Cambridge IGCSE Geography 0460 — 2017 Oct/Nov Paper 4 · Variant 3
0460/43/O/N/17 · 2 questions · 60 marks · ≈68 min
The question paper and its mark scheme, free to read here and free to download. This is Cambridge’s own paper, exactly as it was sat.
Question paper20 pages










Mark scheme7 pages
Answers below. Sit the paper first if you are practising.

Questions as text
Q1 · Students in the UK visited a coastal area where a spit had formed
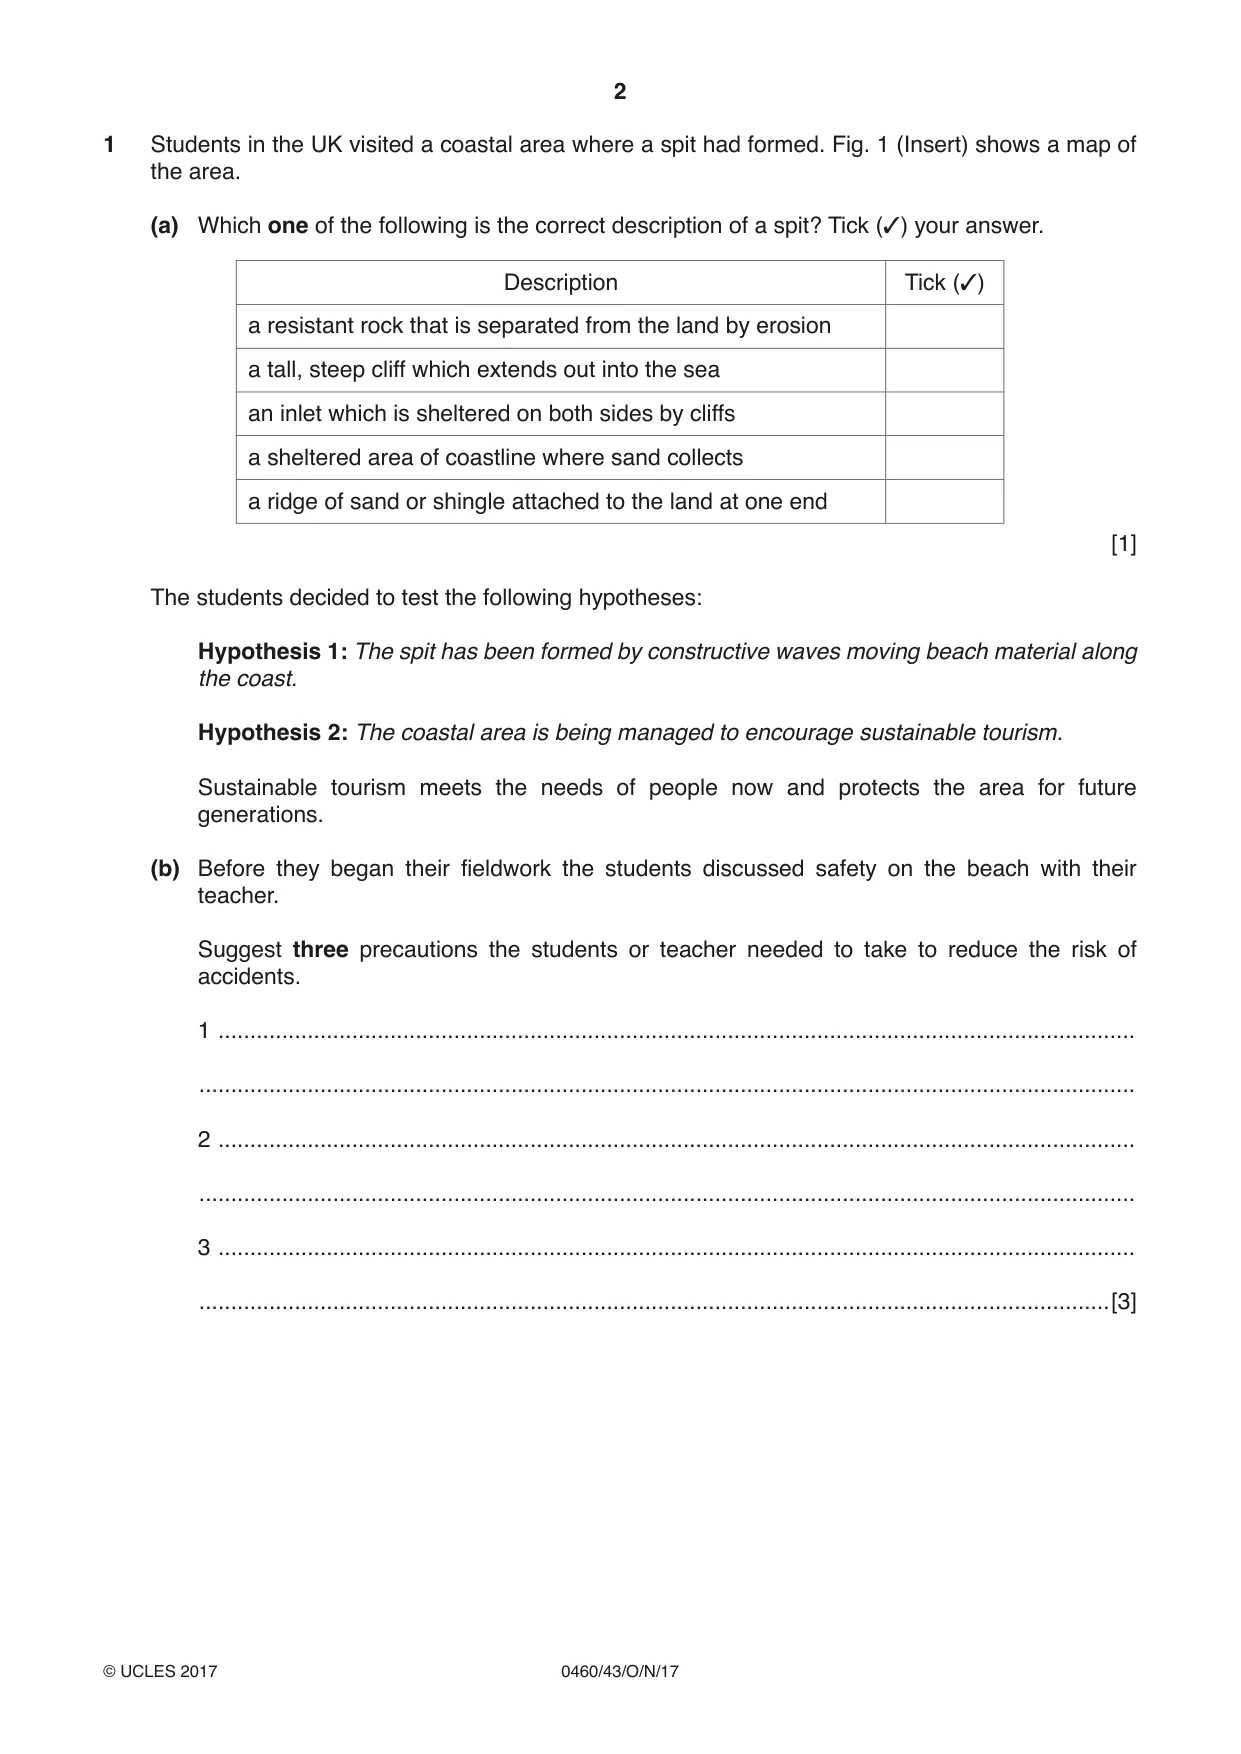
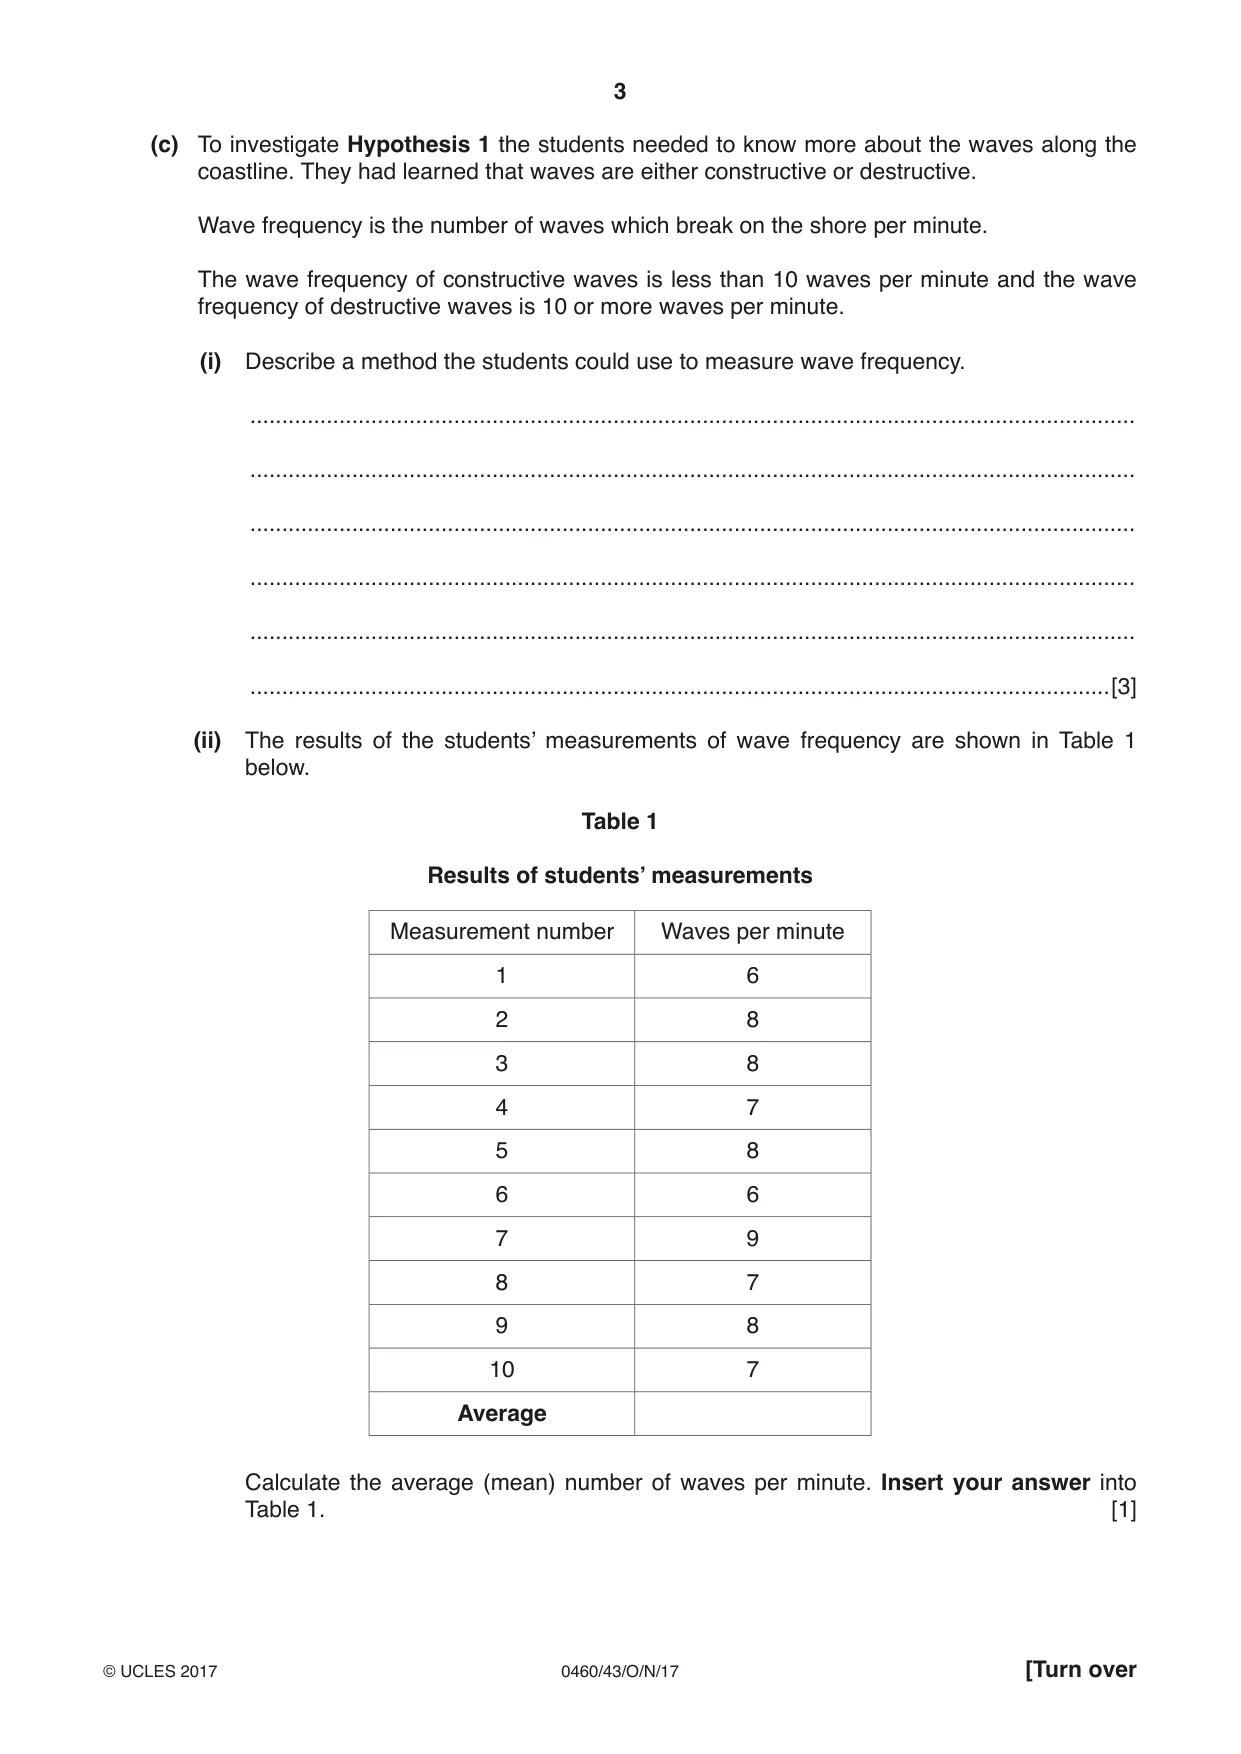
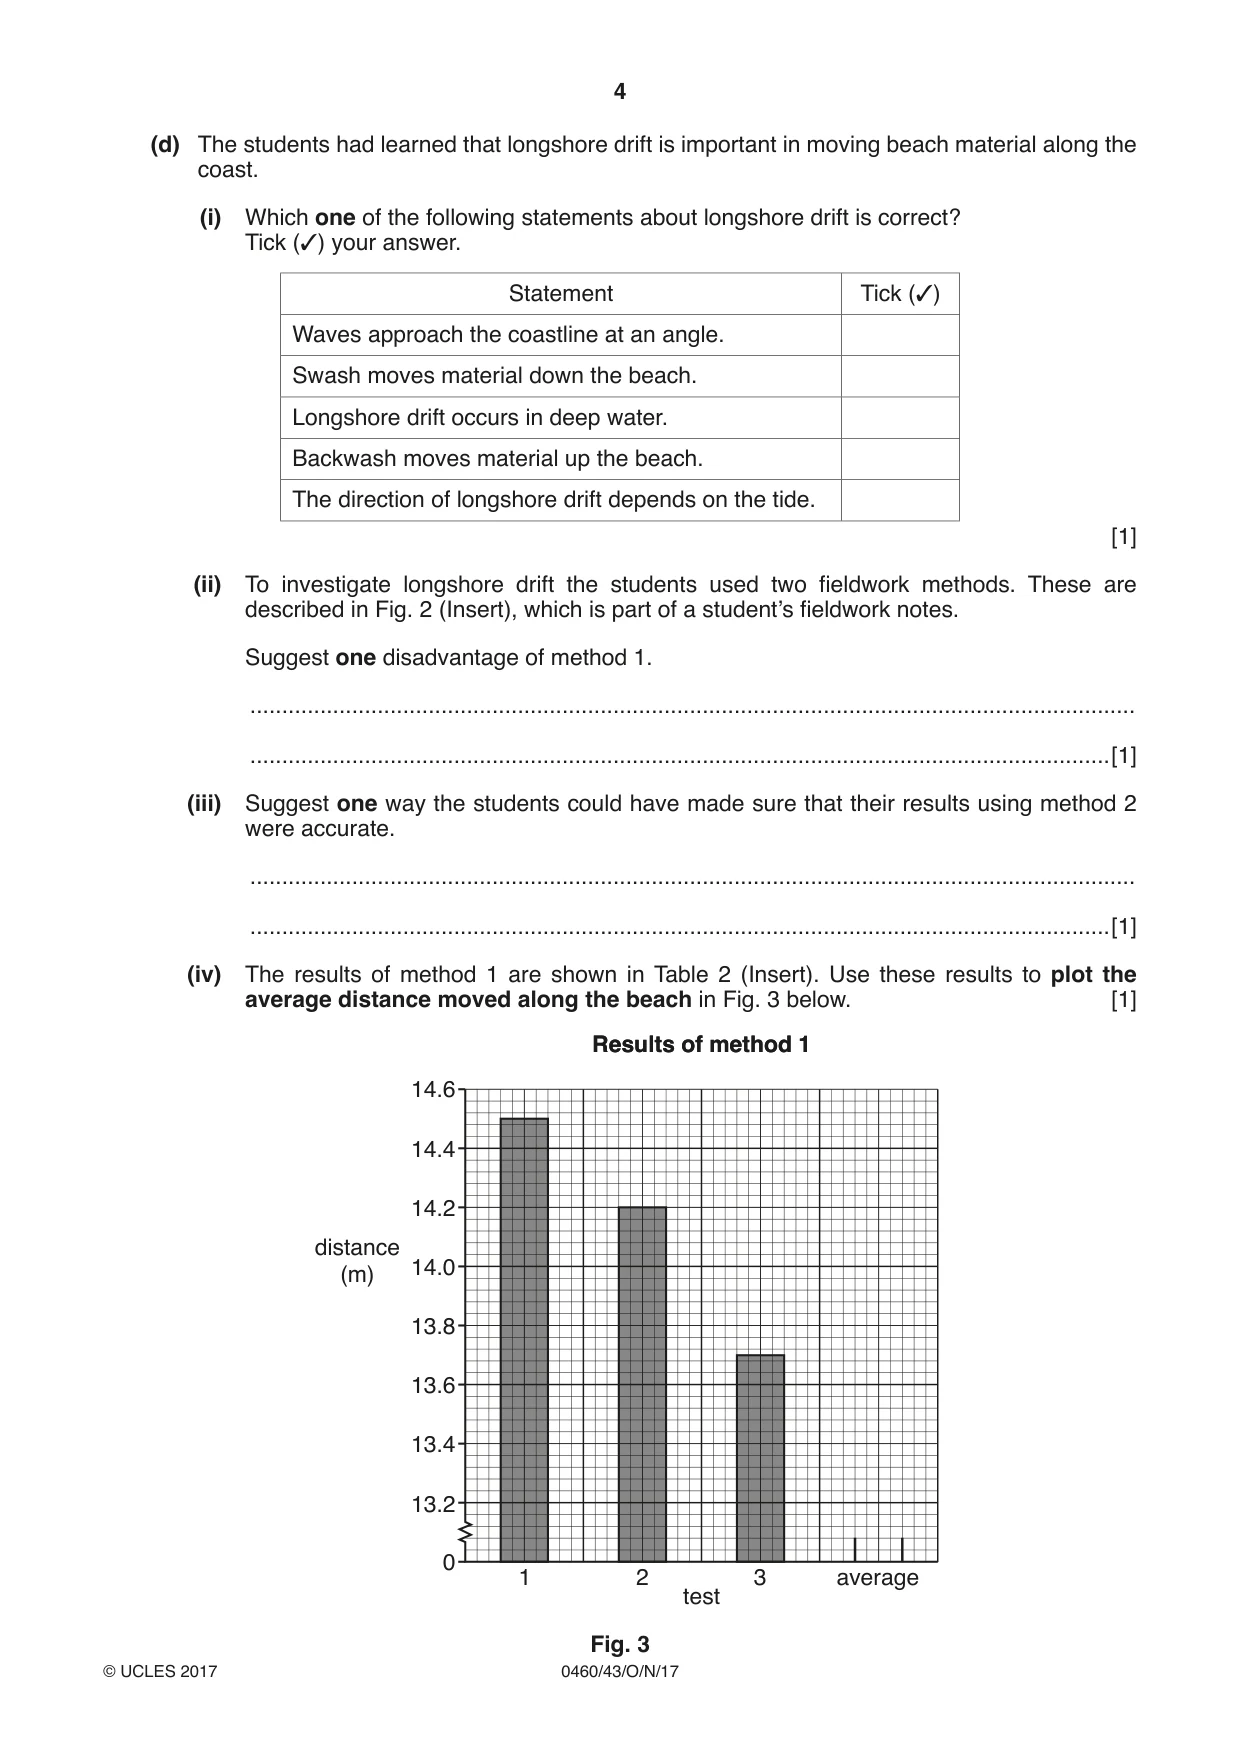
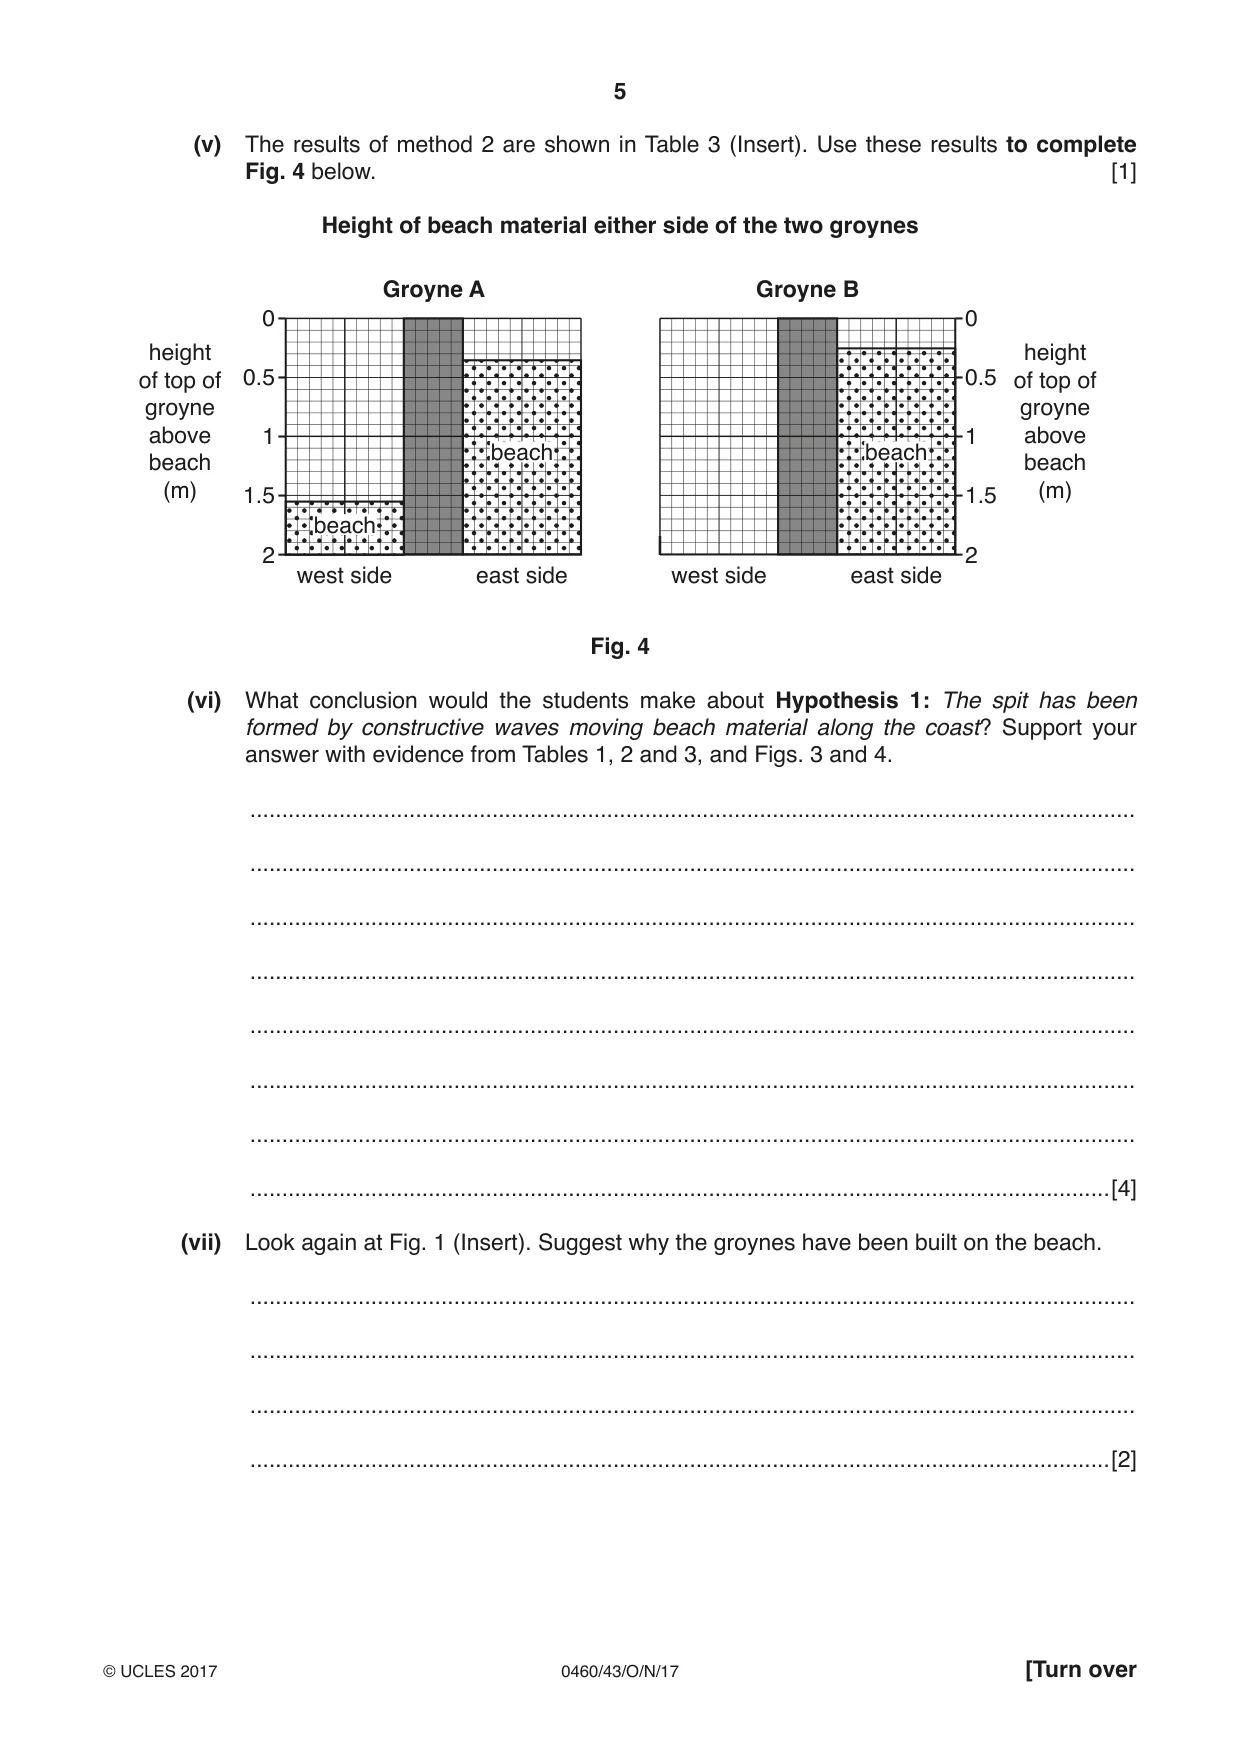
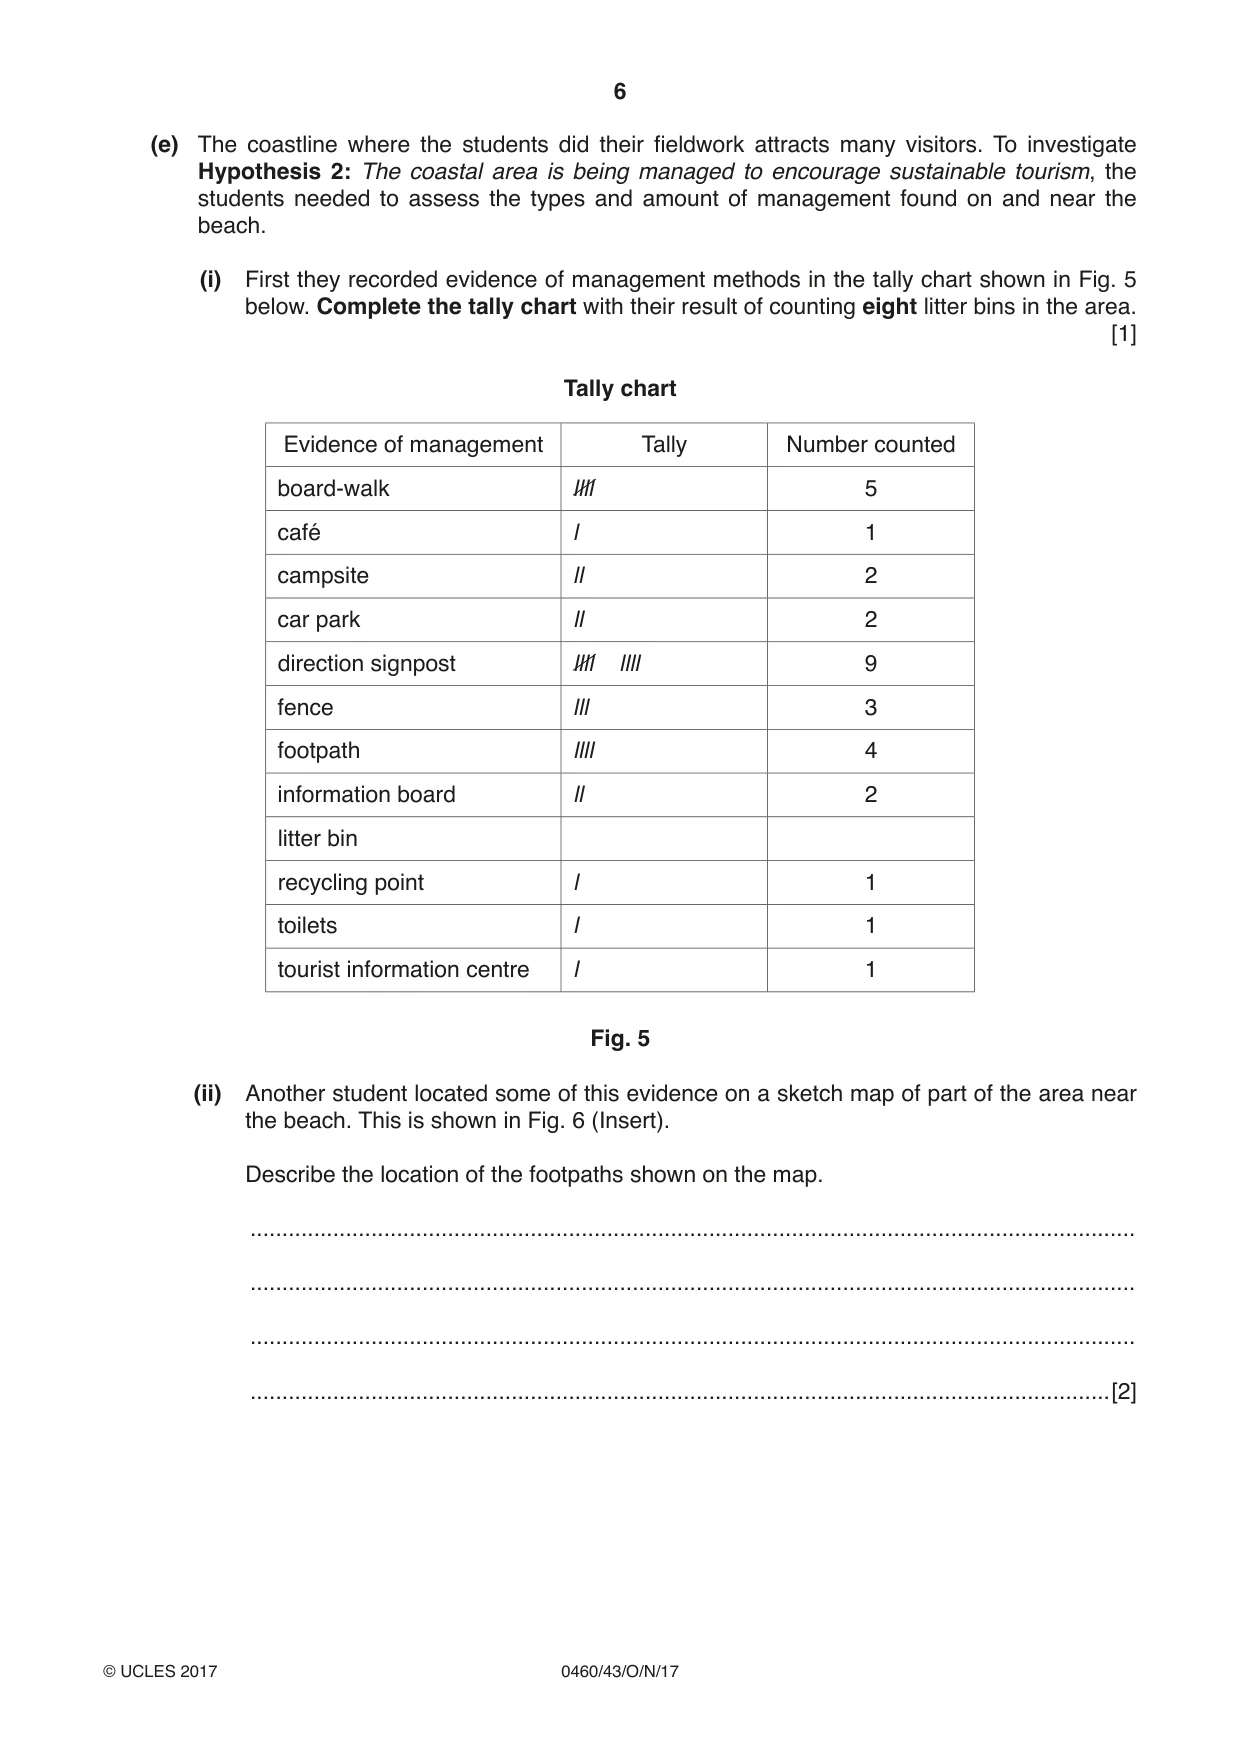
1 Students in the UK visited a coastal area where a spit had formed. Fig. 1 (Insert) shows a map of the area. (a) Which one of the following is the correct description of a spit? Tick (✓) your answer. Description Tick (✓) a resistant rock that is separated from the land by erosion a tall, steep cliff which extends out into the sea an inlet which is sheltered on both sides by cliffs a sheltered area of coastline where sand collects a ridge of sand or shingle attached to the land at one end [1] The students decided to test the following hypotheses: Hypothesis 1: The spit has been formed by constructive waves moving beach material along the coast. Hypothesis 2: The coastal area is being managed to encourage sustainable tourism. Sustainable tourism meets the needs of people now and protects the area for future generations. (b) Before they began their fieldwork the students discussed safety on the beach with their teacher. Suggest three precautions the students or teacher needed to take to reduce the risk of accidents. 1 ................................................................................................................................................ ................................................................................................................................................... 2 ................................................................................................................................................ ................................................................................................................................................... 3 ................................................................................................................................................ ...............................................................................................................................................[3] (c) To investigate Hypothesis 1 the students needed to know more about the waves along the coastline. They had learned that waves are either constructive or destructive. Wave frequency is the number of waves which break on the shore per minute. The wave frequency of constructive waves is less than 10 waves per minute and the wave frequency of destructive waves is 10 or more waves per minute. (i) Describe a method the students could use to measure wave frequency. ........................................................................................................................................... ........................................................................................................................................... ........................................................................................................................................... ........................................................................................................................................... ........................................................................................................................................... .......................................................................................................................................[3] (ii) The results of the students’ measurements of wave frequency are shown in Table 1 below. Table 1 Results of students’ measurements Measurement number Waves per minute 1 6 2 8 3 8 4 7 5 8 6 6 7 9 8 7 9 8 10 7 Average Calculate the average (mean) number of waves per minute. Insert your answer into Table 1. [1] (d) The students had learned that longshore drift is important in moving beach material along the coast. (i) Which one of the following statements about longshore drift is correct? Tick (✓) your answer. Statement Tick (✓) Waves approach the coastline at an angle. Swash moves material down the beach. Longshore drift occurs in deep water. Backwash moves material up the beach. The direction of longshore drift depends on the tide. [1] (ii) To investigate longshore drift the students used two fieldwork methods. These are described in Fig. 2 (Insert), which is part of a student’s fieldwork notes. Suggest one disadvantage of method 1. ........................................................................................................................................... .......................................................................................................................................[1] (iii) Suggest one way the students could have made sure that their results using method 2 were accurate. ........................................................................................................................................... .......................................................................................................................................[1] (iv) The results of method 1 are shown in Table 2 (Insert). Use these results to plot the average distance moved along the beach in Fig. 3 below. [1] ResultsResults ofof methodmethod 11 14.6 14.4 14.2 distance 14.0 (m) 13.8 13.6 13.4 13.2 0 1 2 3 average test Fig. 3 (v) The results of method 2 are shown in Table 3 (Insert). Use these results to complete Fig. 4 below. [1] Height of beach material either side of the two groynes Groyne A Groyne B 0 0 height height of top of 0.5 0.5 of top of groyne groyne above 1 1 above beach beach beach beach (m) 1.5 1.5 (m) beach 2 2 west side east side west side east side Fig. 4 (vi) What conclusion would the students make about Hypothesis 1: The spit has been formed by constructive waves moving beach material along the coast? Support your answer with evidence from Tables 1, 2 and 3, and Figs. 3 and 4. ........................................................................................................................................... ........................................................................................................................................... ........................................................................................................................................... ........................................................................................................................................... ........................................................................................................................................... ........................................................................................................................................... ........................................................................................................................................... .......................................................................................................................................[4] (vii) Look again at Fig. 1 (Insert). Suggest why the groynes have been built on the beach. ........................................................................................................................................... ........................................................................................................................................... ........................................................................................................................................... .......................................................................................................................................[2] (e) The coastline where the students did their fieldwork attracts many visitors. To investigate Hypothesis 2: The coastal area is being managed to encourage sustainable tourism, the students needed to assess the types and amount of management found on and near the beach. (i) First they recorded evidence of management methods in the tally chart shown in Fig. 5 below. Complete the tally chart with their result of counting eight litter bins in the area. [1] Tally chart Evidence of management Tally Number counted board‑walk llll 5 café l 1 campsite ll 2 car park ll 2 direction signpost llll llll 9 fence lll 3 footpath llll 4 information board ll 2 litter bin recycling point l 1 toilets l 1 tourist information centre l 1 Fig. 5 (ii) Another student located some of this evidence on a sketch map of part of the area near the beach. This is shown in Fig. 6 (Insert). Describe the location of the footpaths shown on the map. ........................................................................................................................................... ........................................................................................................................................... ........................................................................................................................................... .......................................................................................................................................[2] (iii) Is Hypothesis 2: The coastal area is being managed to encourage sustainable tourism true or false? Circle your answer below. True False Explain your conclusion. Include evidence from Figs. 5 and 6. ........................................................................................................................................... ........................................................................................................................................... ........................................................................................................................................... ........................................................................................................................................... ........................................................................................................................................... ........................................................................................................................................... ........................................................................................................................................... .......................................................................................................................................[4] (f) For extension work the students drew the beach profile from the edge of the sea to the top of the beach. They used a tape measure, two ranging poles and a clinometer. Describe how they made their measurements. ................................................................................................................................................... ................................................................................................................................................... ................................................................................................................................................... ................................................................................................................................................... ................................................................................................................................................... ................................................................................................................................................... ................................................................................................................................................... ...............................................................................................................................................[4] [Total: 30 marks]
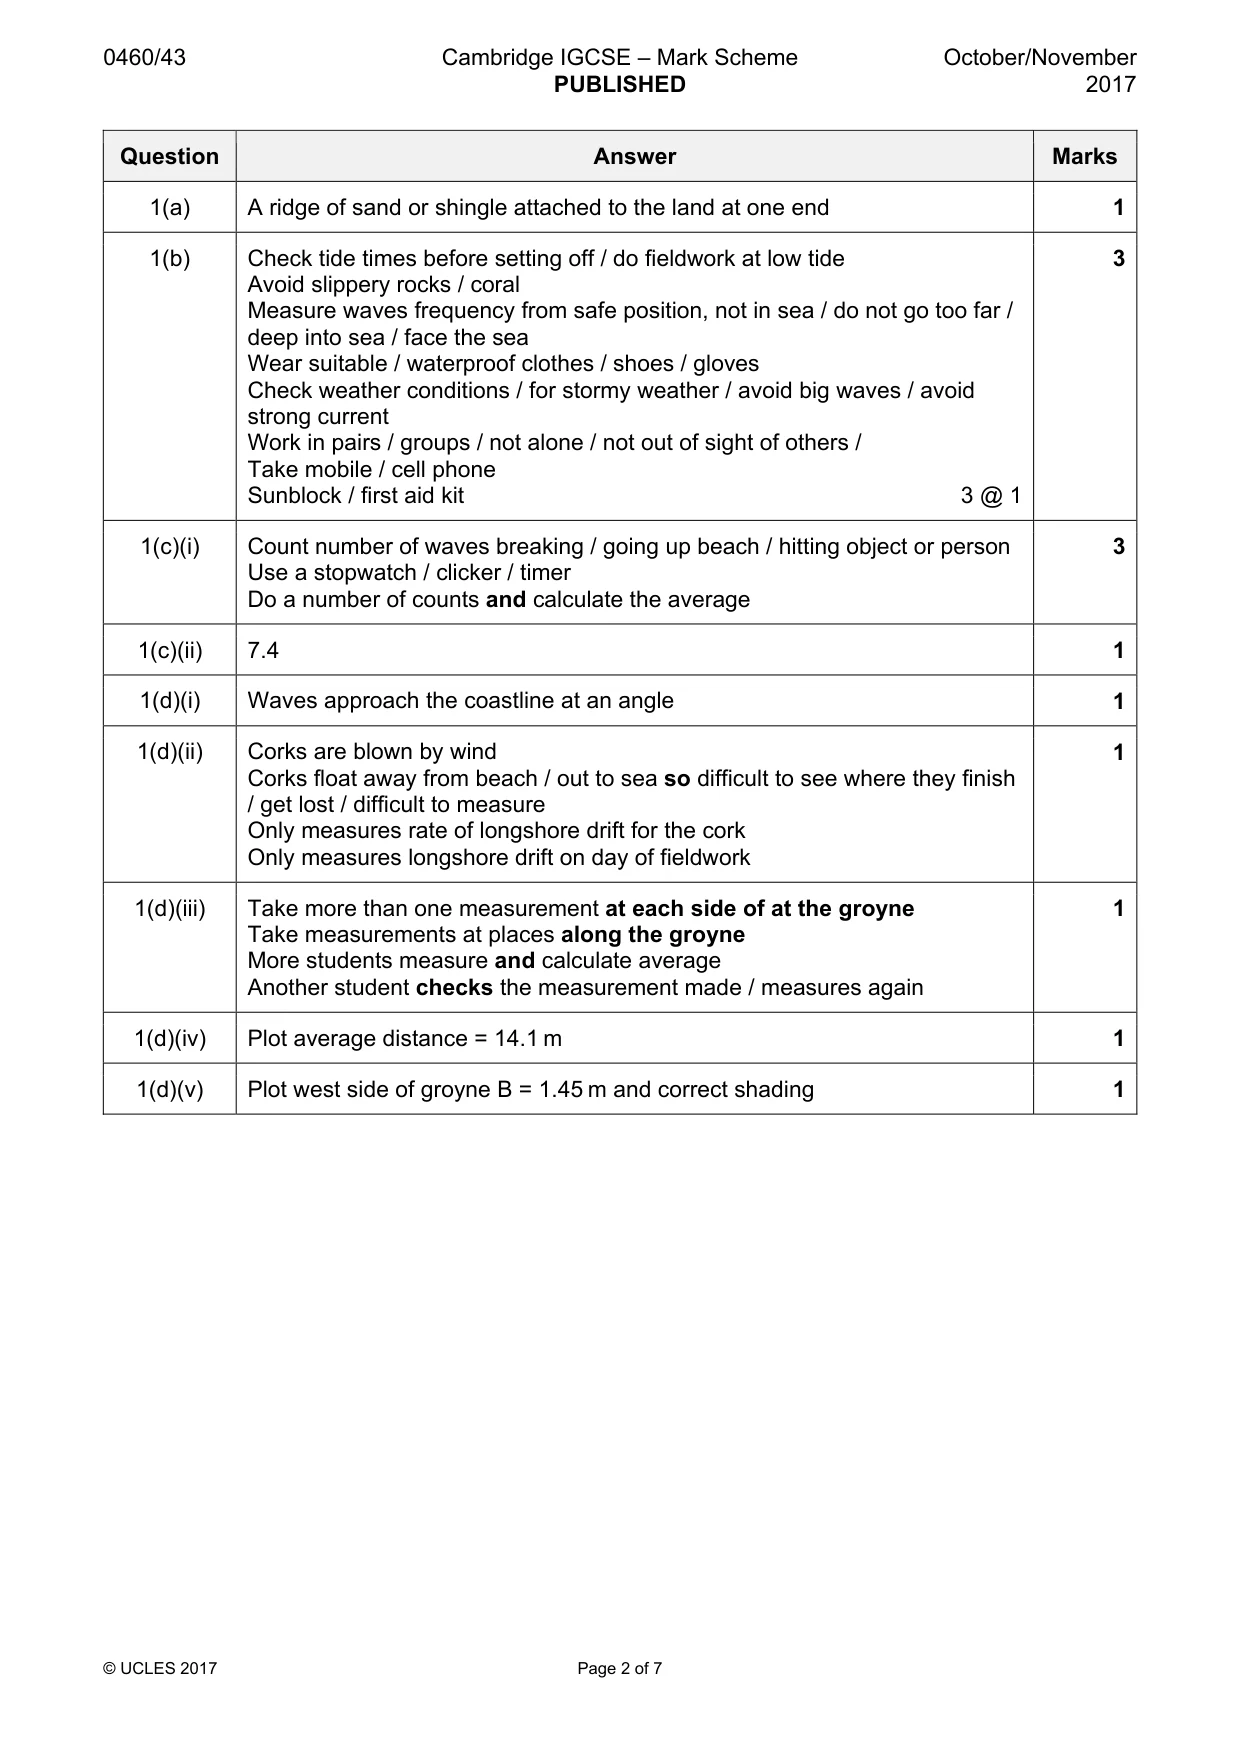
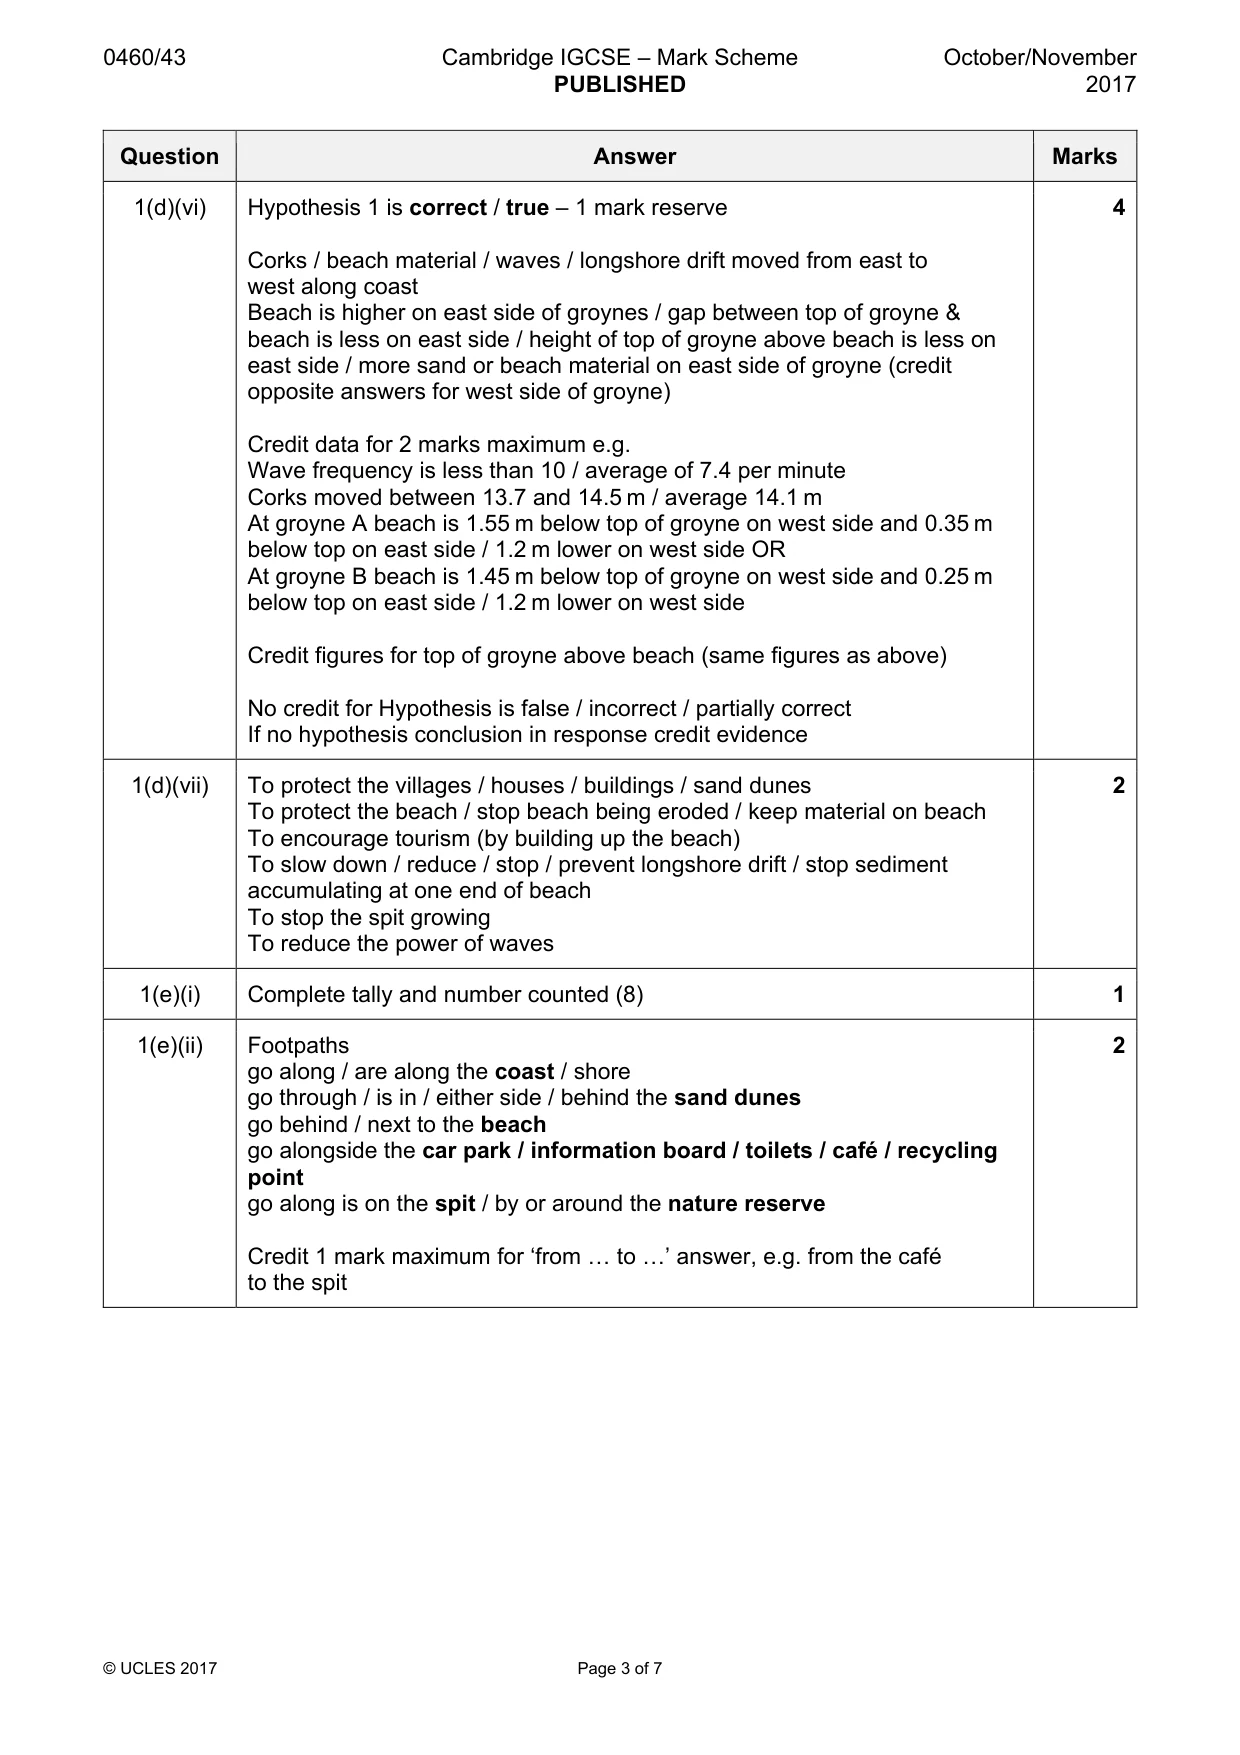
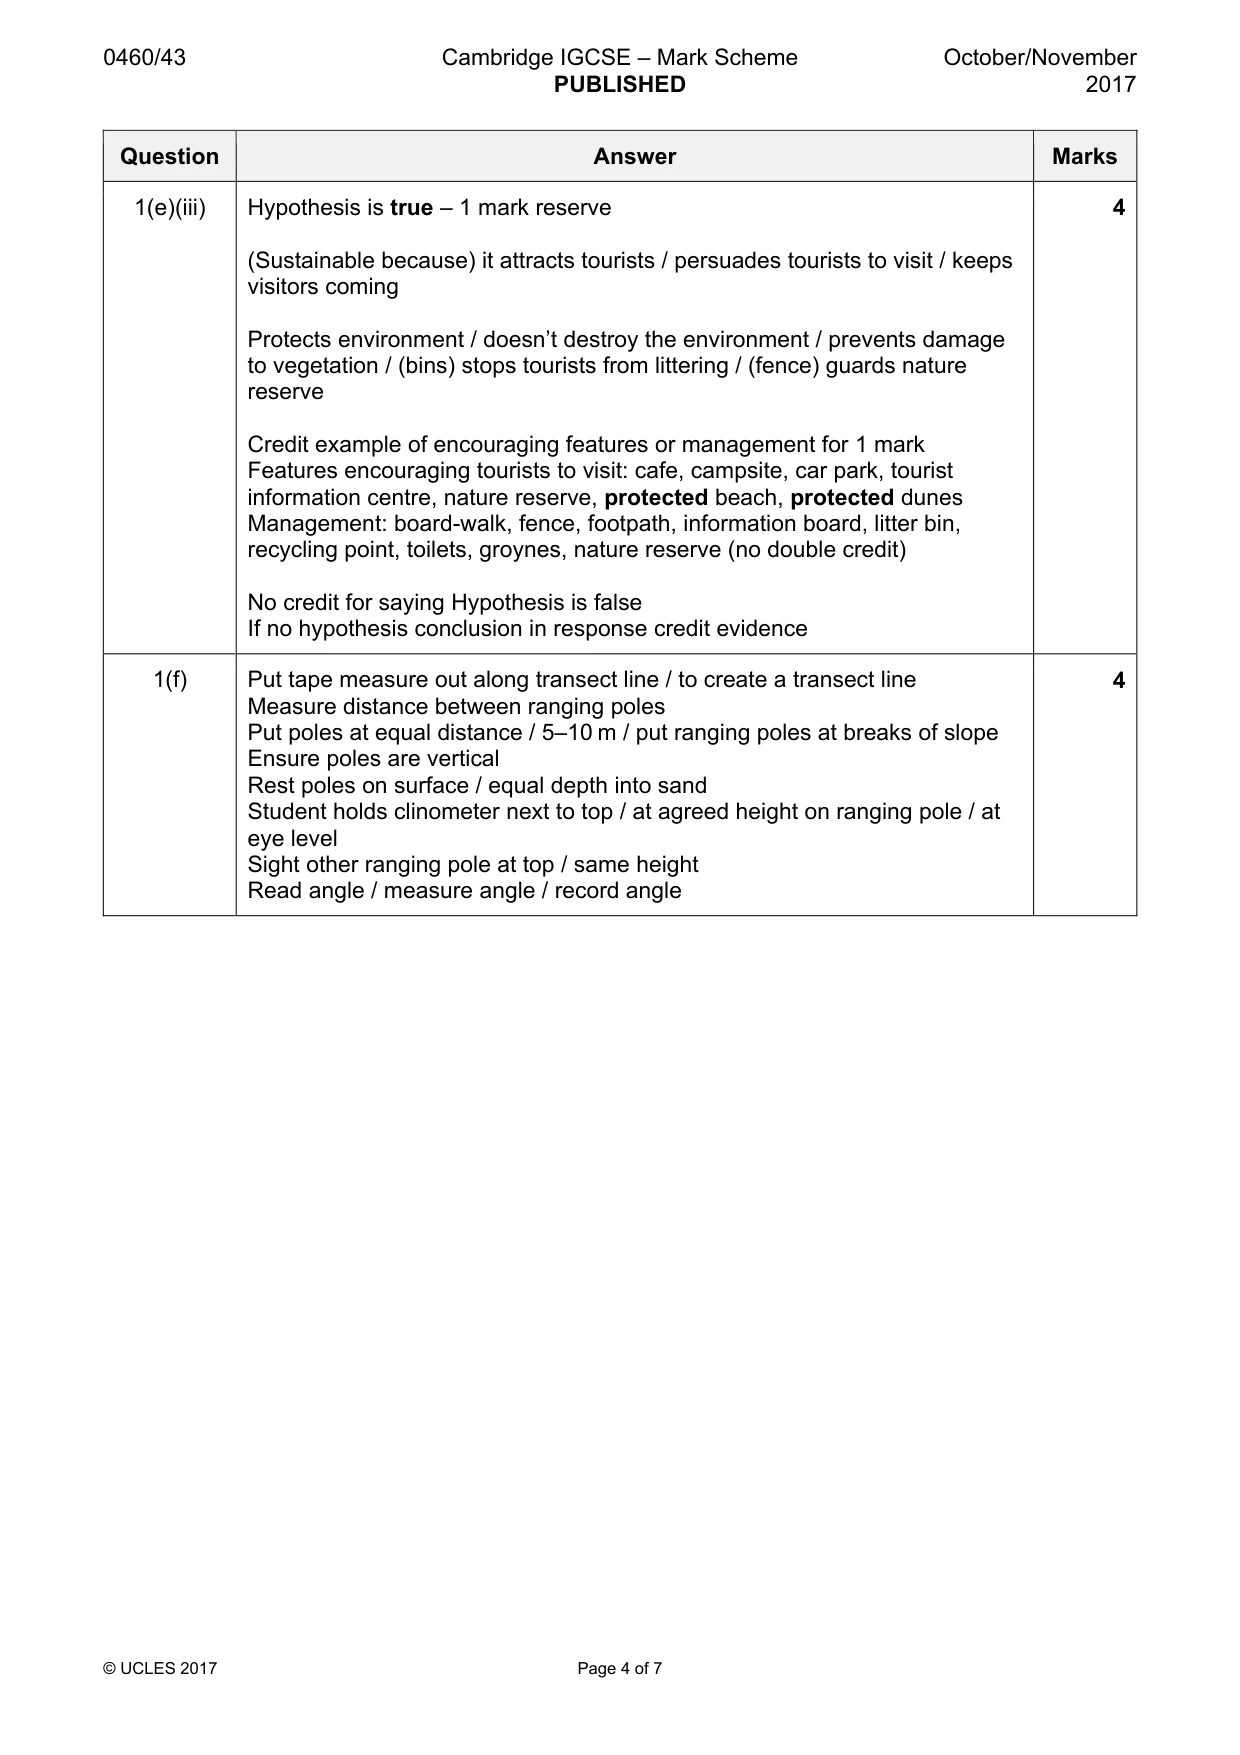
Mark scheme: Question Answer Marks 1(a) A ridge of sand or shingle attached to the land at one end 1 1(b) Check tide times before setting off / do fieldwork at low tide 3 Avoid slippery rocks / coral Measure waves frequency from safe position, not in sea / do not go too far / deep into sea / face the sea Wear suitable / waterproof clothes / shoes / gloves Check weather conditions / for stormy weather / avoid big waves / avoid strong current Work in pairs / groups / not alone / not out of sight of others / Take mobile / cell phone Sunblock / first aid kit 3 @ 1 1(c)(i) Count number of waves breaking / going up beach / hitting object or person 3 Use a stopwatch / clicker / timer Do a number of counts and calculate the average 1(c)(ii) 7.4 1 1(d)(i) Waves approach the coastline at an angle 1 1(d)(ii) Corks are blown by wind 1 Corks float away from beach / out to sea so difficult to see where they finish / get lost / difficult to measure Only measures rate of longshore drift for the cork Only measures longshore drift on day of fieldwork 1(d)(iii) Take more than one measurement at each side of at the groyne 1 Take measurements at places along the groyne More students measure and calculate average Another student checks the measurement made / measures again 1(d)(iv) Plot average distance = 14.1 m 1 1(d)(v) Plot west side of groyne B = 1.45 m and correct shading 1 1(d)(vi) Hypothesis 1 is correct / true – 1 mark reserve 4 Corks / beach material / waves / longshore drift moved from east to west along coast Beach is higher on east side of groynes / gap between top of groyne & beach is less on east side / height of top of groyne above beach is less on east side / more sand or beach material on east side of groyne (credit opposite answers for west side of groyne) Credit data for 2 marks maximum e.g. Wave frequency is less than 10 / average of 7.4 per minute Corks moved between 13.7 and 14.5 m / average 14.1 m At groyne A beach is 1.55 m below top of groyne on west side and 0.35 m below top on east side / 1.2 m lower on west side OR At groyne B beach is 1.45 m below top of groyne on west side and 0.25 m below top on east side / 1.2 m lower on west side Credit figures for top of groyne above beach (same figures as above) No credit for Hypothesis is false / incorrect / partially correct If no hypothesis conclusion in response credit evidence 1(d)(vii) To protect the villages / houses / buildings / sand dunes 2 To protect the beach / stop beach being eroded / keep material on beach To encourage tourism (by building up the beach) To slow down / reduce / stop / prevent longshore drift / stop sediment accumulating at one end of beach To stop the spit growing To reduce the power of waves 1(e)(i) Complete tally and number counted (8) 1 1(e)(ii) Footpaths 2 go along / are along the coast / shore go through / is in / either side / behind the sand dunes go behind / next to the beach go alongside the car park / information board / toilets / café / recycling point go along is on the spit / by or around the nature reserve Credit 1 mark maximum for ‘from « to «’ answer, e.g. from the café to the spit 1(e)(iii) Hypothesis is true – 1 mark reserve 4 (Sustainable because) it attracts tourists / persuades tourists to visit / keeps visitors coming Protects environment / doesn’t destroy the environment / prevents damage to vegetation / (bins) stops tourists from littering / (fence) guards nature reserve Credit example of encouraging features or management for 1 mark Features encouraging tourists to visit: cafe, campsite, car park, tourist information centre, nature reserve, protected beach, protected dunes Management: board-walk, fence, footpath, information board, litter bin, recycling point, toilets, groynes, nature reserve (no double credit) No credit for saying Hypothesis is false If no hypothesis conclusion in response credit evidence 1(f) Put tape measure out along transect line / to create a transect line 4 Measure distance between ranging poles Put poles at equal distance / 5–10 m / put ranging poles at breaks of slope Ensure poles are vertical Rest poles on surface / equal depth into sand Student holds clinometer next to top / at agreed height on ranging pole / at eye level Sight other ranging pole at top / same height Read angle / measure angle / record angle
Q2 · Students in India wanted to find out more about people who had migrated to the city of…
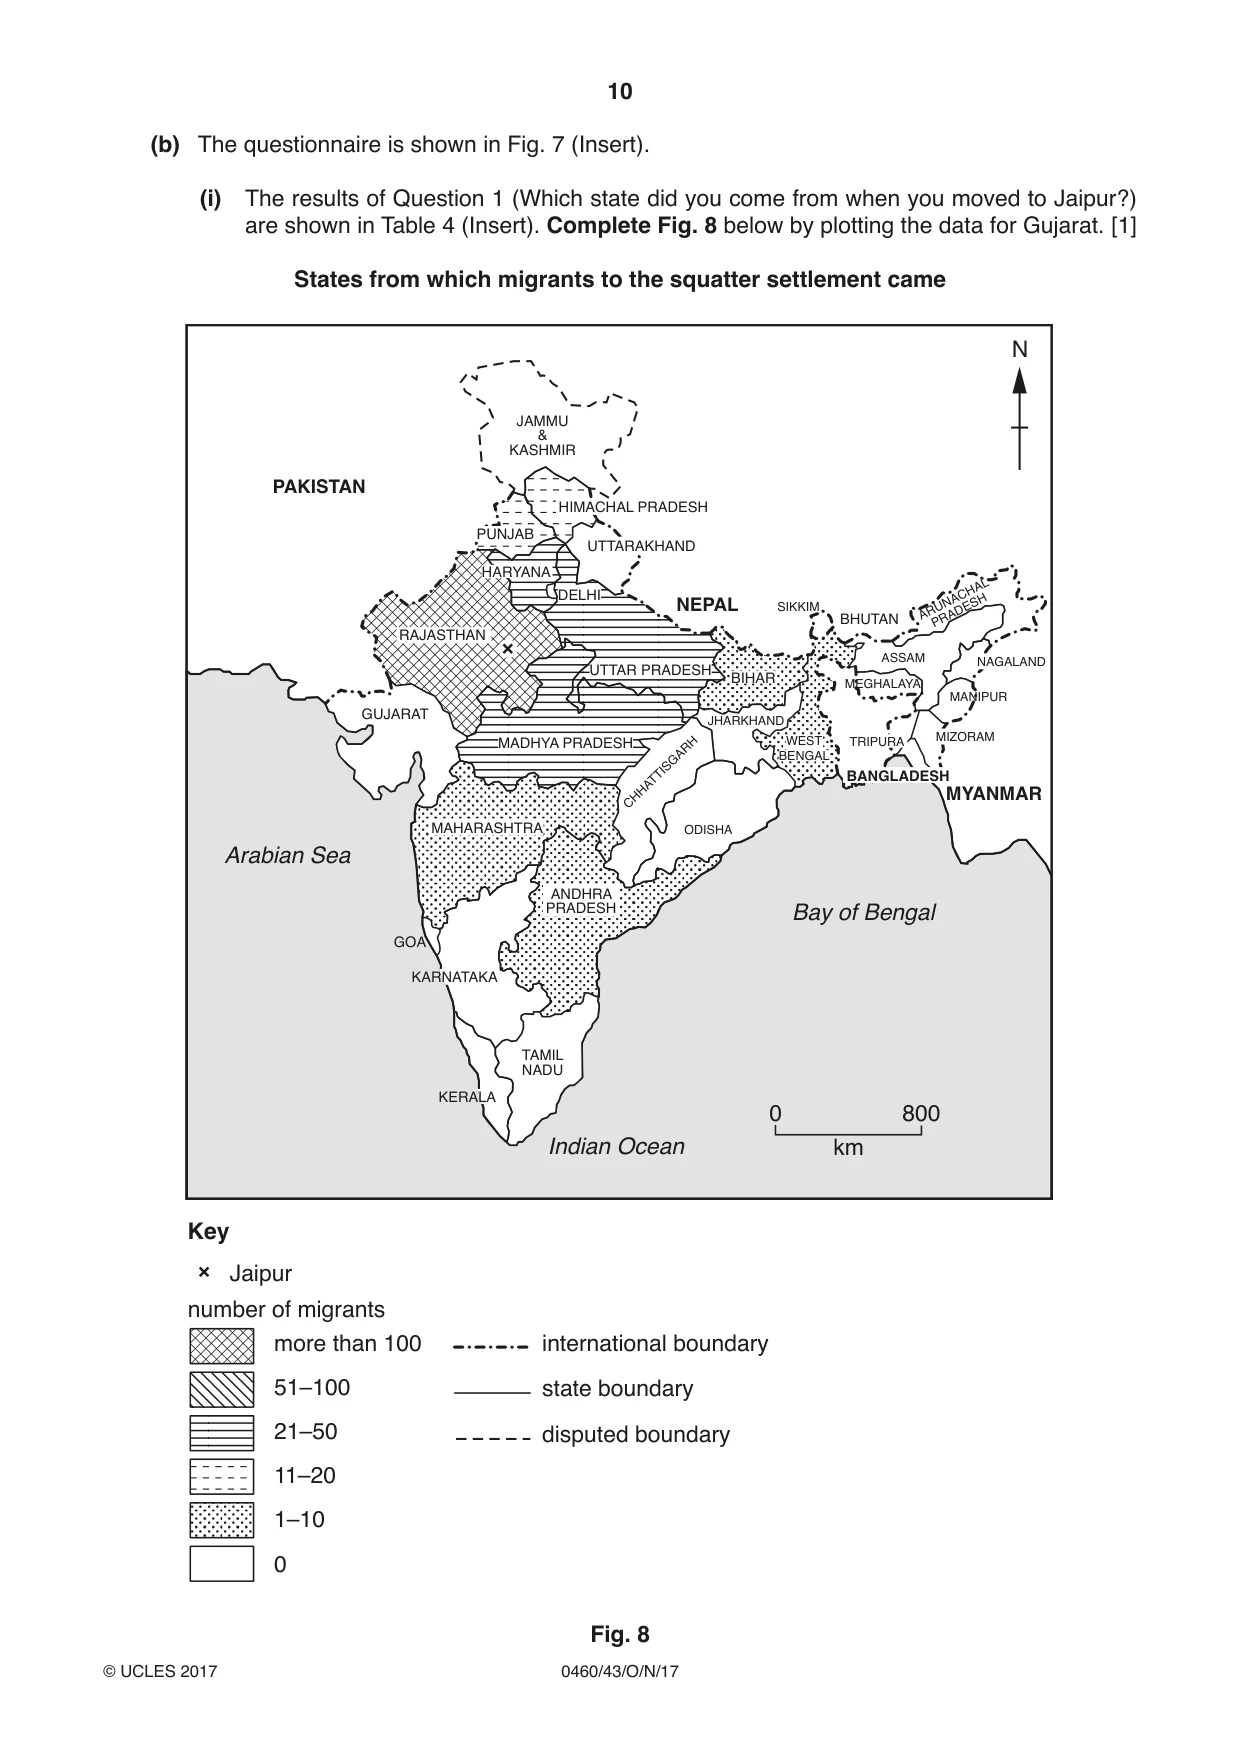
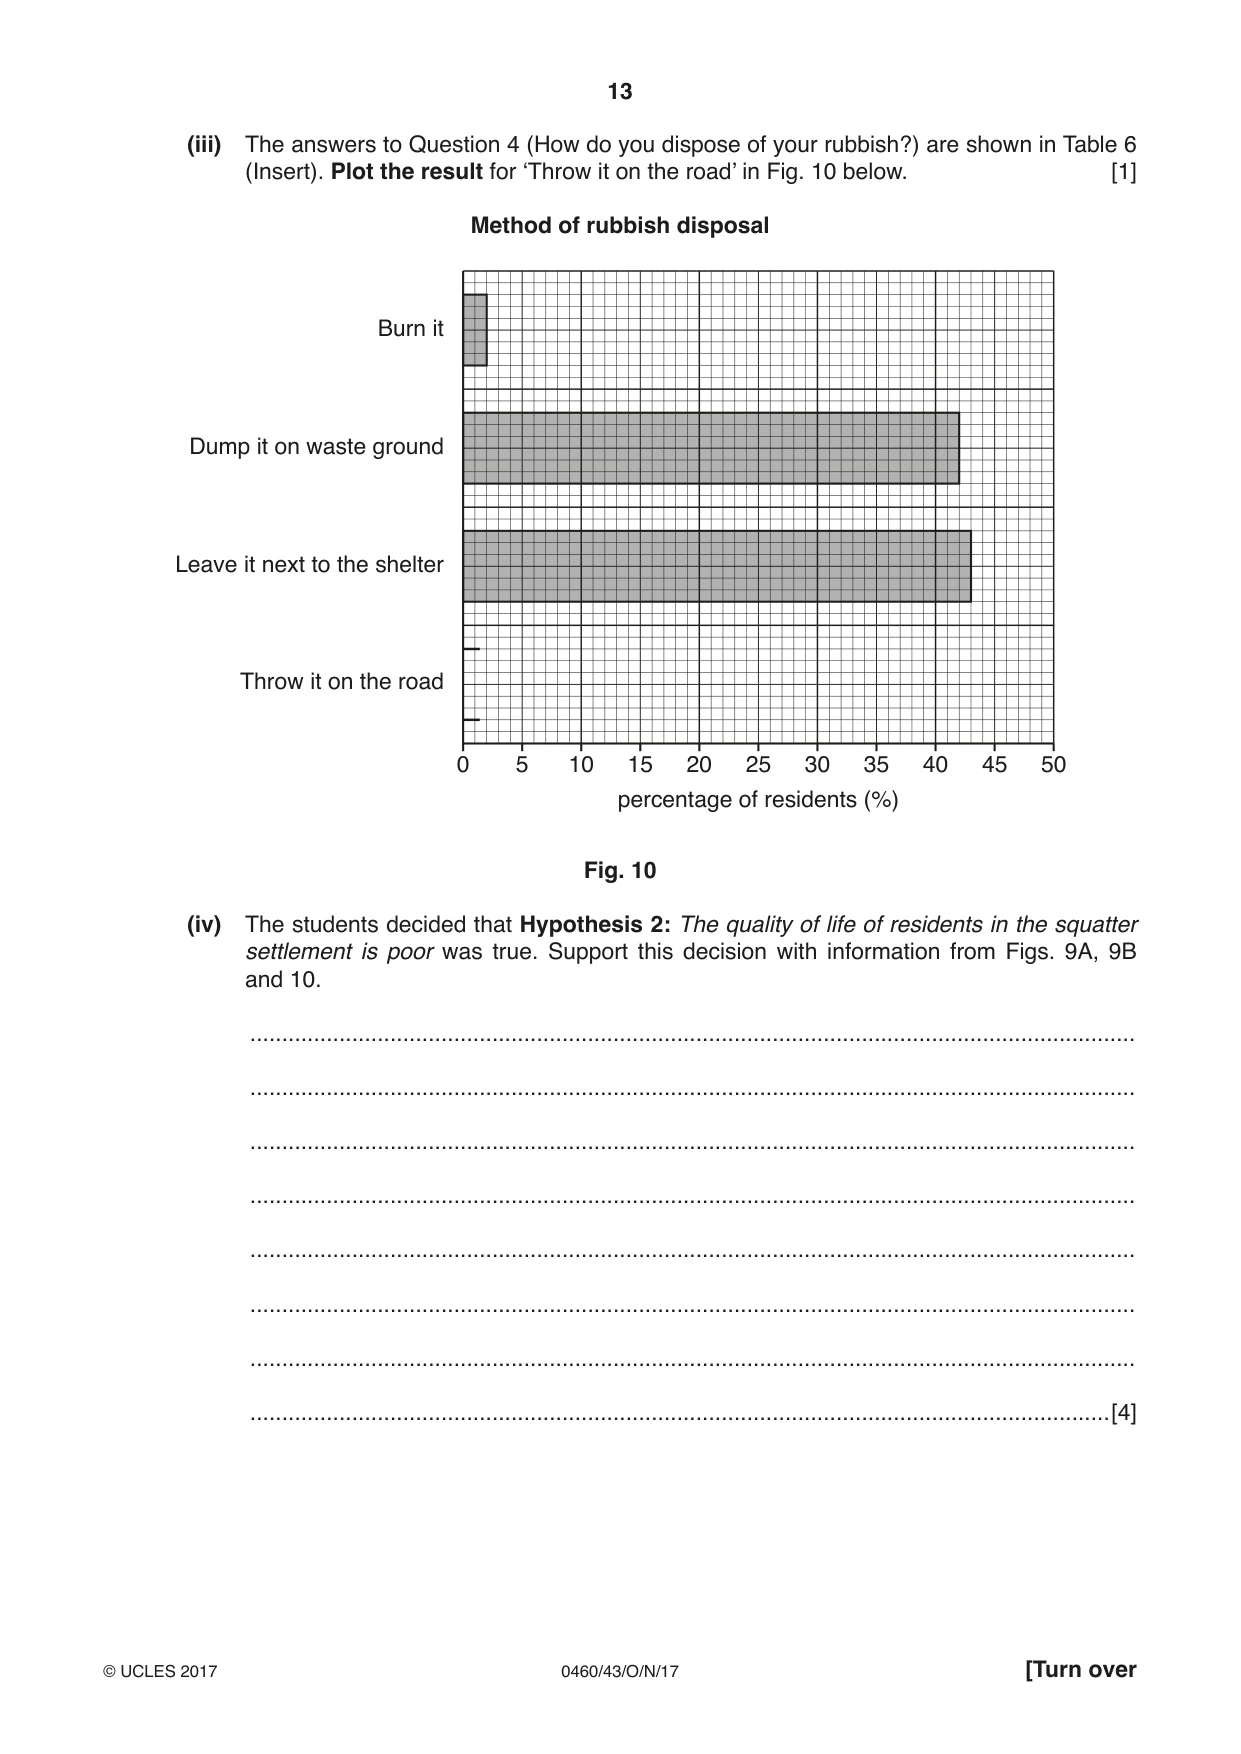
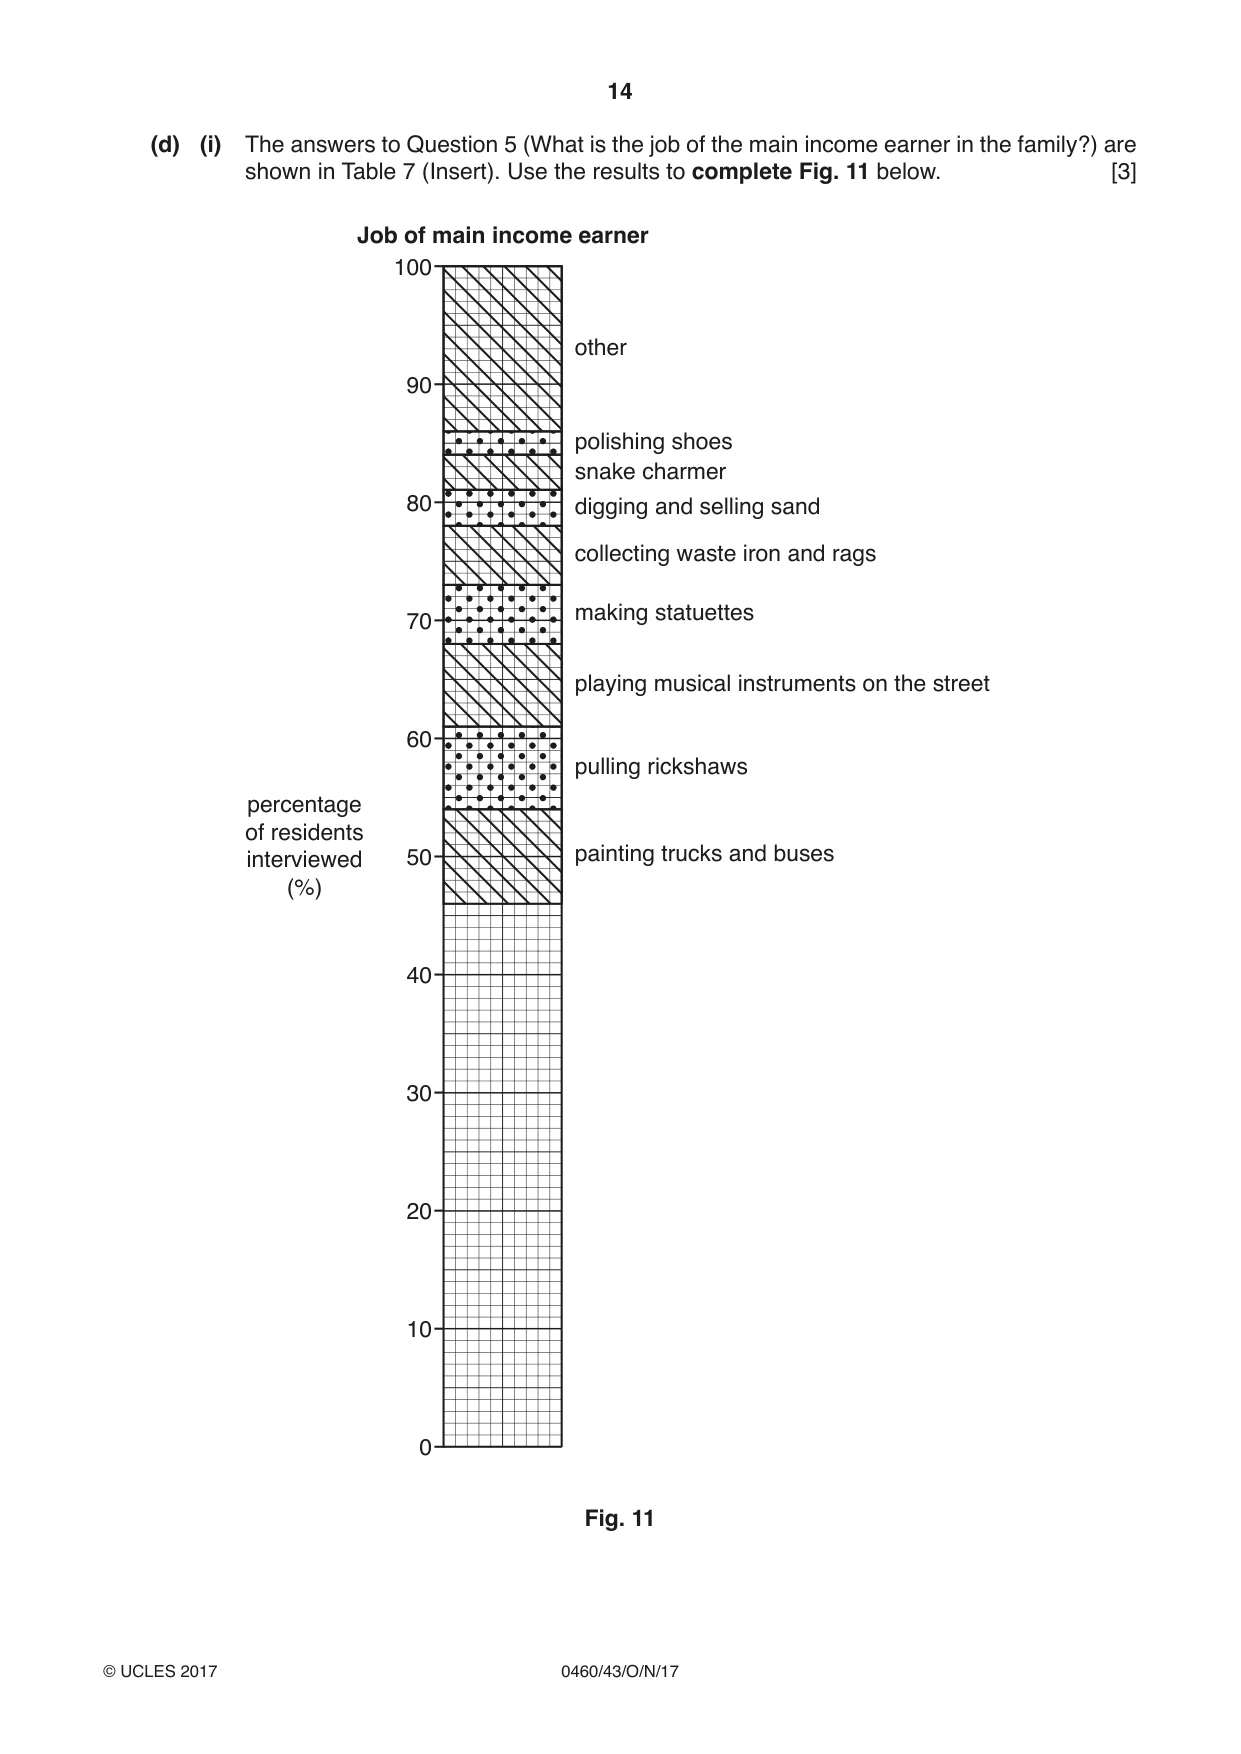
2 Students in India wanted to find out more about people who had migrated to the city of Jaipur from within India and lived in squatter settlements made up of homemade shelters on pavements or next to roads. The students decided to test the following hypotheses: Hypothesis 1: More migrants who live in the squatter settlement came from the area around Jaipur than areas further away. Hypothesis 2: The quality of life of residents in the squatter settlement is poor. (a) To investigate the hypotheses the students used a questionnaire with 10% of the residents of the squatter settlements. (i) Describe a sampling method for how the students could choose people to complete the questionnaire. Explain why you have chosen this method. Name of sampling method ................................................................................................ Description of method ....................................................................................................... ........................................................................................................................................... Explanation for choice ....................................................................................................... ........................................................................................................................................... .......................................................................................................................................[3] (ii) Explain why a 10% sample (300 people) is an appropriate number of residents to answer the questionnaire. ........................................................................................................................................... ........................................................................................................................................... ........................................................................................................................................... .......................................................................................................................................[2] (b) The questionnaire is shown in Fig. 7 (Insert). (i) The results of Question 1 (Which state did you come from when you moved to Jaipur?) are shown in Table 4 (Insert). Complete Fig. 8 below by plotting the data for Gujarat. [1] States from which migrants to the squatter settlement came N JAMMU & KASHMIR PAKISTAN HIMACHAL PRADESH PUNJAB UTTARAKHAND HARYANA DELHI NEPAL SIKKIM BHUTAN ARUNACHALPRADESH RAJASTHAN ASSAM NAGALAND UTTAR PRADESH BIHAR MEGHALAYA MANIPUR GUJARAT JHARKHAND MADHYA PRADESH WEST TRIPURA MIZORAM BENGAL BANGLADESH CHHATTISGARH MYANMAR MAHARASHTRA ODISHA Arabian Sea ANDHRA PRADESH Bay of Bengal GOA KARNATAKA TAMIL NADU KERALA 0 800 Indian Ocean km Key Jaipur number of migrants more than 100 international boundary 51–100 state boundary 21–50 disputed boundary 11–20 1–10 0 Fig. 8 (ii) Suggest one other suitable method to display the results of Question 1 on a map of India. .......................................................................................................................................[1] (iii) What is the correct conclusion about Hypothesis 1: More migrants who live in the squatter settlement came from the area around Jaipur than areas further away? Support your answer with evidence from Fig. 8 and Table 4. ........................................................................................................................................... ........................................................................................................................................... ........................................................................................................................................... ........................................................................................................................................... ........................................................................................................................................... .......................................................................................................................................[3] (iv) Suggest reasons for the pattern of migration shown in Fig. 8. ........................................................................................................................................... ........................................................................................................................................... ........................................................................................................................................... .......................................................................................................................................[2]
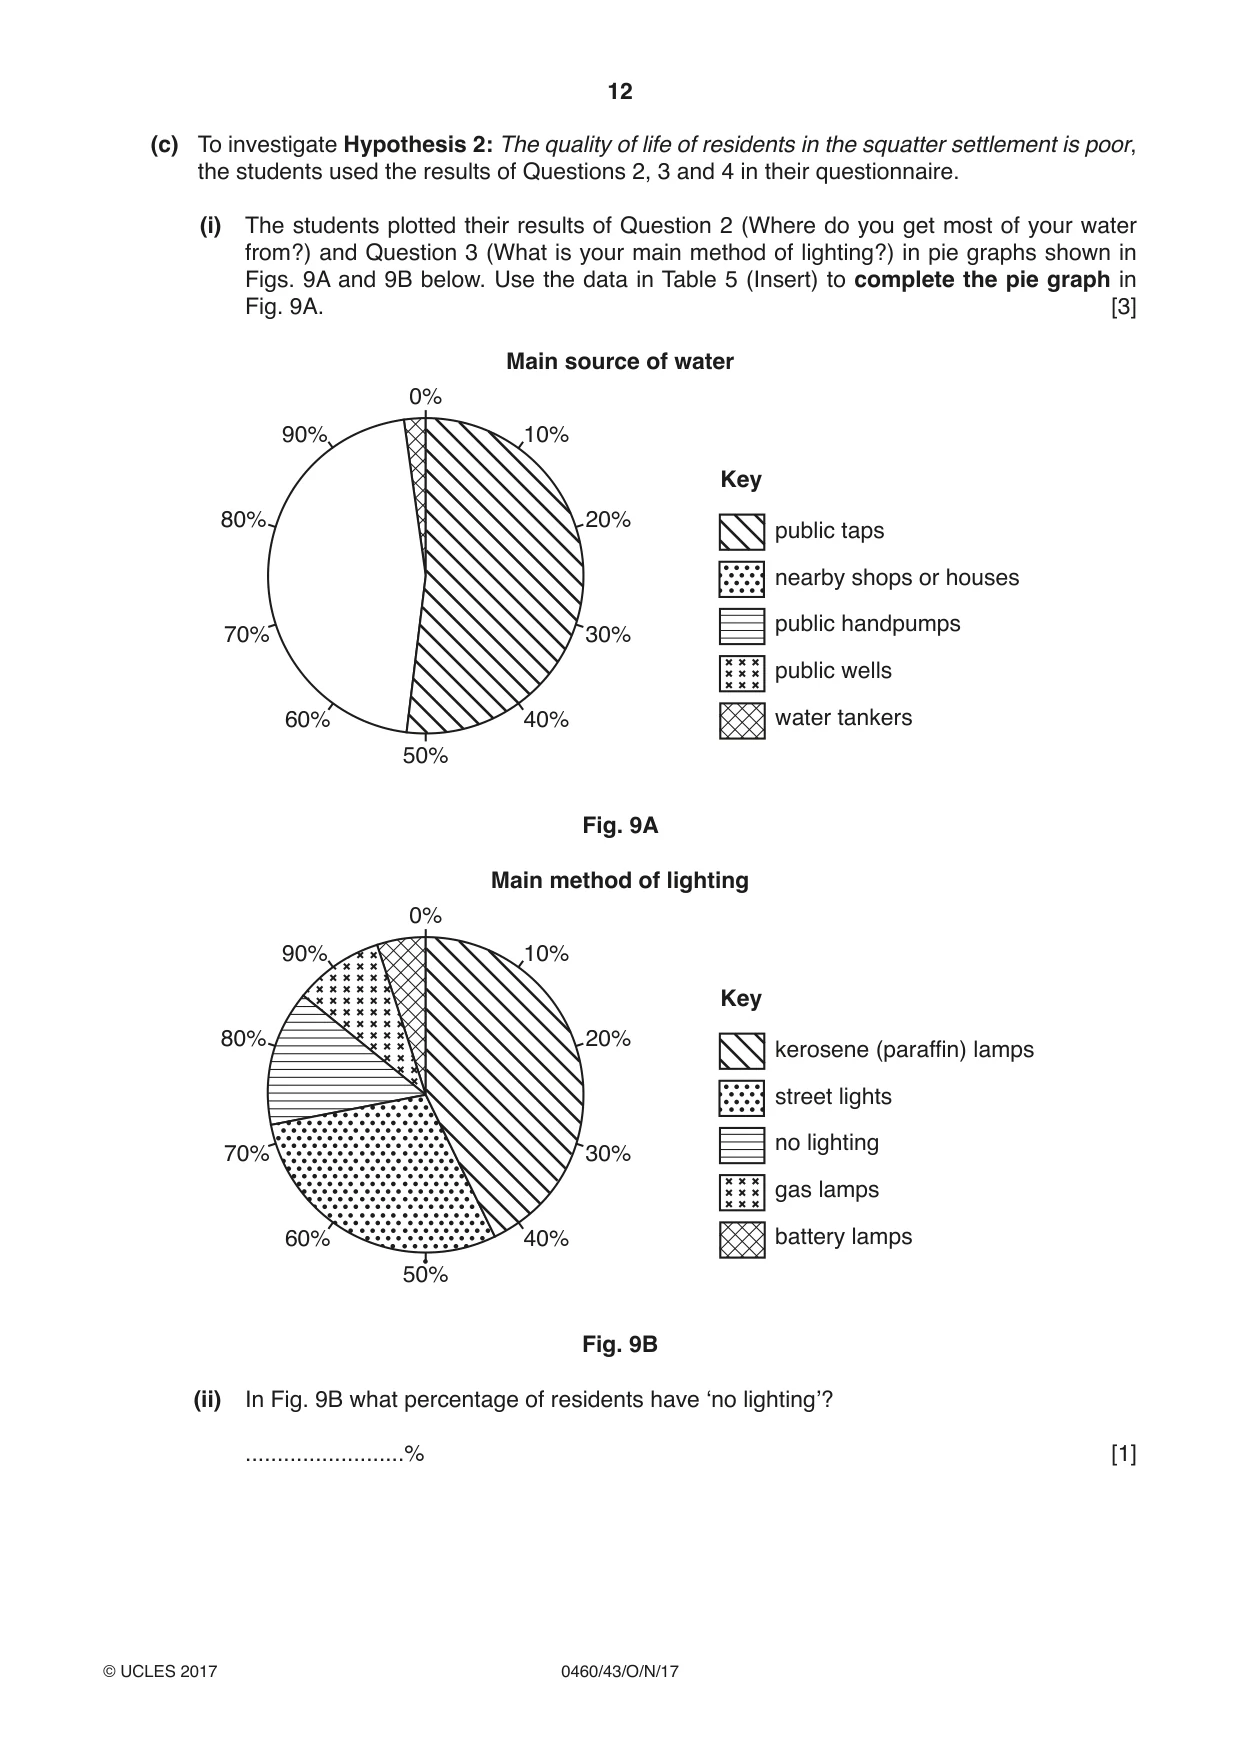
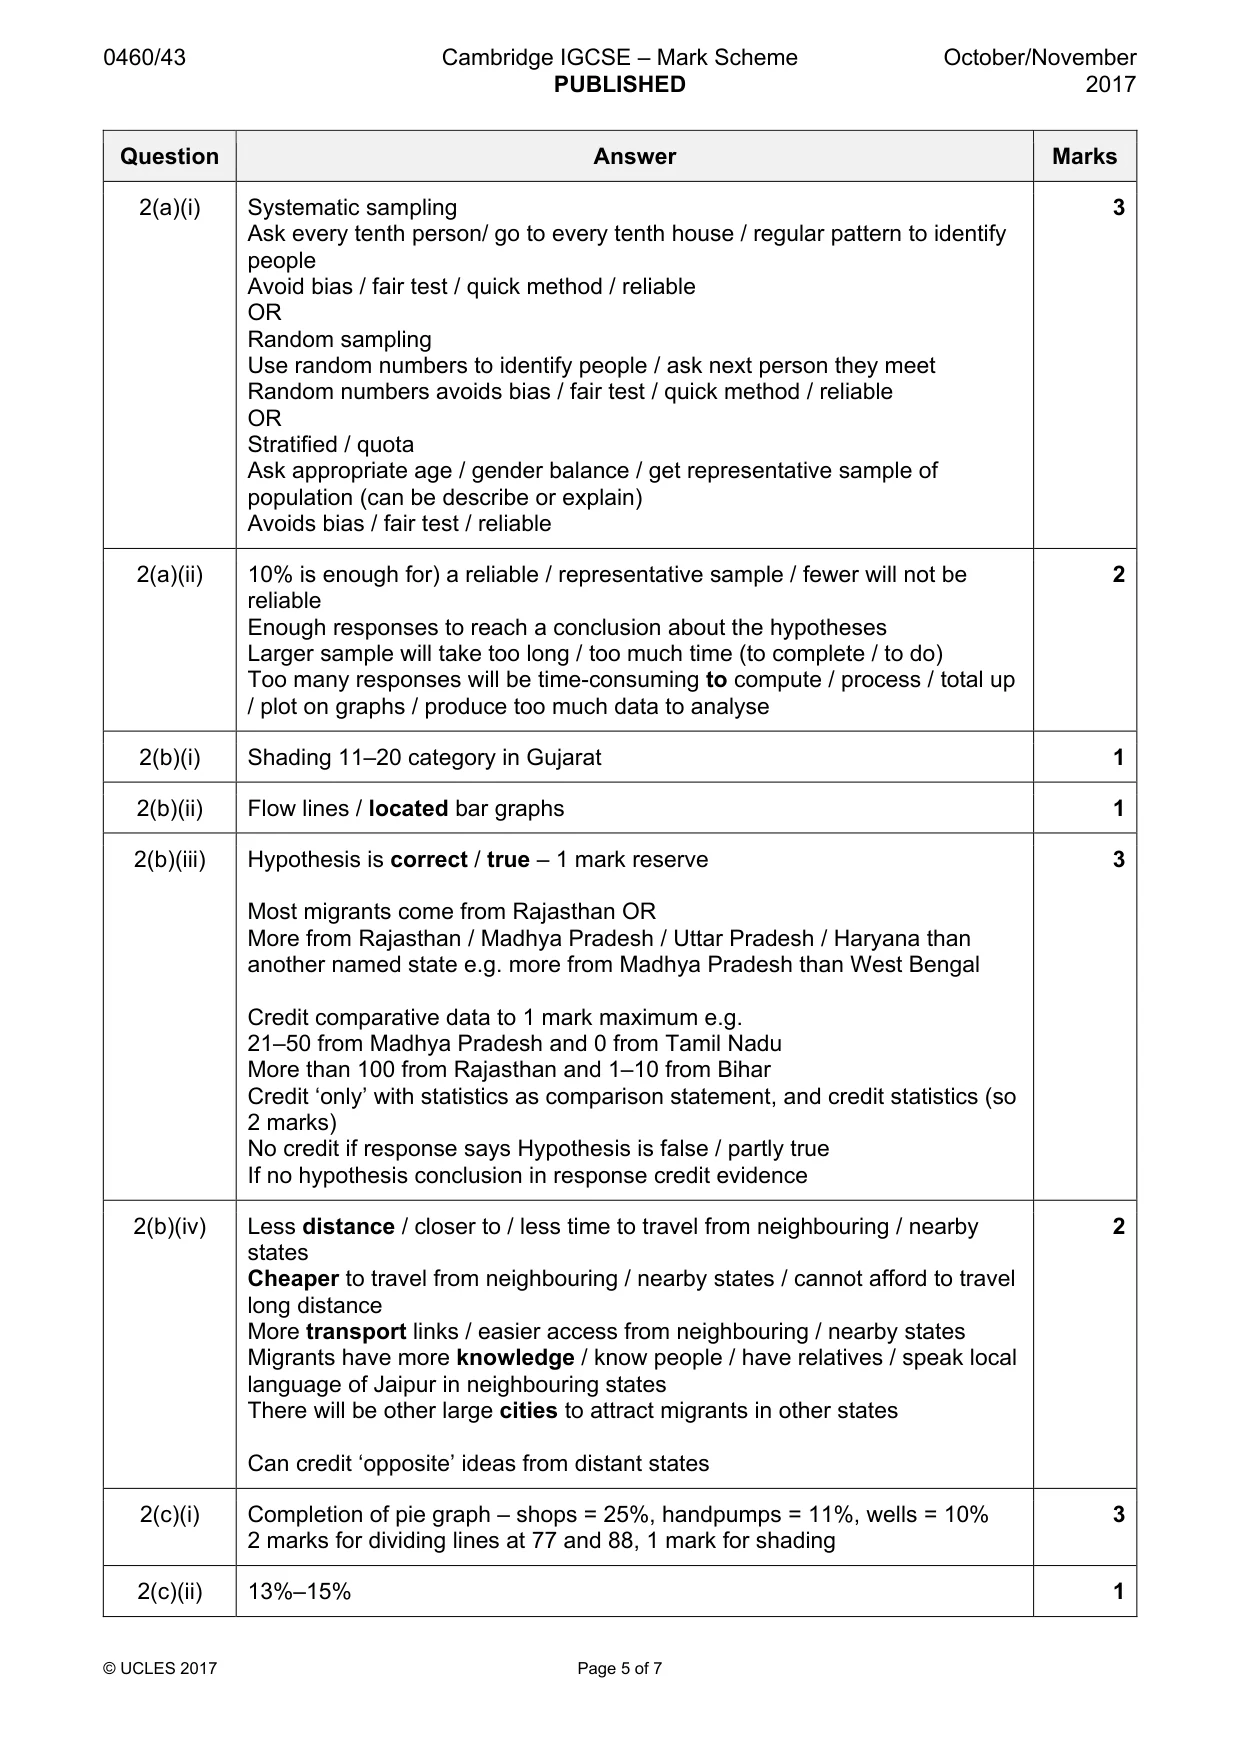
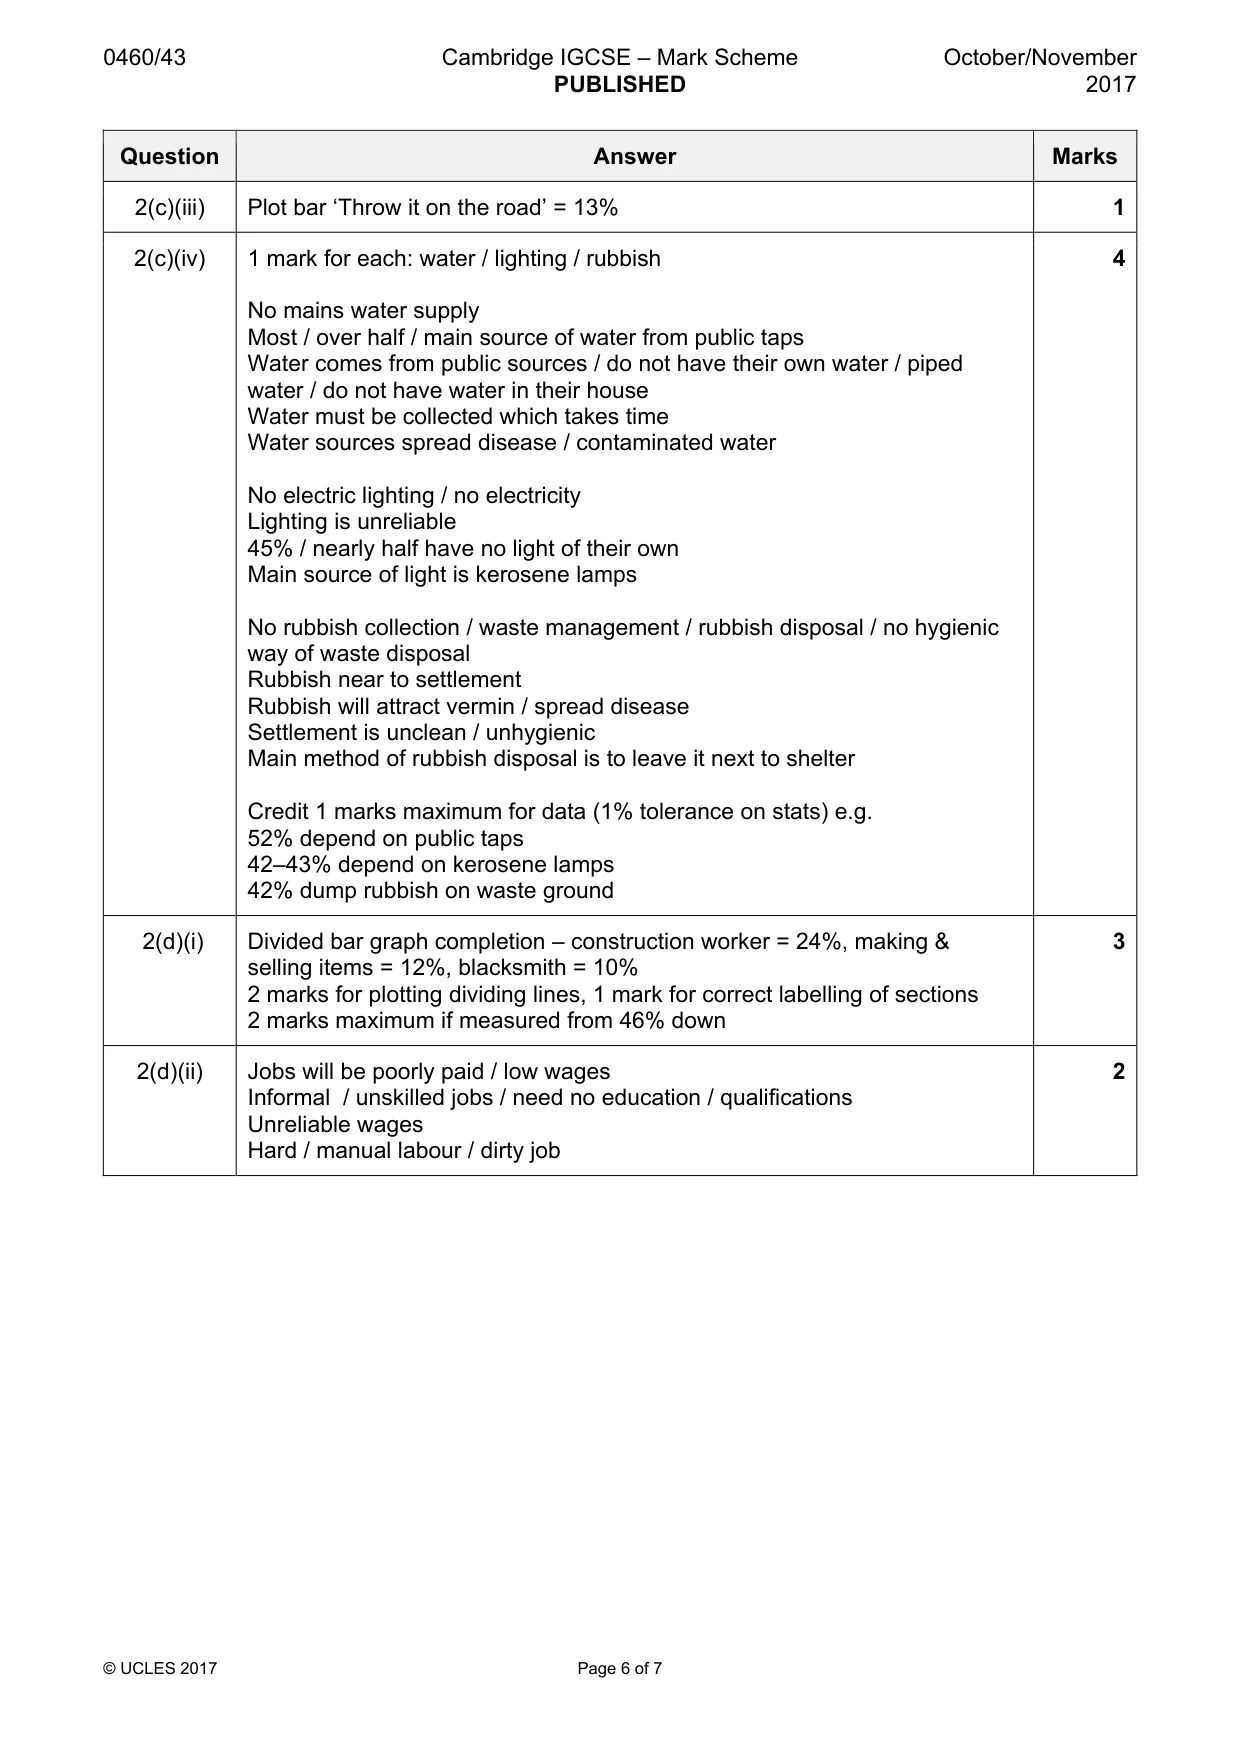
Mark scheme: 2(a)(i) Systematic sampling 3 Ask every tenth person/ go to every tenth house / regular pattern to identify people Avoid bias / fair test / quick method / reliable OR Random sampling Use random numbers to identify people / ask next person they meet Random numbers avoids bias / fair test / quick method / reliable OR Stratified / quota Ask appropriate age / gender balance / get representative sample of population (can be describe or explain) Avoids bias / fair test / reliable 2(a)(ii) 10% is enough for) a reliable / representative sample / fewer will not be 2 reliable Enough responses to reach a conclusion about the hypotheses Larger sample will take too long / too much time (to complete / to do) Too many responses will be time-consuming to compute / process / total up / plot on graphs / produce too much data to analyse 2(b)(i) Shading 11–20 category in Gujarat 1 2(b)(ii) Flow lines / located bar graphs 1 2(b)(iii) Hypothesis is correct / true – 1 mark reserve 3 Most migrants come from Rajasthan OR More from Rajasthan / Madhya Pradesh / Uttar Pradesh / Haryana than another named state e.g. more from Madhya Pradesh than West Bengal Credit comparative data to 1 mark maximum e.g. 21–50 from Madhya Pradesh and 0 from Tamil Nadu More than 100 from Rajasthan and 1–10 from Bihar Credit ‘only’ with statistics as comparison statement, and credit statistics (so 2 marks) No credit if response says Hypothesis is false / partly true If no hypothesis conclusion in response credit evidence 2(b)(iv) Less distance / closer to / less time to travel from neighbouring / nearby 2 states Cheaper to travel from neighbouring / nearby states / cannot afford to travel long distance More transport links / easier access from neighbouring / nearby states Migrants have more knowledge / know people / have relatives / speak local language of Jaipur in neighbouring states There will be other large cities to attract migrants in other states Can credit ‘opposite’ ideas from distant states 2(c)(i) Completion of pie graph – shops = 25%, handpumps = 11%, wells = 10% 3 2 marks for dividing lines at 77 and 88, 1 mark for shading 2(c)(ii) 13%–15% 1 2(c)(iii) Plot bar ‘Throw it on the road’ = 13% 1 2(c)(iv) 1 mark for each: water / lighting / rubbish 4 No mains water supply Most / over half / main source of water from public taps Water comes from public sources / do not have their own water / piped water / do not have water in their house Water must be collected which takes time Water sources spread disease / contaminated water No electric lighting / no electricity Lighting is unreliable 45% / nearly half have no light of their own Main source of light is kerosene lamps No rubbish collection / waste management / rubbish disposal / no hygienic way of waste disposal Rubbish near to settlement Rubbish will attract vermin / spread disease Settlement is unclean / unhygienic Main method of rubbish disposal is to leave it next to shelter Credit 1 marks maximum for data (1% tolerance on stats) e.g. 52% depend on public taps 42–43% depend on kerosene lamps 42% dump rubbish on waste ground 2(d)(i) Divided bar graph completion – construction worker = 24%, making & 3 selling items = 12%, blacksmith = 10% 2 marks for plotting dividing lines, 1 mark for correct labelling of sections 2 marks maximum if measured from 46% down 2(d)(ii) Jobs will be poorly paid / low wages 2 Informal / unskilled jobs / need no education / qualifications Unreliable wages Hard / manual labour / dirty job 2(e) Solution A 4 Will improve housing / services / create living spaces / provide a house / provide a shelter Create good standard of living / good quality of life / provide basic needs People can afford decent house / services Reduce disease / hygienic / clean environment / healthy environment / improve health Safe – if developed e.g. from robbery Solution B Will force people out of their accommodation / force them to move away / nowhere to live Will just transfer the squatter settlement residents elsewhere May lead to conflict with authorities / violence People end up where they started / end up back on pavement / not a permanent solution Answer does not need to be comparative Accept answers for A which are a reversal of B, e.g. Solution A will not force people to move out of their houses Credit if the answer says ‘it’ rather than solution A
What was in this paper
The subtopics covered by these 2 questions, and how many questions each got. Open one in a new tab to see every Cambridge question on it.
What you needed in this session
Cambridge’s own grade thresholds for 2017 Oct/Nov, Paper 4 · Variant 3. A higher threshold means an easier paper — the bar moves with how the cohort did.