Cambridge IGCSE Geography 0460 — 2017 Oct/Nov Paper 4 · Variant 2
0460/42/O/N/17 · 2 questions · 60 marks · ≈68 min
The question paper and its mark scheme, free to read here and free to download. This is Cambridge’s own paper, exactly as it was sat.
Question paper20 pages







Mark scheme7 pages
Answers below. Sit the paper first if you are practising.

Questions as text
Q1 · Students in Brazil did fieldwork to investigate infiltration
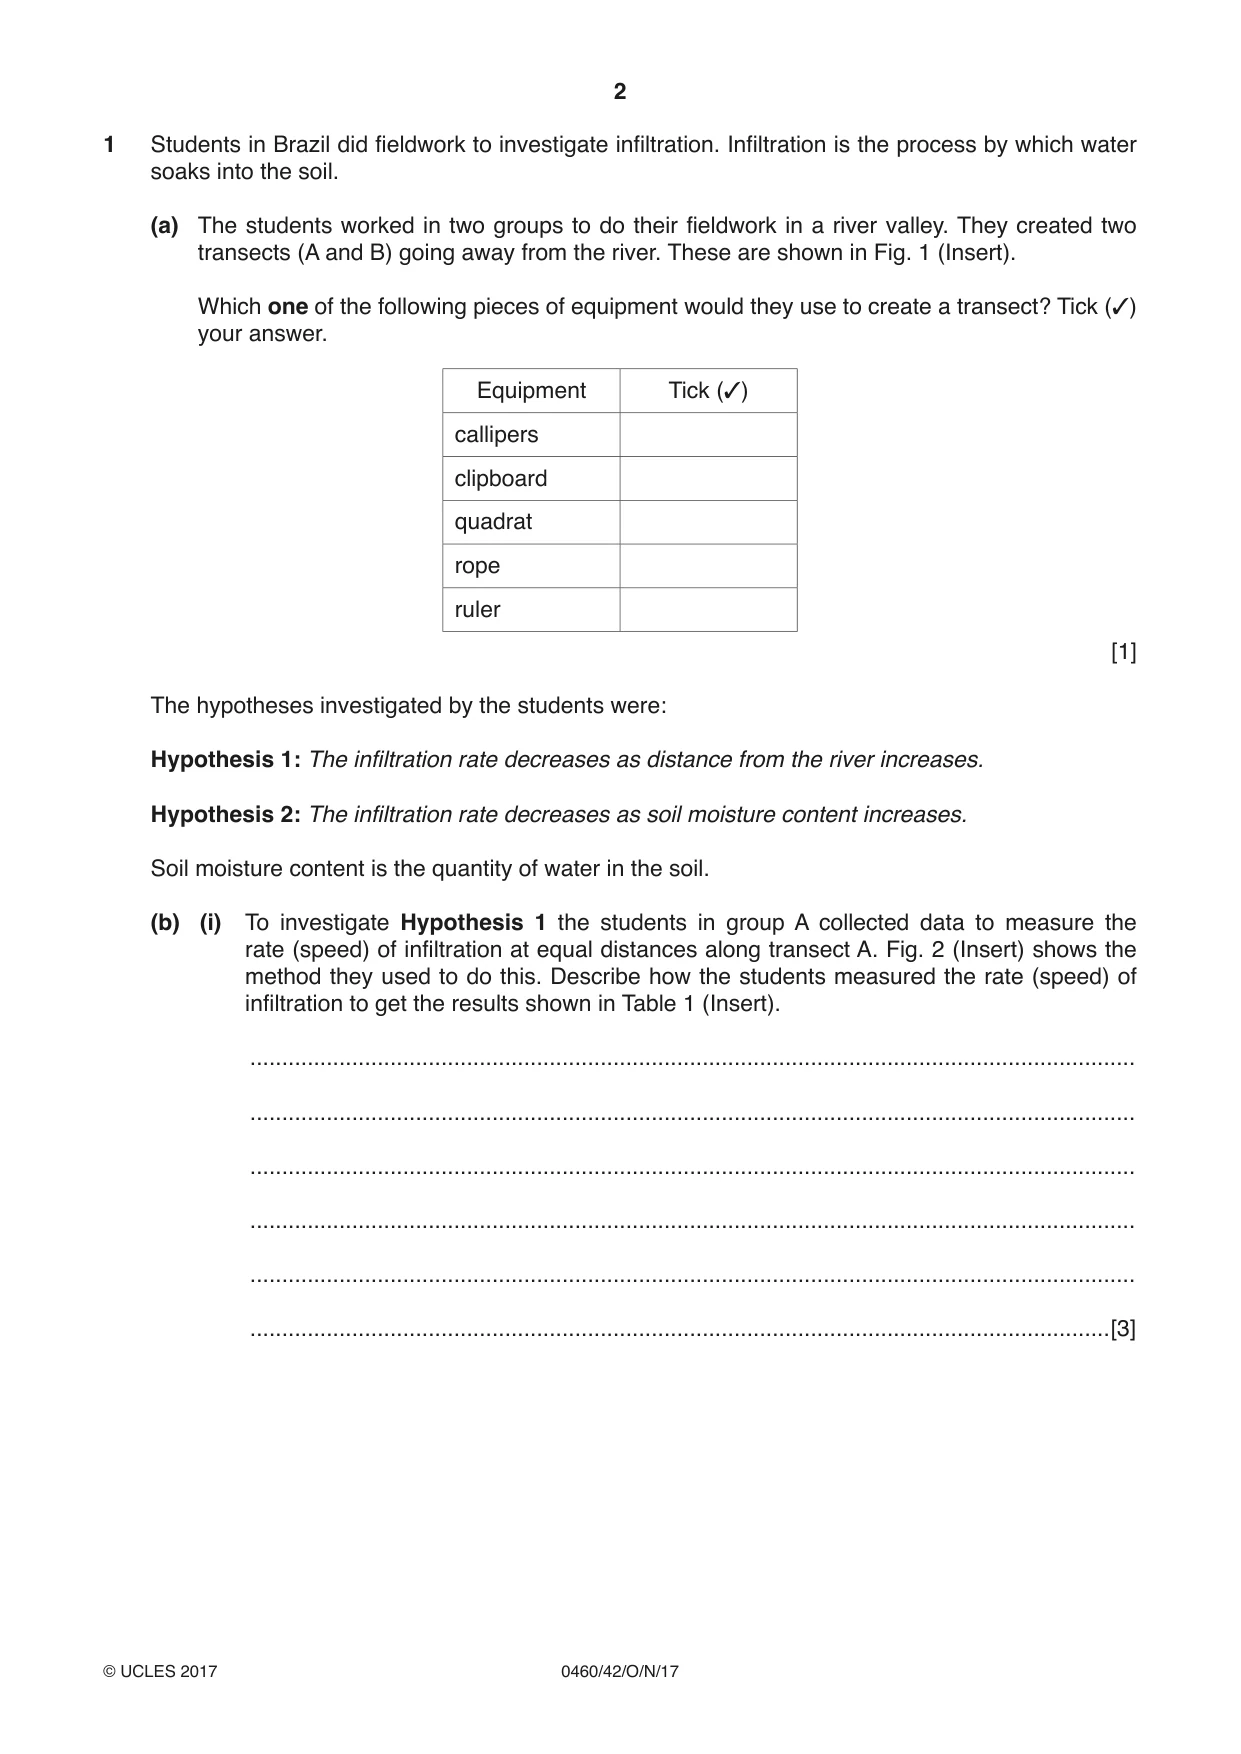
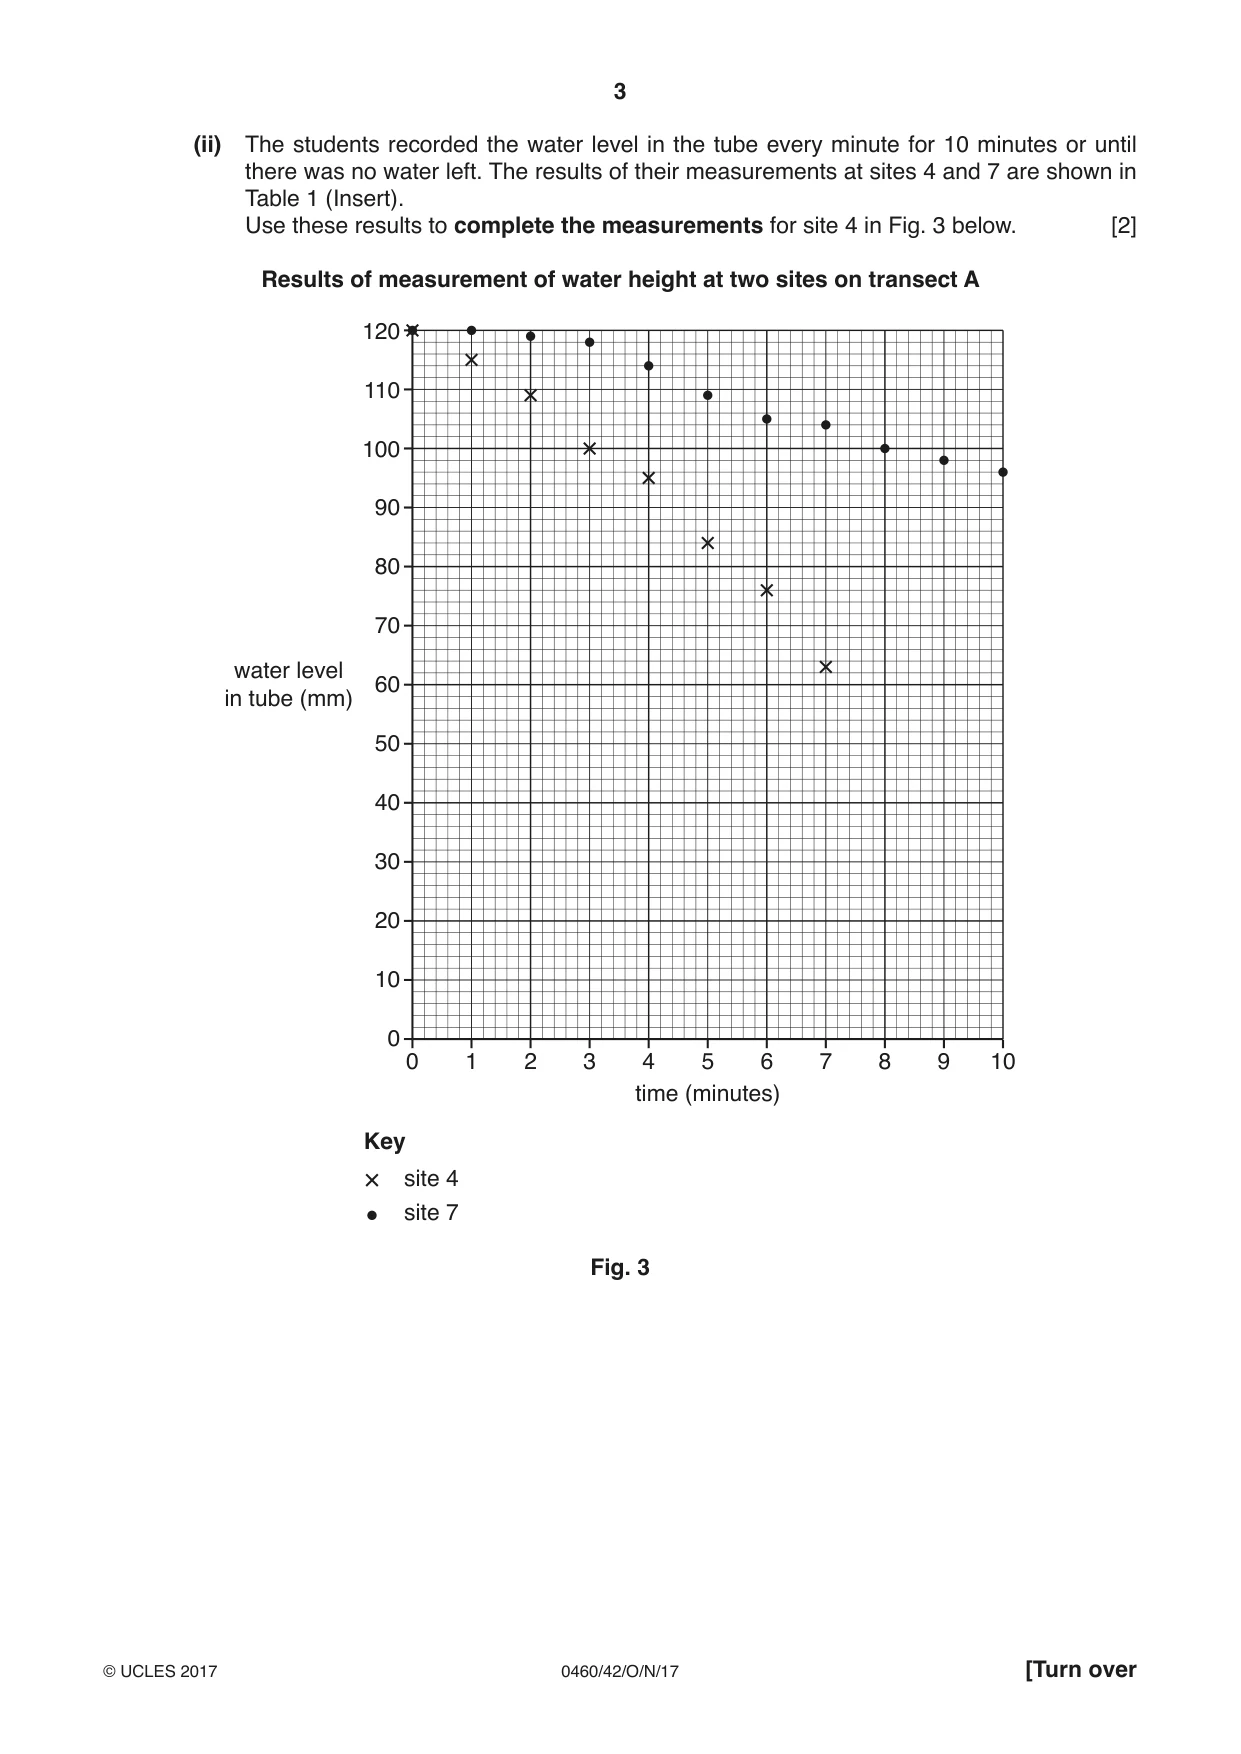
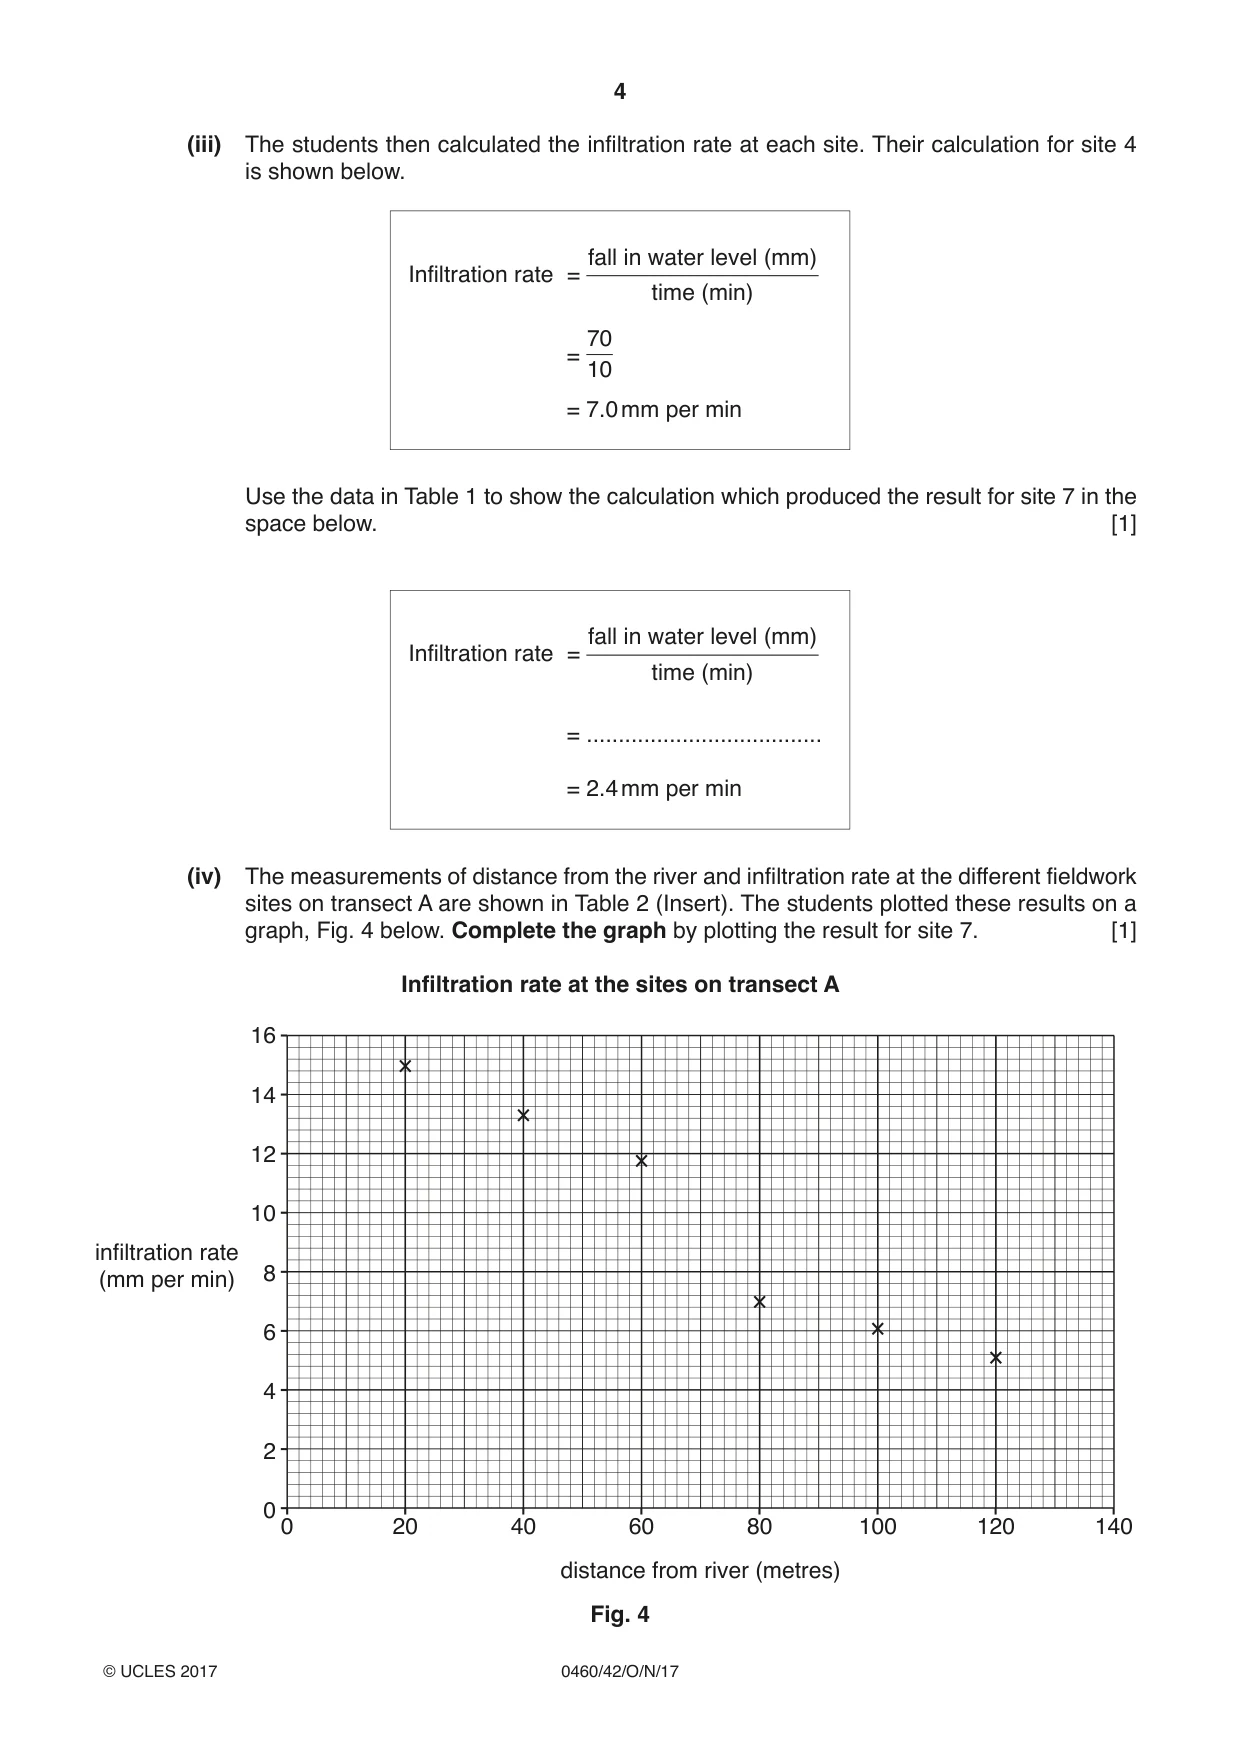
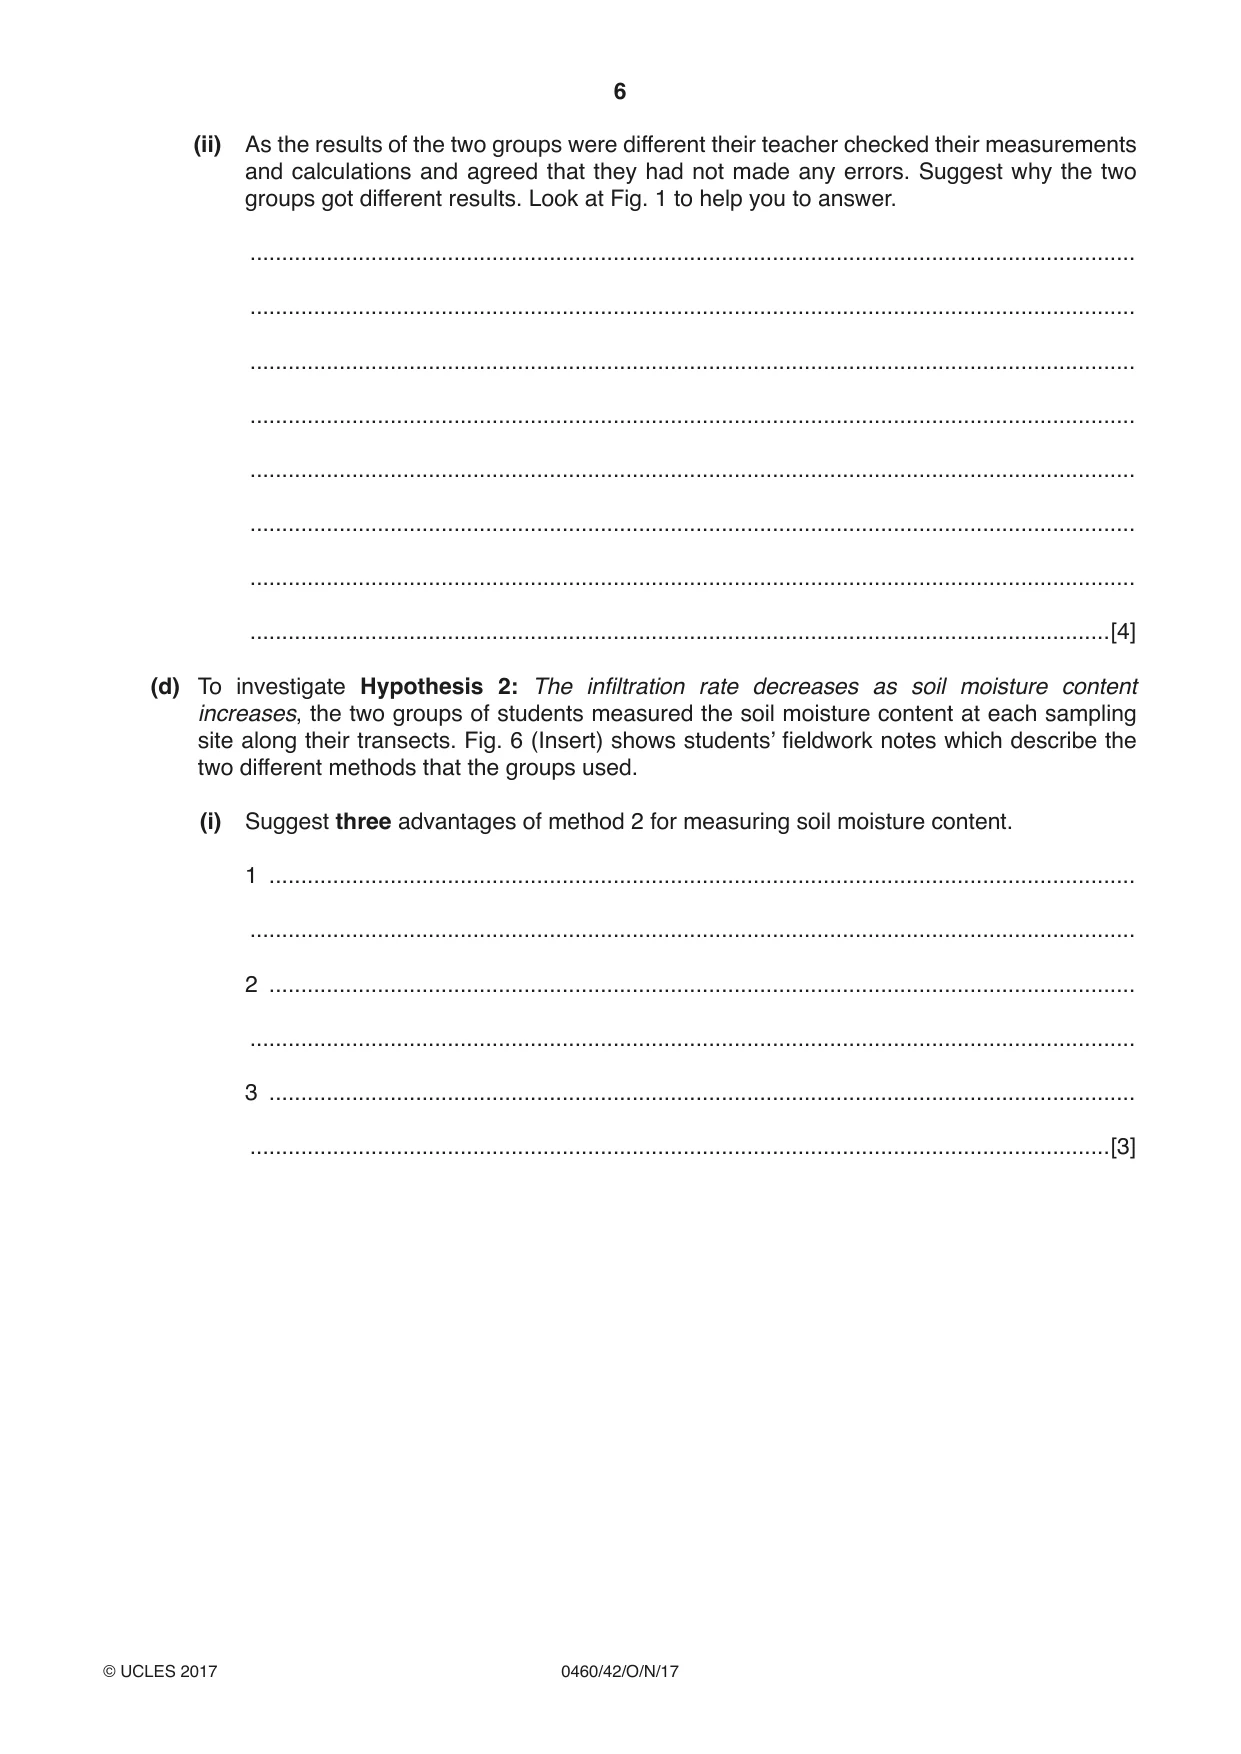
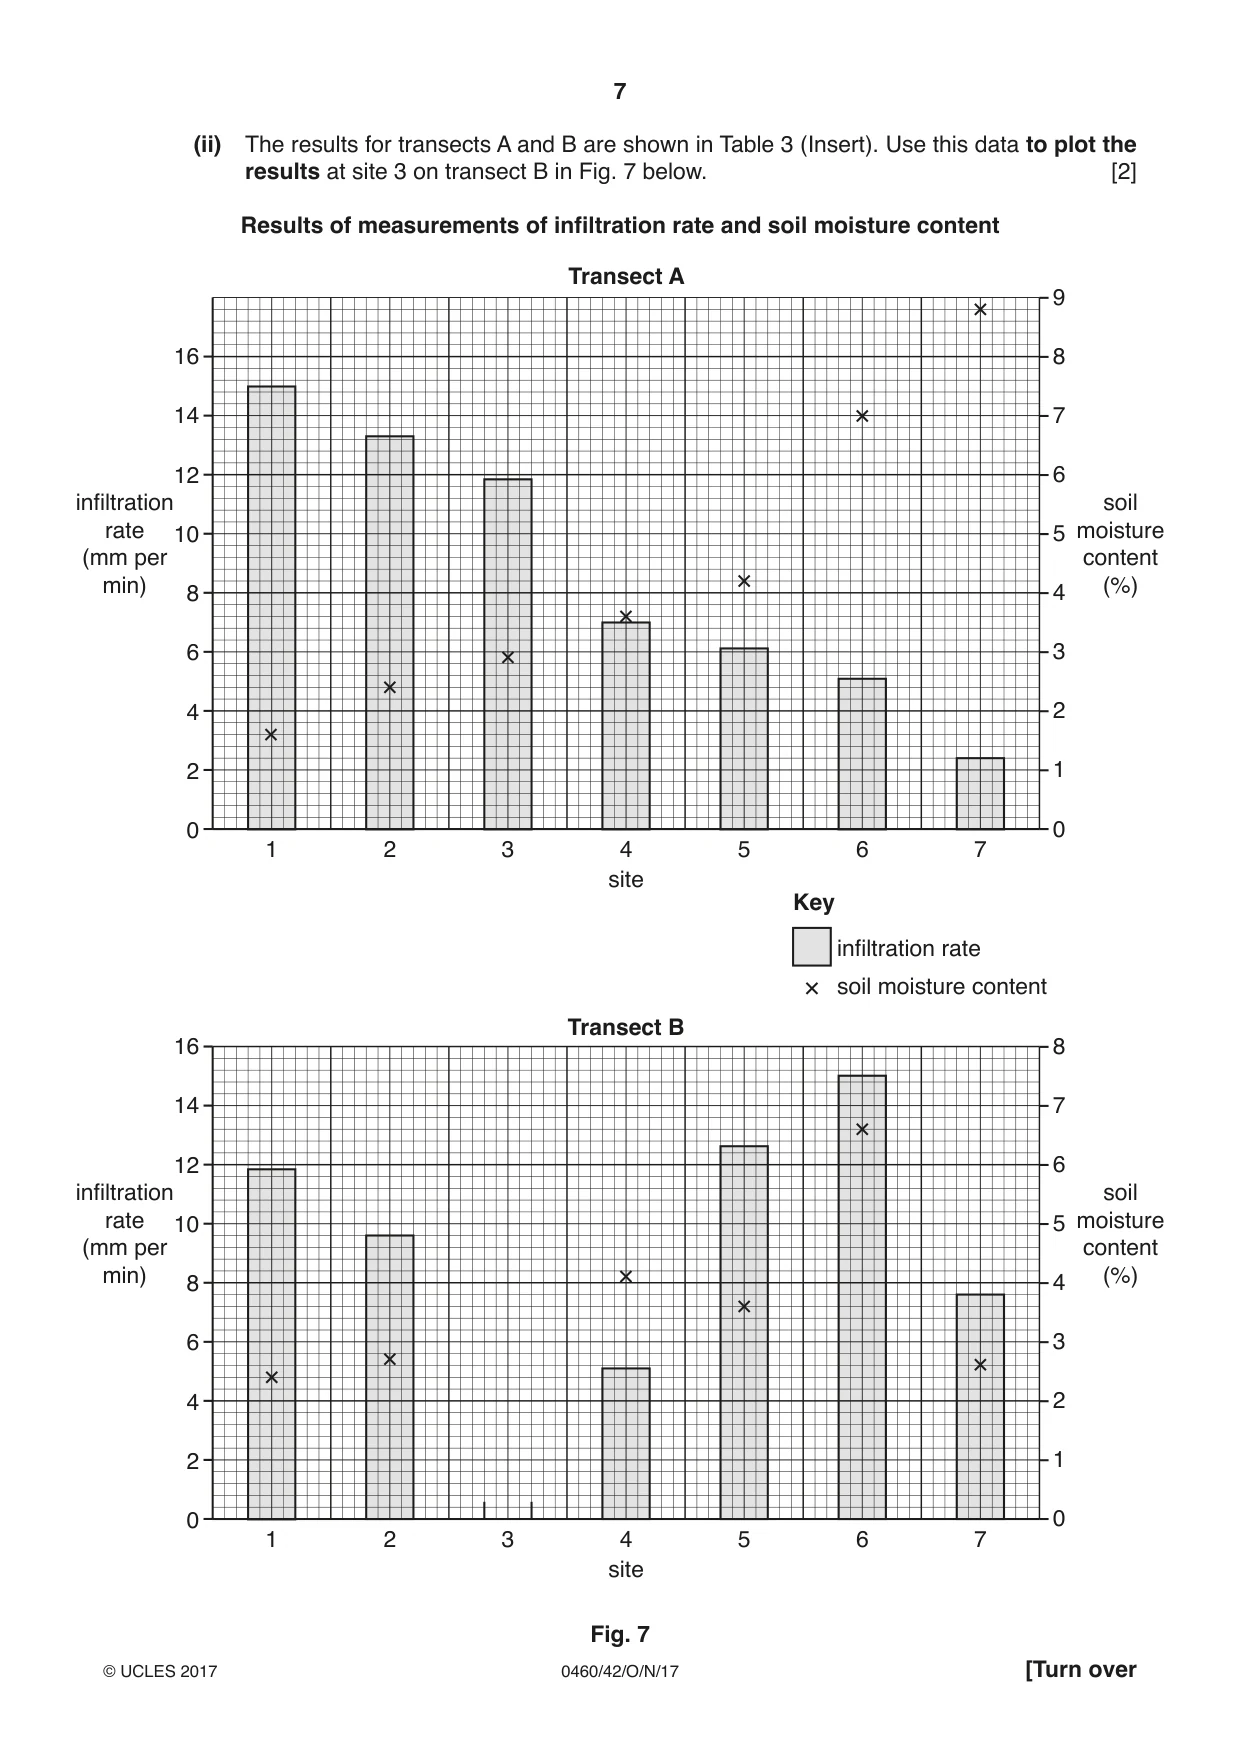
1 Students in Brazil did fieldwork to investigate infiltration. Infiltration is the process by which water soaks into the soil. (a) The students worked in two groups to do their fieldwork in a river valley. They created two transects (A and B) going away from the river. These are shown in Fig. 1 (Insert). Which one of the following pieces of equipment would they use to create a transect? Tick (3) your answer. Equipment Tick (3) callipers clipboard quadrat rope ruler [1] The hypotheses investigated by the students were: Hypothesis 1: The infiltration rate decreases as distance from the river increases. Hypothesis 2: The infiltration rate decreases as soil moisture content increases. Soil moisture content is the quantity of water in the soil. (b) (i) To investigate Hypothesis 1 the students in group A collected data to measure the rate (speed) of infiltration at equal distances along transect A. Fig. 2 (Insert) shows the method they used to do this. Describe how the students measured the rate (speed) of infiltration to get the results shown in Table 1 (Insert). ........................................................................................................................................... ........................................................................................................................................... ........................................................................................................................................... ........................................................................................................................................... ........................................................................................................................................... .......................................................................................................................................[3] (ii) The students recorded the water level in the tube every minute for 10 minutes or until there was no water left. The results of their measurements at sites 4 and 7 are shown in Table 1 (Insert). Use these results to complete the measurements for site 4 in Fig. 3 below. [2] Results of measurement of water height at two sites on transect A 120 110 100 90 80 70 water level 60 in tube (mm) 50 40 30 20 10 0 0 1 2 3 4 5 6 7 8 9 10 time (minutes) Key site 4 site 7 Fig. 3 (iii) The students then calculated the infiltration rate at each site. Their calculation for site 4 is shown below. fall in water level (mm) Infiltration rate = time (min) 70 = 10 = 7.0 mm per min Use the data in Table 1 to show the calculation which produced the result for site 7 in the space below. [1] fall in water level (mm) Infiltration rate = time (min) = ..................................... = 2.4 mm per min (iv) The measurements of distance from the river and infiltration rate at the different fieldwork sites on transect A are shown in Table 2 (Insert). The students plotted these results on a graph, Fig. 4 below. Complete the graph by plotting the result for site 7. [1] Infiltration rate at the sites on transect A 16 14 12 10 infiltration rate 8(mm per min) 6 4 2 0 0 20 40 60 80 100 120 140 distance from river (metres) Fig. 4 (v) What conclusion would the students in group A make about Hypothesis 1: The infiltration rate decreases as distance from the river increases? Support your answer with evidence from Fig. 4 and Table 2. ........................................................................................................................................... ........................................................................................................................................... ........................................................................................................................................... ........................................................................................................................................... ........................................................................................................................................... .......................................................................................................................................[3] (c) The students in group B did the same fieldwork along transect B shown in Fig. 1 (Insert). Their results are shown in Fig. 5 below. Infiltration rate at the sites on transect B 16 14 12 10 infiltration rate 8(mm per min) 6 4 2 0 0 20 40 60 80 100 120 140 distance from river (metres) Fig. 5 (i) Compare the results of the two groups on transects A and B. Use evidence from Figs. 4 and 5 in your answer. ........................................................................................................................................... ........................................................................................................................................... ........................................................................................................................................... .......................................................................................................................................[2] (ii) As the results of the two groups were different their teacher checked their measurements and calculations and agreed that they had not made any errors. Suggest why the two groups got different results. Look at Fig. 1 to help you to answer. ........................................................................................................................................... ........................................................................................................................................... ........................................................................................................................................... ........................................................................................................................................... ........................................................................................................................................... ........................................................................................................................................... ........................................................................................................................................... .......................................................................................................................................[4] (d) To investigate Hypothesis 2: The infiltration rate decreases as soil moisture content increases, the two groups of students measured the soil moisture content at each sampling site along their transects. Fig. 6 (Insert) shows students’ fieldwork notes which describe the two different methods that the groups used. (i) Suggest three advantages of method 2 for measuring soil moisture content. 1 ........................................................................................................................................ ........................................................................................................................................... 2 ........................................................................................................................................ ........................................................................................................................................... 3 ........................................................................................................................................ .......................................................................................................................................[3] (ii) The results for transects A and B are shown in Table 3 (Insert). Use this data to plot the results at site 3 on transect B in Fig. 7 below. [2] Results of measurements of infiltration rate and soil moisture content Transect A 9 16 8 14 7 12 6 infiltration soil rate 10 5 moisture (mm per content min) (%) 8 4 6 3 4 2 2 1 0 0 1 2 3 4 5 6 7 site Key infiltration rate soil moisture content Transect B 16 8 14 7 12 6 infiltration soil rate 10 5 moisture (mm per content min) (%) 8 4 6 3 4 2 2 1 0 0 1 2 3 4 5 6 7 site Fig. 7 (iii) Which group’s results agree with Hypothesis 2: The infiltration rate decreases as soil moisture content increases? Circle your decision below. Group A on Transect A Group B on Transect B Support your decision with evidence from Fig. 7 and Table 3. ........................................................................................................................................... ........................................................................................................................................... ........................................................................................................................................... ........................................................................................................................................... ........................................................................................................................................... .......................................................................................................................................[3] (e) If the students repeated their infiltration measurements after a week of heavy rain, how and why would the infiltration rates be different? ................................................................................................................................................... ................................................................................................................................................... ................................................................................................................................................... ...............................................................................................................................................[2] (f) The area around the river where the students did their fieldwork is a popular tourist area. Suggest how and explain why people walking in the area might affect the infiltration rate. ................................................................................................................................................... ................................................................................................................................................... ................................................................................................................................................... ................................................................................................................................................... ................................................................................................................................................... ...............................................................................................................................................[3] [Total: 30 marks]
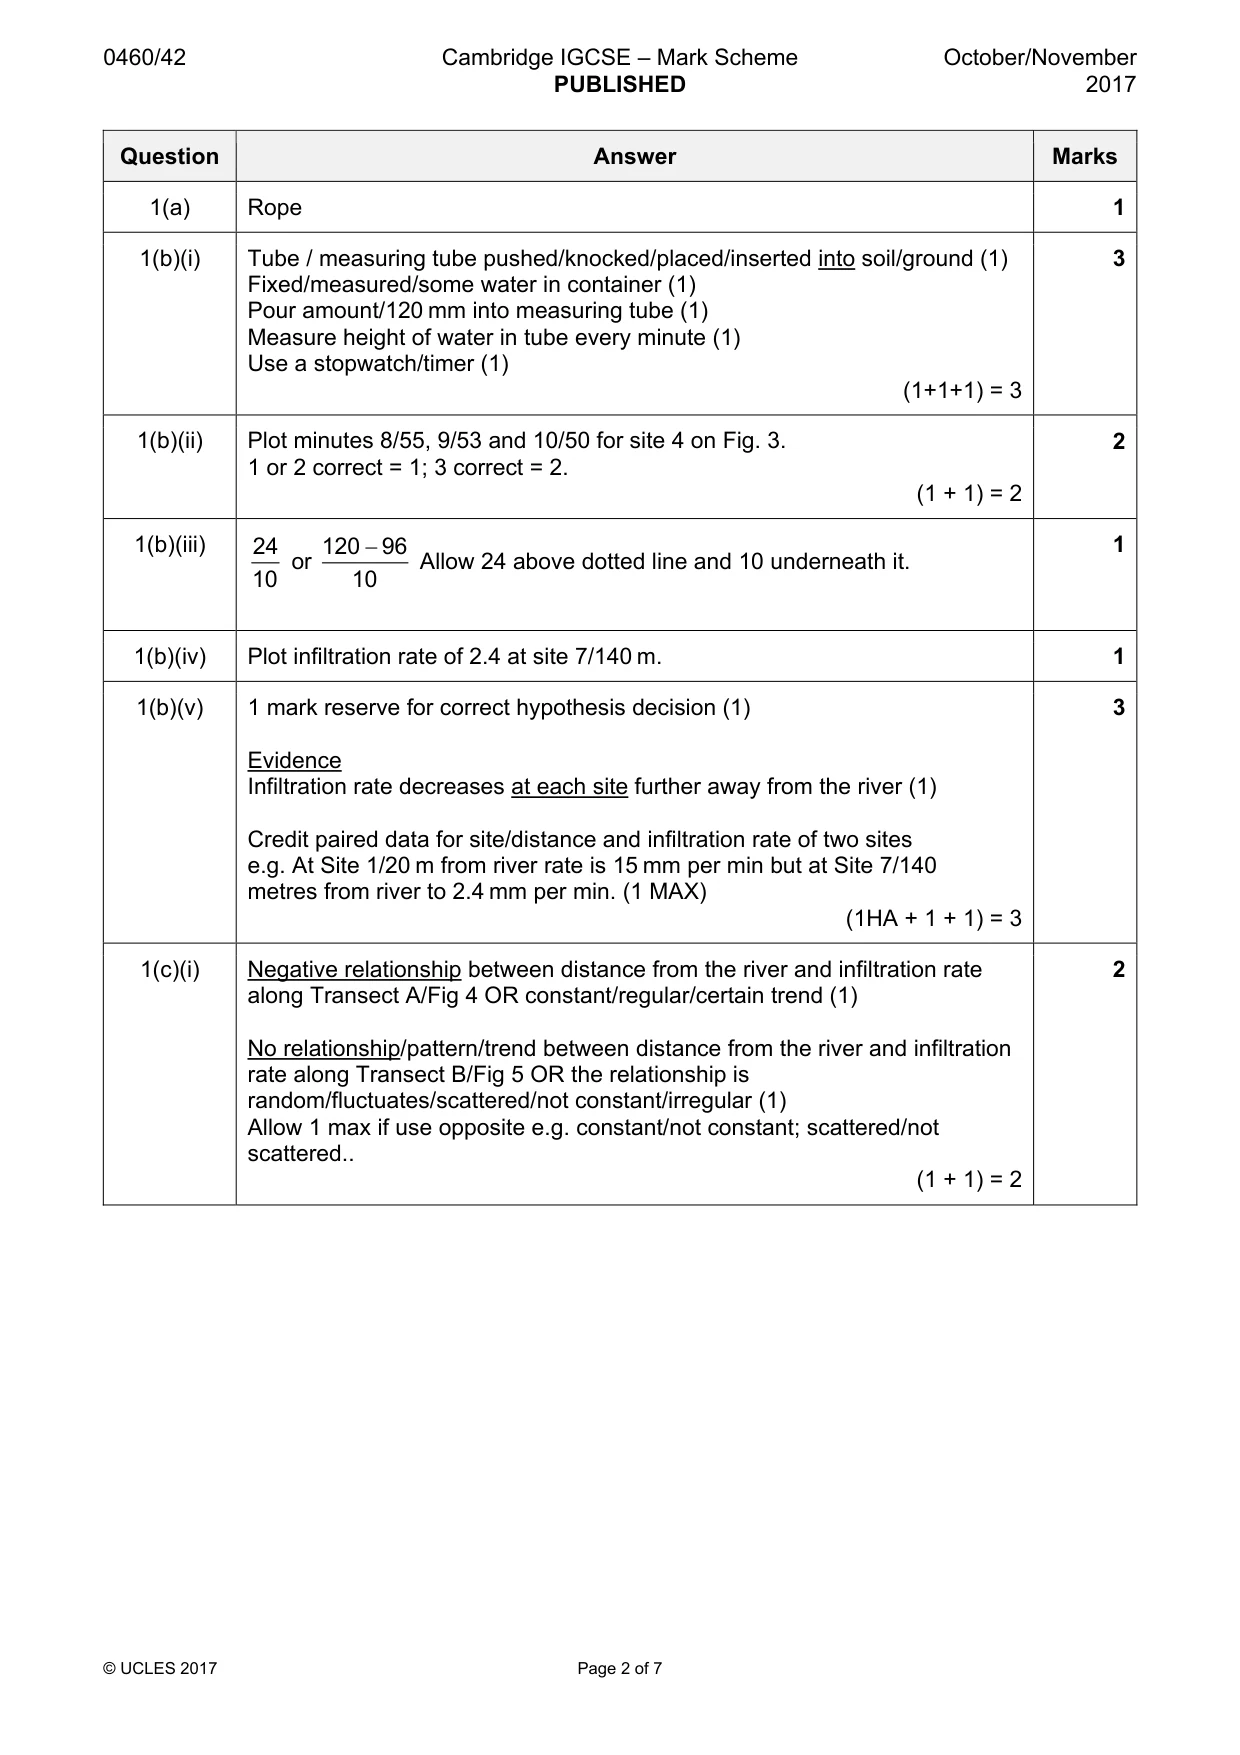
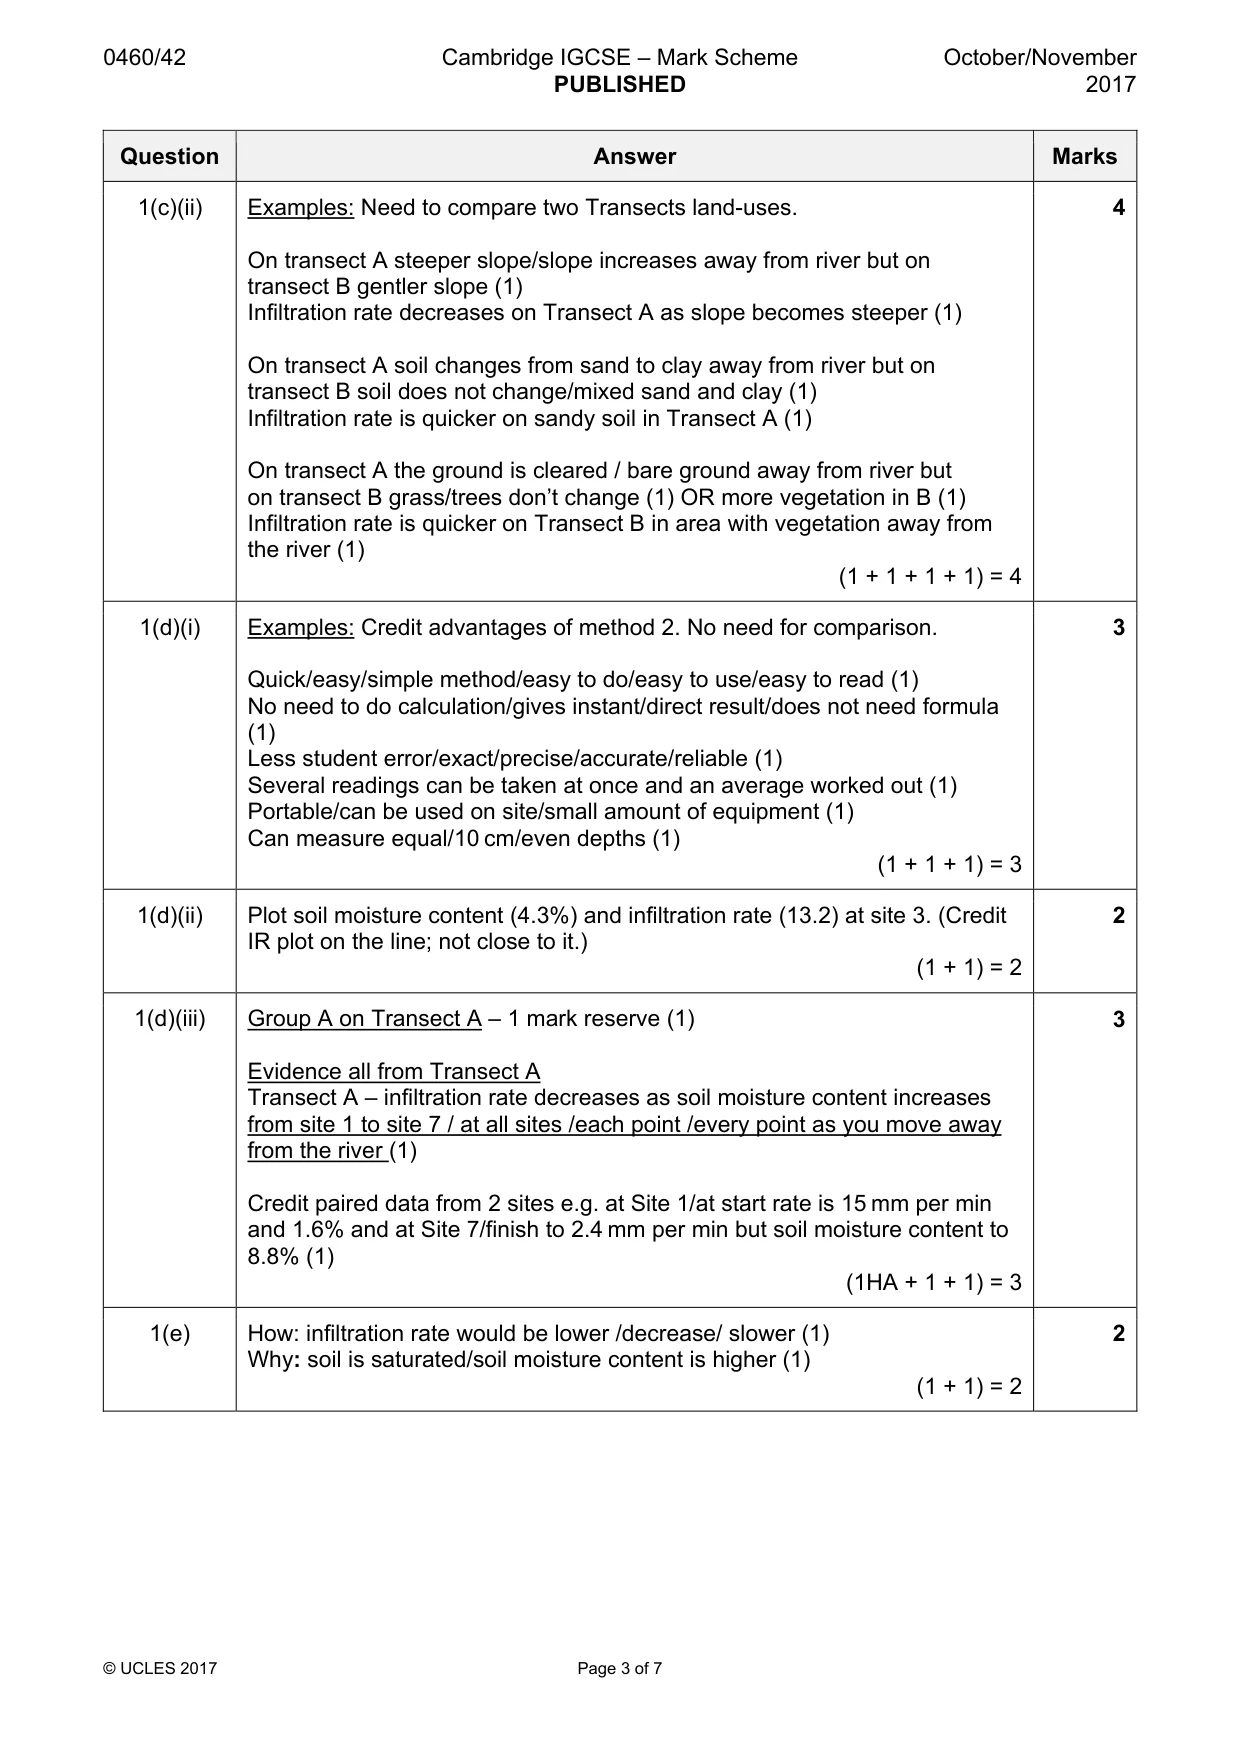
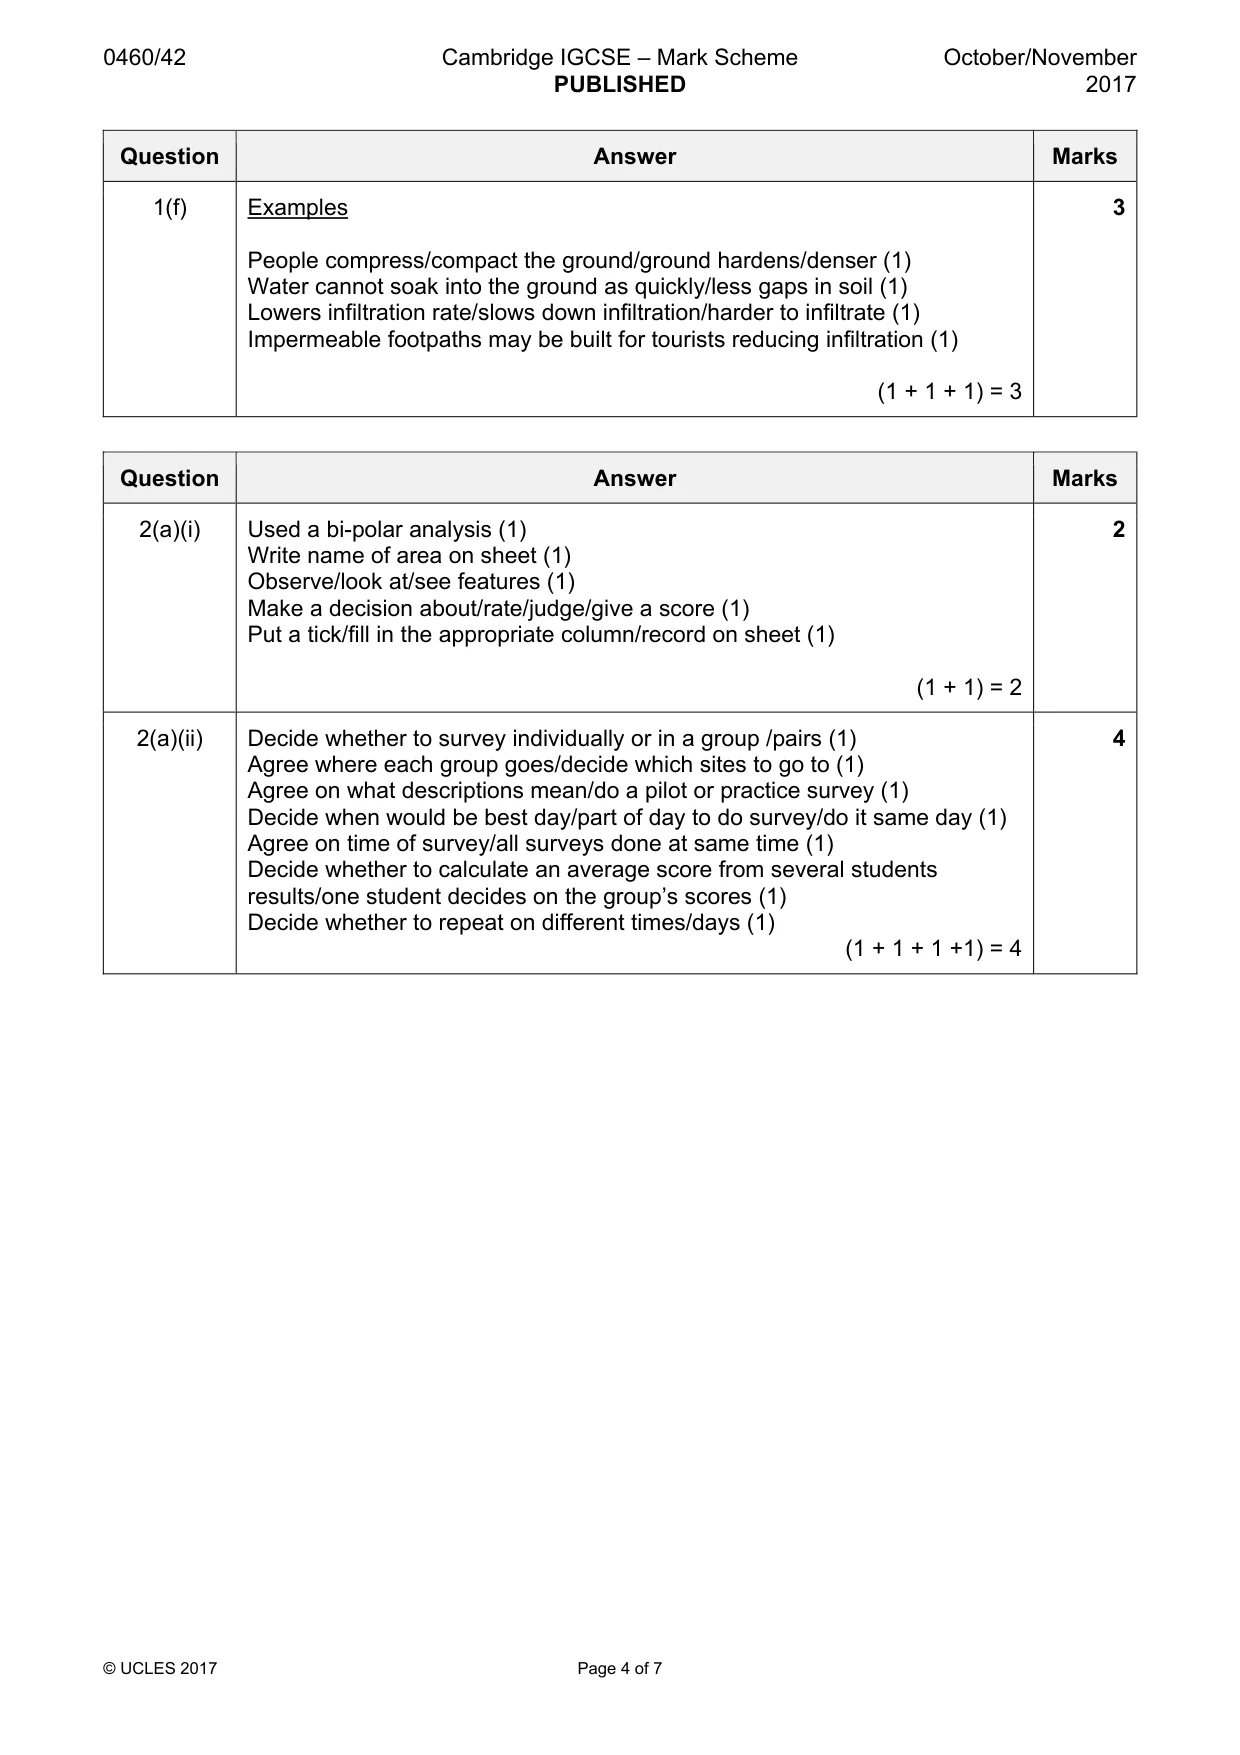
Mark scheme: Question Answer Marks 1(a) Rope 1 1(b)(i) Tube / measuring tube pushed/knocked/placed/inserted into soil/ground (1) 3 Fixed/measured/some water in container (1) Pour amount/120 mm into measuring tube (1) Measure height of water in tube every minute (1) Use a stopwatch/timer (1) (1+1+1) = 3 1(b)(ii) Plot minutes 8/55, 9/53 and 10/50 for site 4 on Fig. 3. 2 1 or 2 correct = 1; 3 correct = 2. (1 + 1) = 2 1(b)(iii) 24 120 − 96 1 or Allow 24 above dotted line and 10 underneath it. 10 10 1(b)(iv) Plot infiltration rate of 2.4 at site 7/140 m. 1 1(b)(v) 1 mark reserve for correct hypothesis decision (1) 3 Evidence Infiltration rate decreases at each site further away from the river (1) Credit paired data for site/distance and infiltration rate of two sites e.g. At Site 1/20 m from river rate is 15 mm per min but at Site 7/140 metres from river to 2.4 mm per min. (1 MAX) (1HA + 1 + 1) = 3 1(c)(i) Negative relationship between distance from the river and infiltration rate 2 along Transect A/Fig 4 OR constant/regular/certain trend (1) No relationship/pattern/trend between distance from the river and infiltration rate along Transect B/Fig 5 OR the relationship is random/fluctuates/scattered/not constant/irregular (1) Allow 1 max if use opposite e.g. constant/not constant; scattered/not scattered.. (1 + 1) = 2 1(c)(ii) Examples: Need to compare two Transects land-uses. 4 On transect A steeper slope/slope increases away from river but on transect B gentler slope (1) Infiltration rate decreases on Transect A as slope becomes steeper (1) On transect A soil changes from sand to clay away from river but on transect B soil does not change/mixed sand and clay (1) Infiltration rate is quicker on sandy soil in Transect A (1) On transect A the ground is cleared / bare ground away from river but on transect B grass/trees don’t change (1) OR more vegetation in B (1) Infiltration rate is quicker on Transect B in area with vegetation away from the river (1) (1 + 1 + 1 + 1) = 4 1(d)(i) Examples: Credit advantages of method 2. No need for comparison. 3 Quick/easy/simple method/easy to do/easy to use/easy to read (1) No need to do calculation/gives instant/direct result/does not need formula (1) Less student error/exact/precise/accurate/reliable (1) Several readings can be taken at once and an average worked out (1) Portable/can be used on site/small amount of equipment (1) Can measure equal/10 cm/even depths (1) (1 + 1 + 1) = 3 1(d)(ii) Plot soil moisture content (4.3%) and infiltration rate (13.2) at site 3. (Credit 2 IR plot on the line; not close to it.) (1 + 1) = 2 1(d)(iii) Group A on Transect A – 1 mark reserve (1) 3 Evidence all from Transect A Transect A – infiltration rate decreases as soil moisture content increases from site 1 to site 7 / at all sites /each point /every point as you move away from the river (1) Credit paired data from 2 sites e.g. at Site 1/at start rate is 15 mm per min and 1.6% and at Site 7/finish to 2.4 mm per min but soil moisture content to 8.8% (1) (1HA + 1 + 1) = 3 1(e) How: infiltration rate would be lower /decrease/ slower (1) 2 Why: soil is saturated/soil moisture content is higher (1) (1 + 1) = 2 1(f) Examples 3 People compress/compact the ground/ground hardens/denser (1) Water cannot soak into the ground as quickly/less gaps in soil (1) Lowers infiltration rate/slows down infiltration/harder to infiltrate (1) Impermeable footpaths may be built for tourists reducing infiltration (1) (1 + 1 + 1) = 3
Q2 · Students in the UK wanted to investigate how areas of their city were different from each…
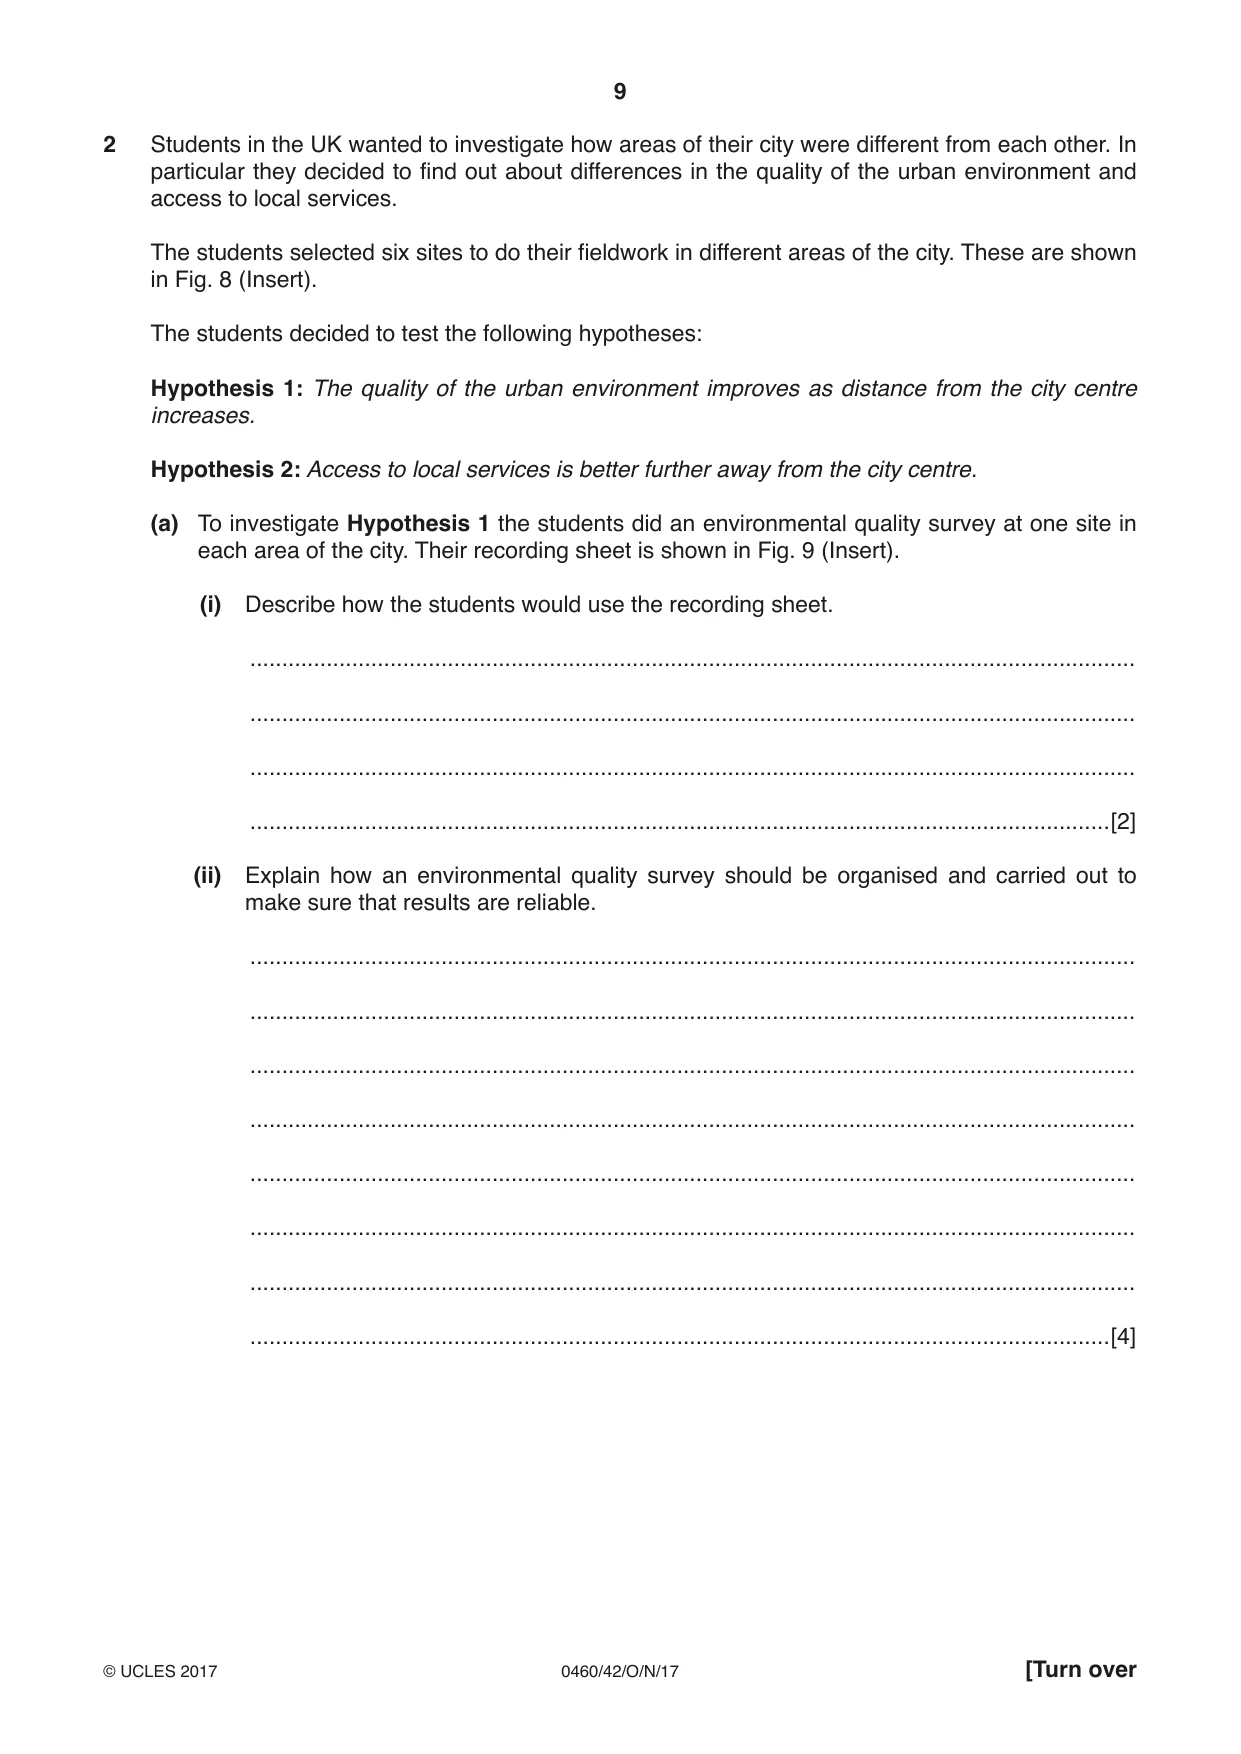
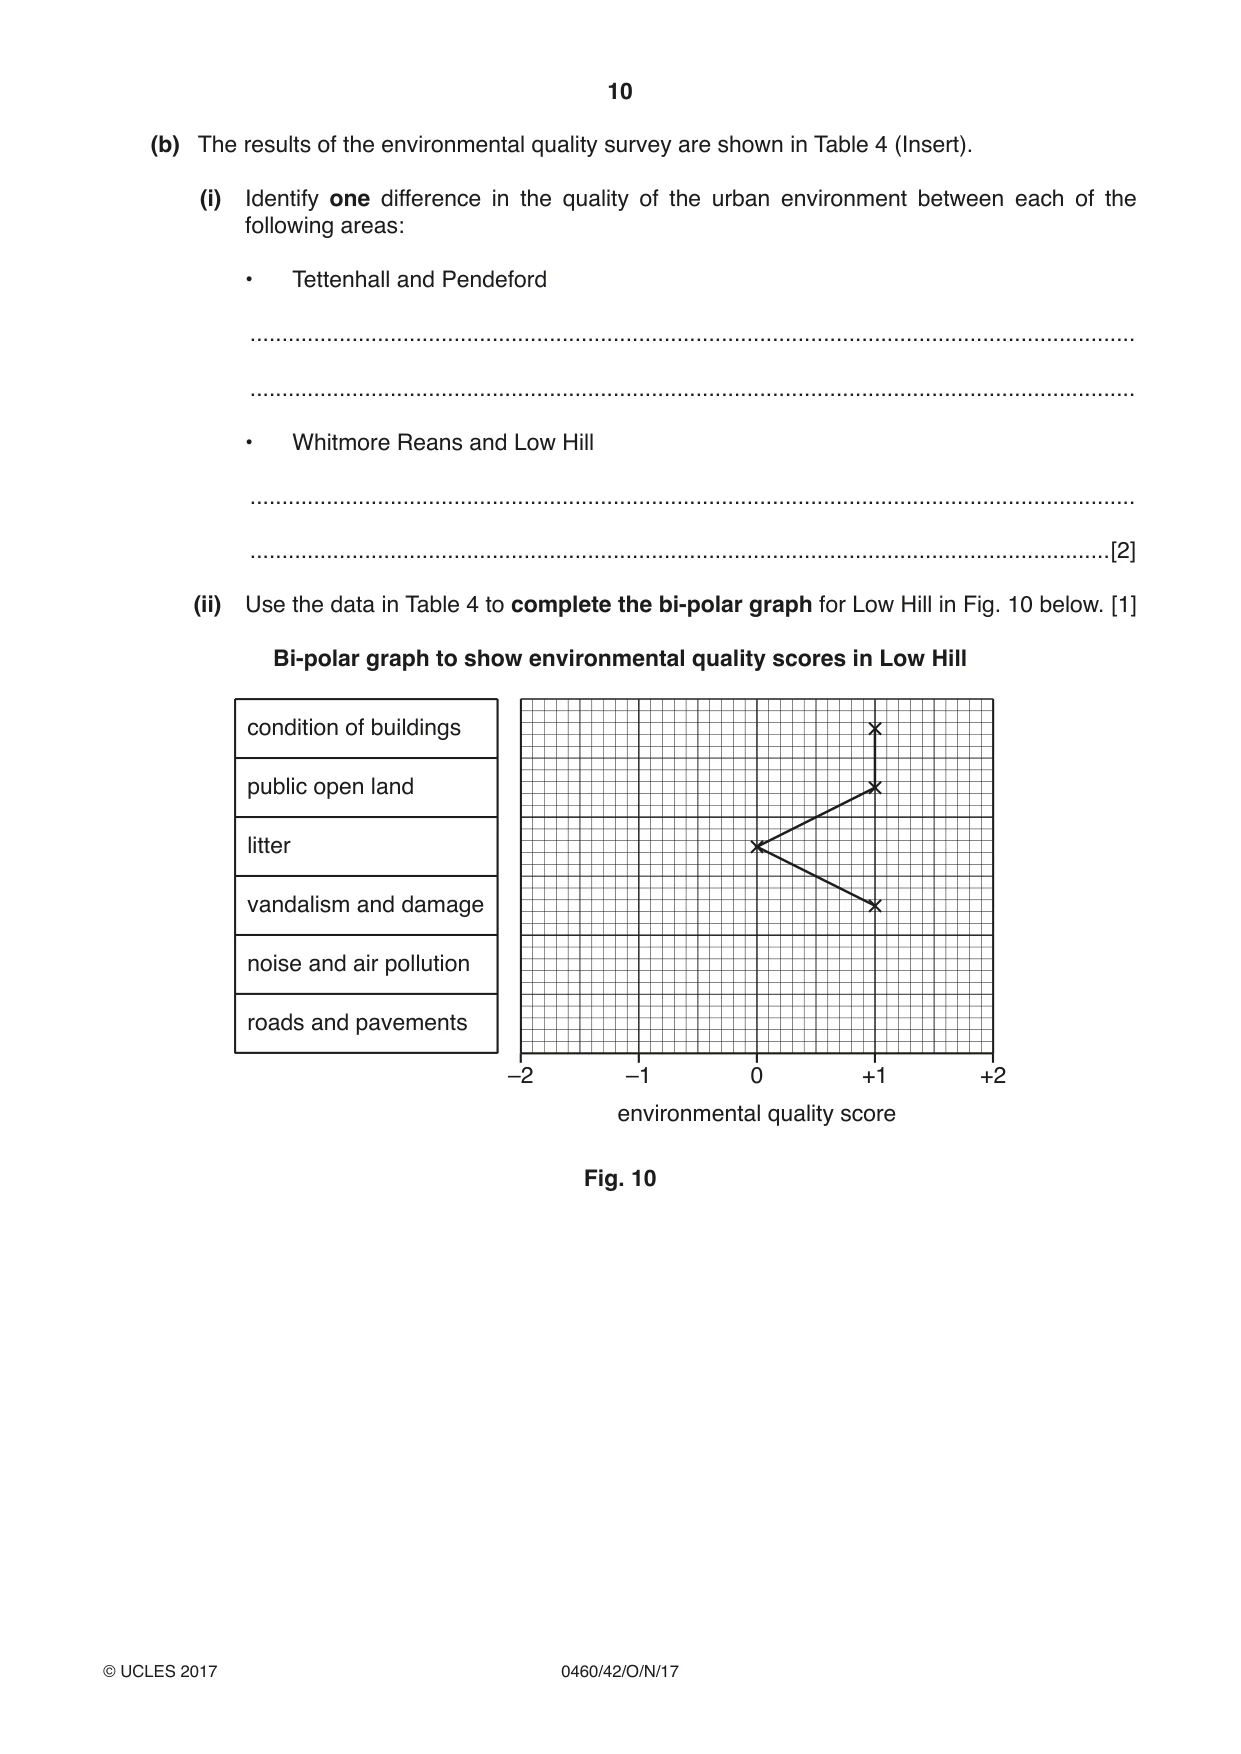
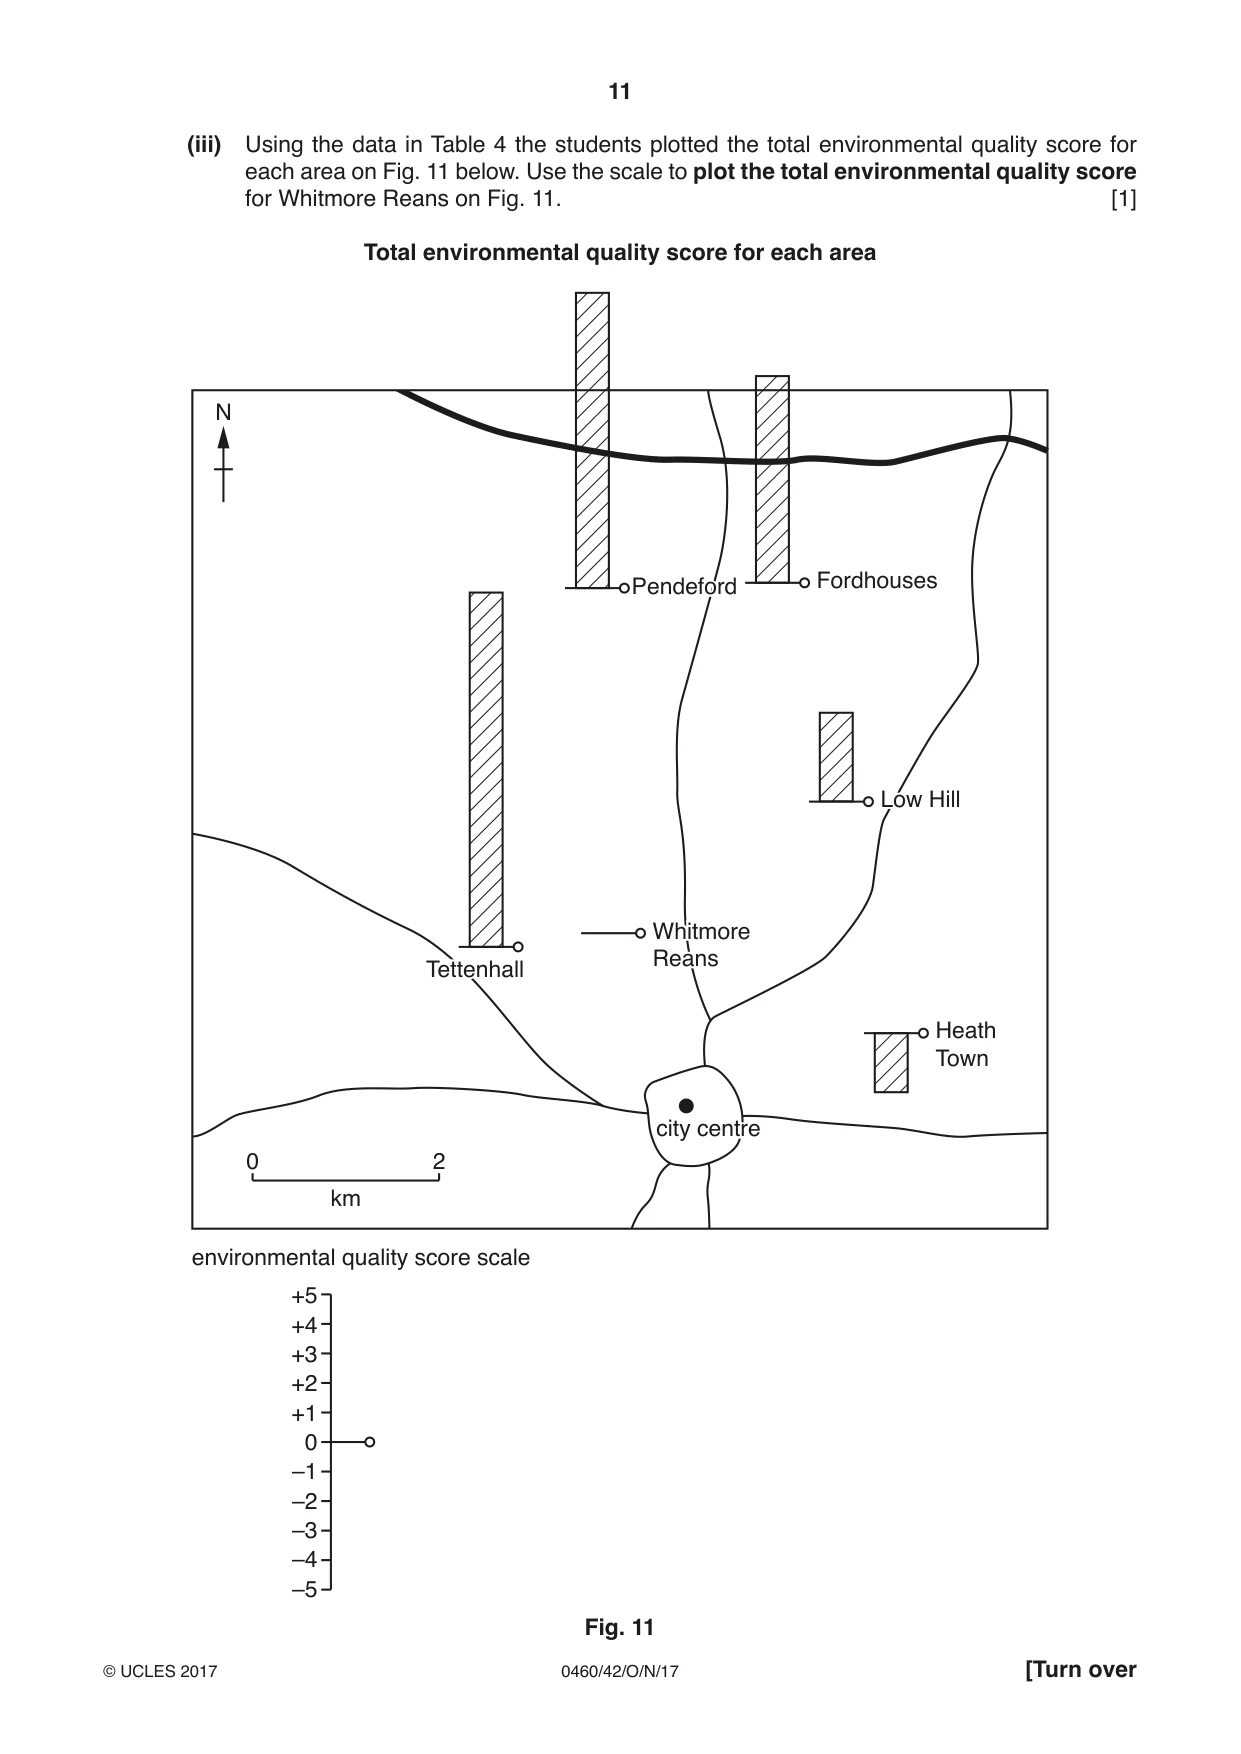
2 Students in the UK wanted to investigate how areas of their city were different from each other. In particular they decided to find out about differences in the quality of the urban environment and access to local services. The students selected six sites to do their fieldwork in different areas of the city. These are shown in Fig. 8 (Insert). The students decided to test the following hypotheses: Hypothesis 1: The quality of the urban environment improves as distance from the city centre increases. Hypothesis 2: Access to local services is better further away from the city centre. (a) To investigate Hypothesis 1 the students did an environmental quality survey at one site in each area of the city. Their recording sheet is shown in Fig. 9 (Insert). (i) Describe how the students would use the recording sheet. ........................................................................................................................................... ........................................................................................................................................... ........................................................................................................................................... .......................................................................................................................................[2] (ii) Explain how an environmental quality survey should be organised and carried out to make sure that results are reliable. ........................................................................................................................................... ........................................................................................................................................... ........................................................................................................................................... ........................................................................................................................................... ........................................................................................................................................... ........................................................................................................................................... ........................................................................................................................................... .......................................................................................................................................[4] (b) The results of the environmental quality survey are shown in Table 4 (Insert). (i) Identify one difference in the quality of the urban environment between each of the following areas: • Tettenhall and Pendeford ........................................................................................................................................... ........................................................................................................................................... • Whitmore Reans and Low Hill ........................................................................................................................................... .......................................................................................................................................[2] (ii) Use the data in Table 4 to complete the bi-polar graph for Low Hill in Fig. 10 below. [1] Bi-polar graph to show environmental quality scores in Low Hill condition of buildings public open land litter vandalism and damage noise and air pollution roads and pavements –2 –1 0 +1 +2 environmental quality score Fig. 10 (iii) Using the data in Table 4 the students plotted the total environmental quality score for each area on Fig. 11 below. Use the scale to plot the total environmental quality score for Whitmore Reans on Fig. 11. [1] Total environmental quality score for each area N Fordhouses PendefordPendeford LowLow HillHill WhitmoreWhitmore ReansReans TettenhallTettenhall Heath Town citycity centrecentre 0 2 km environmental quality score scale +5 +4 +3 +2 +1 0 –1 –2 –3 –4 –5 Fig. 11
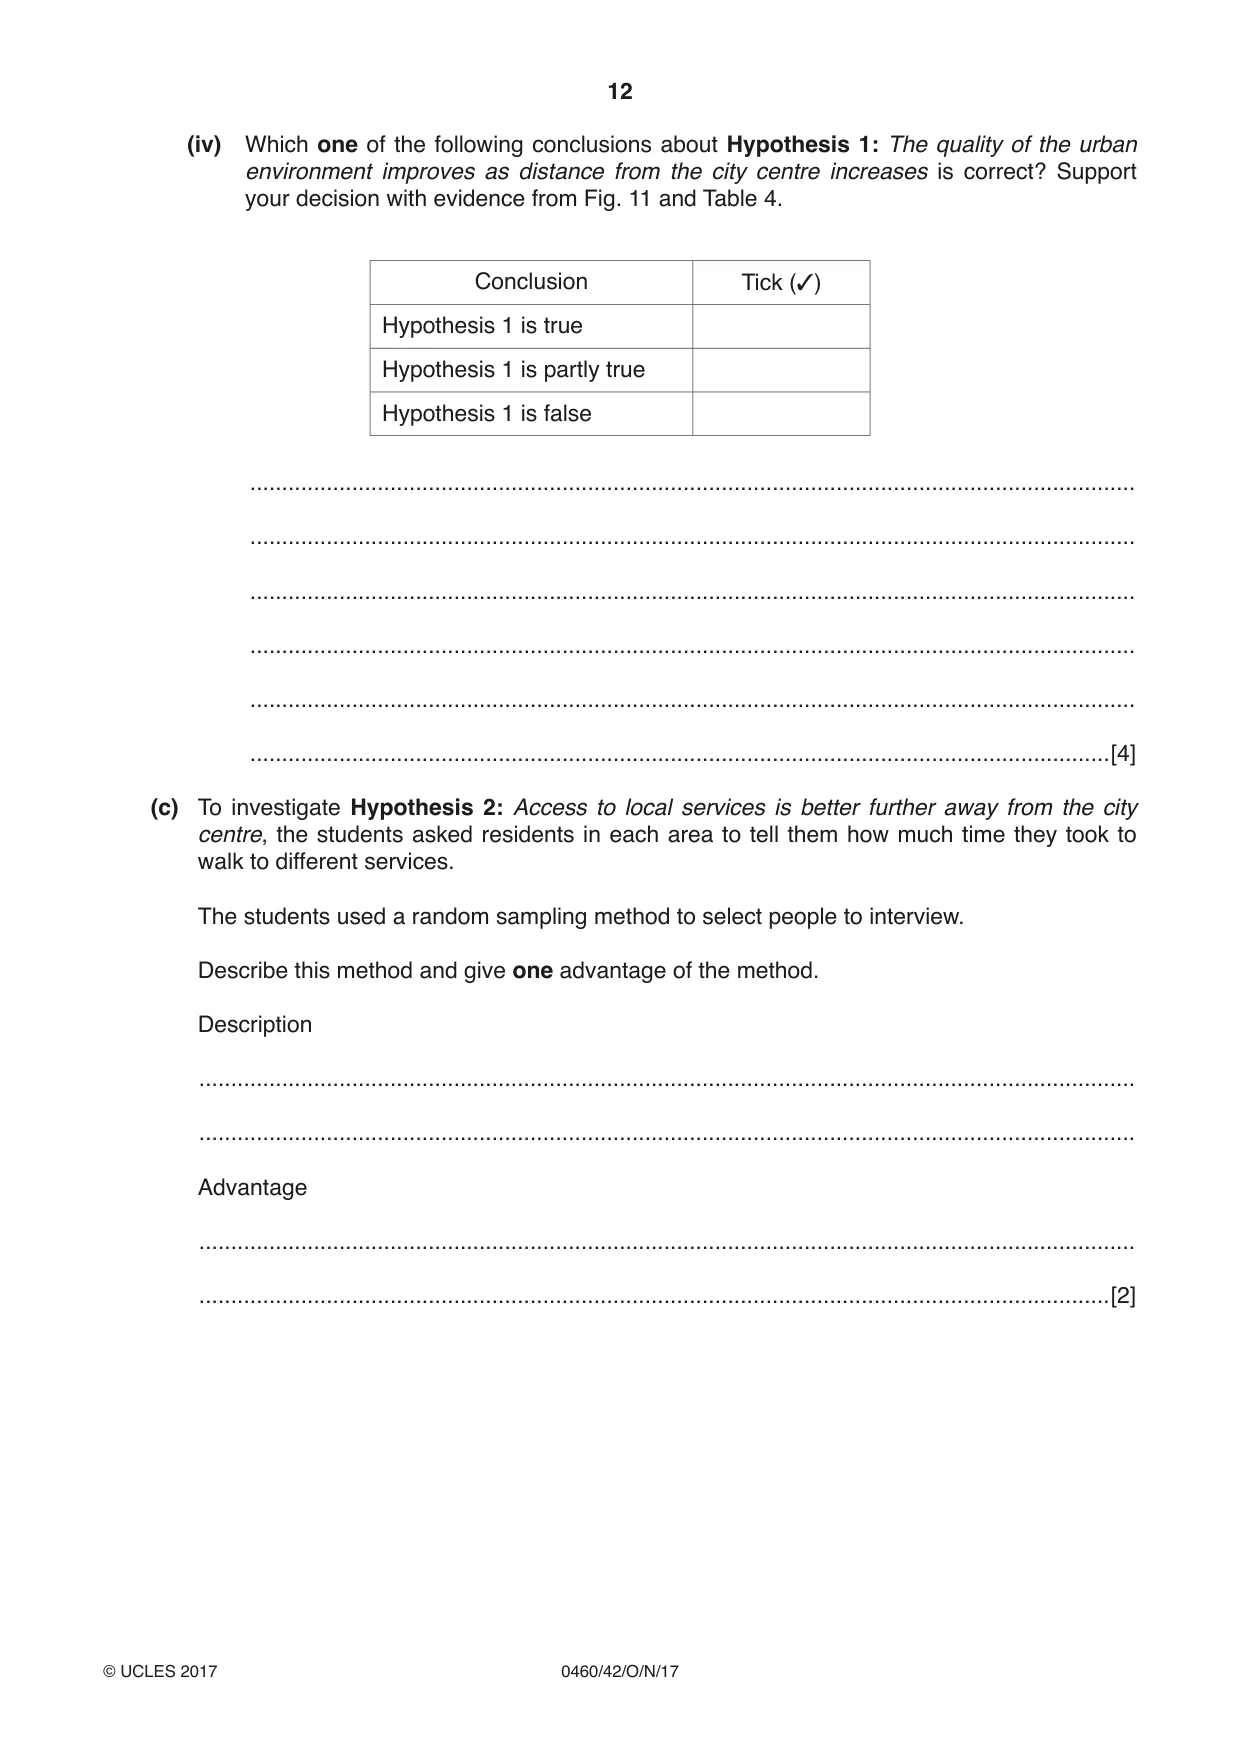
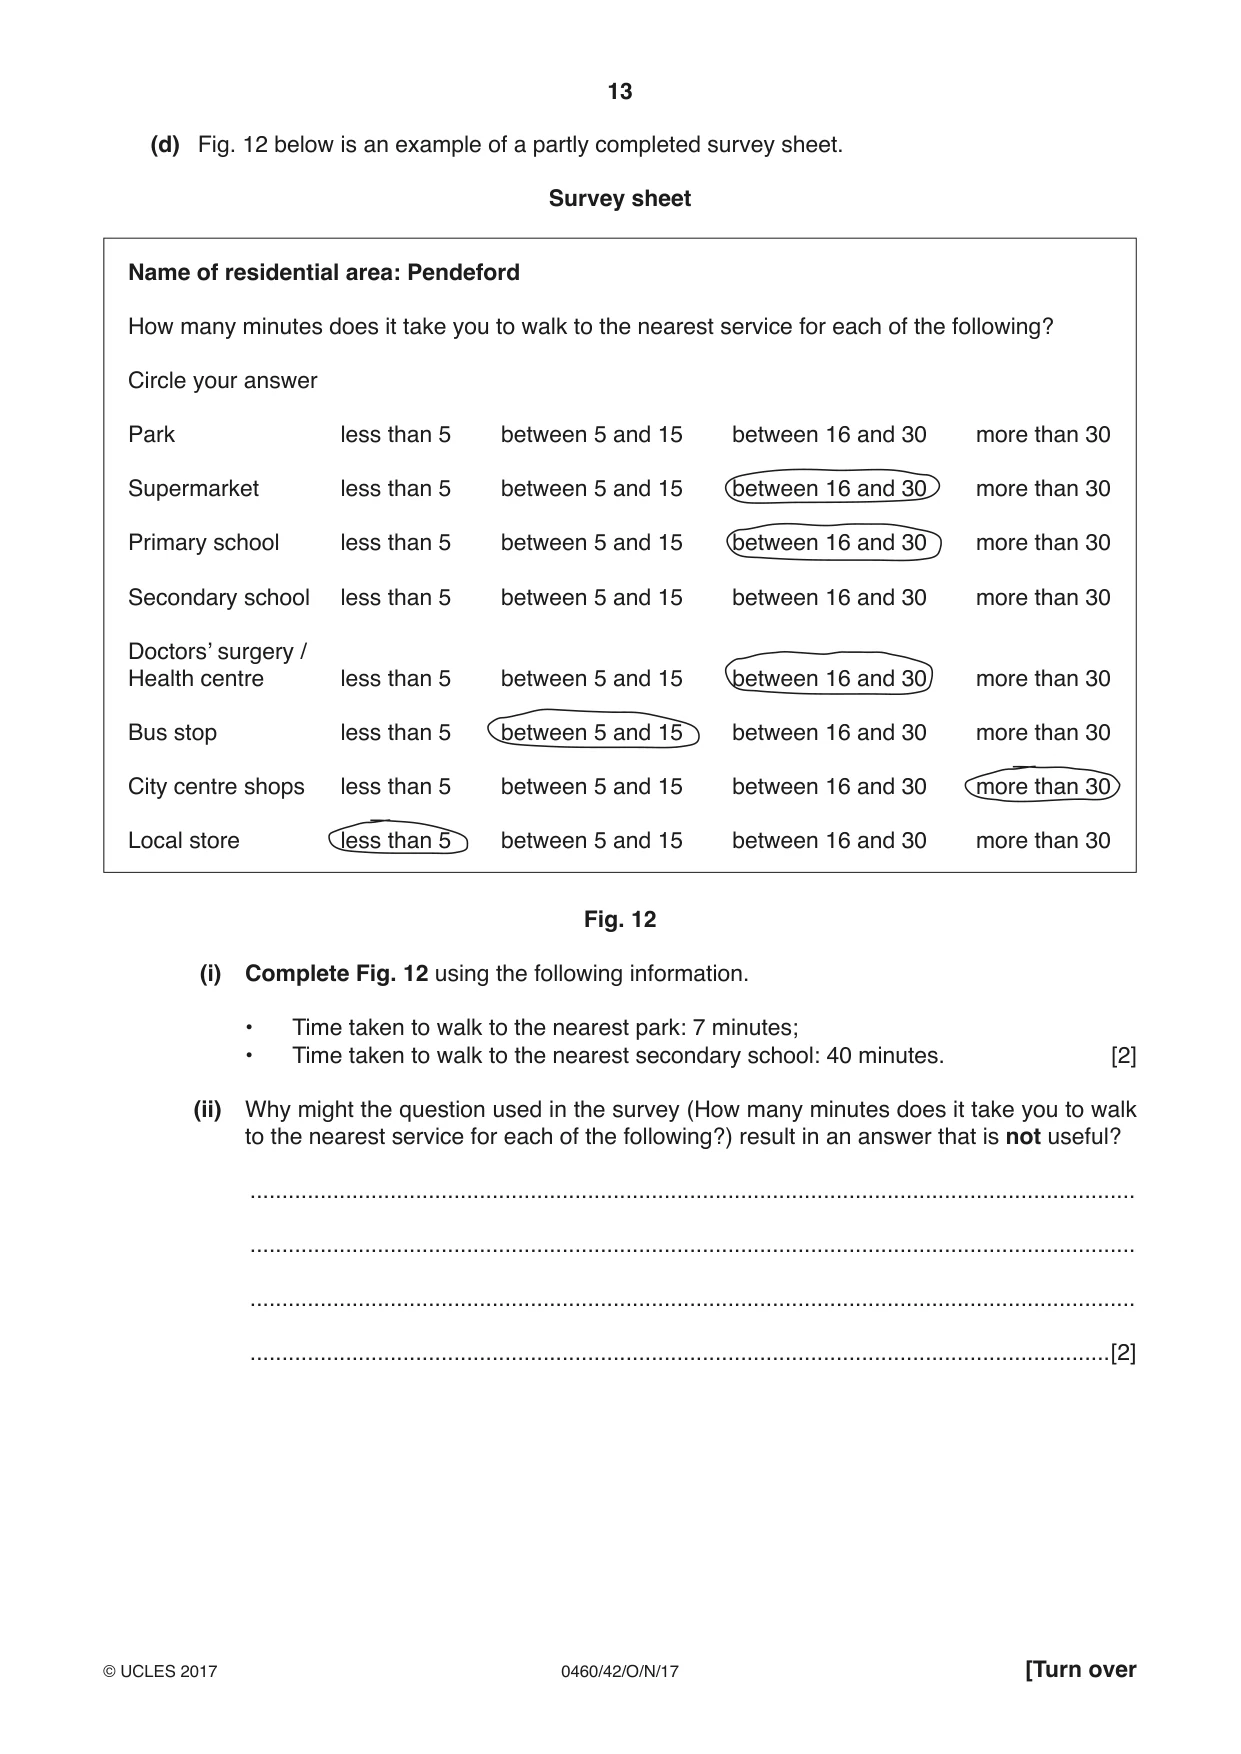
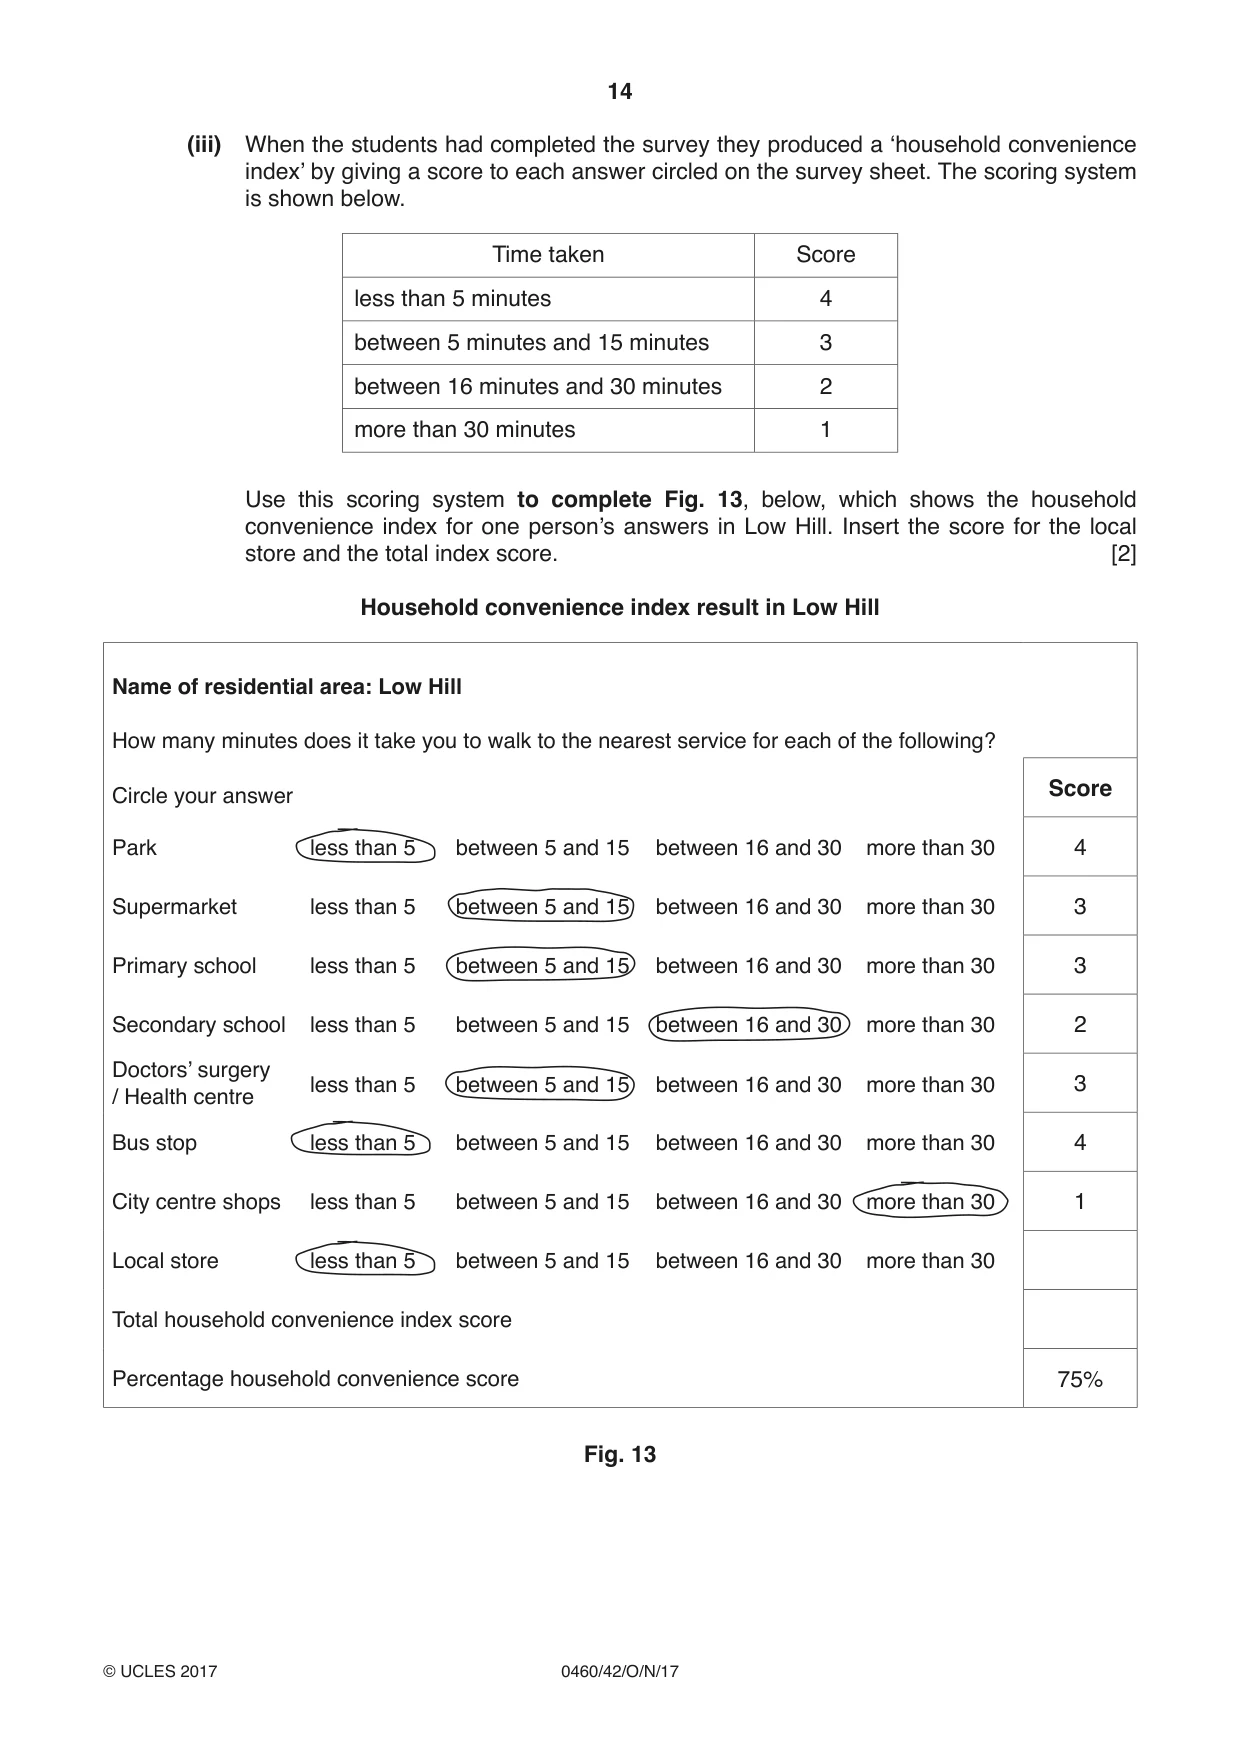
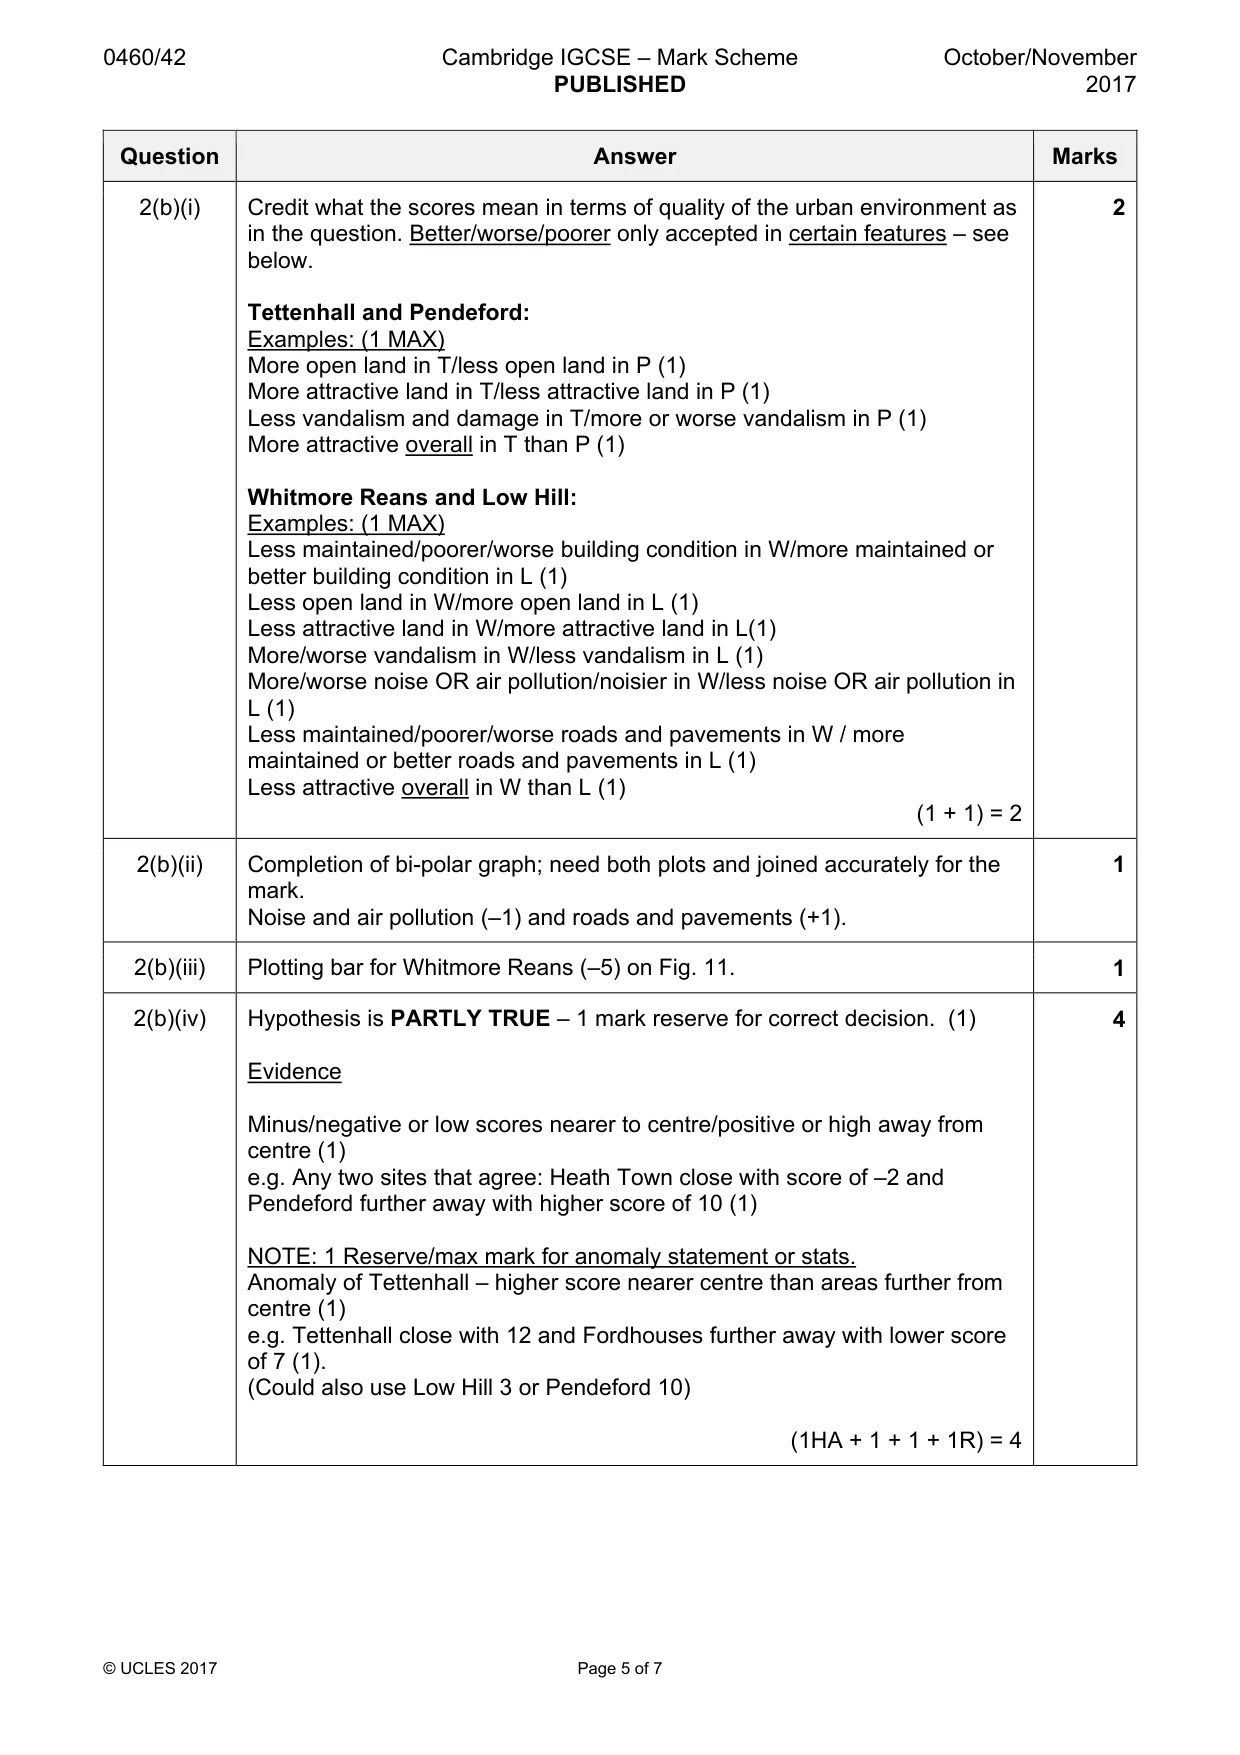
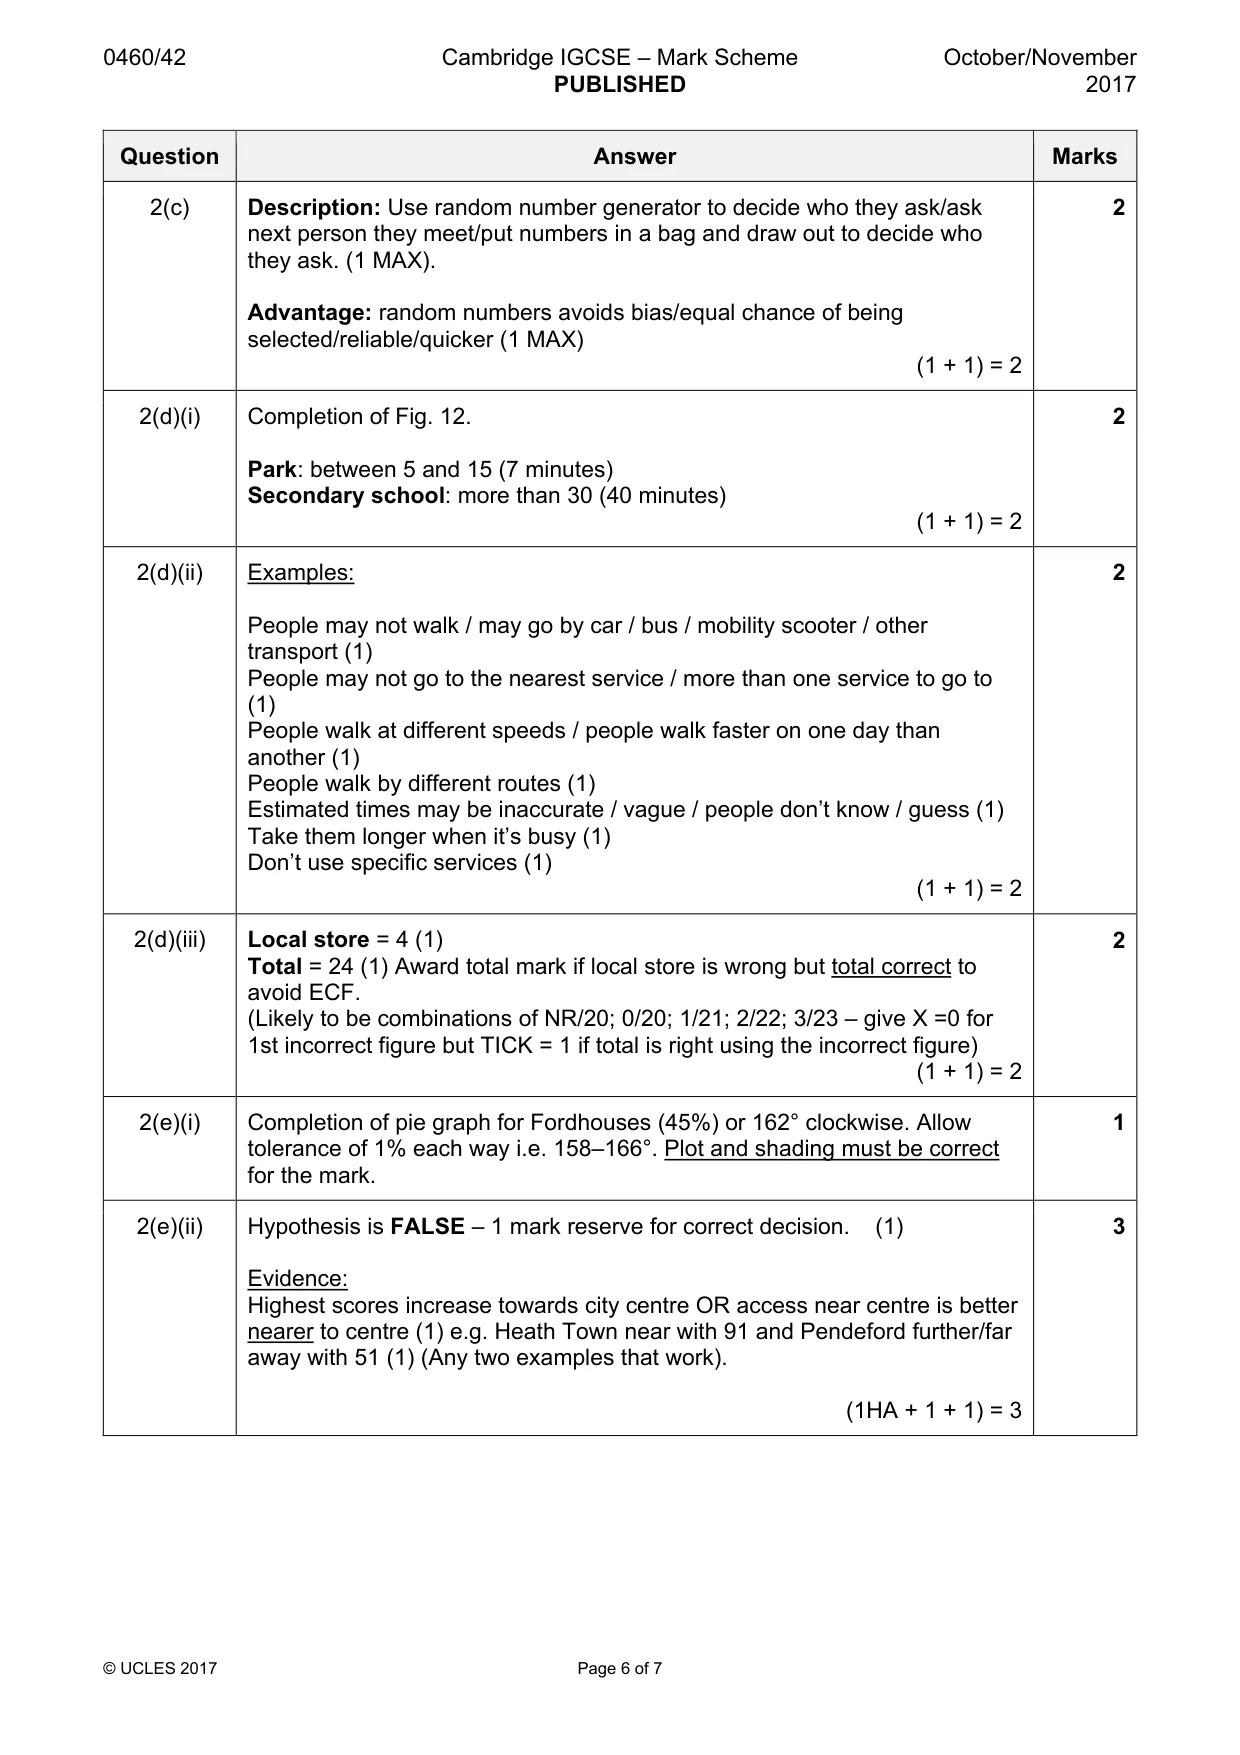
Mark scheme: 2(a)(i) Used a bi-polar analysis (1) 2 Write name of area on sheet (1) Observe/look at/see features (1) Make a decision about/rate/judge/give a score (1) Put a tick/fill in the appropriate column/record on sheet (1) (1 + 1) = 2 2(a)(ii) Decide whether to survey individually or in a group /pairs (1) 4 Agree where each group goes/decide which sites to go to (1) Agree on what descriptions mean/do a pilot or practice survey (1) Decide when would be best day/part of day to do survey/do it same day (1) Agree on time of survey/all surveys done at same time (1) Decide whether to calculate an average score from several students results/one student decides on the group’s scores (1) Decide whether to repeat on different times/days (1) (1 + 1 + 1 +1) = 4 2(b)(i) Credit what the scores mean in terms of quality of the urban environment as 2 in the question. Better/worse/poorer only accepted in certain features – see below. Tettenhall and Pendeford: Examples: (1 MAX) More open land in T/less open land in P (1) More attractive land in T/less attractive land in P (1) Less vandalism and damage in T/more or worse vandalism in P (1) More attractive overall in T than P (1) Whitmore Reans and Low Hill: Examples: (1 MAX) Less maintained/poorer/worse building condition in W/more maintained or better building condition in L (1) Less open land in W/more open land in L (1) Less attractive land in W/more attractive land in L(1) More/worse vandalism in W/less vandalism in L (1) More/worse noise OR air pollution/noisier in W/less noise OR air pollution in L (1) Less maintained/poorer/worse roads and pavements in W / more maintained or better roads and pavements in L (1) Less attractive overall in W than L (1) (1 + 1) = 2 2(b)(ii) Completion of bi-polar graph; need both plots and joined accurately for the 1 mark. Noise and air pollution (–1) and roads and pavements (+1). 2(b)(iii) Plotting bar for Whitmore Reans (–5) on Fig. 11. 1 2(b)(iv) Hypothesis is PARTLY TRUE – 1 mark reserve for correct decision. (1) 4 Evidence Minus/negative or low scores nearer to centre/positive or high away from centre (1) e.g. Any two sites that agree: Heath Town close with score of –2 and Pendeford further away with higher score of 10 (1) NOTE: 1 Reserve/max mark for anomaly statement or stats. Anomaly of Tettenhall – higher score nearer centre than areas further from centre (1) e.g. Tettenhall close with 12 and Fordhouses further away with lower score of 7 (1). (Could also use Low Hill 3 or Pendeford 10) (1HA + 1 + 1 + 1R) = 4 2(c) Description: Use random number generator to decide who they ask/ask 2 next person they meet/put numbers in a bag and draw out to decide who they ask. (1 MAX). Advantage: random numbers avoids bias/equal chance of being selected/reliable/quicker (1 MAX) (1 + 1) = 2 2(d)(i) Completion of Fig. 12. 2 Park: between 5 and 15 (7 minutes) Secondary school: more than 30 (40 minutes) (1 + 1) = 2 2(d)(ii) Examples: 2 People may not walk / may go by car / bus / mobility scooter / other transport (1) People may not go to the nearest service / more than one service to go to (1) People walk at different speeds / people walk faster on one day than another (1) People walk by different routes (1) Estimated times may be inaccurate / vague / people don’t know / guess (1) Take them longer when it’s busy (1) Don’t use specific services (1) (1 + 1) = 2 2(d)(iii) Local store = 4 (1) 2 Total = 24 (1) Award total mark if local store is wrong but total correct to avoid ECF. (Likely to be combinations of NR/20; 0/20; 1/21; 2/22; 3/23 – give X =0 for 1st incorrect figure but TICK = 1 if total is right using the incorrect figure) (1 + 1) = 2 2(e)(i) Completion of pie graph for Fordhouses (45%) or 162° clockwise. Allow 1 tolerance of 1% each way i.e. 158–166°. Plot and shading must be correct for the mark. 2(e)(ii) Hypothesis is FALSE – 1 mark reserve for correct decision. (1) 3 Evidence: Highest scores increase towards city centre OR access near centre is better nearer to centre (1) e.g. Heath Town near with 91 and Pendeford further/far away with 51 (1) (Any two examples that work). (1HA + 1 + 1) = 3 2(f) Examples 4 Decide on groups/pairs or individual research (1) Divide jobs between students/1 counts other records (1) Decide on appropriate sites/roads (1) Decide when to do the traffic counts/time (1) Decide which days to do it (1) Decide duration of traffic counts (1) Go to 2 sites on each road/opposite sides of road/specific sites (1) Use stopwatch/watch for timing (1) Count traffic/vehicles/types of vehicles/all transport types (1) Use counter/clicker/tally method (1) Synchronise timing/start and finish at same time (1) Record on sheet/table/chart (1) (1 + 1 + 1 +1) = 4
What was in this paper
The subtopics covered by these 2 questions, and how many questions each got. Open one in a new tab to see every Cambridge question on it.
What you needed in this session
Cambridge’s own grade thresholds for 2017 Oct/Nov, Paper 4 · Variant 2. A higher threshold means an easier paper — the bar moves with how the cohort did.