Cambridge IGCSE Geography 0460 — 2017 Oct/Nov Paper 4 · Variant 1
0460/41/O/N/17 · 2 questions · 60 marks · ≈68 min
The question paper and its mark scheme, free to read here and free to download. This is Cambridge’s own paper, exactly as it was sat.
Question paper20 pages




Mark scheme6 pages
Answers below. Sit the paper first if you are practising.
Questions as text
Q1 · A class of students were studying how a river changes downstream
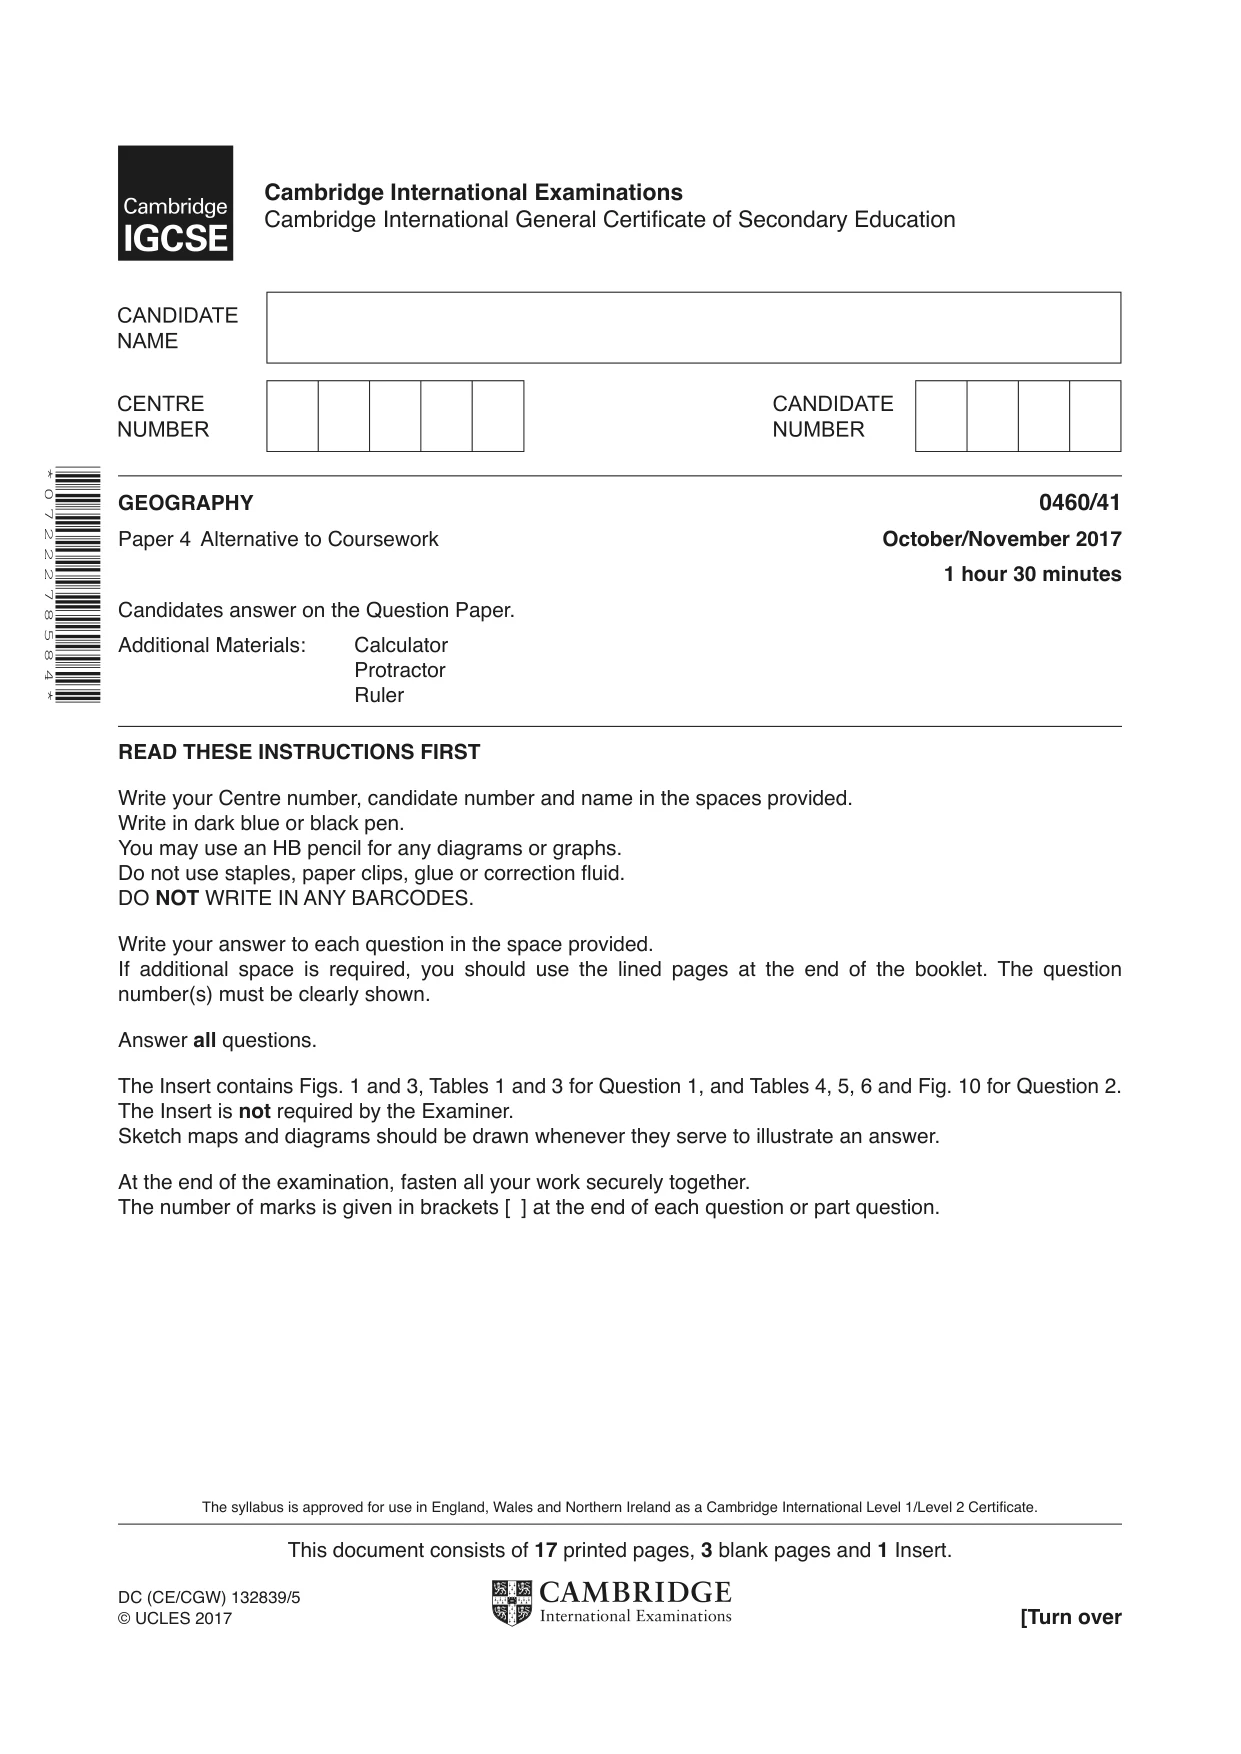
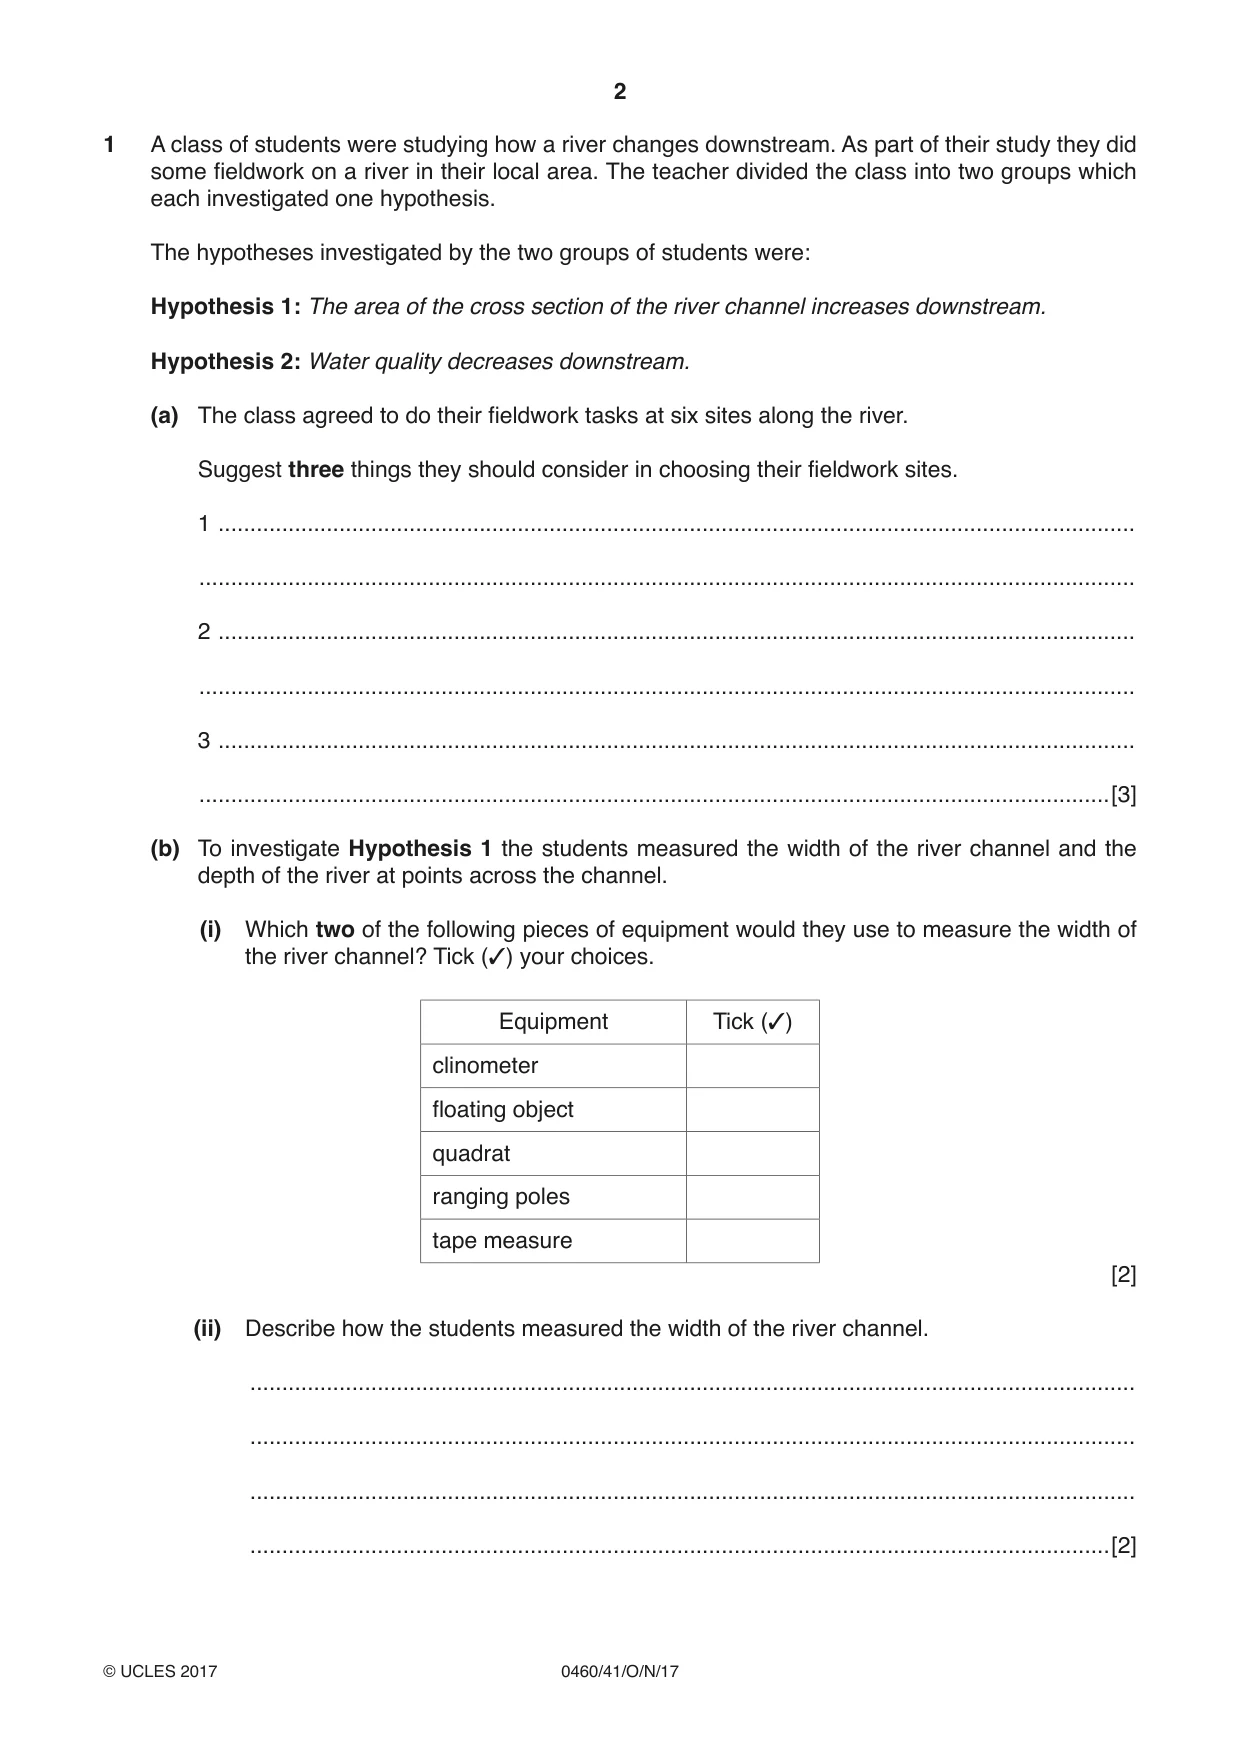
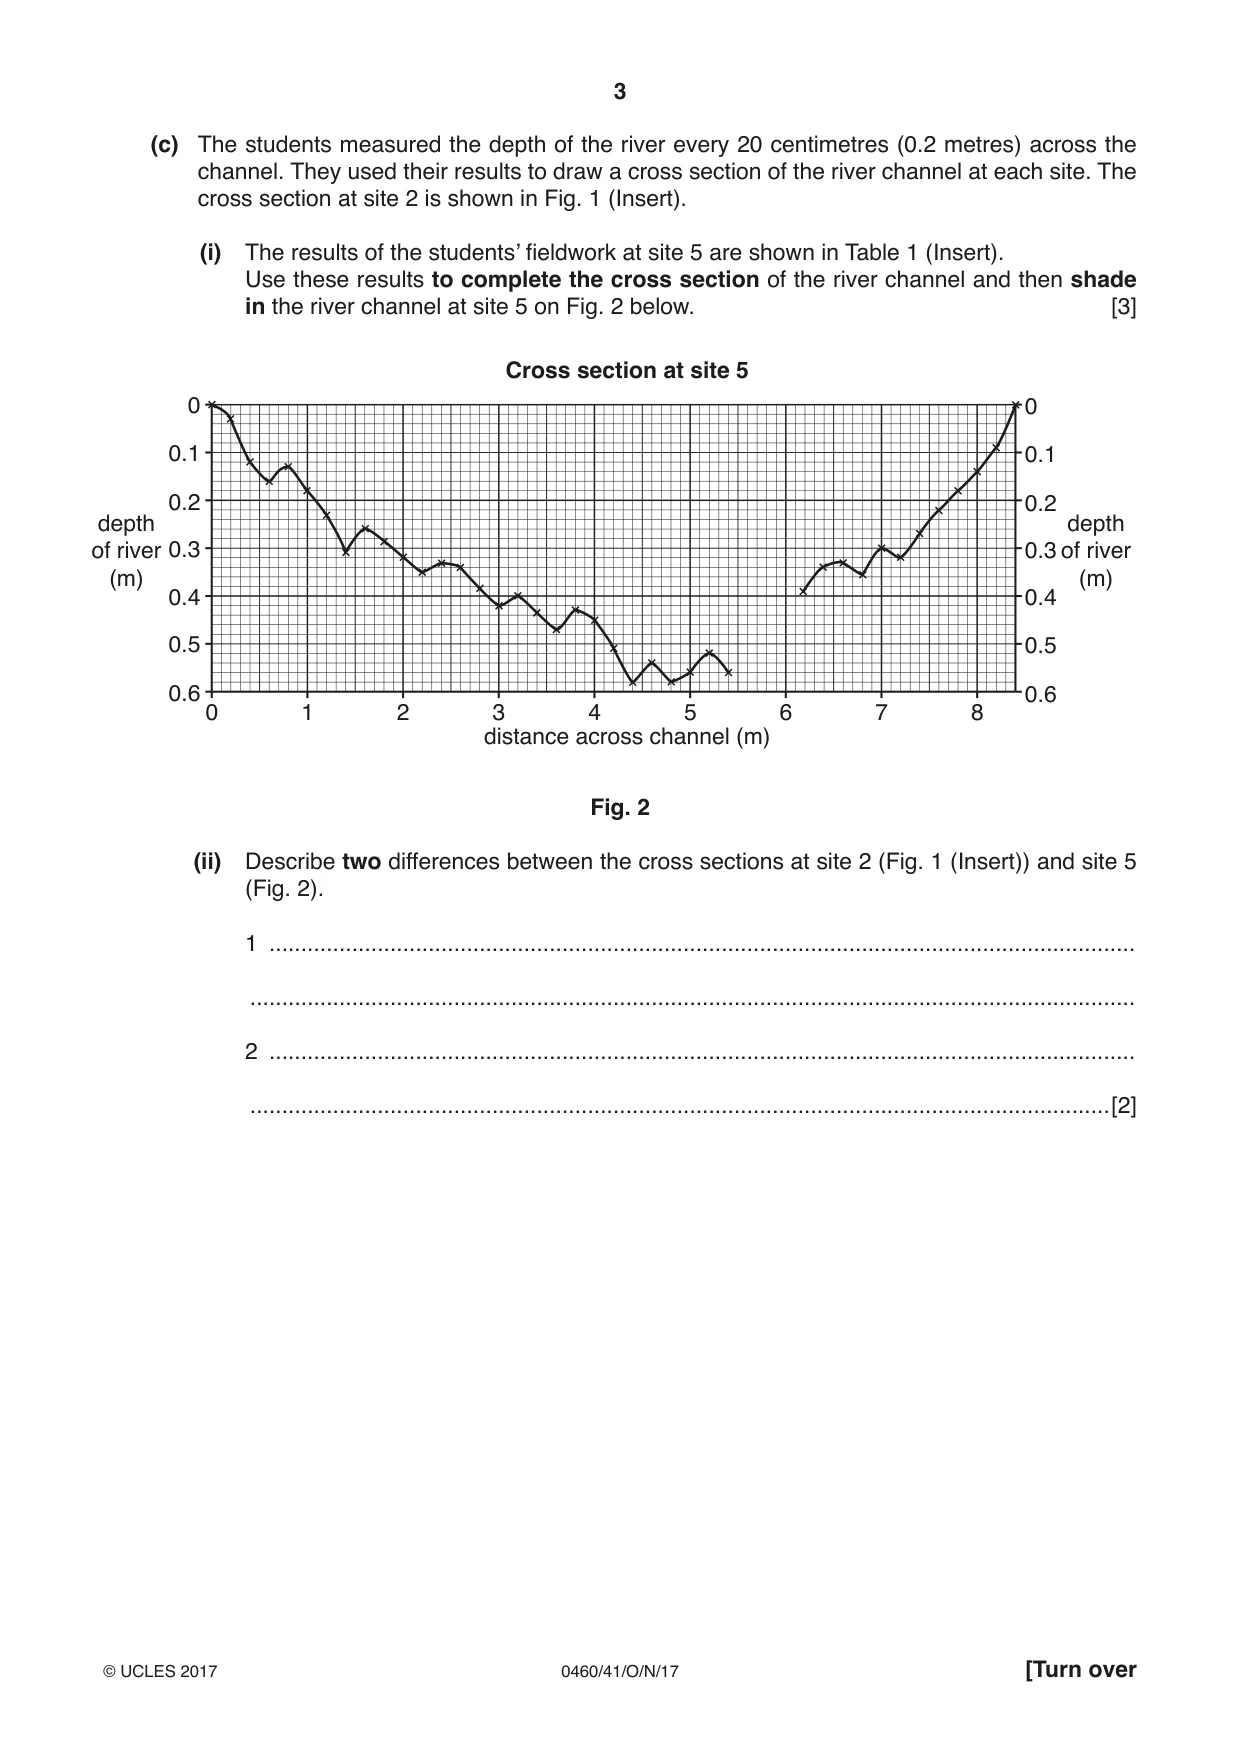
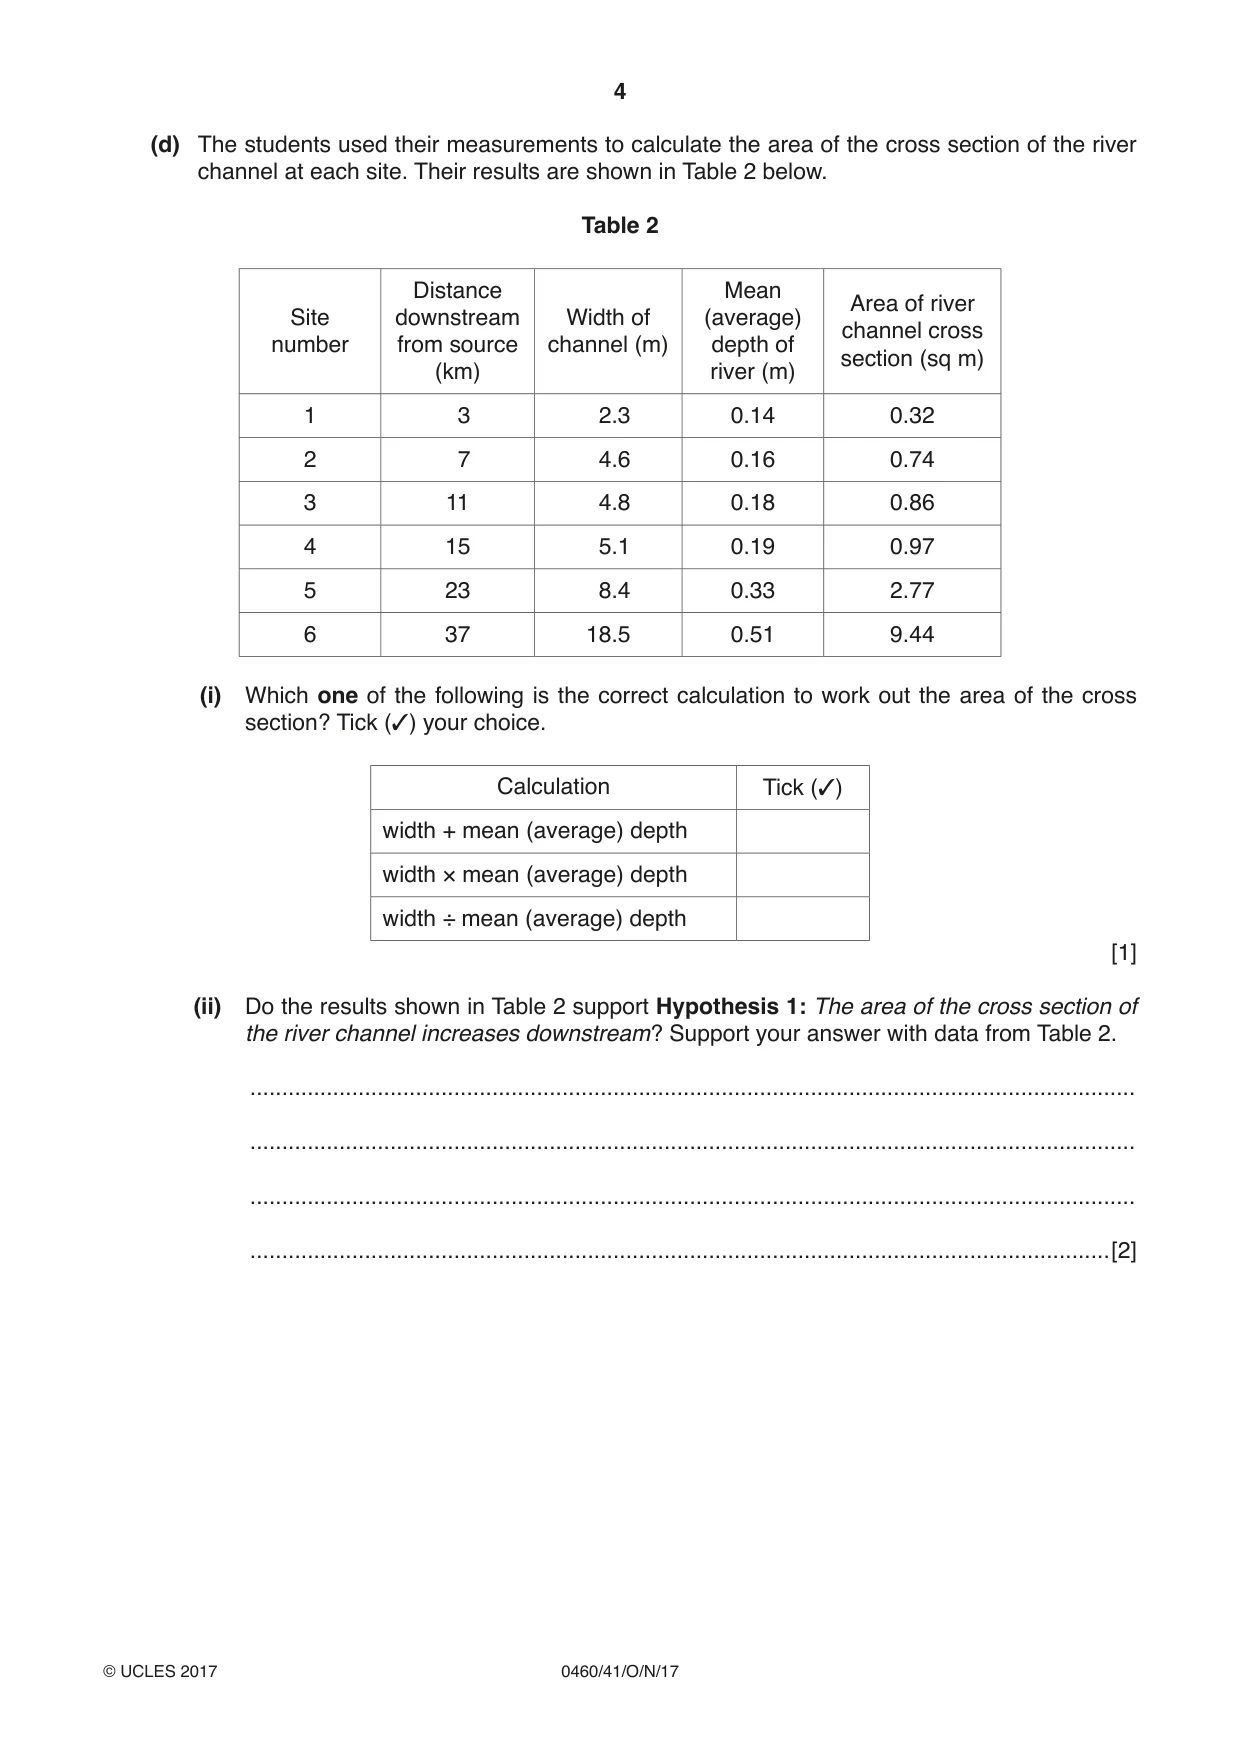
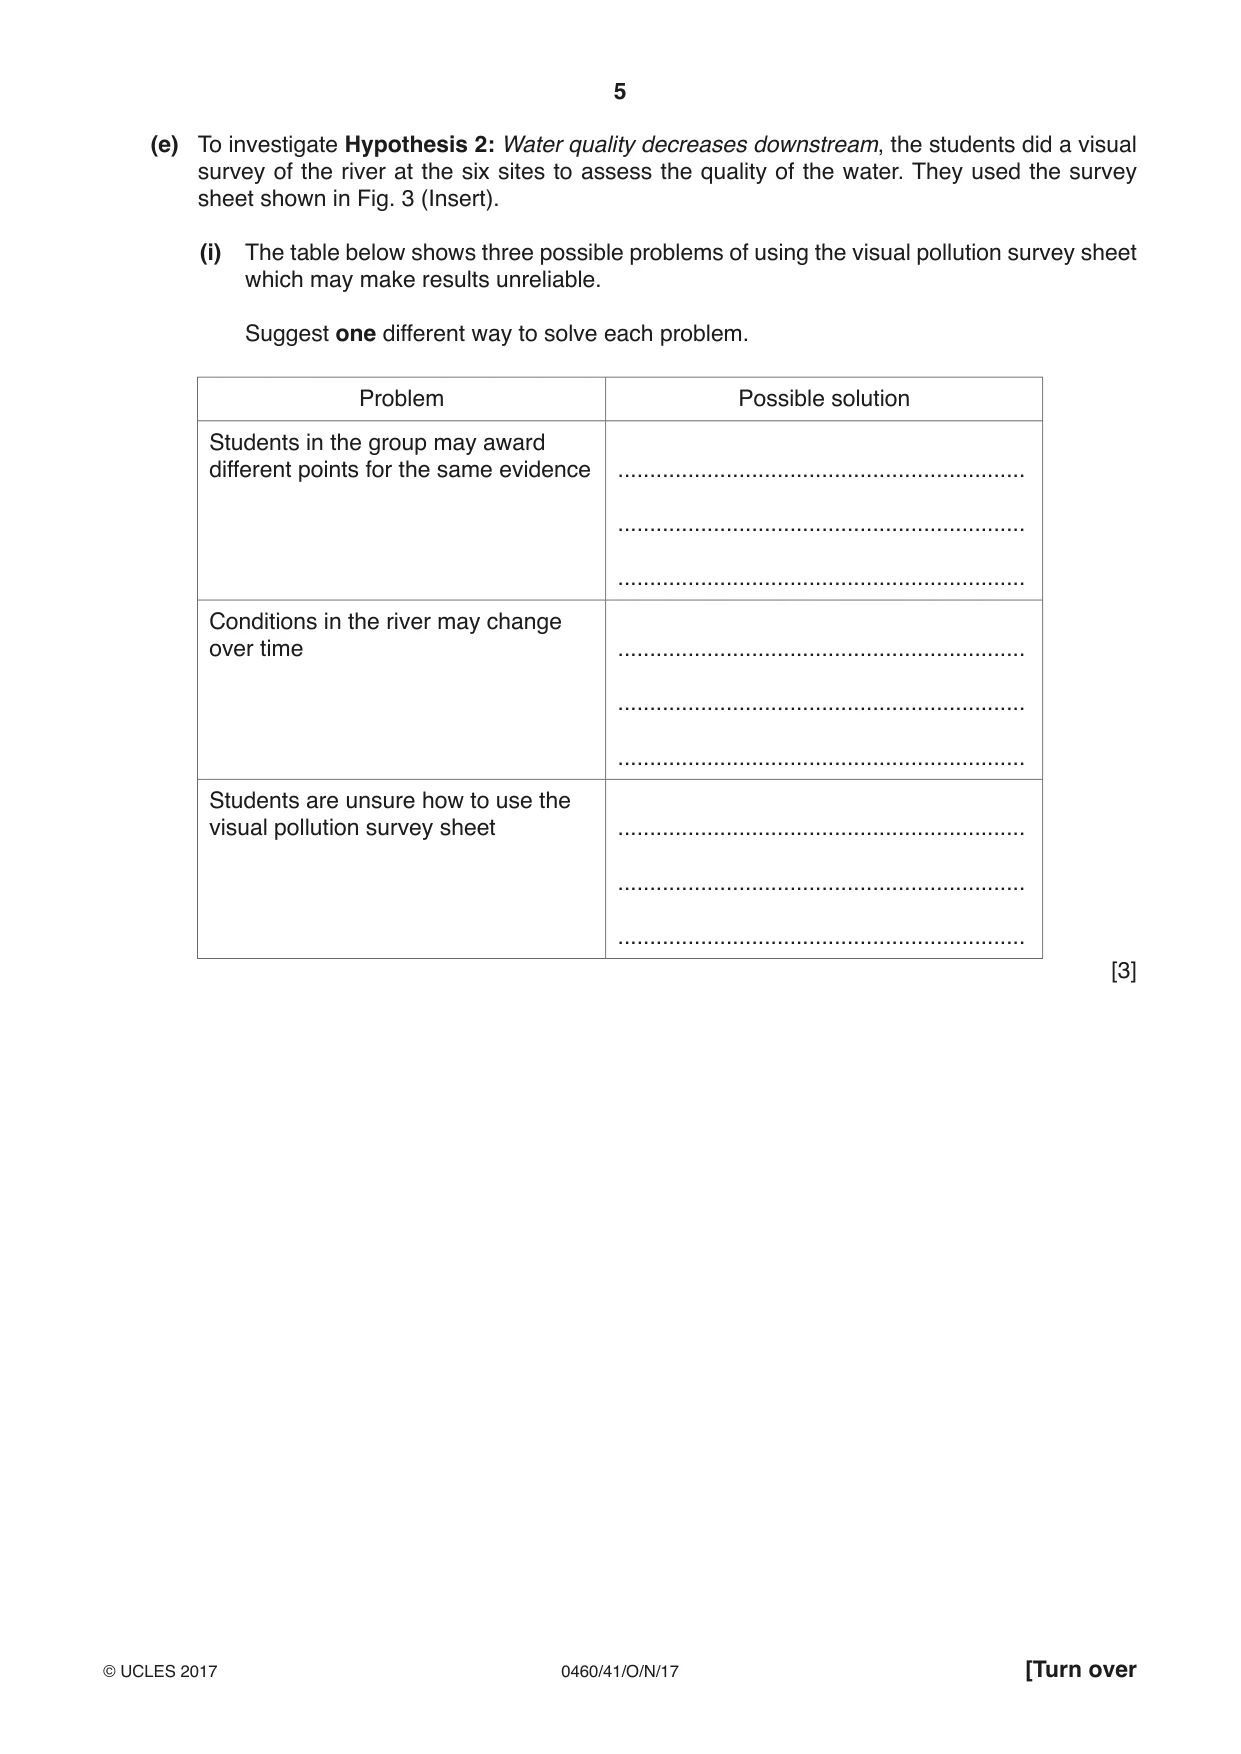
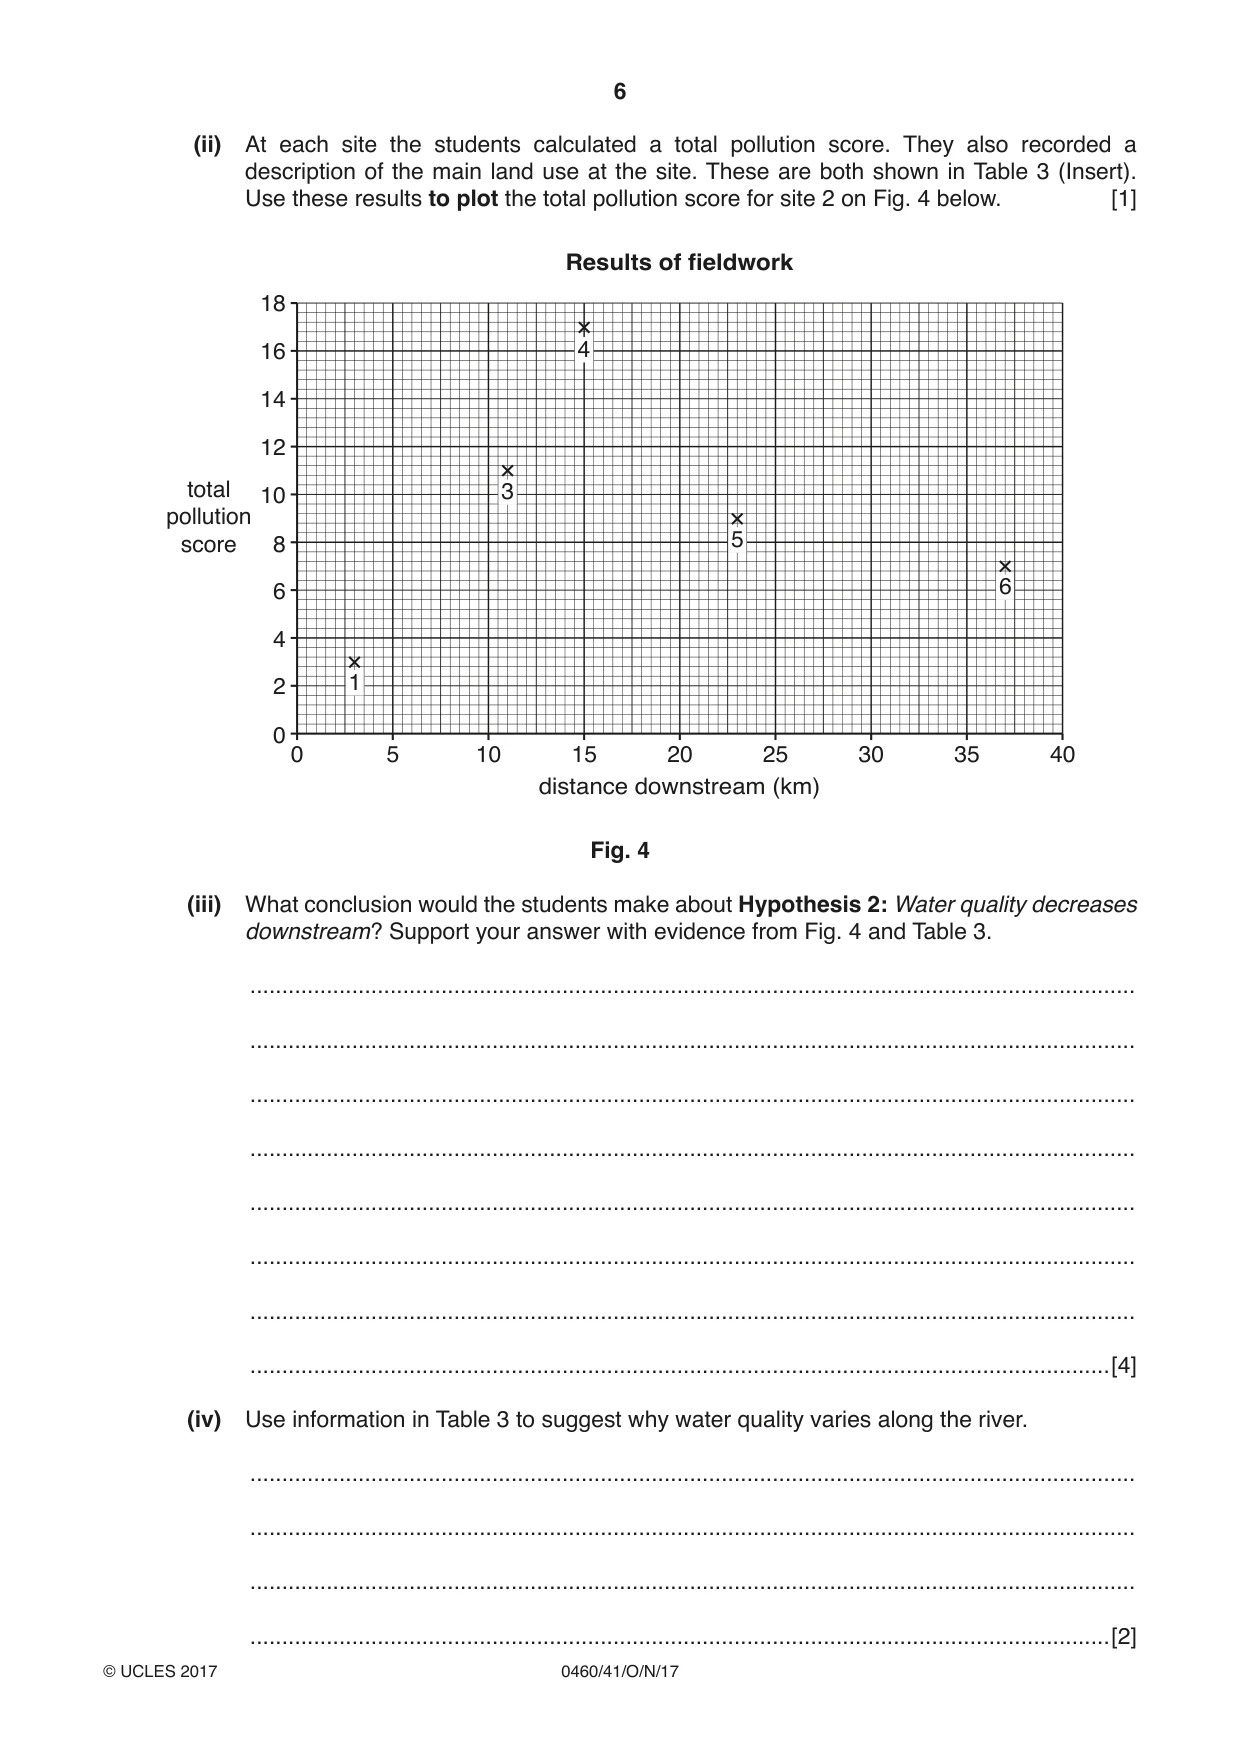
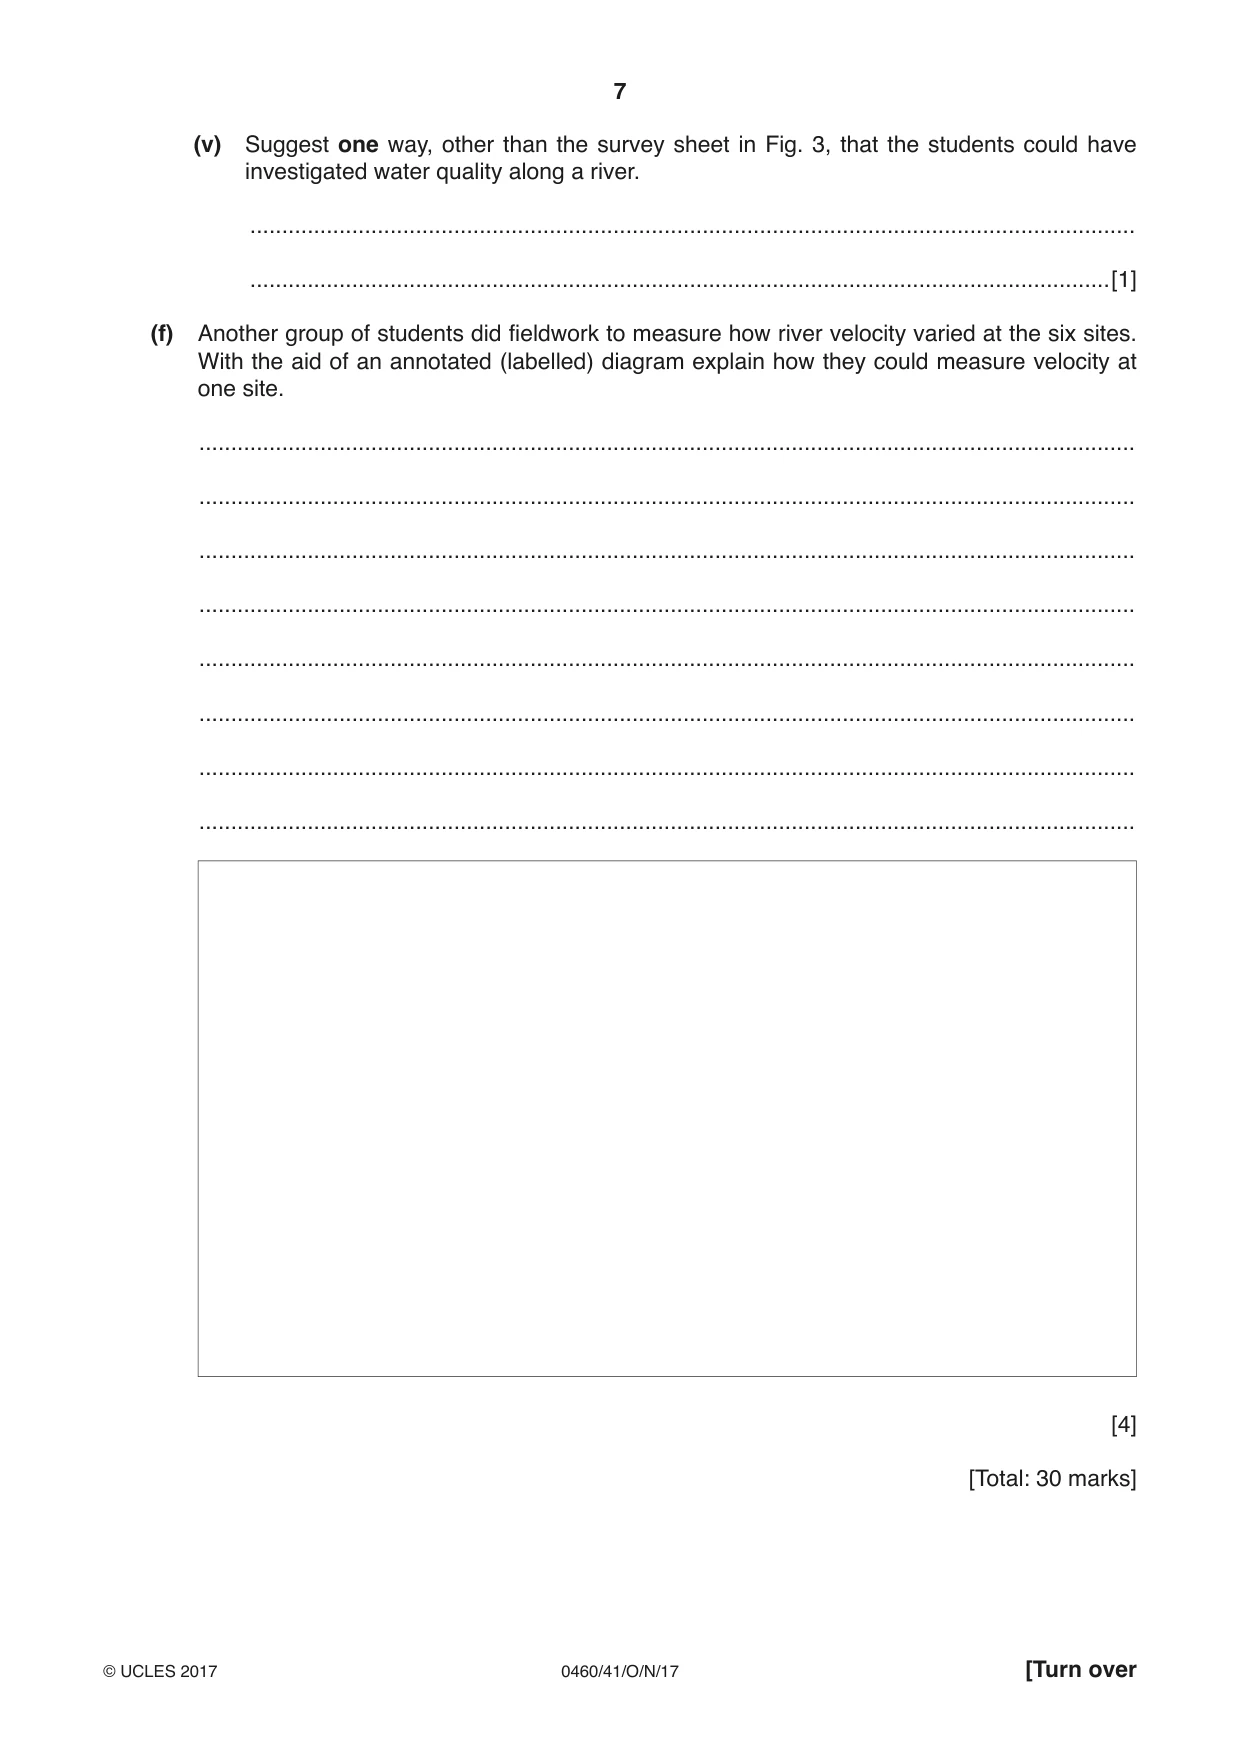
1 A class of students were studying how a river changes downstream. As part of their study they did some fieldwork on a river in their local area. The teacher divided the class into two groups which each investigated one hypothesis. The hypotheses investigated by the two groups of students were: Hypothesis 1: The area of the cross section of the river channel increases downstream. Hypothesis 2: Water quality decreases downstream. (a) The class agreed to do their fieldwork tasks at six sites along the river. Suggest three things they should consider in choosing their fieldwork sites. 1 ................................................................................................................................................ ................................................................................................................................................... 2 ................................................................................................................................................ ................................................................................................................................................... 3 ................................................................................................................................................ ...............................................................................................................................................[3] (b) To investigate Hypothesis 1 the students measured the width of the river channel and the depth of the river at points across the channel. (i) Which two of the following pieces of equipment would they use to measure the width of the river channel? Tick (3) your choices. Equipment Tick (3) clinometer floating object quadrat ranging poles tape measure [2] (ii) Describe how the students measured the width of the river channel. ........................................................................................................................................... ........................................................................................................................................... ........................................................................................................................................... .......................................................................................................................................[2] (c) The students measured the depth of the river every 20 centimetres (0.2 metres) across the channel. They used their results to draw a cross section of the river channel at each site. The cross section at site 2 is shown in Fig. 1 (Insert). (i) The results of the students’ fieldwork at site 5 are shown in Table 1 (Insert). Use these results to complete the cross section of the river channel and then shade in the river channel at site 5 on Fig. 2 below. [3] Cross section at site 5 0 0 0.1 0.1 0.2 0.2 depth depth of river 0.3 0.3 of river (m) (m) 0.4 0.4 0.5 0.5 0.6 0.6 0 1 2 3 4 5 6 7 8 distance across channel (m) Fig. 2 (ii) Describe two differences between the cross sections at site 2 (Fig. 1 (Insert)) and site 5 (Fig. 2). 1 ........................................................................................................................................ ........................................................................................................................................... 2 ........................................................................................................................................ .......................................................................................................................................[2] (d) The students used their measurements to calculate the area of the cross section of the river channel at each site. Their results are shown in Table 2 below. Table 2 Distance Mean Area of river Site downstream Width of (average) channel cross number from source channel (m) depth of section (sq m) (km) river (m) 1 3 2.3 0.14 0.32 2 7 4.6 0.16 0.74 3 11 4.8 0.18 0.86 4 15 5.1 0.19 0.97 5 23 8.4 0.33 2.77 6 37 18.5 0.51 9.44 (i) Which one of the following is the correct calculation to work out the area of the cross section? Tick (3) your choice. Calculation Tick (3) width + mean (average) depth width × mean (average) depth width ÷ mean (average) depth [1] (ii) Do the results shown in Table 2 support Hypothesis 1: The area of the cross section of the river channel increases downstream? Support your answer with data from Table 2. ........................................................................................................................................... ........................................................................................................................................... ........................................................................................................................................... .......................................................................................................................................[2] (e) To investigate Hypothesis 2: Water quality decreases downstream, the students did a visual survey of the river at the six sites to assess the quality of the water. They used the survey sheet shown in Fig. 3 (Insert). (i) The table below shows three possible problems of using the visual pollution survey sheet which may make results unreliable. Suggest one different way to solve each problem. Problem Possible solution Students in the group may award different points for the same evidence ................................................................ ................................................................ ................................................................ Conditions in the river may change over time ................................................................ ................................................................ ................................................................ Students are unsure how to use the visual pollution survey sheet ................................................................ ................................................................ ................................................................ [3] (ii) At each site the students calculated a total pollution score. They also recorded a description of the main land use at the site. These are both shown in Table 3 (Insert). Use these results to plot the total pollution score for site 2 on Fig. 4 below. [1] Results of fieldwork 18 16 4 14 12 total 10 3 pollution score 8 5 6 6 4 2 1 0 0 5 10 15 20 25 30 35 40 distance downstream (km) Fig. 4 (iii) What conclusion would the students make about Hypothesis 2: Water quality decreases downstream? Support your answer with evidence from Fig. 4 and Table 3. ........................................................................................................................................... ........................................................................................................................................... ........................................................................................................................................... ........................................................................................................................................... ........................................................................................................................................... ........................................................................................................................................... ........................................................................................................................................... .......................................................................................................................................[4] (iv) Use information in Table 3 to suggest why water quality varies along the river. ........................................................................................................................................... ........................................................................................................................................... ........................................................................................................................................... .......................................................................................................................................[2] (v) Suggest one way, other than the survey sheet in Fig. 3, that the students could have investigated water quality along a river. ........................................................................................................................................... .......................................................................................................................................[1] (f) Another group of students did fieldwork to measure how river velocity varied at the six sites. With the aid of an annotated (labelled) diagram explain how they could measure velocity at one site. ................................................................................................................................................... ................................................................................................................................................... ................................................................................................................................................... ................................................................................................................................................... ................................................................................................................................................... ................................................................................................................................................... ................................................................................................................................................... ................................................................................................................................................... [4] [Total: 30 marks]
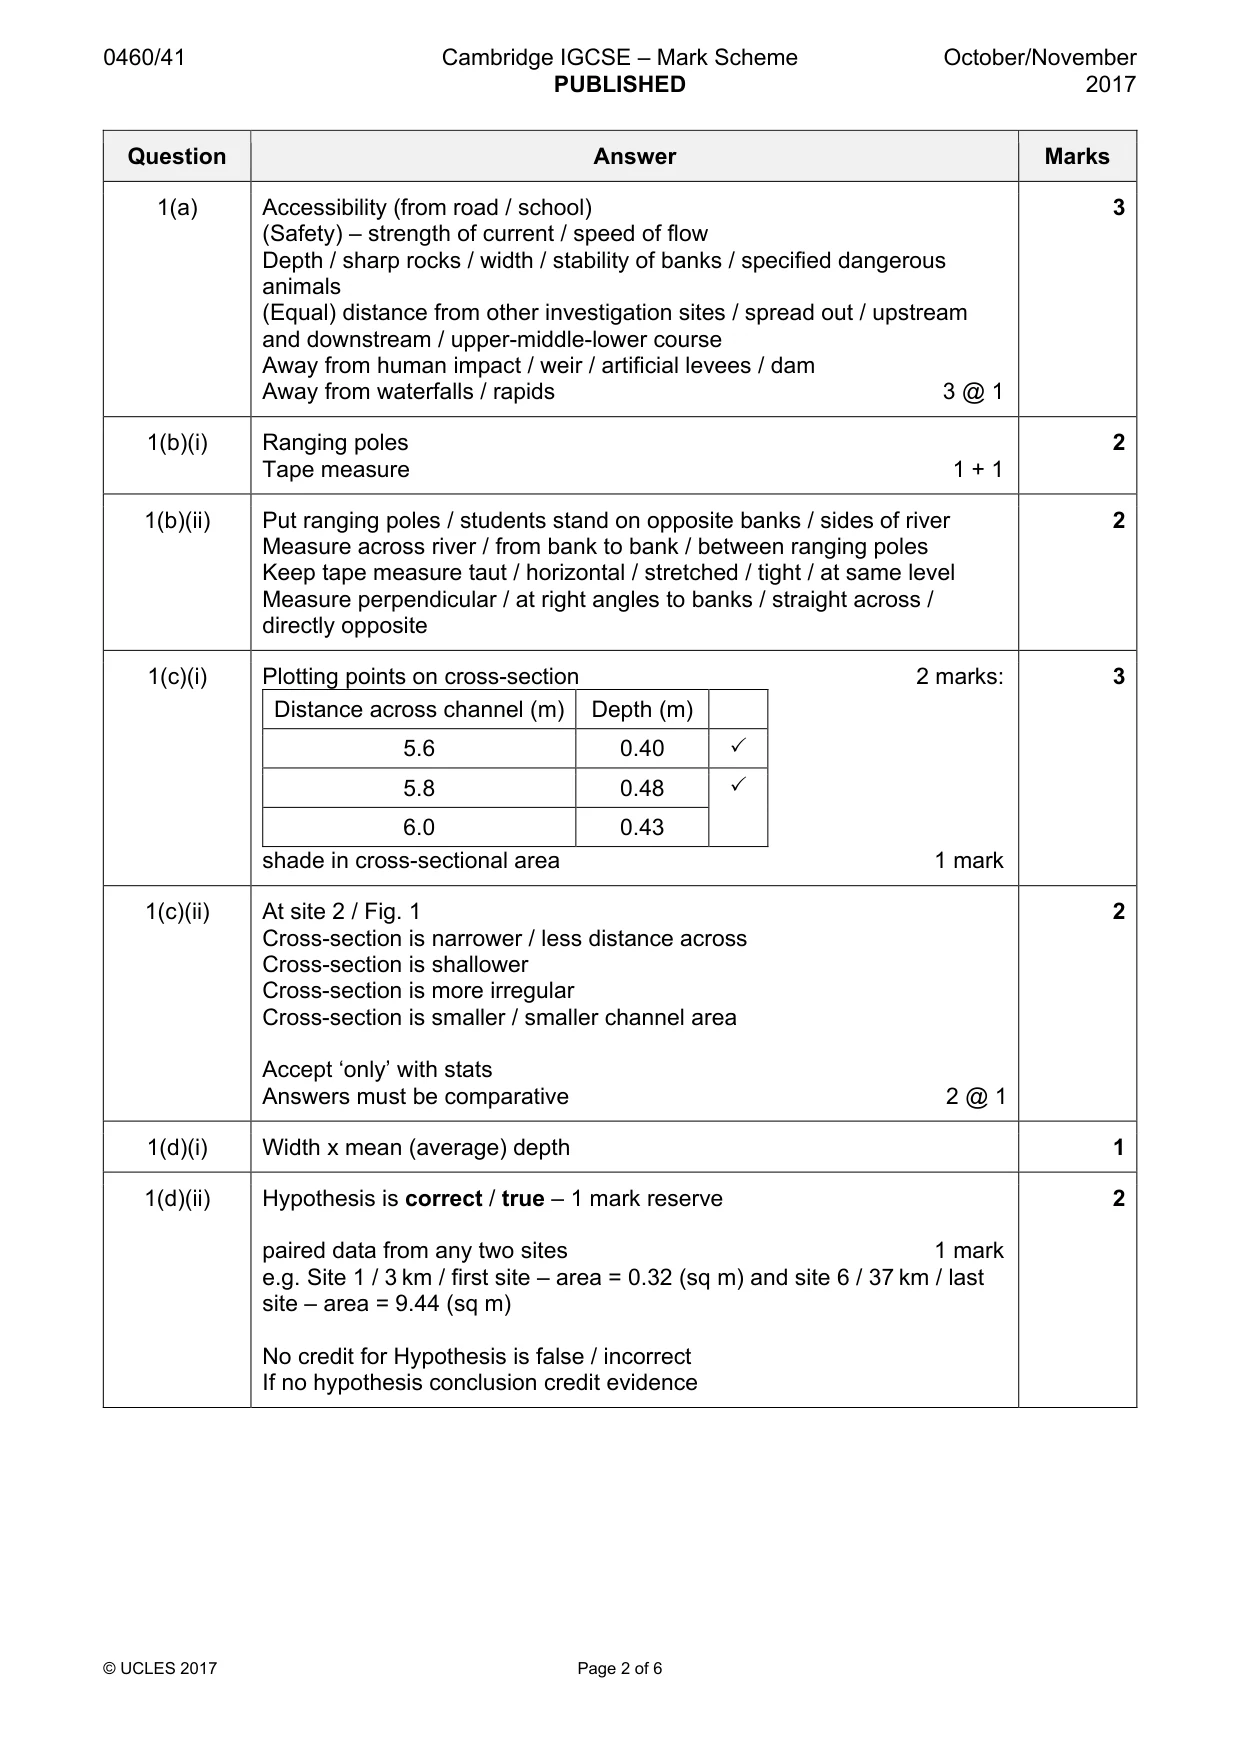
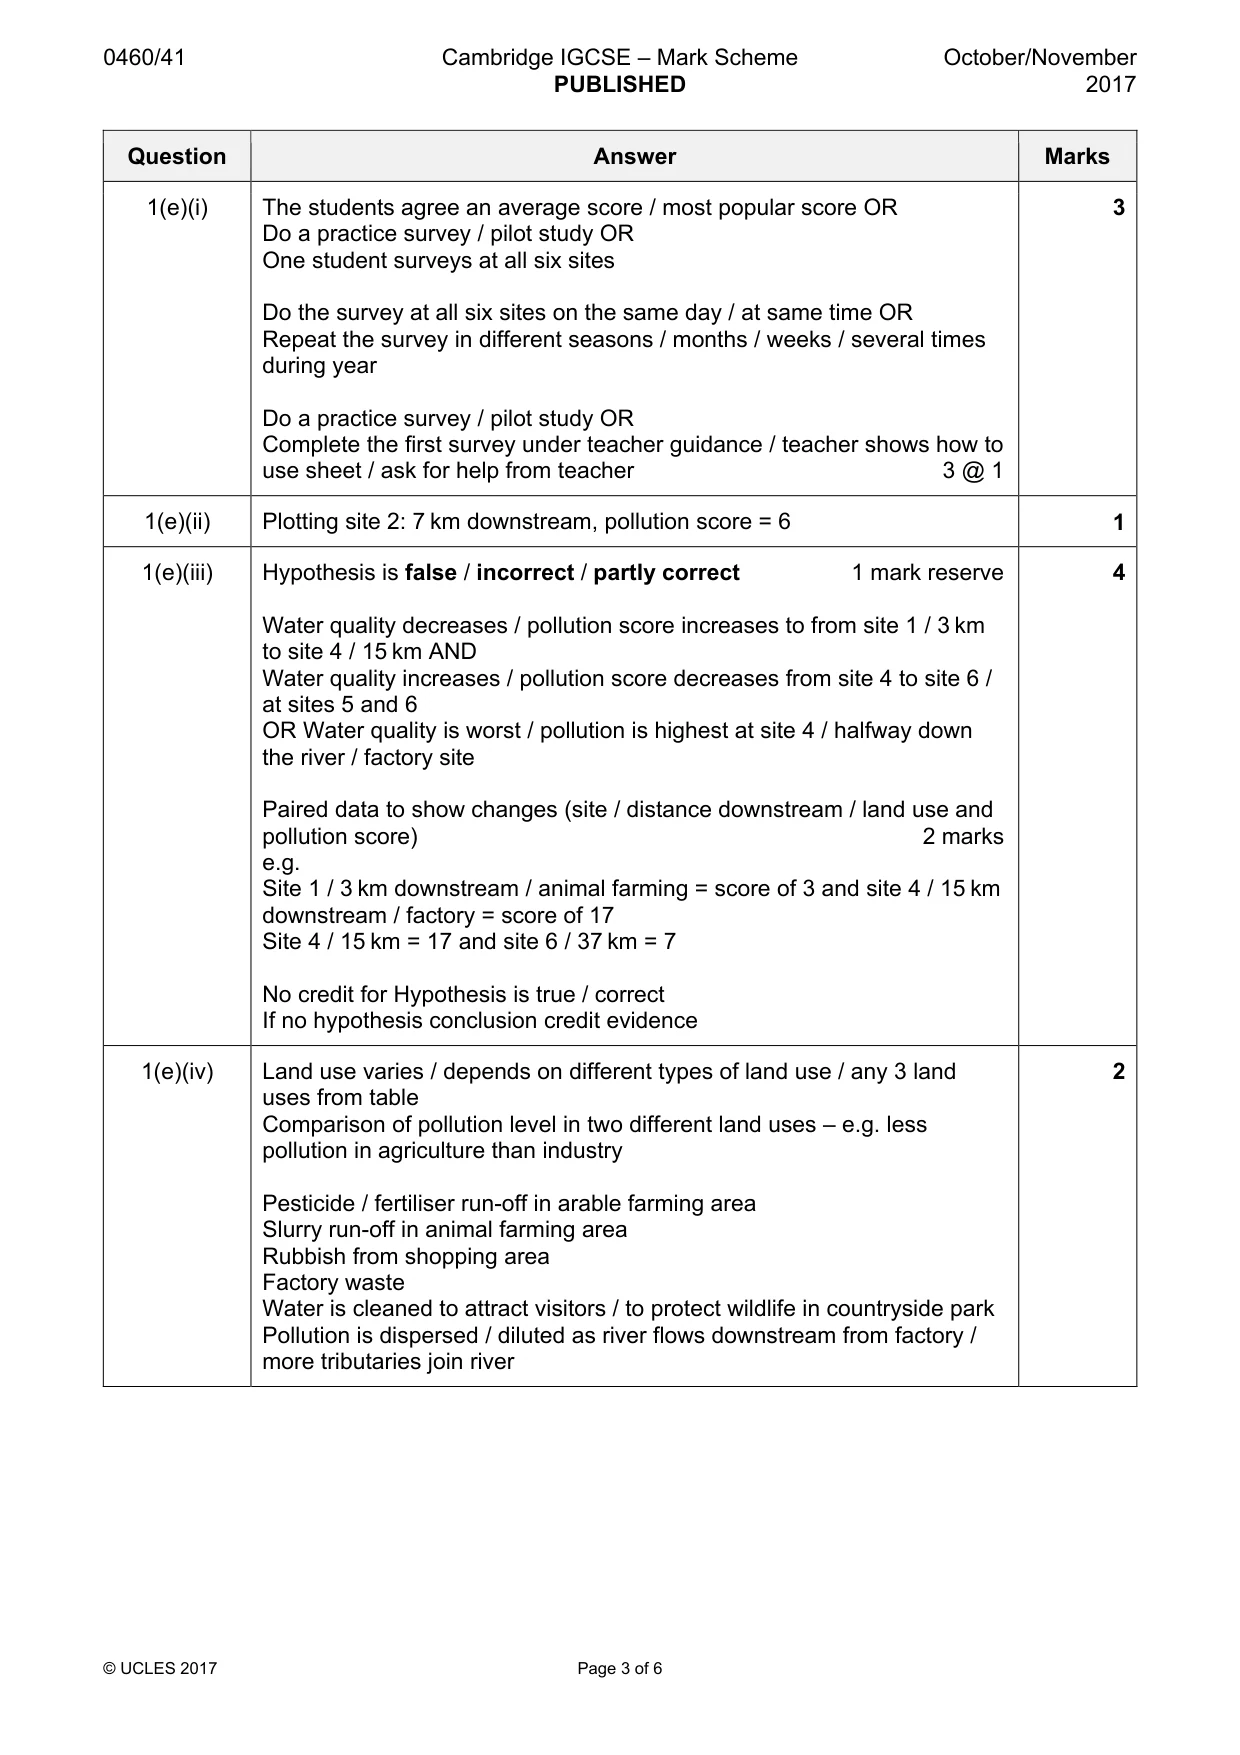
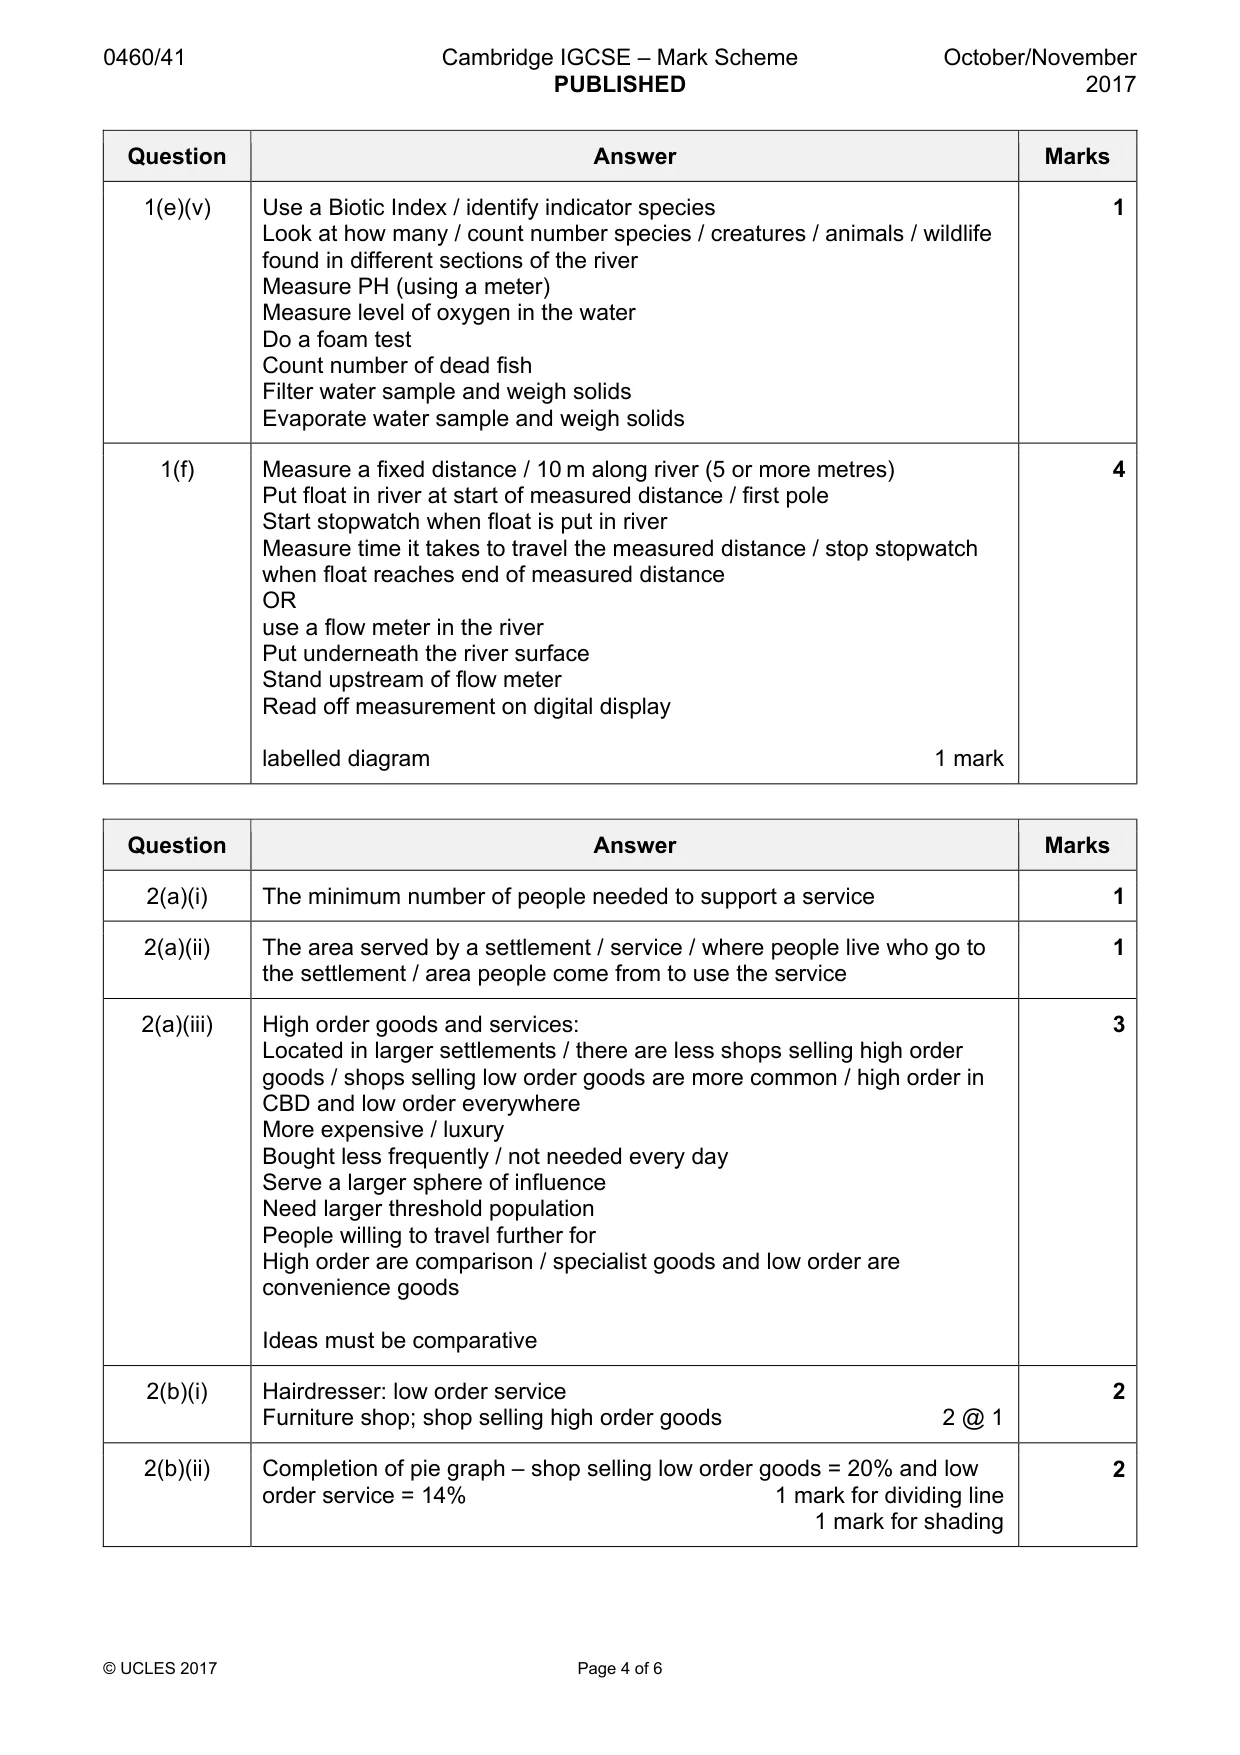
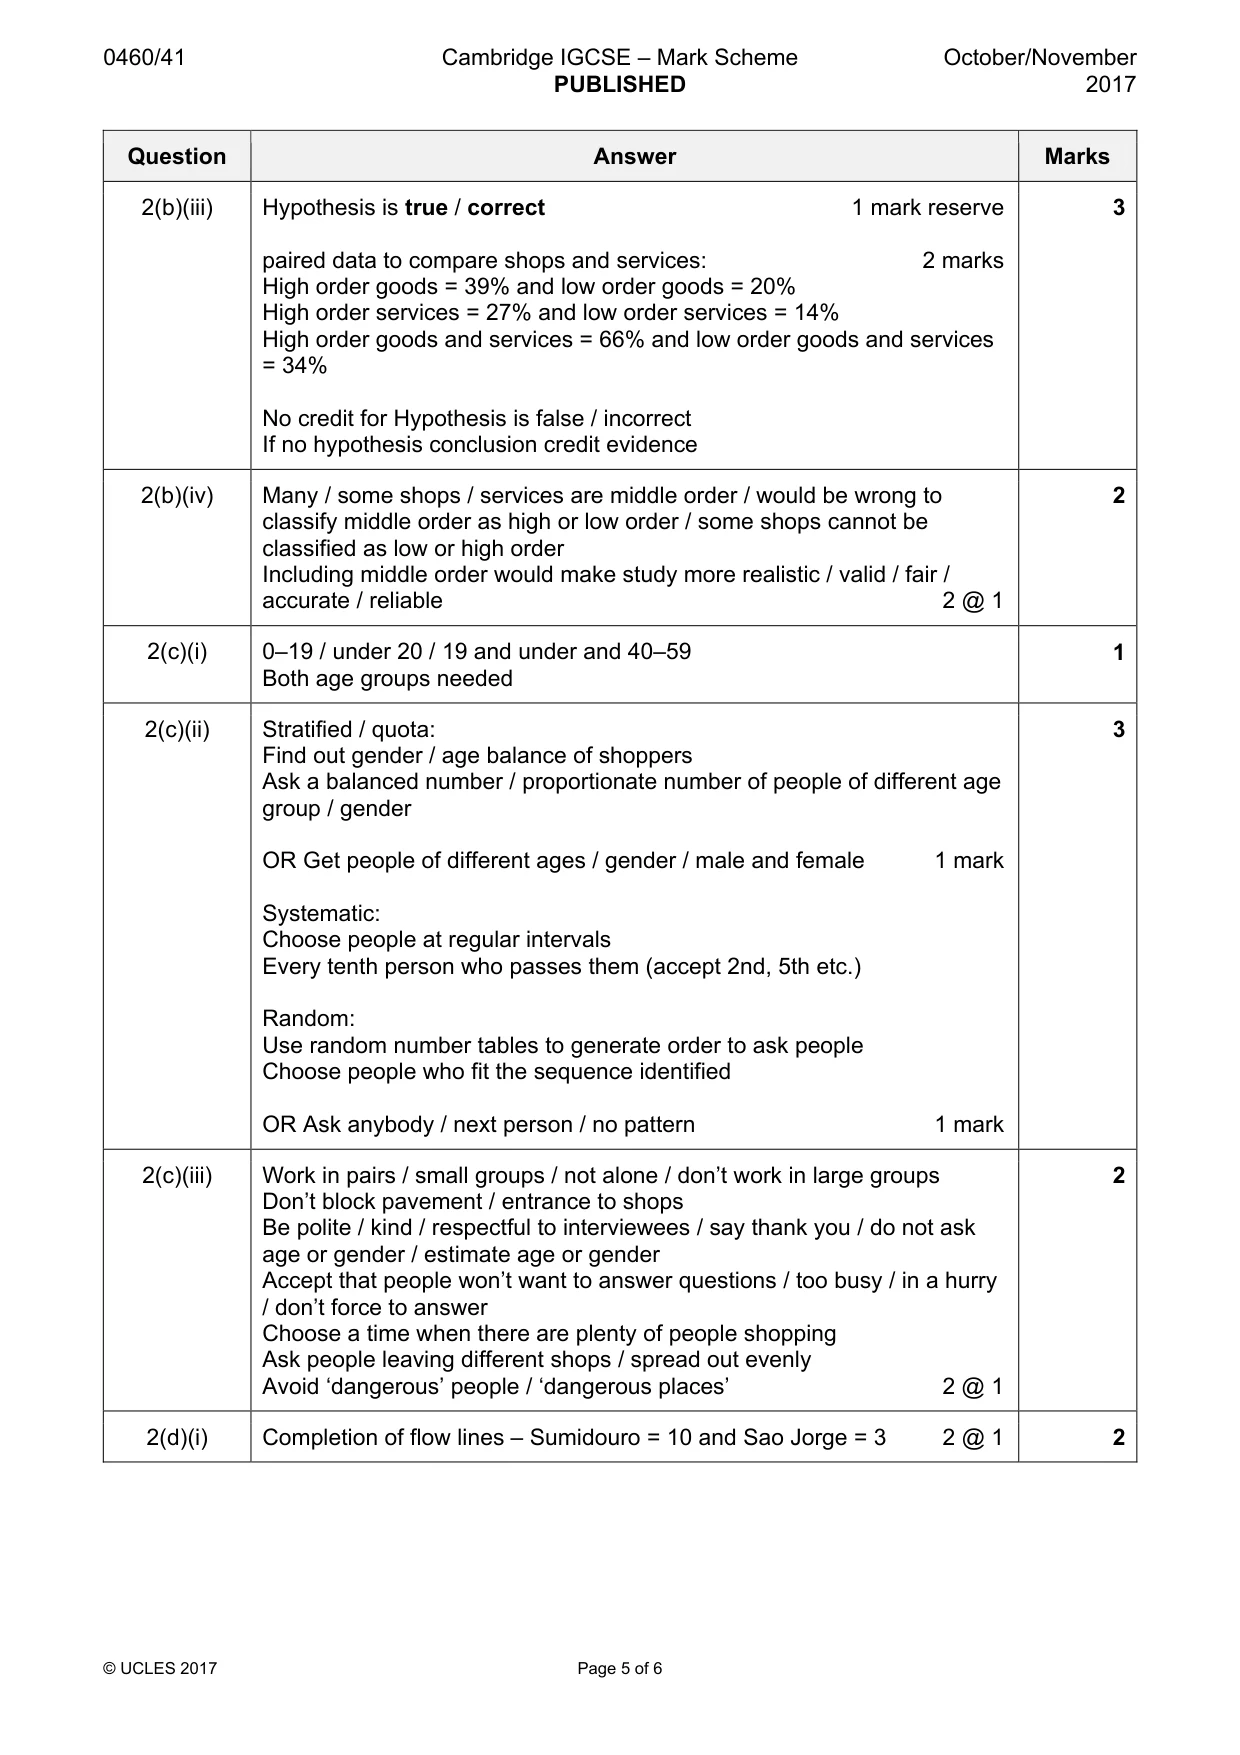
Mark scheme: Question Answer Marks 1(a) Accessibility (from road / school) 3 (Safety) – strength of current / speed of flow Depth / sharp rocks / width / stability of banks / specified dangerous animals (Equal) distance from other investigation sites / spread out / upstream and downstream / upper-middle-lower course Away from human impact / weir / artificial levees / dam Away from waterfalls / rapids 3 @ 1 1(b)(i) Ranging poles 2 Tape measure 1 + 1 1(b)(ii) Put ranging poles / students stand on opposite banks / sides of river 2 Measure across river / from bank to bank / between ranging poles Keep tape measure taut / horizontal / stretched / tight / at same level Measure perpendicular / at right angles to banks / straight across / directly opposite 1(c)(i) Plotting points on cross-section 2 marks: 3 Distance across channel (m) Depth (m) 5.6 0.40 3 5.8 0.48 3 6.0 0.43 shade in cross-sectional area 1 mark 1(c)(ii) At site 2 / Fig. 1 2 Cross-section is narrower / less distance across Cross-section is shallower Cross-section is more irregular Cross-section is smaller / smaller channel area Accept ‘only’ with stats Answers must be comparative 2 @ 1 1(d)(i) Width x mean (average) depth 1 1(d)(ii) Hypothesis is correct / true – 1 mark reserve 2 paired data from any two sites 1 mark e.g. Site 1 / 3 km / first site – area = 0.32 (sq m) and site 6 / 37 km / last site – area = 9.44 (sq m) No credit for Hypothesis is false / incorrect If no hypothesis conclusion credit evidence 1(e)(i) The students agree an average score / most popular score OR 3 Do a practice survey / pilot study OR One student surveys at all six sites Do the survey at all six sites on the same day / at same time OR Repeat the survey in different seasons / months / weeks / several times during year Do a practice survey / pilot study OR Complete the first survey under teacher guidance / teacher shows how to use sheet / ask for help from teacher 3 @ 1 1(e)(ii) Plotting site 2: 7 km downstream, pollution score = 6 1 1(e)(iii) Hypothesis is false / incorrect / partly correct 1 mark reserve 4 Water quality decreases / pollution score increases to from site 1 / 3 km to site 4 / 15 km AND Water quality increases / pollution score decreases from site 4 to site 6 / at sites 5 and 6 OR Water quality is worst / pollution is highest at site 4 / halfway down the river / factory site Paired data to show changes (site / distance downstream / land use and pollution score) 2 marks e.g. Site 1 / 3 km downstream / animal farming = score of 3 and site 4 / 15 km downstream / factory = score of 17 Site 4 / 15 km = 17 and site 6 / 37 km = 7 No credit for Hypothesis is true / correct If no hypothesis conclusion credit evidence 1(e)(iv) Land use varies / depends on different types of land use / any 3 land 2 uses from table Comparison of pollution level in two different land uses – e.g. less pollution in agriculture than industry Pesticide / fertiliser run-off in arable farming area Slurry run-off in animal farming area Rubbish from shopping area Factory waste Water is cleaned to attract visitors / to protect wildlife in countryside park Pollution is dispersed / diluted as river flows downstream from factory / more tributaries join river 1(e)(v) Use a Biotic Index / identify indicator species 1 Look at how many / count number species / creatures / animals / wildlife found in different sections of the river Measure PH (using a meter) Measure level of oxygen in the water Do a foam test Count number of dead fish Filter water sample and weigh solids Evaporate water sample and weigh solids 1(f) Measure a fixed distance / 10 m along river (5 or more metres) 4 Put float in river at start of measured distance / first pole Start stopwatch when float is put in river Measure time it takes to travel the measured distance / stop stopwatch when float reaches end of measured distance OR use a flow meter in the river Put underneath the river surface Stand upstream of flow meter Read off measurement on digital display labelled diagram 1 mark
Q2 · Students in Nova Friburgo, Brazil were learning about different types of services…
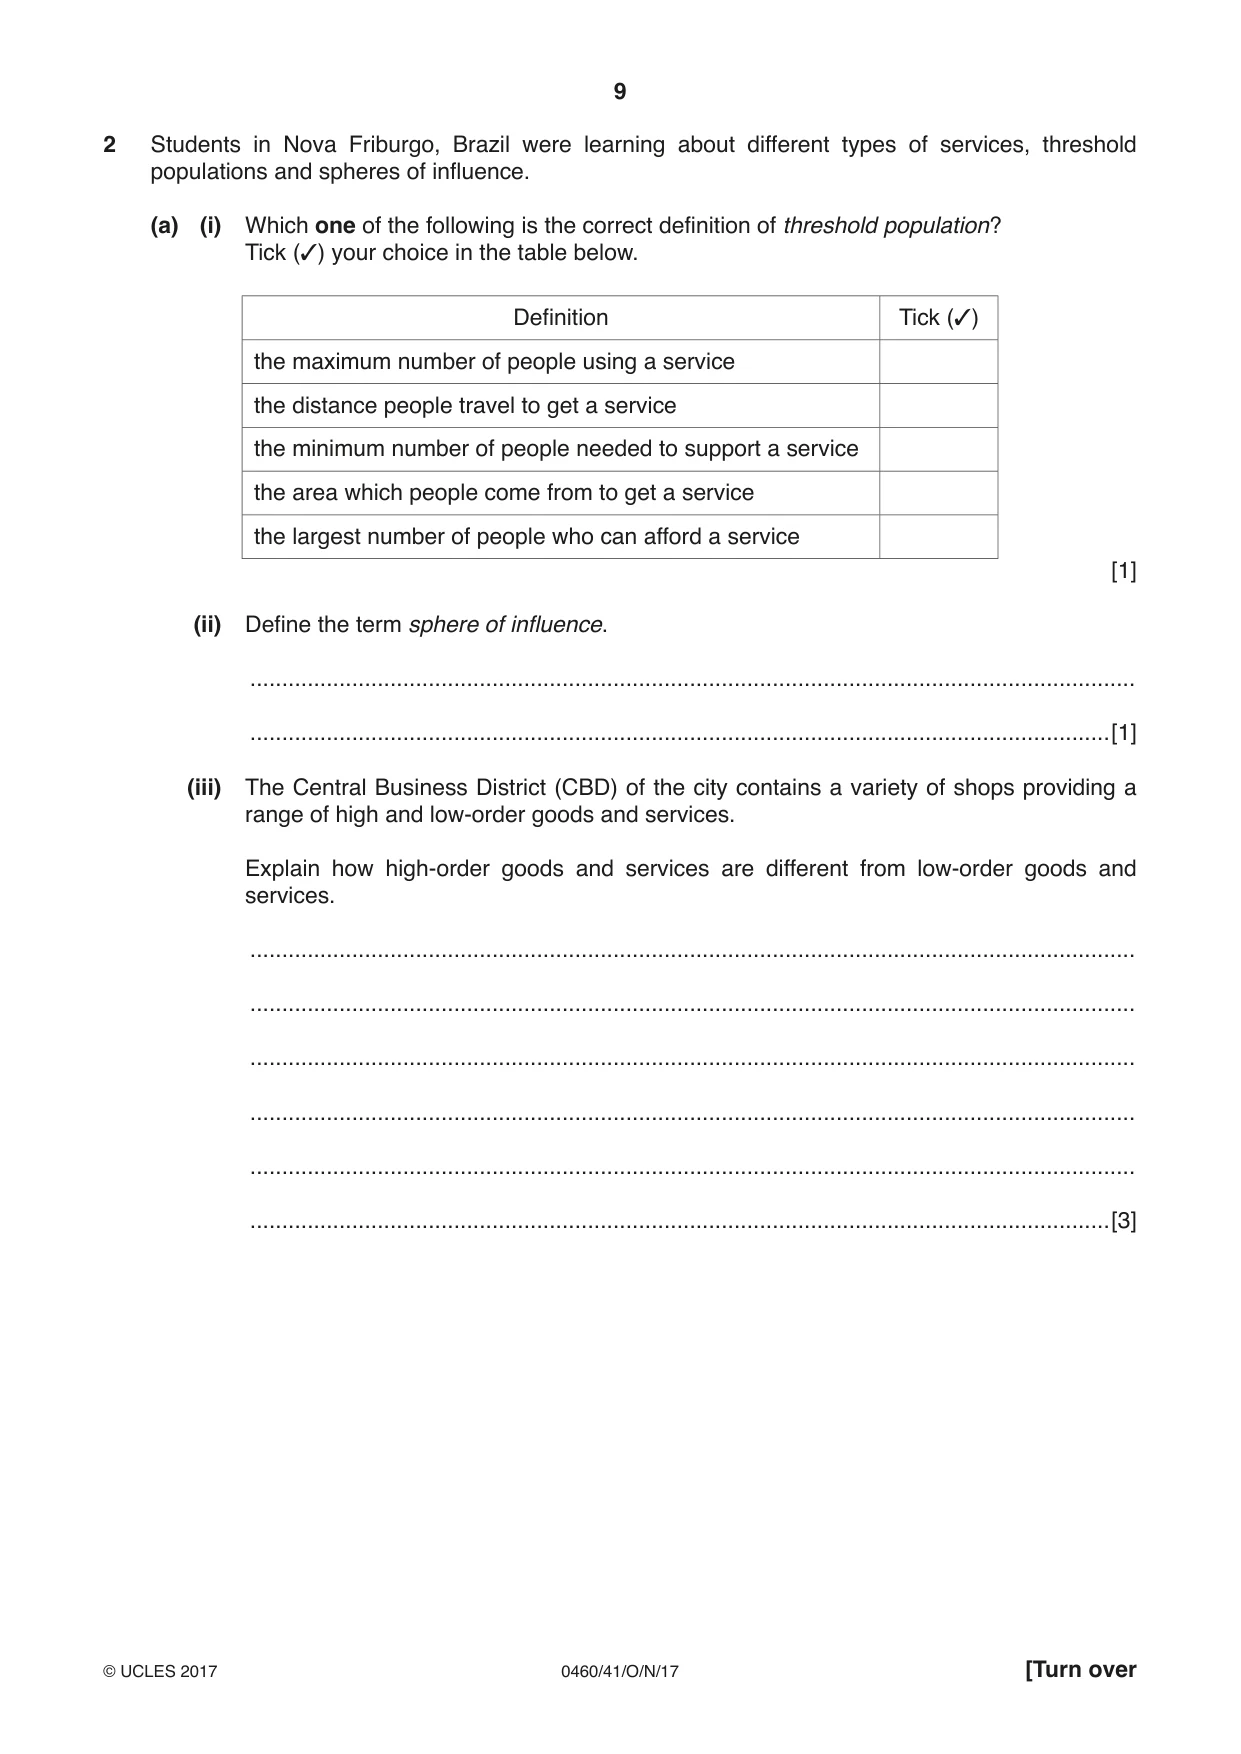
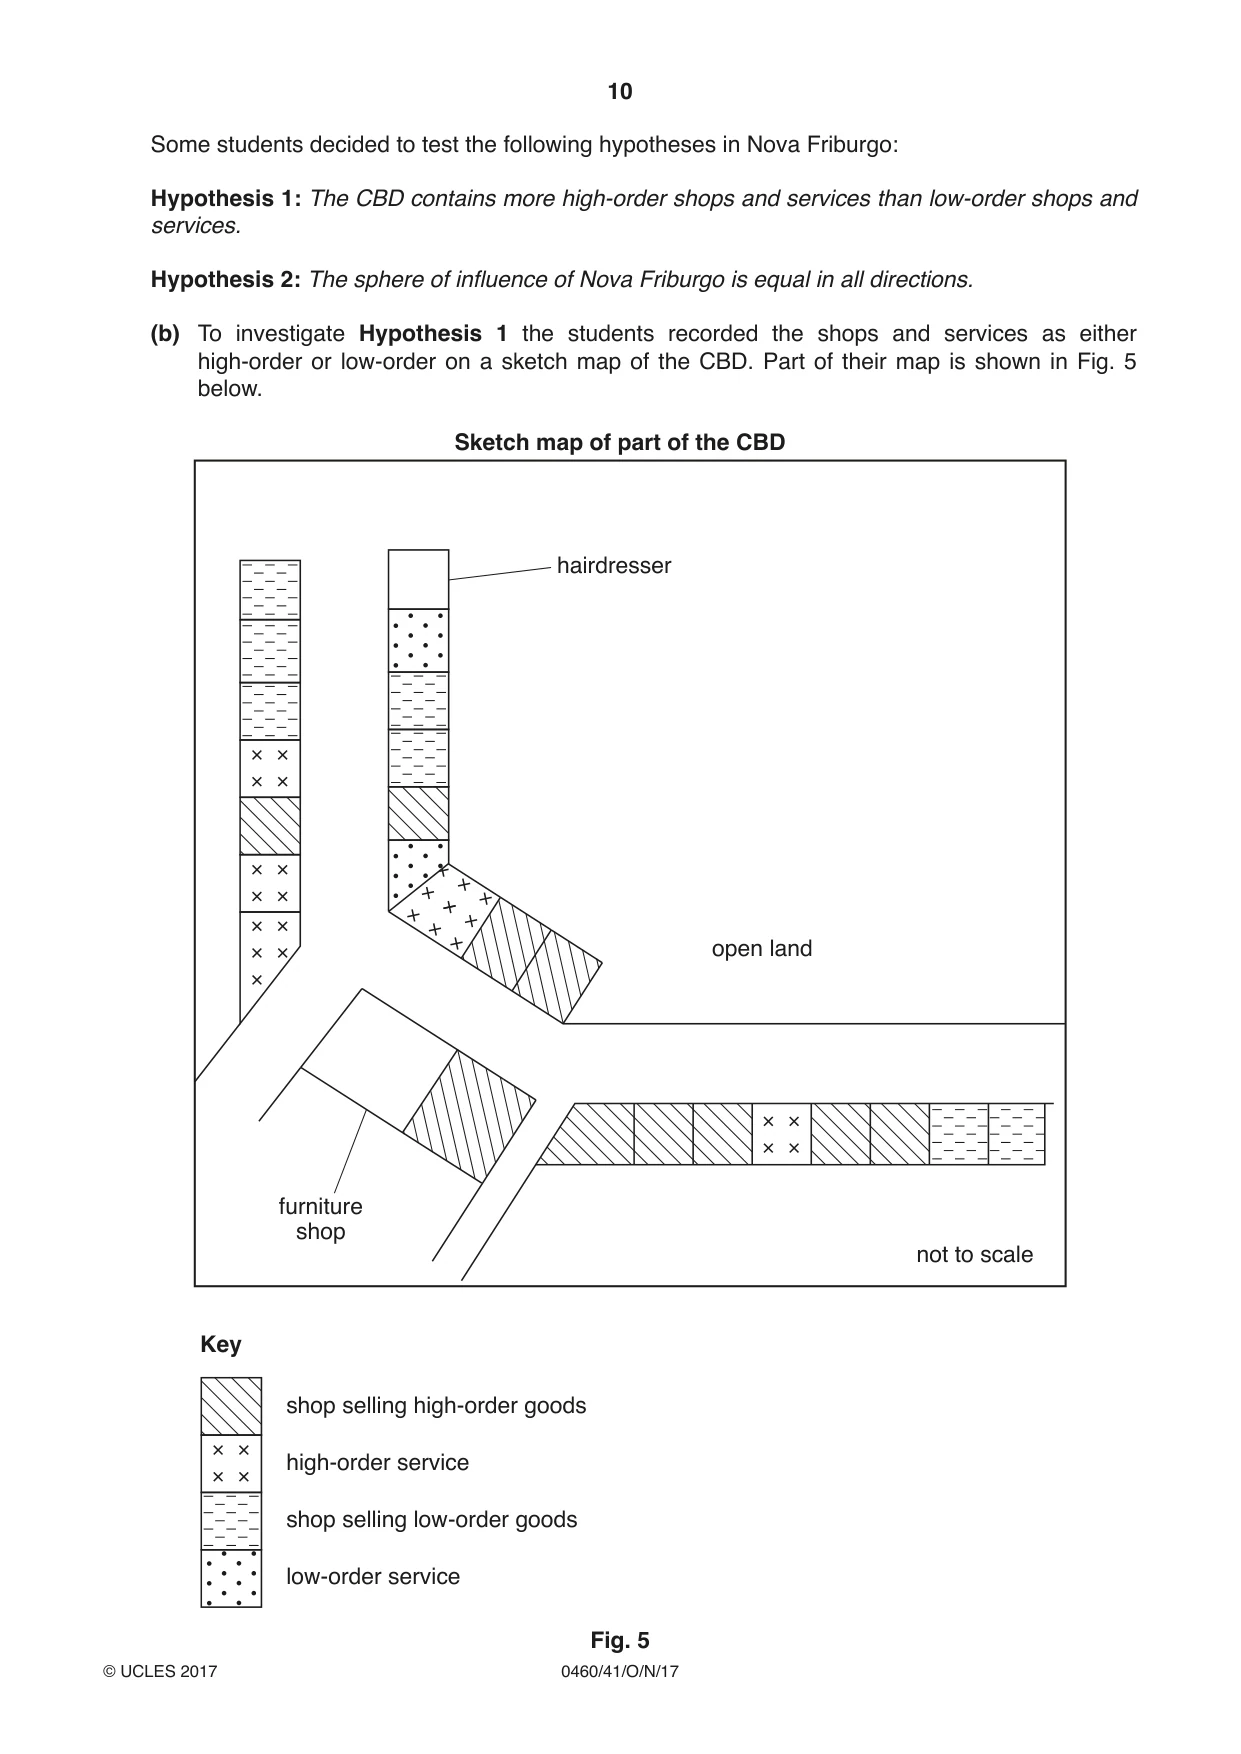
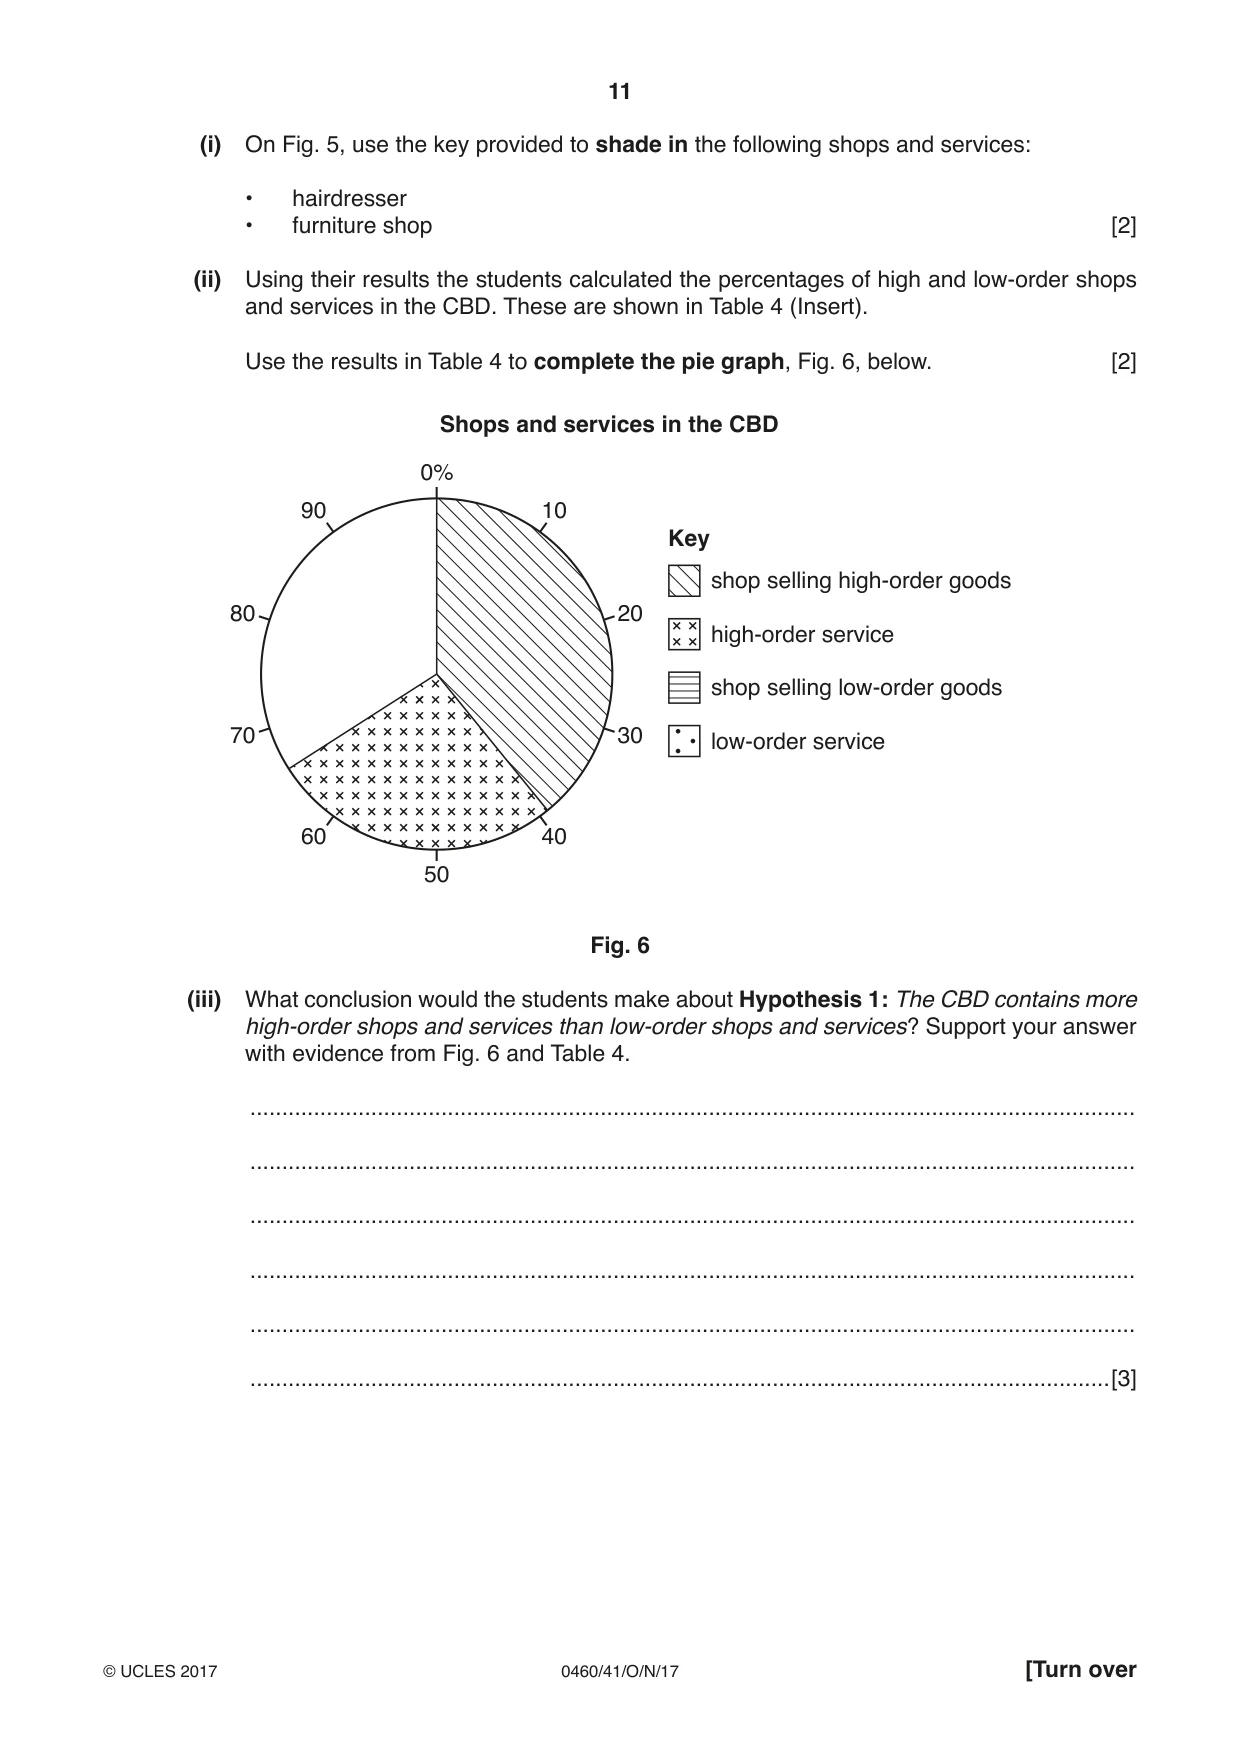
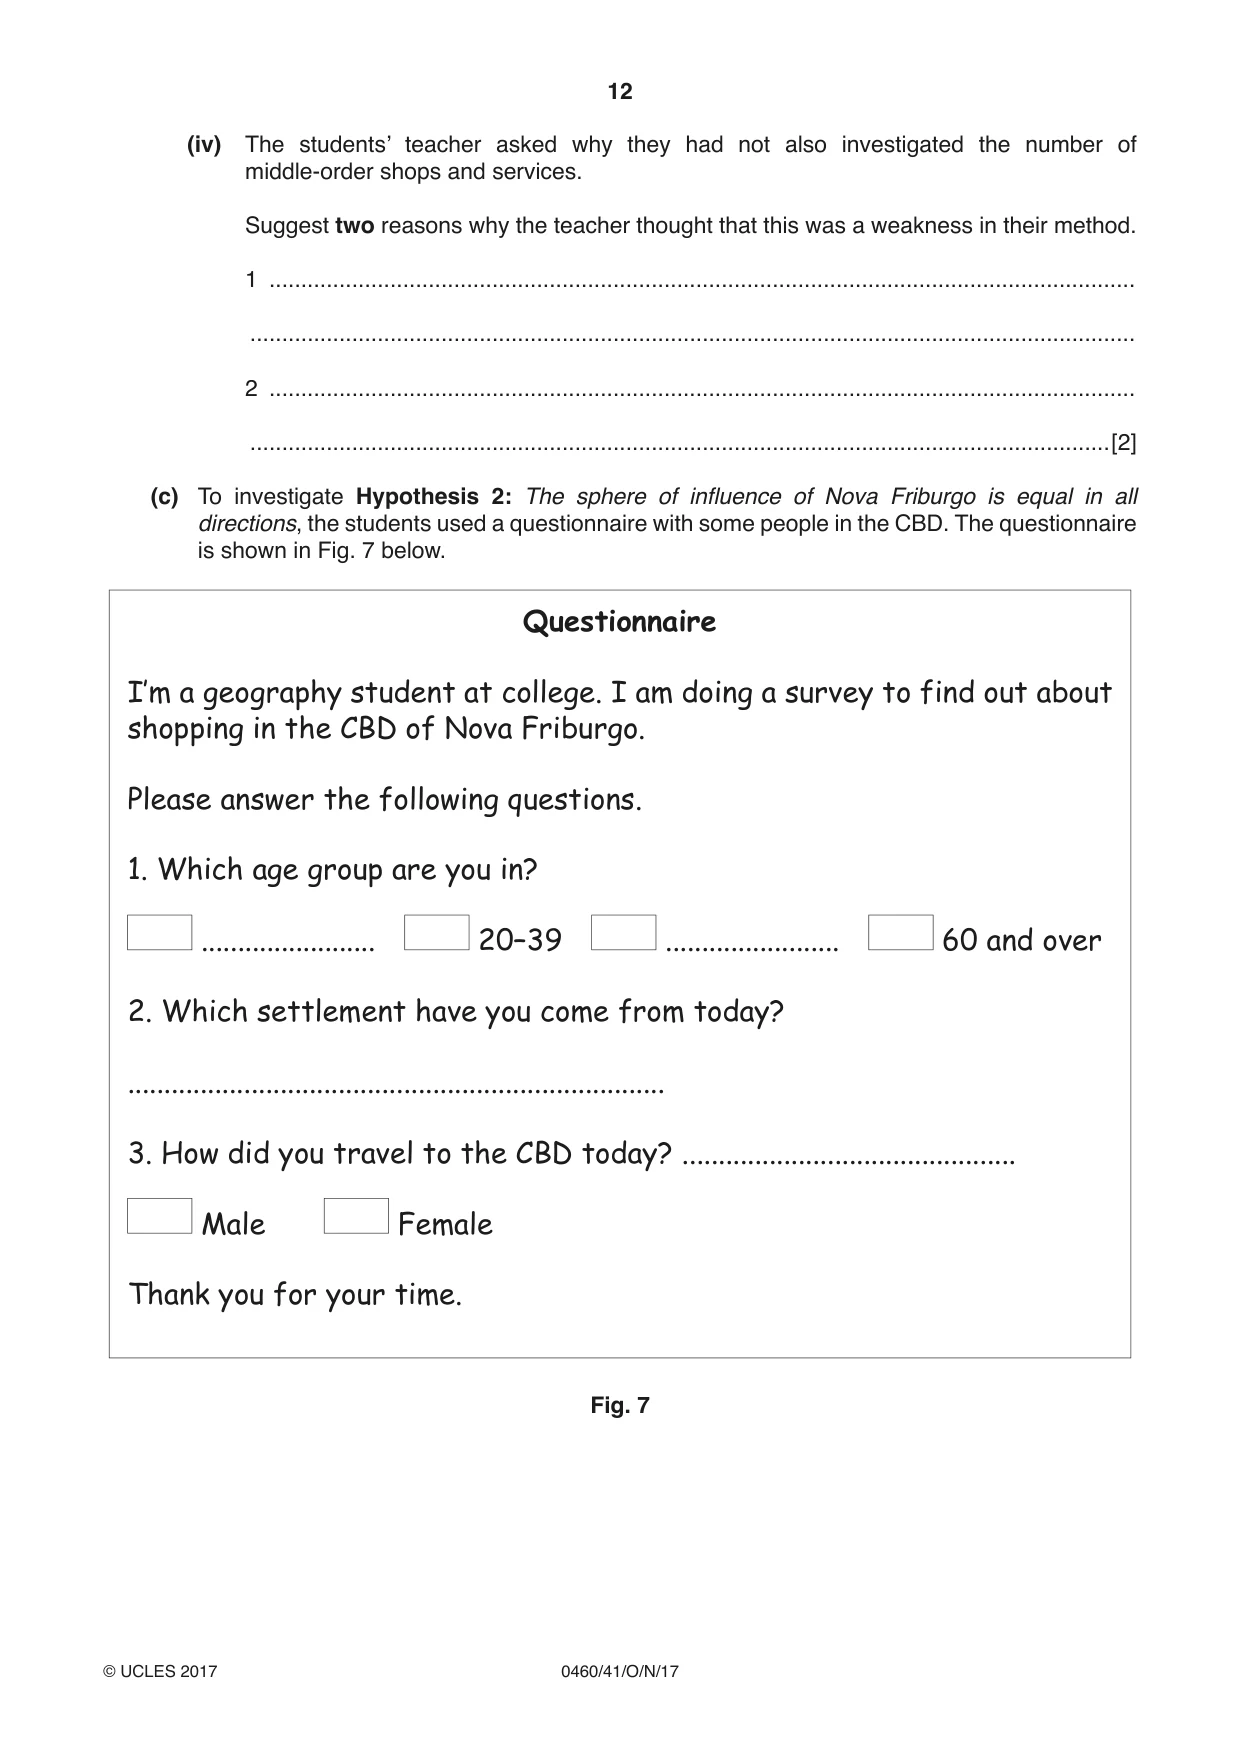
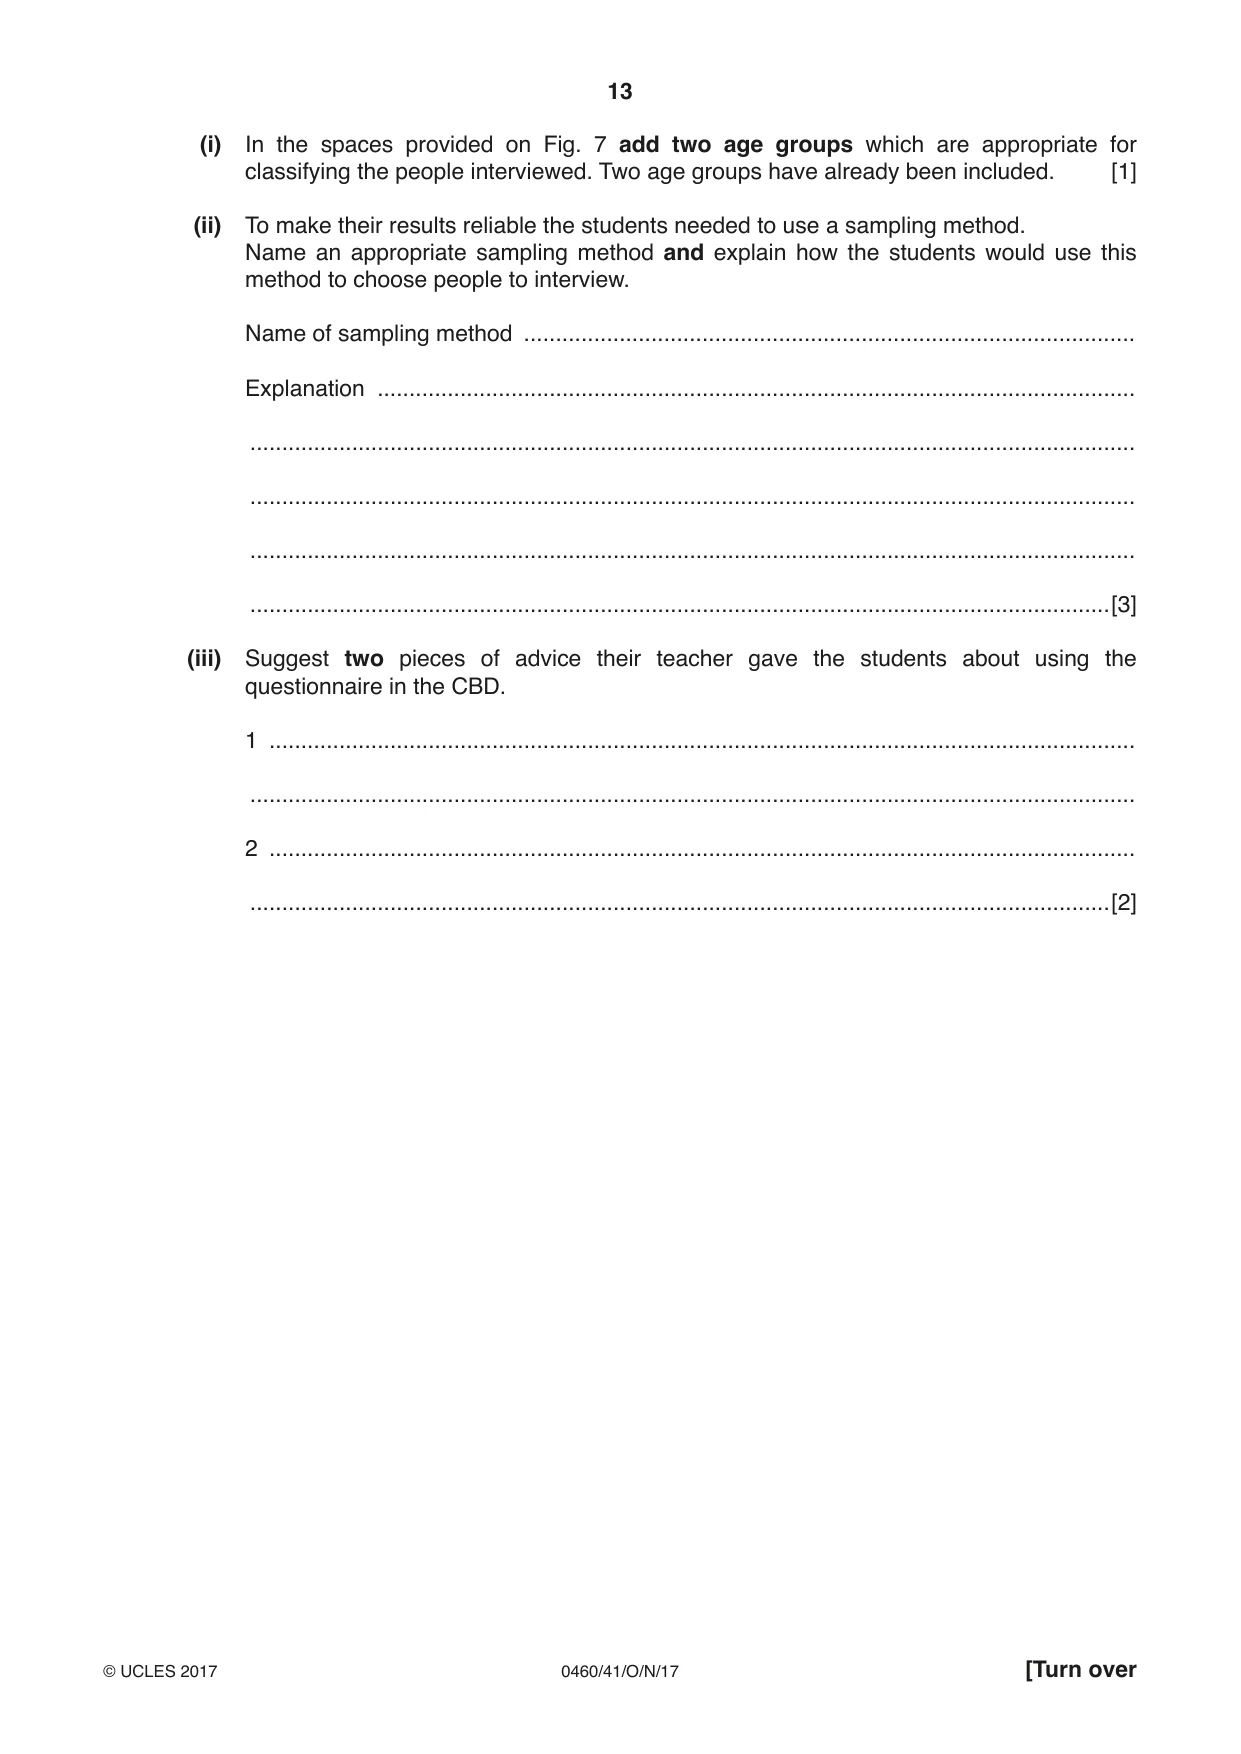
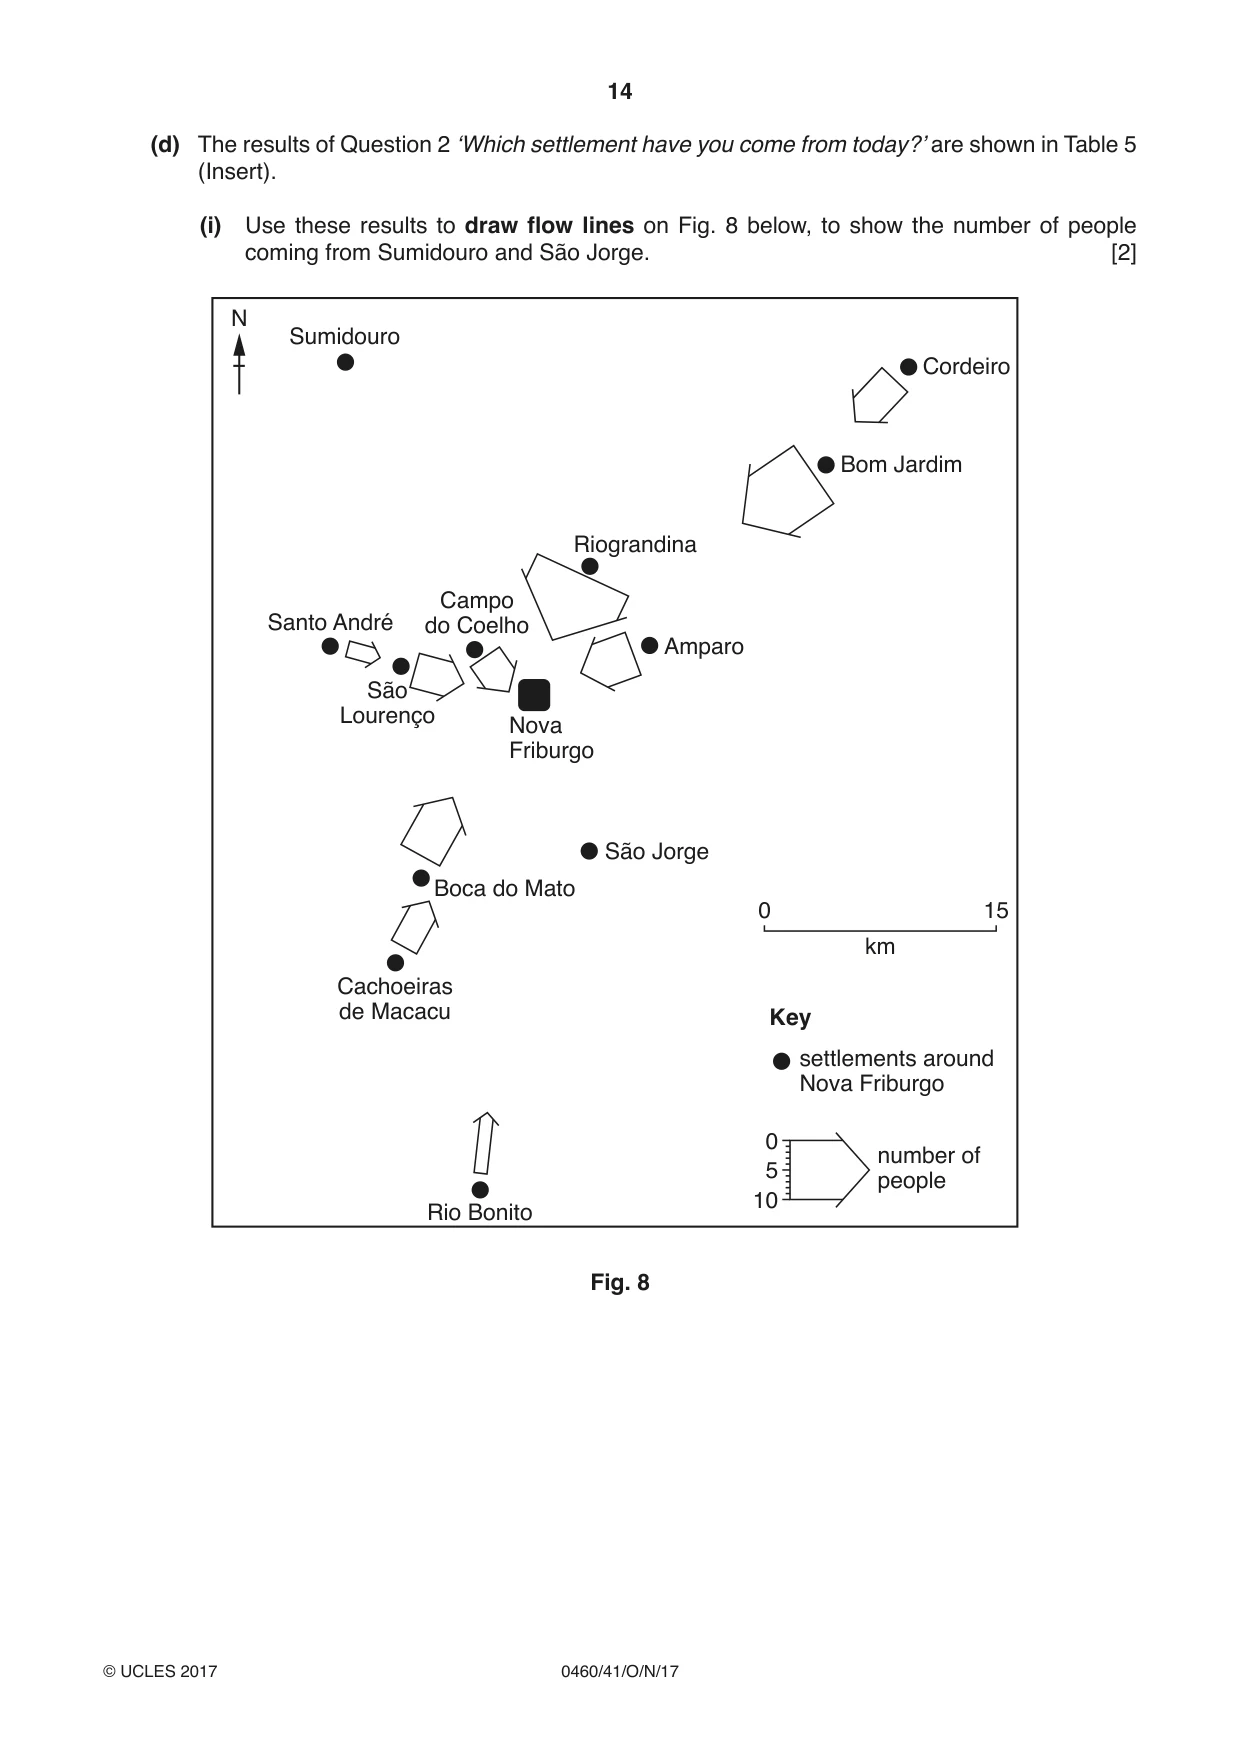
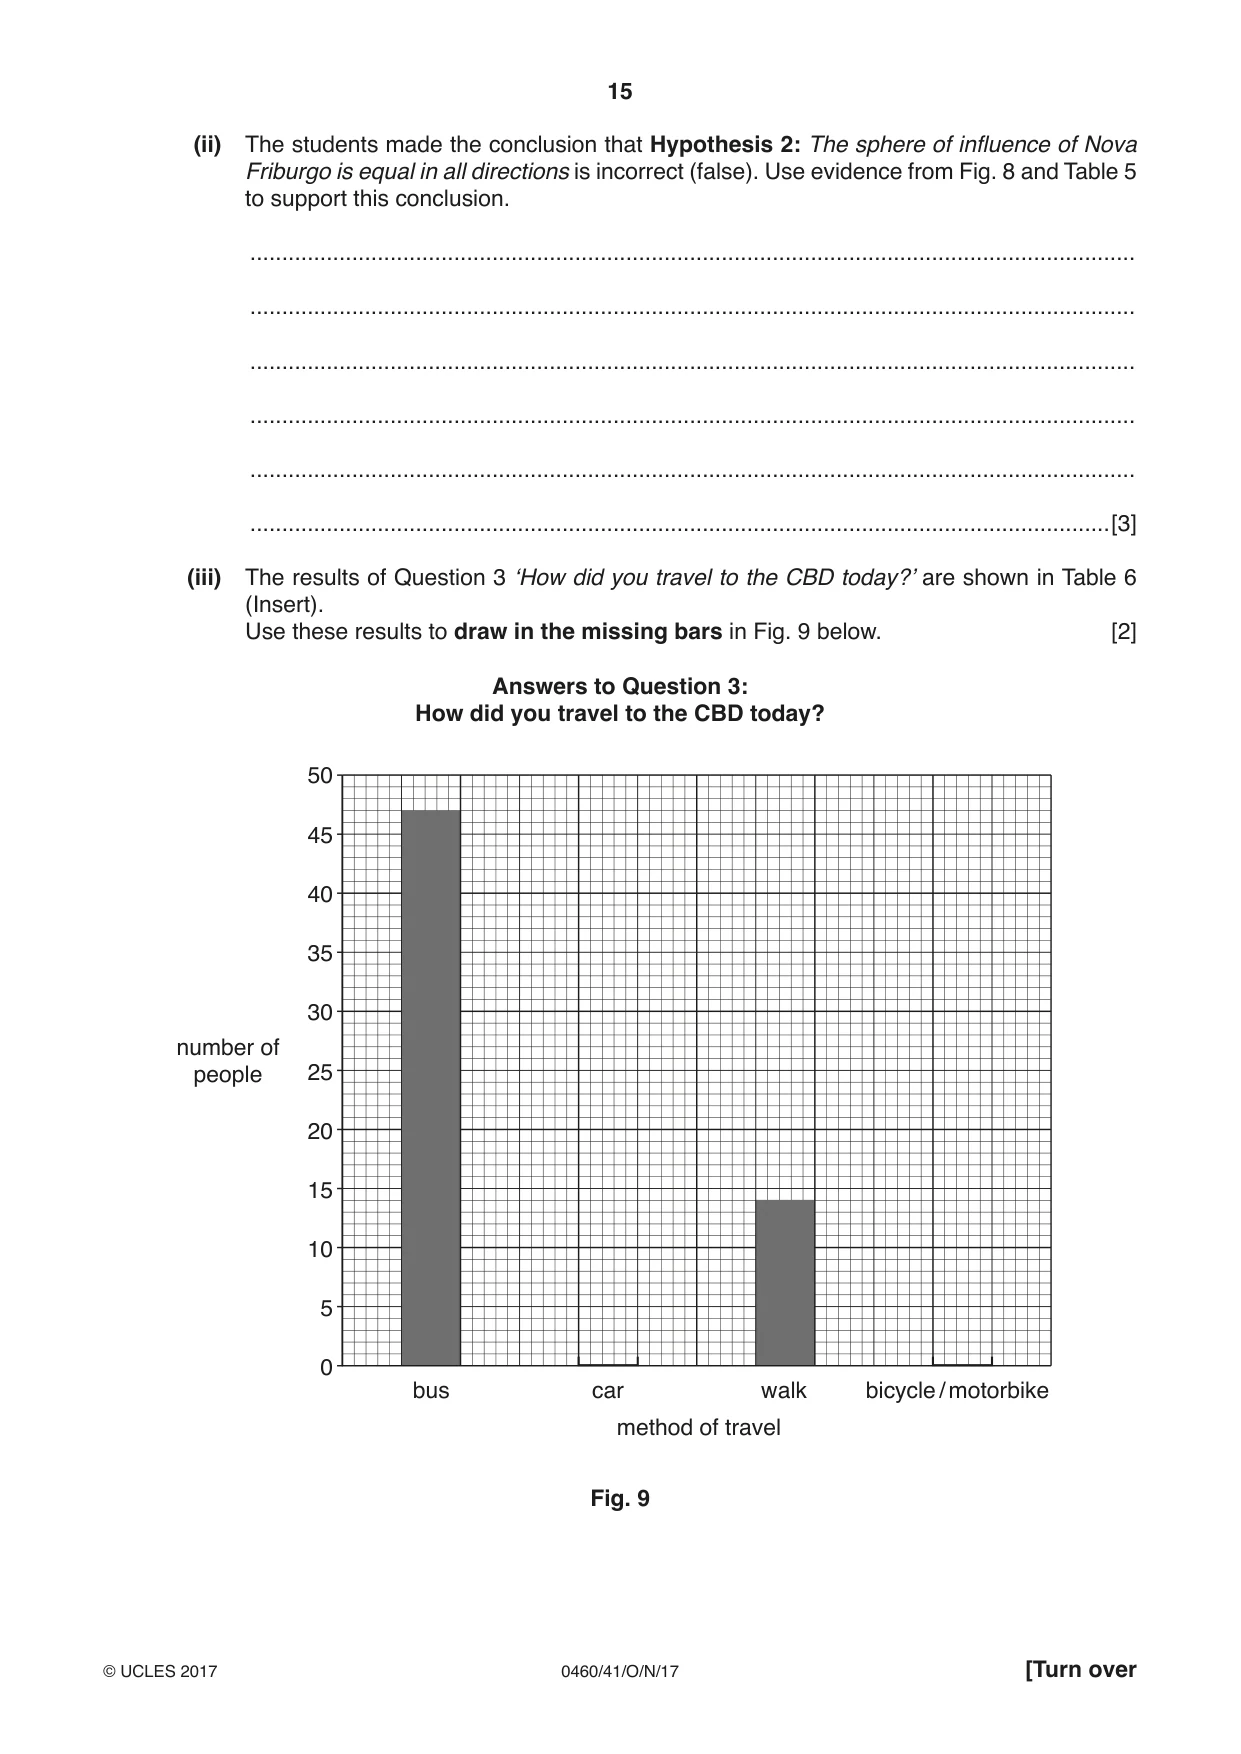
2 Students in Nova Friburgo, Brazil were learning about different types of services, threshold populations and spheres of influence. (a) (i) Which one of the following is the correct definition of threshold population? Tick (3) your choice in the table below. Definition Tick (3) the maximum number of people using a service the distance people travel to get a service the minimum number of people needed to support a service the area which people come from to get a service the largest number of people who can afford a service [1] (ii) Define the term sphere of influence. ........................................................................................................................................... .......................................................................................................................................[1] (iii) The Central Business District (CBD) of the city contains a variety of shops providing a range of high and low-order goods and services. Explain how high-order goods and services are different from low-order goods and services. ........................................................................................................................................... ........................................................................................................................................... ........................................................................................................................................... ........................................................................................................................................... ........................................................................................................................................... .......................................................................................................................................[3] Some students decided to test the following hypotheses in Nova Friburgo: Hypothesis 1: The CBD contains more high-order shops and services than low-order shops and services. Hypothesis 2: The sphere of influence of Nova Friburgo is equal in all directions. (b) To investigate Hypothesis 1 the students recorded the shops and services as either high-order or low-order on a sketch map of the CBD. Part of their map is shown in Fig. 5 below. Sketch map of part of the CBD hairdresser open land furniture shop not to scale Key shop selling high-order goods high-order service shop selling low-order goods low-order service Fig. 5 (i) On Fig. 5, use the key provided to shade in the following shops and services: • hairdresser • furniture shop [2] (ii) Using their results the students calculated the percentages of high and low-order shops and services in the CBD. These are shown in Table 4 (Insert). Use the results in Table 4 to complete the pie graph, Fig. 6, below. [2] Shops and services in the CBD 0% 90 10 Key shop selling high-order goods 80 20 high-order service shop selling low-order goods 70 30 low-order service 60 40 50 Fig. 6 (iii) What conclusion would the students make about Hypothesis 1: The CBD contains more high-order shops and services than low-order shops and services? Support your answer with evidence from Fig. 6 and Table 4. ........................................................................................................................................... ........................................................................................................................................... ........................................................................................................................................... ........................................................................................................................................... ........................................................................................................................................... .......................................................................................................................................[3]
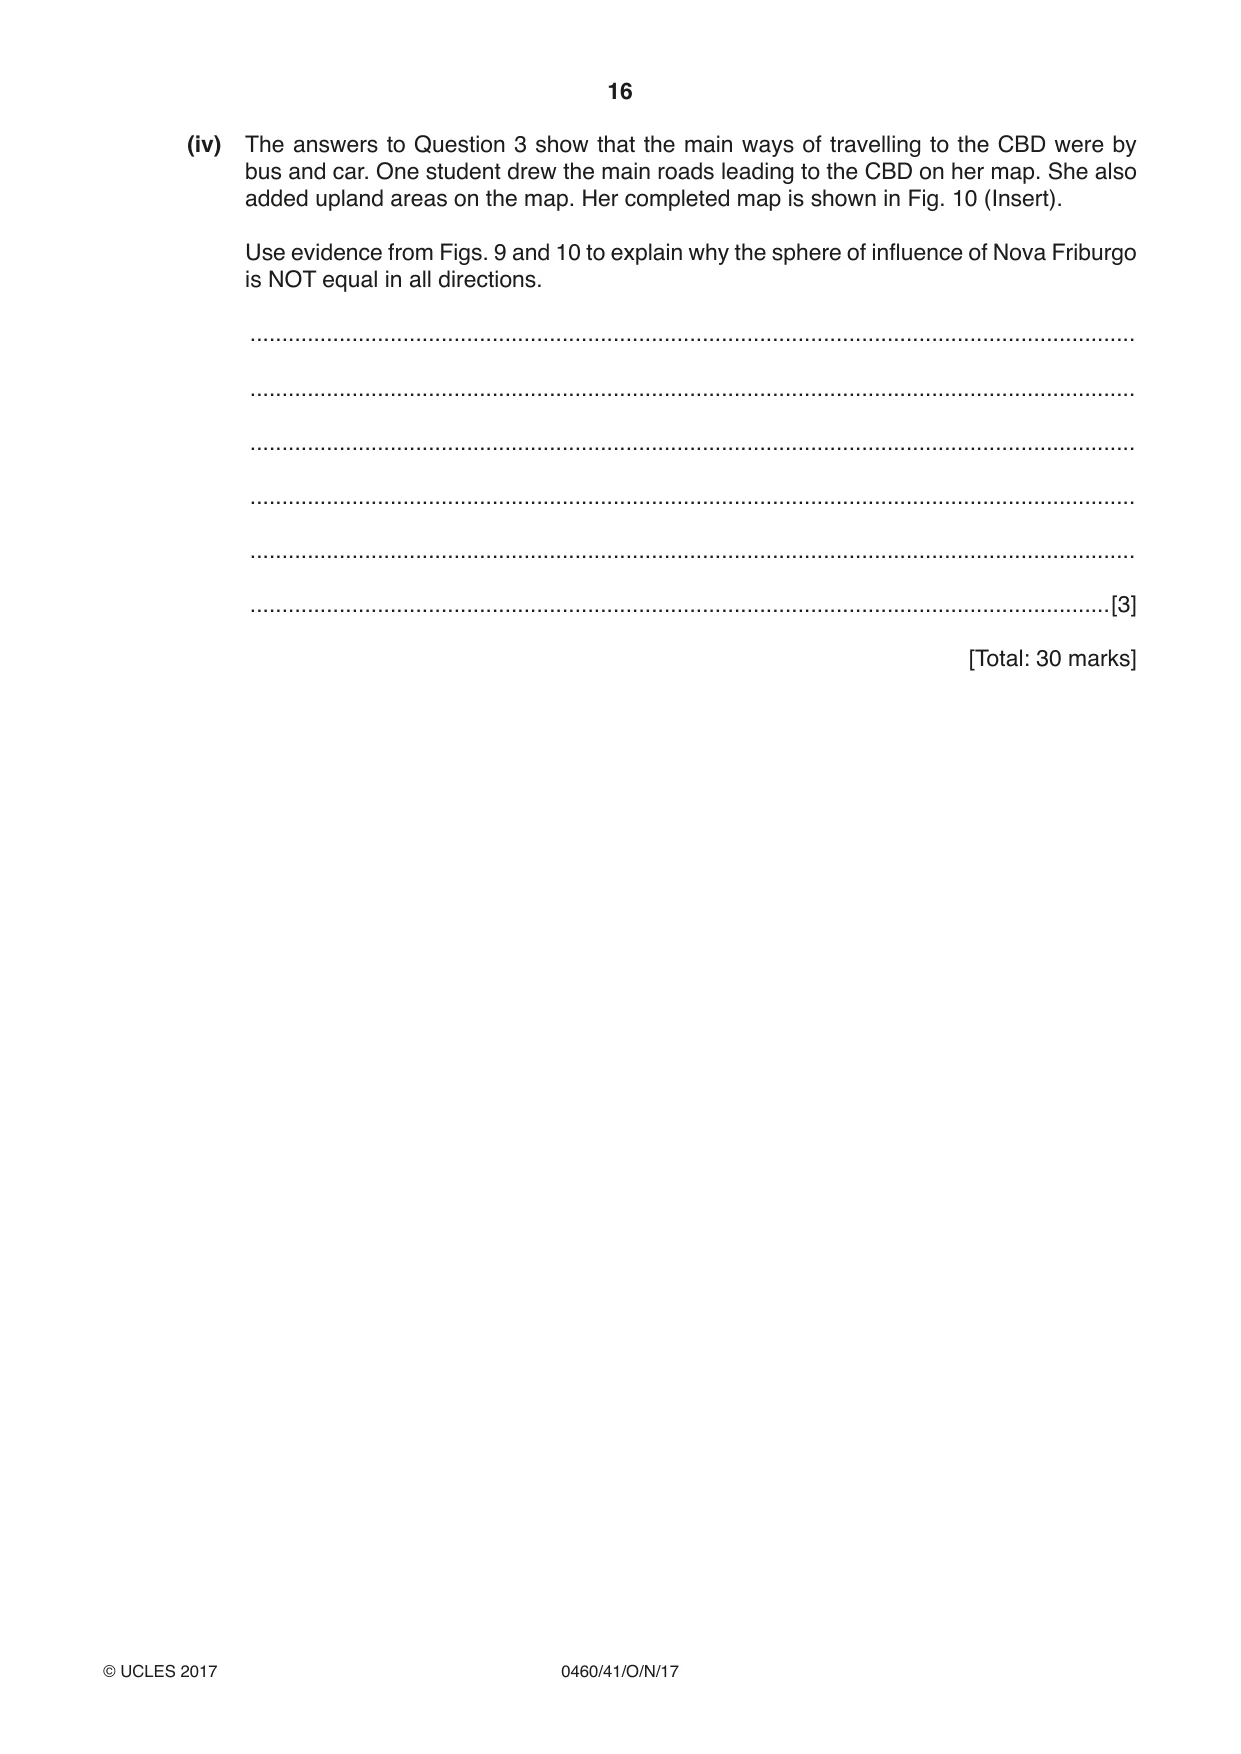
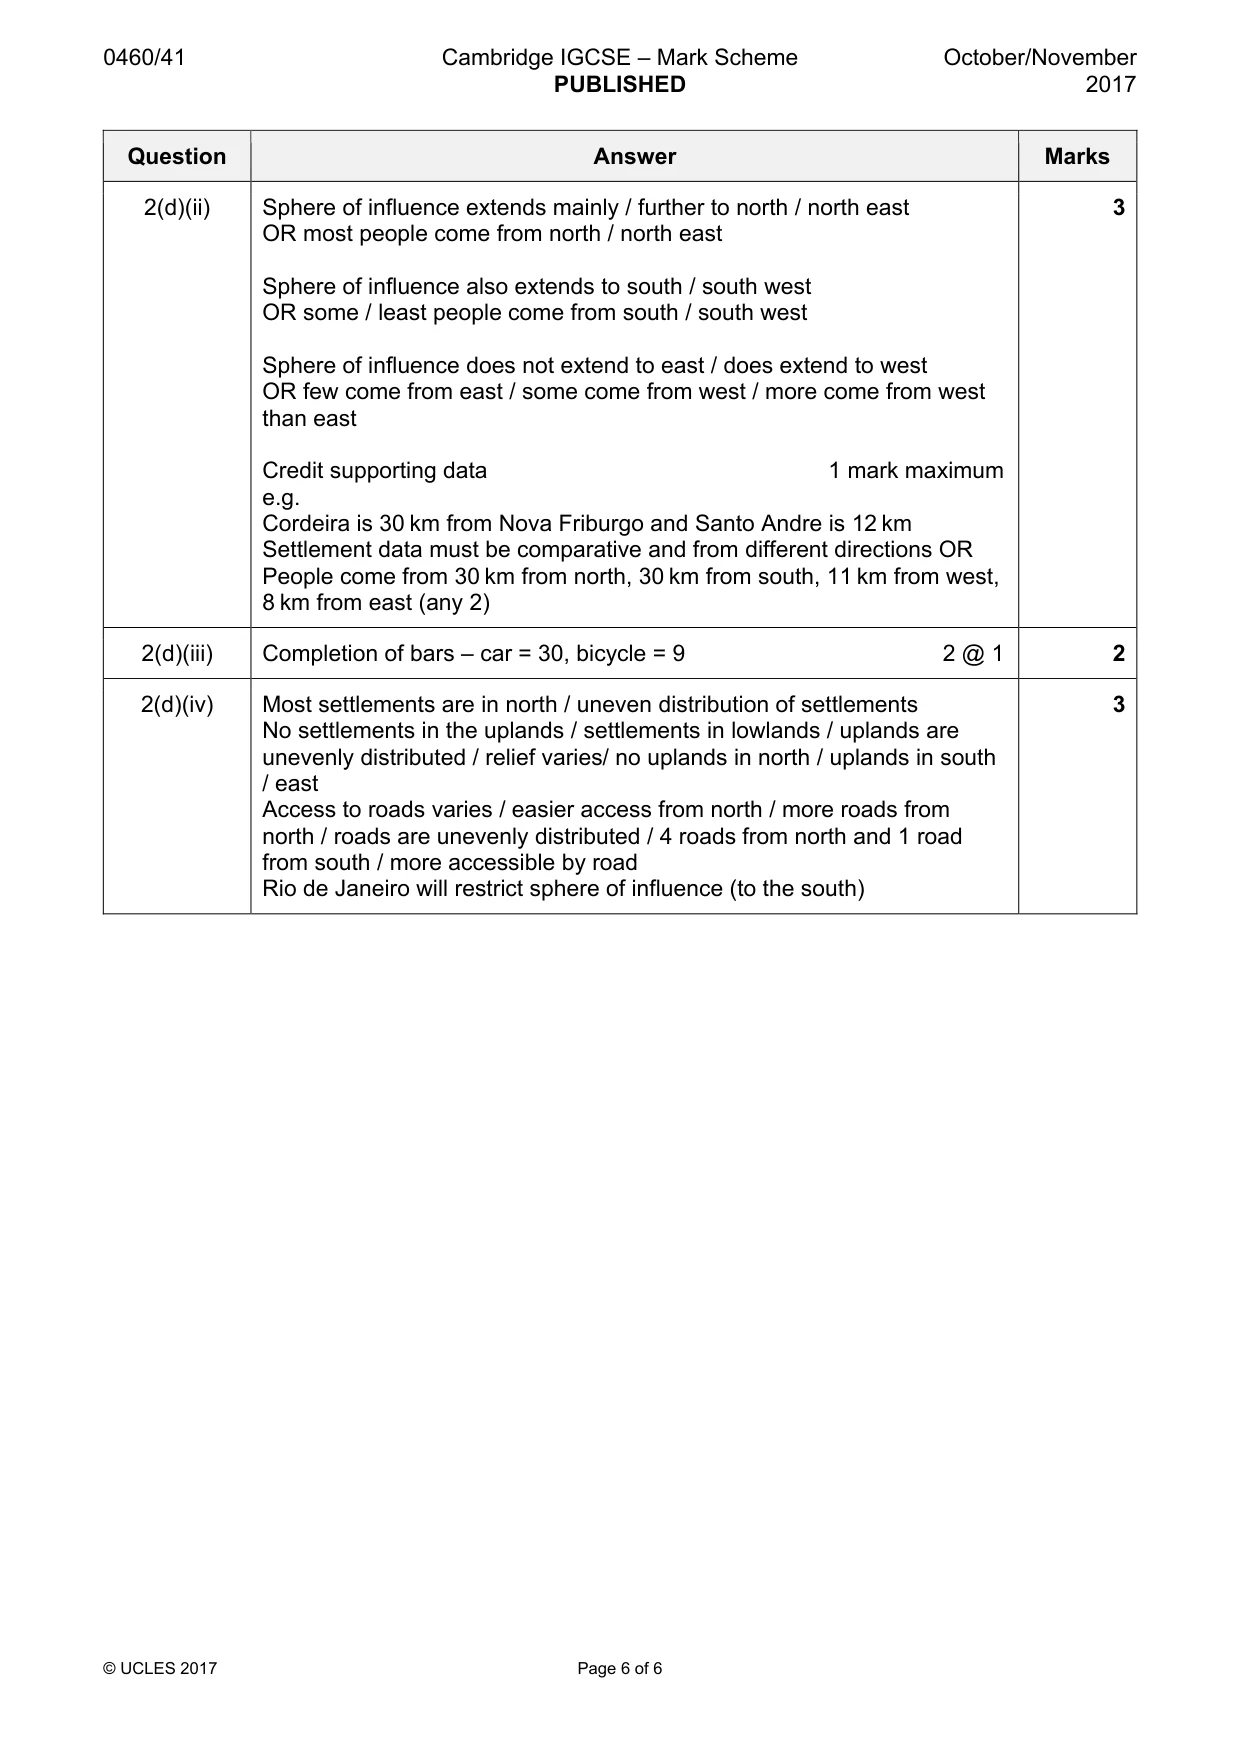
Mark scheme: 2(a)(i) The minimum number of people needed to support a service 1 2(a)(ii) The area served by a settlement / service / where people live who go to 1 the settlement / area people come from to use the service 2(a)(iii) High order goods and services: 3 Located in larger settlements / there are less shops selling high order goods / shops selling low order goods are more common / high order in CBD and low order everywhere More expensive / luxury Bought less frequently / not needed every day Serve a larger sphere of influence Need larger threshold population People willing to travel further for High order are comparison / specialist goods and low order are convenience goods Ideas must be comparative 2(b)(i) Hairdresser: low order service 2 Furniture shop; shop selling high order goods 2 @ 1 2(b)(ii) Completion of pie graph – shop selling low order goods = 20% and low 2 order service = 14% 1 mark for dividing line 1 mark for shading 2(b)(iii) Hypothesis is true / correct 1 mark reserve 3 paired data to compare shops and services: 2 marks High order goods = 39% and low order goods = 20% High order services = 27% and low order services = 14% High order goods and services = 66% and low order goods and services = 34% No credit for Hypothesis is false / incorrect If no hypothesis conclusion credit evidence 2(b)(iv) Many / some shops / services are middle order / would be wrong to 2 classify middle order as high or low order / some shops cannot be classified as low or high order Including middle order would make study more realistic / valid / fair / accurate / reliable 2 @ 1 2(c)(i) 0–19 / under 20 / 19 and under and 40–59 1 Both age groups needed 2(c)(ii) Stratified / quota: 3 Find out gender / age balance of shoppers Ask a balanced number / proportionate number of people of different age group / gender OR Get people of different ages / gender / male and female 1 mark Systematic: Choose people at regular intervals Every tenth person who passes them (accept 2nd, 5th etc.) Random: Use random number tables to generate order to ask people Choose people who fit the sequence identified OR Ask anybody / next person / no pattern 1 mark 2(c)(iii) Work in pairs / small groups / not alone / don’t work in large groups 2 Don’t block pavement / entrance to shops Be polite / kind / respectful to interviewees / say thank you / do not ask age or gender / estimate age or gender Accept that people won’t want to answer questions / too busy / in a hurry / don’t force to answer Choose a time when there are plenty of people shopping Ask people leaving different shops / spread out evenly Avoid ‘dangerous’ people / ‘dangerous places’ 2 @ 1 2(d)(i) Completion of flow lines – Sumidouro = 10 and Sao Jorge = 3 2 @ 1 2 2(d)(ii) Sphere of influence extends mainly / further to north / north east 3 OR most people come from north / north east Sphere of influence also extends to south / south west OR some / least people come from south / south west Sphere of influence does not extend to east / does extend to west OR few come from east / some come from west / more come from west than east Credit supporting data 1 mark maximum e.g. Cordeira is 30 km from Nova Friburgo and Santo Andre is 12 km Settlement data must be comparative and from different directions OR People come from 30 km from north, 30 km from south, 11 km from west, 8 km from east (any 2) 2(d)(iii) Completion of bars – car = 30, bicycle = 9 2 @ 1 2 2(d)(iv) Most settlements are in north / uneven distribution of settlements 3 No settlements in the uplands / settlements in lowlands / uplands are unevenly distributed / relief varies/ no uplands in north / uplands in south / east Access to roads varies / easier access from north / more roads from north / roads are unevenly distributed / 4 roads from north and 1 road from south / more accessible by road Rio de Janeiro will restrict sphere of influence (to the south)
More questions on Settlements (rural and urban) and service provision
What was in this paper
The subtopics covered by these 2 questions, and how many questions each got. Open one in a new tab to see every Cambridge question on it.
What you needed in this session
Cambridge’s own grade thresholds for 2017 Oct/Nov, Paper 4 · Variant 1. A higher threshold means an easier paper — the bar moves with how the cohort did.