Cambridge IGCSE Geography 0460 — 2017 May/June Paper 4 · Variant 3
0460/43/M/J/17 · 2 questions · 60 marks · ≈68 min
The question paper and its mark scheme, free to read here and free to download. This is Cambridge’s own paper, exactly as it was sat.
Question paper20 pages







Mark scheme6 pages
Answers below. Sit the paper first if you are practising.
Questions as text
Q1 · Students at a school in south west England did fieldwork on a river which flows from…
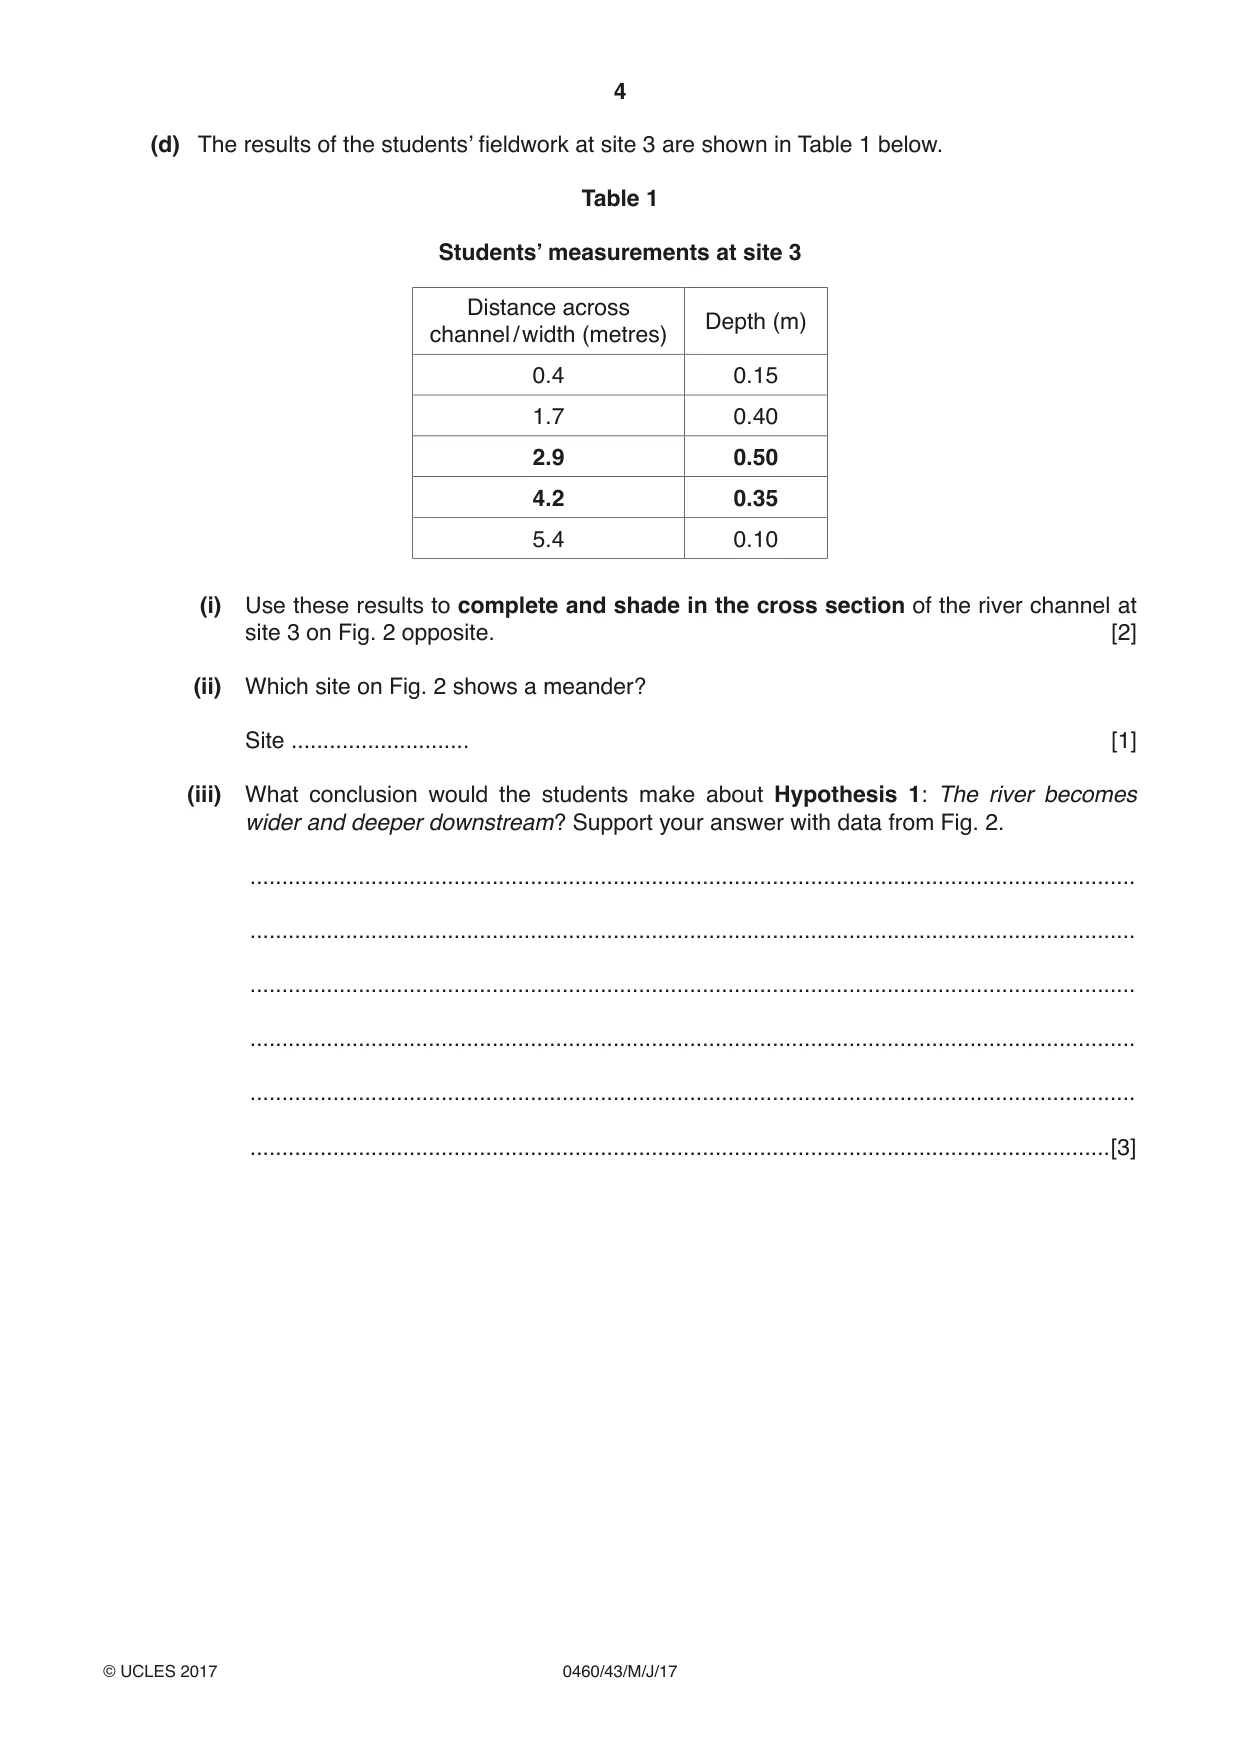
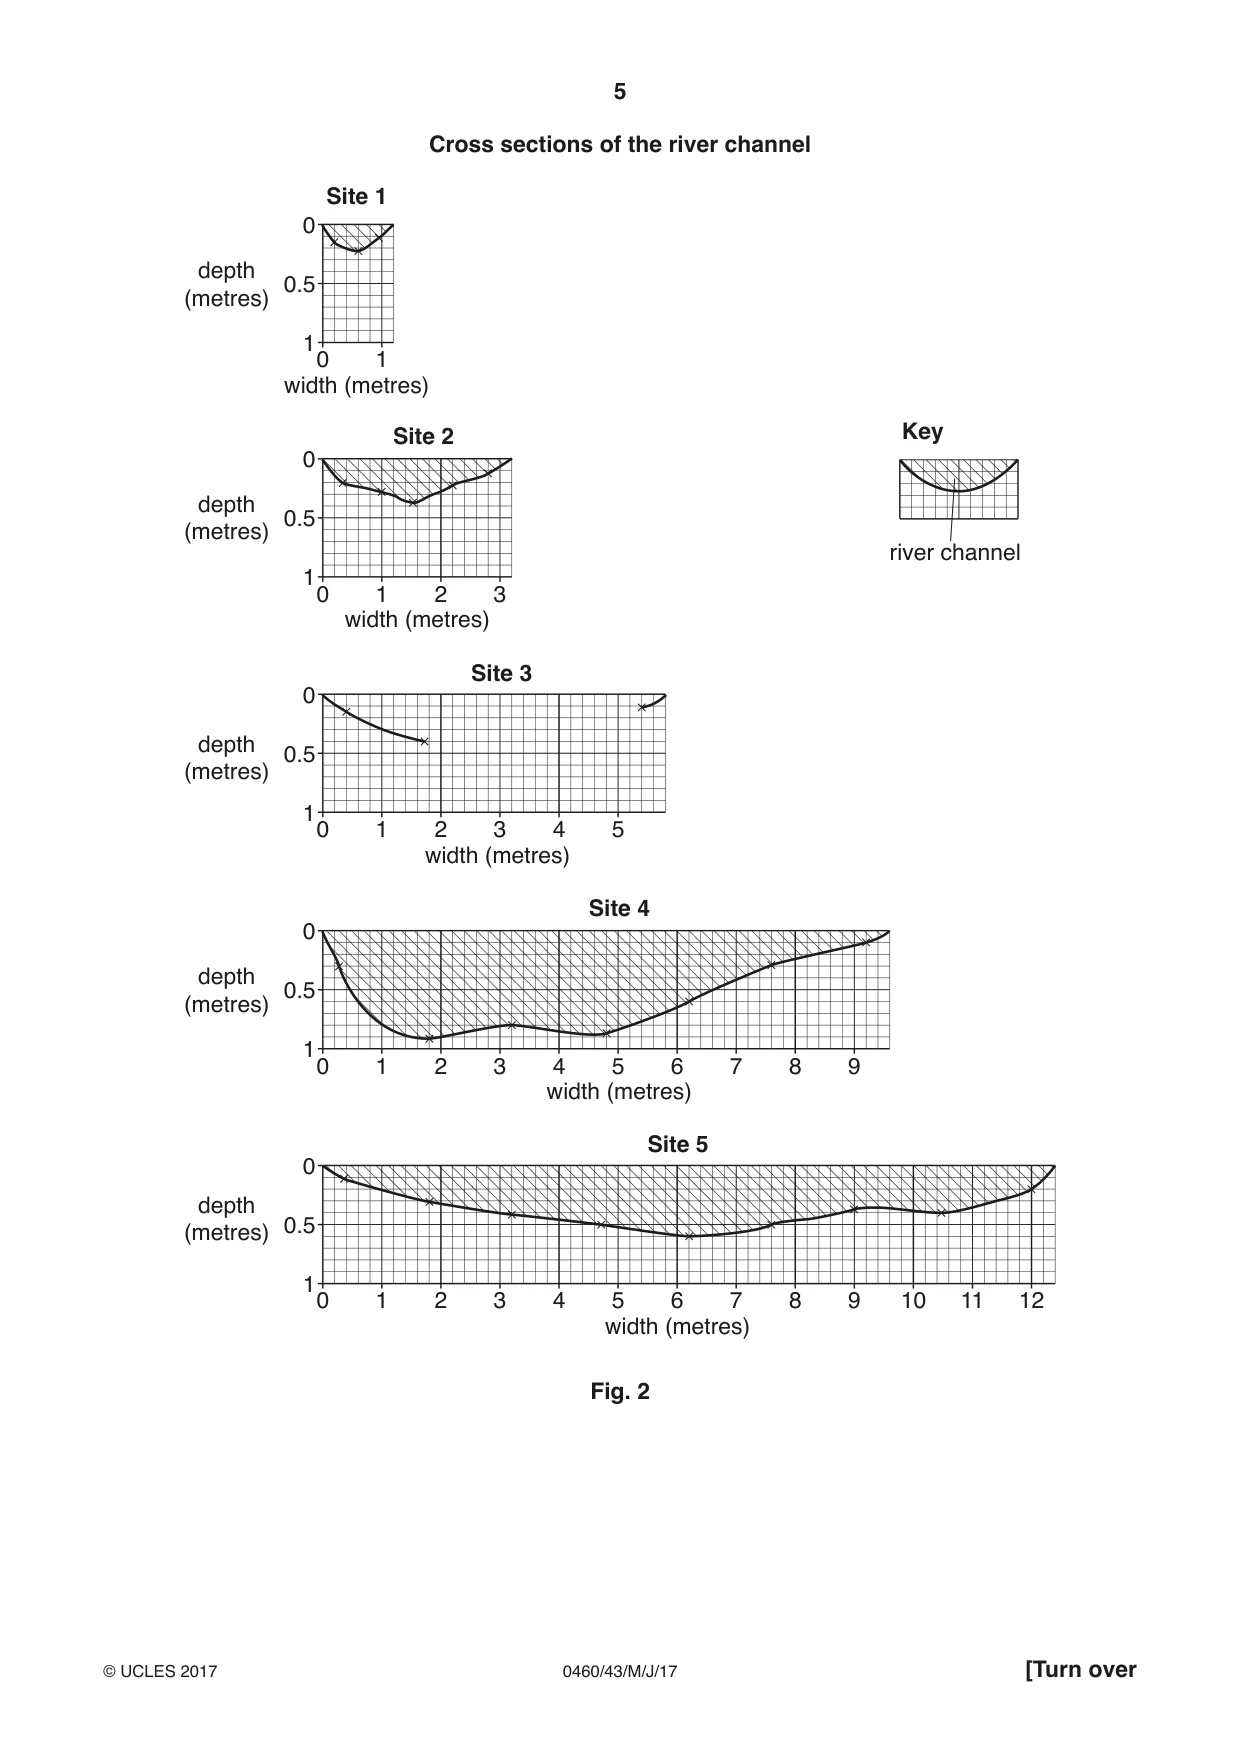
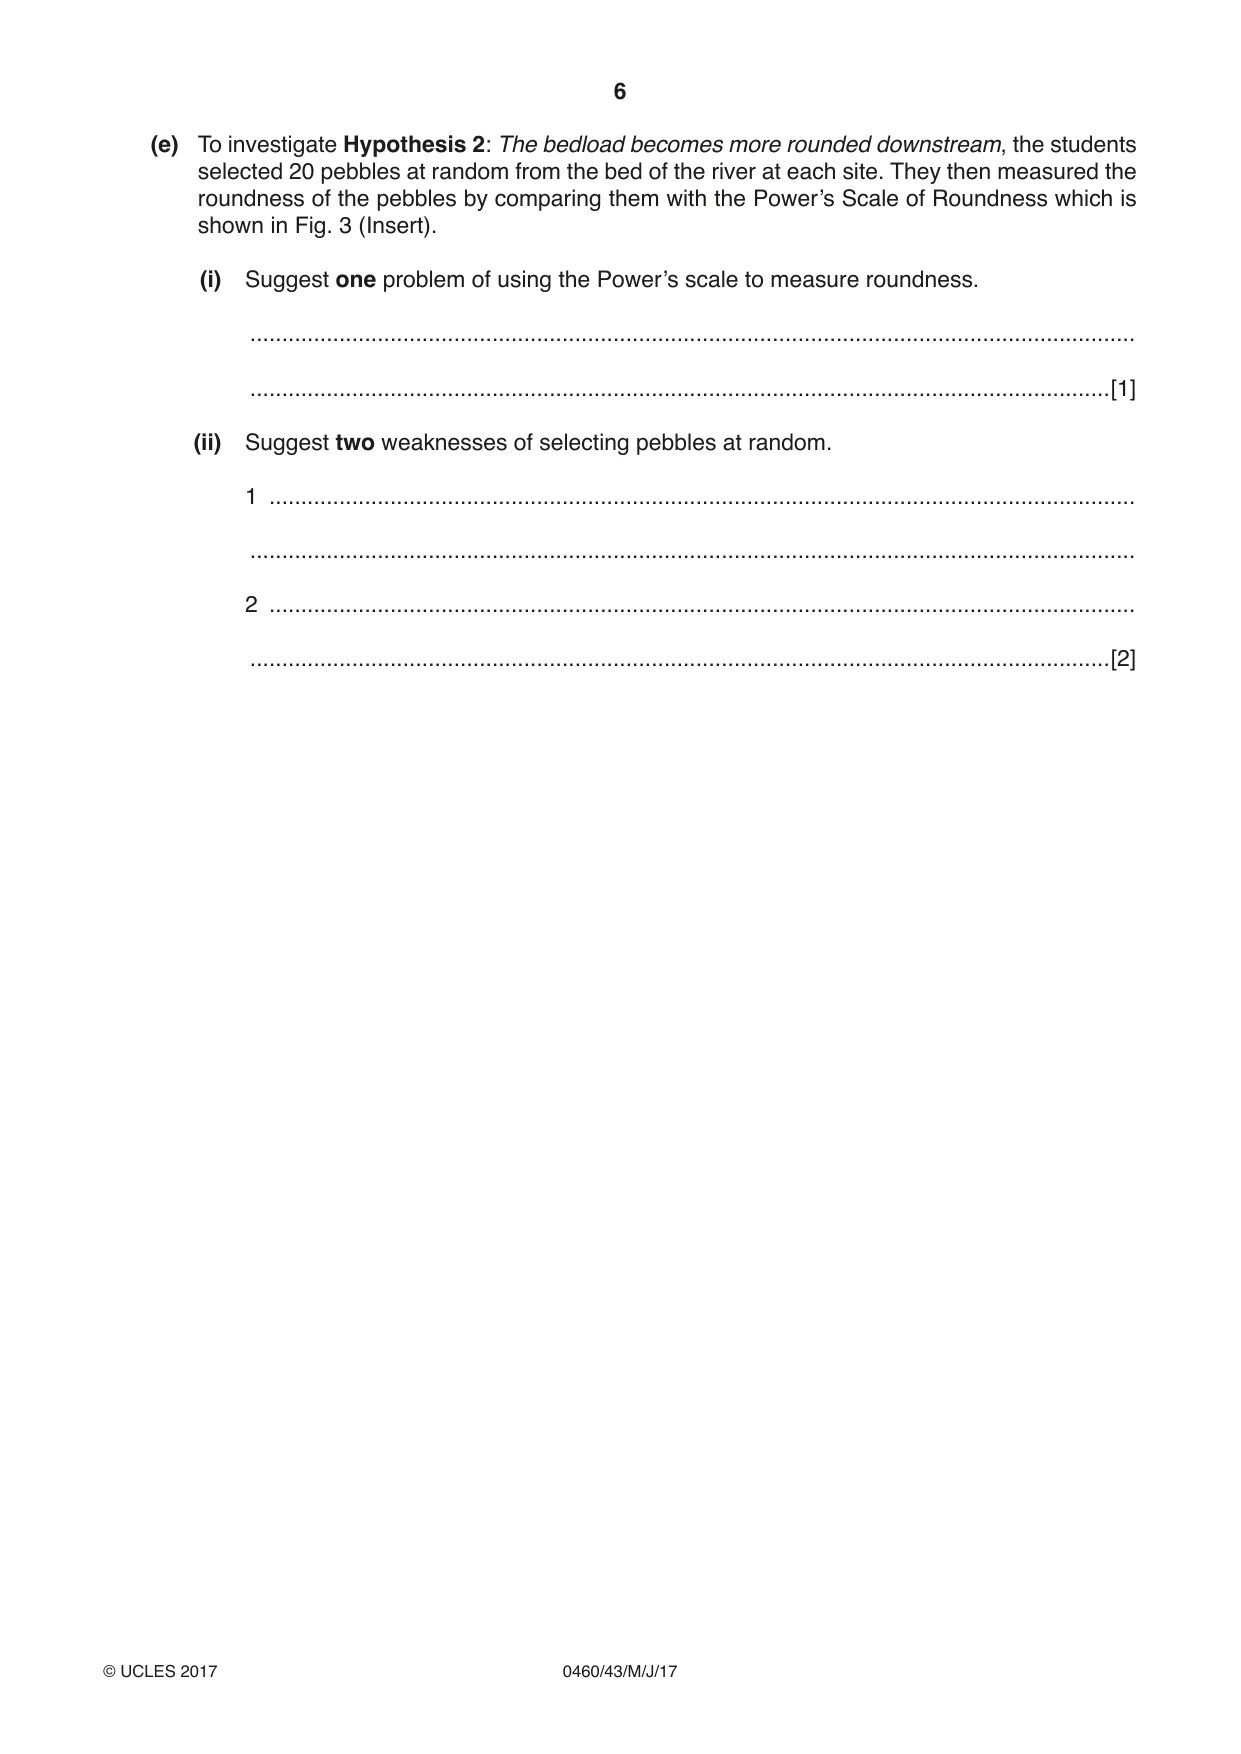
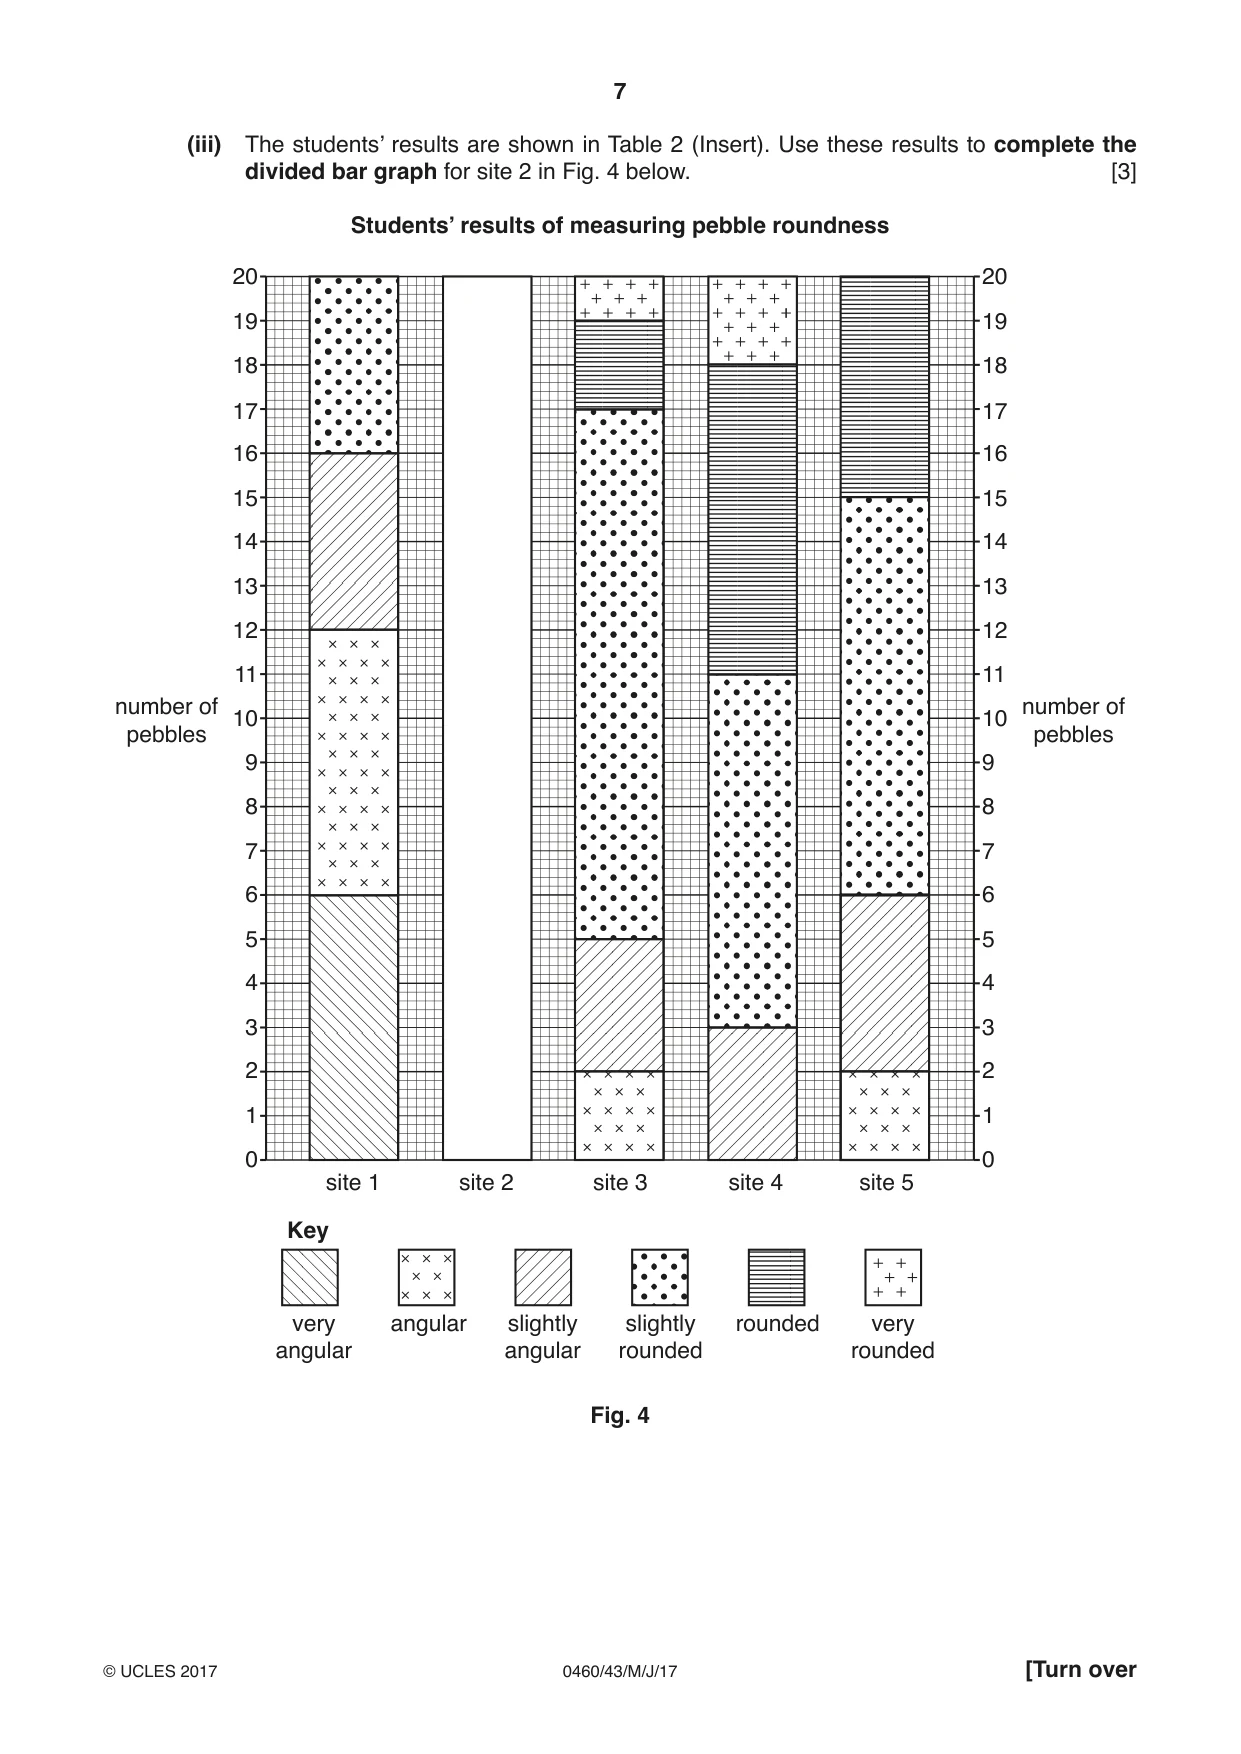
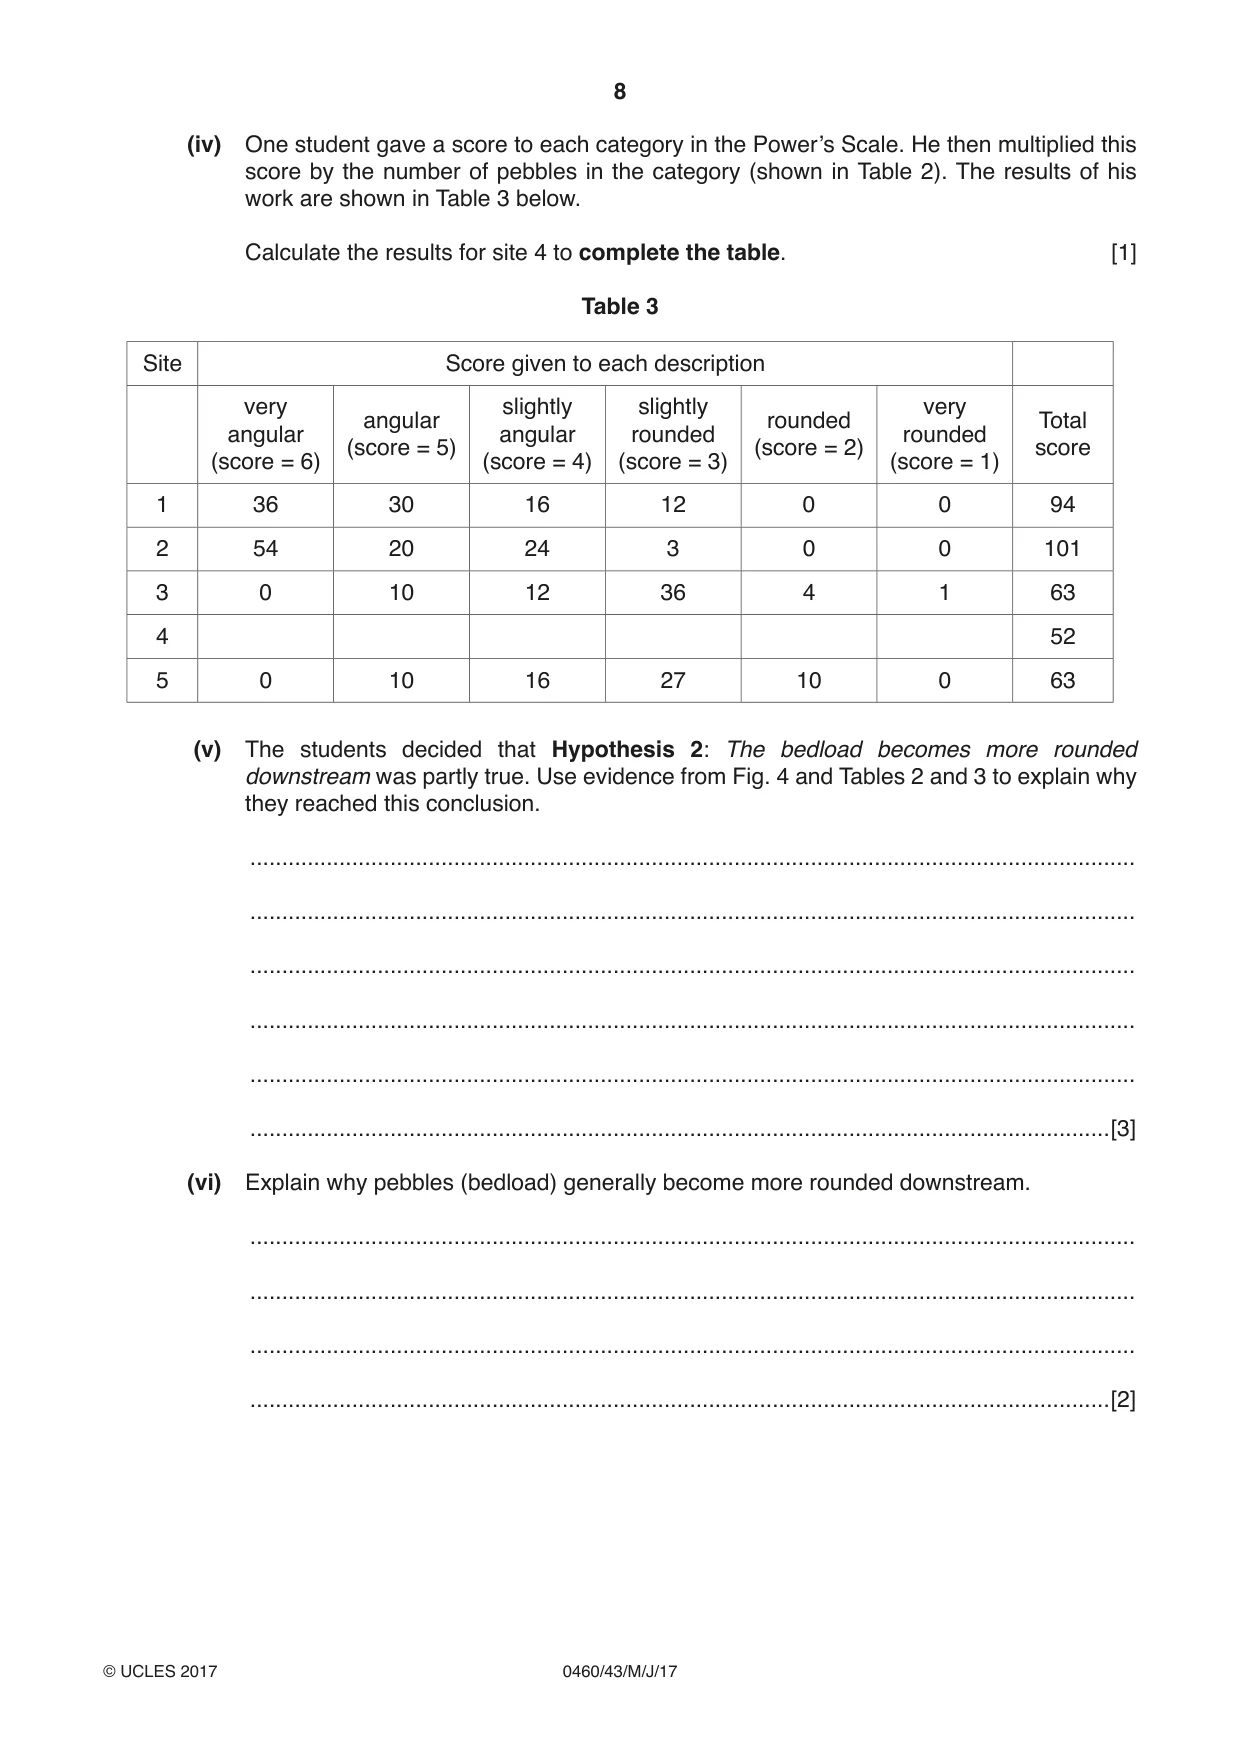
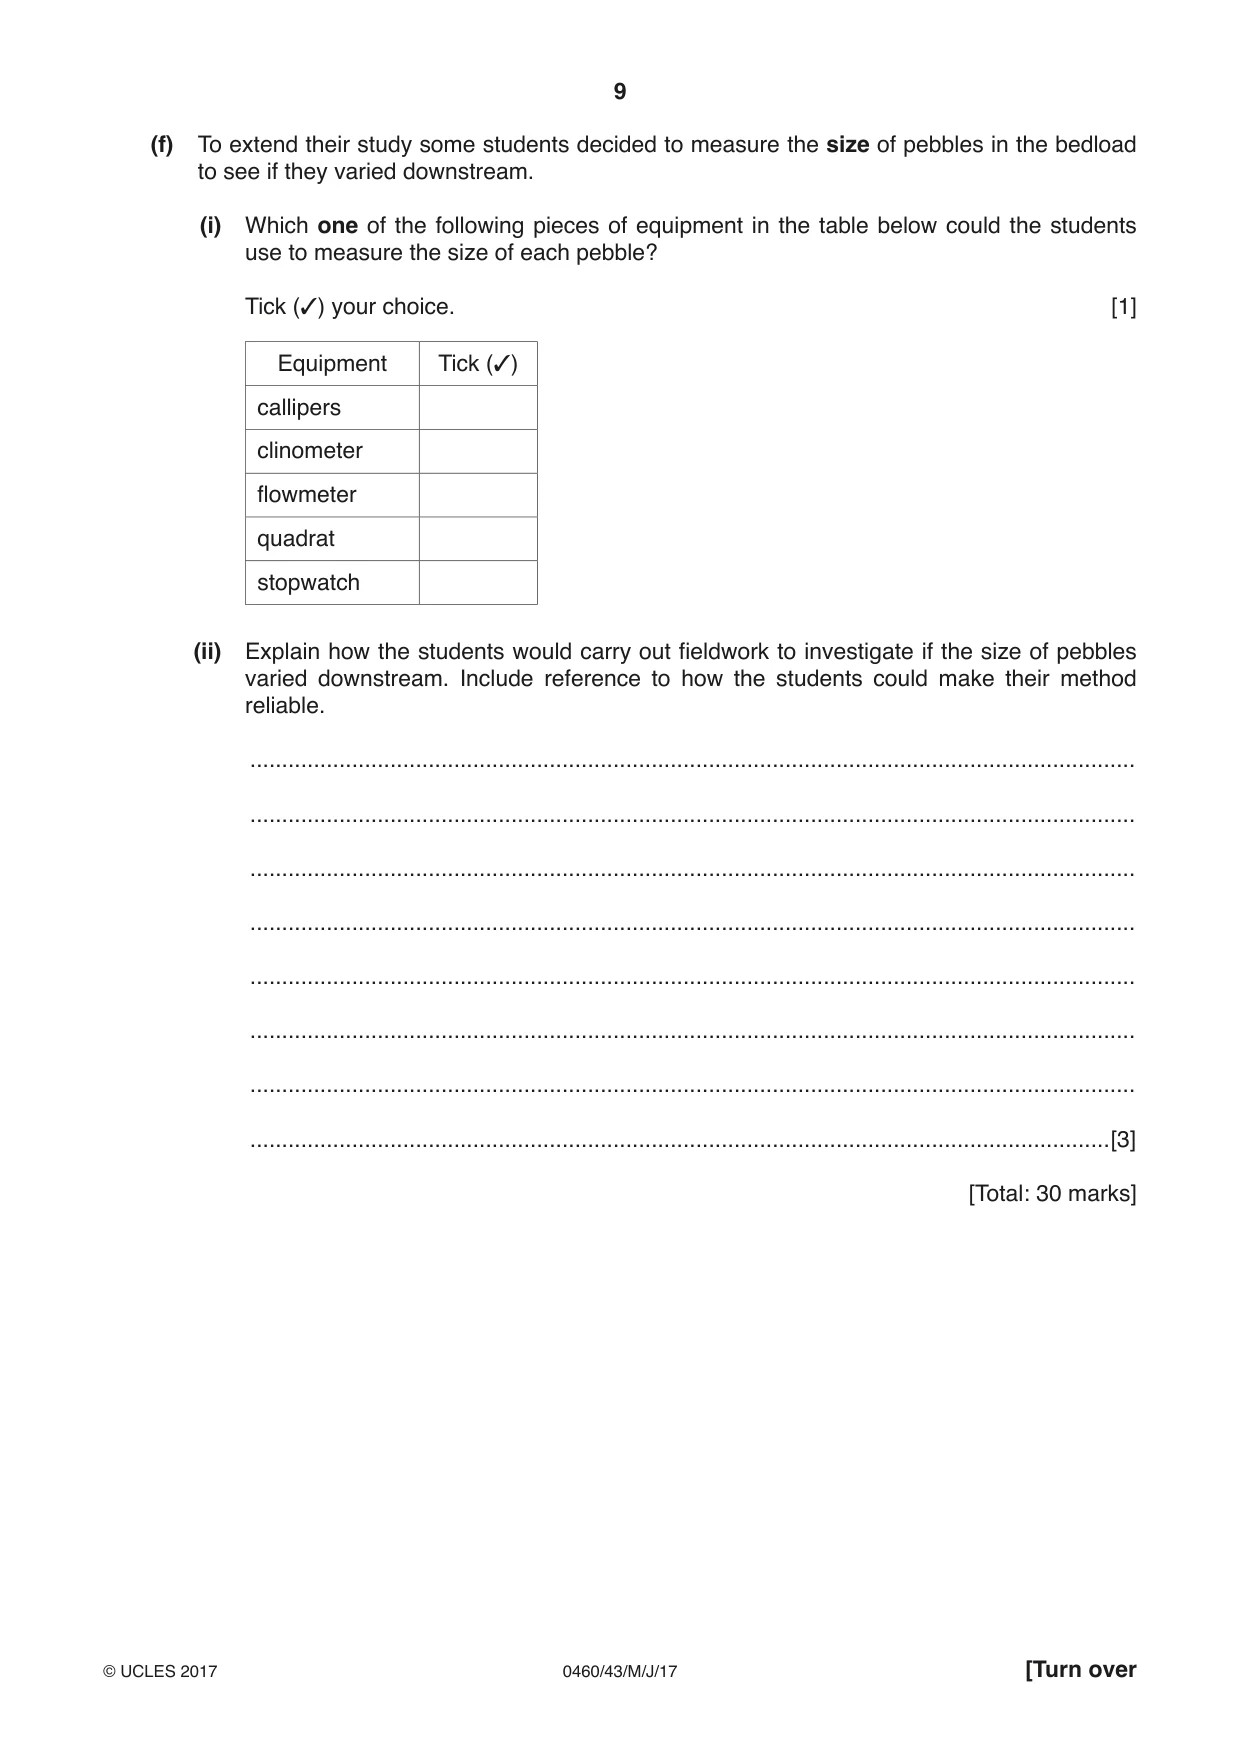
1 Students at a school in south west England did fieldwork on a river which flows from Dartmoor (an upland area). The river and the five fieldwork sites are shown on Fig. 1 (Insert). (a) Which two river features are labelled A and B on Fig. 1? Choose from the following: confluence delta flood plain source tributary Feature A .................................................... Feature B .................................................... [2] The students agreed to investigate the following hypotheses: Hypothesis 1: The river becomes wider and deeper downstream. Hypothesis 2: The bedload becomes more rounded downstream. (b) Before they went to do their fieldwork the students did a pilot study at a site on a local stream. Suggest two advantages of doing a pilot study. 1 ................................................................................................................................................ ................................................................................................................................................... 2 ................................................................................................................................................ ...............................................................................................................................................[2] (c) To investigate Hypothesis 1, the students measured the width of the river channel and the depth of the river at points across the channel. Photographs A and B (Insert) show the students doing their fieldwork. Describe how the students made their measurements. width of river channel ................................................................................................................................................... ................................................................................................................................................... ................................................................................................................................................... ................................................................................................................................................... depth of river ................................................................................................................................................... ................................................................................................................................................... ................................................................................................................................................... ...............................................................................................................................................[4] (d) The results of the students’ fieldwork at site 3 are shown in Table 1 below. Table 1 Students’ measurements at site 3 Distance across Depth (m) channel / width (metres) 0.4 0.15 1.7 0.40 2.9 0.50 4.2 0.35 5.4 0.10 (i) Use these results to complete and shade in the cross section of the river channel at site 3 on Fig. 2 opposite. [2] (ii) Which site on Fig. 2 shows a meander? Site ............................ [1] (iii) What conclusion would the students make about Hypothesis 1: The river becomes wider and deeper downstream? Support your answer with data from Fig. 2. ........................................................................................................................................... ........................................................................................................................................... ........................................................................................................................................... ........................................................................................................................................... ........................................................................................................................................... .......................................................................................................................................[3] Cross sections of the river channel Site 1 0 depth 0.5(metres) 1 0 1 width (metres) Site 2 Key 0 depth 0.5(metres) river channel 1 0 1 2 3 width (metres) Site 3 0 depth 0.5(metres) 1 0 1 2 3 4 5 width (metres) Site 4 0 depth 0.5(metres) 1 0 1 2 3 4 5 6 7 8 9 width (metres) Site 5 0 depth 0.5(metres) 1 0 1 2 3 4 5 6 7 8 9 10 11 12 width (metres) Fig. 2 (e) To investigate Hypothesis 2: The bedload becomes more rounded downstream, the students selected 20 pebbles at random from the bed of the river at each site. They then measured the roundness of the pebbles by comparing them with the Power’s Scale of Roundness which is shown in Fig. 3 (Insert). (i) Suggest one problem of using the Power’s scale to measure roundness. ........................................................................................................................................... .......................................................................................................................................[1] (ii) Suggest two weaknesses of selecting pebbles at random. 1 ........................................................................................................................................ ........................................................................................................................................... 2 ........................................................................................................................................ .......................................................................................................................................[2] (iii) The students’ results are shown in Table 2 (Insert). Use these results to complete the divided bar graph for site 2 in Fig. 4 below. [3] Students’ results of measuring pebble roundness 20 20 19 19 18 18 17 17 16 16 15 15 14 14 13 13 12 12 11 11 number of number of 10 10 pebbles pebbles 9 9 8 8 7 7 6 6 5 5 4 4 3 3 2 2 1 1 0 0 site 1 site 2 site 3 site 4 site 5 Key very angular slightly slightly rounded very angular angular rounded rounded Fig. 4 (iv) One student gave a score to each category in the Power’s Scale. He then multiplied this score by the number of pebbles in the category (shown in Table 2). The results of his work are shown in Table 3 below. Calculate the results for site 4 to complete the table. [1] Table 3 Site Score given to each description very slightly slightly very angular rounded Total angular angular rounded rounded (score = 5) (score = 2) score (score = 6) (score = 4) (score = 3) (score = 1) 1 36 30 16 12 0 0 94 2 54 20 24 3 0 0 101 3 0 10 12 36 4 1 63 4 52 5 0 10 16 27 10 0 63 (v) The students decided that Hypothesis 2: The bedload becomes more rounded downstream was partly true. Use evidence from Fig. 4 and Tables 2 and 3 to explain why they reached this conclusion. ........................................................................................................................................... ........................................................................................................................................... ........................................................................................................................................... ........................................................................................................................................... ........................................................................................................................................... .......................................................................................................................................[3] (vi) Explain why pebbles (bedload) generally become more rounded downstream. ........................................................................................................................................... ........................................................................................................................................... ........................................................................................................................................... .......................................................................................................................................[2] (f) To extend their study some students decided to measure the size of pebbles in the bedload to see if they varied downstream. (i) Which one of the following pieces of equipment in the table below could the students use to measure the size of each pebble? Tick (✓) your choice. [1] Equipment Tick (✓) callipers clinometer flowmeter quadrat stopwatch (ii) Explain how the students would carry out fieldwork to investigate if the size of pebbles varied downstream. Include reference to how the students could make their method reliable. ........................................................................................................................................... ........................................................................................................................................... ........................................................................................................................................... ........................................................................................................................................... ........................................................................................................................................... ........................................................................................................................................... ........................................................................................................................................... .......................................................................................................................................[3] [Total: 30 marks]
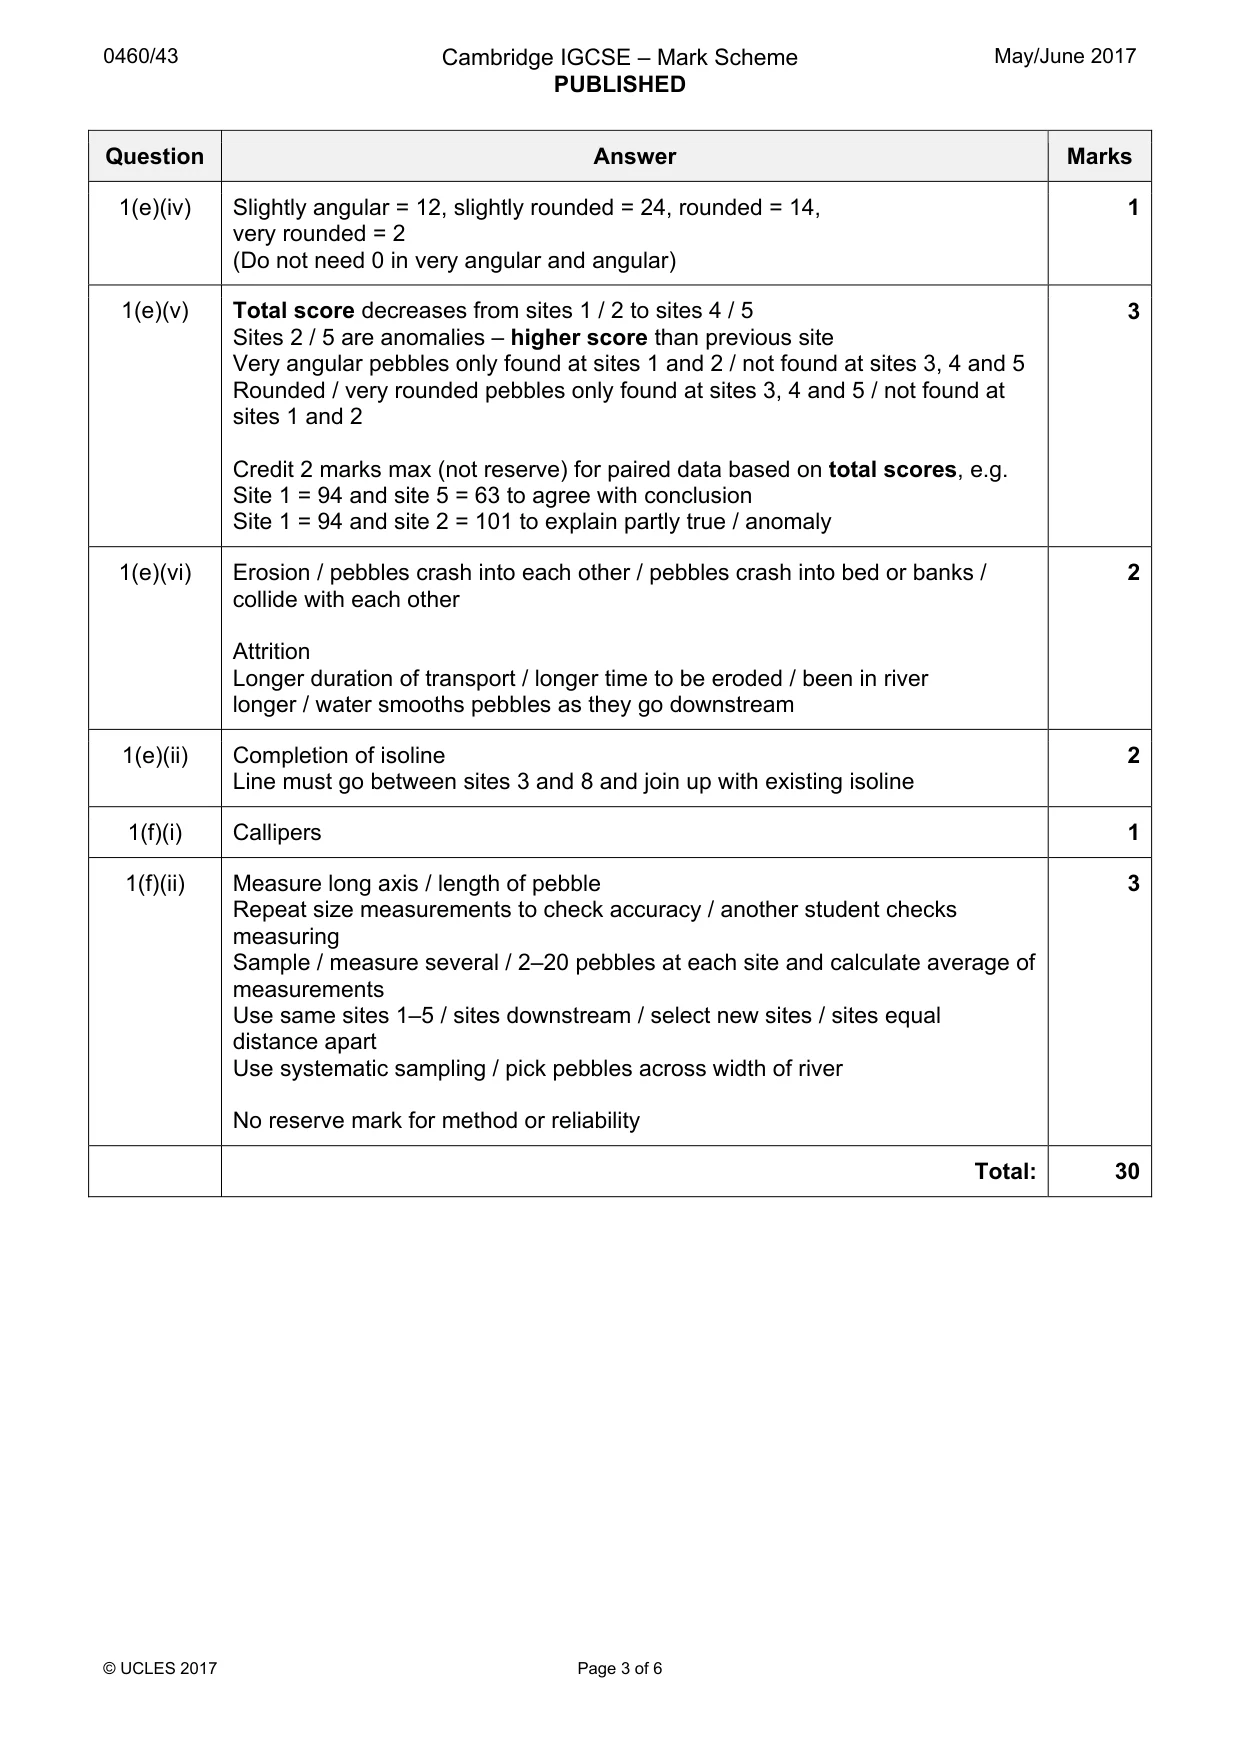
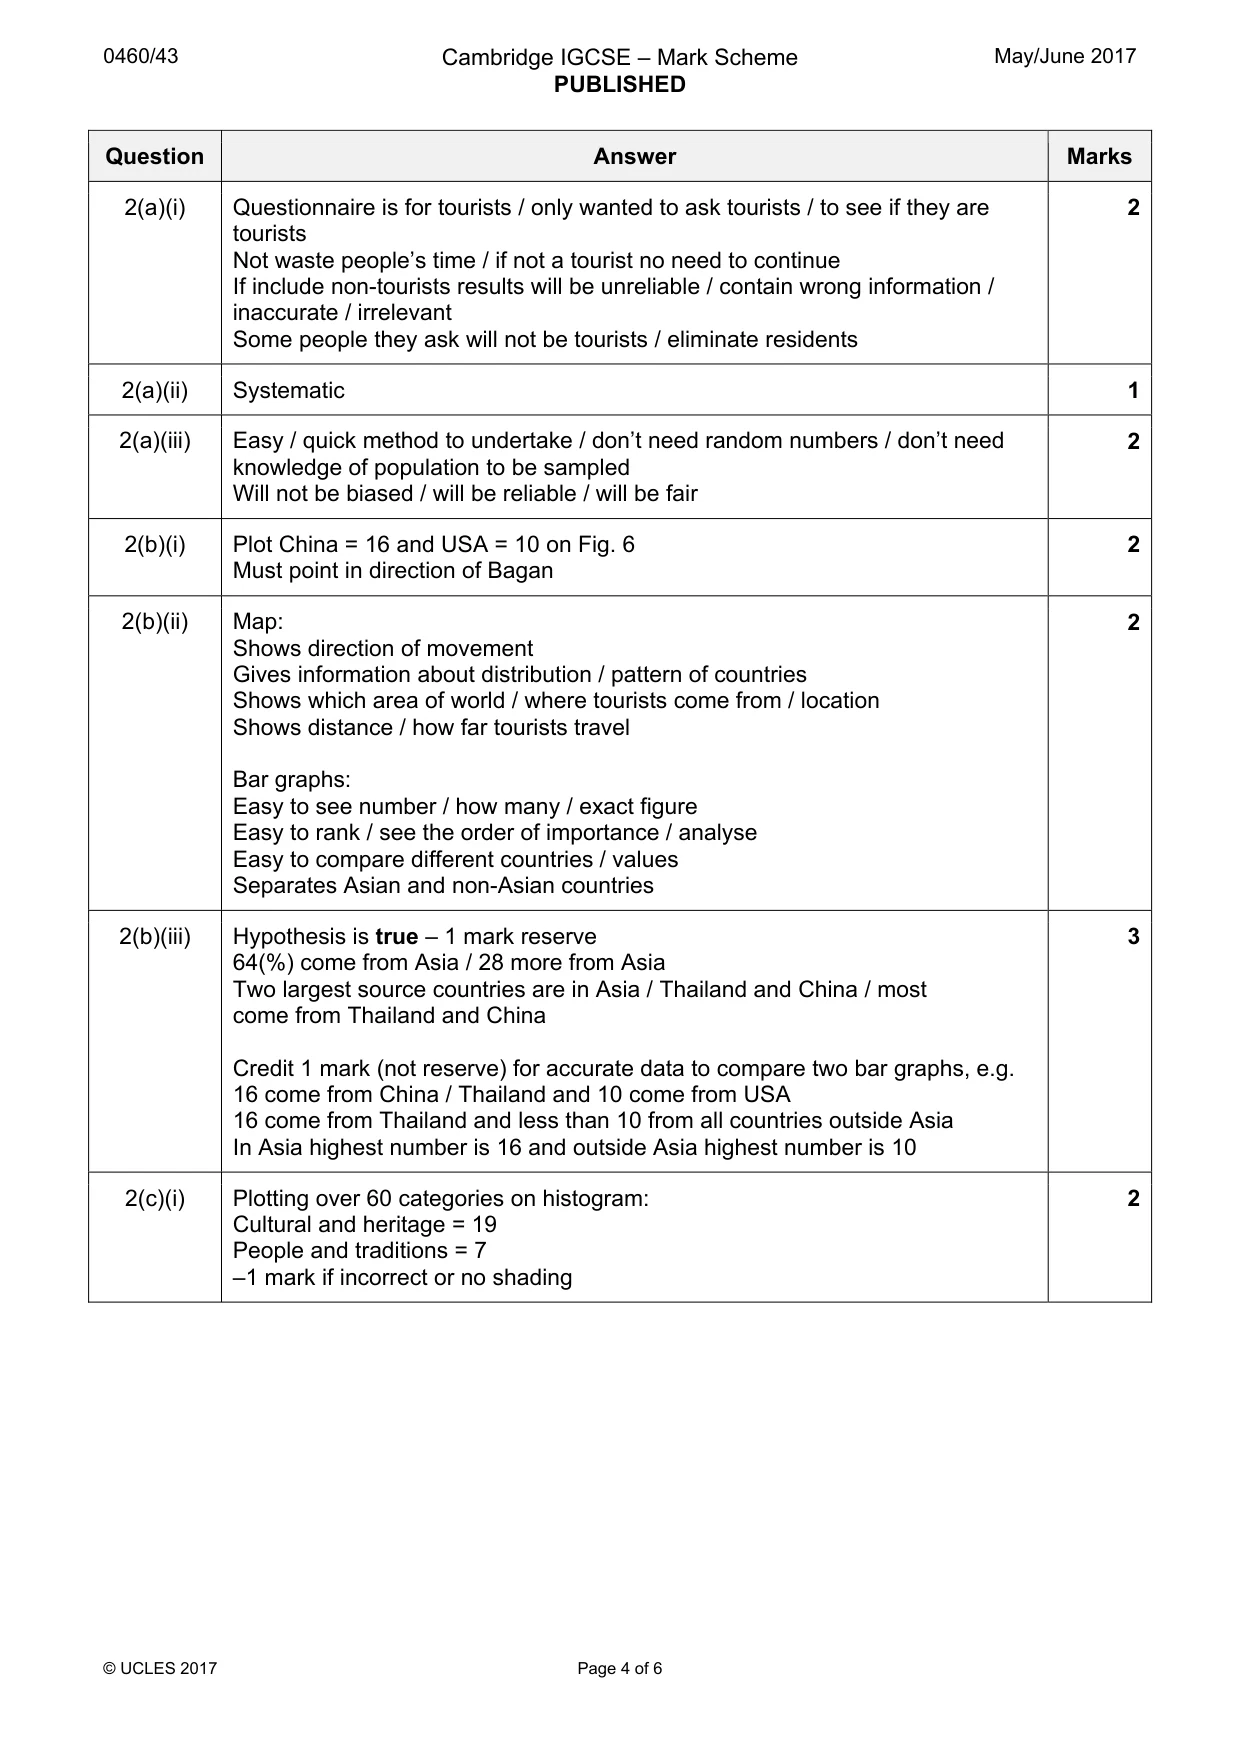
Mark scheme: Question Answer Marks 1(a)(i) A: source 2 B: confluence 1(b) Agree methodology on what measurements to take 2 Find out what doesn’t work / change it / avoid mistakes Practise fieldwork techniques / learn how to do Test / learn how to use equipment Experience of working as a team / team organisation Find out how long to allocate each task 1(c) Width of channel: 4 Stretch tape measure across river / from bank to bank / side to side Keep tape measure taut / horizontal / stretched / tight Measure perpendicular / at right angles to banks / straight across / directly opposite Measure where tape touches the bank Depth of river: Rest ruler on river bed / bottom Measure vertically / perpendicular to surface Measure where water level is / wet part of ruler Measure at equal points / 25–30 cm across channel 1(d)(i) Completion of cross section and shading 2 0.5 m at 2.9 m, 0.35 m at 4.2 m 1 mark for each plot and no credit for shading 1(d)(ii) Site 4 1 1(d)(iii) Hypothesis is true / partially true / mainly true / except for – 1 mark reserve 3 (3HA) If true – no credit for anomaly If partially true – reserve 1 mark for anomaly Two marks for supporting data – need 2 site numbers and 2 measurements Wider: 1.2 m at site 1 to 12.4 m at site 5 / increases by 11.2 m (credit any 2 sites) Deeper: 0.2 m at site 1 to 0.6 m at site 5 / increases by 0.4 m (credit any 2 sites) Anomaly between sites 4 and 5 – depth is 0.9 m at site 4 and 0.6 m at site 5 1(e)(i) Classification is subjective / based on student judgement 1 Classes of pebbles are very similar / hard to distinguish between classes 1(e)(ii) Pebbles selected may not be typical of the pebbles at that site / bigger 2 than other pebbles / smaller than other pebbles / anomalies / not representative All pebbles may have been taken from same area of river bed / not across river channel / areas missed out Not a fair / reliable sample / bias / student preference 1(e)(iii) Completion of divided bar graph for site 2: 3 Very angular = 9, angular = 4, slightly angular = 6, slightly rounded = 1 2 marks for dividing lines, 1 mark for shading 1(e)(iv) Slightly angular = 12, slightly rounded = 24, rounded = 14, 1 very rounded = 2 (Do not need 0 in very angular and angular) 1(e)(v) Total score decreases from sites 1 / 2 to sites 4 / 5 3 Sites 2 / 5 are anomalies – higher score than previous site Very angular pebbles only found at sites 1 and 2 / not found at sites 3, 4 and 5 Rounded / very rounded pebbles only found at sites 3, 4 and 5 / not found at sites 1 and 2 Credit 2 marks max (not reserve) for paired data based on total scores, e.g. Site 1 = 94 and site 5 = 63 to agree with conclusion Site 1 = 94 and site 2 = 101 to explain partly true / anomaly 1(e)(vi) Erosion / pebbles crash into each other / pebbles crash into bed or banks / 2 collide with each other Attrition Longer duration of transport / longer time to be eroded / been in river longer / water smooths pebbles as they go downstream 1(e)(ii) Completion of isoline 2 Line must go between sites 3 and 8 and join up with existing isoline 1(f)(i) Callipers 1 1(f)(ii) Measure long axis / length of pebble 3 Repeat size measurements to check accuracy / another student checks measuring Sample / measure several / 2–20 pebbles at each site and calculate average of measurements Use same sites 1–5 / sites downstream / select new sites / sites equal distance apart Use systematic sampling / pick pebbles across width of river No reserve mark for method or reliability Total: 30
Q2 · A group of students carried out fieldwork about tourism in Bagan, a city which is a major…
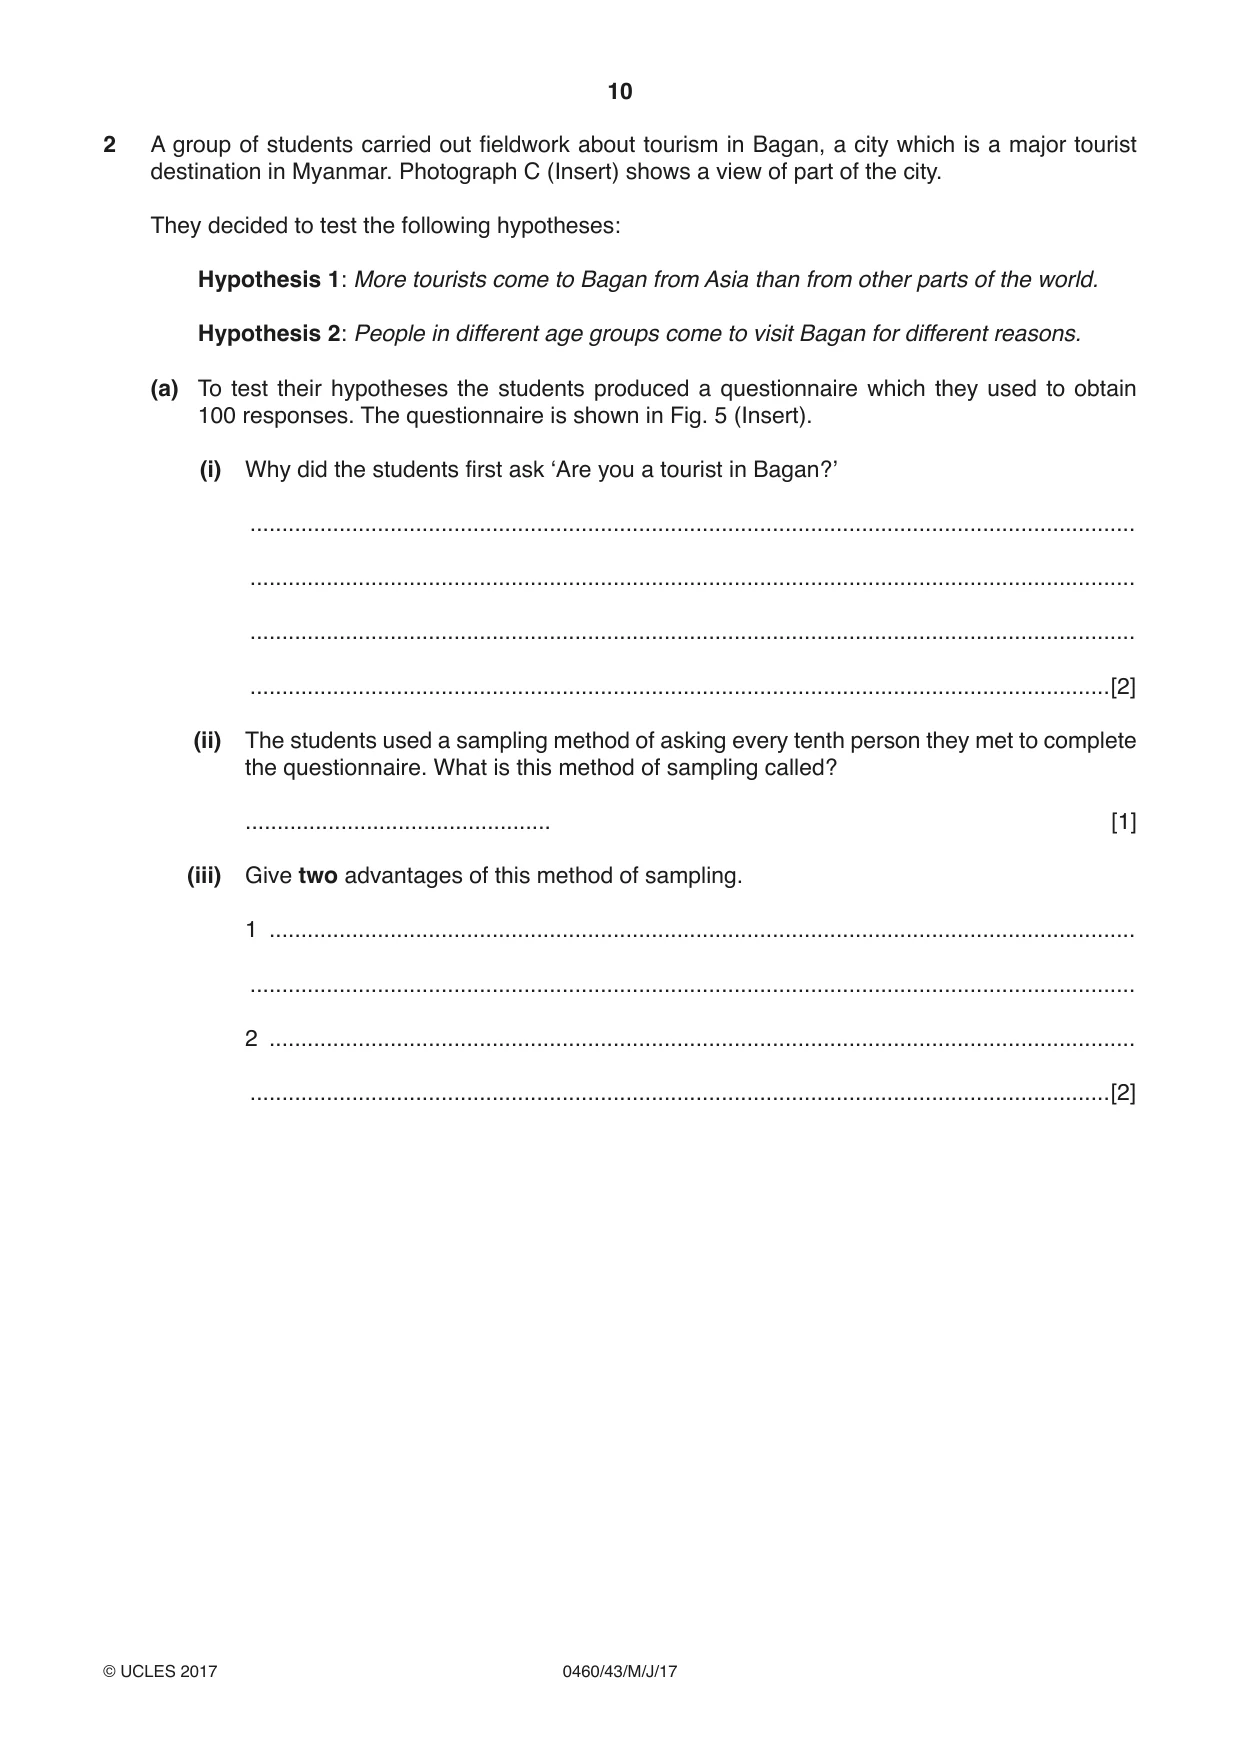
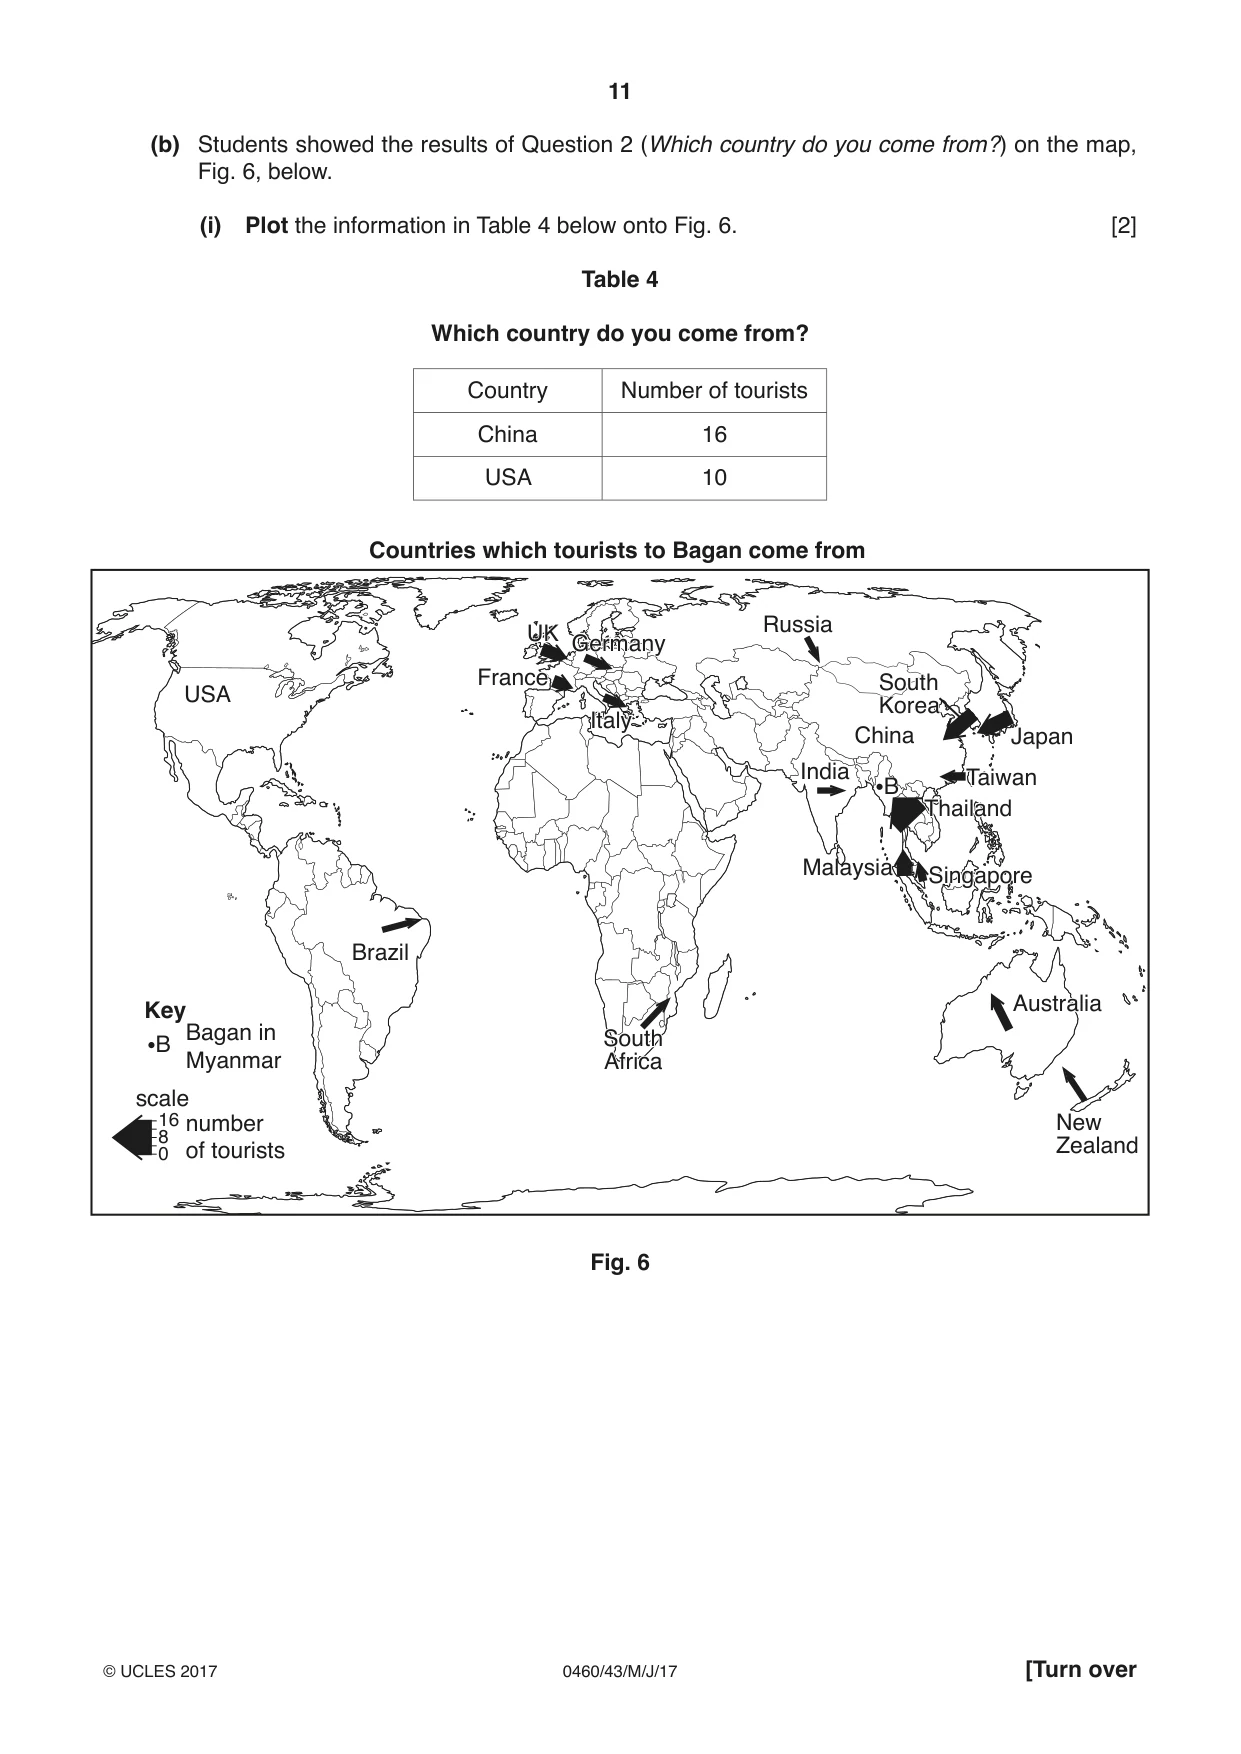
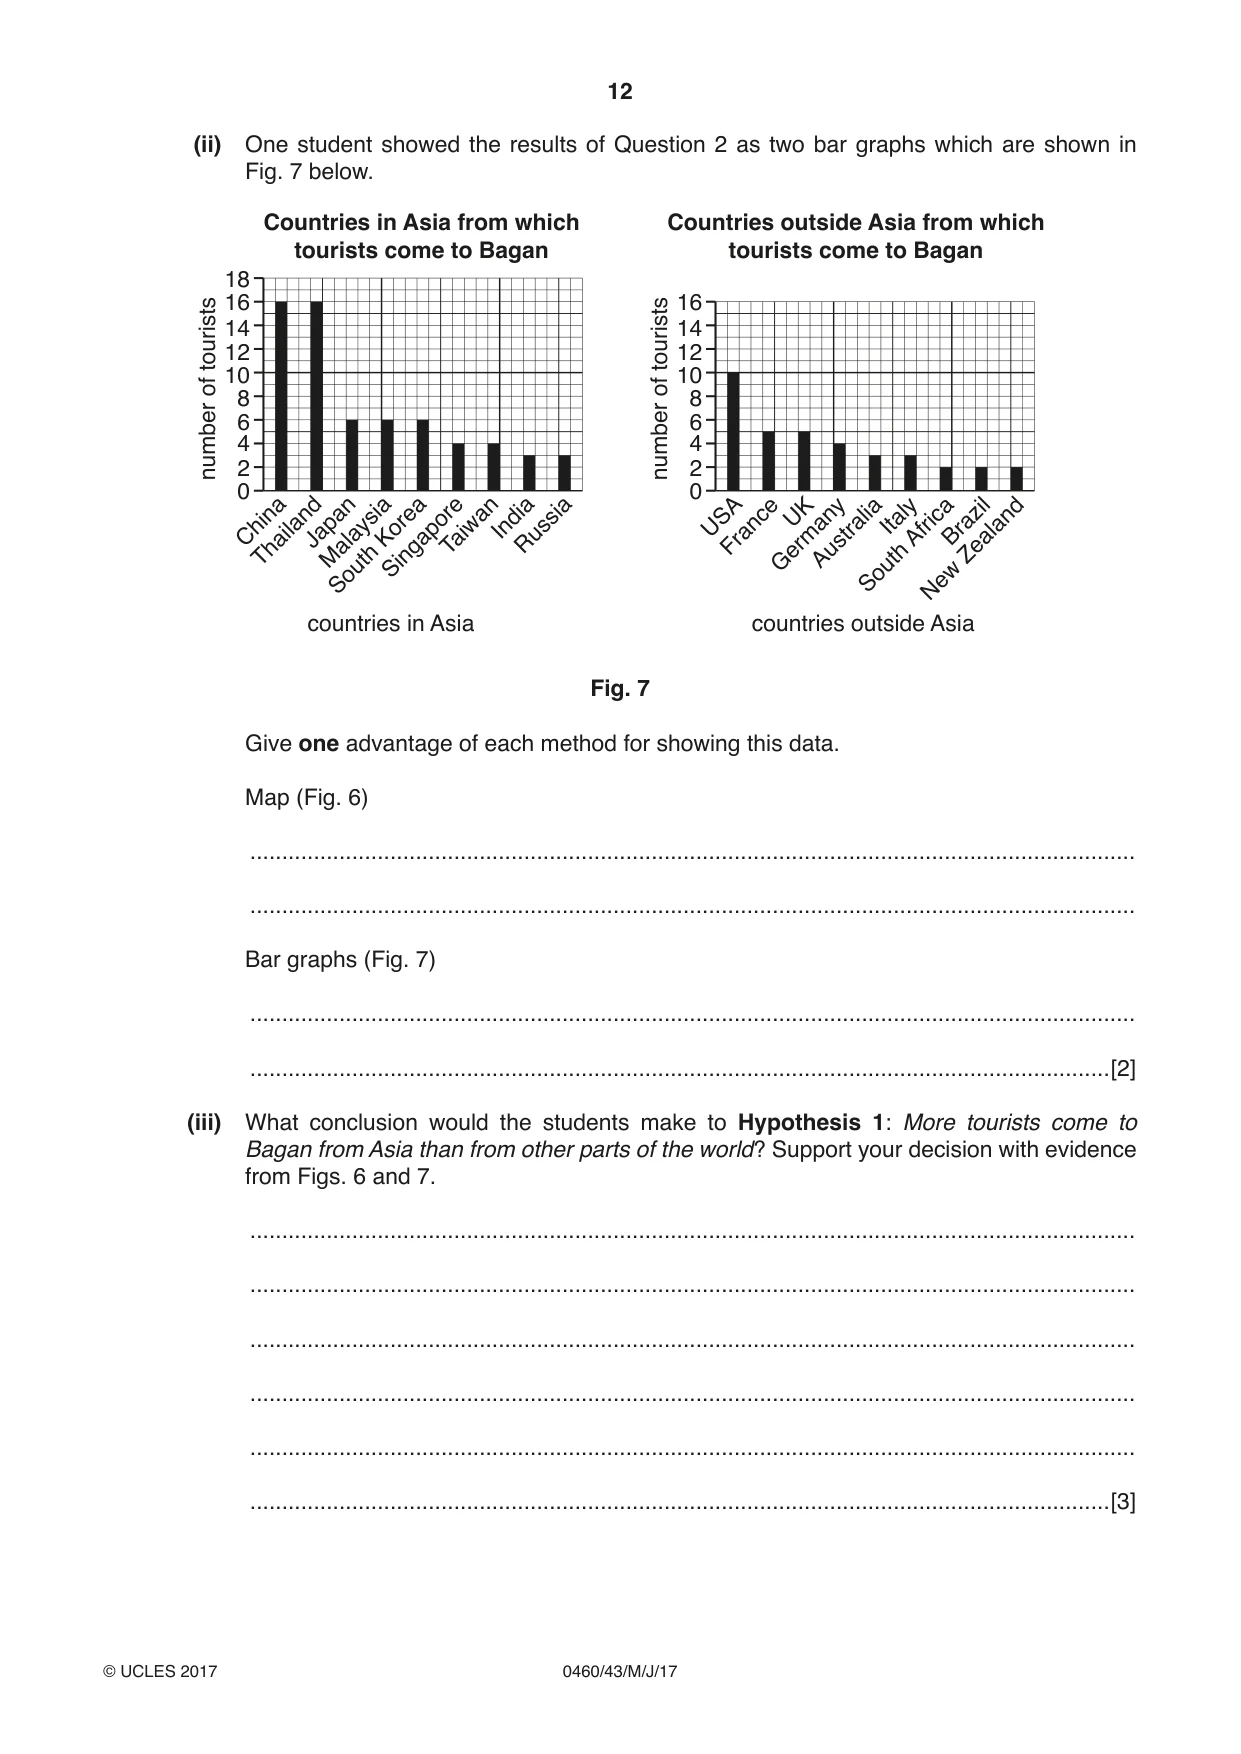
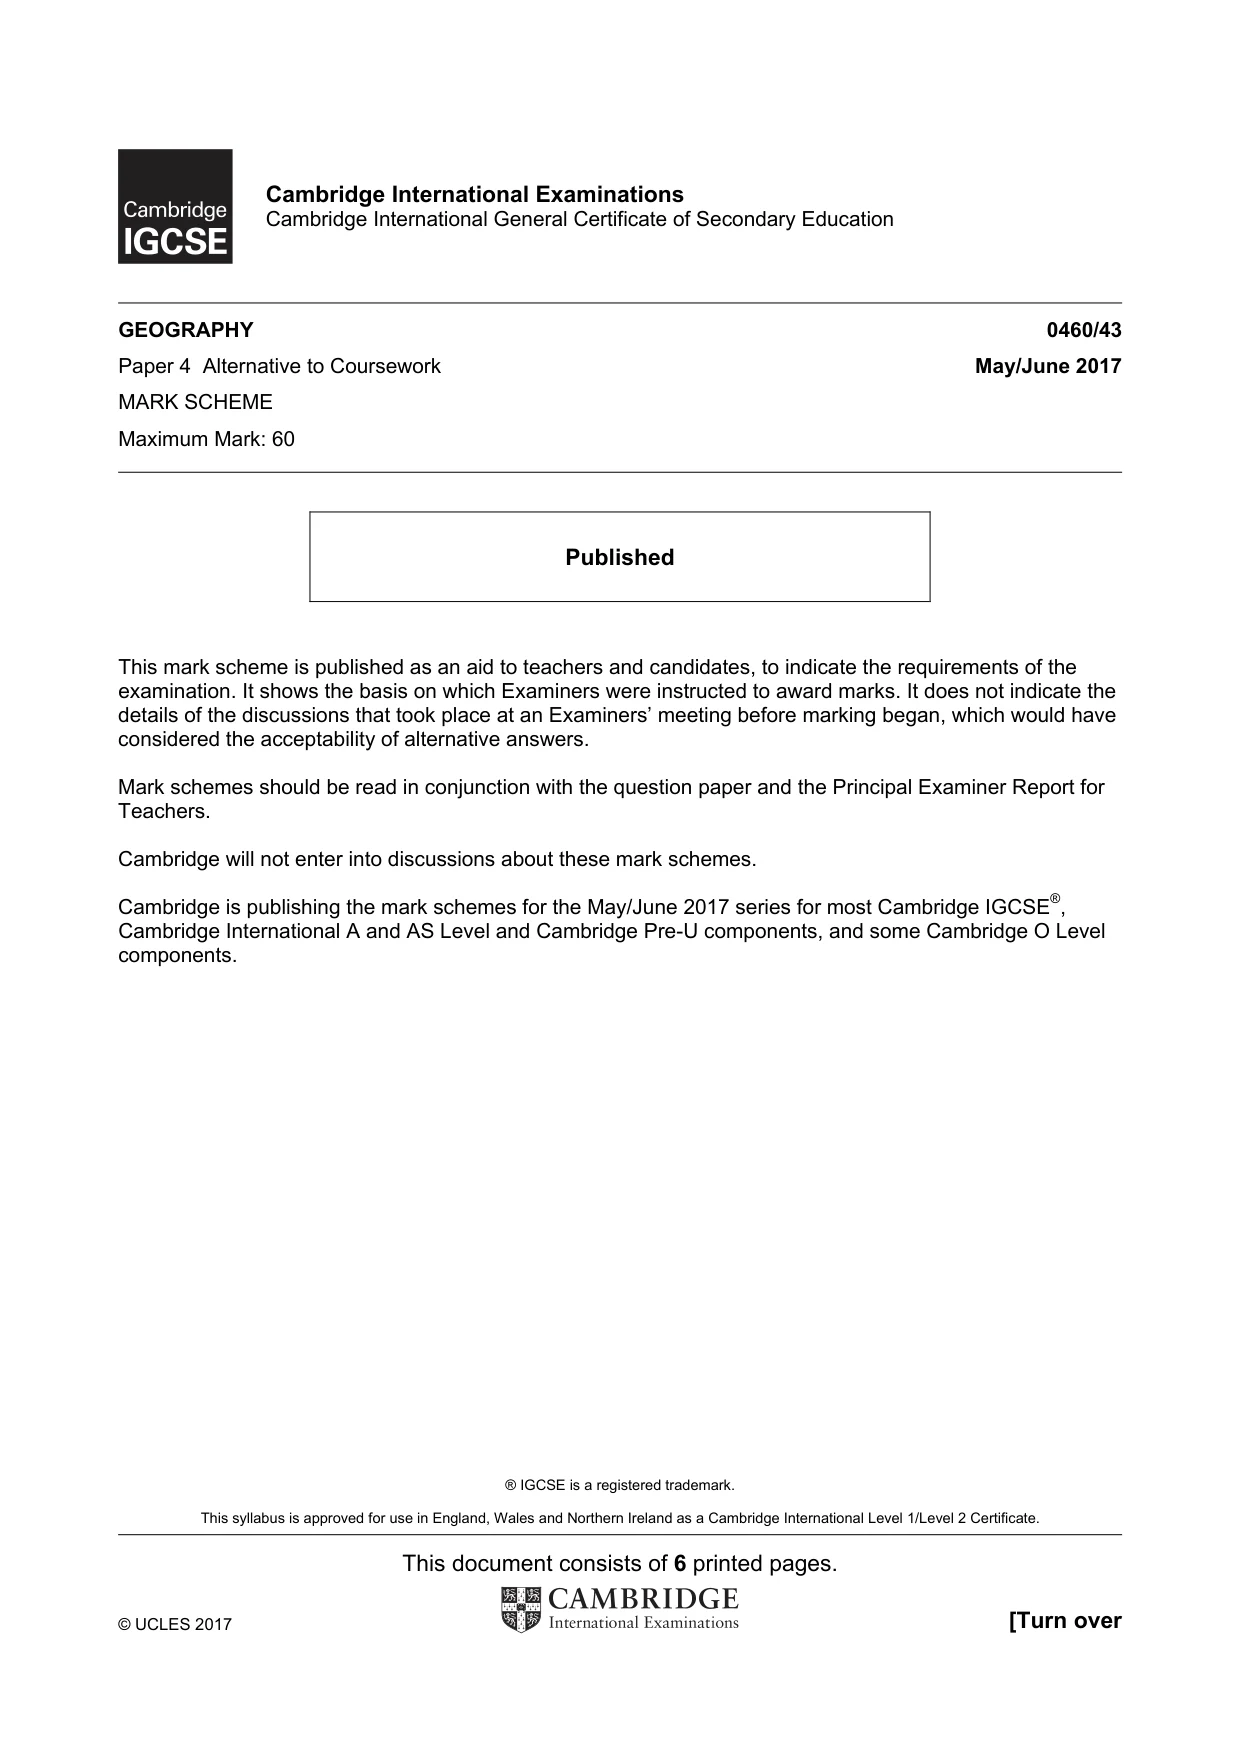
2 A group of students carried out fieldwork about tourism in Bagan, a city which is a major tourist destination in Myanmar. Photograph C (Insert) shows a view of part of the city. They decided to test the following hypotheses: Hypothesis 1: More tourists come to Bagan from Asia than from other parts of the world. Hypothesis 2: People in different age groups come to visit Bagan for different reasons. (a) To test their hypotheses the students produced a questionnaire which they used to obtain 100 responses. The questionnaire is shown in Fig. 5 (Insert). (i) Why did the students first ask ‘Are you a tourist in Bagan?’ ........................................................................................................................................... ........................................................................................................................................... ........................................................................................................................................... .......................................................................................................................................[2] (ii) The students used a sampling method of asking every tenth person they met to complete the questionnaire. What is this method of sampling called? ................................................ [1] (iii) Give two advantages of this method of sampling. 1 ........................................................................................................................................ ........................................................................................................................................... 2 ........................................................................................................................................ .......................................................................................................................................[2] (b) Students showed the results of Question 2 (Which country do you come from?) on the map, Fig. 6, below. (i) Plot the information in Table 4 below onto Fig. 6. [2] Table 4 Which country do you come from? Country Number of tourists China 16 USA 10 Countries which tourists to Bagan come from Russia UK Germany France South USA Korea Italy China Japan India Taiwan B Thailand Malaysia Singapore Brazil Key Australia Bagan in South B Myanmar Africa scale 16 number New 8 0 of tourists Zealand Fig. 6 (ii) One student showed the results of Question 2 as two bar graphs which are shown in Fig. 7 below. Countries in Asia from which Countries outside Asia from which tourists come to Bagan tourists come to Bagan 18 16 16 14 14 tourists12 tourists12 of10 of10 8 8 6 6 4 4number number 2 2 0 0 ChinaThailandJapanMalaysiaKoreaSingaporeTaiwanIndiaRussia USAFranceGermanyUKAustraliaItalyAfricaBrazilZealand South South New countries in Asia countries outside Asia Fig. 7 Give one advantage of each method for showing this data. Map (Fig. 6) ........................................................................................................................................... ........................................................................................................................................... Bar graphs (Fig. 7) ........................................................................................................................................... .......................................................................................................................................[2] (iii) What conclusion would the students make to Hypothesis 1: More tourists come to Bagan from Asia than from other parts of the world? Support your decision with evidence from Figs. 6 and 7. ........................................................................................................................................... ........................................................................................................................................... ........................................................................................................................................... ........................................................................................................................................... ........................................................................................................................................... .......................................................................................................................................[3]
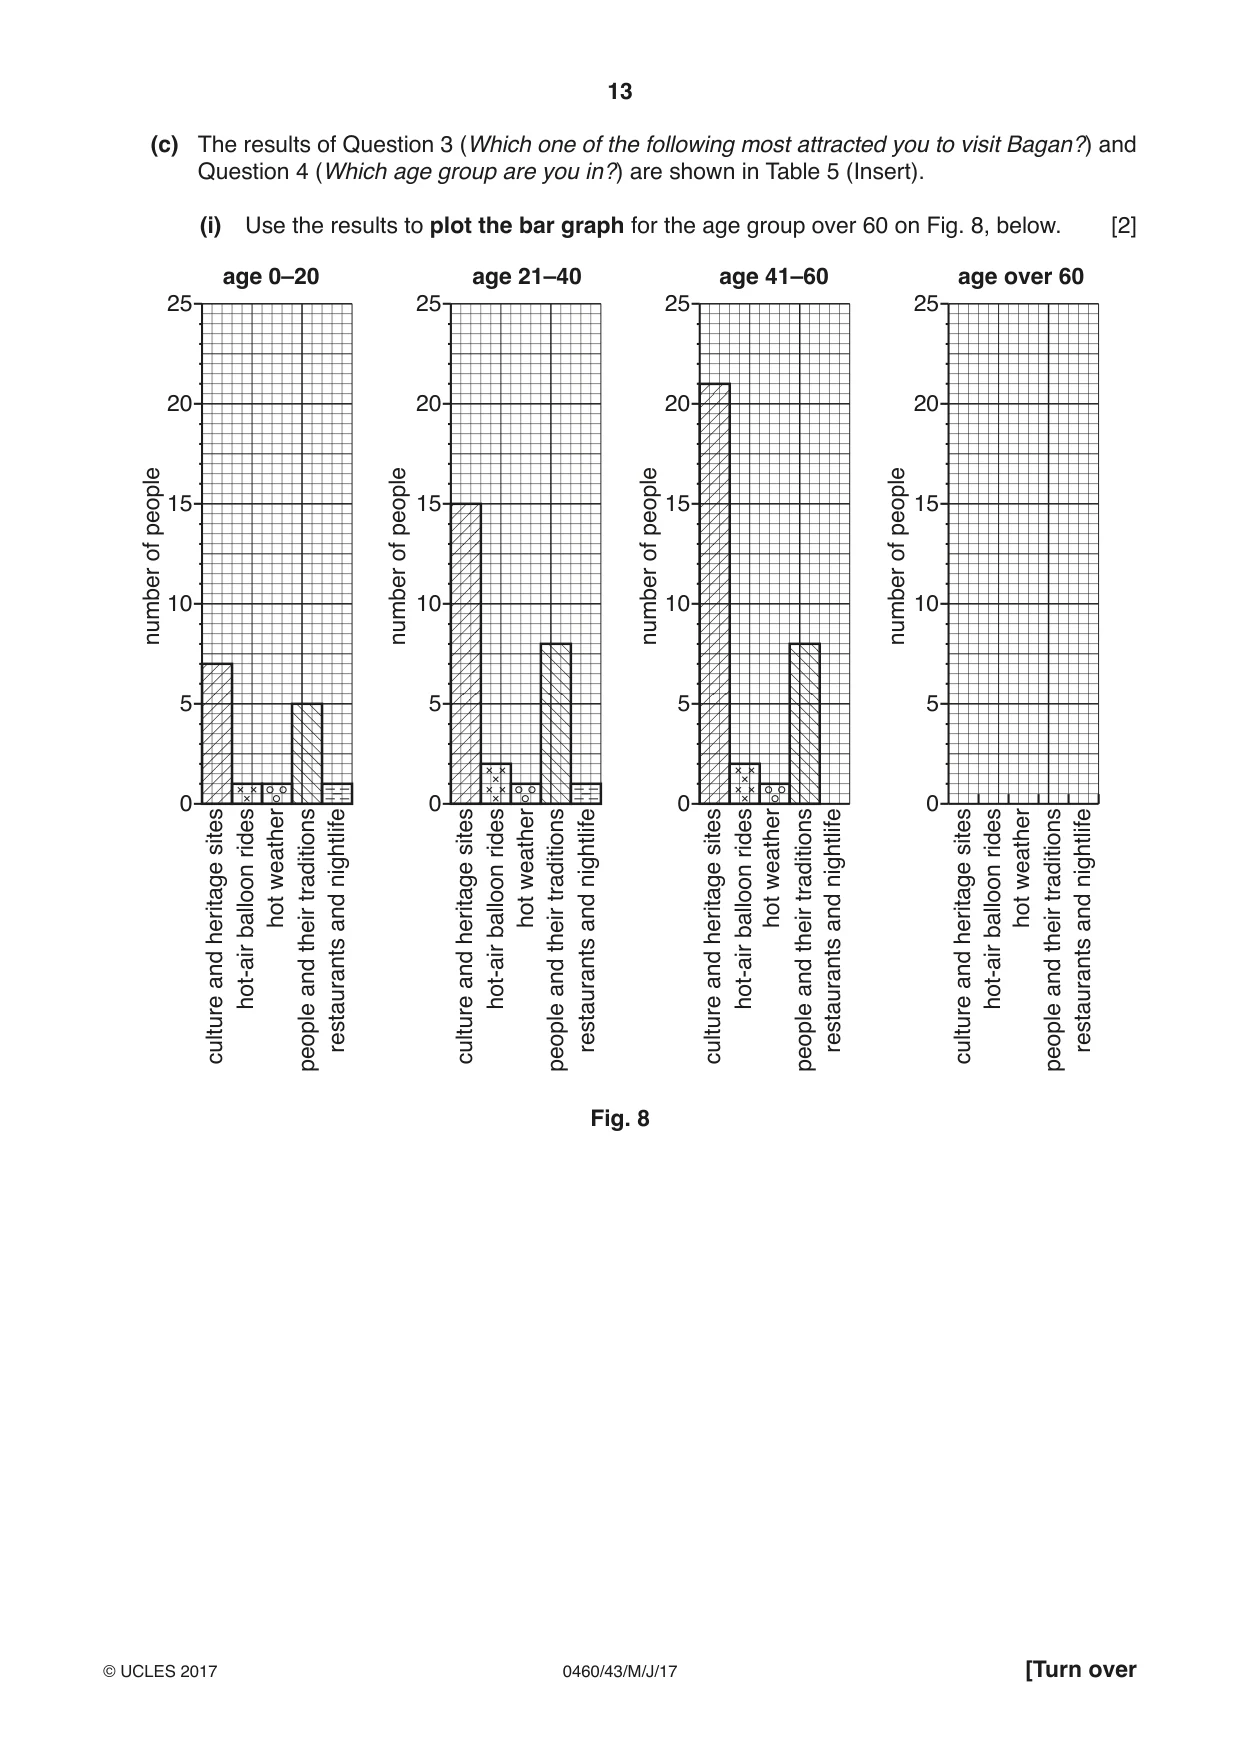
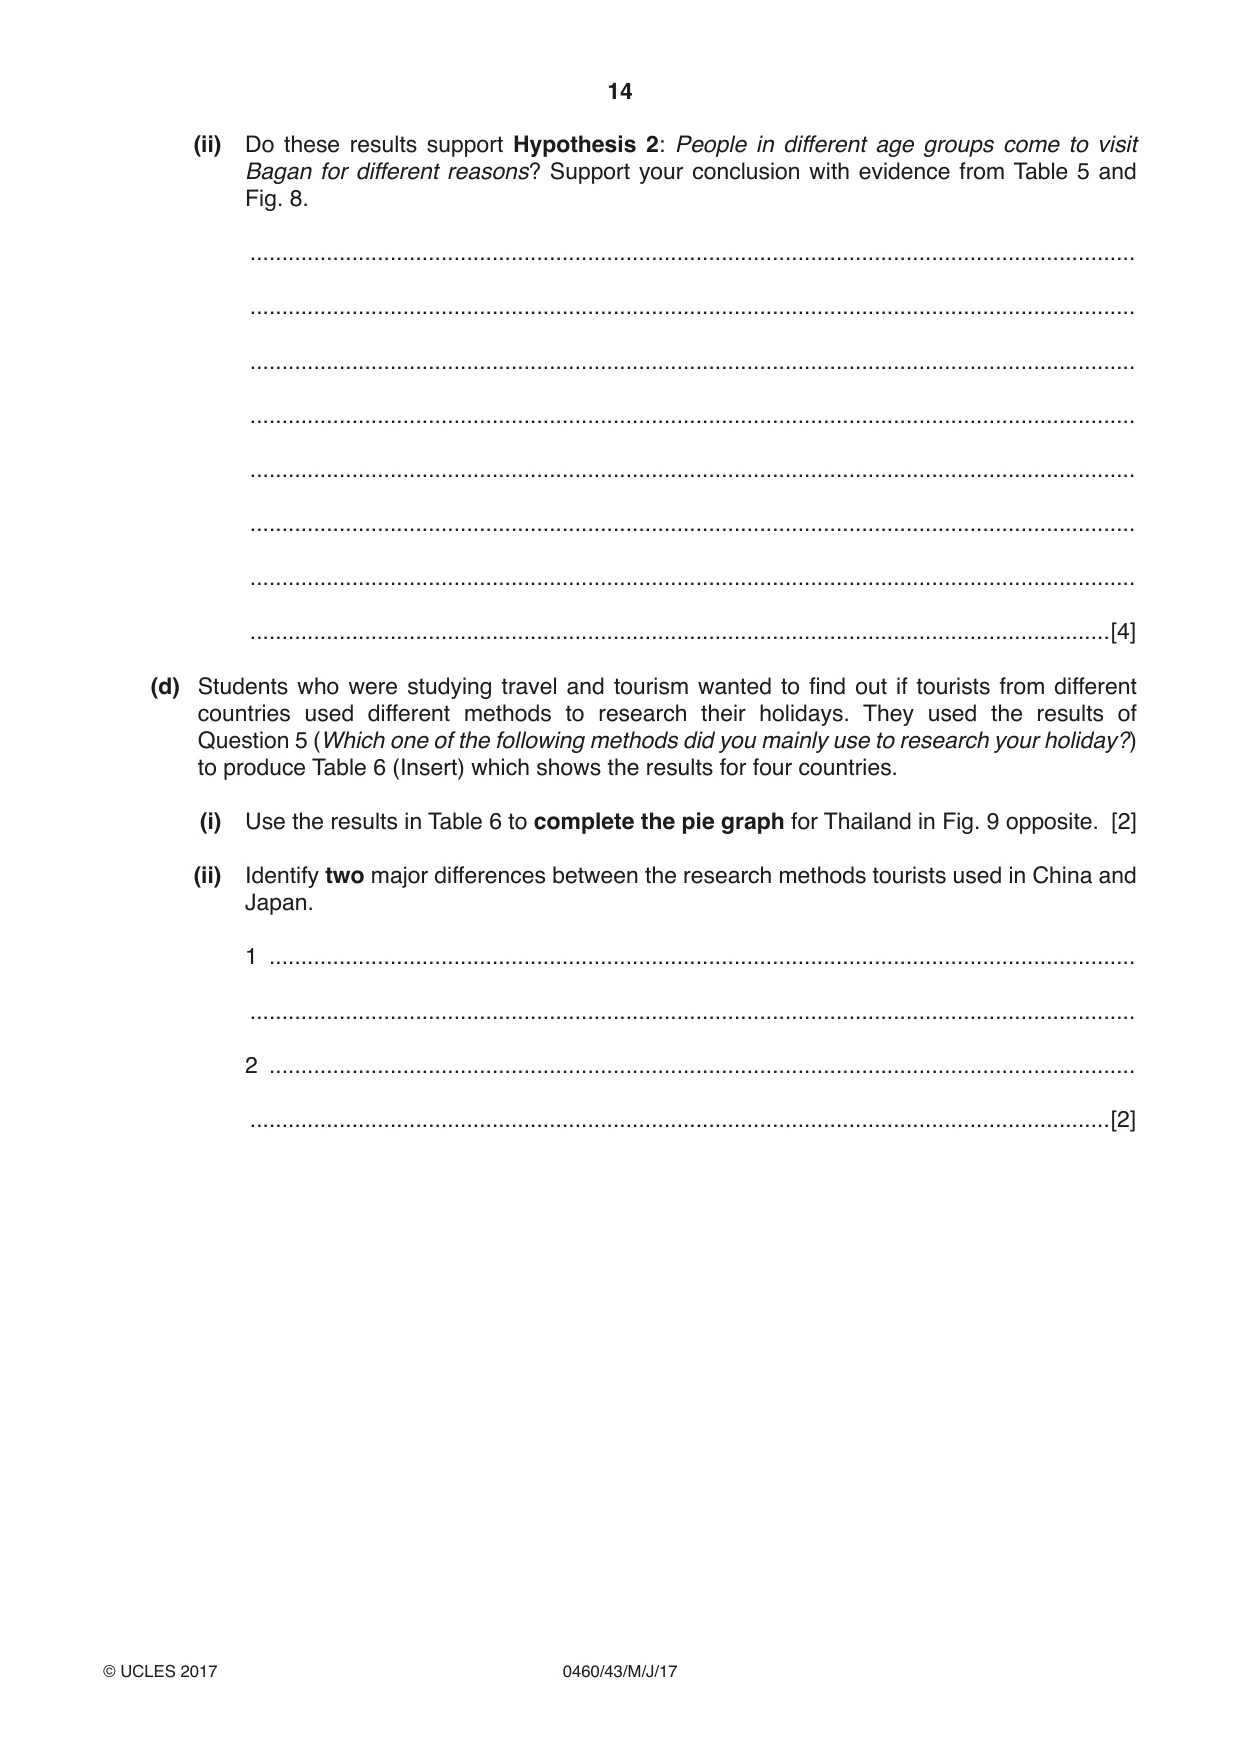
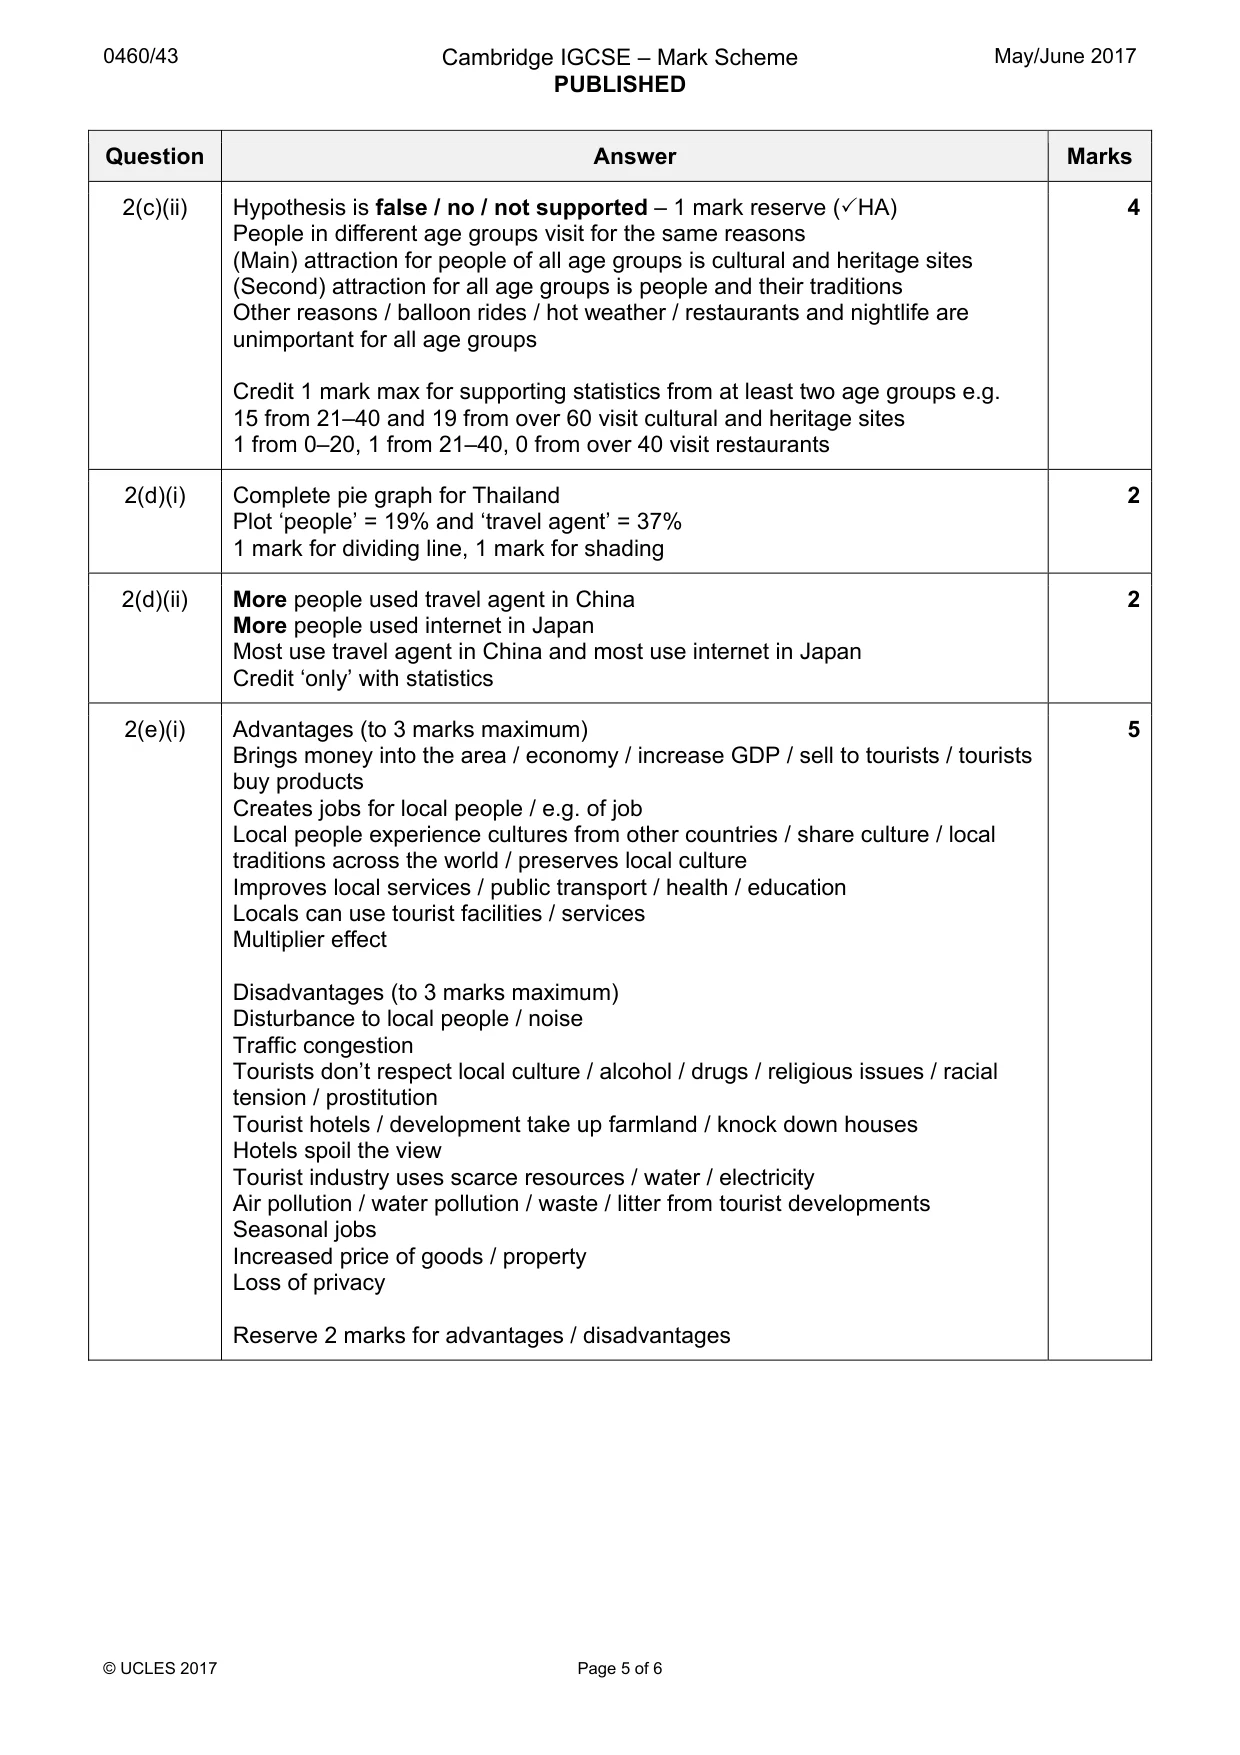
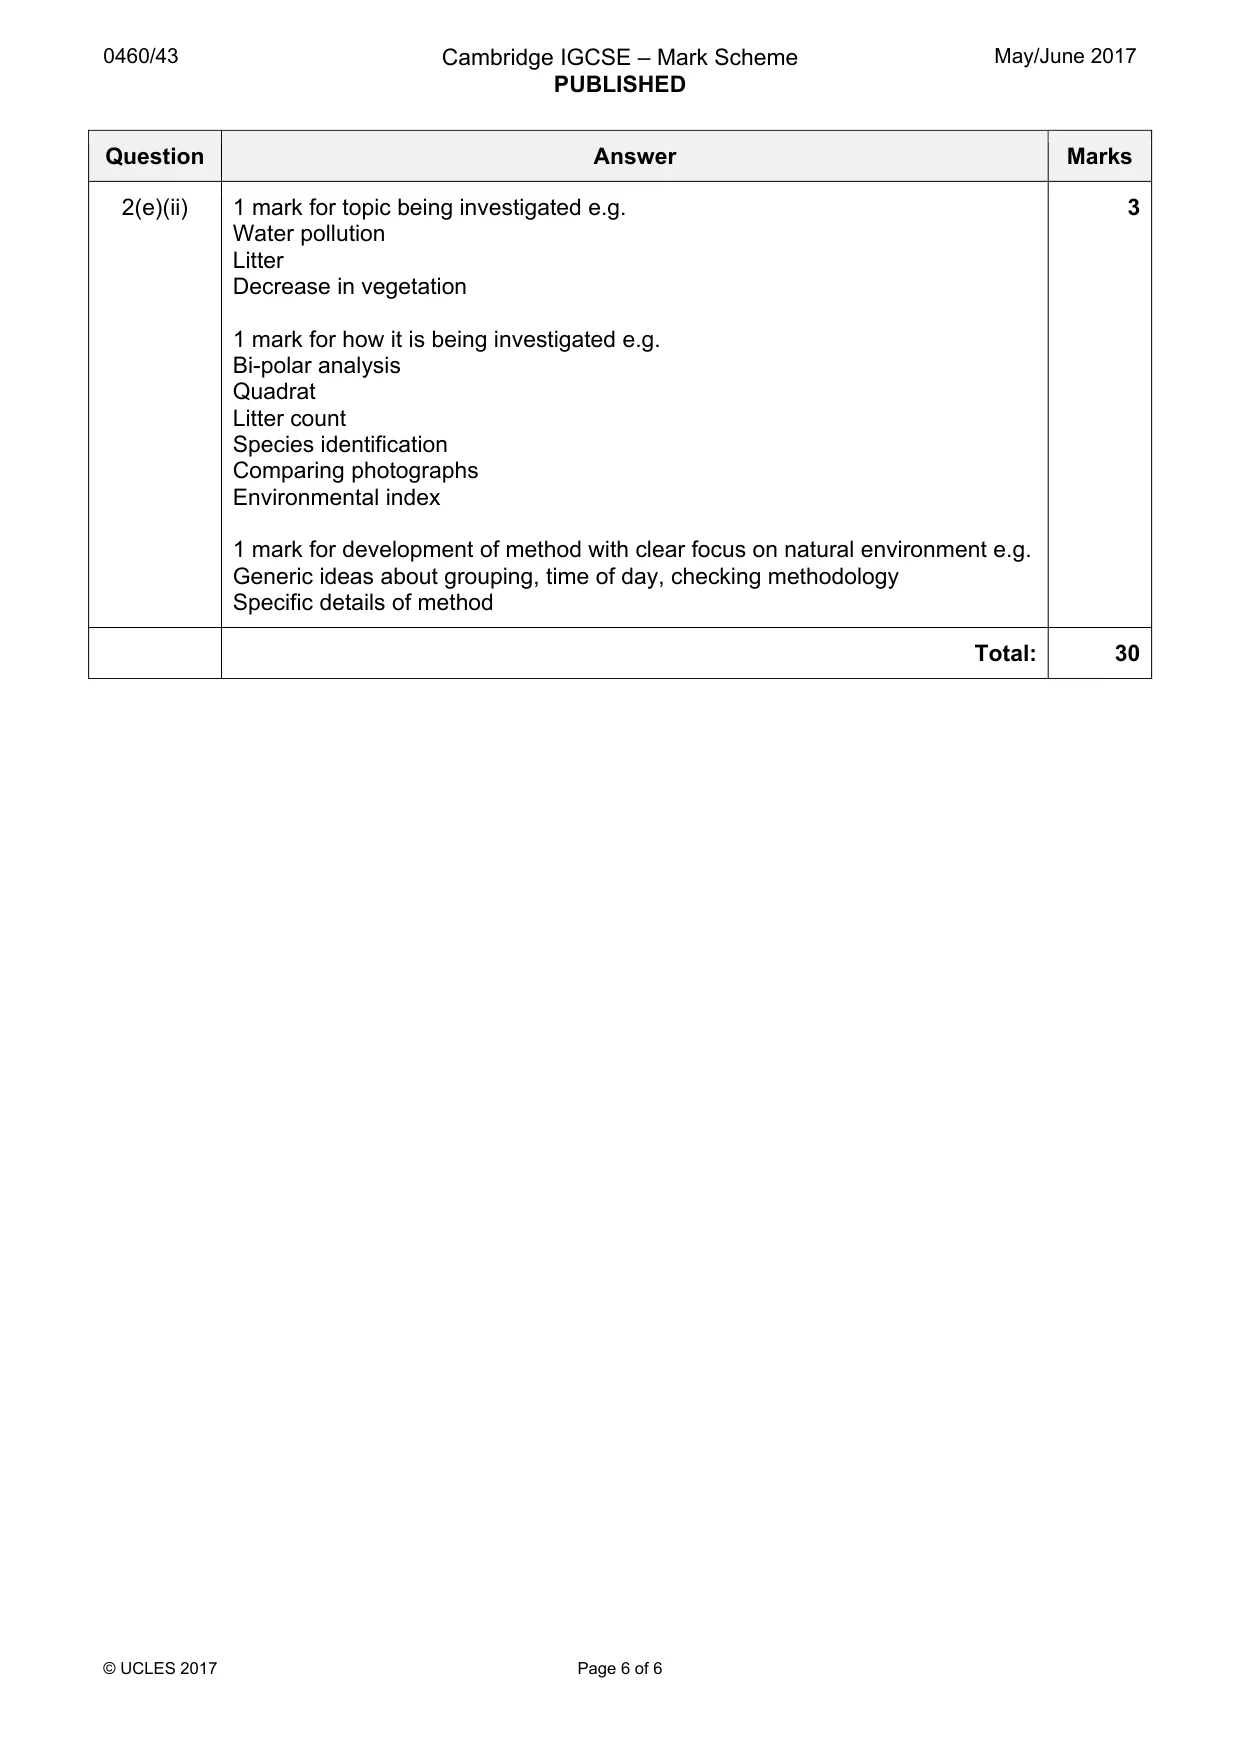
Mark scheme: 2(a)(i) Questionnaire is for tourists / only wanted to ask tourists / to see if they are 2 tourists Not waste people’s time / if not a tourist no need to continue If include non-tourists results will be unreliable / contain wrong information / inaccurate / irrelevant Some people they ask will not be tourists / eliminate residents 2(a)(ii) Systematic 1 2(a)(iii) Easy / quick method to undertake / don’t need random numbers / don’t need 2 knowledge of population to be sampled Will not be biased / will be reliable / will be fair 2(b)(i) Plot China = 16 and USA = 10 on Fig. 6 2 Must point in direction of Bagan 2(b)(ii) Map: 2 Shows direction of movement Gives information about distribution / pattern of countries Shows which area of world / where tourists come from / location Shows distance / how far tourists travel Bar graphs: Easy to see number / how many / exact figure Easy to rank / see the order of importance / analyse Easy to compare different countries / values Separates Asian and non-Asian countries 2(b)(iii) Hypothesis is true – 1 mark reserve 3 64(%) come from Asia / 28 more from Asia Two largest source countries are in Asia / Thailand and China / most come from Thailand and China Credit 1 mark (not reserve) for accurate data to compare two bar graphs, e.g. 16 come from China / Thailand and 10 come from USA 16 come from Thailand and less than 10 from all countries outside Asia In Asia highest number is 16 and outside Asia highest number is 10 2(c)(i) Plotting over 60 categories on histogram: 2 Cultural and heritage = 19 People and traditions = 7 –1 mark if incorrect or no shading 2(c)(ii) Hypothesis is false / no / not supported – 1 mark reserve (3HA) 4 People in different age groups visit for the same reasons (Main) attraction for people of all age groups is cultural and heritage sites (Second) attraction for all age groups is people and their traditions Other reasons / balloon rides / hot weather / restaurants and nightlife are unimportant for all age groups Credit 1 mark max for supporting statistics from at least two age groups e.g. 15 from 21–40 and 19 from over 60 visit cultural and heritage sites 1 from 0–20, 1 from 21–40, 0 from over 40 visit restaurants 2(d)(i) Complete pie graph for Thailand 2 Plot ‘people’ = 19% and ‘travel agent’ = 37% 1 mark for dividing line, 1 mark for shading 2(d)(ii) More people used travel agent in China 2 More people used internet in Japan Most use travel agent in China and most use internet in Japan Credit ‘only’ with statistics 2(e)(i) Advantages (to 3 marks maximum) 5 Brings money into the area / economy / increase GDP / sell to tourists / tourists buy products Creates jobs for local people / e.g. of job Local people experience cultures from other countries / share culture / local traditions across the world / preserves local culture Improves local services / public transport / health / education Locals can use tourist facilities / services Multiplier effect Disadvantages (to 3 marks maximum) Disturbance to local people / noise Traffic congestion Tourists don’t respect local culture / alcohol / drugs / religious issues / racial tension / prostitution Tourist hotels / development take up farmland / knock down houses Hotels spoil the view Tourist industry uses scarce resources / water / electricity Air pollution / water pollution / waste / litter from tourist developments Seasonal jobs Increased price of goods / property Loss of privacy Reserve 2 marks for advantages / disadvantages 2(e)(ii) 1 mark for topic being investigated e.g. 3 Water pollution Litter Decrease in vegetation 1 mark for how it is being investigated e.g. Bi-polar analysis Quadrat Litter count Species identification Comparing photographs Environmental index 1 mark for development of method with clear focus on natural environment e.g. Generic ideas about grouping, time of day, checking methodology Specific details of method Total: 30
What was in this paper
The subtopics covered by these 2 questions, and how many questions each got. Open one in a new tab to see every Cambridge question on it.
What you needed in this session
Cambridge’s own grade thresholds for 2017 May/June, Paper 4 · Variant 3. A higher threshold means an easier paper — the bar moves with how the cohort did.