Cambridge IGCSE Geography 0460 — 2017 May/June Paper 4 · Variant 1
0460/41/M/J/17 · 2 questions · 60 marks · ≈68 min
The question paper and its mark scheme, free to read here and free to download. This is Cambridge’s own paper, exactly as it was sat.
Question paper16 pages



Mark scheme6 pages
Answers below. Sit the paper first if you are practising.
Questions as text
Q1 · Students at a school in Northern Ireland visited a country park to investigate how…
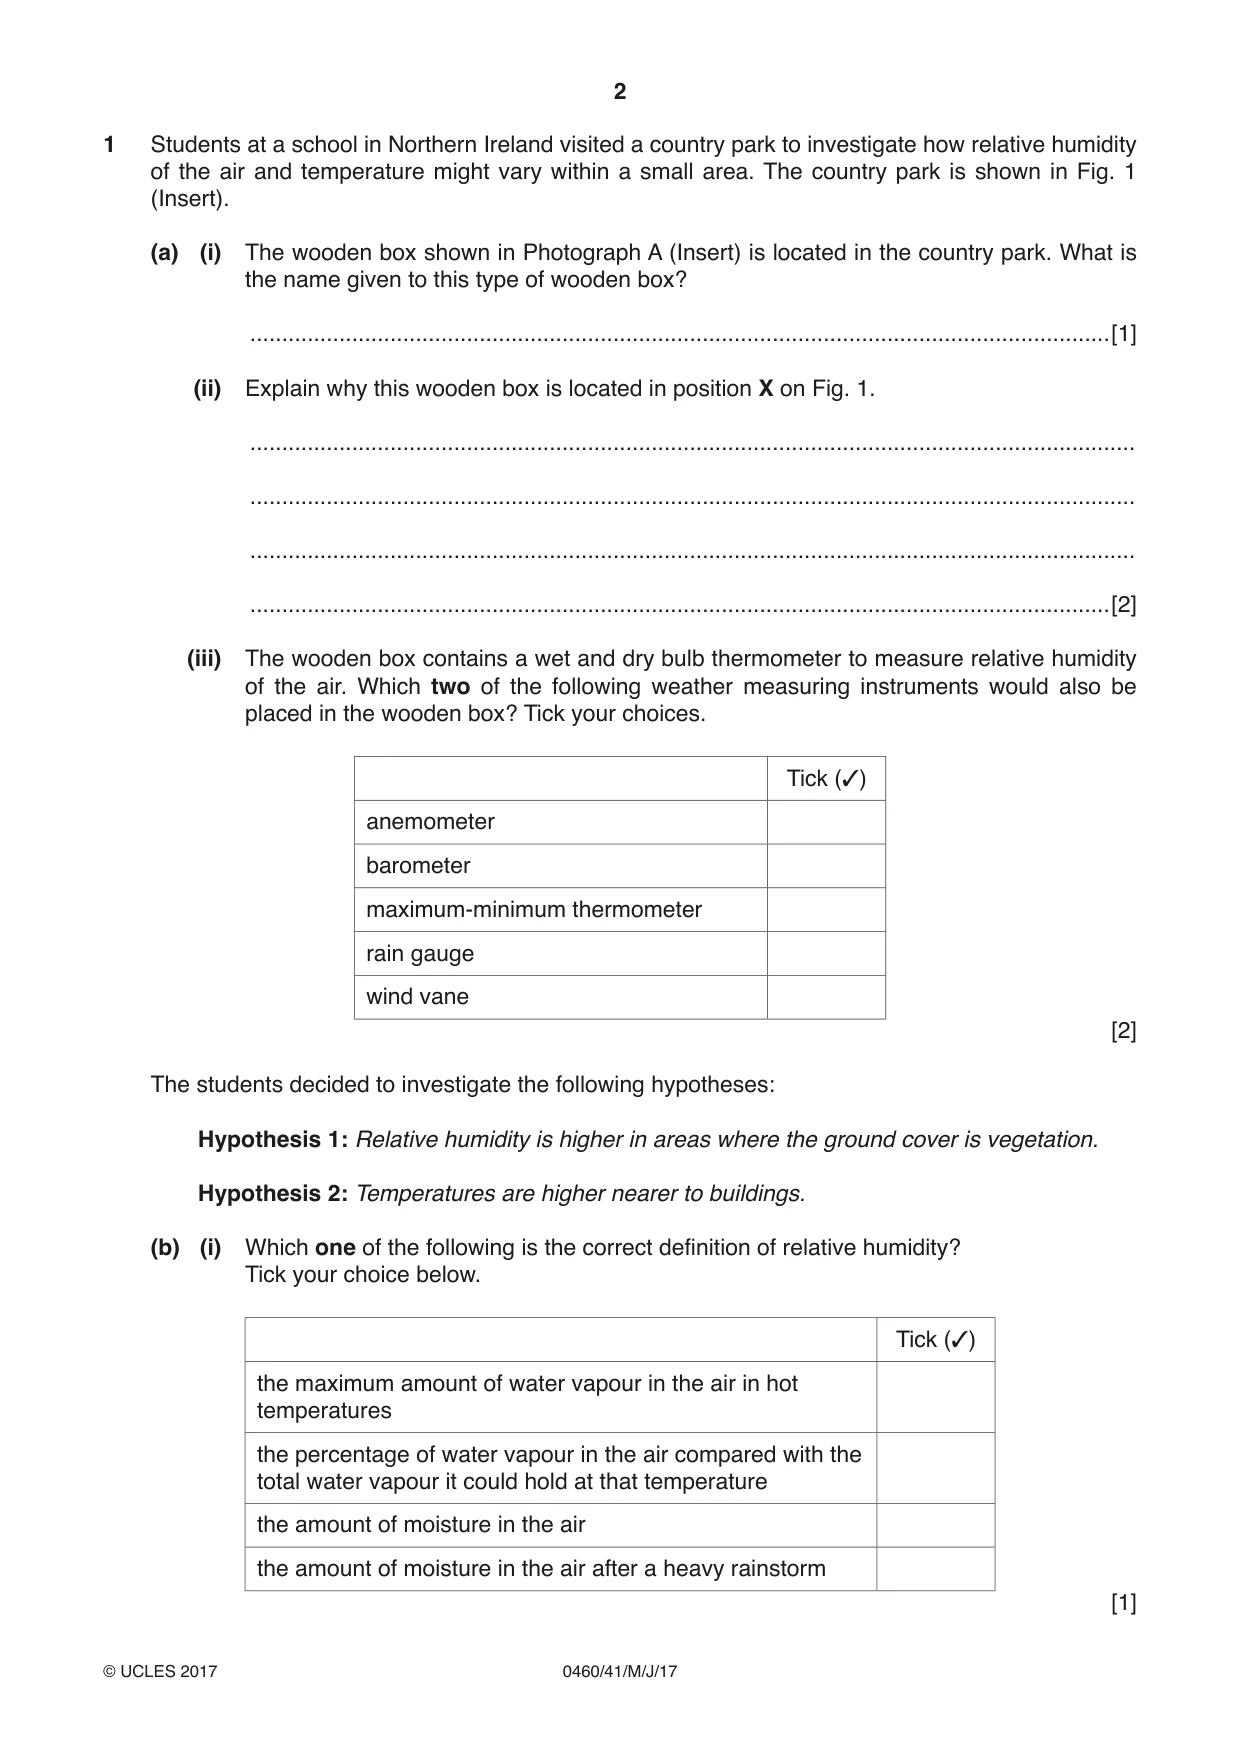
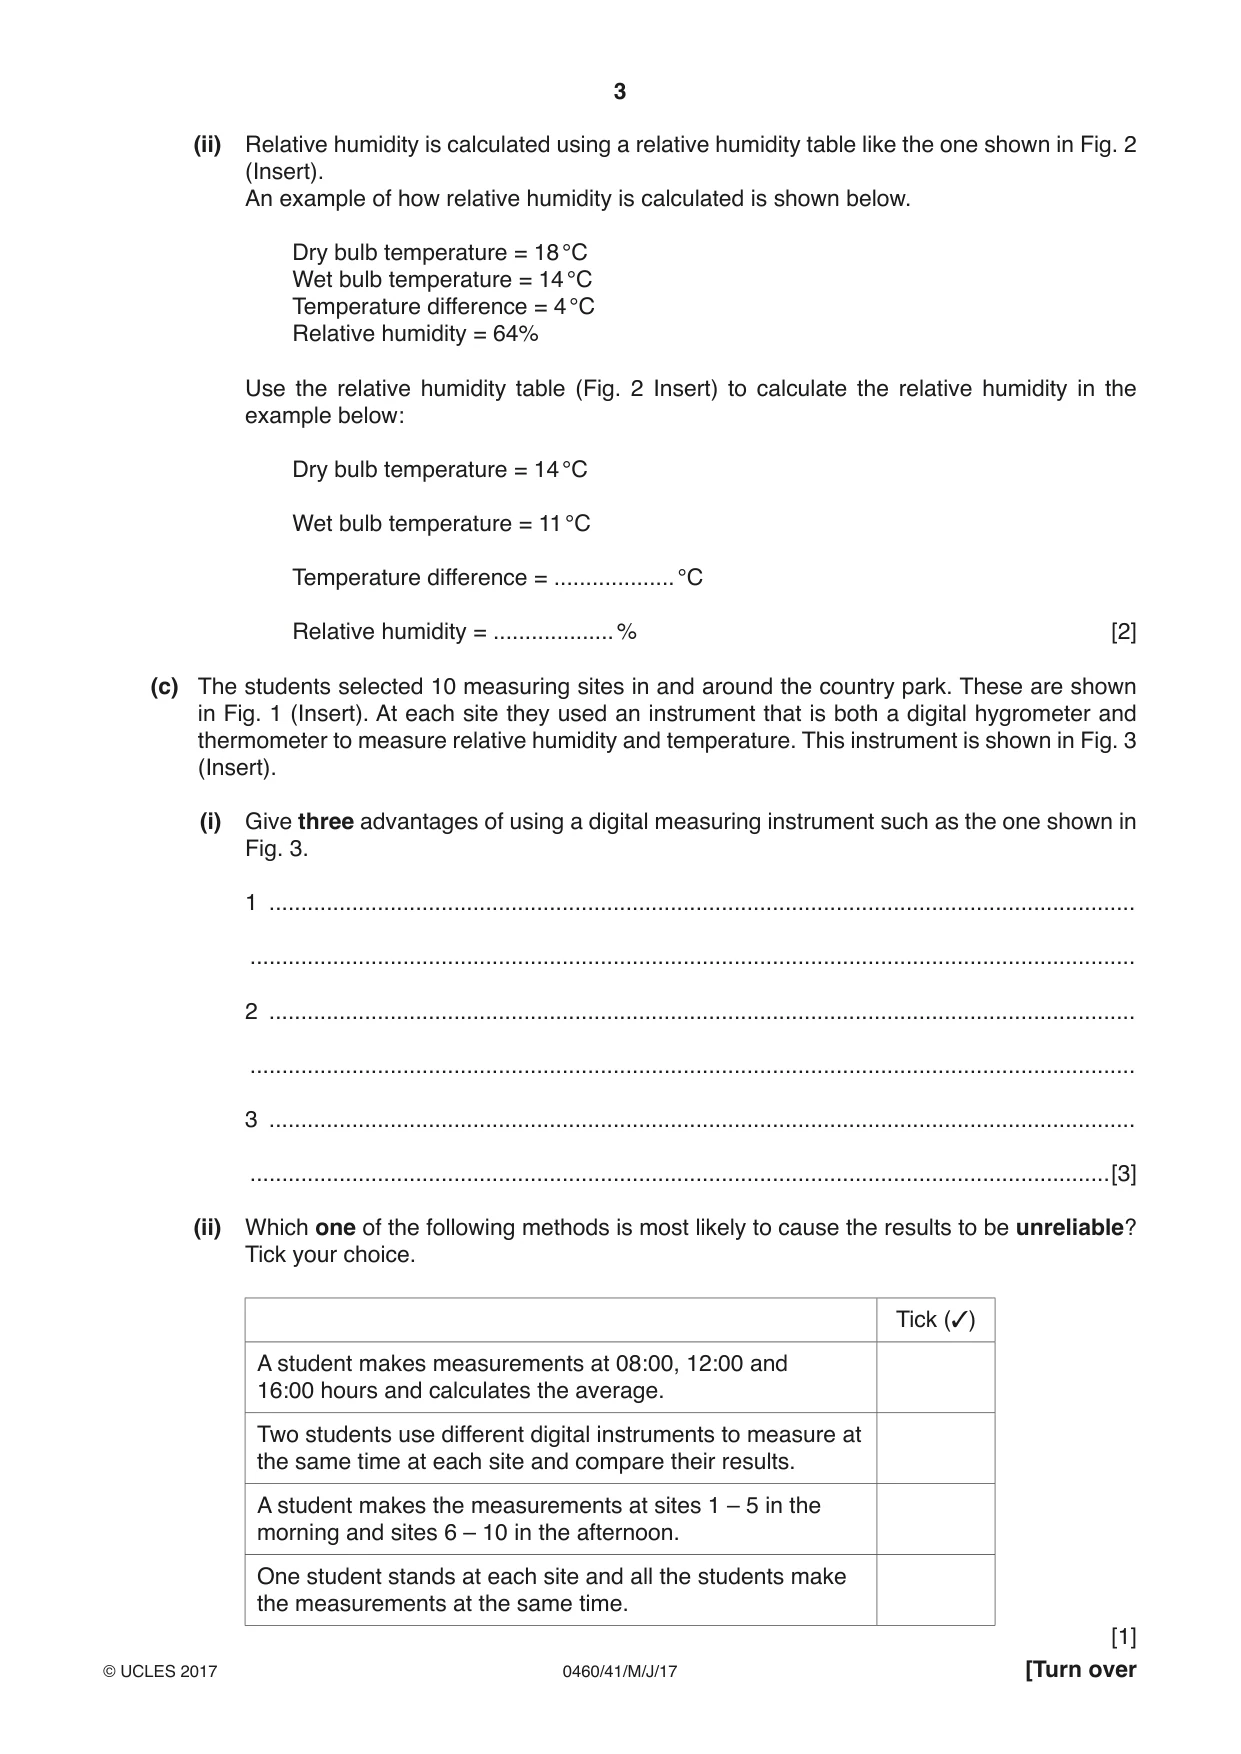
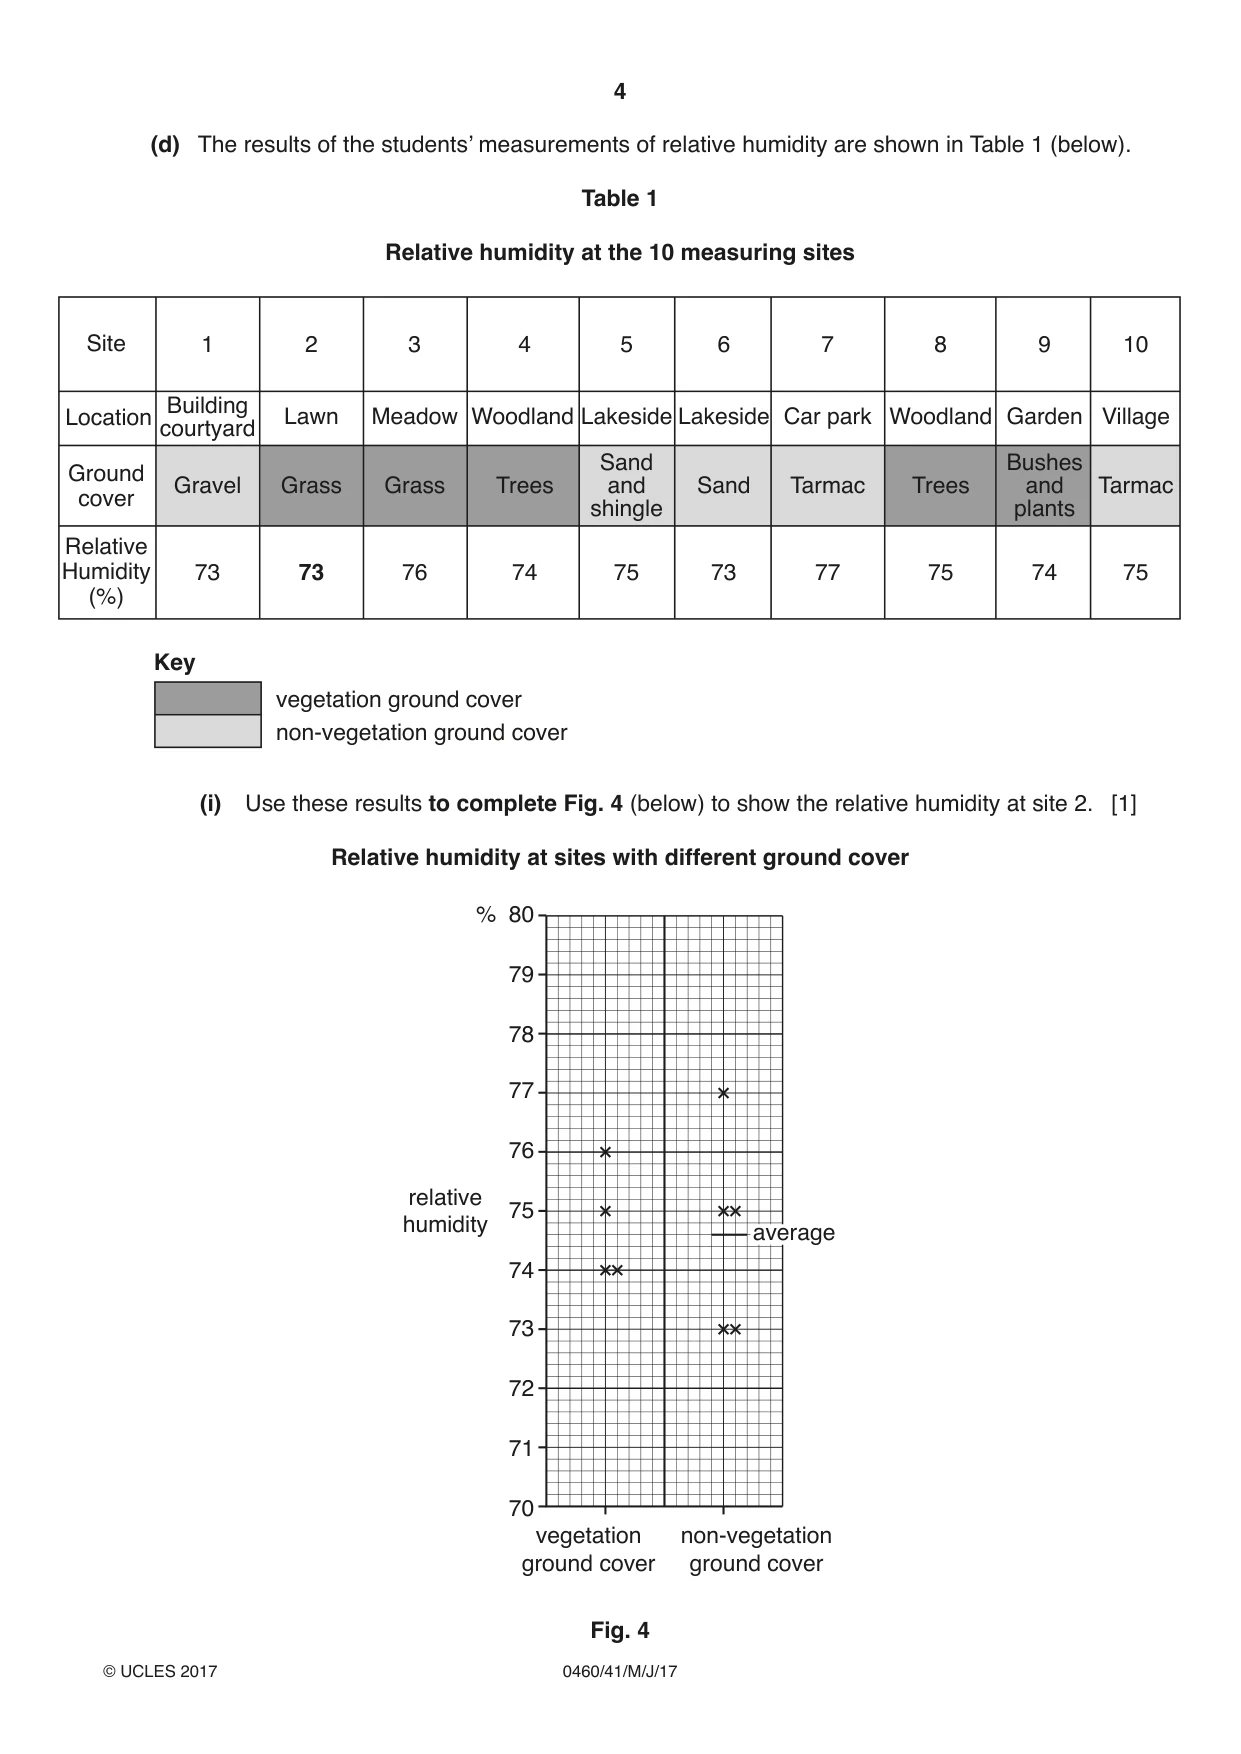
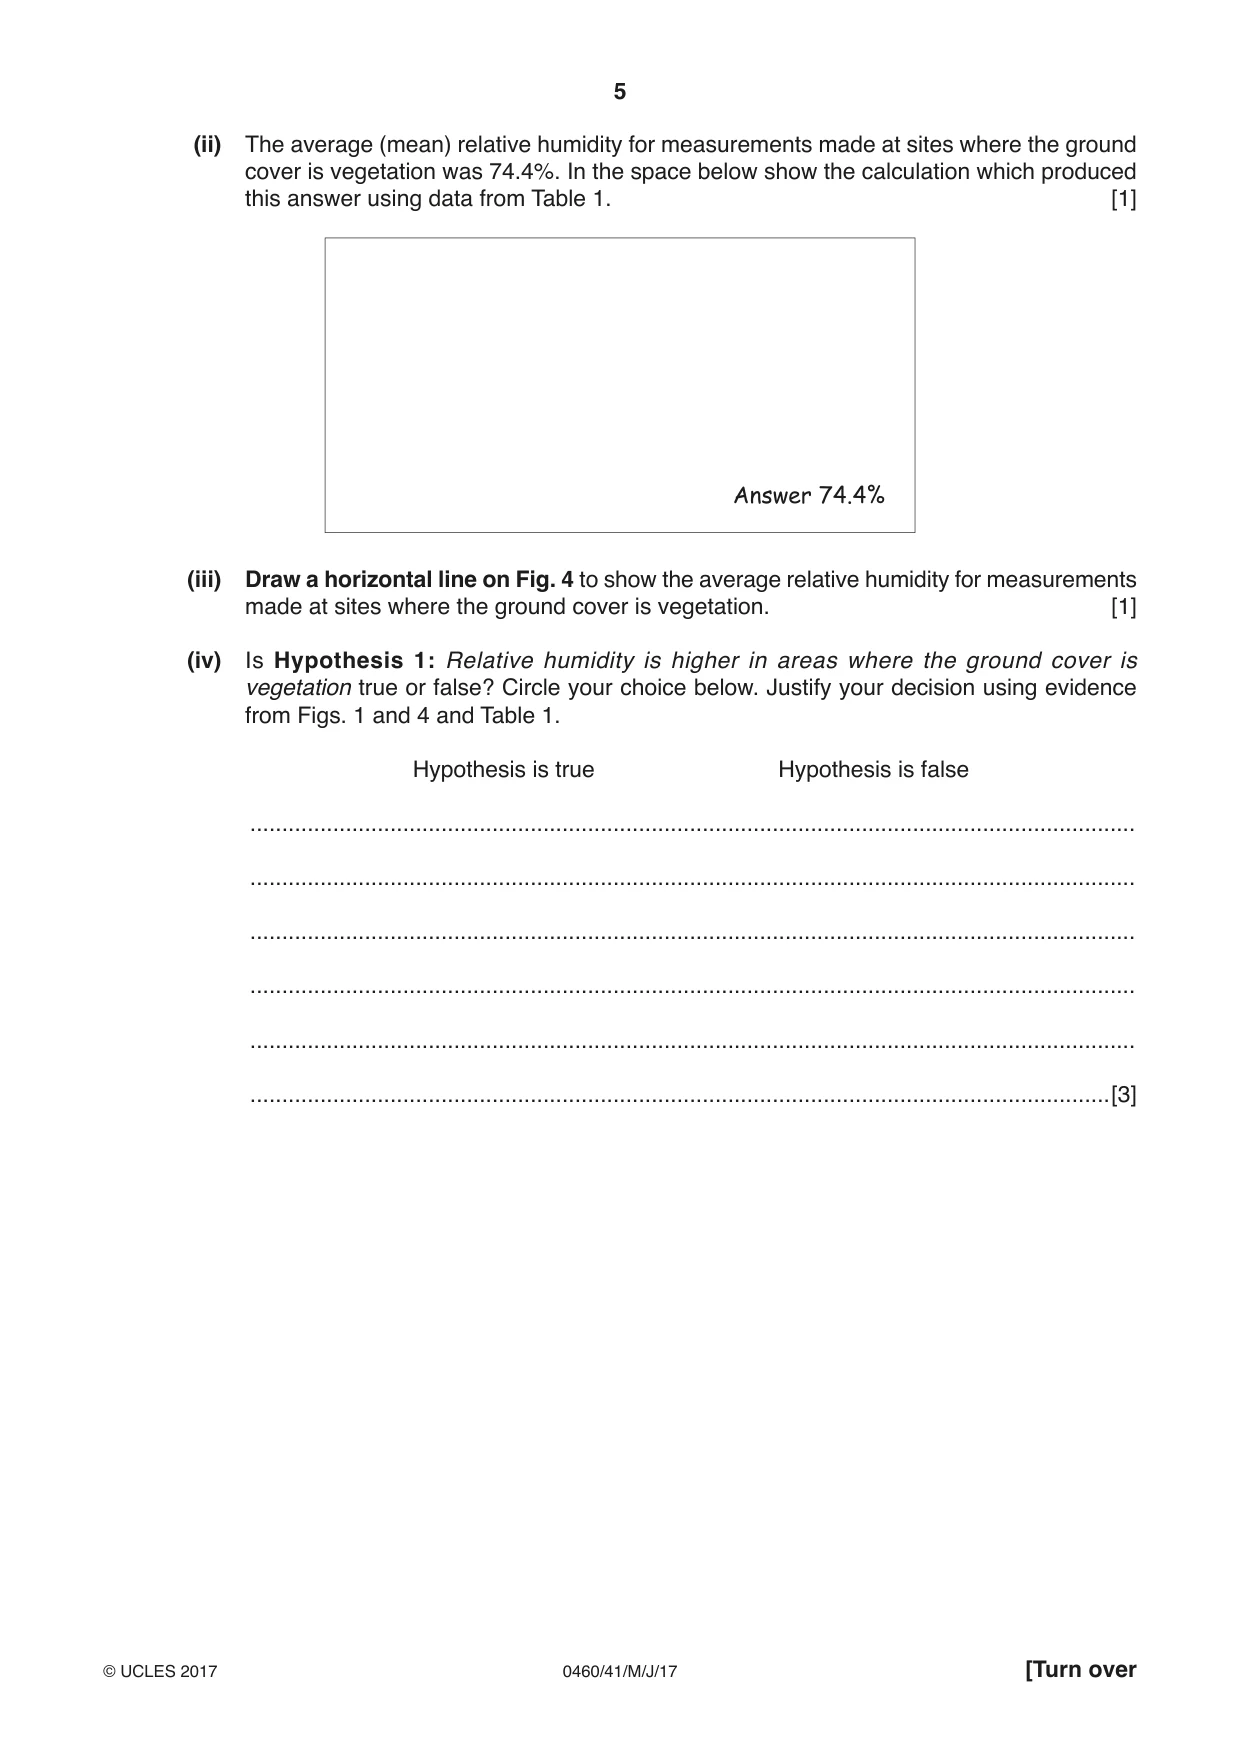
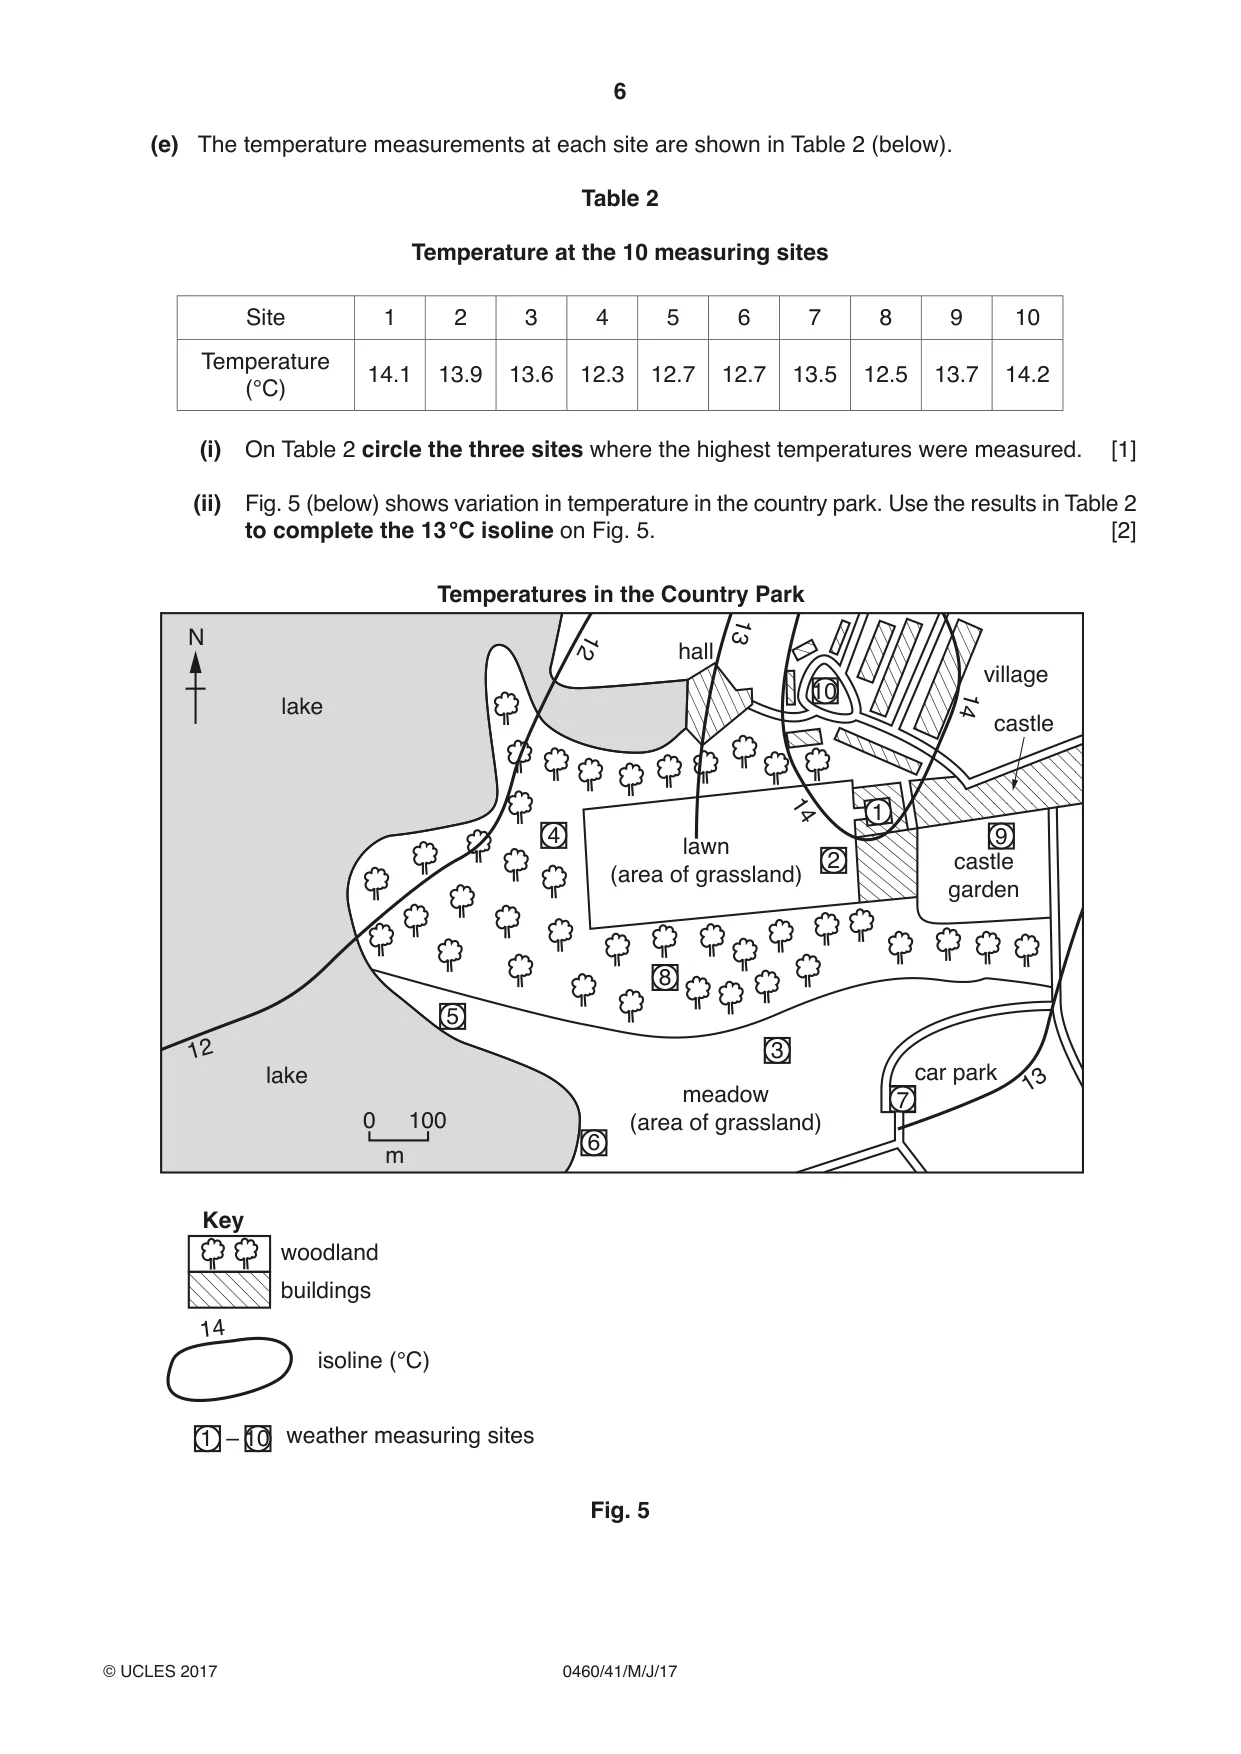
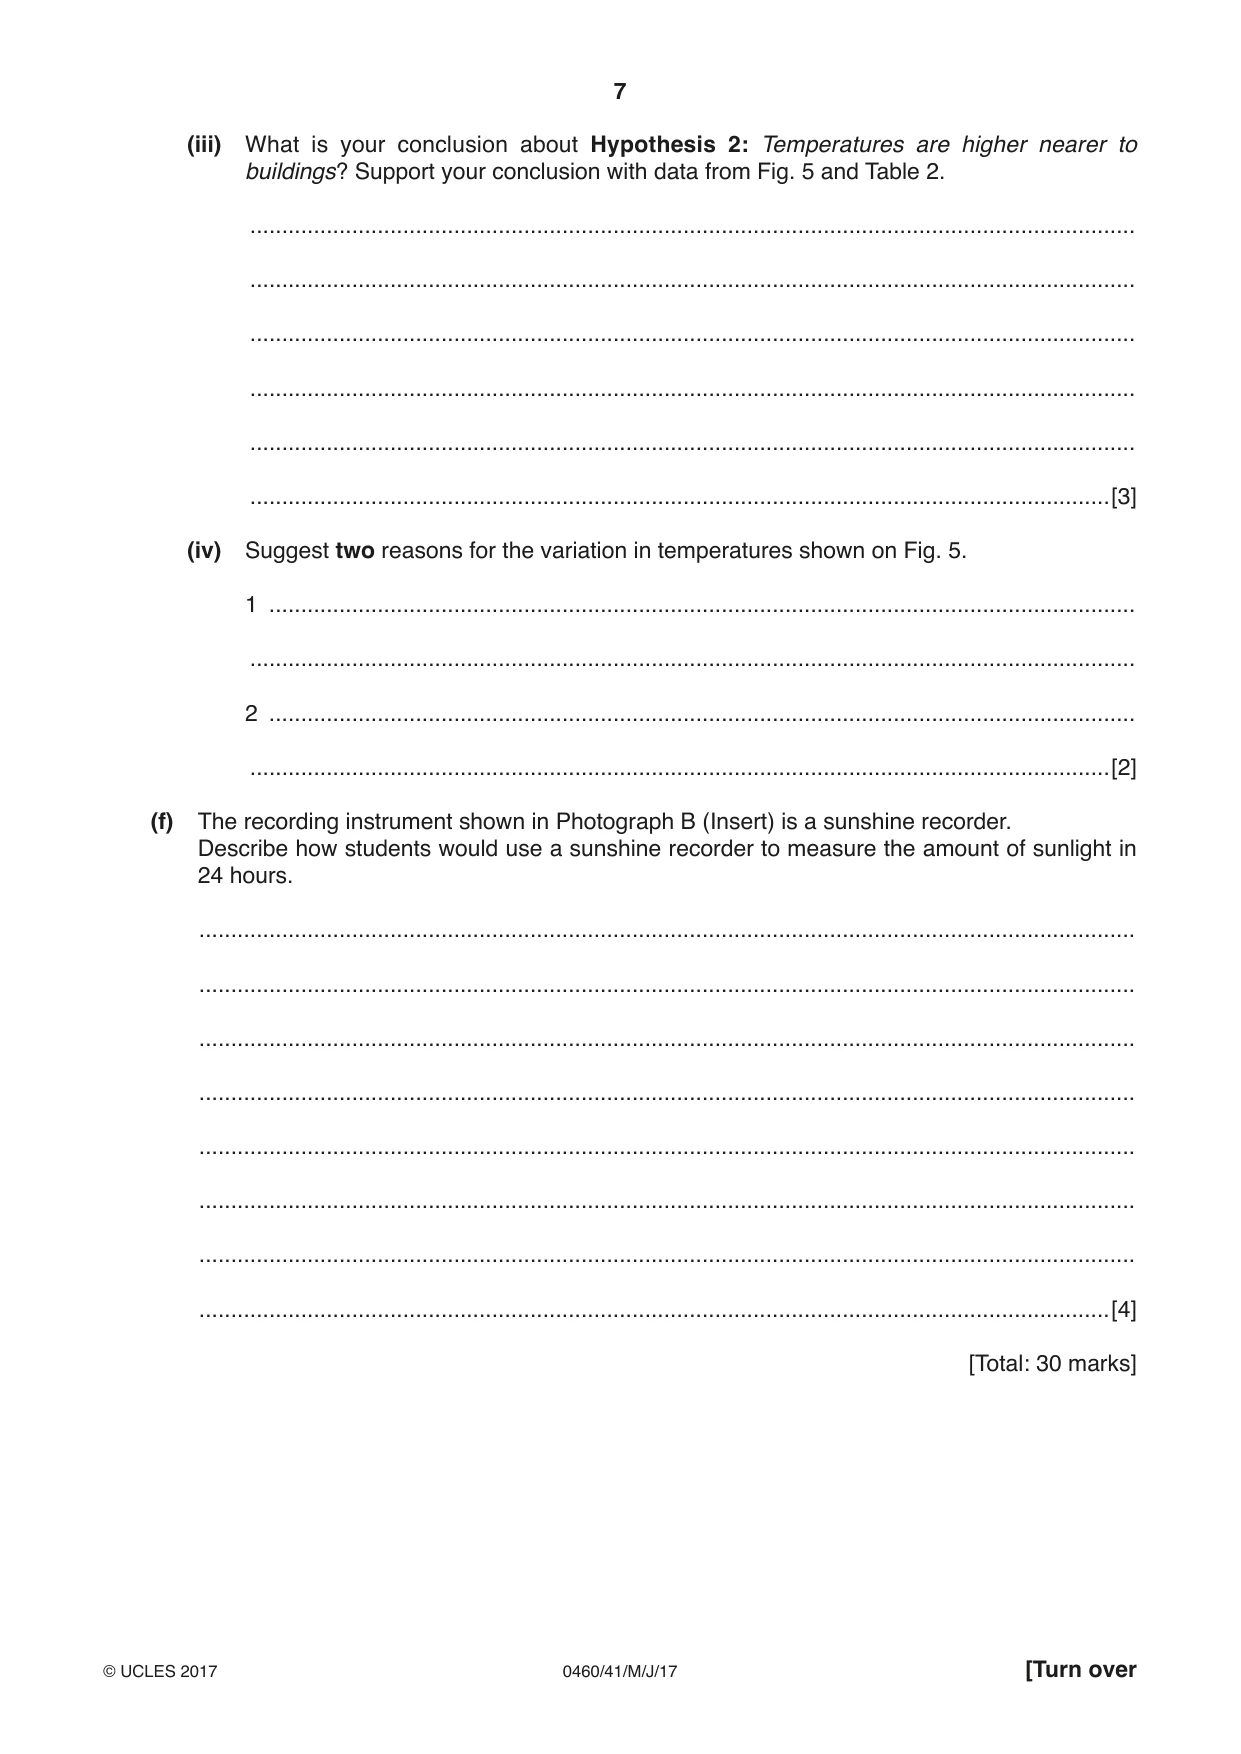
1 Students at a school in Northern Ireland visited a country park to investigate how relative humidity of the air and temperature might vary within a small area. The country park is shown in Fig. 1 (Insert). (a) (i) The wooden box shown in Photograph A (Insert) is located in the country park. What is the name given to this type of wooden box? .......................................................................................................................................[1] (ii) Explain why this wooden box is located in position X on Fig. 1. ........................................................................................................................................... ........................................................................................................................................... ........................................................................................................................................... .......................................................................................................................................[2] (iii) The wooden box contains a wet and dry bulb thermometer to measure relative humidity of the air. Which two of the following weather measuring instruments would also be placed in the wooden box? Tick your choices. Tick (✓) anemometer barometer maximum-minimum thermometer rain gauge wind vane [2] The students decided to investigate the following hypotheses: Hypothesis 1: Relative humidity is higher in areas where the ground cover is vegetation. Hypothesis 2: Temperatures are higher nearer to buildings. (b) (i) Which one of the following is the correct definition of relative humidity? Tick your choice below. Tick (✓) the maximum amount of water vapour in the air in hot temperatures the percentage of water vapour in the air compared with the total water vapour it could hold at that temperature the amount of moisture in the air the amount of moisture in the air after a heavy rainstorm [1] (ii) Relative humidity is calculated using a relative humidity table like the one shown in Fig. 2 (Insert). An example of how relative humidity is calculated is shown below. Dry bulb temperature = 18 °C Wet bulb temperature = 14 °C Temperature difference = 4 °C Relative humidity = 64% Use the relative humidity table (Fig. 2 Insert) to calculate the relative humidity in the example below: Dry bulb temperature = 14 °C Wet bulb temperature = 11 °C Temperature difference = ................... °C Relative humidity = ................... % [2] (c) The students selected 10 measuring sites in and around the country park. These are shown in Fig. 1 (Insert). At each site they used an instrument that is both a digital hygrometer and thermometer to measure relative humidity and temperature. This instrument is shown in Fig. 3 (Insert). (i) Give three advantages of using a digital measuring instrument such as the one shown in Fig. 3. 1 ........................................................................................................................................ ........................................................................................................................................... 2 ........................................................................................................................................ ........................................................................................................................................... 3 ........................................................................................................................................ .......................................................................................................................................[3] (ii) Which one of the following methods is most likely to cause the results to be unreliable? Tick your choice. Tick (✓) A student makes measurements at 08:00, 12:00 and 16:00 hours and calculates the average. Two students use different digital instruments to measure at the same time at each site and compare their results. A student makes the measurements at sites 1 – 5 in the morning and sites 6 – 10 in the afternoon. One student stands at each site and all the students make the measurements at the same time. (d) The results of the students’ measurements of relative humidity are shown in Table 1 (below). Table 1 Relative humidity at the 10 measuring sites Site 1 2 3 4 5 6 7 8 9 10 BuildingLocation Lawn Meadow Woodland Lakeside Lakeside Car park Woodland Garden Village courtyard Sand BushesGround Gravel Grass Grass Trees and Sand Tarmac Trees and Tarmac cover shingle plants Relative Humidity 73 73 76 74 75 73 77 75 74 75 (%) Key vegetation ground cover non-vegetation ground cover (i) Use these results to complete Fig. 4 (below) to show the relative humidity at site 2. [1] Relative humidity at sites with different ground cover % 80 79 78 77 76 relative 75 humidity average 74 73 72 71 70 vegetation non-vegetation ground cover ground cover Fig. 4 (ii) The average (mean) relative humidity for measurements made at sites where the ground cover is vegetation was 74.4%. In the space below show the calculation which produced this answer using data from Table 1. [1] Answer 74.4% (iii) Draw a horizontal line on Fig. 4 to show the average relative humidity for measurements made at sites where the ground cover is vegetation. [1] (iv) Is Hypothesis 1: Relative humidity is higher in areas where the ground cover is vegetation true or false? Circle your choice below. Justify your decision using evidence from Figs. 1 and 4 and Table 1. Hypothesis is true Hypothesis is false ........................................................................................................................................... ........................................................................................................................................... ........................................................................................................................................... ........................................................................................................................................... ........................................................................................................................................... .......................................................................................................................................[3] (e) The temperature measurements at each site are shown in Table 2 (below). Table 2 Temperature at the 10 measuring sites Site 1 2 3 4 5 6 7 8 9 10 Temperature 14.1 13.9 13.6 12.3 12.7 12.7 13.5 12.5 13.7 14.2 (°C) (i) On Table 2 circle the three sites where the highest temperatures were measured. [1] (ii) Fig. 5 (below) shows variation in temperature in the country park. Use the results in Table 2 to complete the 13 °C isoline on Fig. 5. [2] Temperatures in the Country Park N 13 12 hall village 10 lake 14 castle 14 1 4 9 lawn 2 castle (area of grassland) garden 8 5 12 3 lake car park 13 meadow 7 0 100 (area of grassland) 6 m Key woodland buildings 14 isoline (°C) 1 – 10 weather measuring sites Fig. 5 (iii) What is your conclusion about Hypothesis 2: Temperatures are higher nearer to buildings? Support your conclusion with data from Fig. 5 and Table 2. ........................................................................................................................................... ........................................................................................................................................... ........................................................................................................................................... ........................................................................................................................................... ........................................................................................................................................... .......................................................................................................................................[3] (iv) Suggest two reasons for the variation in temperatures shown on Fig. 5. 1 ........................................................................................................................................ ........................................................................................................................................... 2 ........................................................................................................................................ .......................................................................................................................................[2] (f) The recording instrument shown in Photograph B (Insert) is a sunshine recorder. Describe how students would use a sunshine recorder to measure the amount of sunlight in 24 hours. ................................................................................................................................................... ................................................................................................................................................... ................................................................................................................................................... ................................................................................................................................................... ................................................................................................................................................... ................................................................................................................................................... ................................................................................................................................................... ...............................................................................................................................................[4] [Total: 30 marks]
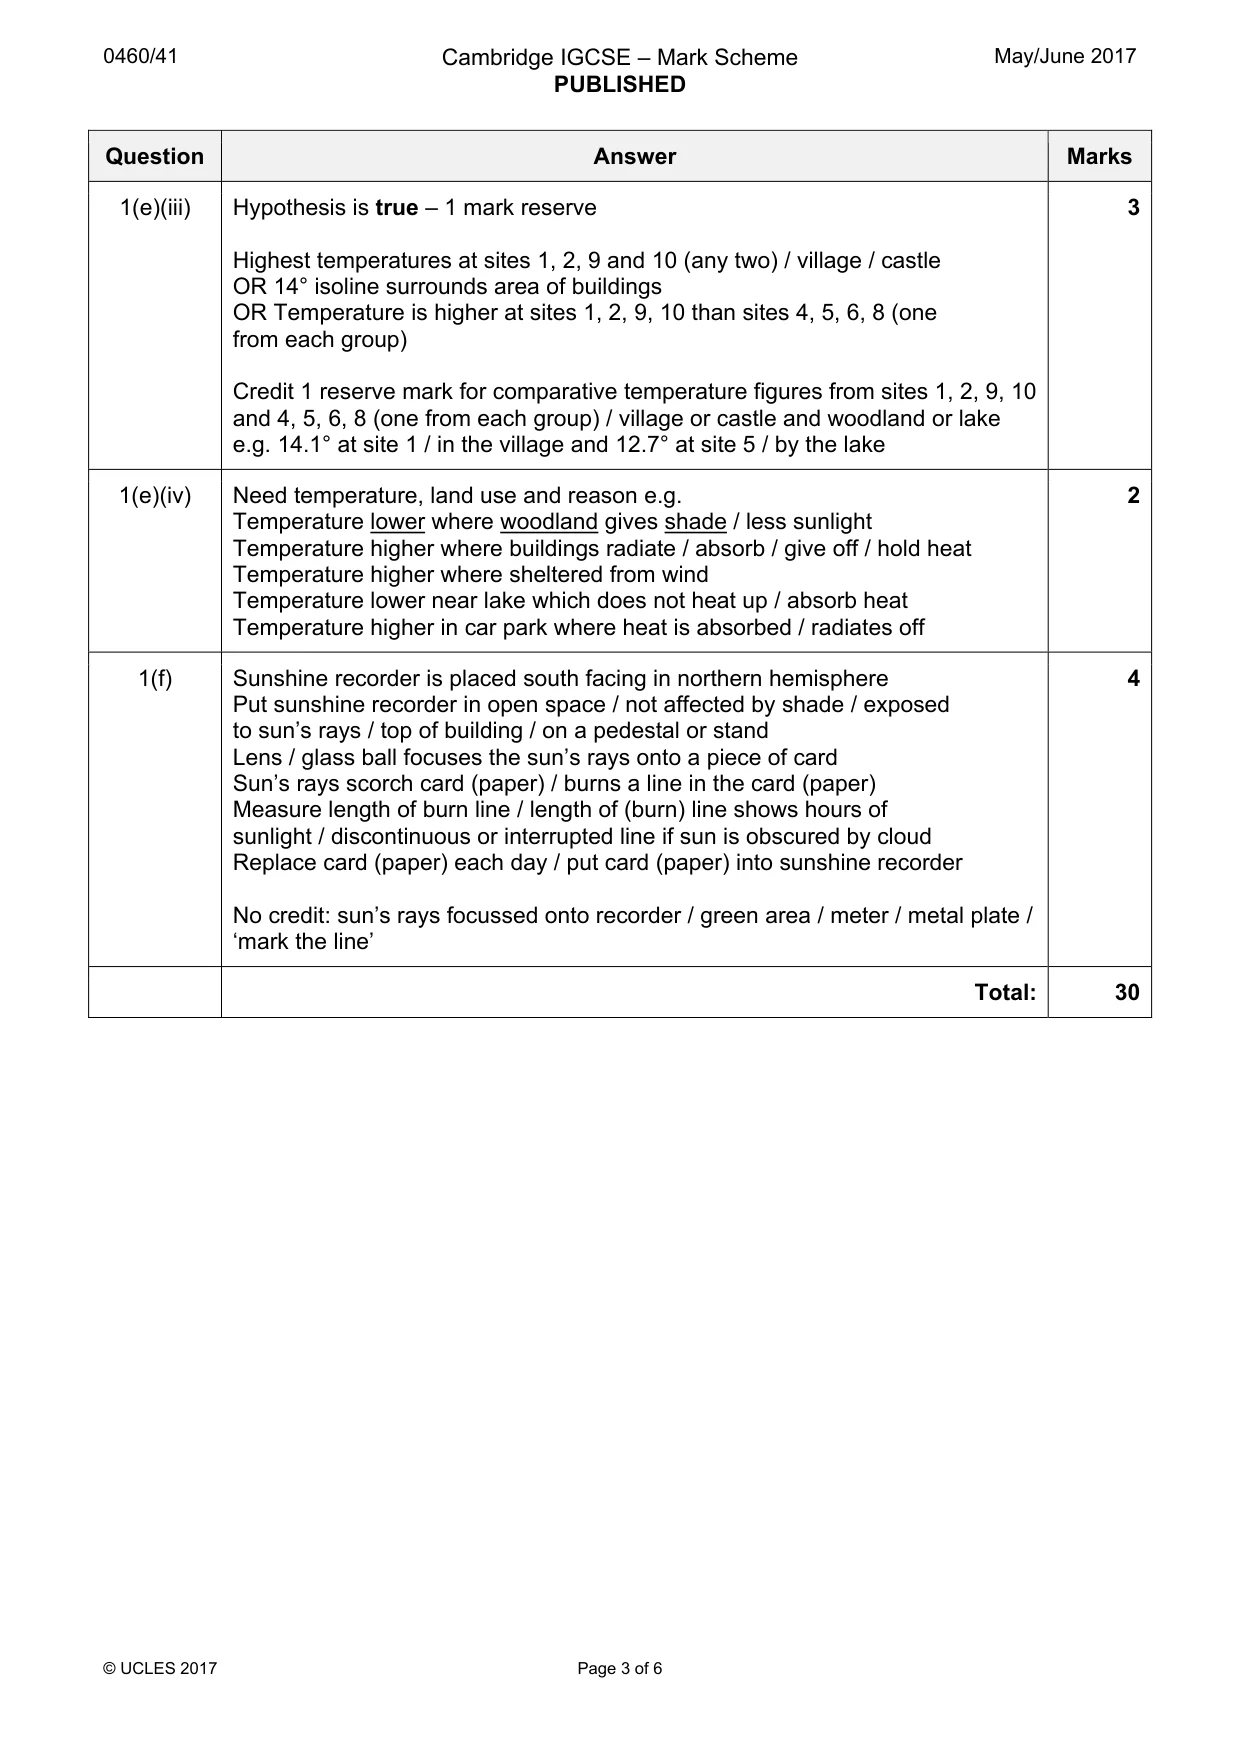
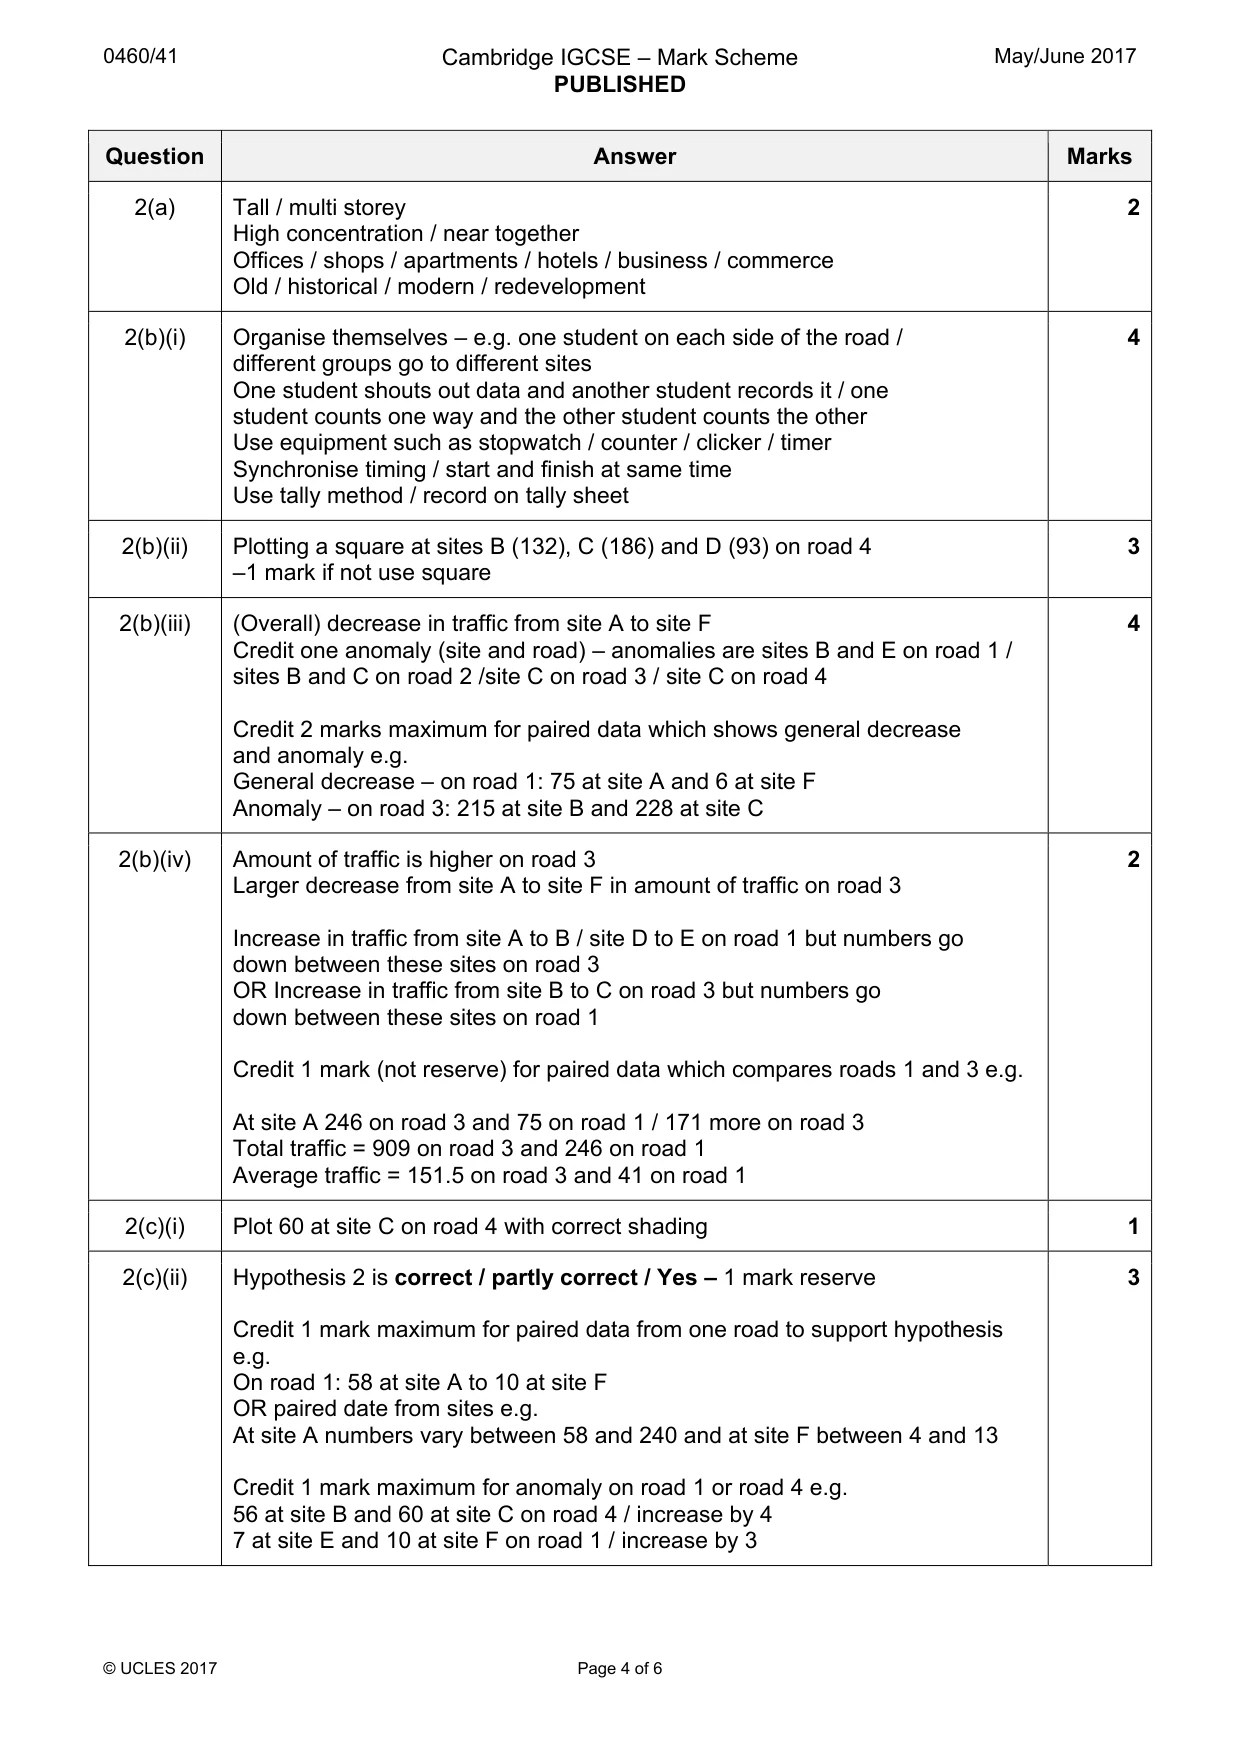
Mark scheme: Question Answer Marks 1(a)(i) Stevenson screen 1 1(a)(ii) On grassland / away from woodland or trees / lake / buildings / in open area 2 Temperature recording is not affected by heat radiation from the ground or buildings / not affected by shade Accessible Relative humidity not affected by lake 1(a)(iii) Barometer 2 Maximum-minimum thermometer 1(b)(i) The percentage of water vapour in the air compared with the total water 1 vapour it could hold at that temperature 1(b)(ii) Temperature difference = 3 °C 2 Relative Humidity = 69% Credit ecf if incorrect temperature difference 1(c)(i) Give instant readings / faster / quicker / saves time 3 Easy / clear to read / large digital readout Don’t need to know how to read a thermometer / RH table / hygrometer Exact figures / accurate / precise / reliable / to one decimal point Less chance of making mistake in reading / misreading / less errors Portable / can be used at more than one site / easy to reset Can download results to computer / save data Safer if dropped because no mercury / sturdier if dropped Fewer instruments to use / measures both temperature and relative humidity 1(c)(ii) A student makes the measurements at sites 1–5 in the morning 1 and sites 6–10 in the afternoon 1(d)(i) Plot 73% RH in vegetation ground cover column on Fig. 4 1 1(d)(ii) 73 + 76 + 74 + 75 + 74 372 1 OR 5 5 1(d)(iii) Plot 74.4% on Fig. 4 (do not need ‘average’) 1 1(d)(iv) Hypothesis is false – 1 mark reserve (3HA) 3 Average is higher in areas of non-vegetation cover / little difference between vegetation and non-vegetation areas Highest site reading (site 7) is on tarmac OR non-vegetation / lowest readings on vegetation and non-vegetation have same values Credit paired data for 1 mark (not reserve) – 74.4% on vegetation and 74.6% on non-vegetation / 0.2% higher on non-vegetation Hypothesis is true / partly true = 0 (XHA) If no hypothesis conclusion ^HA and credit evidence 1(e)(i) Sites 1, 2, 10 (credit temperatures being circled for three correct sites) 1 1(e)(ii) Completion of isoline 2 Line must go between sites 3 and 8 and join up with existing isoline 1(e)(iii) Hypothesis is true – 1 mark reserve 3 Highest temperatures at sites 1, 2, 9 and 10 (any two) / village / castle OR 14° isoline surrounds area of buildings OR Temperature is higher at sites 1, 2, 9, 10 than sites 4, 5, 6, 8 (one from each group) Credit 1 reserve mark for comparative temperature figures from sites 1, 2, 9, 10 and 4, 5, 6, 8 (one from each group) / village or castle and woodland or lake e.g. 14.1° at site 1 / in the village and 12.7° at site 5 / by the lake 1(e)(iv) Need temperature, land use and reason e.g. 2 Temperature lower where woodland gives shade / less sunlight Temperature higher where buildings radiate / absorb / give off / hold heat Temperature higher where sheltered from wind Temperature lower near lake which does not heat up / absorb heat Temperature higher in car park where heat is absorbed / radiates off 1(f) Sunshine recorder is placed south facing in northern hemisphere 4 Put sunshine recorder in open space / not affected by shade / exposed to sun’s rays / top of building / on a pedestal or stand Lens / glass ball focuses the sun’s rays onto a piece of card Sun’s rays scorch card (paper) / burns a line in the card (paper) Measure length of burn line / length of (burn) line shows hours of sunlight / discontinuous or interrupted line if sun is obscured by cloud Replace card (paper) each day / put card (paper) into sunshine recorder No credit: sun’s rays focussed onto recorder / green area / meter / metal plate / ‘mark the line’ Total: 30
Q2 · Students from Auckland, New Zealand, were investigating different topics about their city
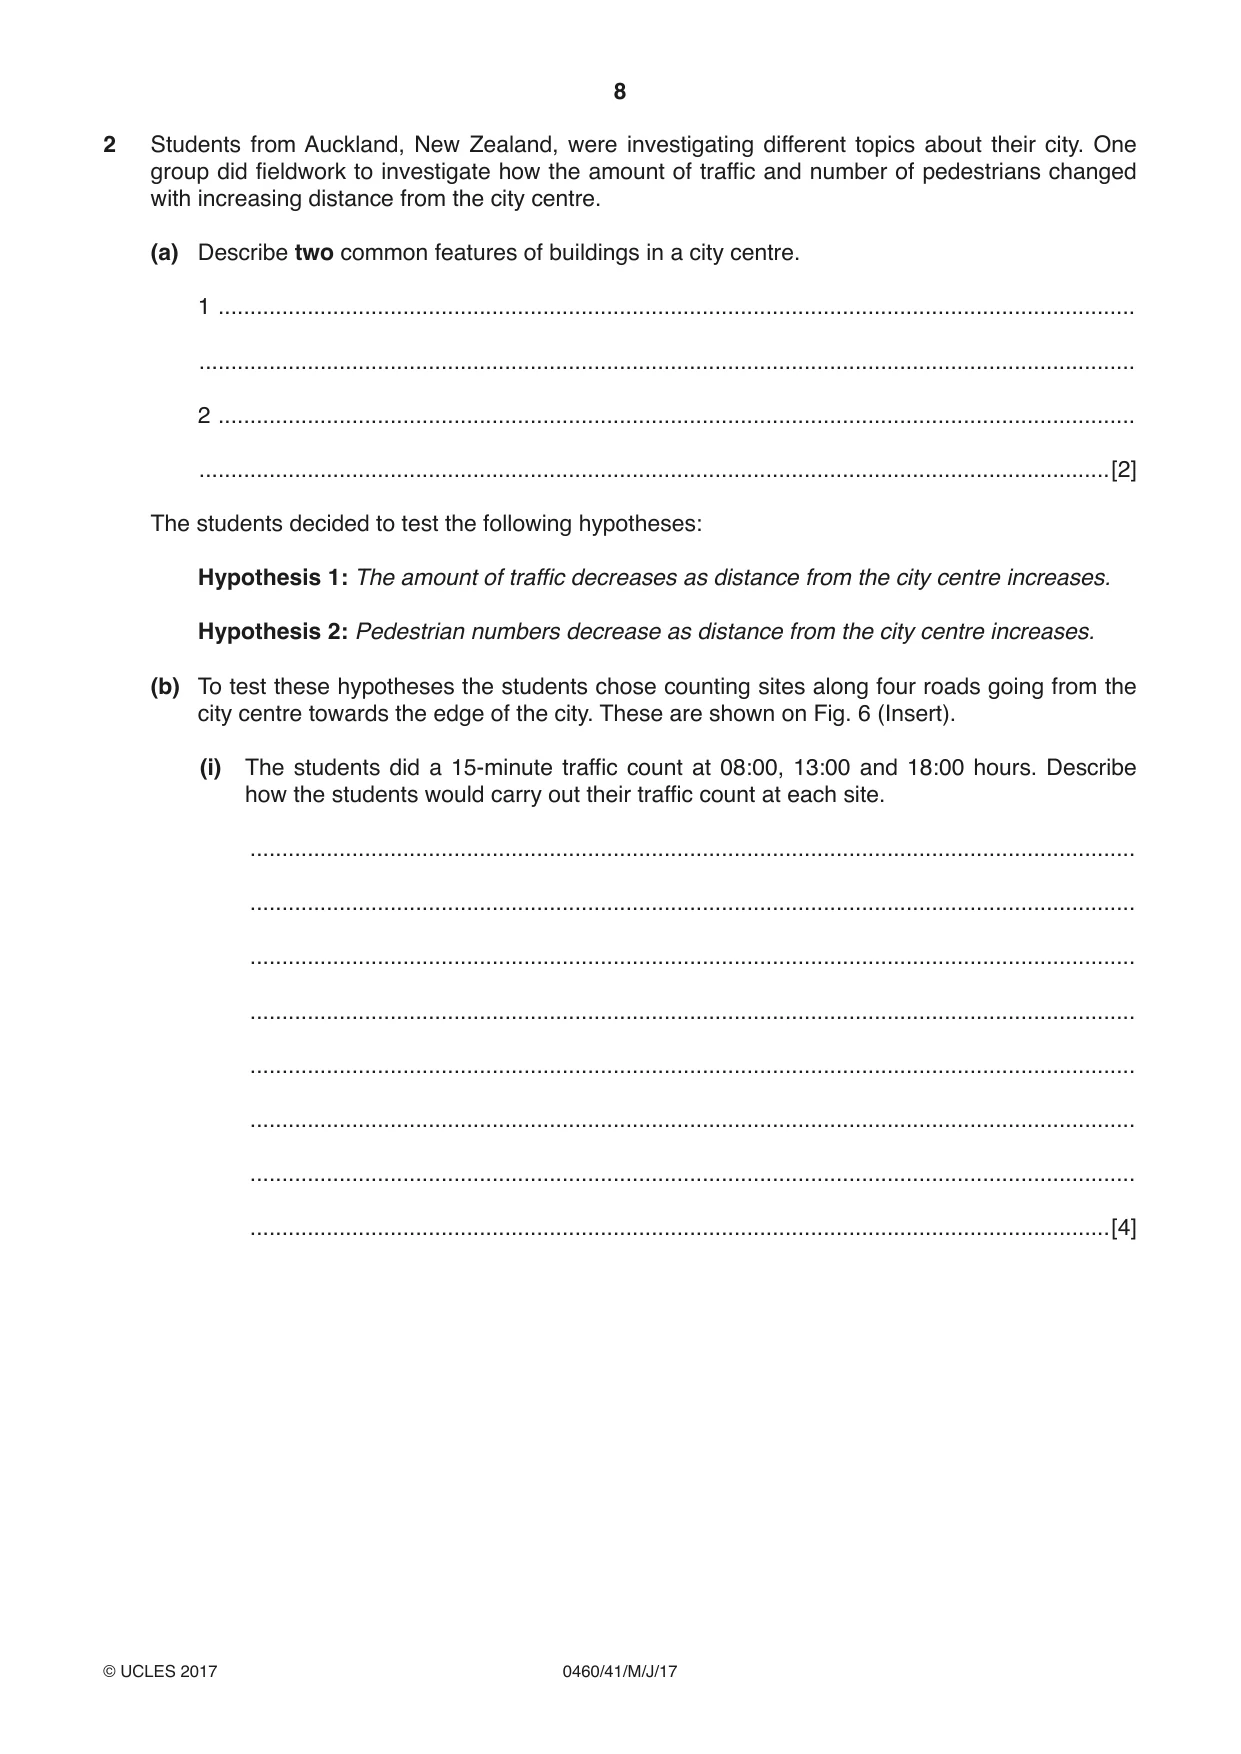
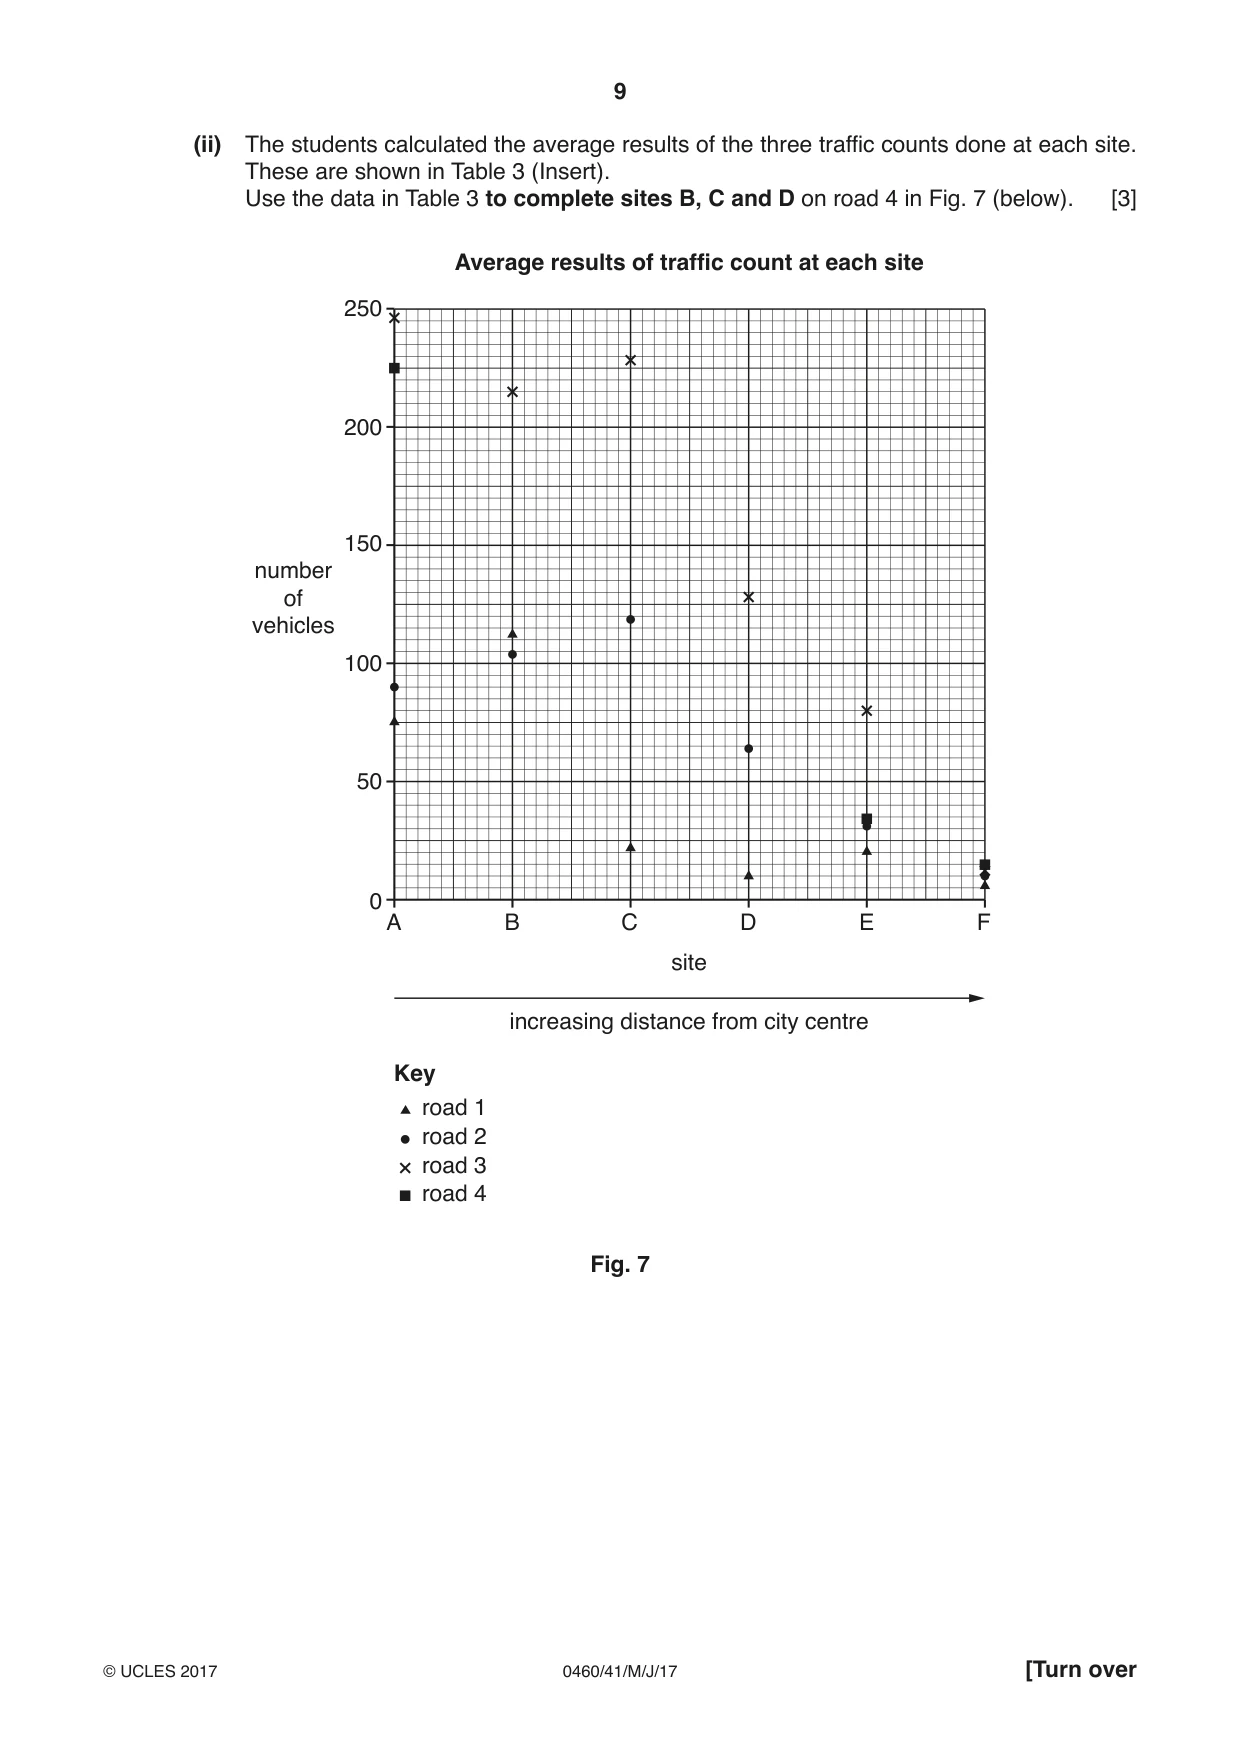
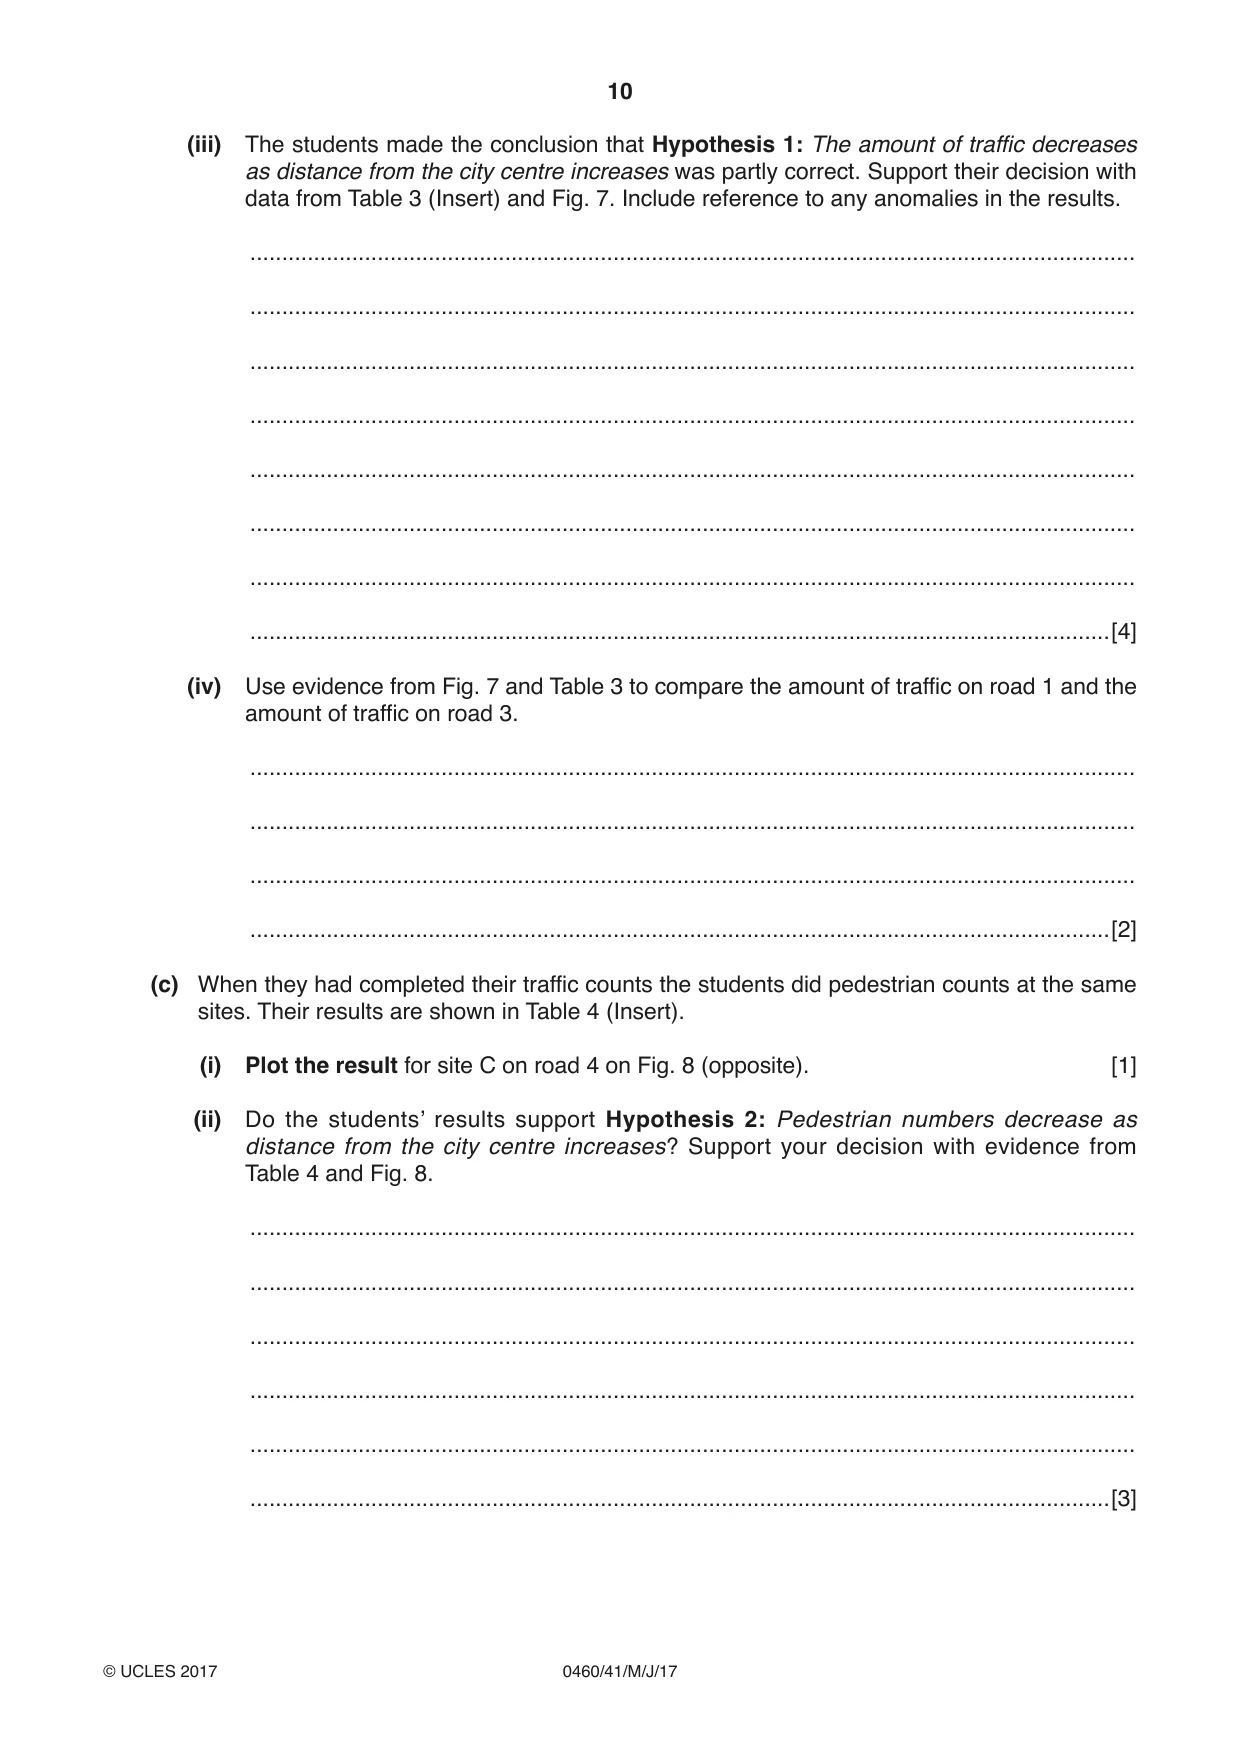
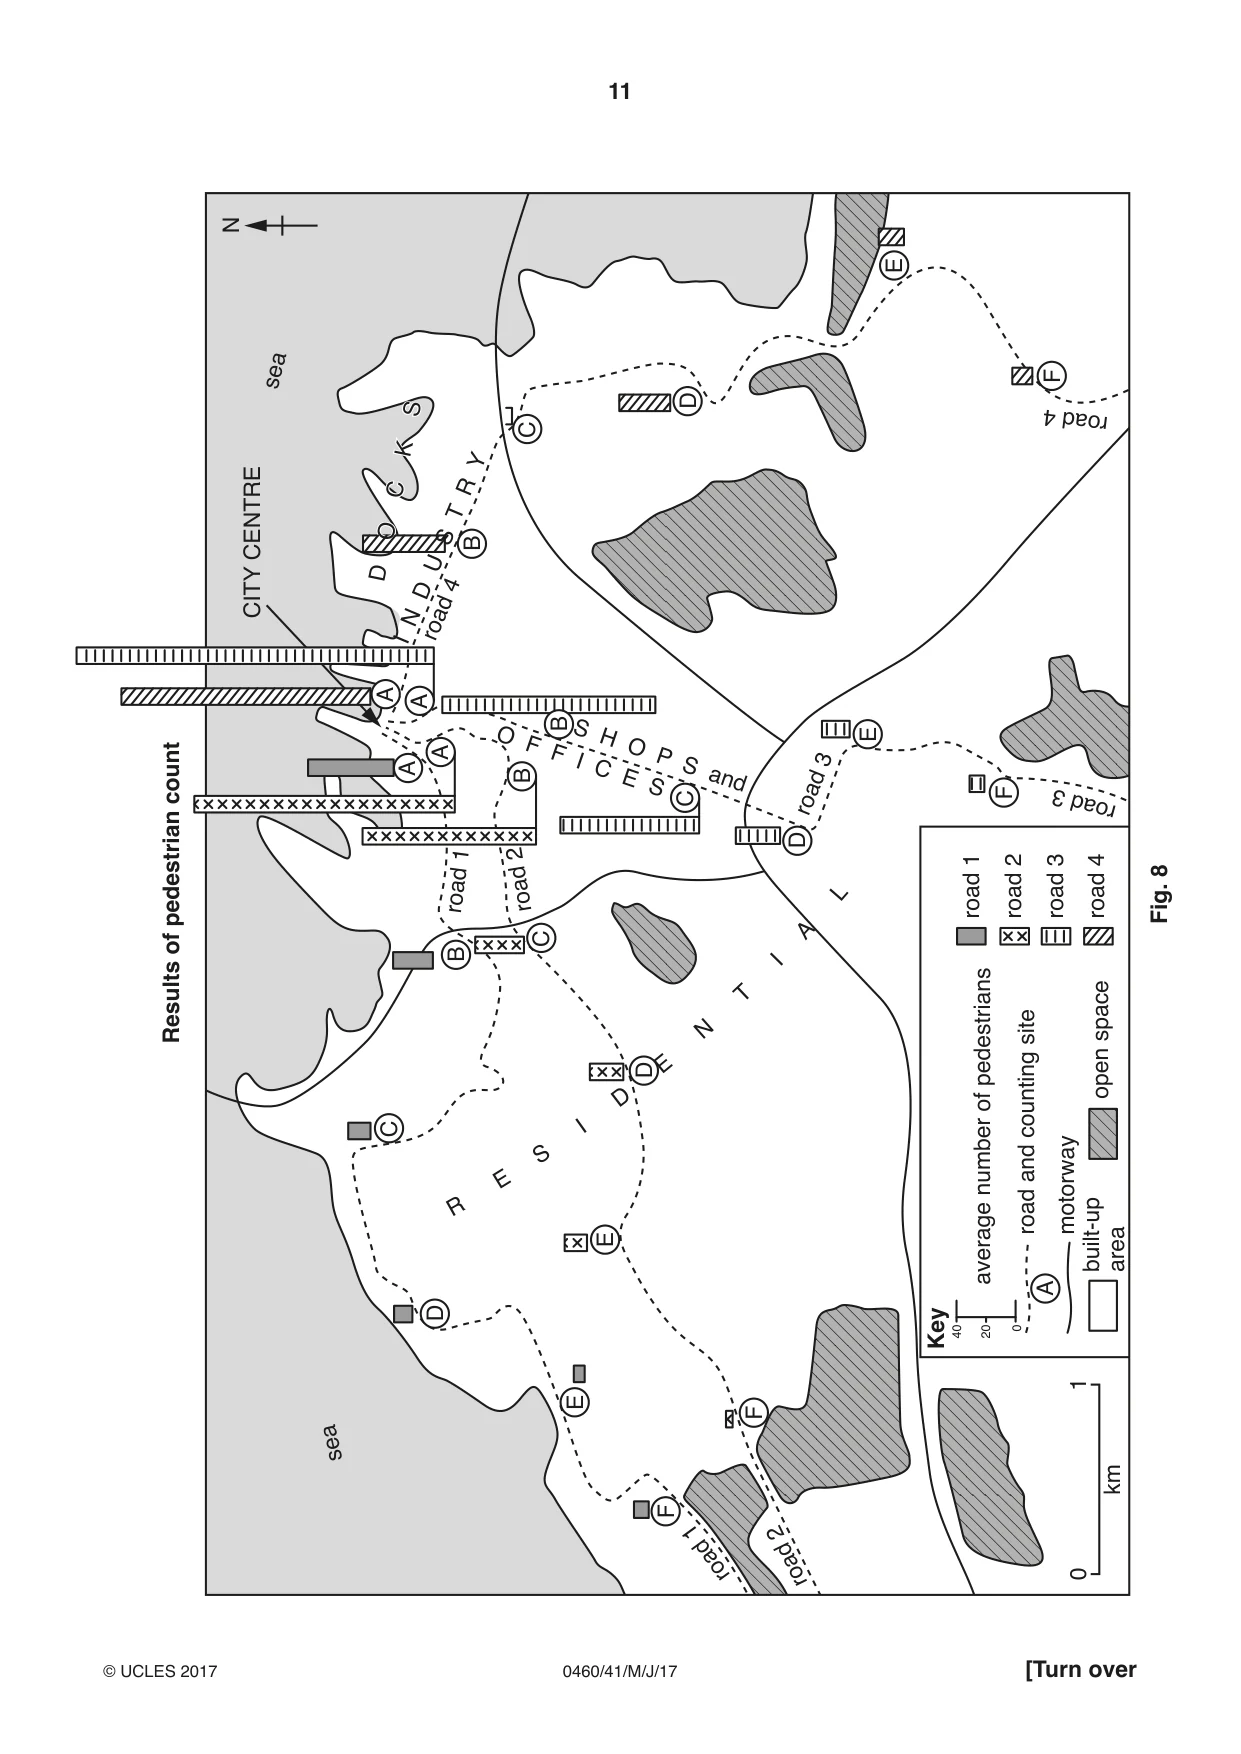
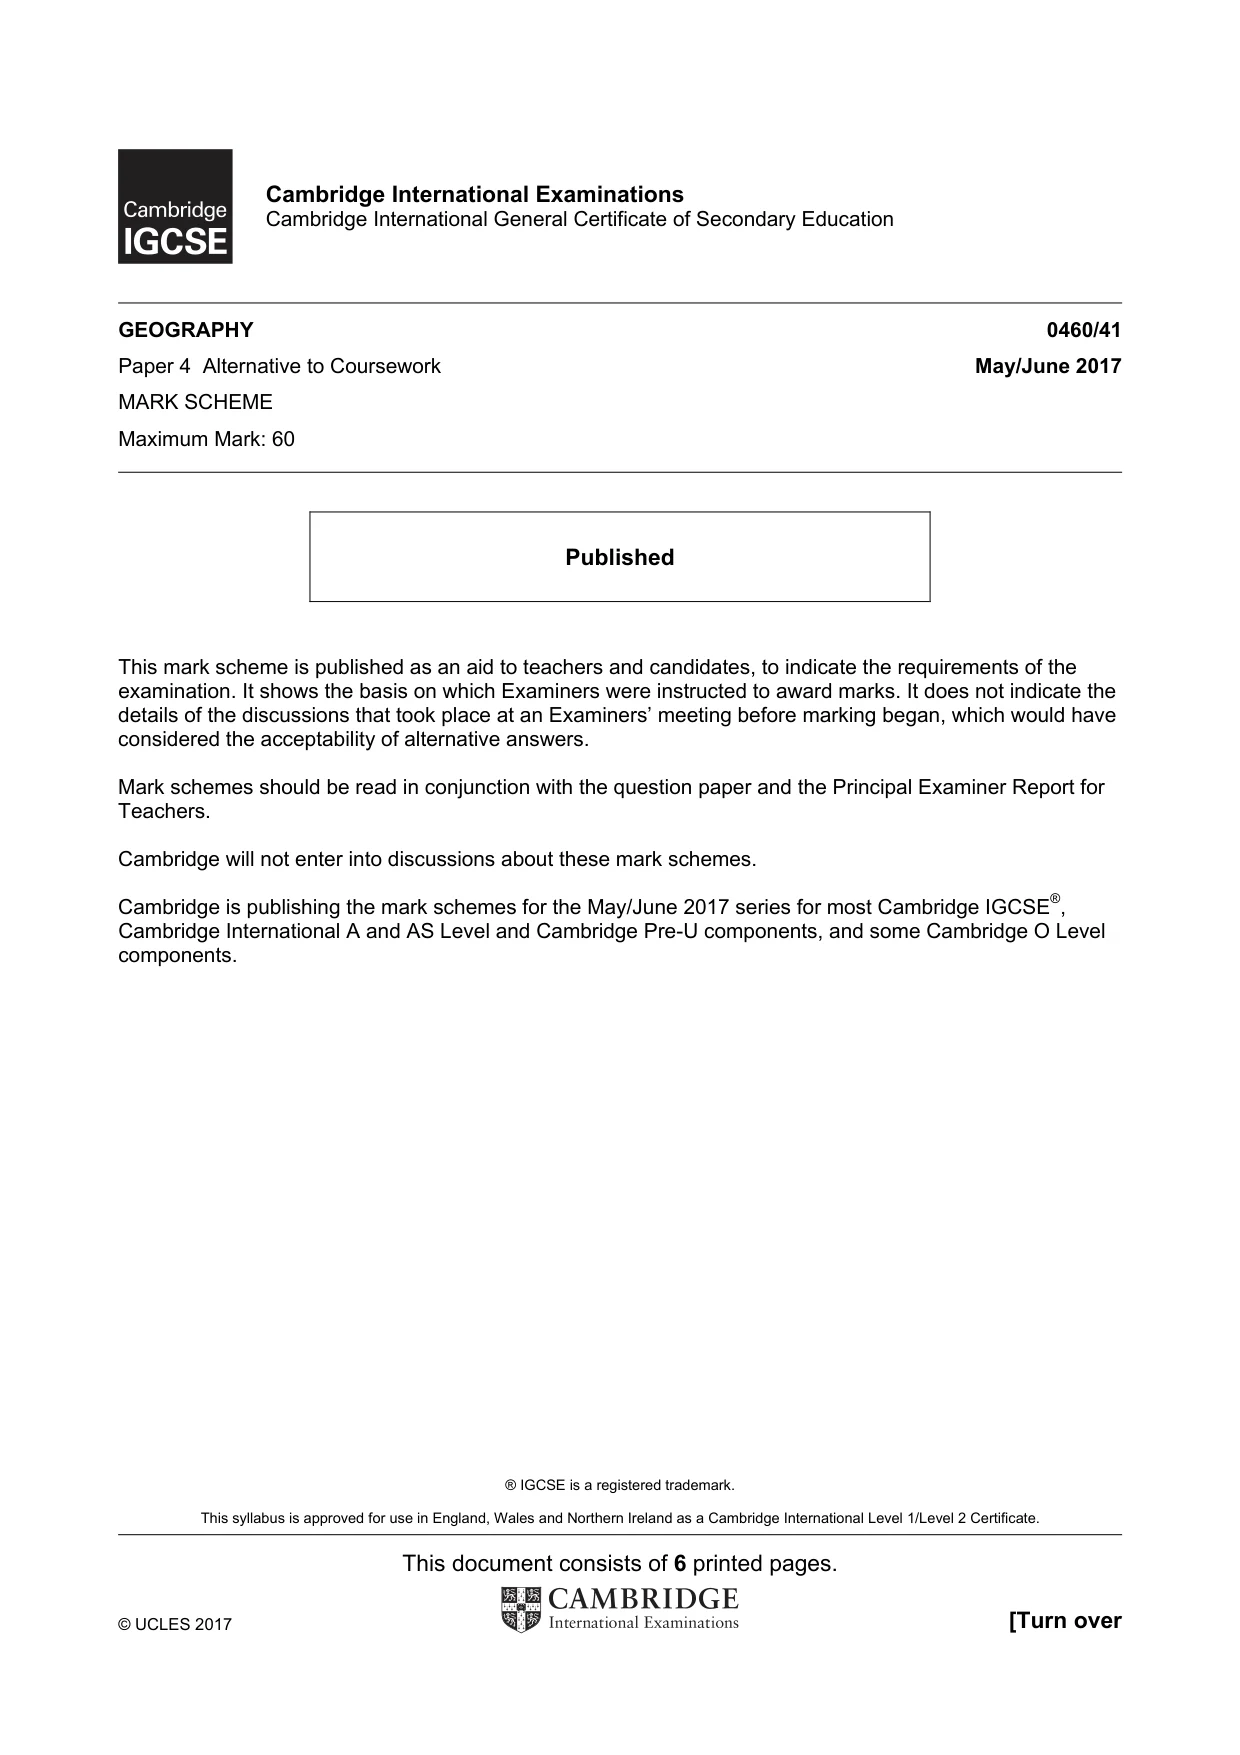
2 Students from Auckland, New Zealand, were investigating different topics about their city. One group did fieldwork to investigate how the amount of traffic and number of pedestrians changed with increasing distance from the city centre. (a) Describe two common features of buildings in a city centre. 1 ................................................................................................................................................ ................................................................................................................................................... 2 ................................................................................................................................................ ...............................................................................................................................................[2] The students decided to test the following hypotheses: Hypothesis 1: The amount of traffic decreases as distance from the city centre increases. Hypothesis 2: Pedestrian numbers decrease as distance from the city centre increases. (b) To test these hypotheses the students chose counting sites along four roads going from the city centre towards the edge of the city. These are shown on Fig. 6 (Insert). (i) The students did a 15-minute traffic count at 08:00, 13:00 and 18:00 hours. Describe how the students would carry out their traffic count at each site. ........................................................................................................................................... ........................................................................................................................................... ........................................................................................................................................... ........................................................................................................................................... ........................................................................................................................................... ........................................................................................................................................... ........................................................................................................................................... .......................................................................................................................................[4] (ii) The students calculated the average results of the three traffic counts done at each site. These are shown in Table 3 (Insert). Use the data in Table 3 to complete sites B, C and D on road 4 in Fig. 7 (below). [3] Average results of traffic count at each site 250 200 150 number of vehicles 100 50 0 A B C D E F site increasing distance from city centre Key road 1 road 2 road 3 road 4 Fig. 7 (iii) The students made the conclusion that Hypothesis 1: The amount of traffic decreases as distance from the city centre increases was partly correct. Support their decision with data from Table 3 (Insert) and Fig. 7. Include reference to any anomalies in the results. ........................................................................................................................................... ........................................................................................................................................... ........................................................................................................................................... ........................................................................................................................................... ........................................................................................................................................... ........................................................................................................................................... ........................................................................................................................................... .......................................................................................................................................[4] (iv) Use evidence from Fig. 7 and Table 3 to compare the amount of traffic on road 1 and the amount of traffic on road 3. ........................................................................................................................................... ........................................................................................................................................... ........................................................................................................................................... .......................................................................................................................................[2] (c) When they had completed their traffic counts the students did pedestrian counts at the same sites. Their results are shown in Table 4 (Insert). (i) Plot the result for site C on road 4 on Fig. 8 (opposite). [1] (ii) Do the students’ results support Hypothesis 2: Pedestrian numbers decrease as distance from the city centre increases? Support your decision with evidence from Table 4 and Fig. 8. ........................................................................................................................................... ........................................................................................................................................... ........................................................................................................................................... ........................................................................................................................................... ........................................................................................................................................... .......................................................................................................................................[3]
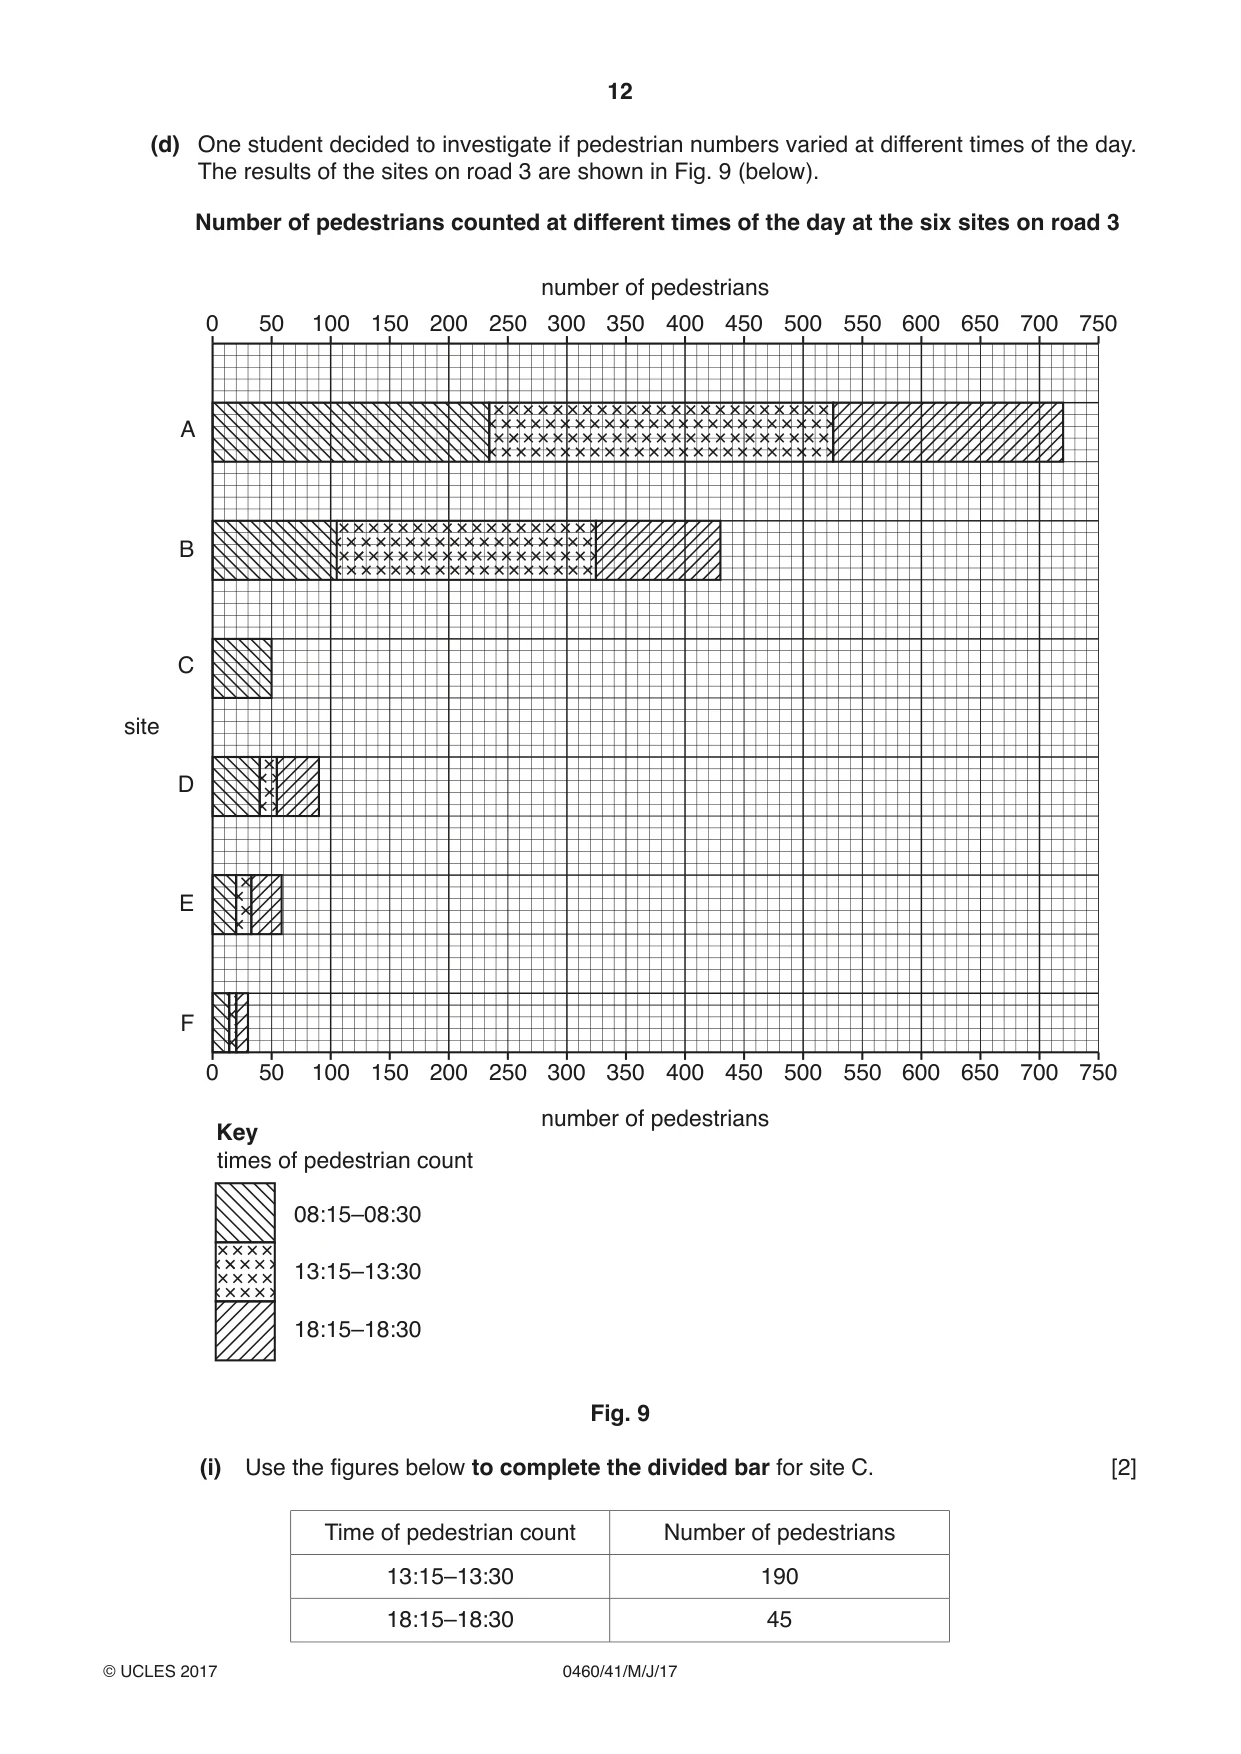
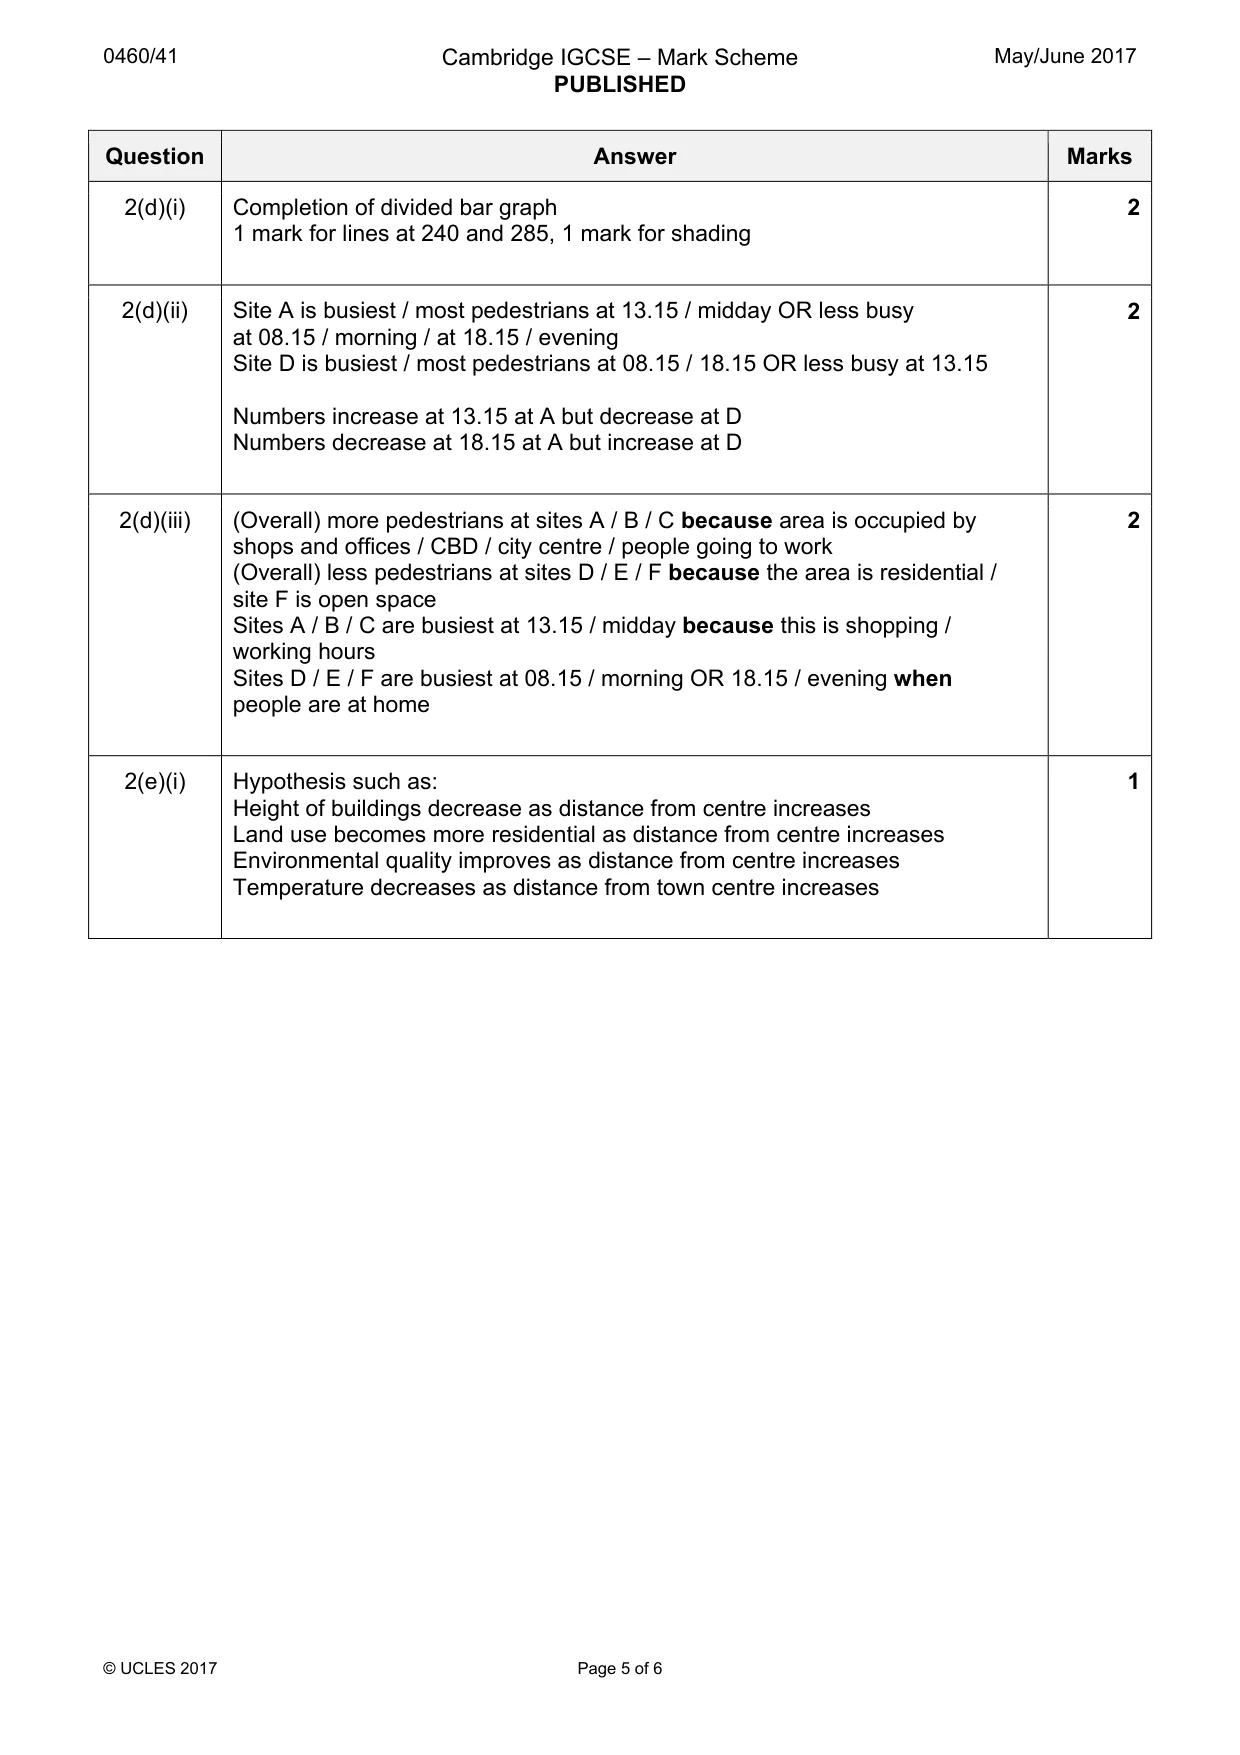
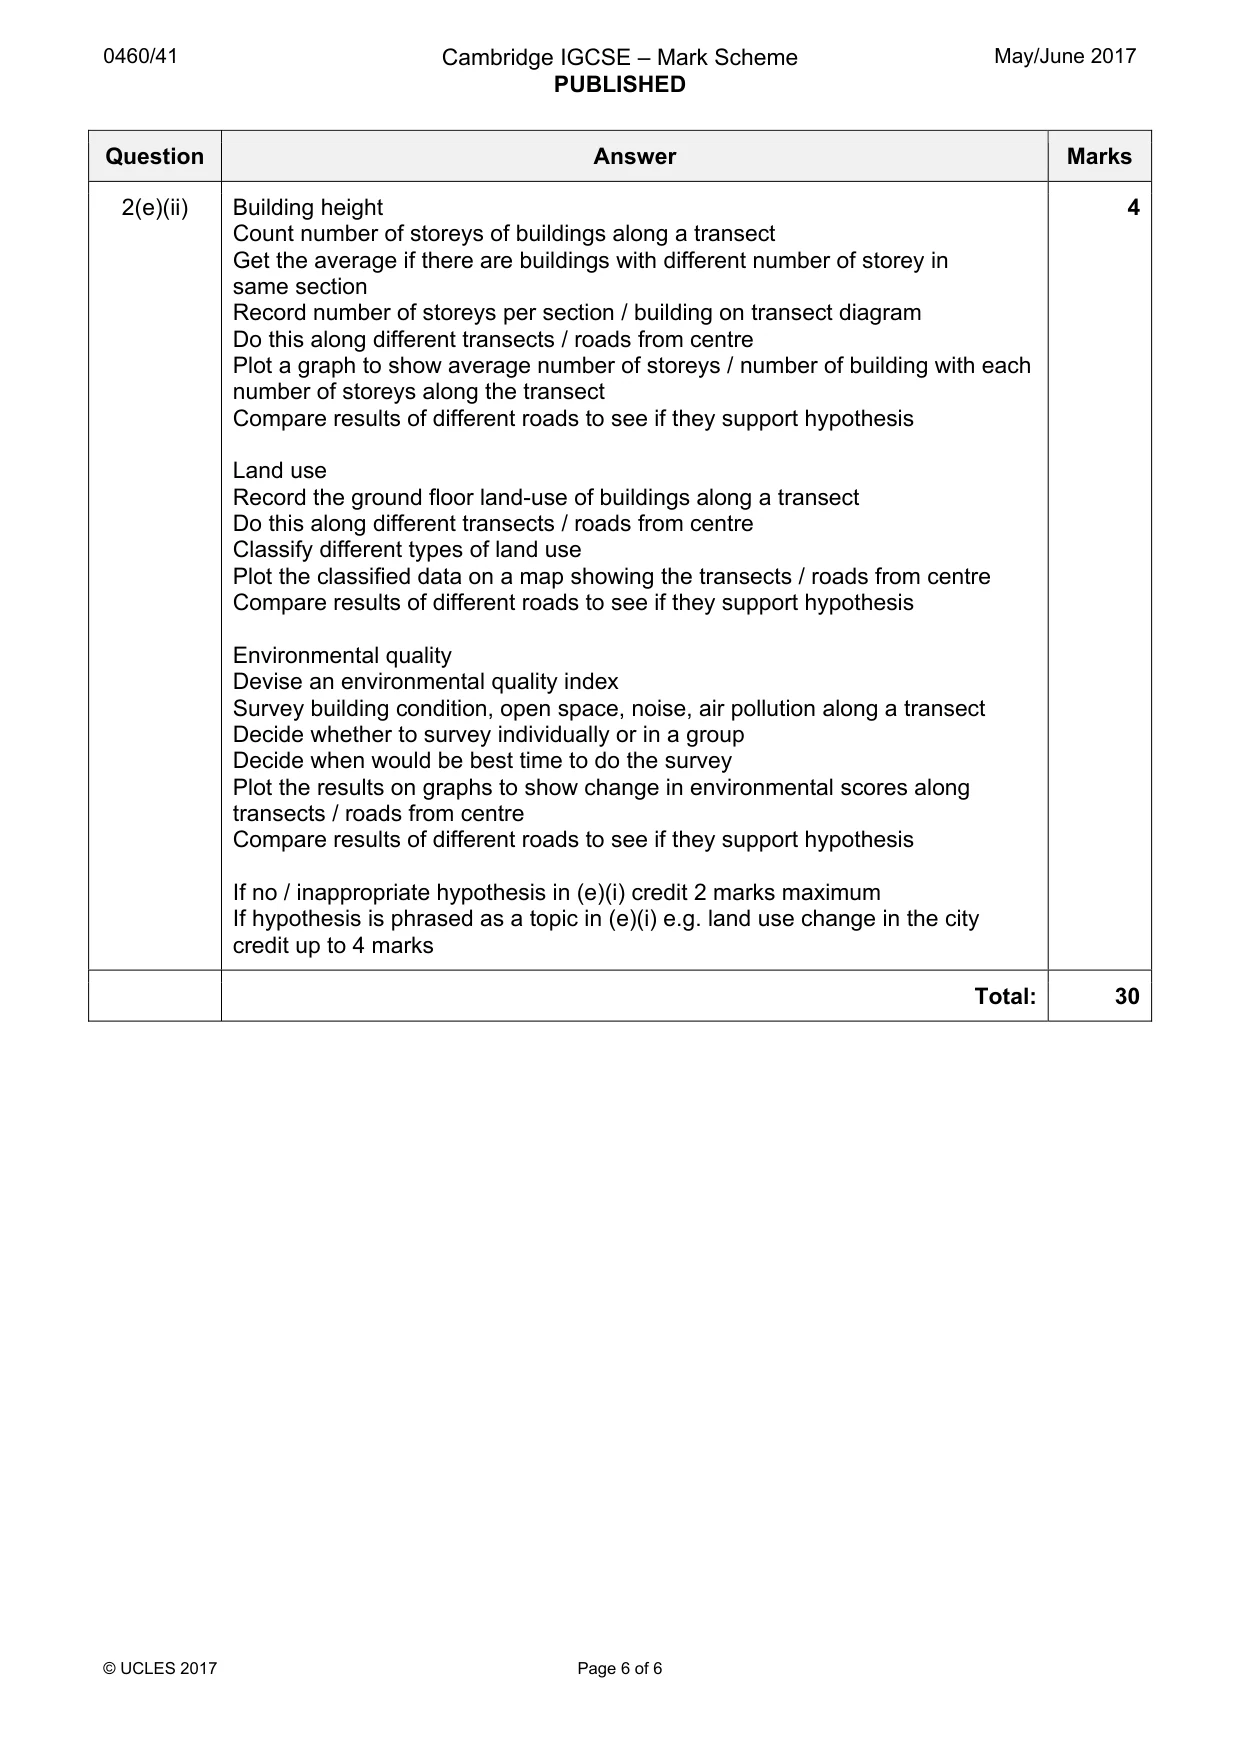
Mark scheme: 2(a) Tall / multi storey 2 High concentration / near together Offices / shops / apartments / hotels / business / commerce Old / historical / modern / redevelopment 2(b)(i) Organise themselves – e.g. one student on each side of the road / 4 different groups go to different sites One student shouts out data and another student records it / one student counts one way and the other student counts the other Use equipment such as stopwatch / counter / clicker / timer Synchronise timing / start and finish at same time Use tally method / record on tally sheet 2(b)(ii) Plotting a square at sites B (132), C (186) and D (93) on road 4 3 –1 mark if not use square 2(b)(iii) (Overall) decrease in traffic from site A to site F 4 Credit one anomaly (site and road) – anomalies are sites B and E on road 1 / sites B and C on road 2 /site C on road 3 / site C on road 4 Credit 2 marks maximum for paired data which shows general decrease and anomaly e.g. General decrease – on road 1: 75 at site A and 6 at site F Anomaly – on road 3: 215 at site B and 228 at site C 2(b)(iv) Amount of traffic is higher on road 3 2 Larger decrease from site A to site F in amount of traffic on road 3 Increase in traffic from site A to B / site D to E on road 1 but numbers go down between these sites on road 3 OR Increase in traffic from site B to C on road 3 but numbers go down between these sites on road 1 Credit 1 mark (not reserve) for paired data which compares roads 1 and 3 e.g. At site A 246 on road 3 and 75 on road 1 / 171 more on road 3 Total traffic = 909 on road 3 and 246 on road 1 Average traffic = 151.5 on road 3 and 41 on road 1 2(c)(i) Plot 60 at site C on road 4 with correct shading 1 2(c)(ii) Hypothesis 2 is correct / partly correct / Yes – 1 mark reserve 3 Credit 1 mark maximum for paired data from one road to support hypothesis e.g. On road 1: 58 at site A to 10 at site F OR paired date from sites e.g. At site A numbers vary between 58 and 240 and at site F between 4 and 13 Credit 1 mark maximum for anomaly on road 1 or road 4 e.g. 56 at site B and 60 at site C on road 4 / increase by 4 7 at site E and 10 at site F on road 1 / increase by 3 2(d)(i) Completion of divided bar graph 2 1 mark for lines at 240 and 285, 1 mark for shading 2(d)(ii) Site A is busiest / most pedestrians at 13.15 / midday OR less busy 2 at 08.15 / morning / at 18.15 / evening Site D is busiest / most pedestrians at 08.15 / 18.15 OR less busy at 13.15 Numbers increase at 13.15 at A but decrease at D Numbers decrease at 18.15 at A but increase at D 2(d)(iii) (Overall) more pedestrians at sites A / B / C because area is occupied by 2 shops and offices / CBD / city centre / people going to work (Overall) less pedestrians at sites D / E / F because the area is residential / site F is open space Sites A / B / C are busiest at 13.15 / midday because this is shopping / working hours Sites D / E / F are busiest at 08.15 / morning OR 18.15 / evening when people are at home 2(e)(i) Hypothesis such as: 1 Height of buildings decrease as distance from centre increases Land use becomes more residential as distance from centre increases Environmental quality improves as distance from centre increases Temperature decreases as distance from town centre increases 2(e)(ii) Building height 4 Count number of storeys of buildings along a transect Get the average if there are buildings with different number of storey in same section Record number of storeys per section / building on transect diagram Do this along different transects / roads from centre Plot a graph to show average number of storeys / number of building with each number of storeys along the transect Compare results of different roads to see if they support hypothesis Land use Record the ground floor land-use of buildings along a transect Do this along different transects / roads from centre Classify different types of land use Plot the classified data on a map showing the transects / roads from centre Compare results of different roads to see if they support hypothesis Environmental quality Devise an environmental quality index Survey building condition, open space, noise, air pollution along a transect Decide whether to survey individually or in a group Decide when would be best time to do the survey Plot the results on graphs to show change in environmental scores along transects / roads from centre Compare results of different roads to see if they support hypothesis If no / inappropriate hypothesis in (e)(i) credit 2 marks maximum If hypothesis is phrased as a topic in (e)(i) e.g. land use change in the city credit up to 4 marks Total: 30
What was in this paper
The subtopics covered by these 2 questions, and how many questions each got. Open one in a new tab to see every Cambridge question on it.
What you needed in this session
Cambridge’s own grade thresholds for 2017 May/June, Paper 4 · Variant 1. A higher threshold means an easier paper — the bar moves with how the cohort did.