Cambridge IGCSE Geography 0460 — 2017 May/June Paper 4 · Variant 2
0460/42/M/J/17 · 2 questions · 60 marks · ≈68 min
The question paper and its mark scheme, free to read here and free to download. This is Cambridge’s own paper, exactly as it was sat.
Question paper20 pages







Mark scheme7 pages
Answers below. Sit the paper first if you are practising.


Questions as text
Q1 · Students in Wales went on a field visit to an area of coastal sand dunes near to their…
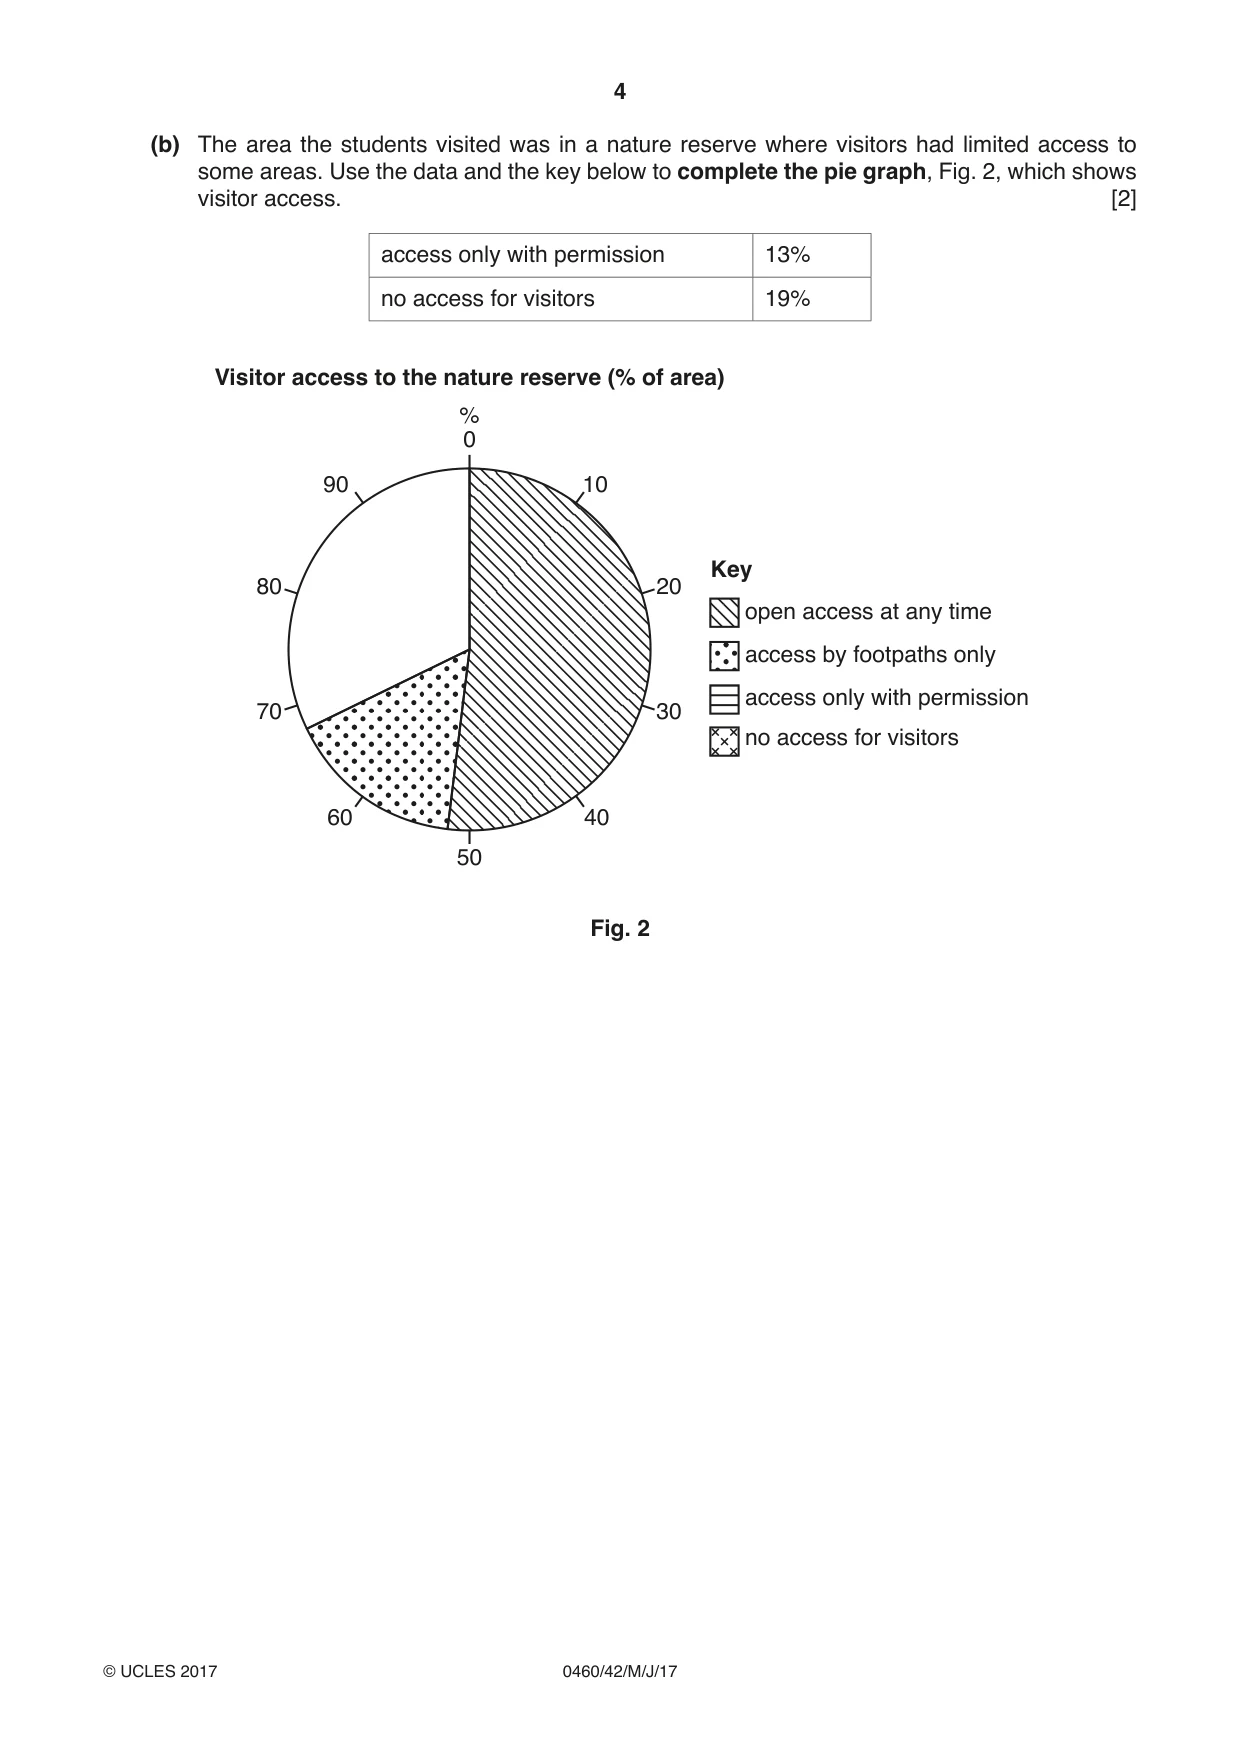
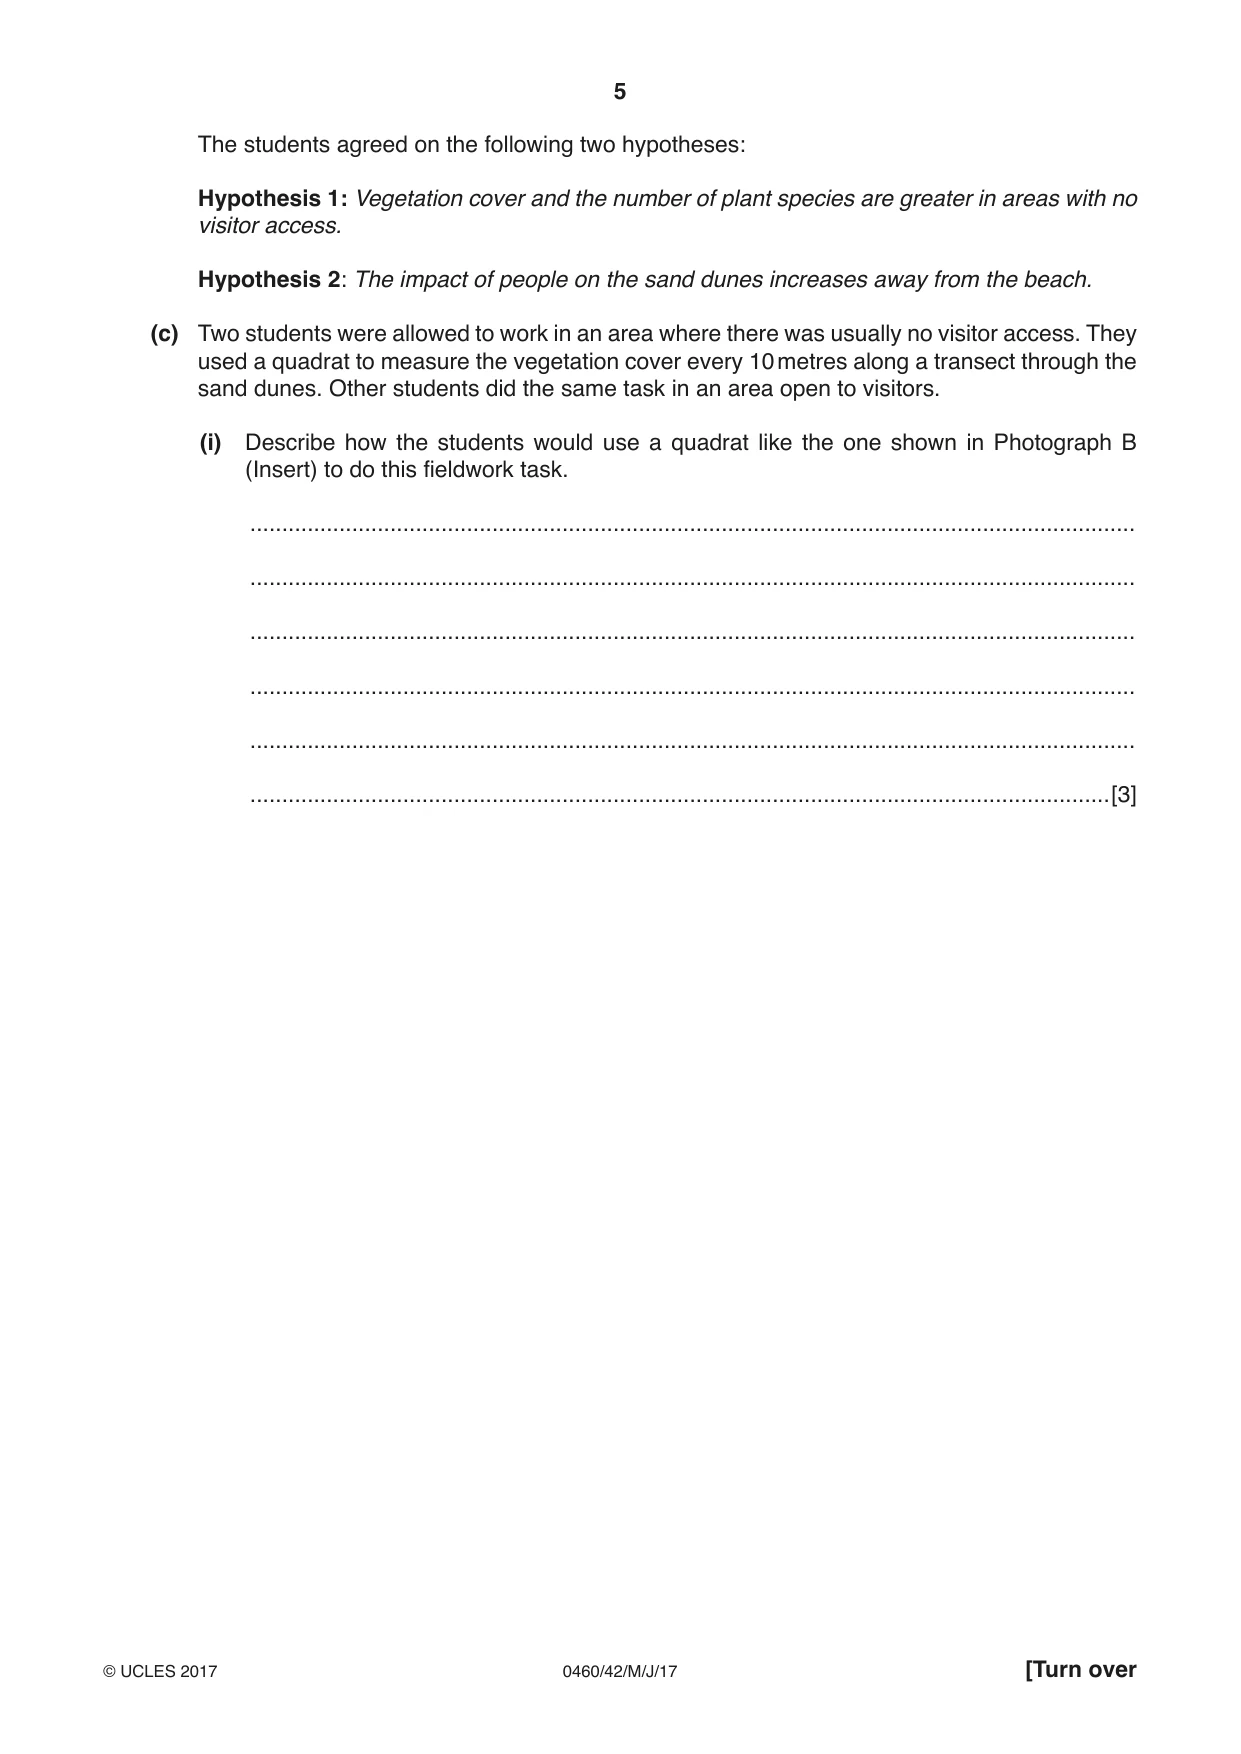
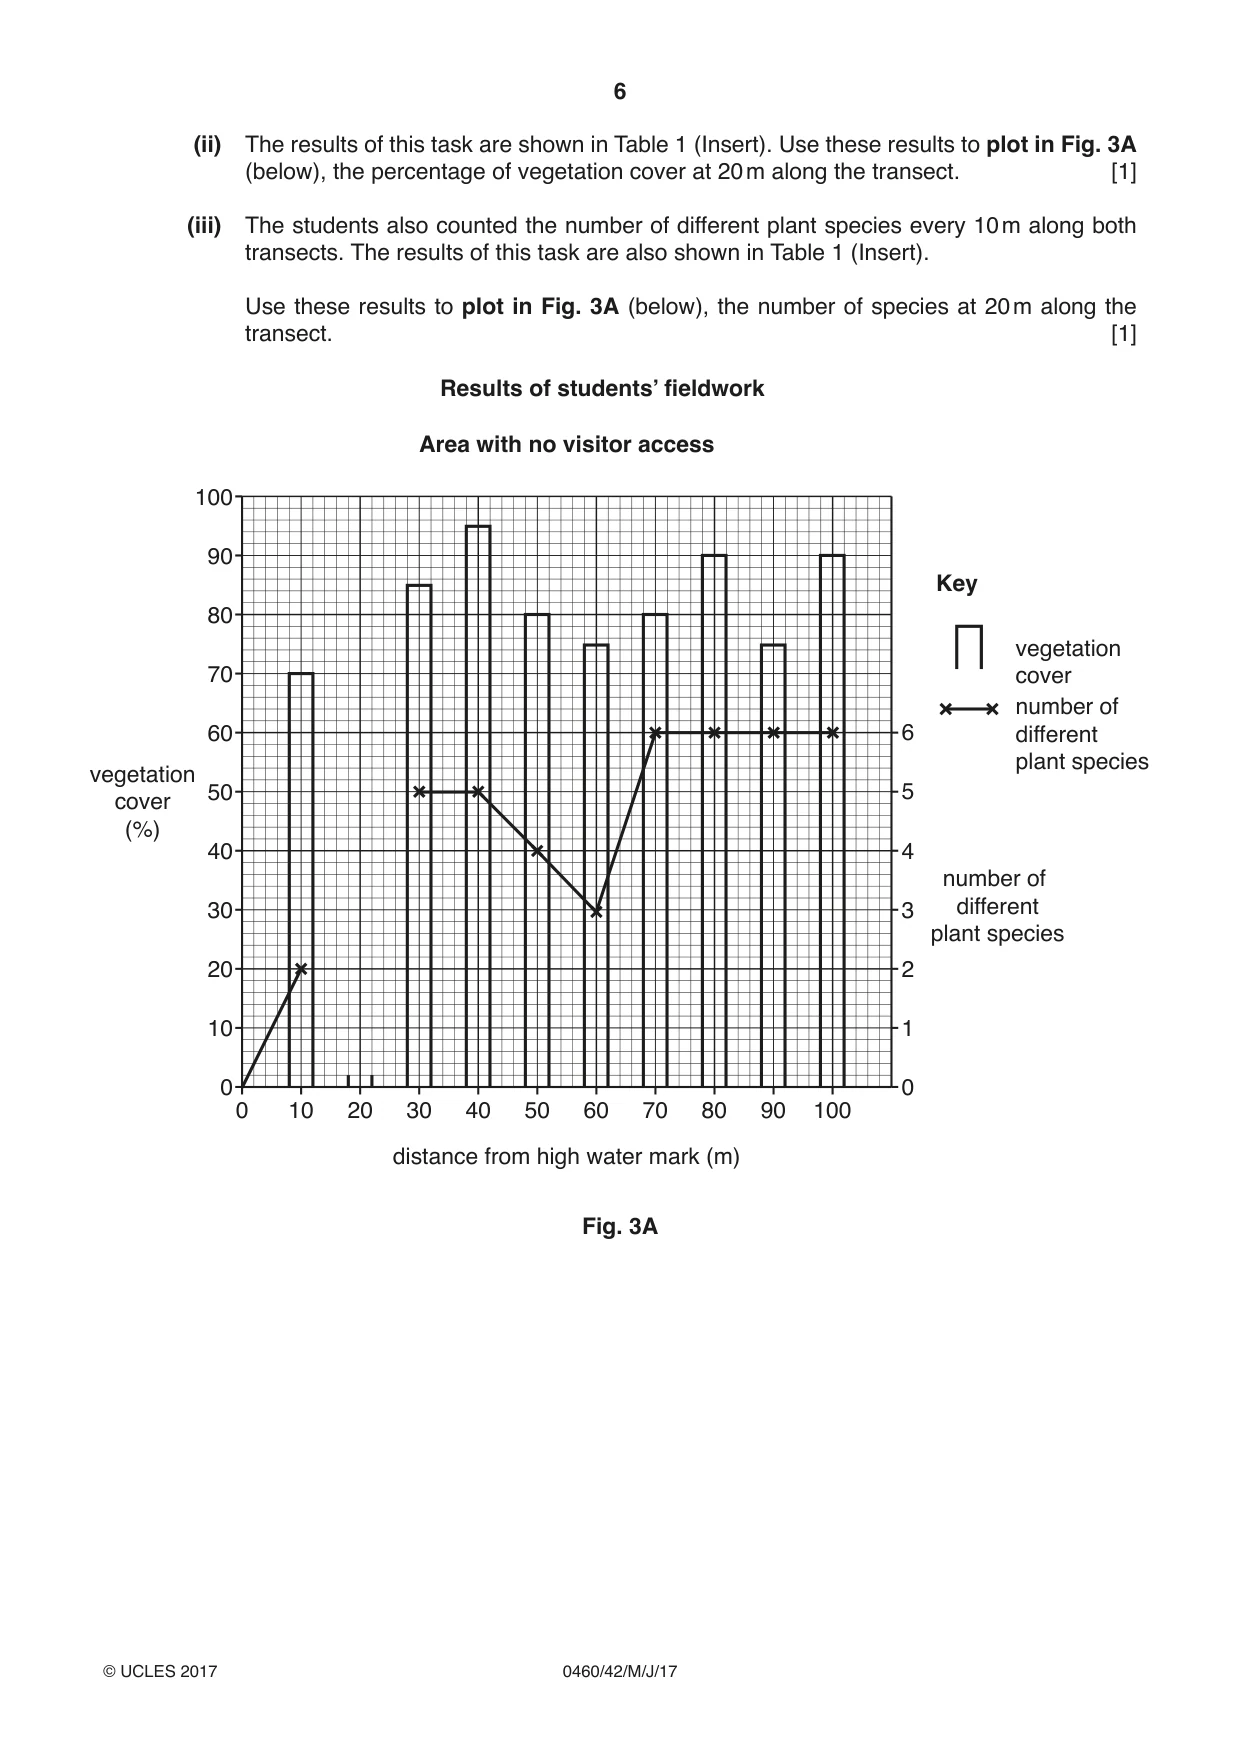
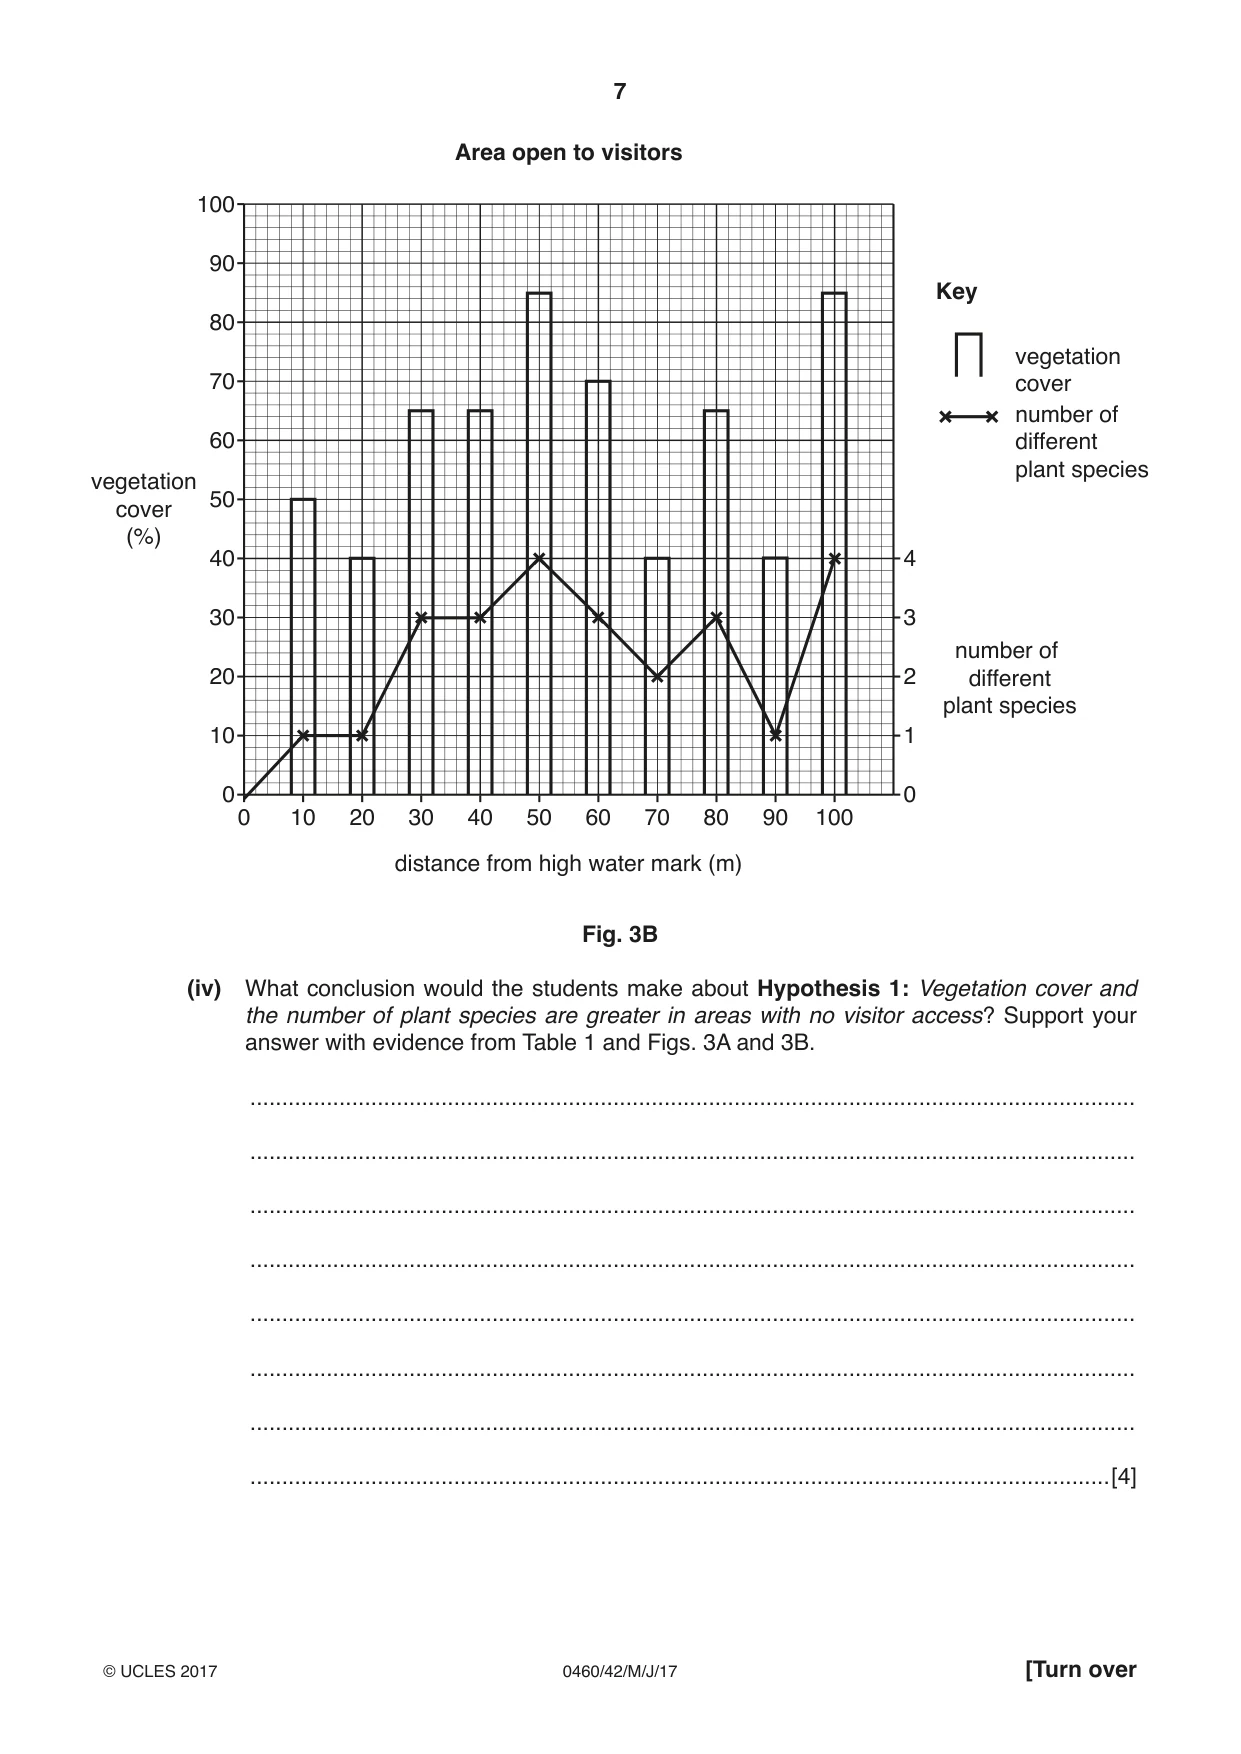
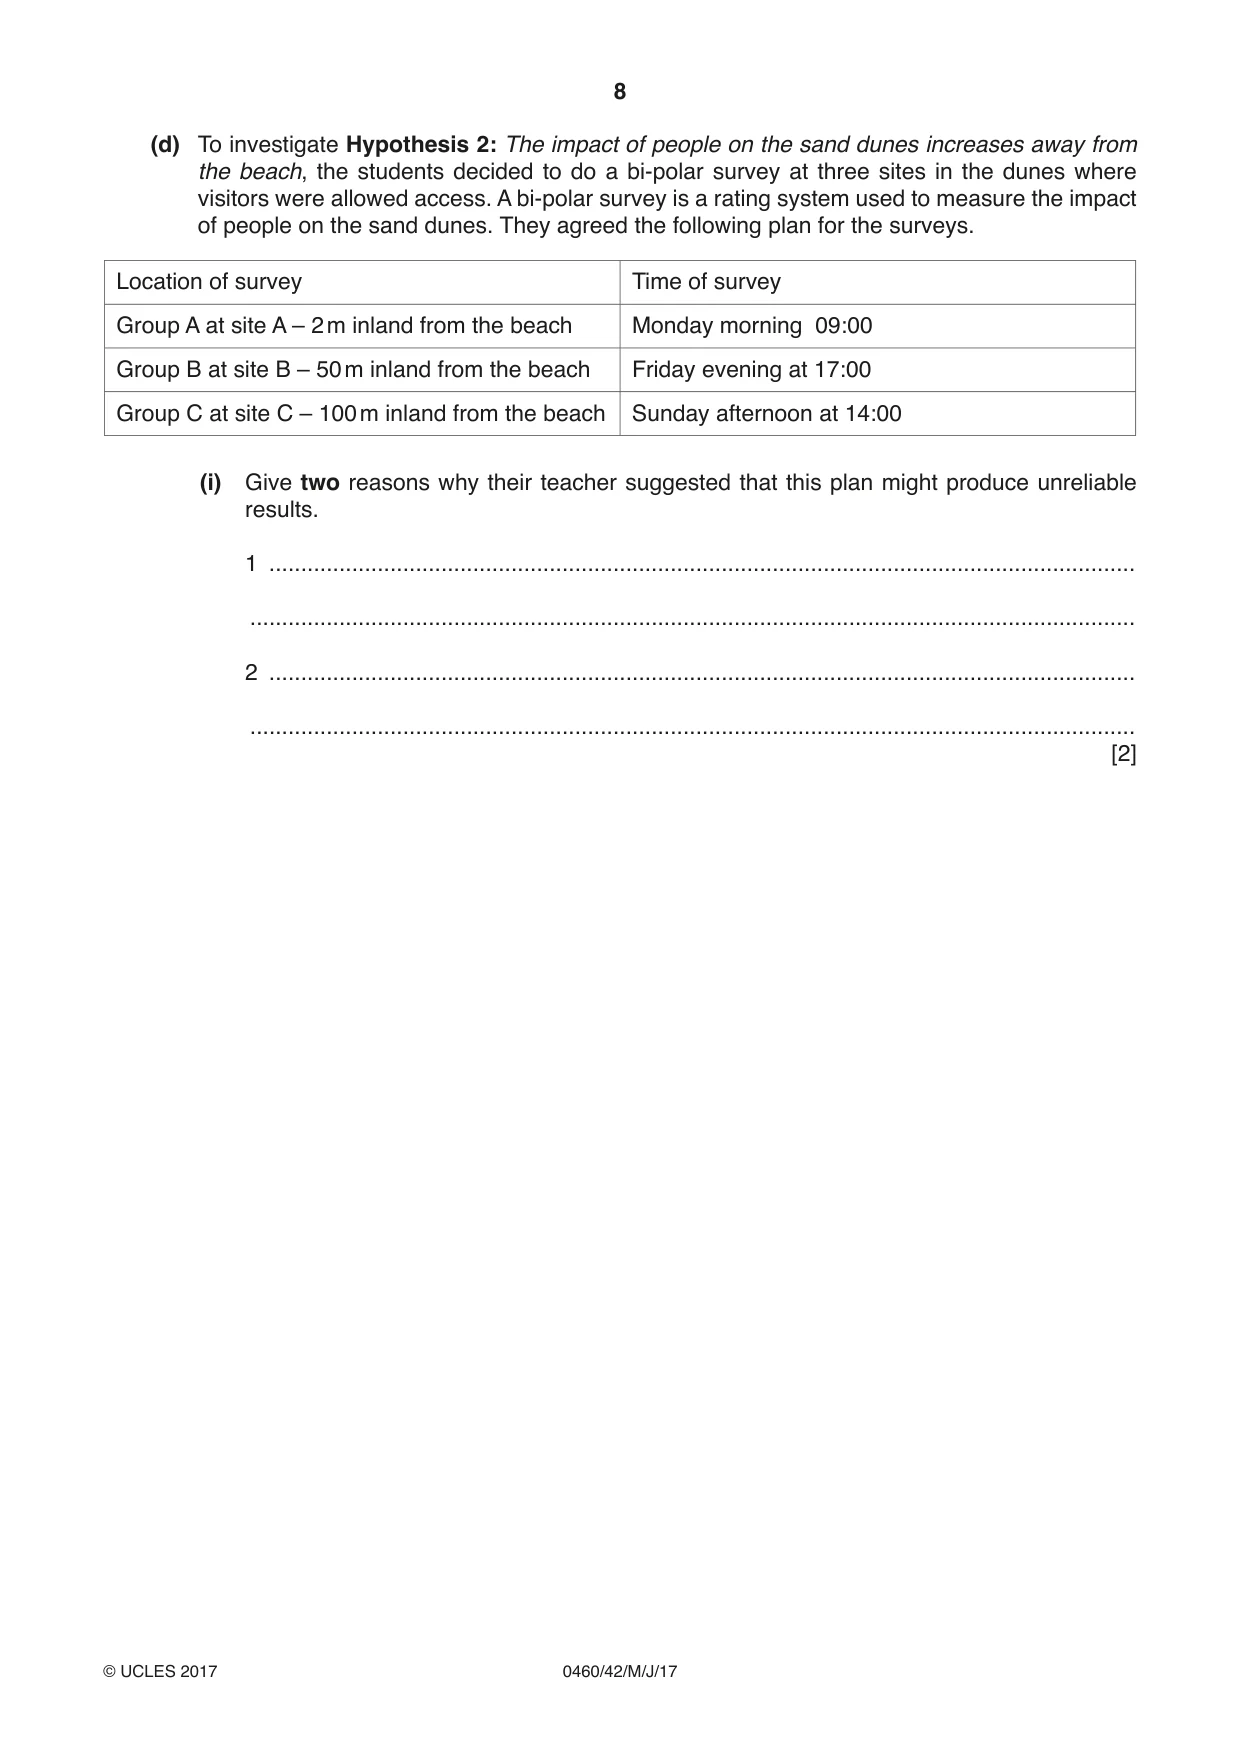
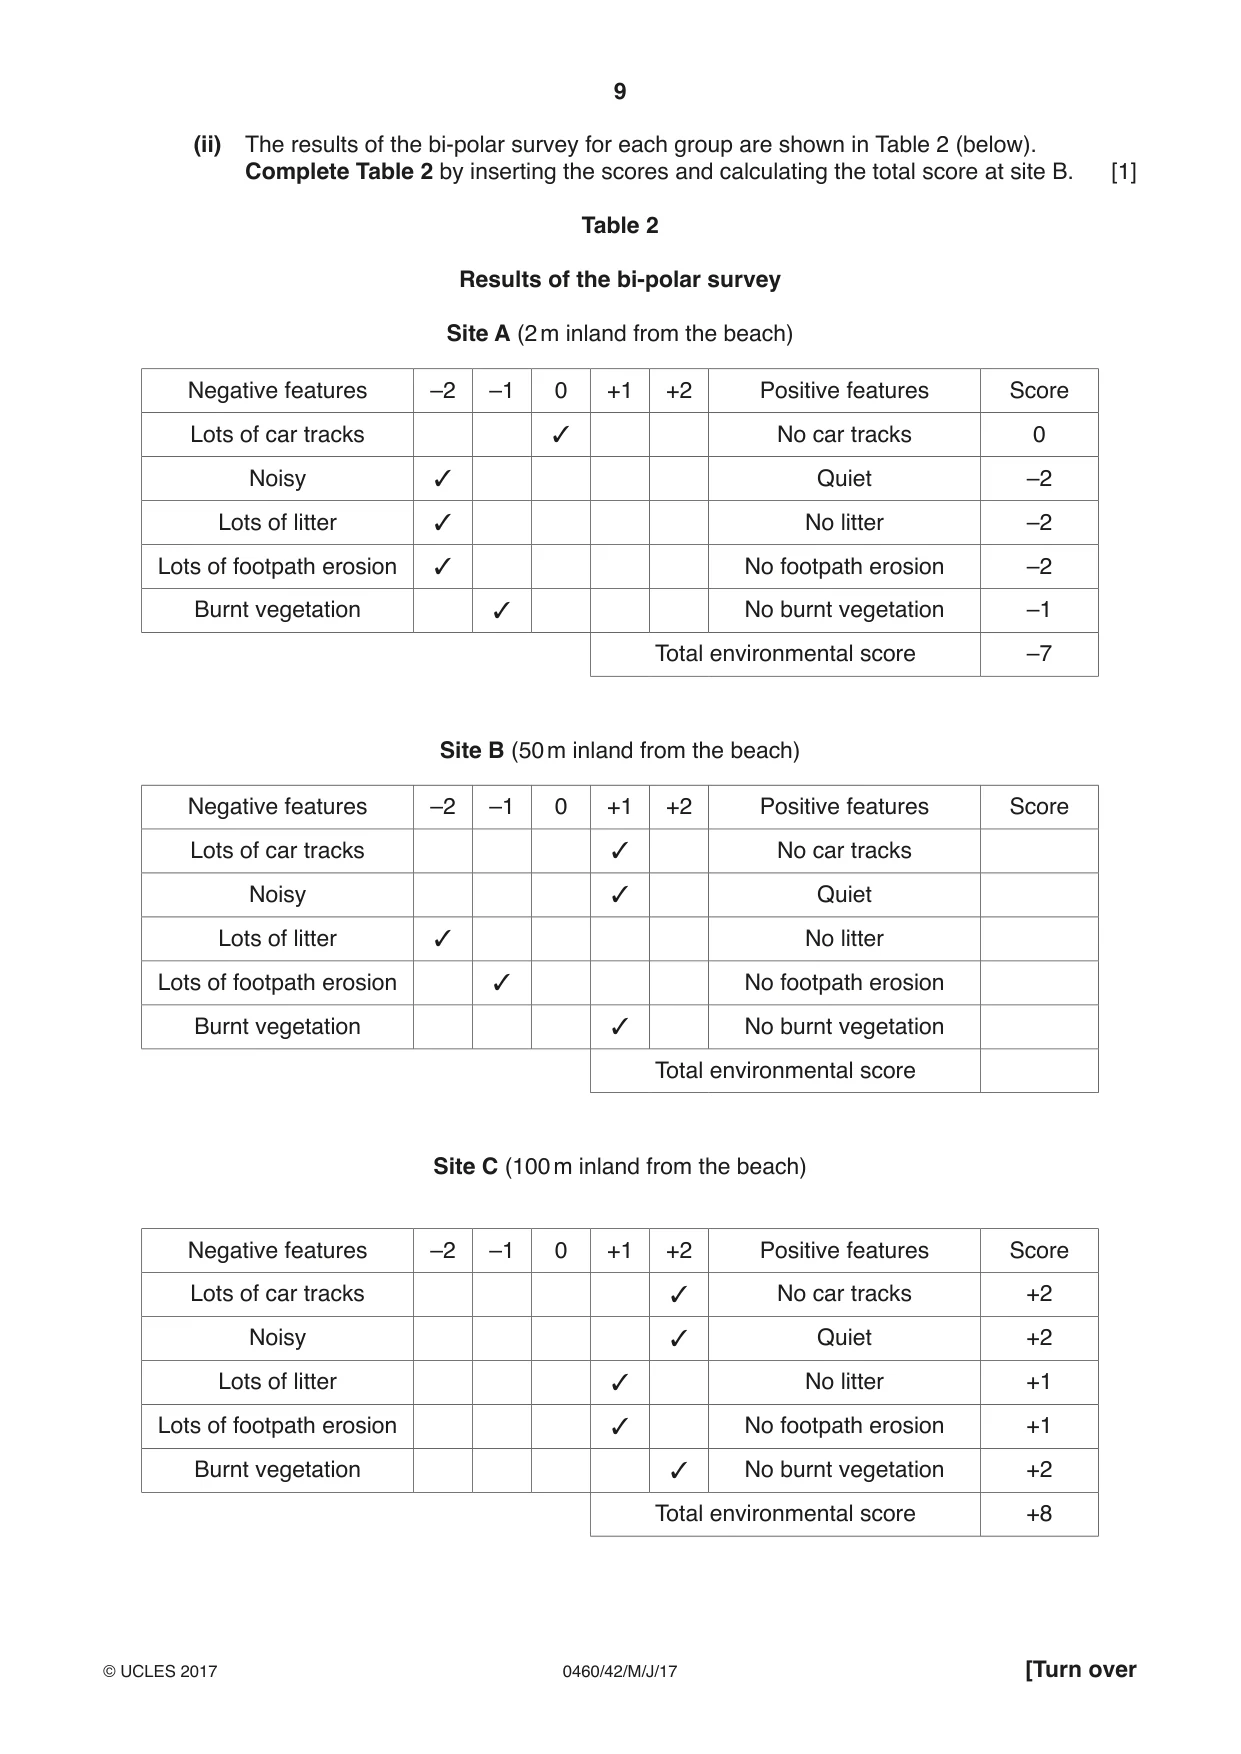
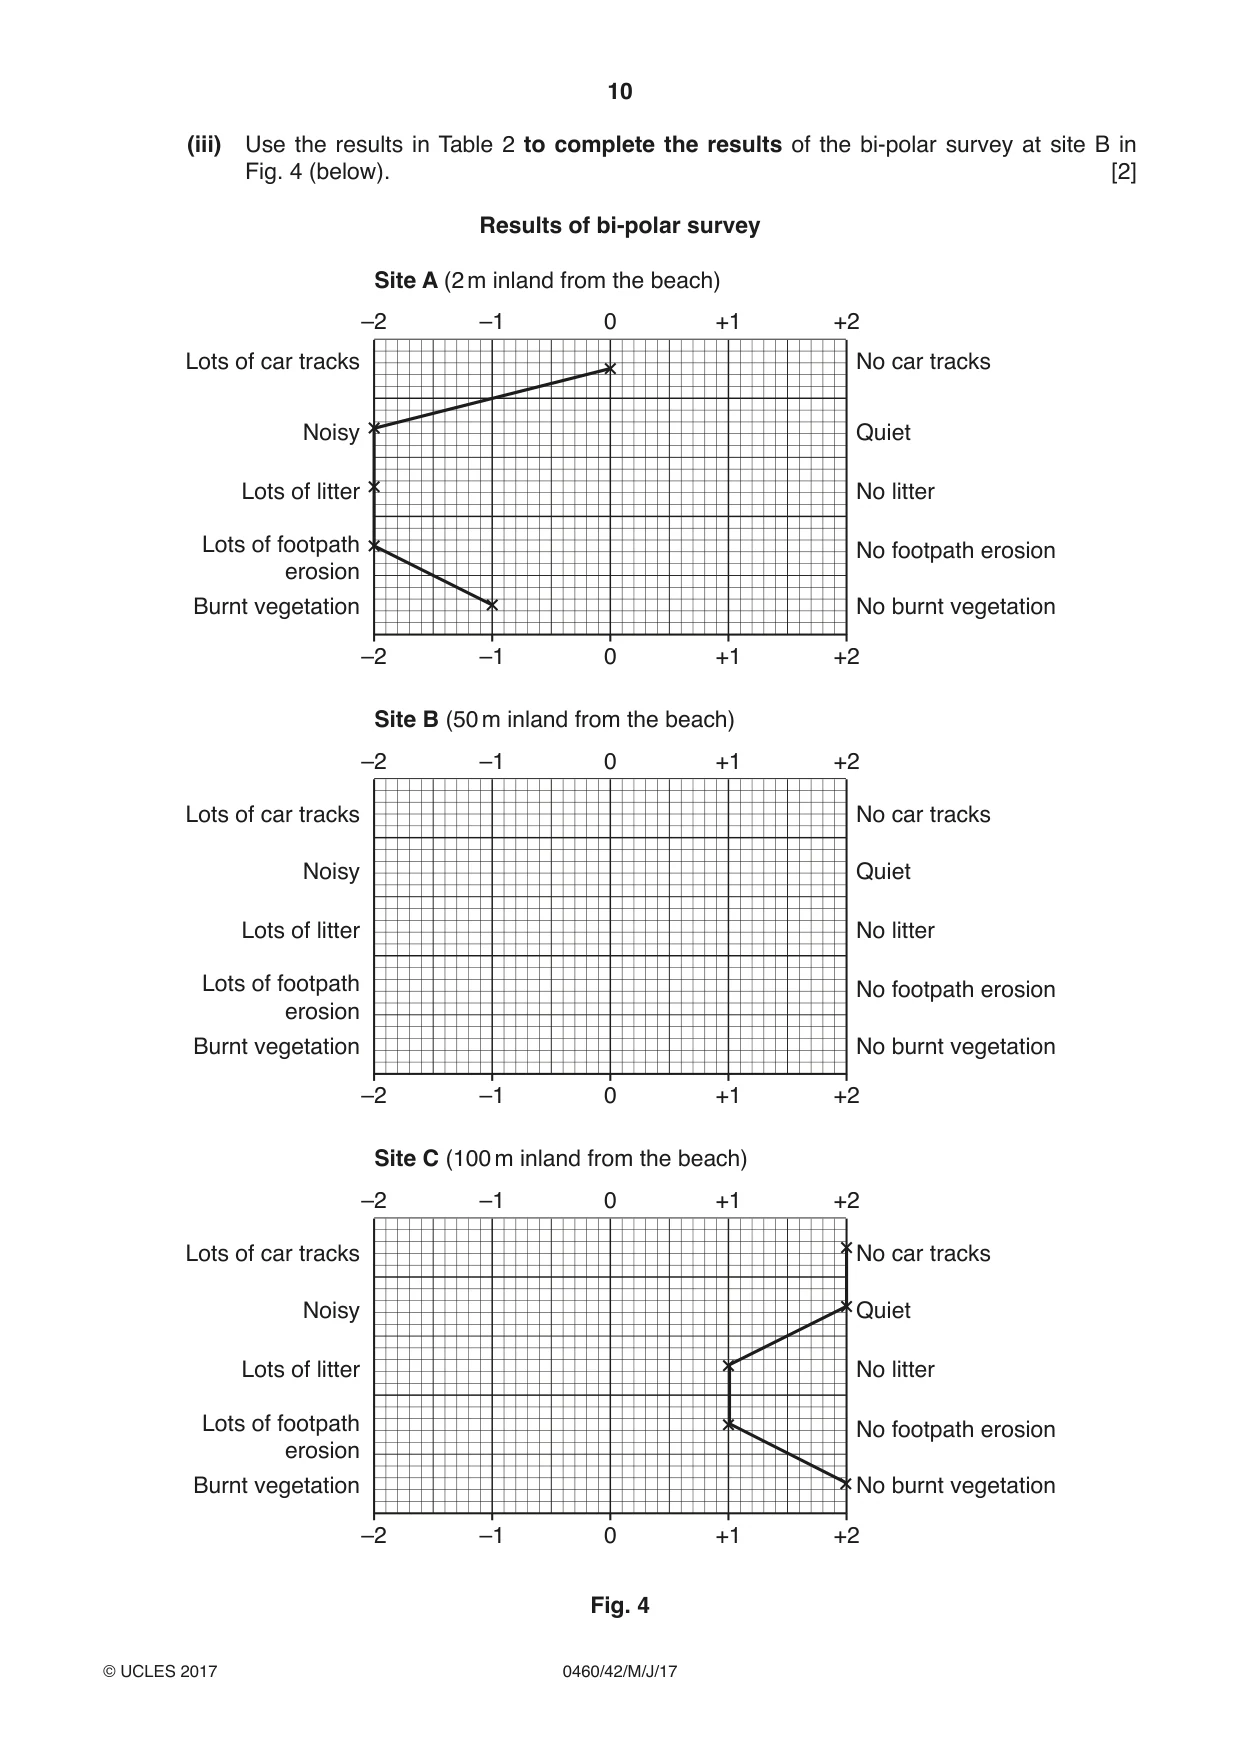
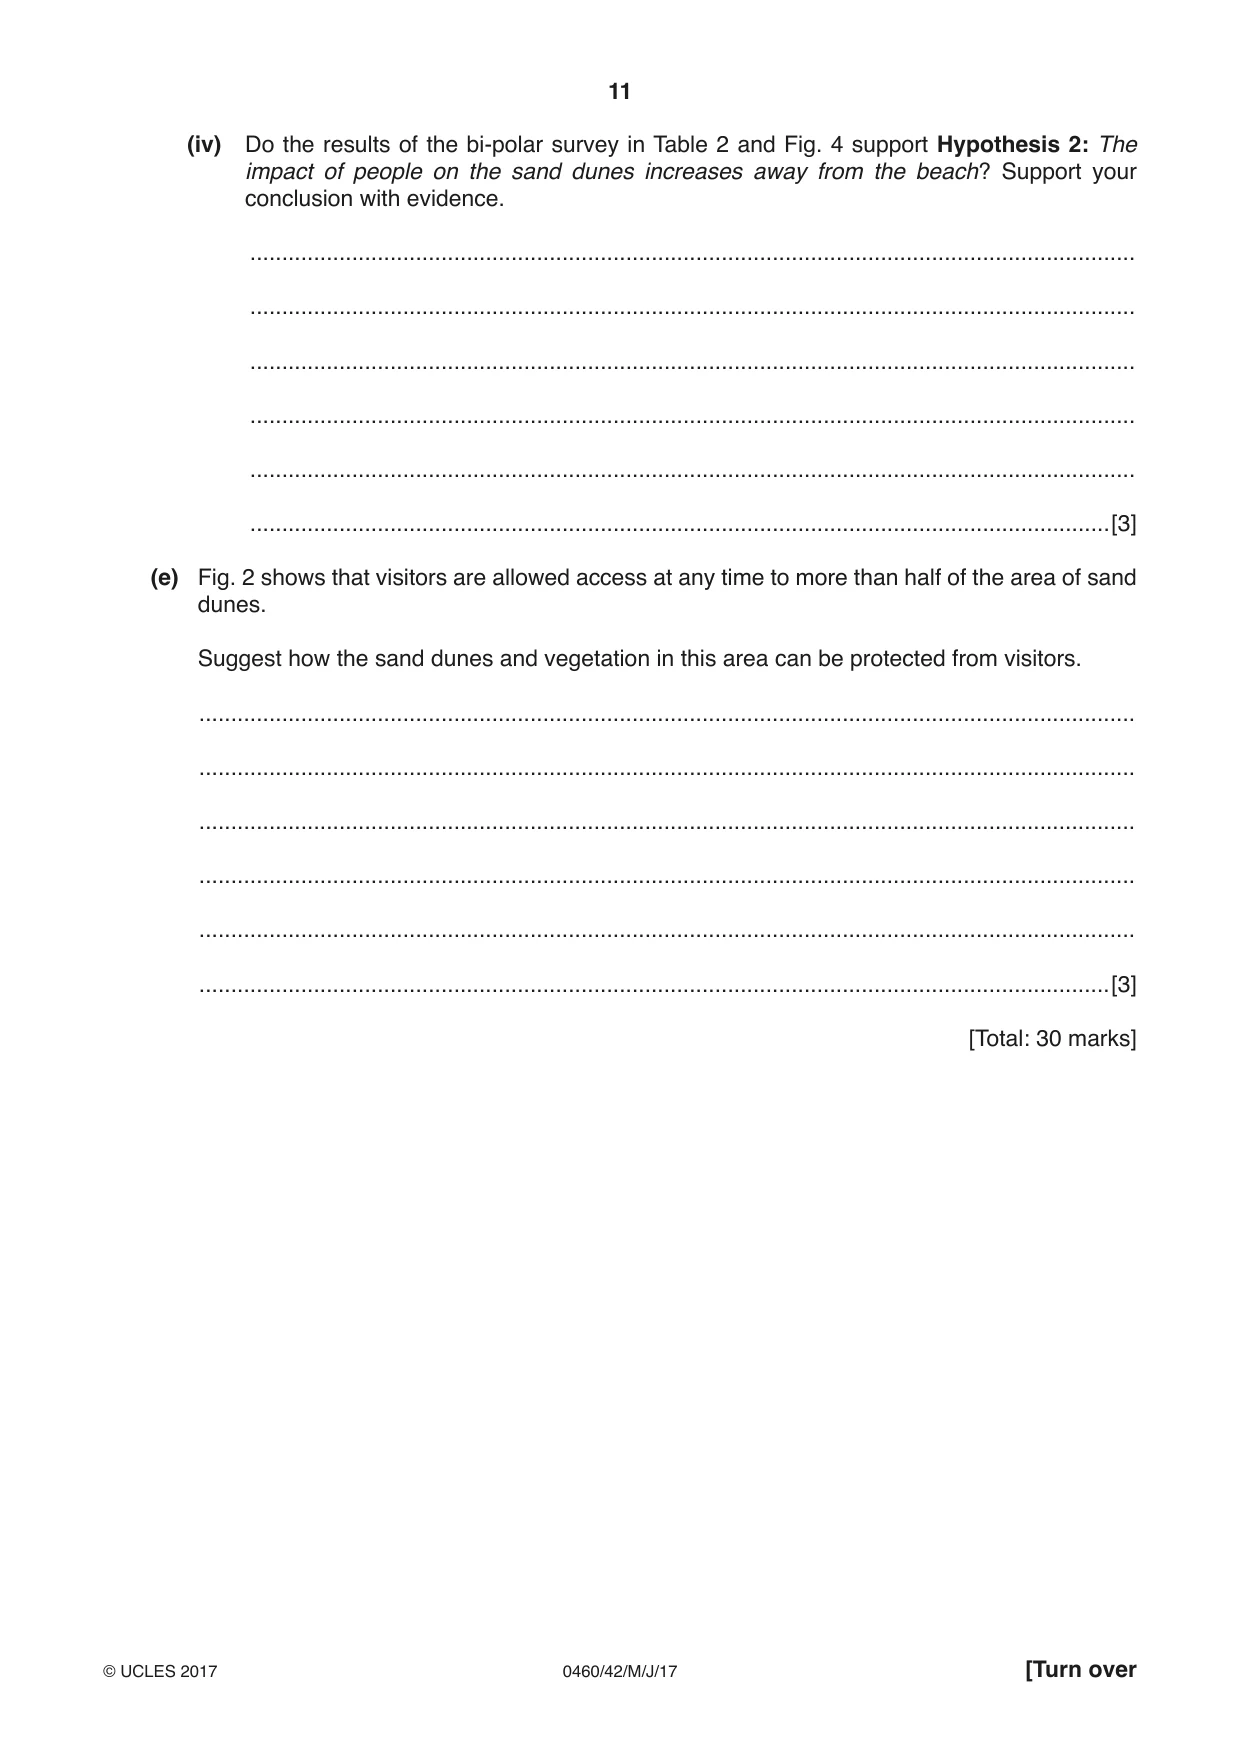
1 Students in Wales went on a field visit to an area of coastal sand dunes near to their school. They had studied the formation of sand dunes and wanted to find out about the amount of marram grass and other vegetation growing on them. Photograph A (Insert) shows the coastal sand dunes they visited. Coastal sand dunes are popular places for people to visit and this may affect the growth of vegetation. (a) (i) Explain how sand dunes like those shown in Photograph A are formed. ........................................................................................................................................... ........................................................................................................................................... ........................................................................................................................................... ........................................................................................................................................... ........................................................................................................................................... ........................................................................................................................................... ........................................................................................................................................... .......................................................................................................................................[4] (ii) The students used the fieldwork equipment shown in Fig. 1 (below) to measure the changing angle of slope across the sand dunes. Measuring the changing angle of slope ranging pole clinometer string tape measure Fig. 1 Explain how the following equipment was used: Tape measure; ........................................................................................................................................... ........................................................................................................................................... Ranging poles; ........................................................................................................................................... ........................................................................................................................................... String; ........................................................................................................................................... ........................................................................................................................................... Clinometer. ........................................................................................................................................... ........................................................................................................................................... [4] (b) The area the students visited was in a nature reserve where visitors had limited access to some areas. Use the data and the key below to complete the pie graph, Fig. 2, which shows visitor access. [2] access only with permission 13% no access for visitors 19% Visitor access to the nature reserve (% of area) % 0 90 10 Key 80 20 open access at any time access by footpaths only access only with permission 70 30 no access for visitors 60 40 50 Fig. 2 The students agreed on the following two hypotheses: Hypothesis 1: Vegetation cover and the number of plant species are greater in areas with no visitor access. Hypothesis 2: The impact of people on the sand dunes increases away from the beach. (c) Two students were allowed to work in an area where there was usually no visitor access. They used a quadrat to measure the vegetation cover every 10 metres along a transect through the sand dunes. Other students did the same task in an area open to visitors. (i) Describe how the students would use a quadrat like the one shown in Photograph B (Insert) to do this fieldwork task. ........................................................................................................................................... ........................................................................................................................................... ........................................................................................................................................... ........................................................................................................................................... ........................................................................................................................................... .......................................................................................................................................[3] (ii) The results of this task are shown in Table 1 (Insert). Use these results to plot in Fig. 3A (below), the percentage of vegetation cover at 20 m along the transect. [1] (iii) The students also counted the number of different plant species every 10 m along both transects. The results of this task are also shown in Table 1 (Insert). Use these results to plot in Fig. 3A (below), the number of species at 20 m along the transect. [1] Results of students’ fieldwork Area with no visitor access 100 90 Key 80 vegetation 70 cover number of 60 6 different plant speciesvegetation 50 5 cover (%) 40 4 number of 30 3 different plant species 20 2 10 1 0 0 0 10 20 30 40 50 60 70 80 90 100 distance from high water mark (m) Fig. 3A Area open to visitors 100 90 Key 80 vegetation 70 cover number of 60 different plant speciesvegetation 50 cover (%) 40 4 30 3 number of 20 2 different plant species 10 1 0 0 0 10 20 30 40 50 60 70 80 90 100 distance from high water mark (m) Fig. 3B (iv) What conclusion would the students make about Hypothesis 1: Vegetation cover and the number of plant species are greater in areas with no visitor access? Support your answer with evidence from Table 1 and Figs. 3A and 3B. ........................................................................................................................................... ........................................................................................................................................... ........................................................................................................................................... ........................................................................................................................................... ........................................................................................................................................... ........................................................................................................................................... ........................................................................................................................................... .......................................................................................................................................[4] (d) To investigate Hypothesis 2: The impact of people on the sand dunes increases away from the beach, the students decided to do a bi-polar survey at three sites in the dunes where visitors were allowed access. A bi-polar survey is a rating system used to measure the impact of people on the sand dunes. They agreed the following plan for the surveys. Location of survey Time of survey Group A at site A – 2 m inland from the beach Monday morning 09:00 Group B at site B – 50 m inland from the beach Friday evening at 17:00 Group C at site C – 100 m inland from the beach Sunday afternoon at 14:00 (i) Give two reasons why their teacher suggested that this plan might produce unreliable results. 1 ........................................................................................................................................ ........................................................................................................................................... 2 ........................................................................................................................................ ........................................................................................................................................... [2] (ii) The results of the bi-polar survey for each group are shown in Table 2 (below). Complete Table 2 by inserting the scores and calculating the total score at site B. [1] Table 2 Results of the bi-polar survey Site A (2 m inland from the beach) Negative features –2 –1 0 +1 +2 Positive features Score 3 Lots of car tracks No car tracks 0 3 Noisy Quiet –2 3 Lots of litter No litter –2 3Lots of footpath erosion No footpath erosion –2 3 Burnt vegetation No burnt vegetation –1 Total environmental score –7 Site B (50 m inland from the beach) Negative features –2 –1 0 +1 +2 Positive features Score 3 Lots of car tracks No car tracks 3 Noisy Quiet 3 Lots of litter No litter 3Lots of footpath erosion No footpath erosion 3 Burnt vegetation No burnt vegetation Total environmental score Site C (100 m inland from the beach) Negative features –2 –1 0 +1 +2 Positive features Score 3 Lots of car tracks No car tracks +2 3 Noisy Quiet +2 3 Lots of litter No litter +1 3Lots of footpath erosion No footpath erosion +1 3 Burnt vegetation No burnt vegetation +2 Total environmental score +8 (iii) Use the results in Table 2 to complete the results of the bi-polar survey at site B in Fig. 4 (below). [2] Results of bi-polar survey Site A (2 m inland from the beach) –2 –1 0 +1 +2 Lots of car tracks No car tracks Noisy Quiet Lots of litter No litter Lots of footpath No footpath erosion erosion Burnt vegetation No burnt vegetation –2 –1 0 +1 +2 Site B (50 m inland from the beach) –2 –1 0 +1 +2 Lots of car tracks No car tracks Noisy Quiet Lots of litter No litter Lots of footpath No footpath erosion erosion Burnt vegetation No burnt vegetation –2 –1 0 +1 +2 Site C (100 m inland from the beach) –2 –1 0 +1 +2 Lots of car tracks No car tracks Noisy Quiet Lots of litter No litter Lots of footpath No footpath erosion erosion Burnt vegetation No burnt vegetation –2 –1 0 +1 +2 Fig. 4 (iv) Do the results of the bi-polar survey in Table 2 and Fig. 4 support Hypothesis 2: The impact of people on the sand dunes increases away from the beach? Support your conclusion with evidence. ........................................................................................................................................... ........................................................................................................................................... ........................................................................................................................................... ........................................................................................................................................... ........................................................................................................................................... .......................................................................................................................................[3] (e) Fig. 2 shows that visitors are allowed access at any time to more than half of the area of sand dunes. Suggest how the sand dunes and vegetation in this area can be protected from visitors. ................................................................................................................................................... ................................................................................................................................................... ................................................................................................................................................... ................................................................................................................................................... ................................................................................................................................................... ...............................................................................................................................................[3] [Total: 30 marks]
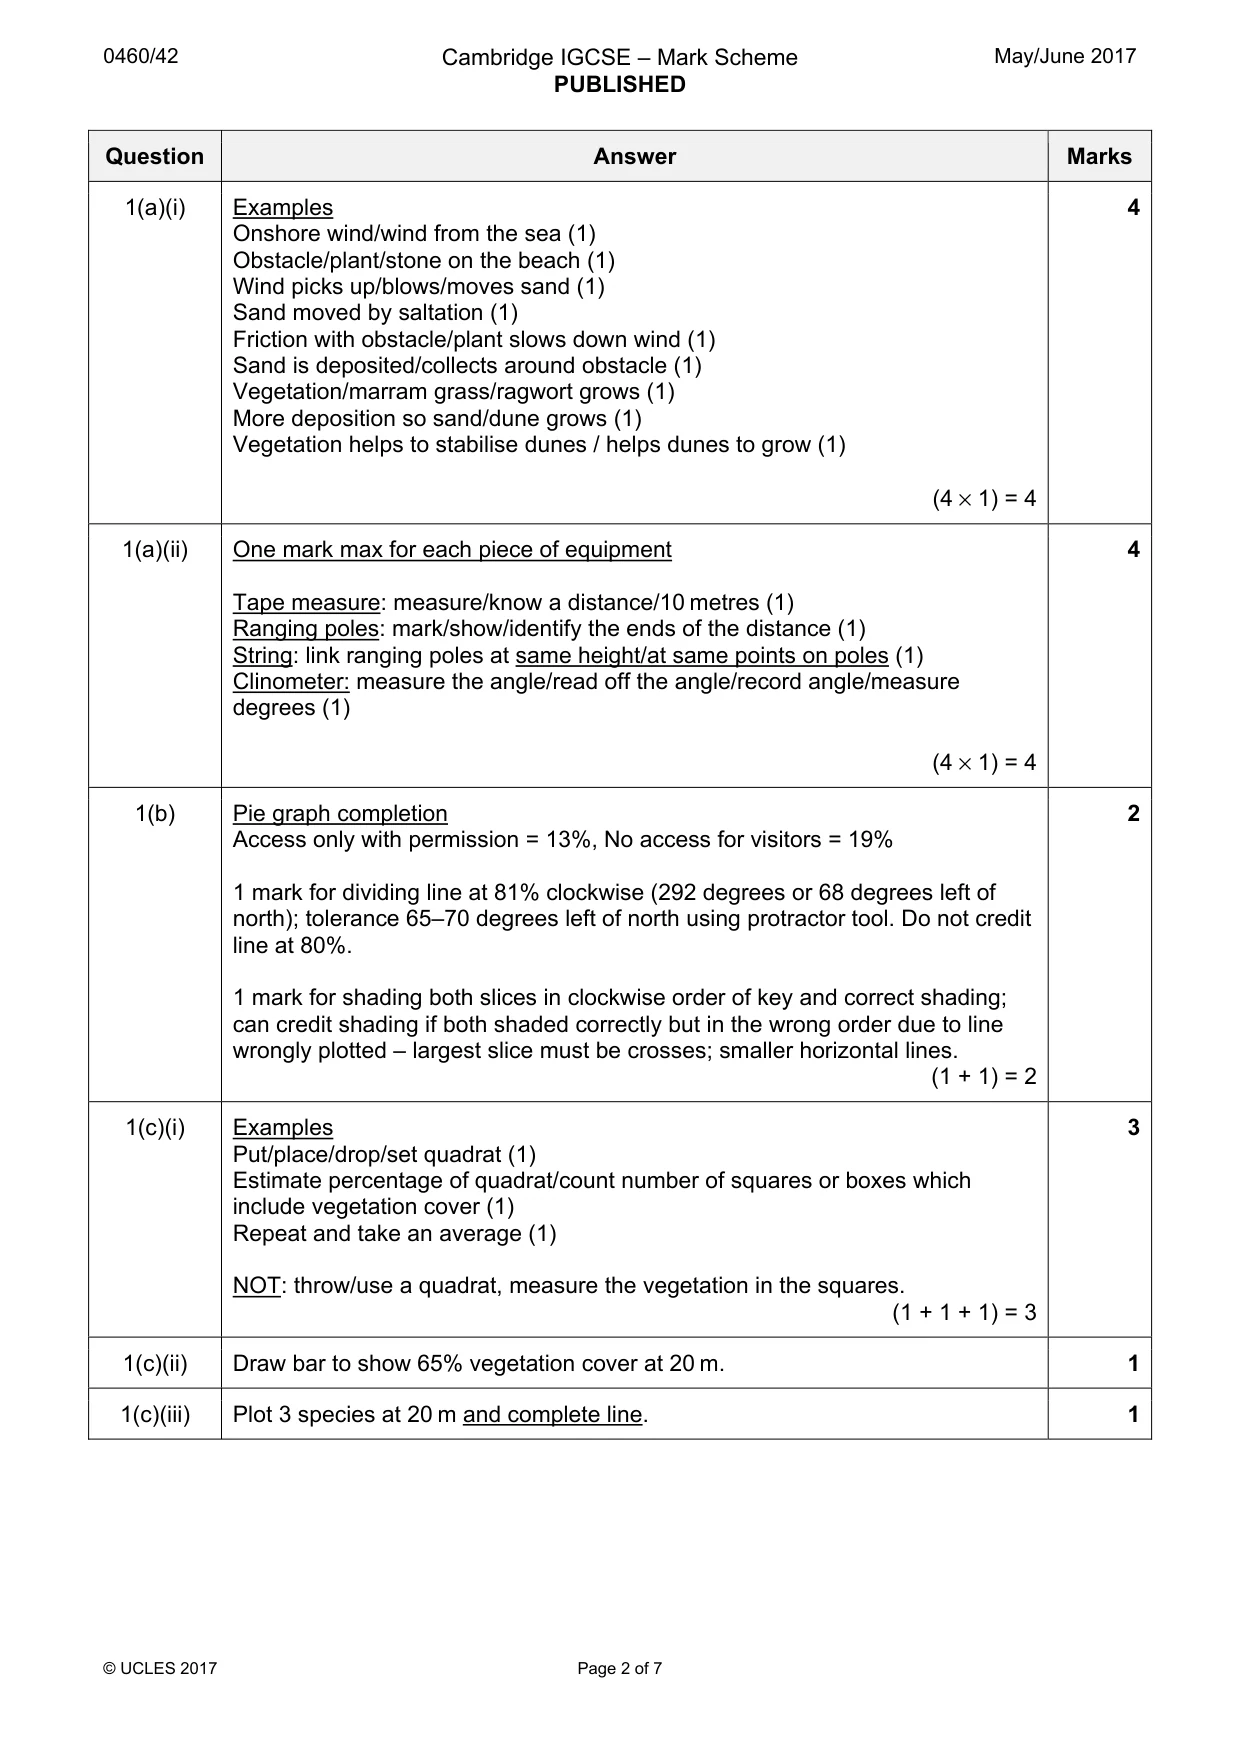
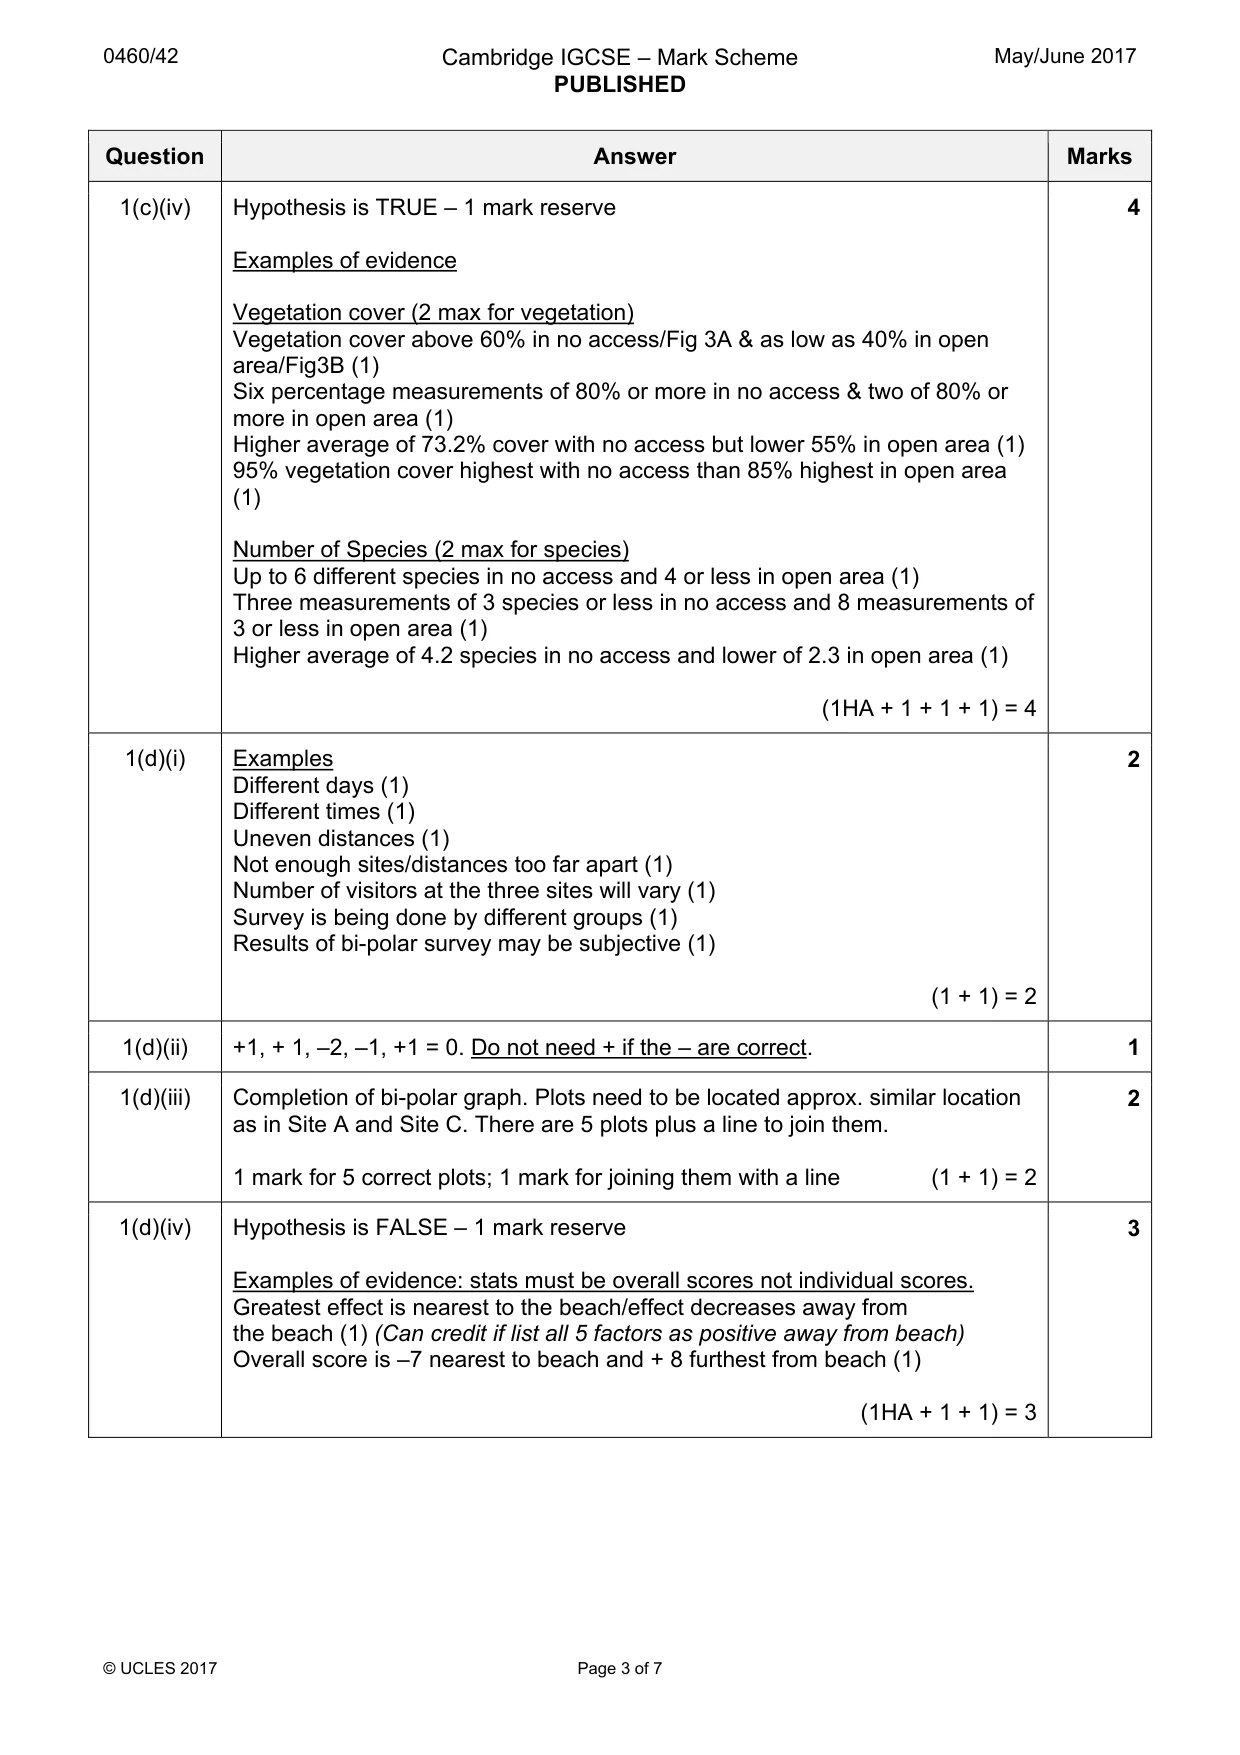
Mark scheme: Question Answer Marks 1(a)(i) Examples 4 Onshore wind/wind from the sea (1) Obstacle/plant/stone on the beach (1) Wind picks up/blows/moves sand (1) Sand moved by saltation (1) Friction with obstacle/plant slows down wind (1) Sand is deposited/collects around obstacle (1) Vegetation/marram grass/ragwort grows (1) More deposition so sand/dune grows (1) Vegetation helps to stabilise dunes / helps dunes to grow (1) (4 × 1) = 4 1(a)(ii) One mark max for each piece of equipment 4 Tape measure: measure/know a distance/10 metres (1) Ranging poles: mark/show/identify the ends of the distance (1) String: link ranging poles at same height/at same points on poles (1) Clinometer: measure the angle/read off the angle/record angle/measure degrees (1) (4 × 1) = 4 1(b) Pie graph completion 2 Access only with permission = 13%, No access for visitors = 19% 1 mark for dividing line at 81% clockwise (292 degrees or 68 degrees left of north); tolerance 65–70 degrees left of north using protractor tool. Do not credit line at 80%. 1 mark for shading both slices in clockwise order of key and correct shading; can credit shading if both shaded correctly but in the wrong order due to line wrongly plotted – largest slice must be crosses; smaller horizontal lines. (1 + 1) = 2 1(c)(i) Examples 3 Put/place/drop/set quadrat (1) Estimate percentage of quadrat/count number of squares or boxes which include vegetation cover (1) Repeat and take an average (1) NOT: throw/use a quadrat, measure the vegetation in the squares. (1 + 1 + 1) = 3 1(c)(ii) Draw bar to show 65% vegetation cover at 20 m. 1 1(c)(iii) Plot 3 species at 20 m and complete line. 1 1(c)(iv) Hypothesis is TRUE – 1 mark reserve 4 Examples of evidence Vegetation cover (2 max for vegetation) Vegetation cover above 60% in no access/Fig 3A & as low as 40% in open area/Fig3B (1) Six percentage measurements of 80% or more in no access & two of 80% or more in open area (1) Higher average of 73.2% cover with no access but lower 55% in open area (1) 95% vegetation cover highest with no access than 85% highest in open area (1) Number of Species (2 max for species) Up to 6 different species in no access and 4 or less in open area (1) Three measurements of 3 species or less in no access and 8 measurements of 3 or less in open area (1) Higher average of 4.2 species in no access and lower of 2.3 in open area (1) (1HA + 1 + 1 + 1) = 4 1(d)(i) Examples 2 Different days (1) Different times (1) Uneven distances (1) Not enough sites/distances too far apart (1) Number of visitors at the three sites will vary (1) Survey is being done by different groups (1) Results of bi-polar survey may be subjective (1) (1 + 1) = 2 1(d)(ii) +1, + 1, –2, –1, +1 = 0. Do not need + if the – are correct. 1 1(d)(iii) Completion of bi-polar graph. Plots need to be located approx. similar location 2 as in Site A and Site C. There are 5 plots plus a line to join them. 1 mark for 5 correct plots; 1 mark for joining them with a line (1 + 1) = 2 1(d)(iv) Hypothesis is FALSE – 1 mark reserve 3 Examples of evidence: stats must be overall scores not individual scores. Greatest effect is nearest to the beach/effect decreases away from the beach (1) (Can credit if list all 5 factors as positive away from beach) Overall score is –7 nearest to beach and + 8 furthest from beach (1) (1HA + 1 + 1) = 3 1(e) Examples 3 Educate tourists through notice boards /visitor centre/signs/posters/flyers (1) Marked/signed/create more footpaths (1) Boardwalk across area (1) Fence off areas (1) Barriers to prevent vehicle/cycle access (1) Guides/rangers to monitor/advise tourists (1) Designate picnic/BBQ sites (1) Litter bins (1). (1 + 1 + 1) = 3 Total: 30
Q2 · Members of a water charity were doing research into the water supply in six rural…
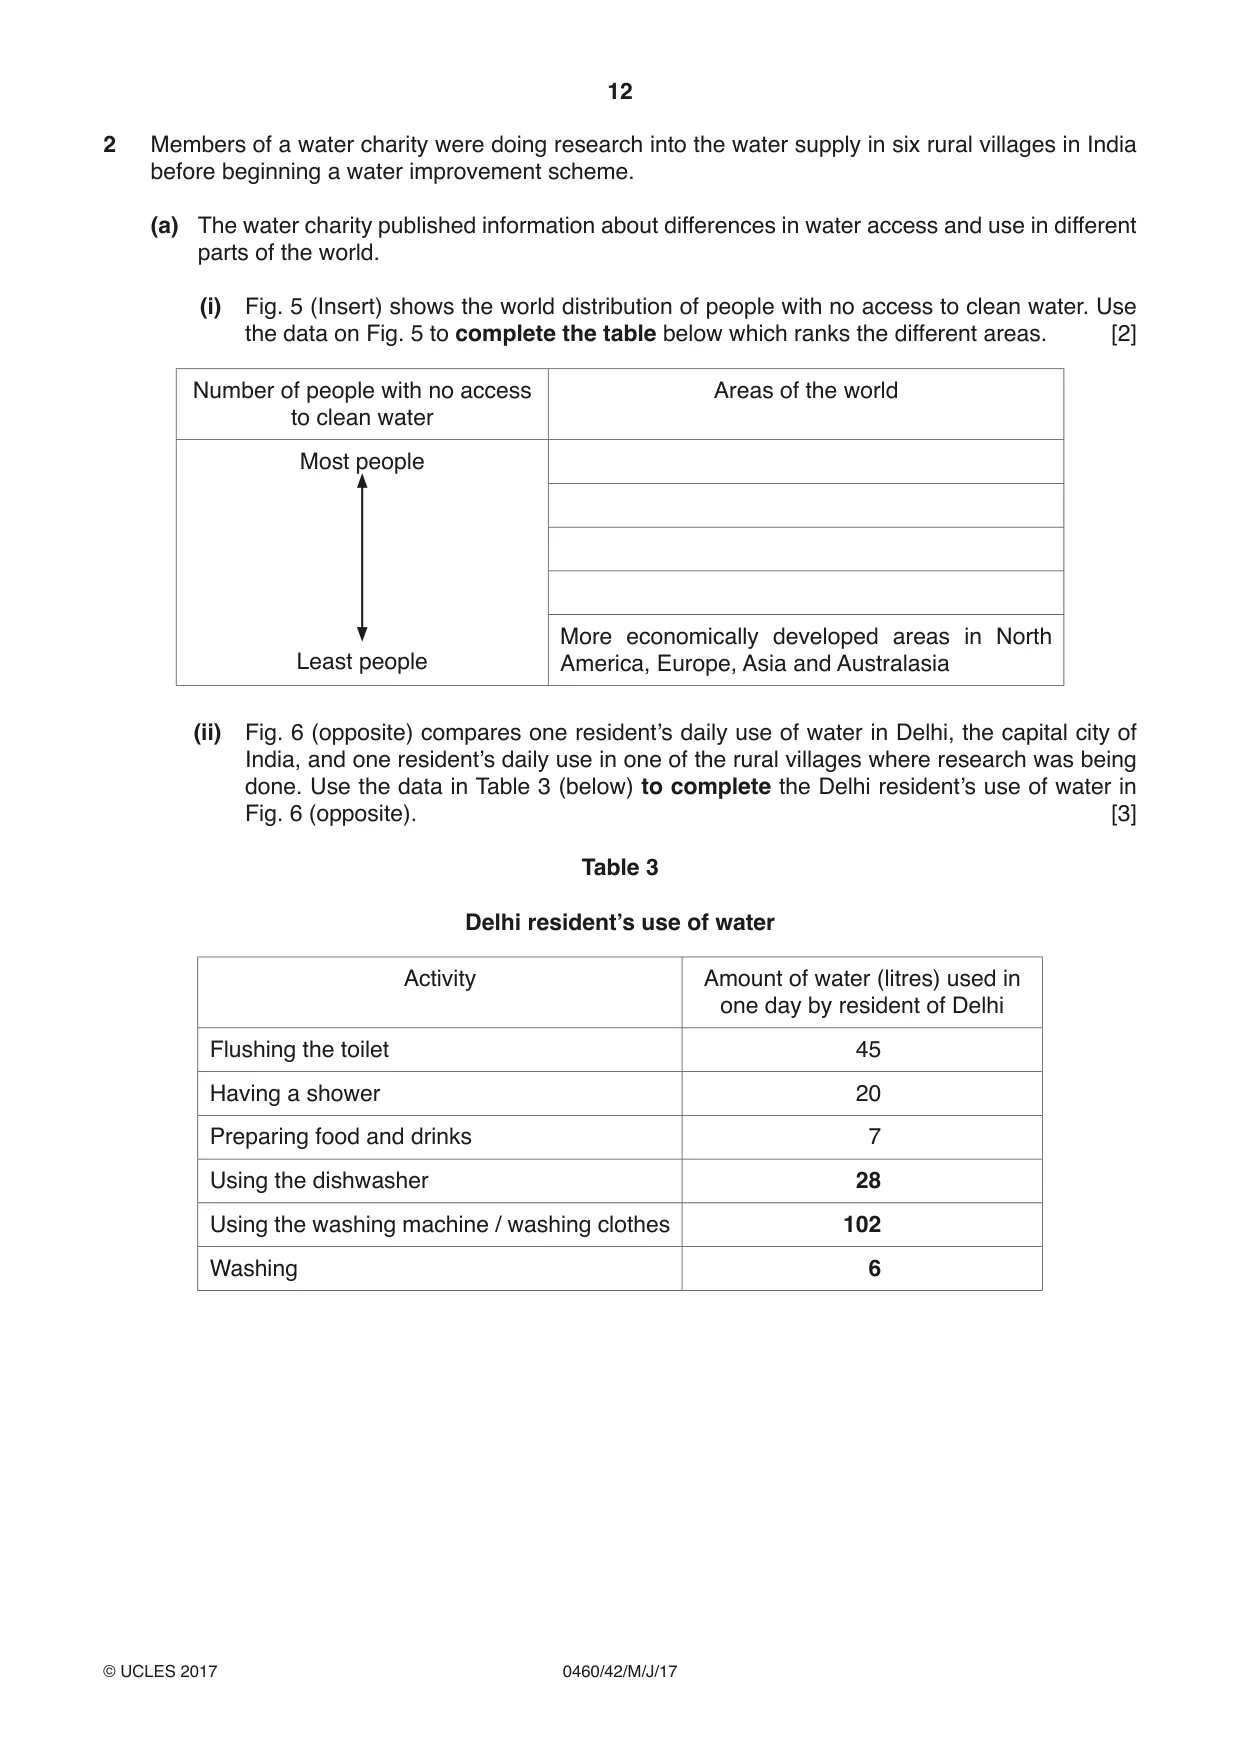
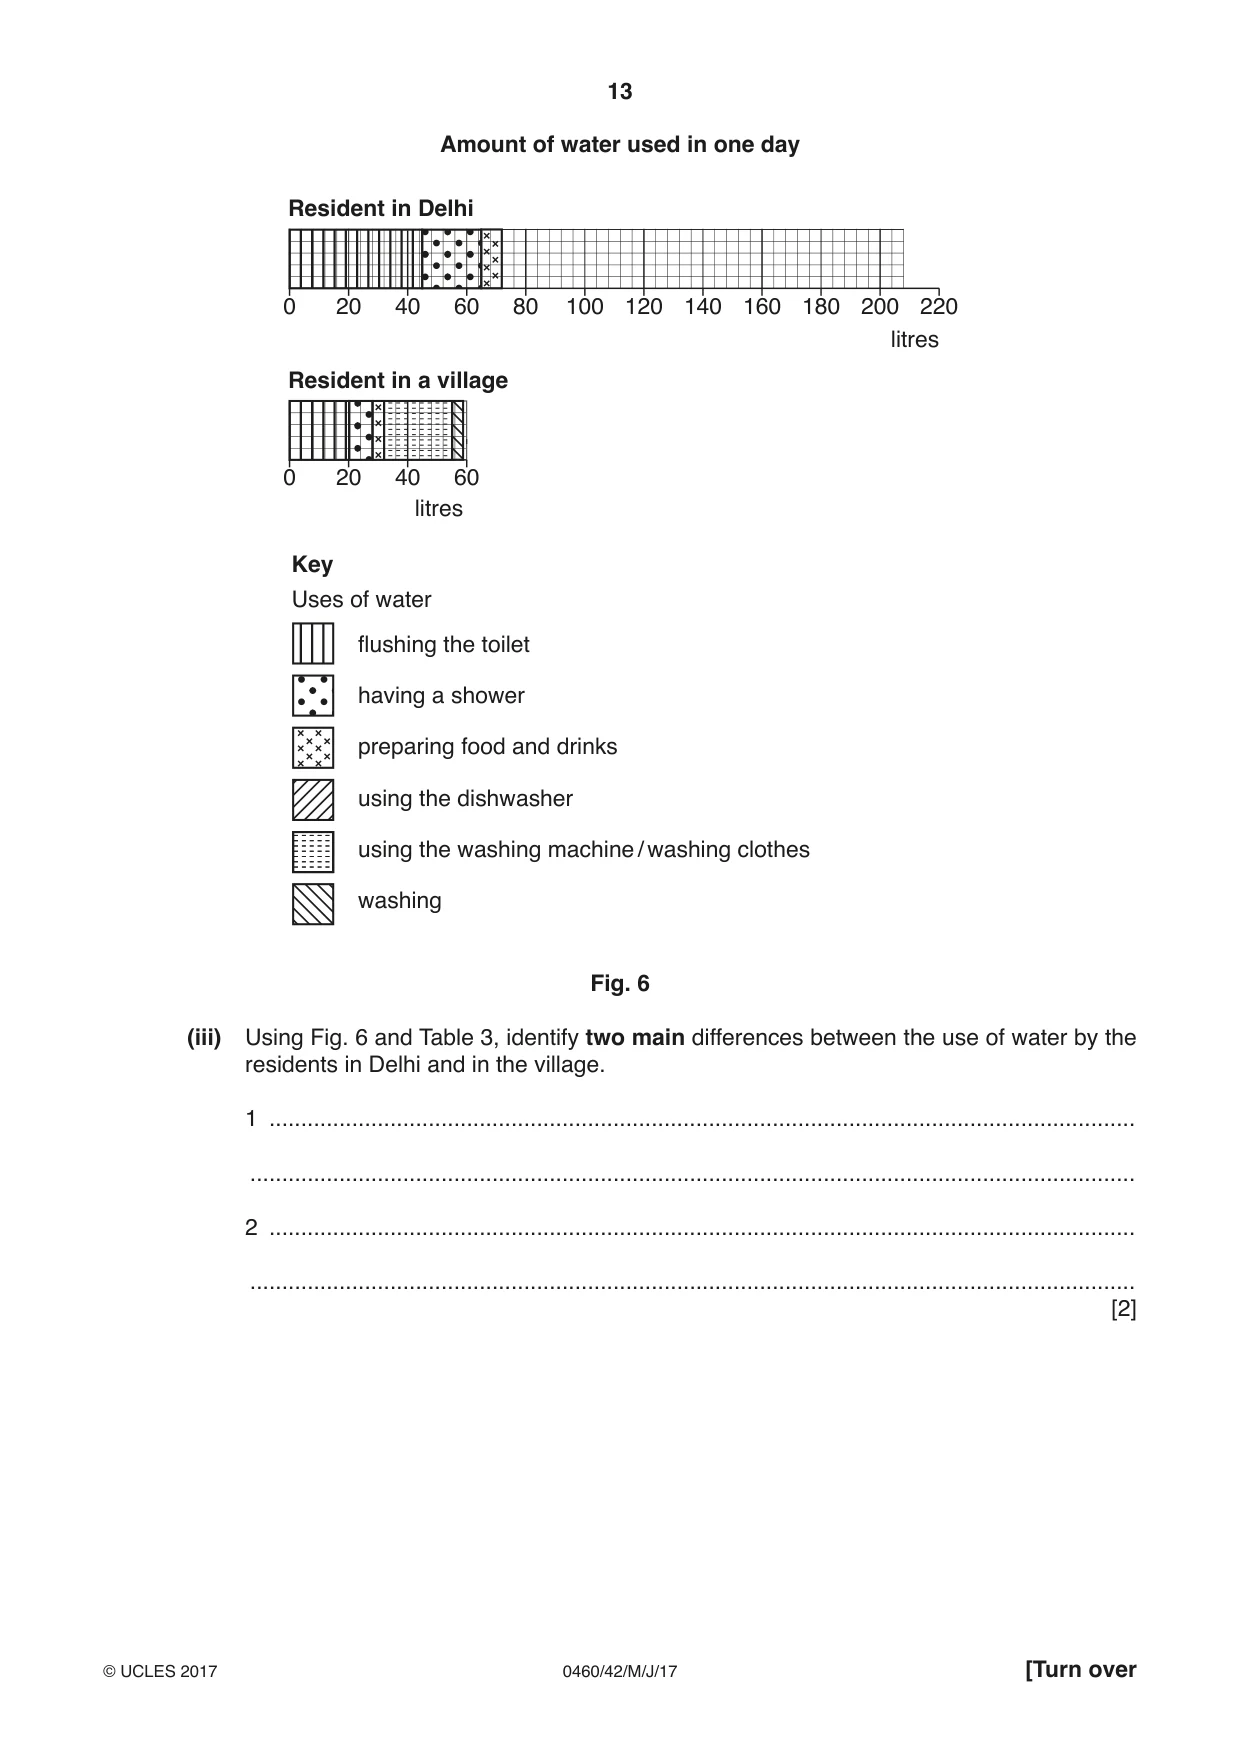
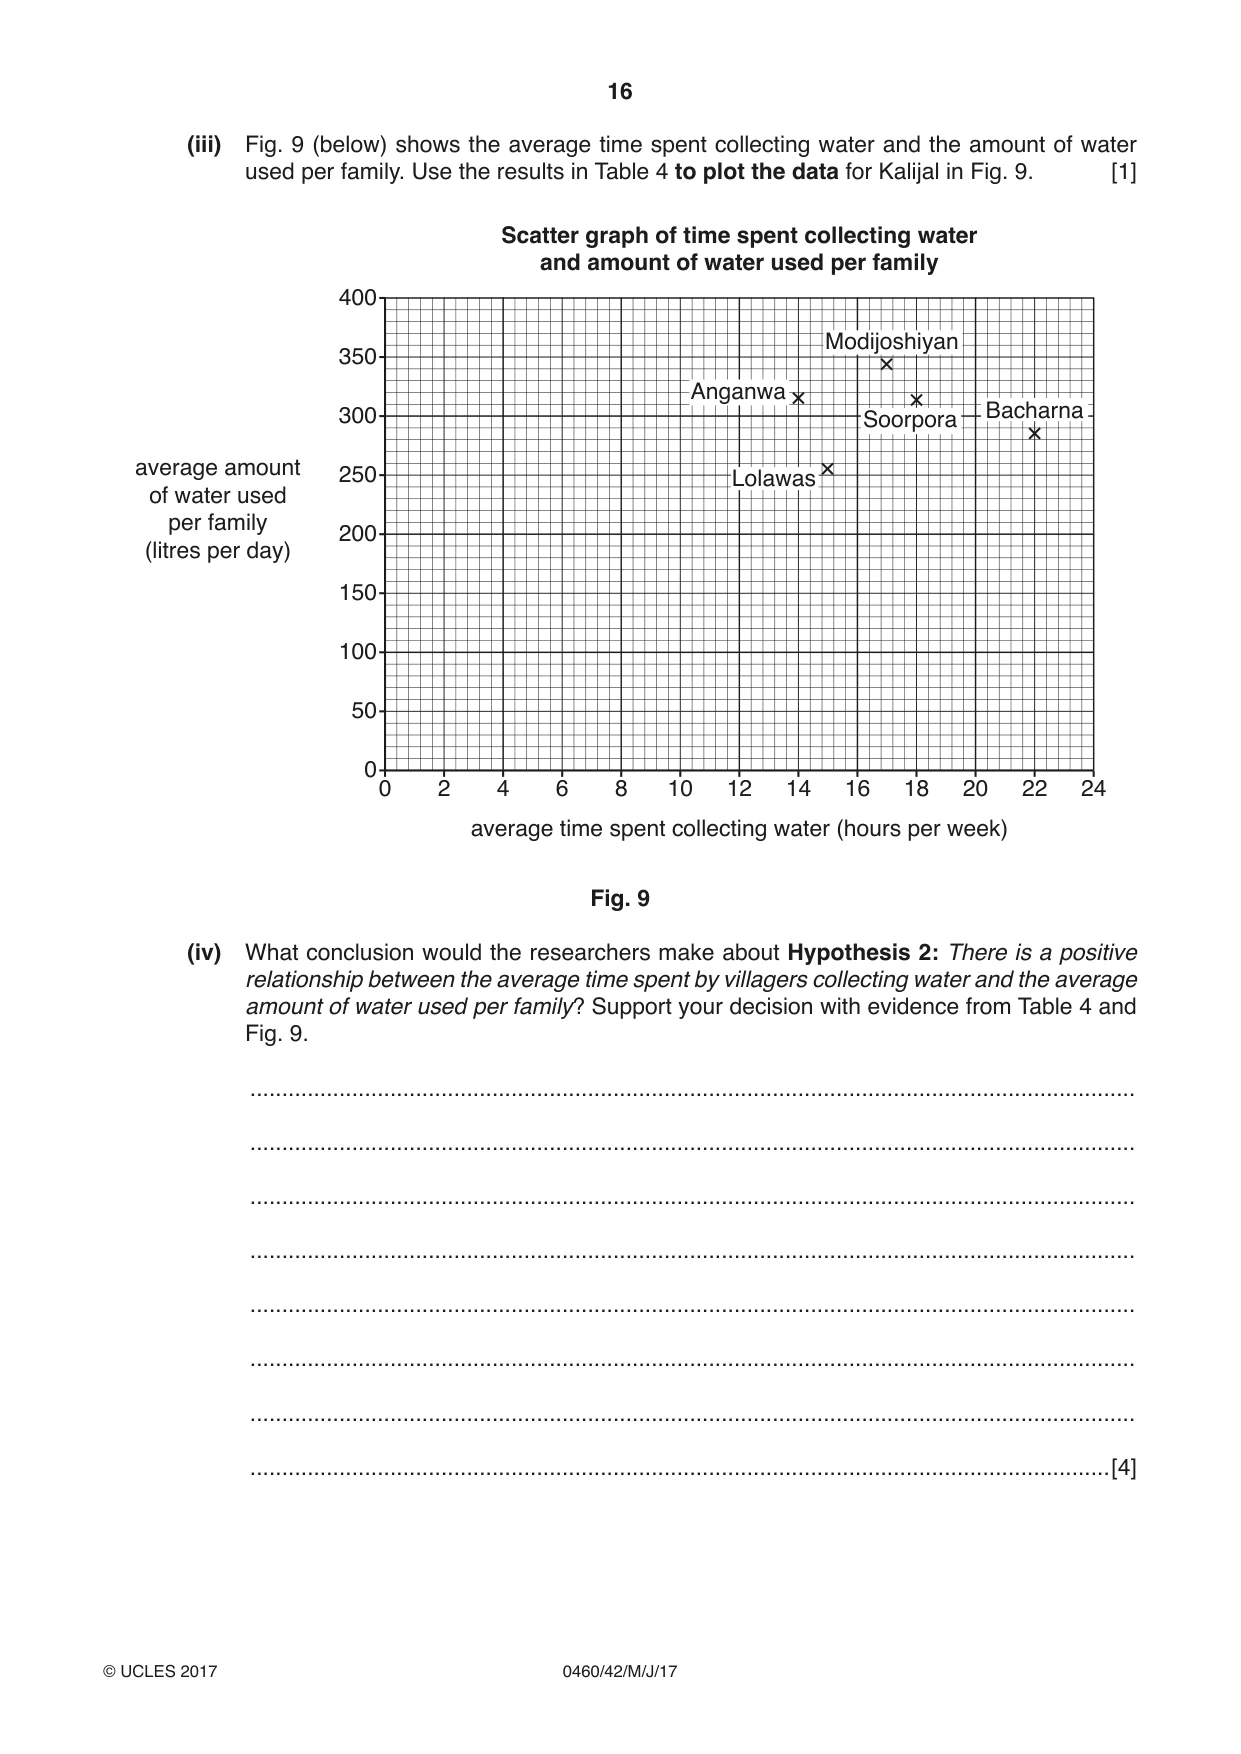
2 Members of a water charity were doing research into the water supply in six rural villages in India before beginning a water improvement scheme. (a) The water charity published information about differences in water access and use in different parts of the world. (i) Fig. 5 (Insert) shows the world distribution of people with no access to clean water. Use the data on Fig. 5 to complete the table below which ranks the different areas. [2] Number of people with no access Areas of the world to clean water Most people More economically developed areas in North Least people America, Europe, Asia and Australasia (ii) Fig. 6 (opposite) compares one resident’s daily use of water in Delhi, the capital city of India, and one resident’s daily use in one of the rural villages where research was being done. Use the data in Table 3 (below) to complete the Delhi resident’s use of water in Fig. 6 (opposite). [3] Table 3 Delhi resident’s use of water Activity Amount of water (litres) used in one day by resident of Delhi Flushing the toilet 45 Having a shower 20 Preparing food and drinks 7 Using the dishwasher 28 Using the washing machine / washing clothes 102 Washing 6 Amount of water used in one day Resident in Delhi 0 20 40 60 80 100 120 140 160 180 200 220 litres Resident in a village 0 20 40 60 litres Key Uses of water flushing the toilet having a shower preparing food and drinks using the dishwasher using the washing machine / washing clothes washing Fig. 6 (iii) Using Fig. 6 and Table 3, identify two main differences between the use of water by the residents in Delhi and in the village. 1 ........................................................................................................................................ ........................................................................................................................................... 2 ........................................................................................................................................ ........................................................................................................................................... [2] The researchers wanted to find out if the following hypotheses were correct: Hypothesis 1: There is a positive relationship between the average time spent by villagers collecting water and the average distance they travel to collect it. Hypothesis 2: There is a positive relationship between the average time spent by villagers collecting water and the average amount of water used per family. (b) To investigate the two hypotheses the researchers used a questionnaire with residents of 20 houses in each village. The questionnaire is shown in Fig. 7 (Insert). (i) Describe an appropriate method to choose a fair sample of 20 houses in each village. ........................................................................................................................................... ........................................................................................................................................... ........................................................................................................................................... ........................................................................................................................................... ........................................................................................................................................... .......................................................................................................................................[3] (ii) Suggest two practical difficulties for the researchers of collecting data using a questionnaire. 1 ........................................................................................................................................ ........................................................................................................................................... 2 ........................................................................................................................................ ........................................................................................................................................... [2]
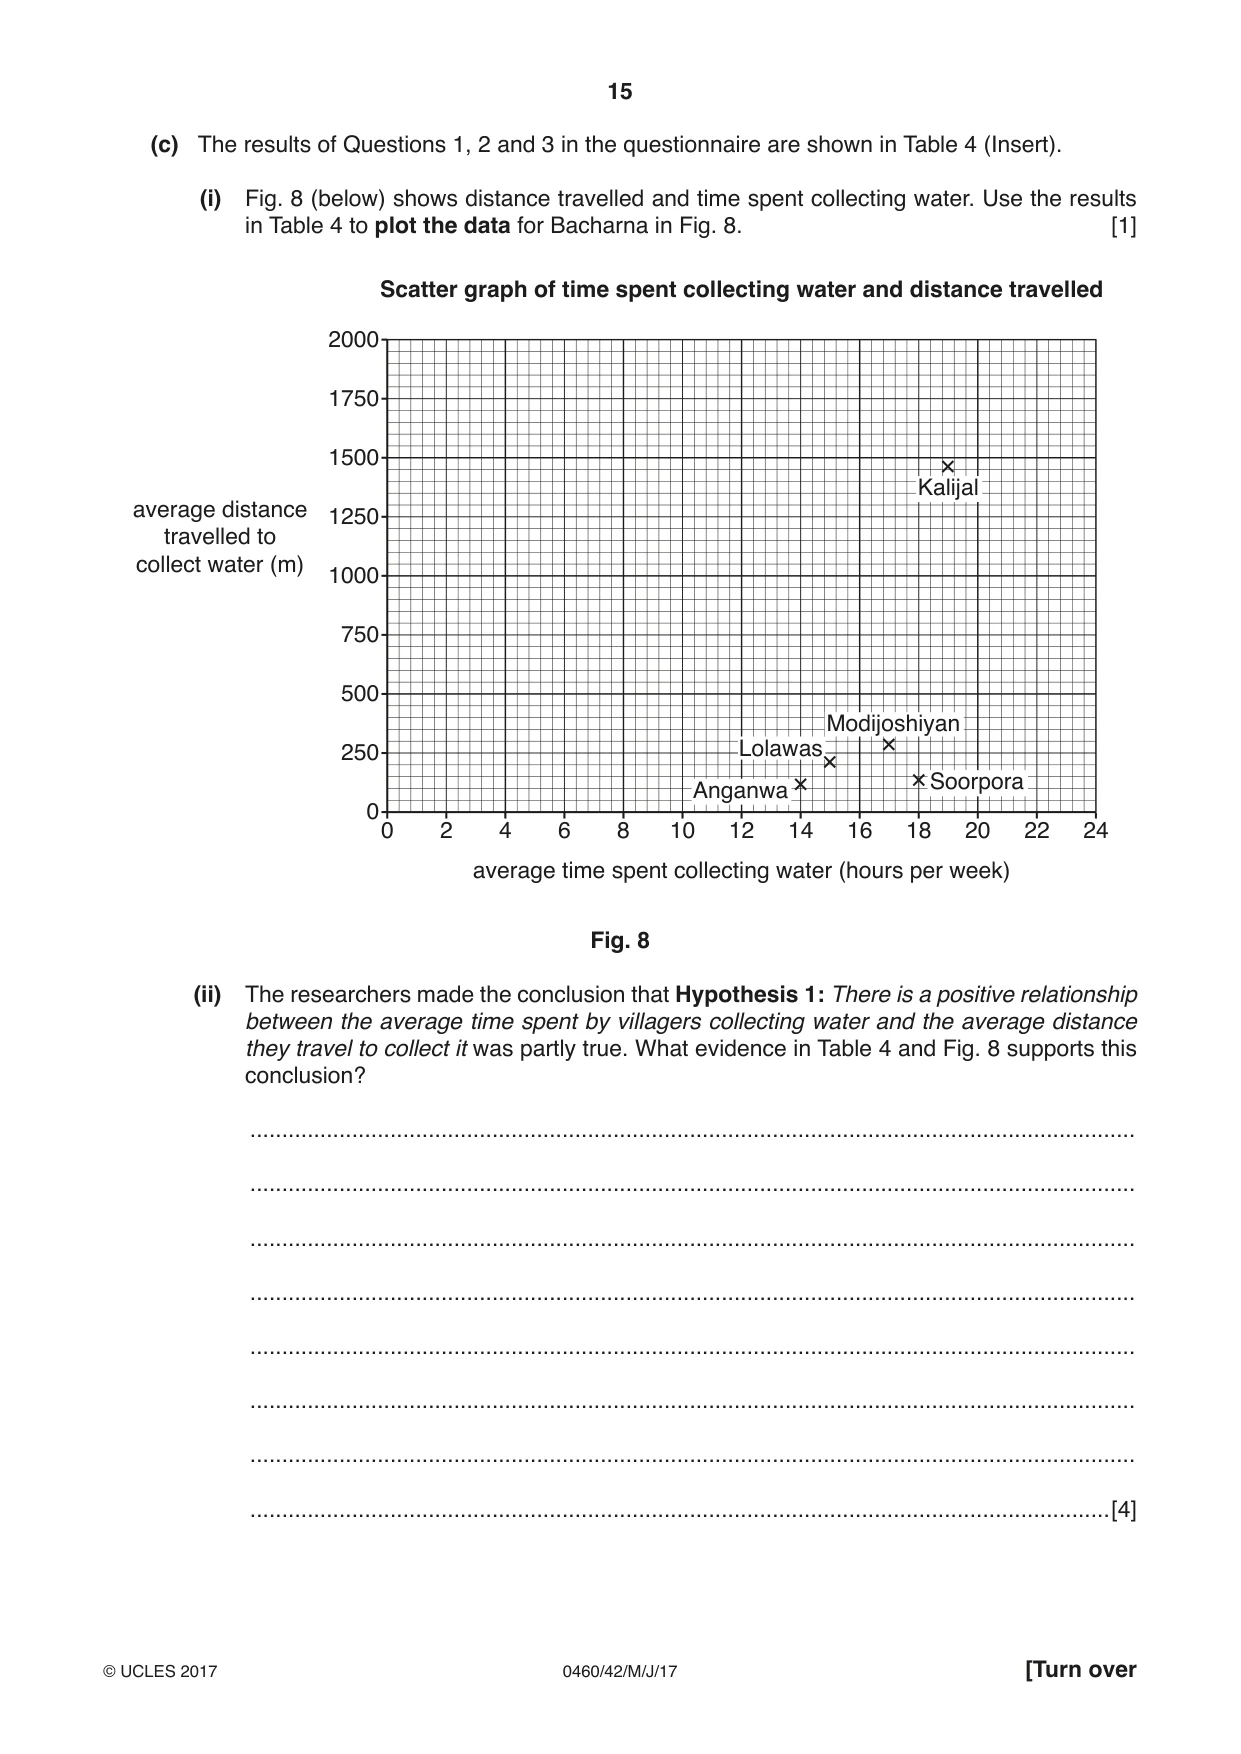
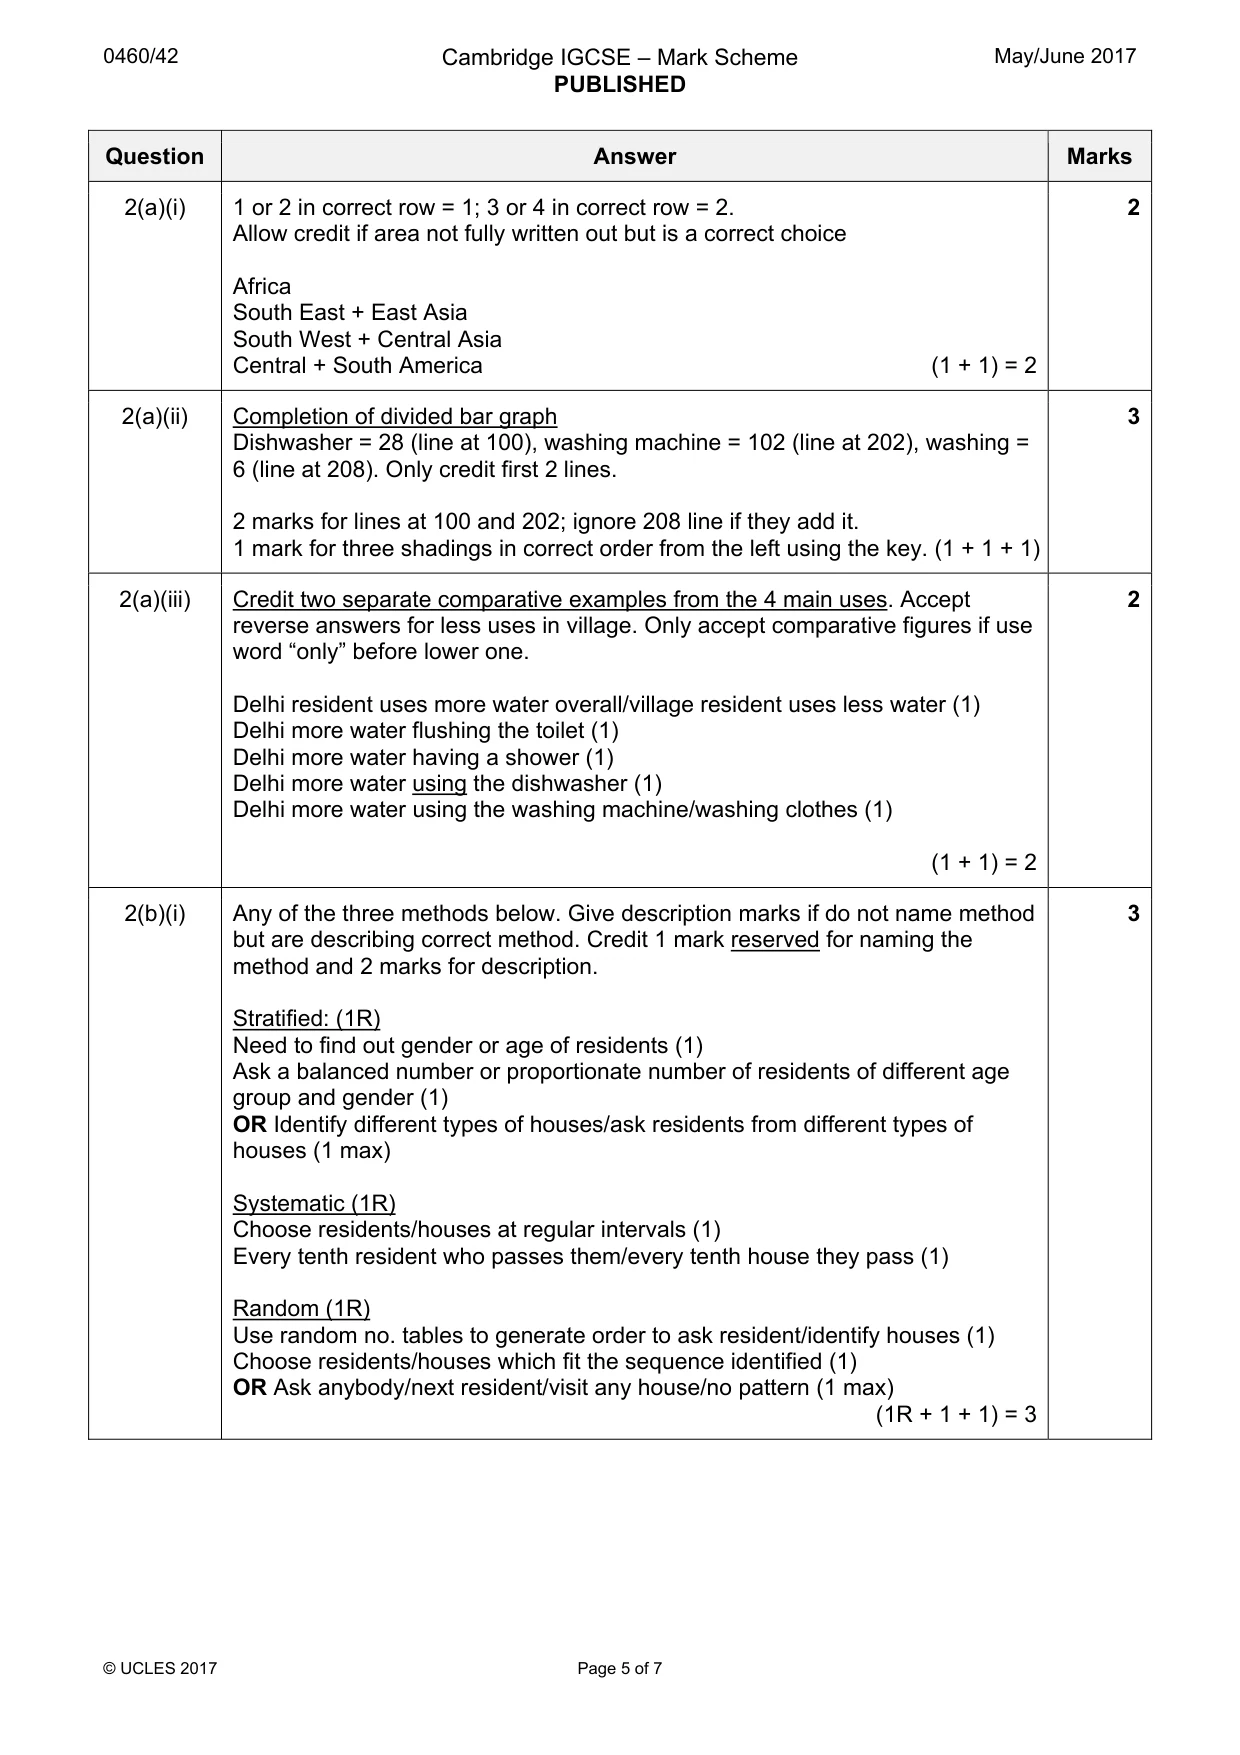
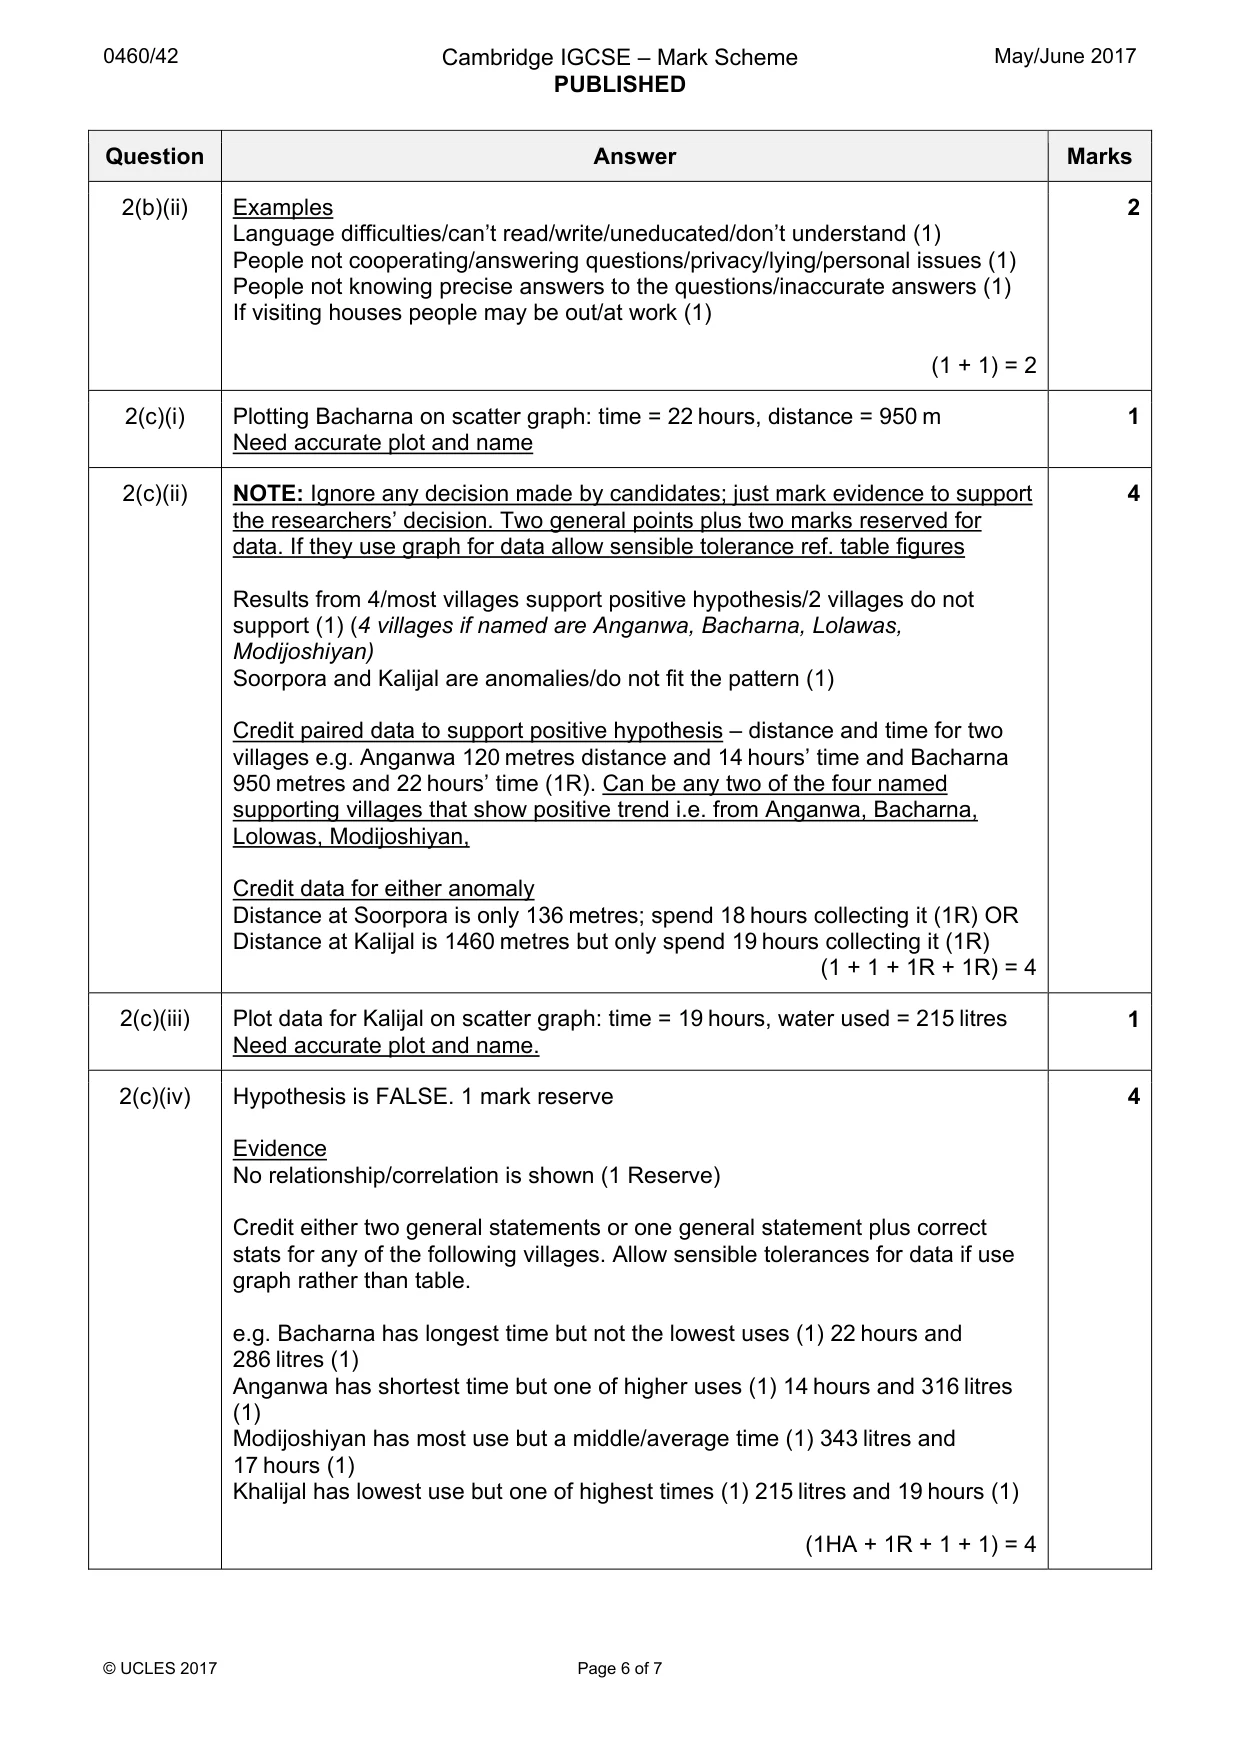
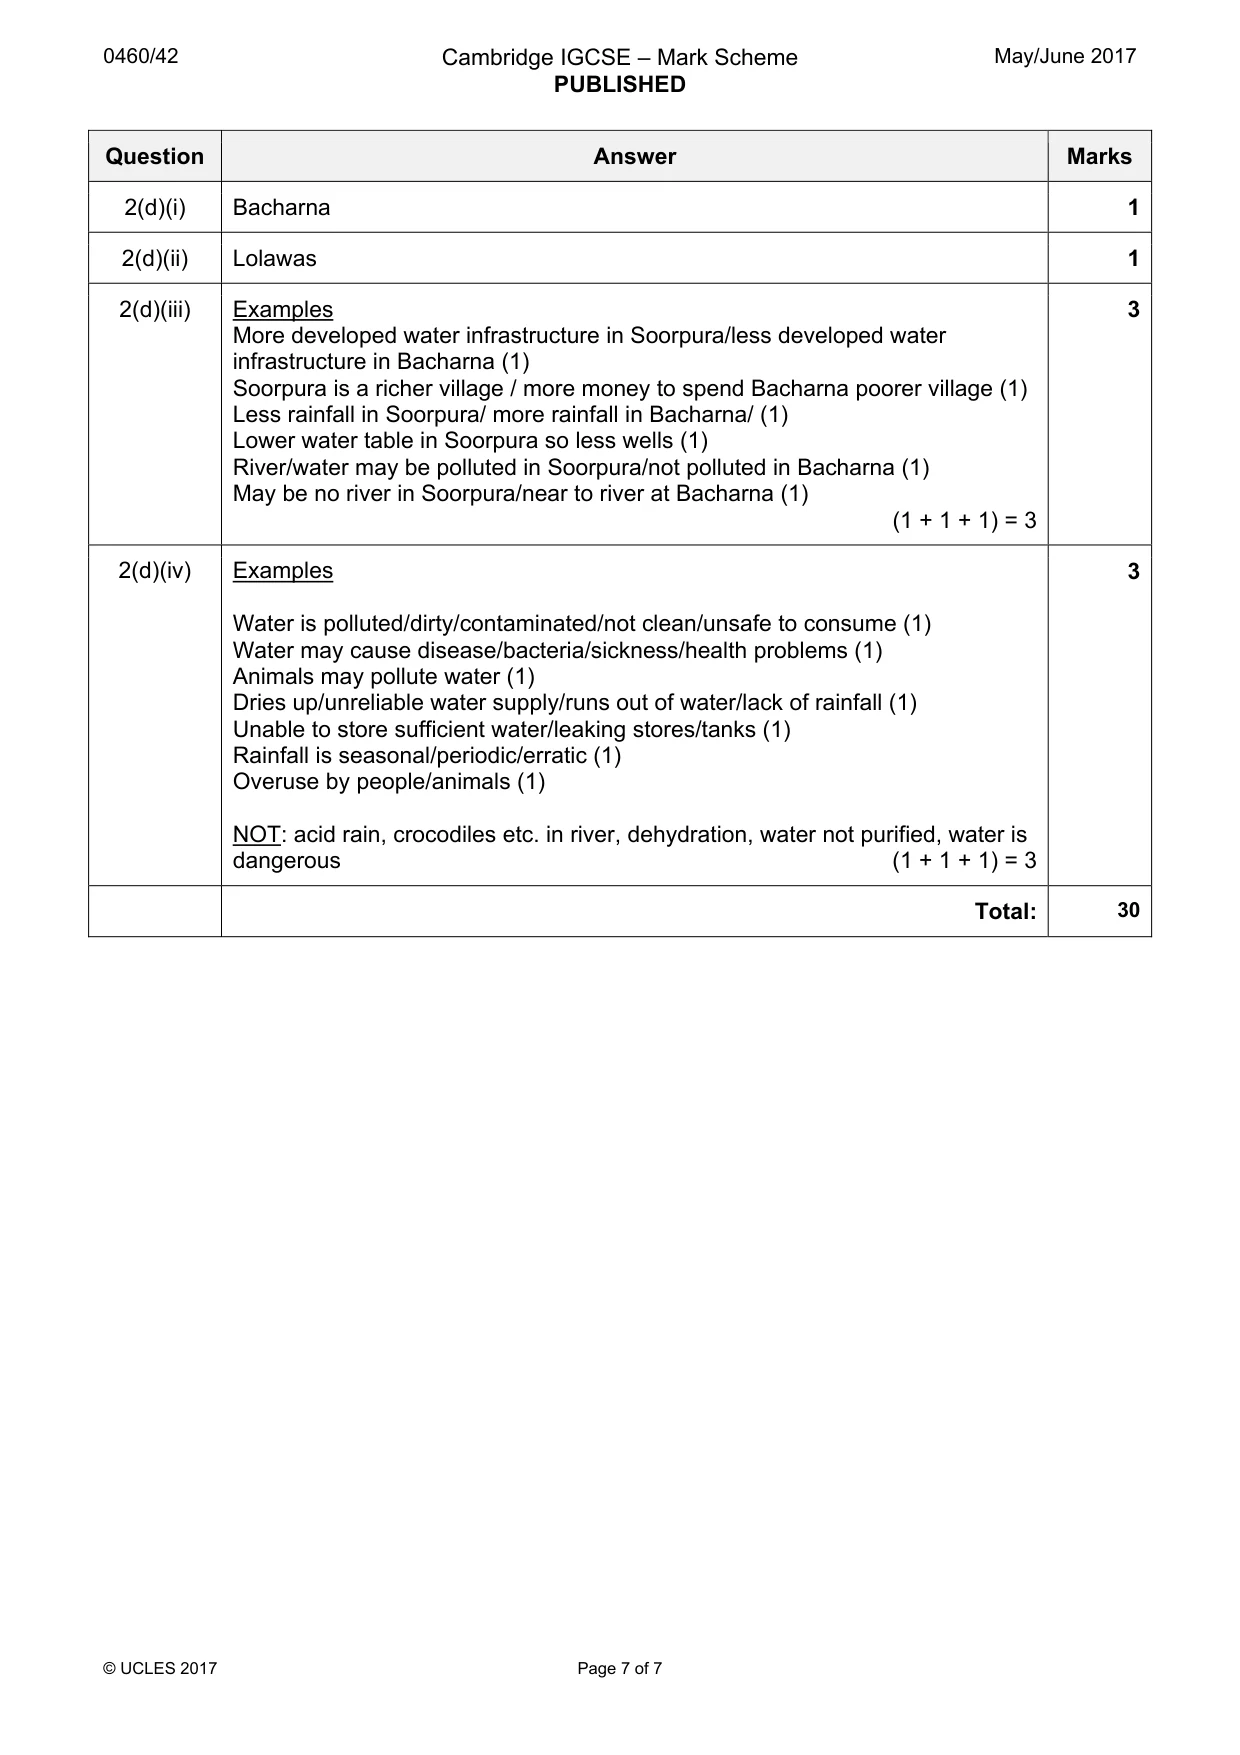
Mark scheme: 2(a)(i) 1 or 2 in correct row = 1; 3 or 4 in correct row = 2. 2 Allow credit if area not fully written out but is a correct choice Africa South East + East Asia South West + Central Asia Central + South America (1 + 1) = 2 2(a)(ii) Completion of divided bar graph 3 Dishwasher = 28 (line at 100), washing machine = 102 (line at 202), washing = 6 (line at 208). Only credit first 2 lines. 2 marks for lines at 100 and 202; ignore 208 line if they add it. 1 mark for three shadings in correct order from the left using the key. (1 + 1 + 1) 2(a)(iii) Credit two separate comparative examples from the 4 main uses. Accept 2 reverse answers for less uses in village. Only accept comparative figures if use word “only” before lower one. Delhi resident uses more water overall/village resident uses less water (1) Delhi more water flushing the toilet (1) Delhi more water having a shower (1) Delhi more water using the dishwasher (1) Delhi more water using the washing machine/washing clothes (1) (1 + 1) = 2 2(b)(i) Any of the three methods below. Give description marks if do not name method 3 but are describing correct method. Credit 1 mark reserved for naming the method and 2 marks for description. Stratified: (1R) Need to find out gender or age of residents (1) Ask a balanced number or proportionate number of residents of different age group and gender (1) OR Identify different types of houses/ask residents from different types of houses (1 max) Systematic (1R) Choose residents/houses at regular intervals (1) Every tenth resident who passes them/every tenth house they pass (1) Random (1R) Use random no. tables to generate order to ask resident/identify houses (1) Choose residents/houses which fit the sequence identified (1) OR Ask anybody/next resident/visit any house/no pattern (1 max) (1R + 1 + 1) = 3 2(b)(ii) Examples 2 Language difficulties/can’t read/write/uneducated/don’t understand (1) People not cooperating/answering questions/privacy/lying/personal issues (1) People not knowing precise answers to the questions/inaccurate answers (1) If visiting houses people may be out/at work (1) (1 + 1) = 2 2(c)(i) Plotting Bacharna on scatter graph: time = 22 hours, distance = 950 m 1 Need accurate plot and name 2(c)(ii) NOTE: Ignore any decision made by candidates; just mark evidence to support 4 the researchers’ decision. Two general points plus two marks reserved for data. If they use graph for data allow sensible tolerance ref. table figures Results from 4/most villages support positive hypothesis/2 villages do not support (1) (4 villages if named are Anganwa, Bacharna, Lolawas, Modijoshiyan) Soorpora and Kalijal are anomalies/do not fit the pattern (1) Credit paired data to support positive hypothesis – distance and time for two villages e.g. Anganwa 120 metres distance and 14 hours’ time and Bacharna 950 metres and 22 hours’ time (1R). Can be any two of the four named supporting villages that show positive trend i.e. from Anganwa, Bacharna, Lolowas, Modijoshiyan, Credit data for either anomaly Distance at Soorpora is only 136 metres; spend 18 hours collecting it (1R) OR Distance at Kalijal is 1460 metres but only spend 19 hours collecting it (1R) (1 + 1 + 1R + 1R) = 4 2(c)(iii) Plot data for Kalijal on scatter graph: time = 19 hours, water used = 215 litres 1 Need accurate plot and name. 2(c)(iv) Hypothesis is FALSE. 1 mark reserve 4 Evidence No relationship/correlation is shown (1 Reserve) Credit either two general statements or one general statement plus correct stats for any of the following villages. Allow sensible tolerances for data if use graph rather than table. e.g. Bacharna has longest time but not the lowest uses (1) 22 hours and 286 litres (1) Anganwa has shortest time but one of higher uses (1) 14 hours and 316 litres (1) Modijoshiyan has most use but a middle/average time (1) 343 litres and 17 hours (1) Khalijal has lowest use but one of highest times (1) 215 litres and 19 hours (1) (1HA + 1R + 1 + 1) = 4 2(d)(i) Bacharna 1 2(d)(ii) Lolawas 1 2(d)(iii) Examples 3 More developed water infrastructure in Soorpura/less developed water infrastructure in Bacharna (1) Soorpura is a richer village / more money to spend Bacharna poorer village (1) Less rainfall in Soorpura/ more rainfall in Bacharna/ (1) Lower water table in Soorpura so less wells (1) River/water may be polluted in Soorpura/not polluted in Bacharna (1) May be no river in Soorpura/near to river at Bacharna (1) (1 + 1 + 1) = 3 2(d)(iv) Examples 3 Water is polluted/dirty/contaminated/not clean/unsafe to consume (1) Water may cause disease/bacteria/sickness/health problems (1) Animals may pollute water (1) Dries up/unreliable water supply/runs out of water/lack of rainfall (1) Unable to store sufficient water/leaking stores/tanks (1) Rainfall is seasonal/periodic/erratic (1) Overuse by people/animals (1) NOT: acid rain, crocodiles etc. in river, dehydration, water not purified, water is dangerous (1 + 1 + 1) = 3 Total: 30
What was in this paper
The subtopics covered by these 2 questions, and how many questions each got. Open one in a new tab to see every Cambridge question on it.
What you needed in this session
Cambridge’s own grade thresholds for 2017 May/June, Paper 4 · Variant 2. A higher threshold means an easier paper — the bar moves with how the cohort did.