Cambridge IGCSE Geography 0460 — 2016 Oct/Nov Paper 2 · Variant 3
0460/23/O/N/16 · 60 marks · ≈68 min
The question paper and its mark scheme, free to read here and free to download. This is Cambridge’s own paper, exactly as it was sat.
Question paper16 pages

Mark scheme5 pages
Answers below. Sit the paper first if you are practising.
Paper as text
Question paper, page 1
This document consists of 15 printed pages, 1 blank page and 1 Insert. DC (LEG/SG) 115580/3 © UCLES 2016 [Turn over Cambridge International Examinations Cambridge International General Certificate of Secondary Education * 0 7 1 0 0 2 8 4 9 6 * GEOGRAPHY 0460/23 Paper 2 October/November 2016 1 hour 30 minutes Candidates answer on the Question Paper. Additional Materials: Ruler Protractor Plain paper Calculator 1:50 000 Survey Map Extract is enclosed with this Question Paper. READ THESE INSTRUCTIONS FIRST Write your Centre number, candidate number and name in the spaces provided. Write in dark blue or black pen. You may use an HB pencil for any diagrams or graphs. Do not use staples, paper clips, glue or correction fluid. DO NOT WRITE IN ANY BARCODES. Write your answer to each question in the space provided. If additional space is required, you should use the lined pages at the end of this booklet. The question number(s) must be clearly shown. Answer all questions. The Insert contains Photographs A and B for Question 3. The Survey Map Extract and the Insert are not required by the Examiner. Sketch maps and diagrams should be drawn whenever they serve to illustrate an answer. At the end of the examination, fasten all your work securely together. The number of marks is given in brackets [ ] at the end of each question or part question. The syllabus is approved for use in England, Wales and Northern Ireland as a Cambridge International Level 1/Level 2 Certificate.
Question paper, page 2
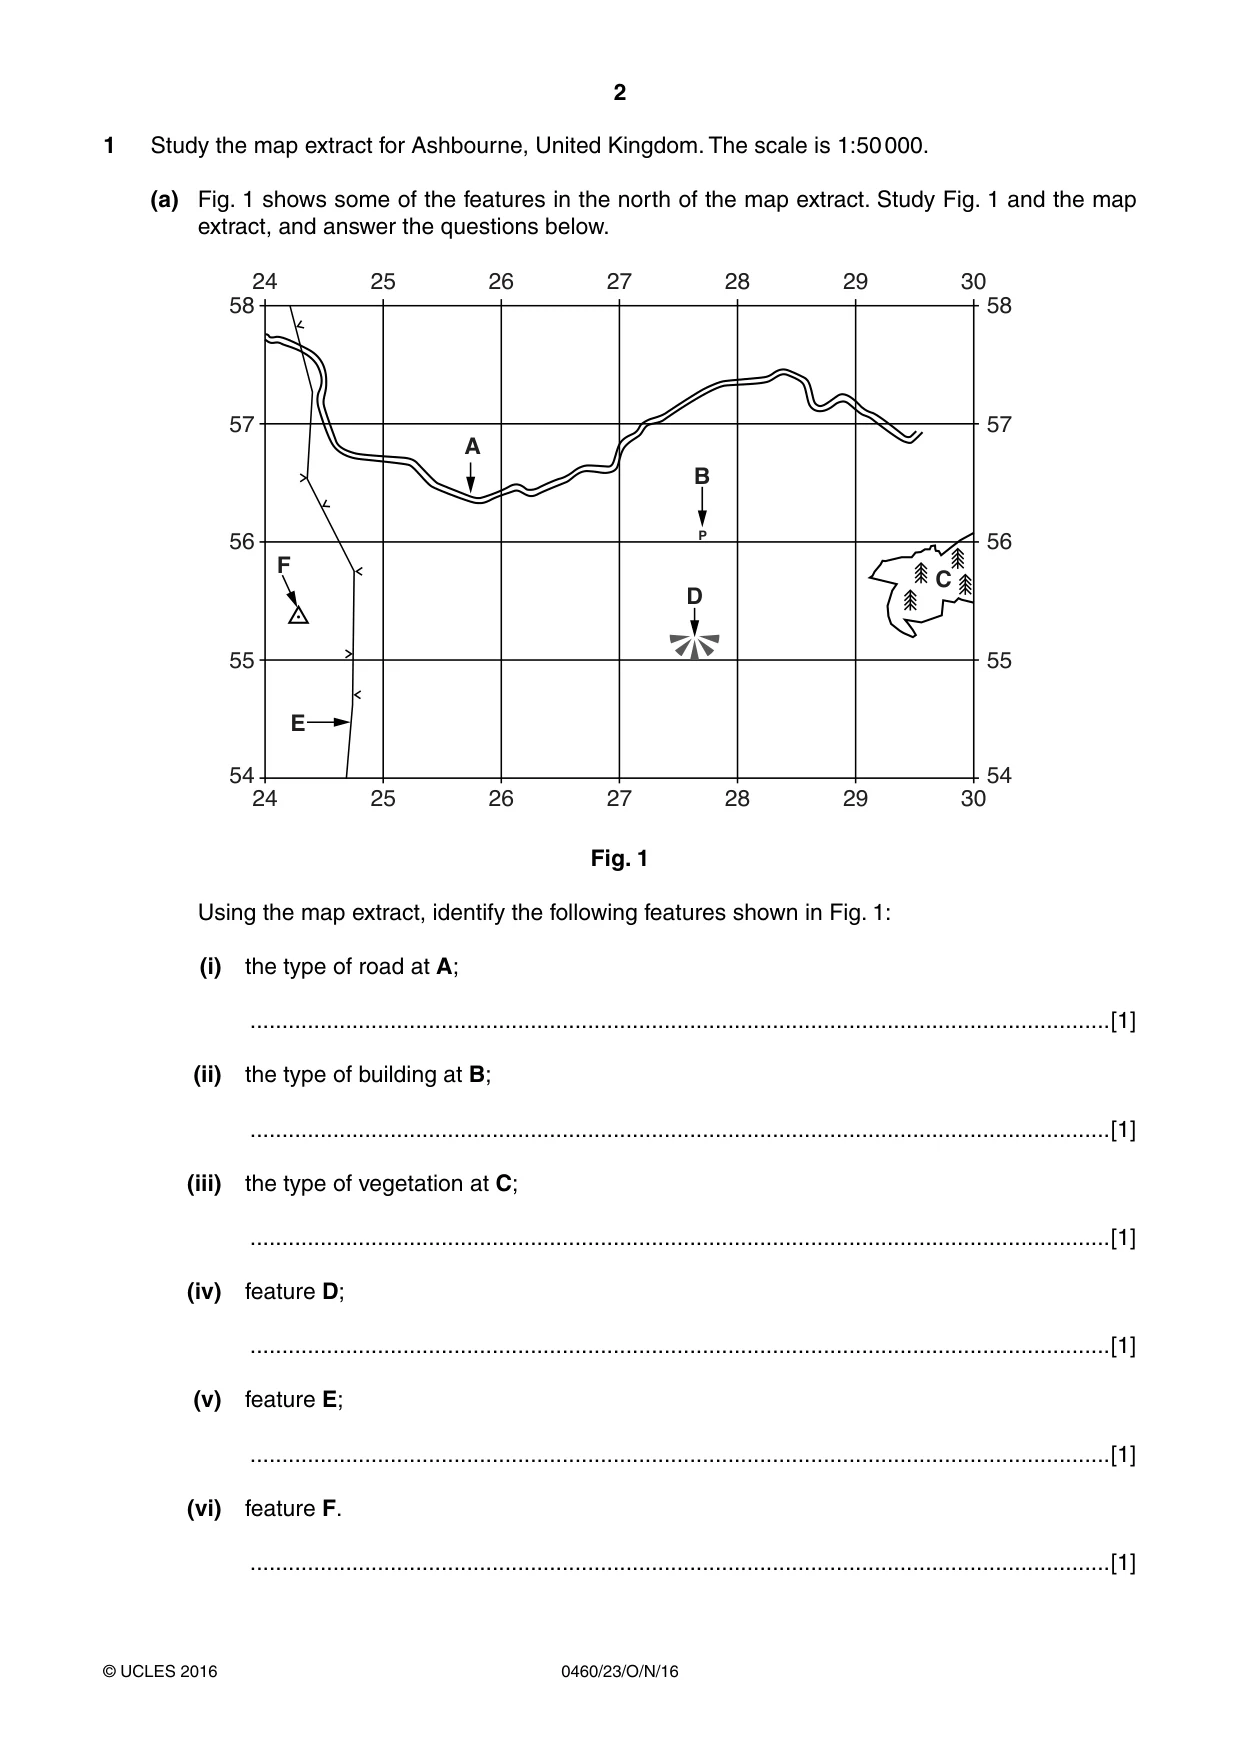
2 0460/23/O/N/16 © UCLES 2016 1 Study the map extract for Ashbourne, United Kingdom. The scale is 1:50 000. (a) Fig. 1 shows some of the features in the north of the map extract. Study Fig. 1 and the map extract, and answer the questions below. 24 58 57 56 55 54 58 57 56 55 54 24 25 A D B C E F 26 27 28 29 30 25 26 27 28 29 30 P Fig. 1 Using the map extract, identify the following features shown in Fig. 1: (i) the type of road at A; …[1] (ii) the type of building at B; …[1] (iii) the type of vegetation at C; …[1] (iv) feature D; …[1] (v) feature E; …[1] (vi) feature F. …[1]
Question paper, page 3
3 0460/23/O/N/16 © UCLES 2016 [Turn over (b) (i) State four pieces of map evidence that Carsington Water is a tourist attraction and recreational centre. 1 … 2 … 3 … 4 …[2] (ii) State the evidence that Carsington Water is not a natural lake. … …[1] (c) (i) Give the six-figure grid reference of the railway station at Idridgehay in the south east of the map. …[1] (ii) Measure the distance northwards along the railway from the railway station at Idridgehay to the next railway station at Wirksworth. Give your answer in metres. … metres [1] (iii) State the bearing from the railway station at Wirksworth to the railway station at Idridgehay. … degrees [1] (iv) Name the feature just north of Idridgehay station used to keep the railway as level as possible. …[1] (d) Describe the relief of the land in grid square 1647. … … … …[2]
Question paper, page 4
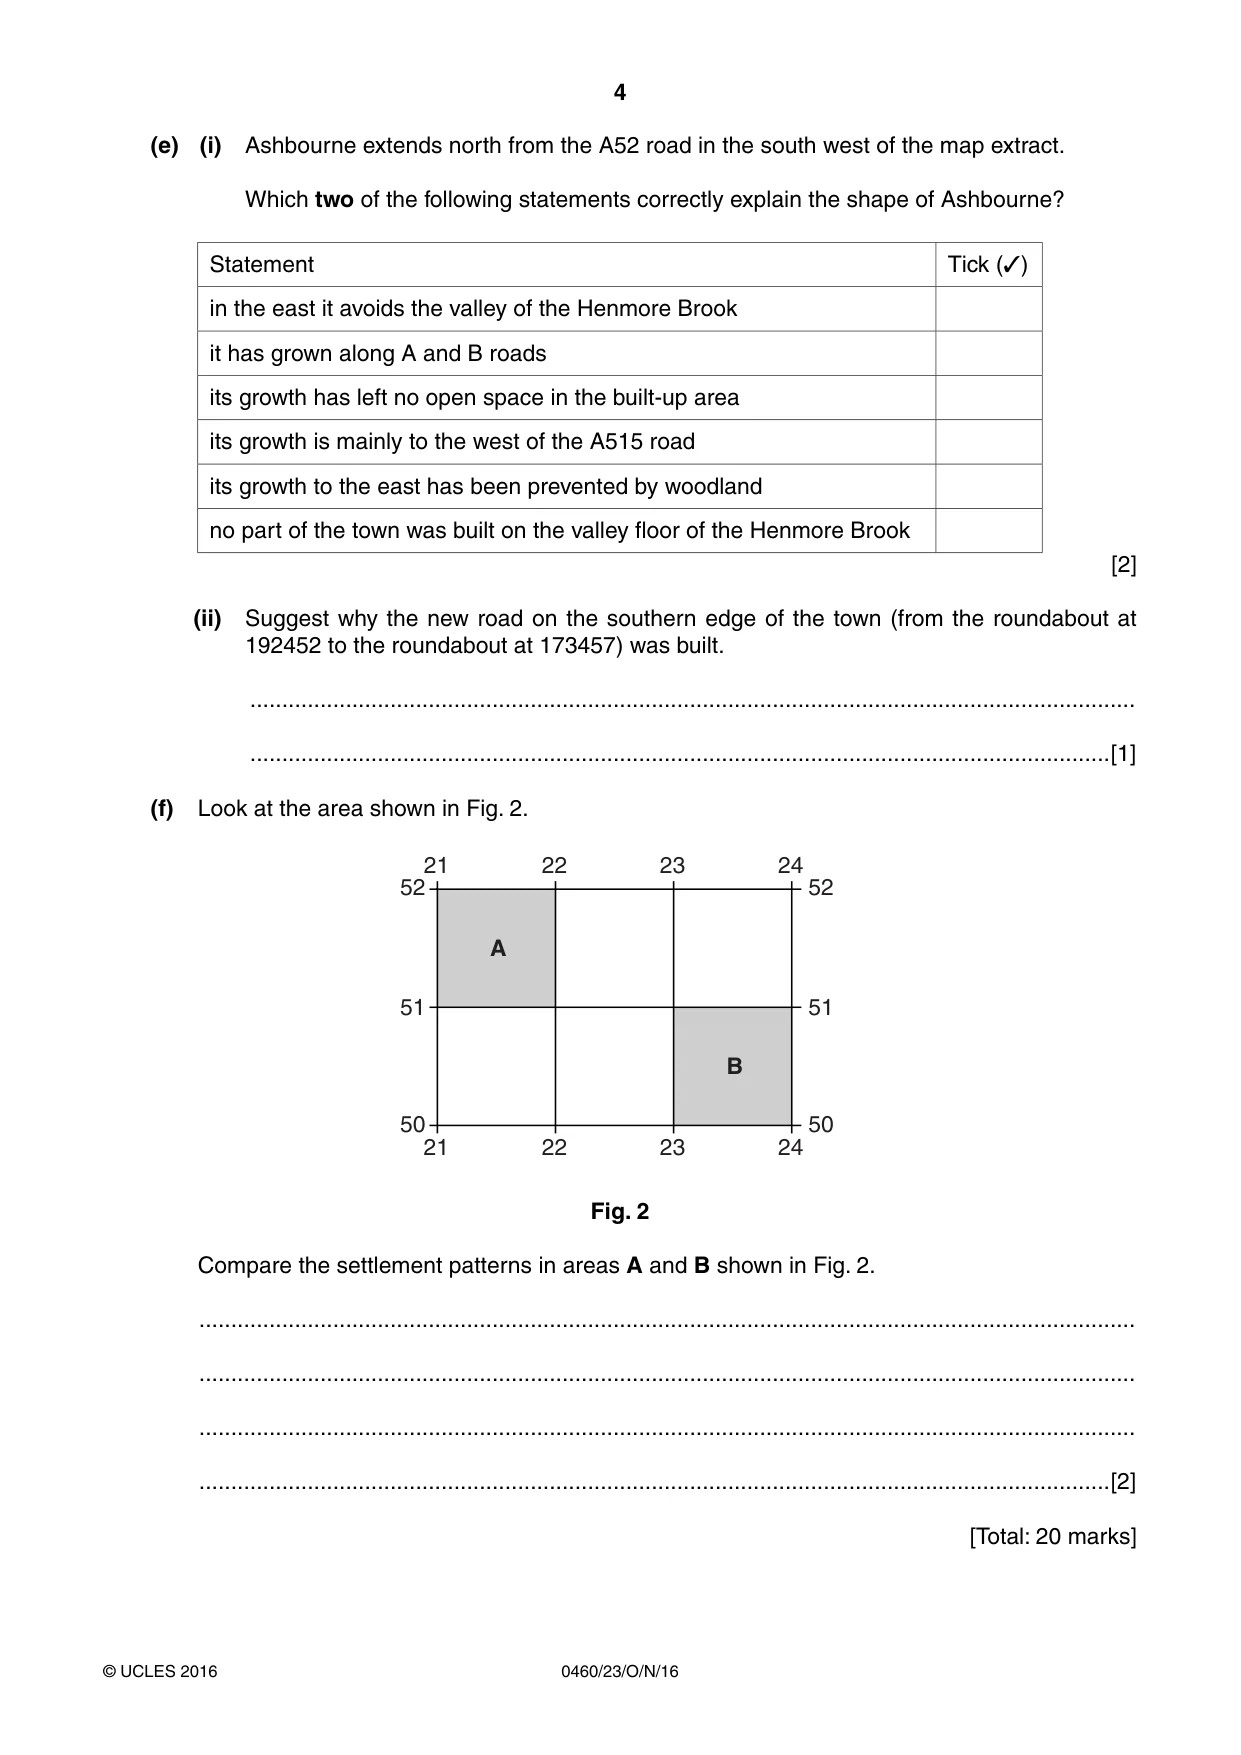
4 0460/23/O/N/16 © UCLES 2016 (e) (i) Ashbourne extends north from the A52 road in the south west of the map extract. Which two of the following statements correctly explain the shape of Ashbourne? Statement Tick (✓) in the east it avoids the valley of the Henmore Brook it has grown along A and B roads its growth has left no open space in the built-up area its growth is mainly to the west of the A515 road its growth to the east has been prevented by woodland no part of the town was built on the valley floor of the Henmore Brook [2] (ii) Suggest why the new road on the southern edge of the town (from the roundabout at 192452 to the roundabout at 173457) was built. … …[1] (f) Look at the area shown in Fig. 2. 21 22 A B 23 24 21 50 51 52 50 51 52 22 23 24 Fig. 2 Compare the settlement patterns in areas A and B shown in Fig. 2. … … … …[2] [Total: 20 marks]
Question paper, page 5
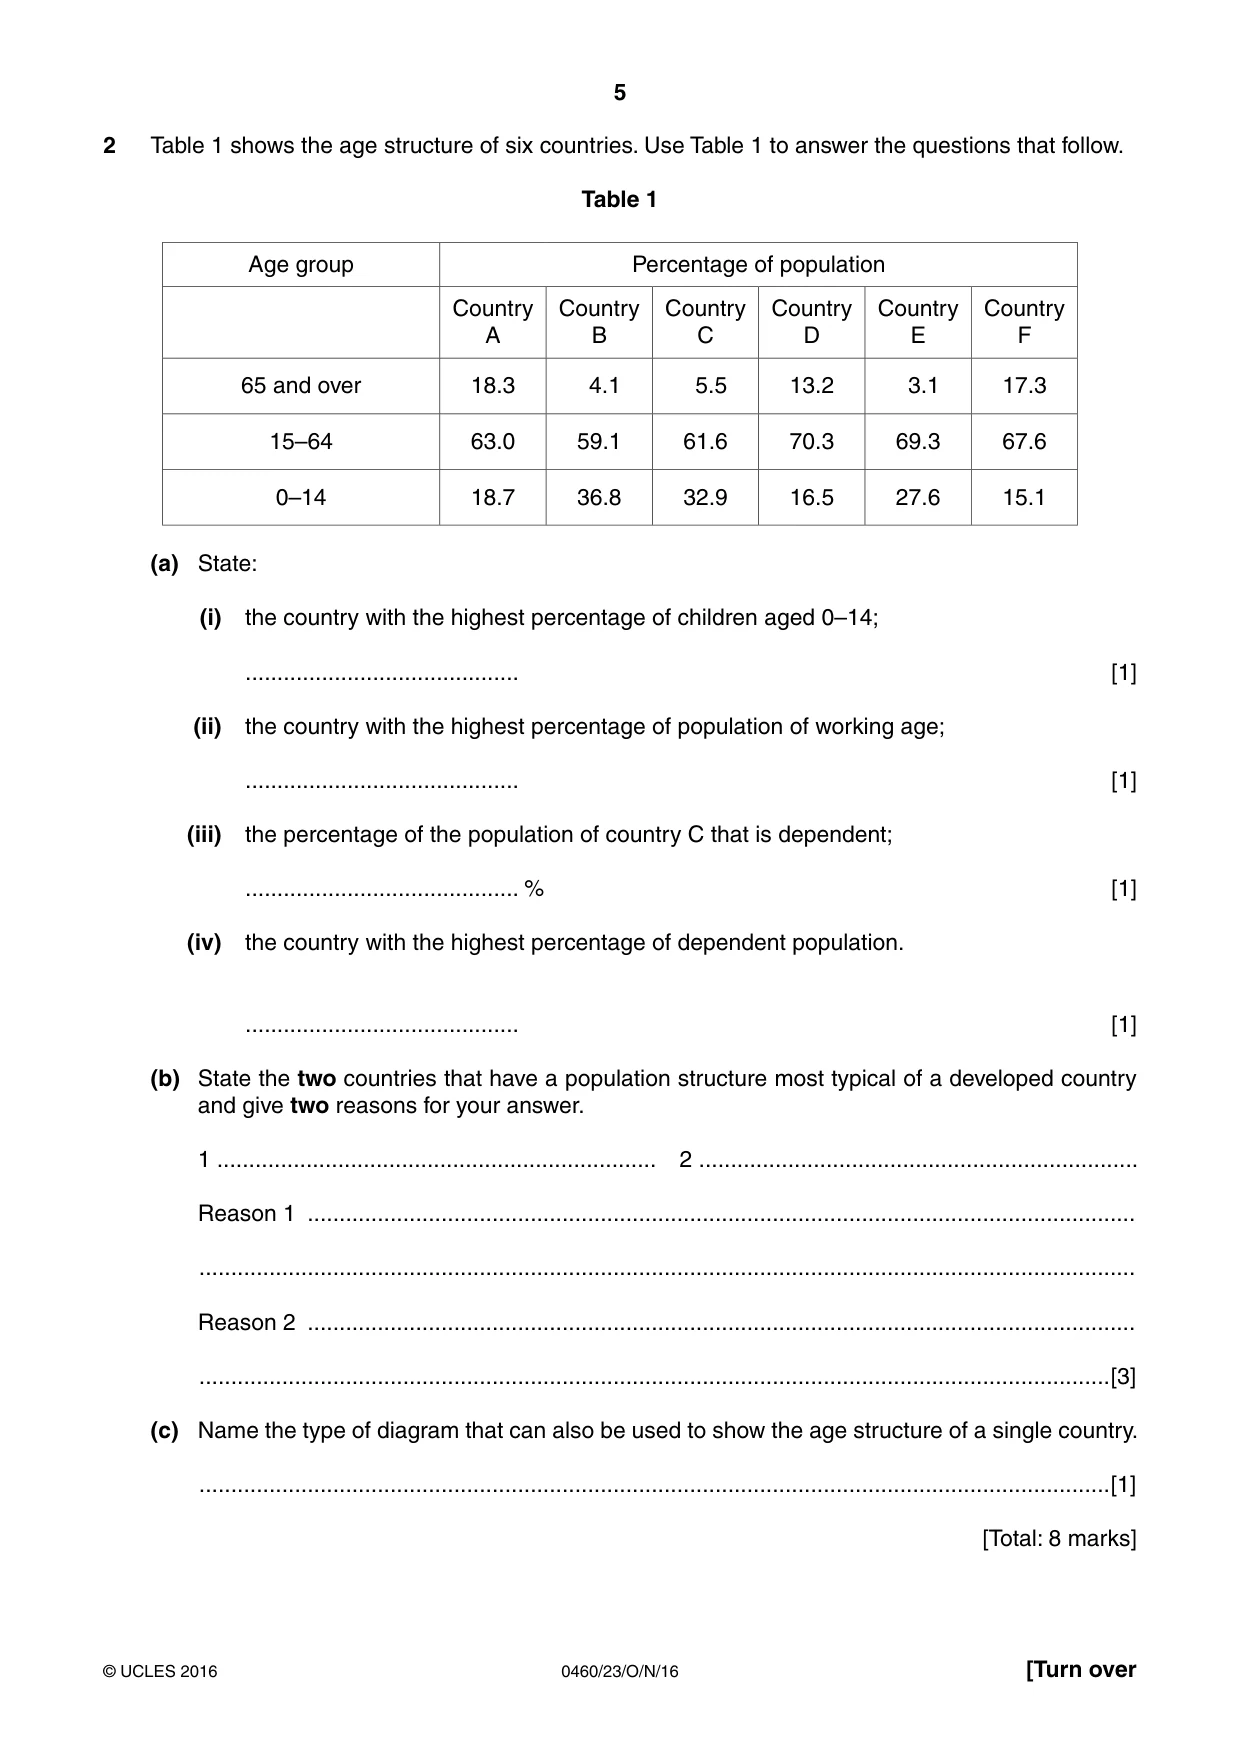
5 0460/23/O/N/16 © UCLES 2016 [Turn over 2 Table 1 shows the age structure of six countries. Use Table 1 to answer the questions that follow. Table 1 Age group Percentage of population Country A Country B Country C Country D Country E Country F 65 and over 18.3 4.1 5.5 13.2 3.1 17.3 15–64 63.0 59.1 61.6 70.3 69.3 67.6 0–14 18.7 36.8 32.9 16.5 27.6 15.1 (a) State: (i) the country with the highest percentage of children aged 0–14; … [1] (ii) the country with the highest percentage of population of working age; … [1] (iii) the percentage of the population of country C that is dependent; … % [1] (iv) the country with the highest percentage of dependent population. … [1] (b) State the two countries that have a population structure most typical of a developed country and give two reasons for your answer. 1 … 2 … Reason 1 … … Reason 2 … …[3] (c) Name the type of diagram that can also be used to show the age structure of a single country. …[1] [Total: 8 marks]
Question paper, page 6
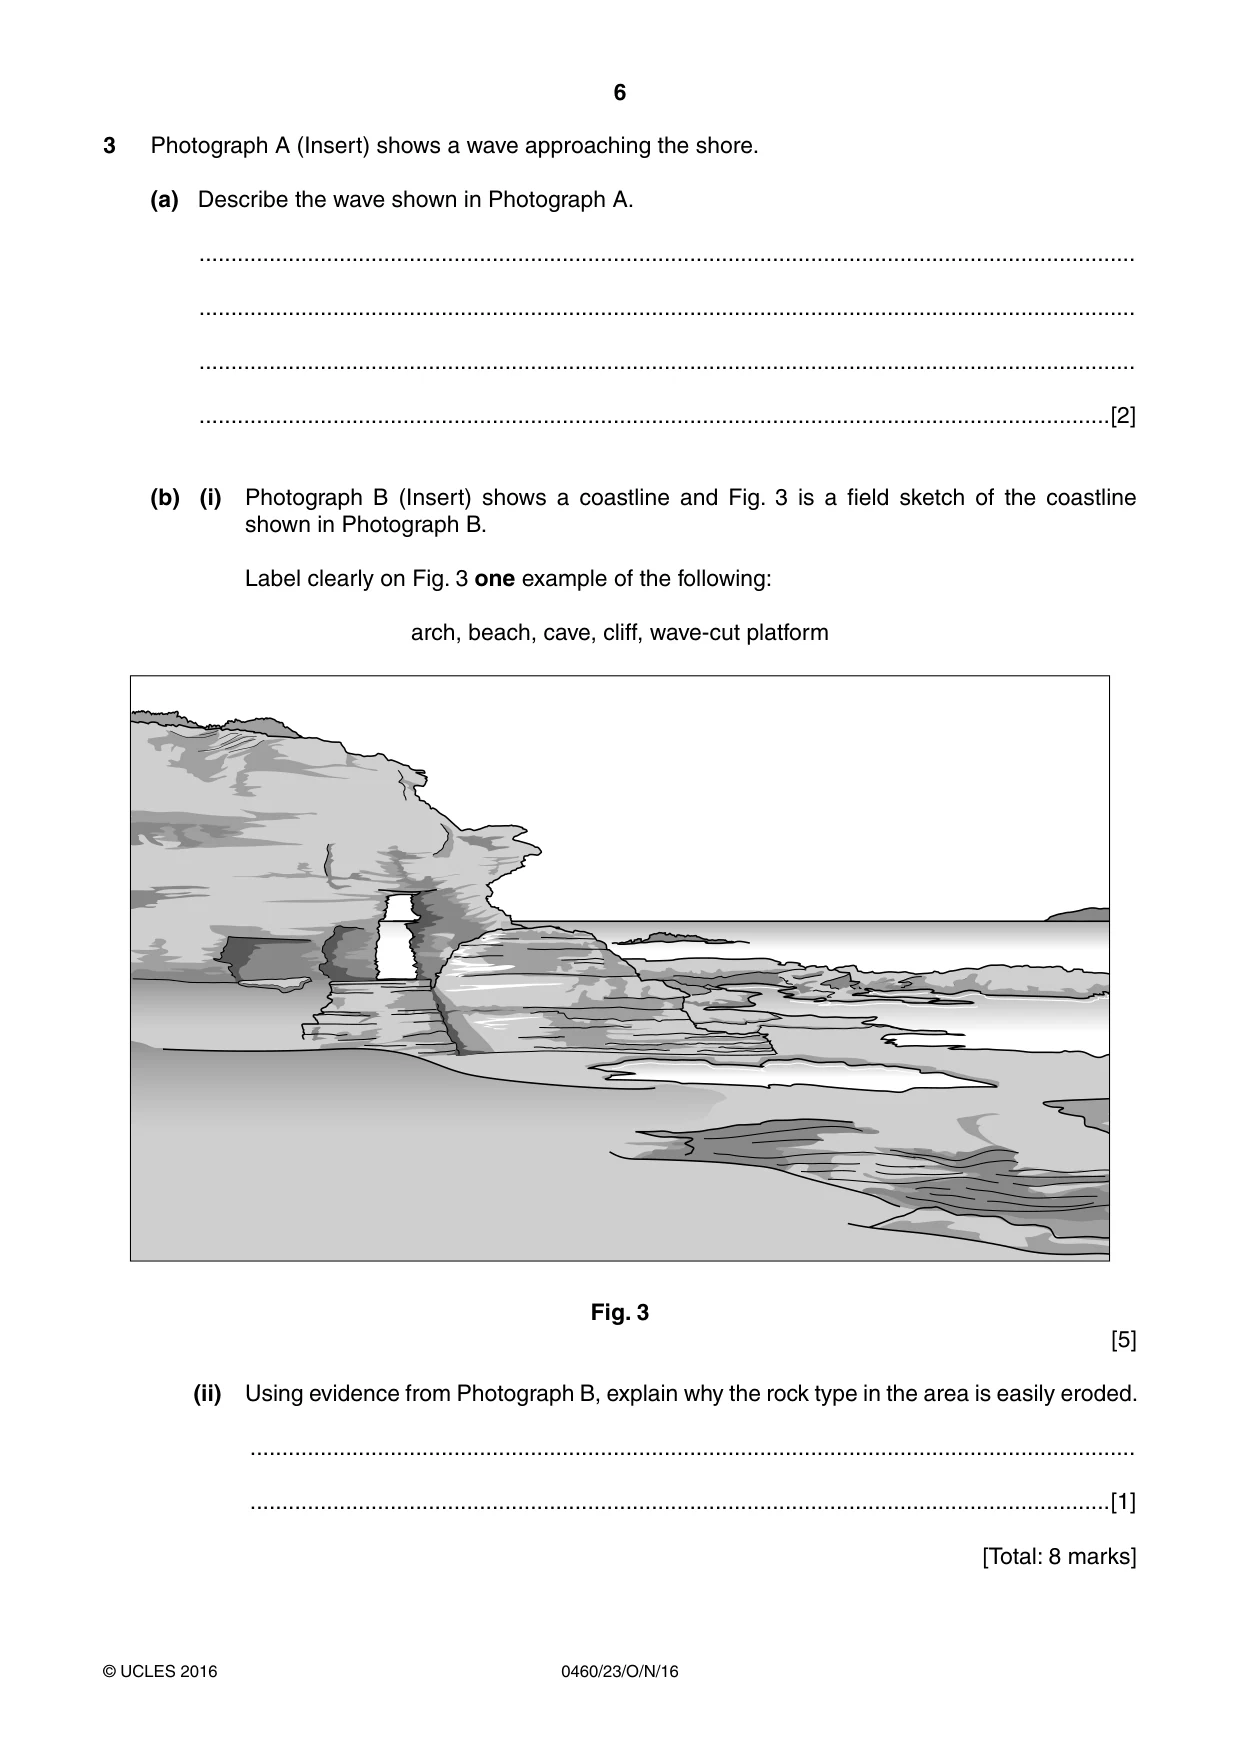
6 0460/23/O/N/16 © UCLES 2016 3 Photograph A (Insert) shows a wave approaching the shore. (a) Describe the wave shown in Photograph A. … … … …[2] (b) (i) Photograph B (Insert) shows a coastline and Fig. 3 is a field sketch of the coastline shown in Photograph B. Label clearly on Fig. 3 one example of the following: arch, beach, cave, cliff, wave-cut platform Fig. 3 [5] (ii) Using evidence from Photograph B, explain why the rock type in the area is easily eroded. … …[1] [Total: 8 marks]
Question paper, page 7
7 0460/23/O/N/16 © UCLES 2016 [Turn over TURN PAGE FOR QUESTION 4
Question paper, page 8
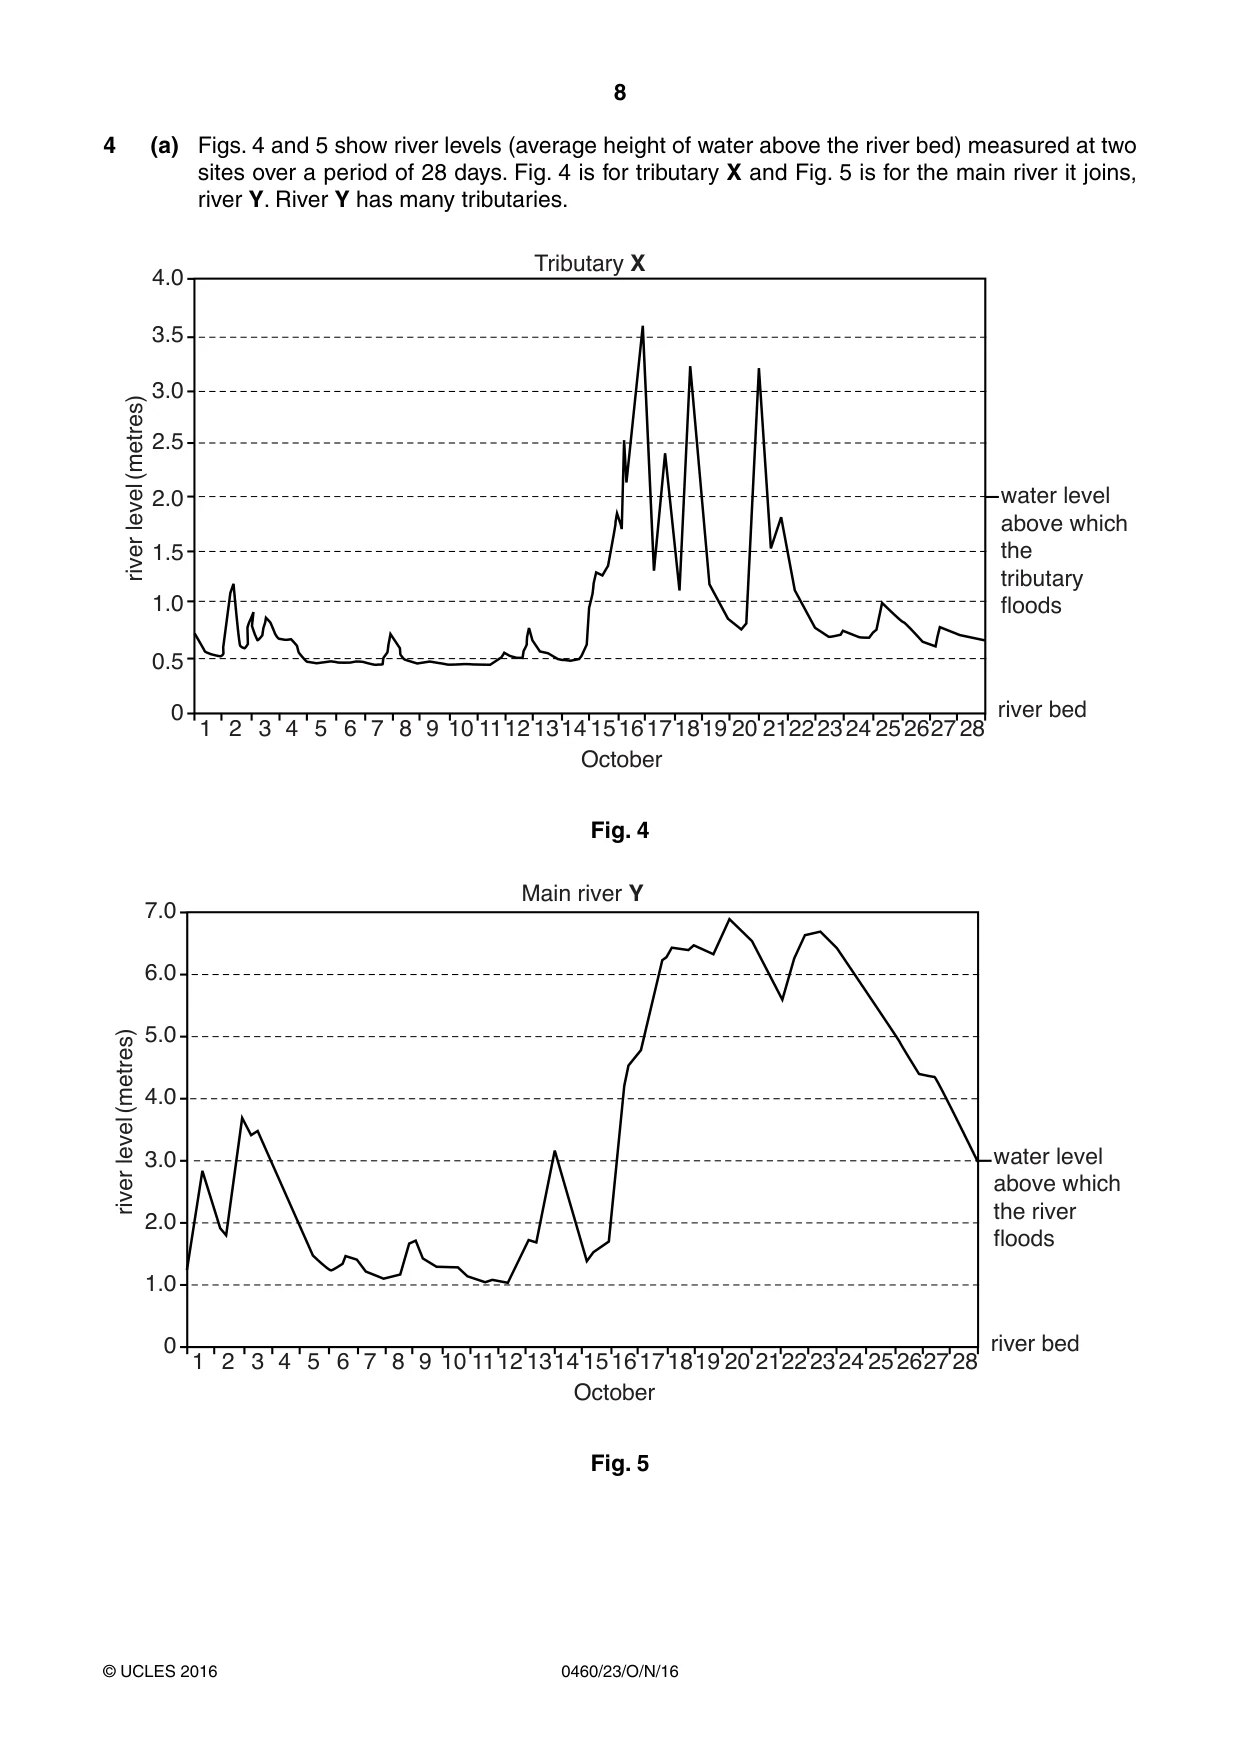
8 0460/23/O/N/16 © UCLES 2016 4 (a) Figs. 4 and 5 show river levels (average height of water above the river bed) measured at two sites over a period of 28 days. Fig. 4 is for tributary X and Fig. 5 is for the main river it joins, river Y. River Y has many tributaries. 1 0 0.5 1.0 1.5 2.0 2.5 3.0 river level (metres) 3.5 4.0 2 3 4 5 6 7 8 9 10 1112 1314 October 1516171819 20 21222324 25262728 Tributary X river bed water level above which the tributary floods Fig. 4 1 0 1.0 2.0 3.0 river level (metres) 4.0 5.0 6.0 7.0 2 3 4 5 6 7 8 9 10 1112 1314 October 1516171819 20 21222324 25262728 Main river Y river bed water level above which the river floods Fig. 5
Question paper, page 9
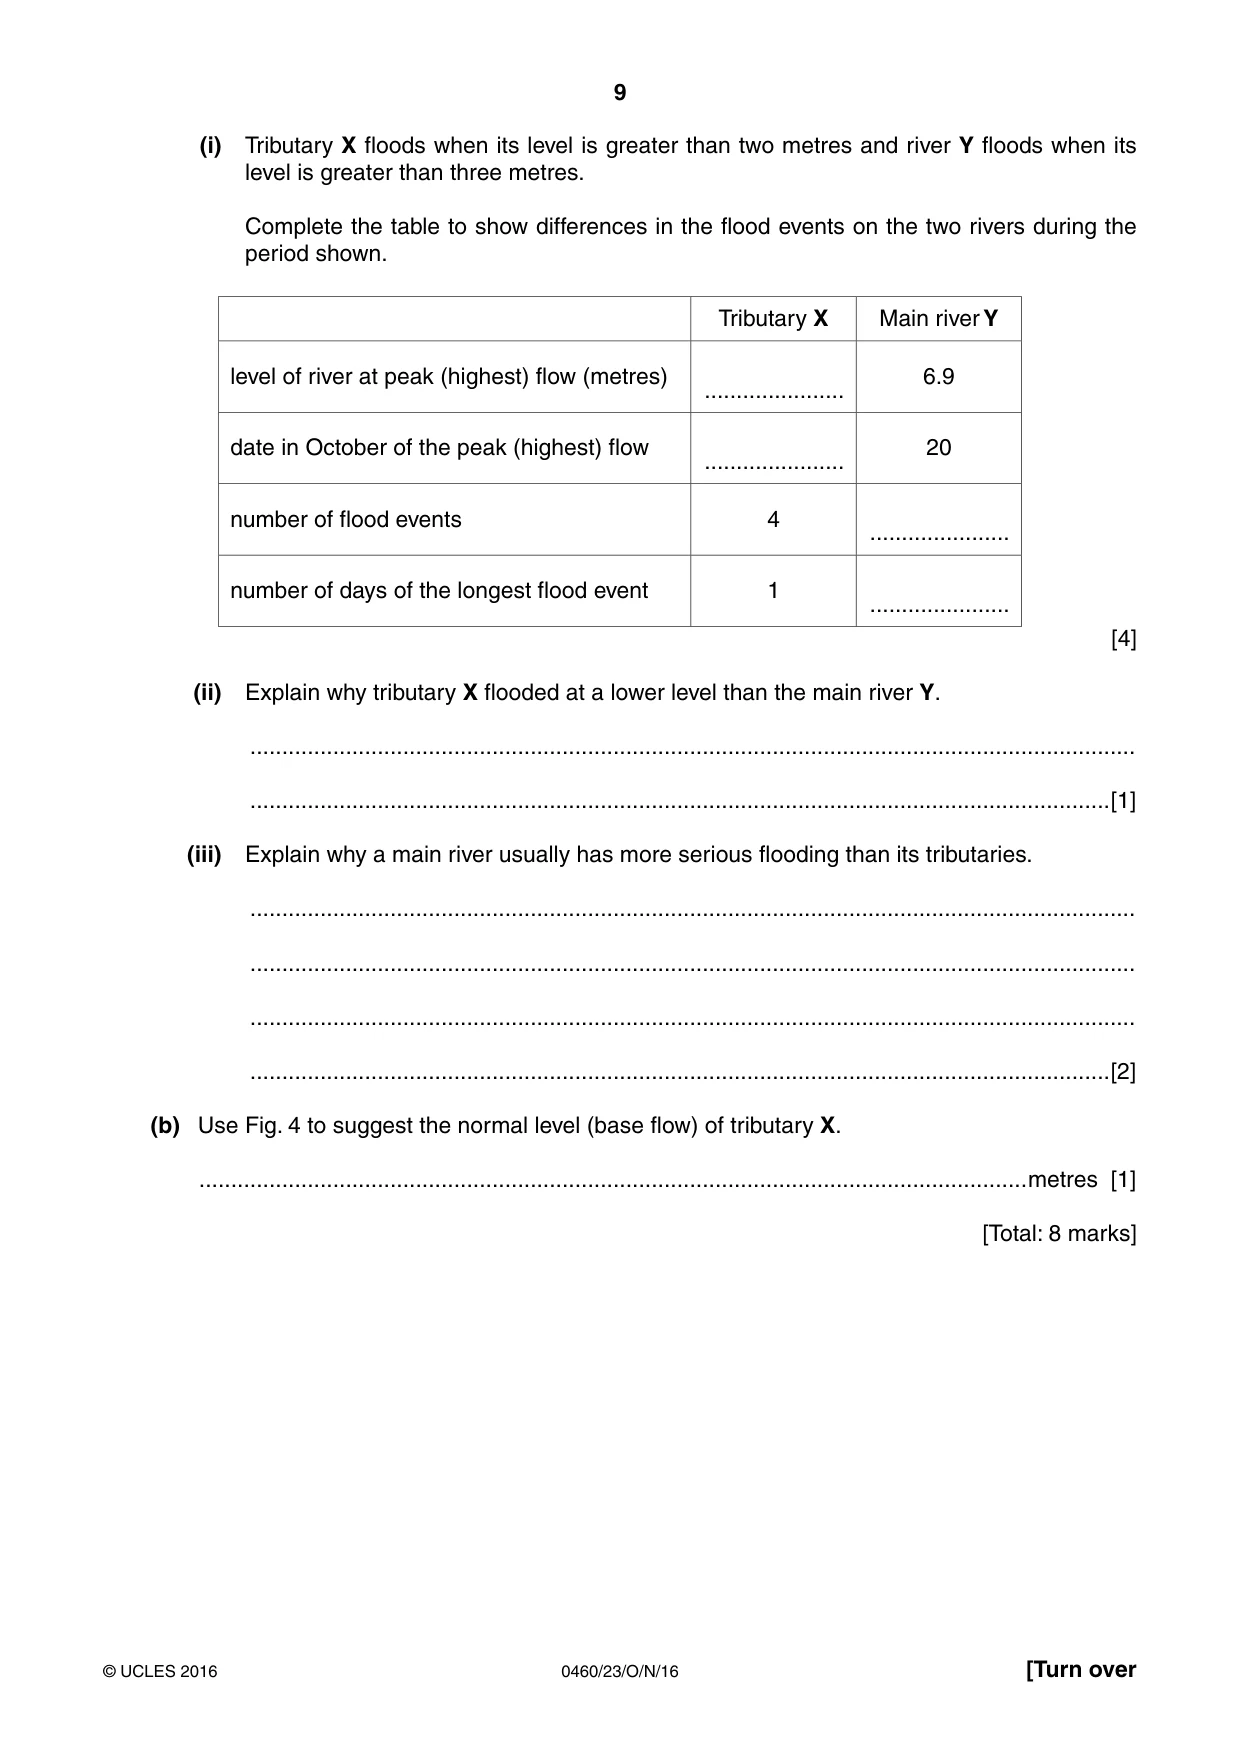
9 0460/23/O/N/16 © UCLES 2016 [Turn over (i) Tributary X floods when its level is greater than two metres and river Y floods when its level is greater than three metres. Complete the table to show differences in the flood events on the two rivers during the period shown. Tributary X Main river Y level of river at peak (highest) flow (metres) … 6.9 date in October of the peak (highest) flow … 20 number of flood events 4 … number of days of the longest flood event 1 … [4] (ii) Explain why tributary X flooded at a lower level than the main river Y. … …[1] (iii) Explain why a main river usually has more serious flooding than its tributaries. … … … …[2] (b) Use Fig. 4 to suggest the normal level (base flow) of tributary X. …metres [1] [Total: 8 marks]
Question paper, page 10
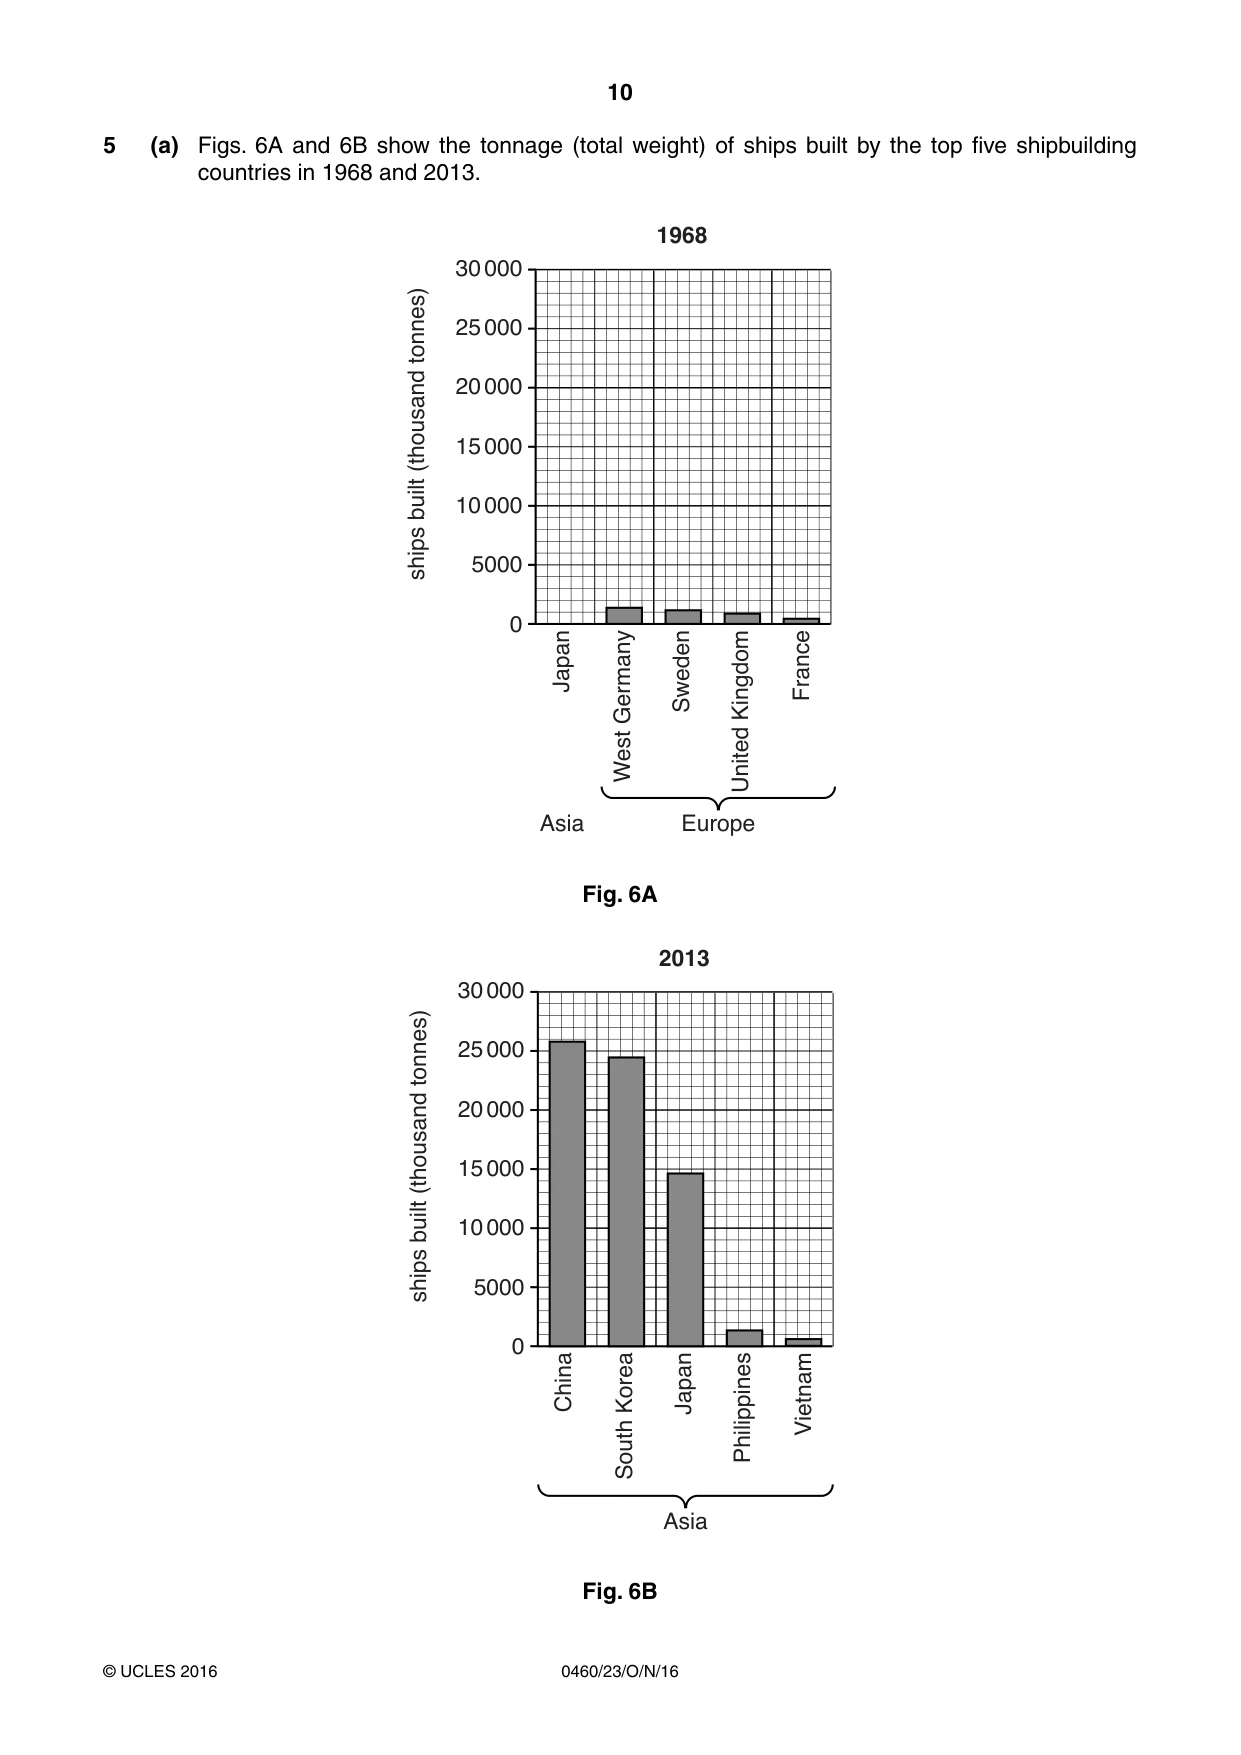
10 0460/23/O/N/16 © UCLES 2016 5 (a) Figs. 6A and 6B show the tonnage (total weight) of ships built by the top five shipbuilding countries in 1968 and 2013. Japan West Germany Sweden United Kingdom France Europe Asia 30 000 25 000 20 000 15 000 10 000 5000 0 ships built (thousand tonnes) 1968 Fig. 6A China South Korea Japan Philippines Vietnam Asia 30 000 25 000 20 000 15 000 10 000 5000 0 ships built (thousand tonnes) 2013 Fig. 6B
Question paper, page 11
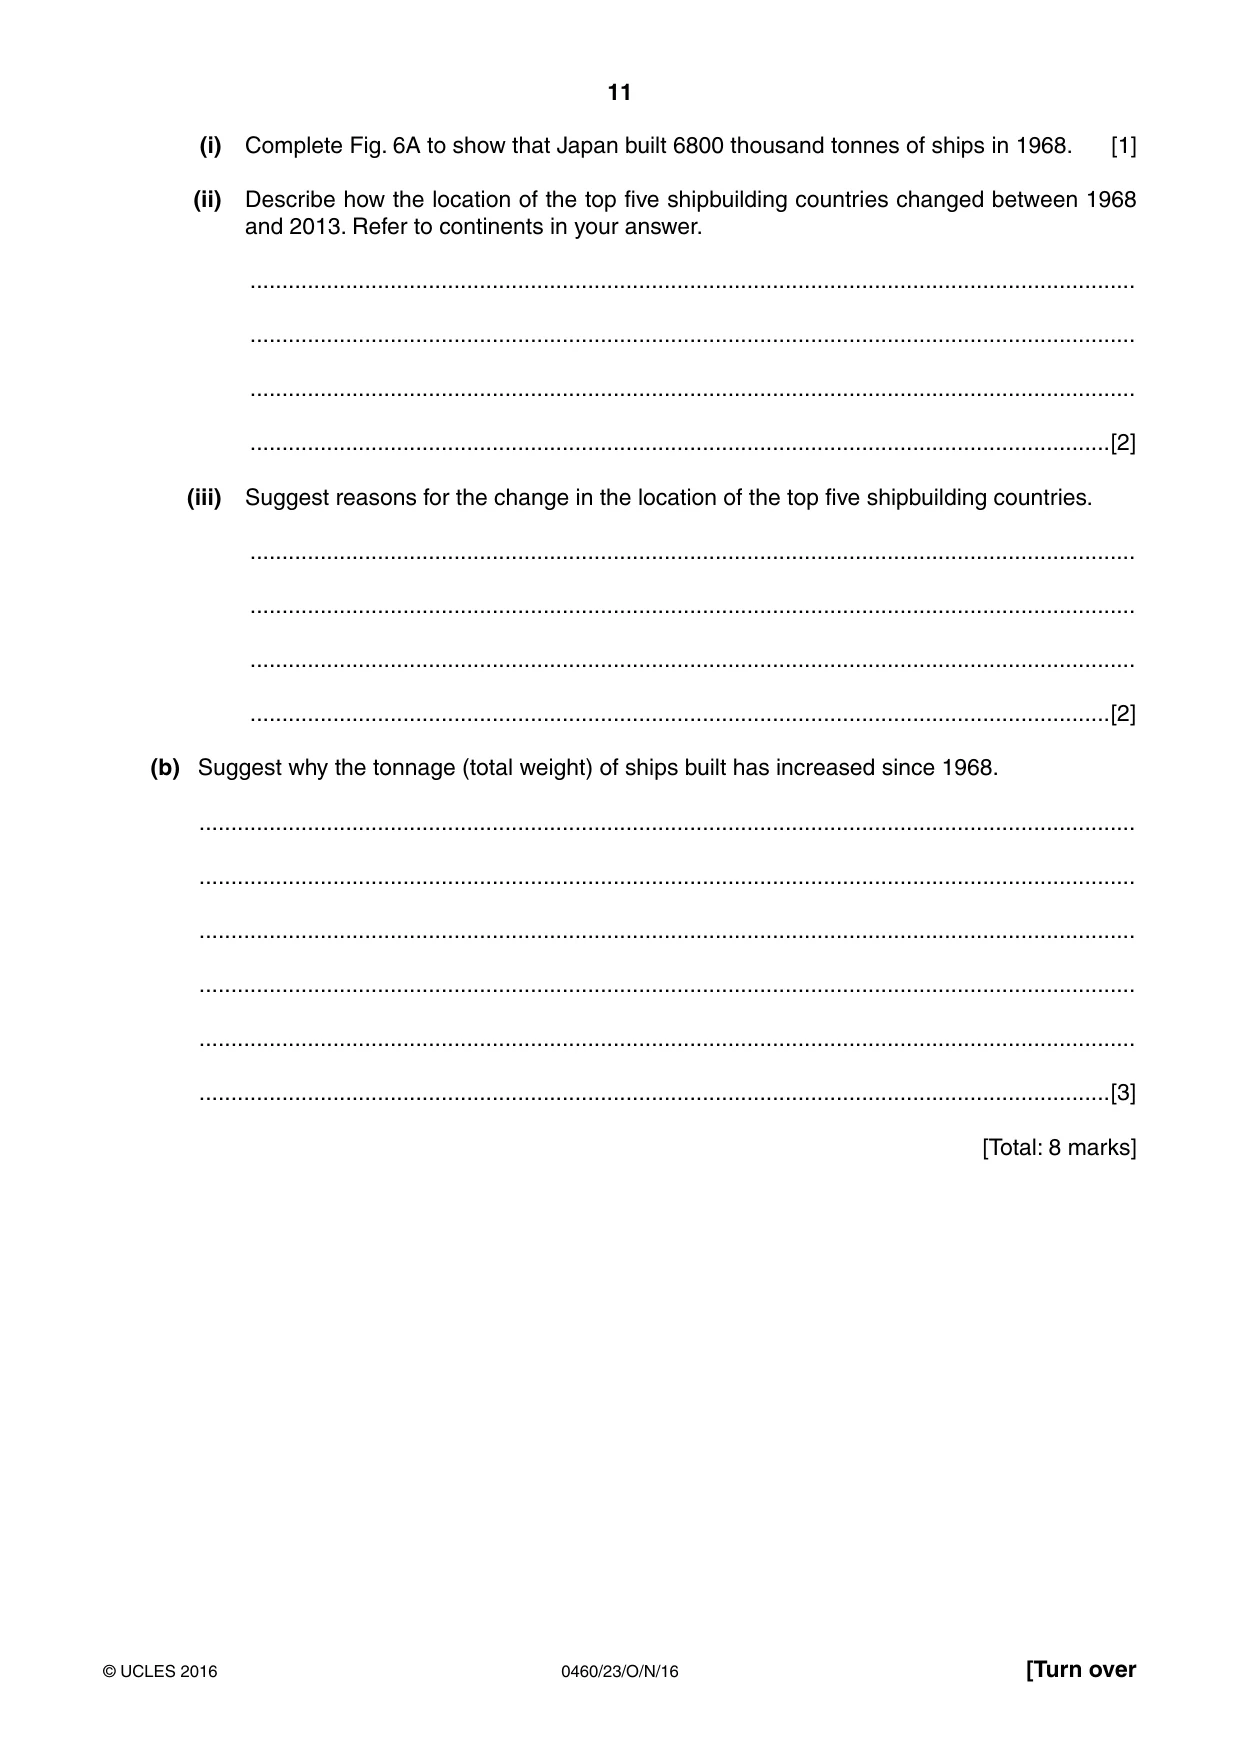
11 0460/23/O/N/16 © UCLES 2016 [Turn over (i) Complete Fig. 6A to show that Japan built 6800 thousand tonnes of ships in 1968. [1] (ii) Describe how the location of the top five shipbuilding countries changed between 1968 and 2013. Refer to continents in your answer. … … … …[2] (iii) Suggest reasons for the change in the location of the top five shipbuilding countries. … … … …[2] (b) Suggest why the tonnage (total weight) of ships built has increased since 1968. … … … … … …[3] [Total: 8 marks]
Question paper, page 12
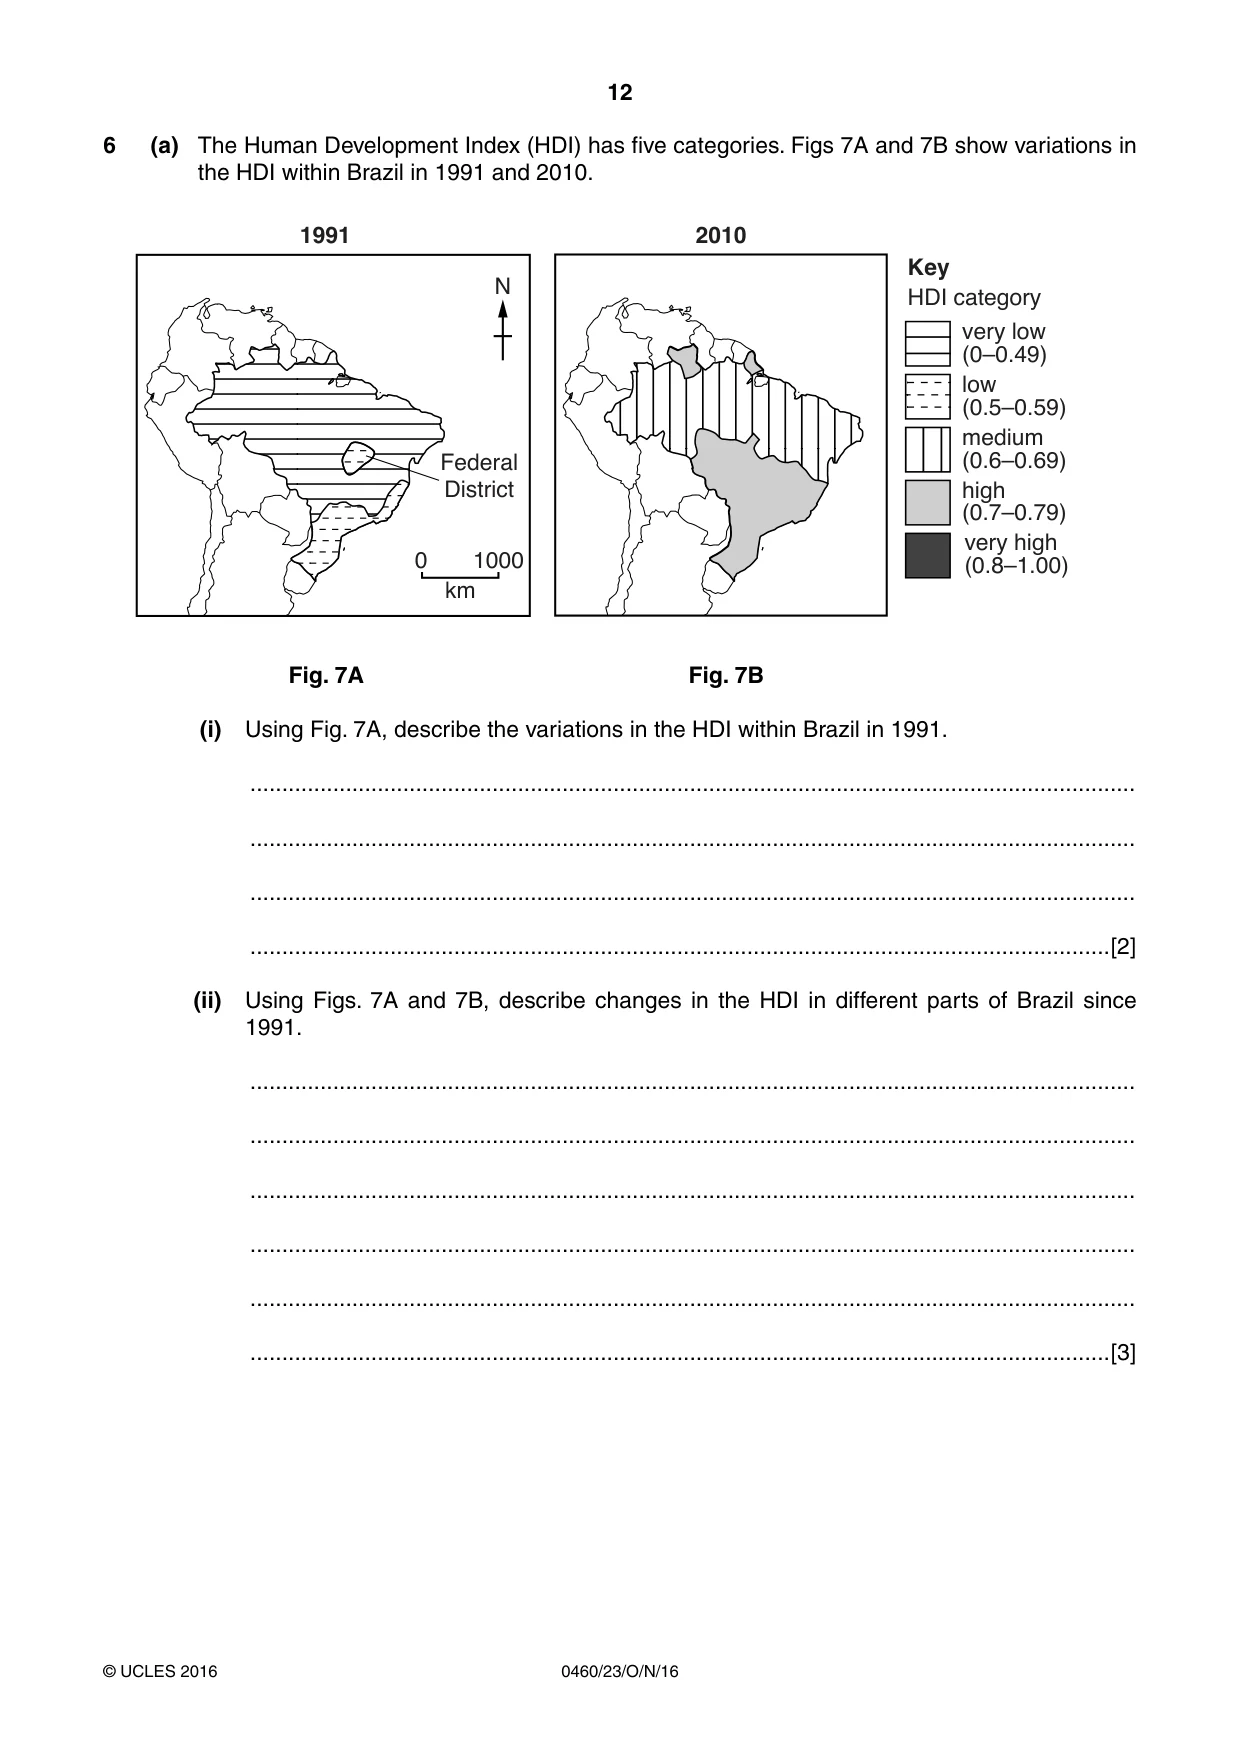
12 0460/23/O/N/16 © UCLES 2016 6 (a) The Human Development Index (HDI) has five categories. Figs 7A and 7B show variations in the HDI within Brazil in 1991 and 2010. 1991 Federal District 2010 0 1000 km N Key HDI category very low (0–0.49) low (0.5–0.59) medium (0.6–0.69) high (0.7–0.79) very high (0.8–1.00) Fig. 7A Fig. 7B (i) Using Fig. 7A, describe the variations in the HDI within Brazil in 1991. … … … …[2] (ii) Using Figs. 7A and 7B, describe changes in the HDI in different parts of Brazil since 1991. … … … … … …[3]
Question paper, page 13
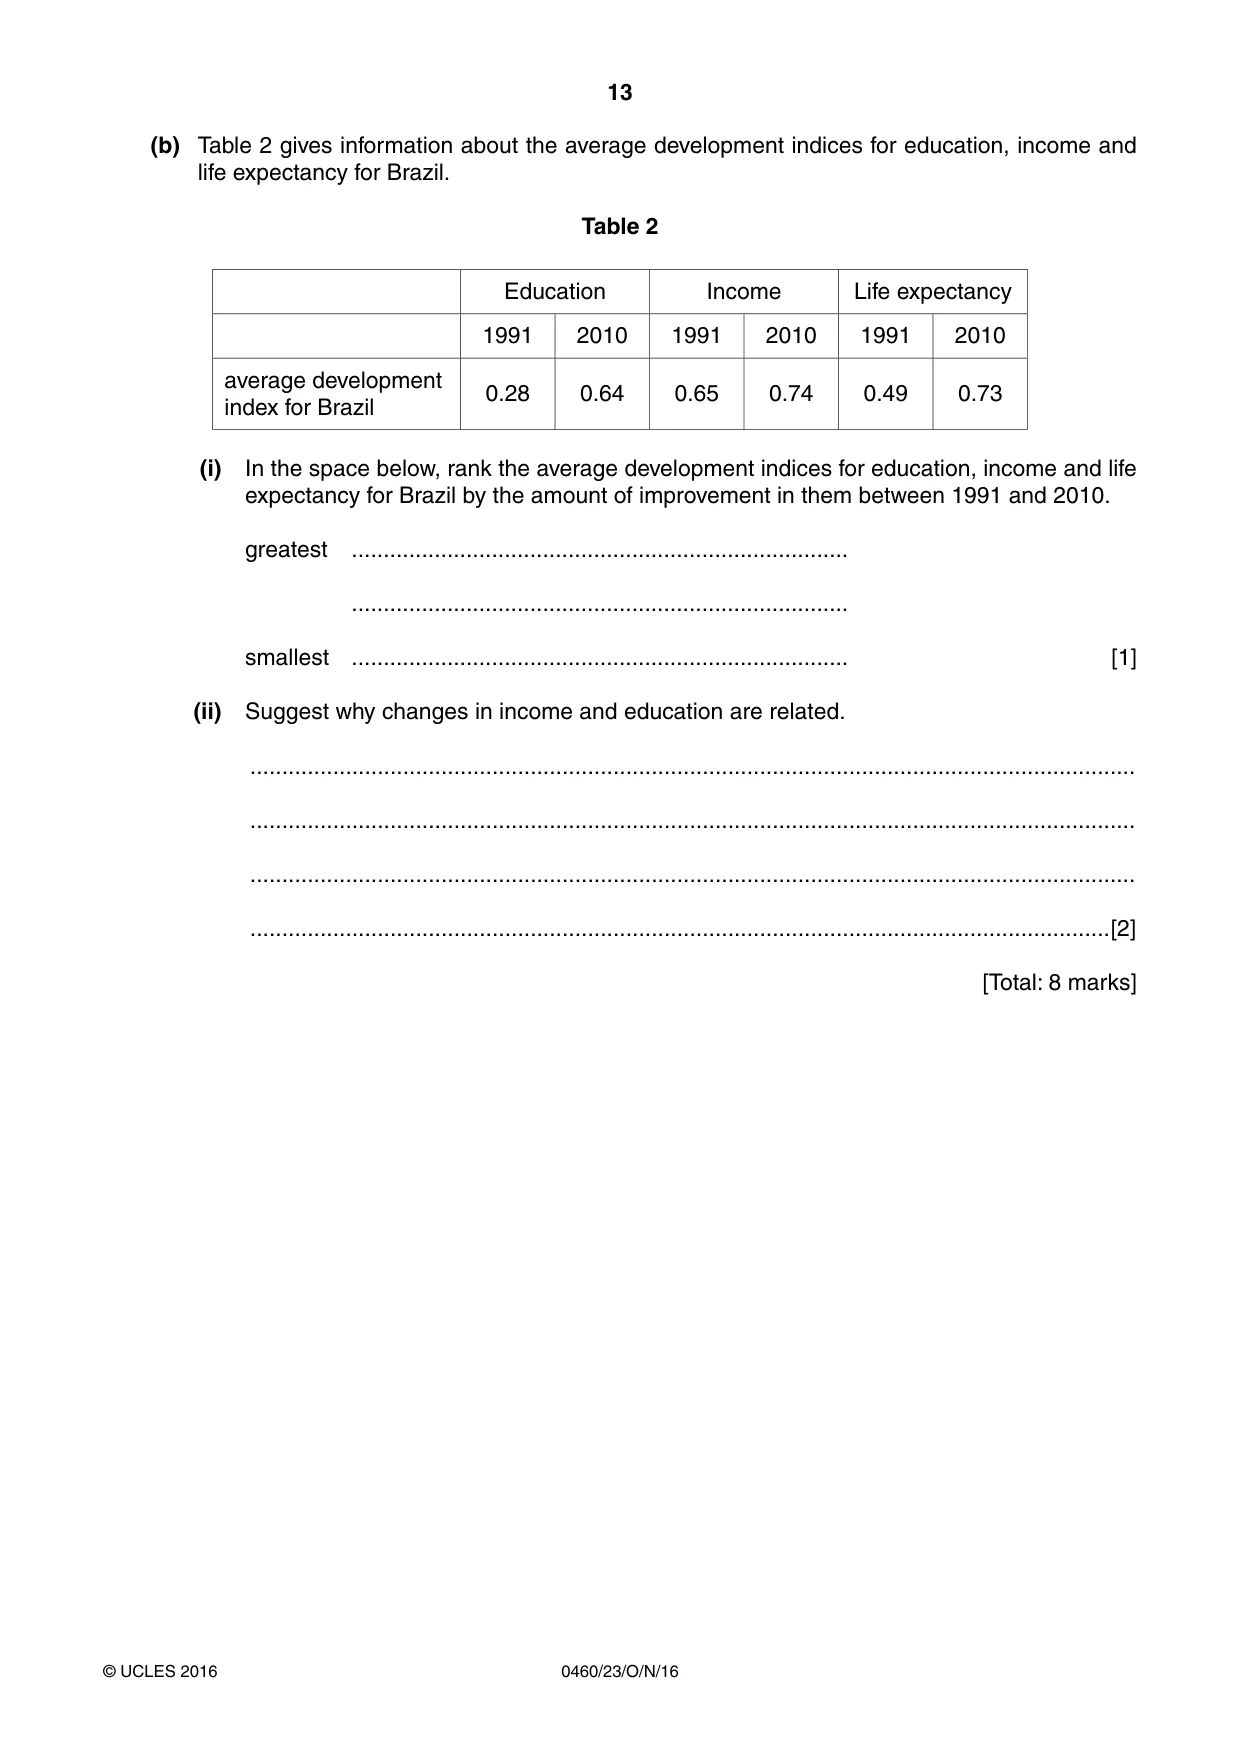
13 0460/23/O/N/16 © UCLES 2016 (b) Table 2 gives information about the average development indices for education, income and life expectancy for Brazil. Table 2 Education Income Life expectancy 1991 2010 1991 2010 1991 2010 average development index for Brazil 0.28 0.64 0.65 0.74 0.49 0.73 (i) In the space below, rank the average development indices for education, income and life expectancy for Brazil by the amount of improvement in them between 1991 and 2010. greatest … … smallest … [1] (ii) Suggest why changes in income and education are related. … … … …[2] [Total: 8 marks]
Question paper, page 14
14 0460/23/O/N/16 © UCLES 2016 Additional Pages If you use the following lined pages to complete the answer(s) to any question(s), the question number(s) must be clearly shown. … … … … … … … … … … … … … … … … … … … … … … … … … …
Question paper, page 15
15 0460/23/O/N/16 © UCLES 2016 … … … … … … … … … … … … … … … … … … … … … … … … … … … …
Question paper, page 16
16 0460/23/O/N/16 © UCLES 2016 Permission to reproduce items where third-party owned material protected by copyright is included has been sought and cleared where possible. Every reasonable effort has been made by the publisher (UCLES) to trace copyright holders, but if any items requiring clearance have unwittingly been included, the publisher will be pleased to make amends at the earliest possible opportunity. To avoid the issue of disclosure of answer-related information to candidates, all copyright acknowledgements are reproduced online in the Cambridge International Examinations Copyright Acknowledgements Booklet. This is produced for each series of examinations and is freely available to download at www.cie.org.uk after the live examination series. Cambridge International Examinations is part of the Cambridge Assessment Group. Cambridge Assessment is the brand name of University of Cambridge Local Examinations Syndicate (UCLES), which is itself a department of the University of Cambridge. BLANK PAGE
Mark scheme, page 1
® IGCSE is the registered trademark of Cambridge International Examinations. This syllabus is approved for use in England, Wales and Northern Ireland as a Cambridge International Level 1/Level 2 Certificate. This document consists of 5 printed pages. © UCLES 2016 [Turn over Cambridge International Examinations Cambridge International General Certificate of Secondary Education GEOGRAPHY 0460/23 Paper 2 October/November 2016 MARK SCHEME Maximum Mark: 60 Published This mark scheme is published as an aid to teachers and candidates, to indicate the requirements of the examination. It shows the basis on which Examiners were instructed to award marks. It does not indicate the details of the discussions that took place at an Examiners’ meeting before marking began, which would have considered the acceptability of alternative answers. Mark schemes should be read in conjunction with the question paper and the Principal Examiner Report for Teachers. Cambridge will not enter into discussions about these mark schemes. Cambridge is publishing the mark schemes for the October/November 2016 series for most Cambridge IGCSE®, Cambridge International A and AS Level components and some Cambridge O Level components.
Mark scheme, page 2
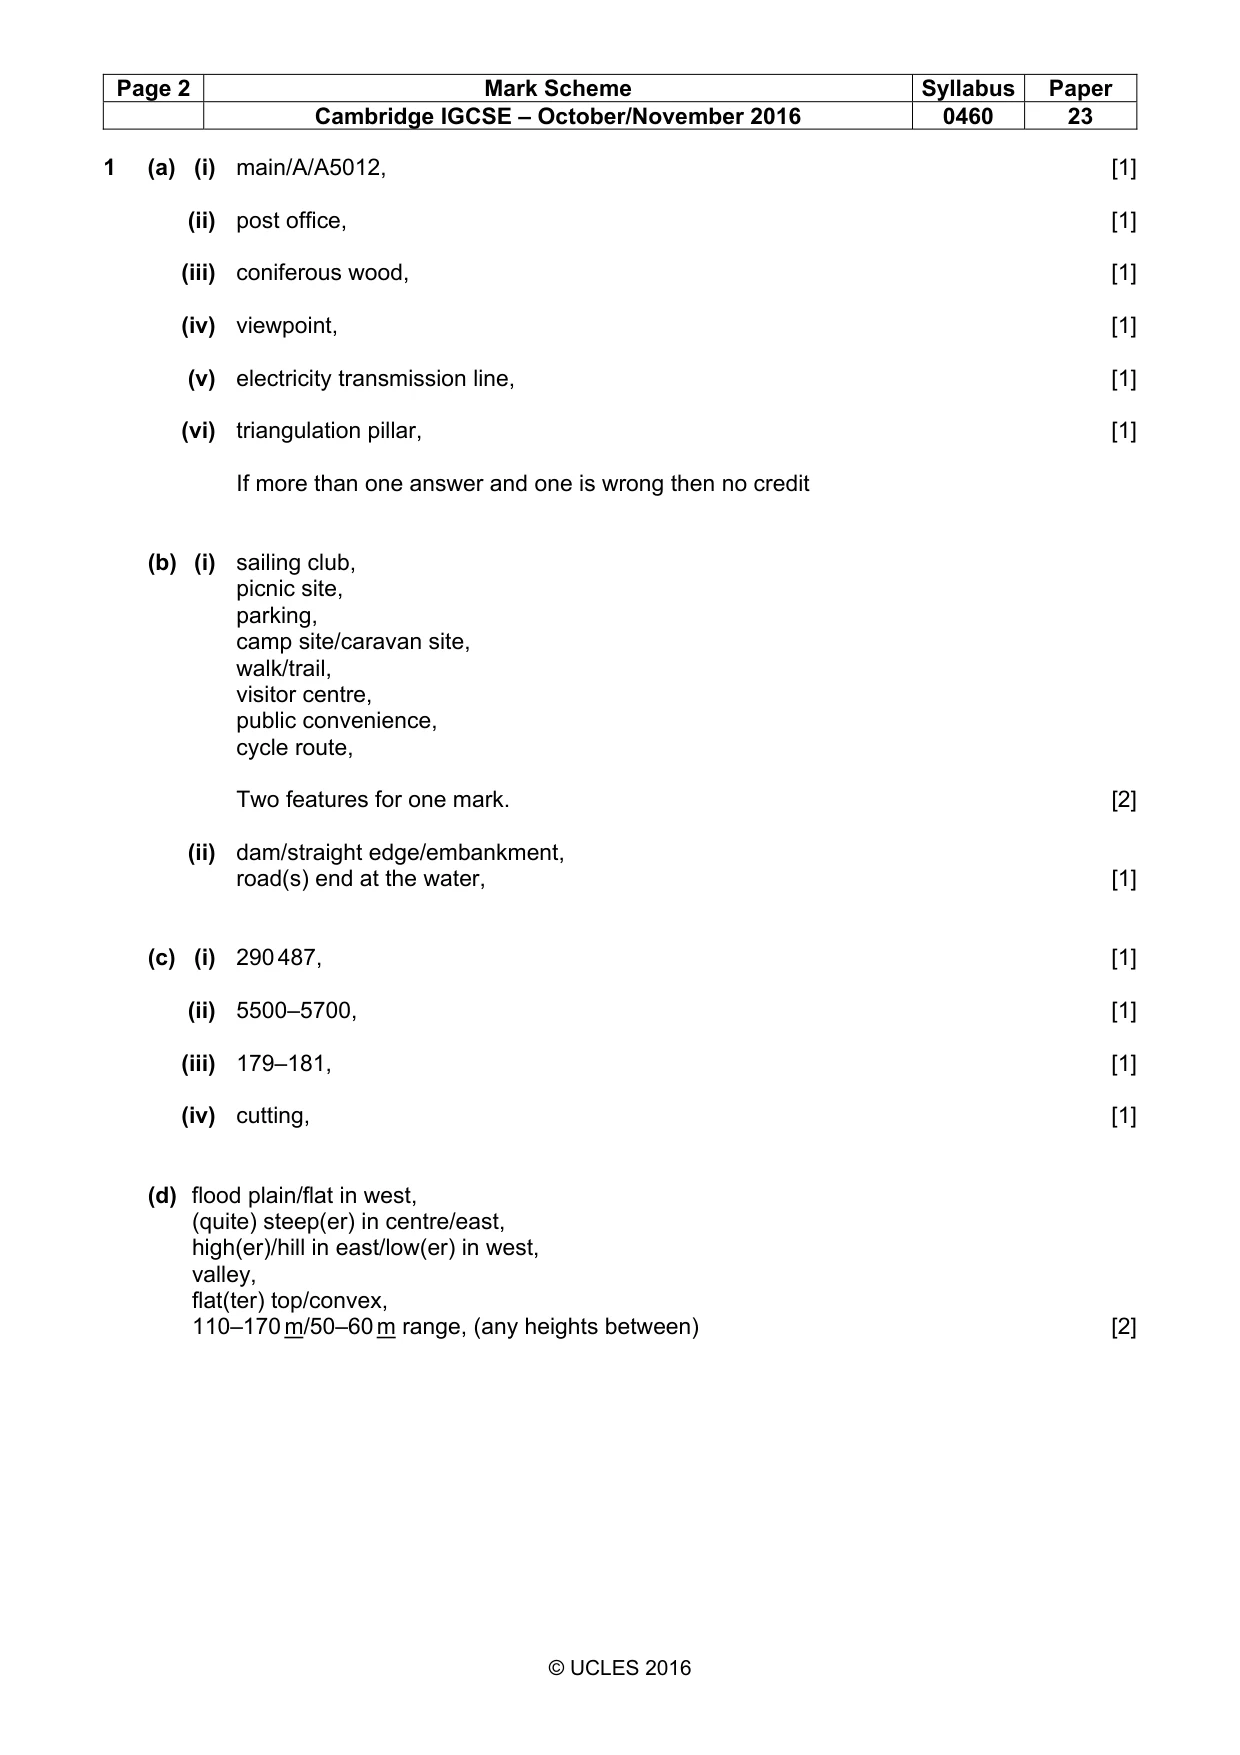
Page 2 Mark Scheme Syllabus Paper Cambridge IGCSE – October/November 2016 0460 23 © UCLES 2016 1 (a) (i) main/A/A5012, [1] (ii) post office, [1] (iii) coniferous wood, [1] (iv) viewpoint, [1] (v) electricity transmission line, [1] (vi) triangulation pillar, [1] If more than one answer and one is wrong then no credit (b) (i) sailing club, picnic site, parking, camp site/caravan site, walk/trail, visitor centre, public convenience, cycle route, Two features for one mark. [2] (ii) dam/straight edge/embankment, road(s) end at the water, [1] (c) (i) 290 487, [1] (ii) 5500–5700, [1] (iii) 179–181, [1] (iv) cutting, [1] (d) flood plain/flat in west, (quite) steep(er) in centre/east, high(er)/hill in east/low(er) in west, valley, flat(ter) top/convex, 110–170 m/50–60 m range, (any heights between) [2]
Mark scheme, page 3
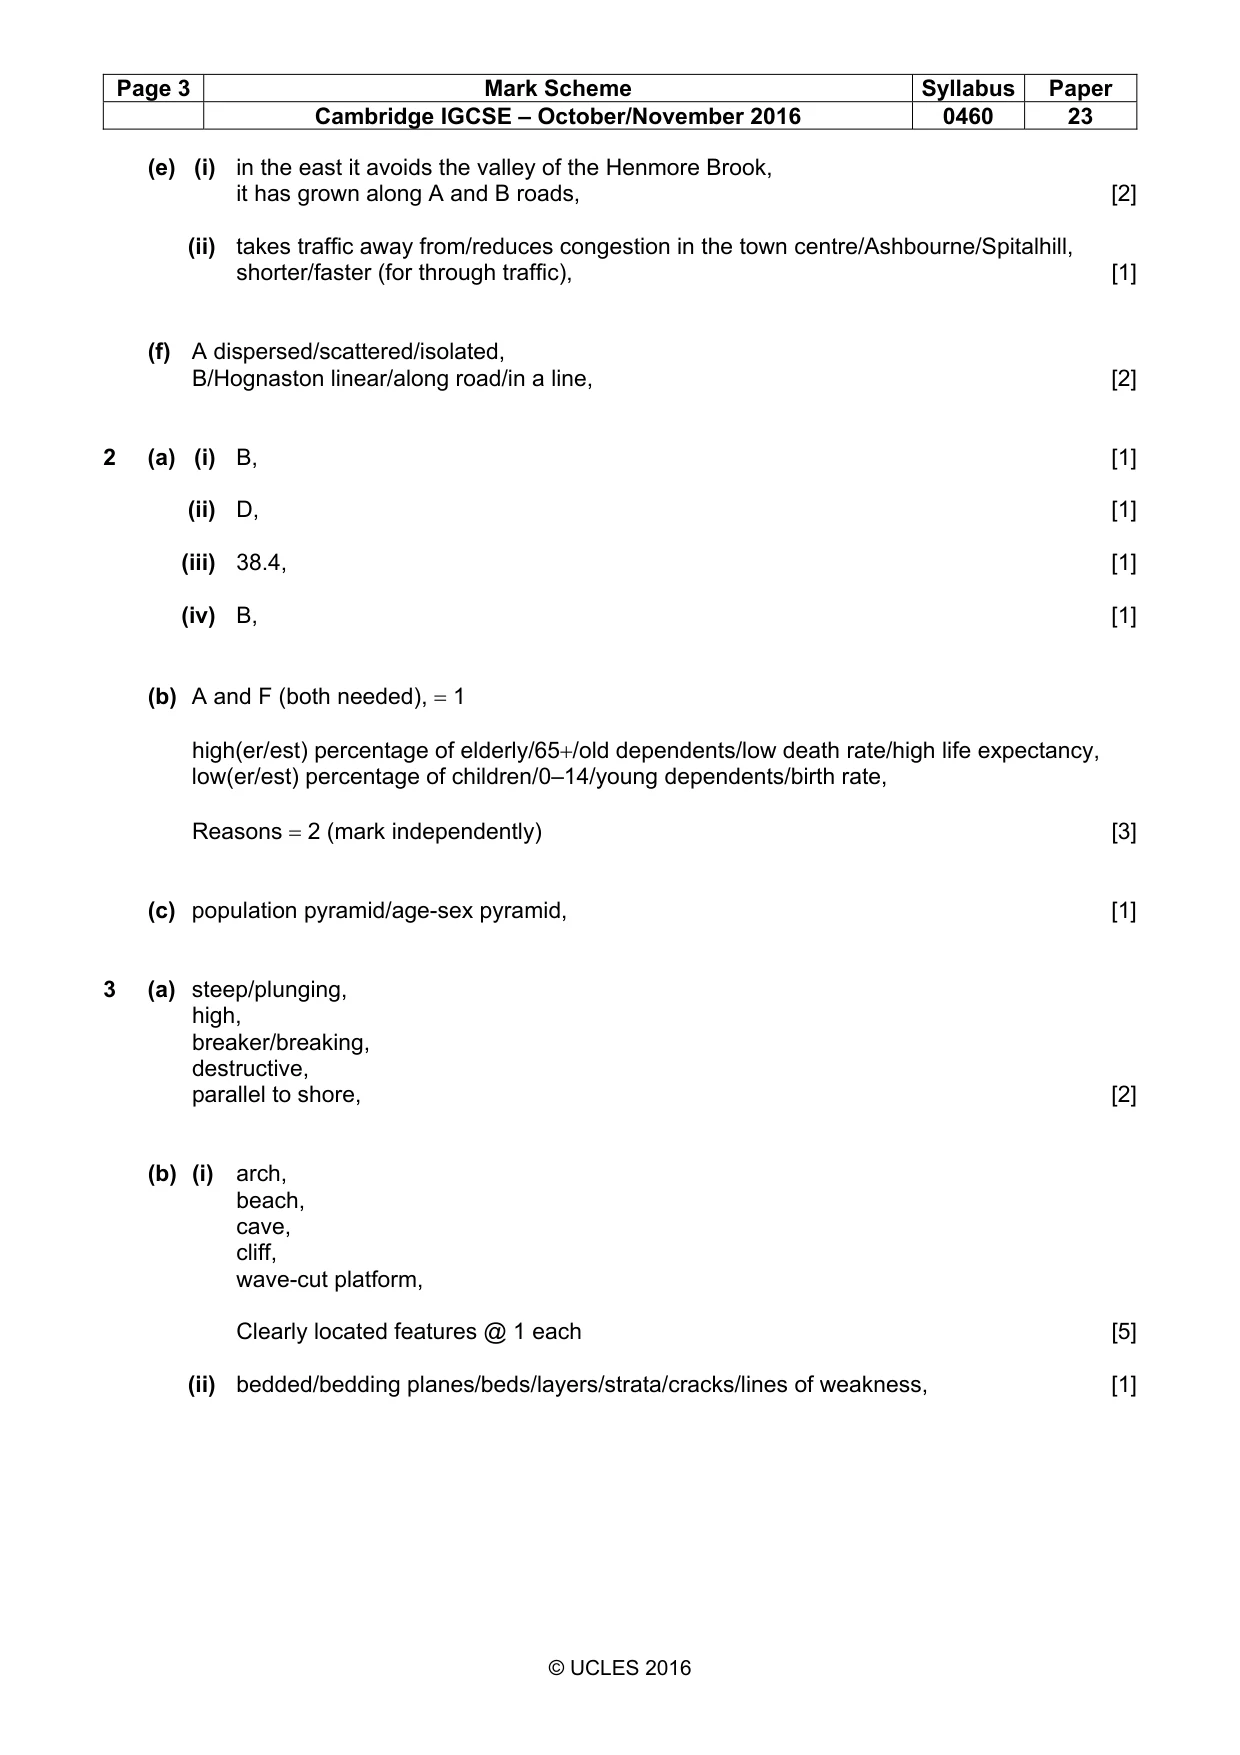
Page 3 Mark Scheme Syllabus Paper Cambridge IGCSE – October/November 2016 0460 23 © UCLES 2016 (e) (i) in the east it avoids the valley of the Henmore Brook, it has grown along A and B roads, [2] (ii) takes traffic away from/reduces congestion in the town centre/Ashbourne/Spitalhill, shorter/faster (for through traffic), [1] (f) A dispersed/scattered/isolated, B/Hognaston linear/along road/in a line, [2] 2 (a) (i) B, [1] (ii) D, [1] (iii) 38.4, [1] (iv) B, [1] (b) A and F (both needed), = 1 high(er/est) percentage of elderly/65+/old dependents/low death rate/high life expectancy, low(er/est) percentage of children/0–14/young dependents/birth rate, Reasons = 2 (mark independently) [3] (c) population pyramid/age-sex pyramid, [1] 3 (a) steep/plunging, high, breaker/breaking, destructive, parallel to shore, [2] (b) (i) arch, beach, cave, cliff, wave-cut platform, Clearly located features @ 1 each [5] (ii) bedded/bedding planes/beds/layers/strata/cracks/lines of weakness, [1]
Mark scheme, page 4
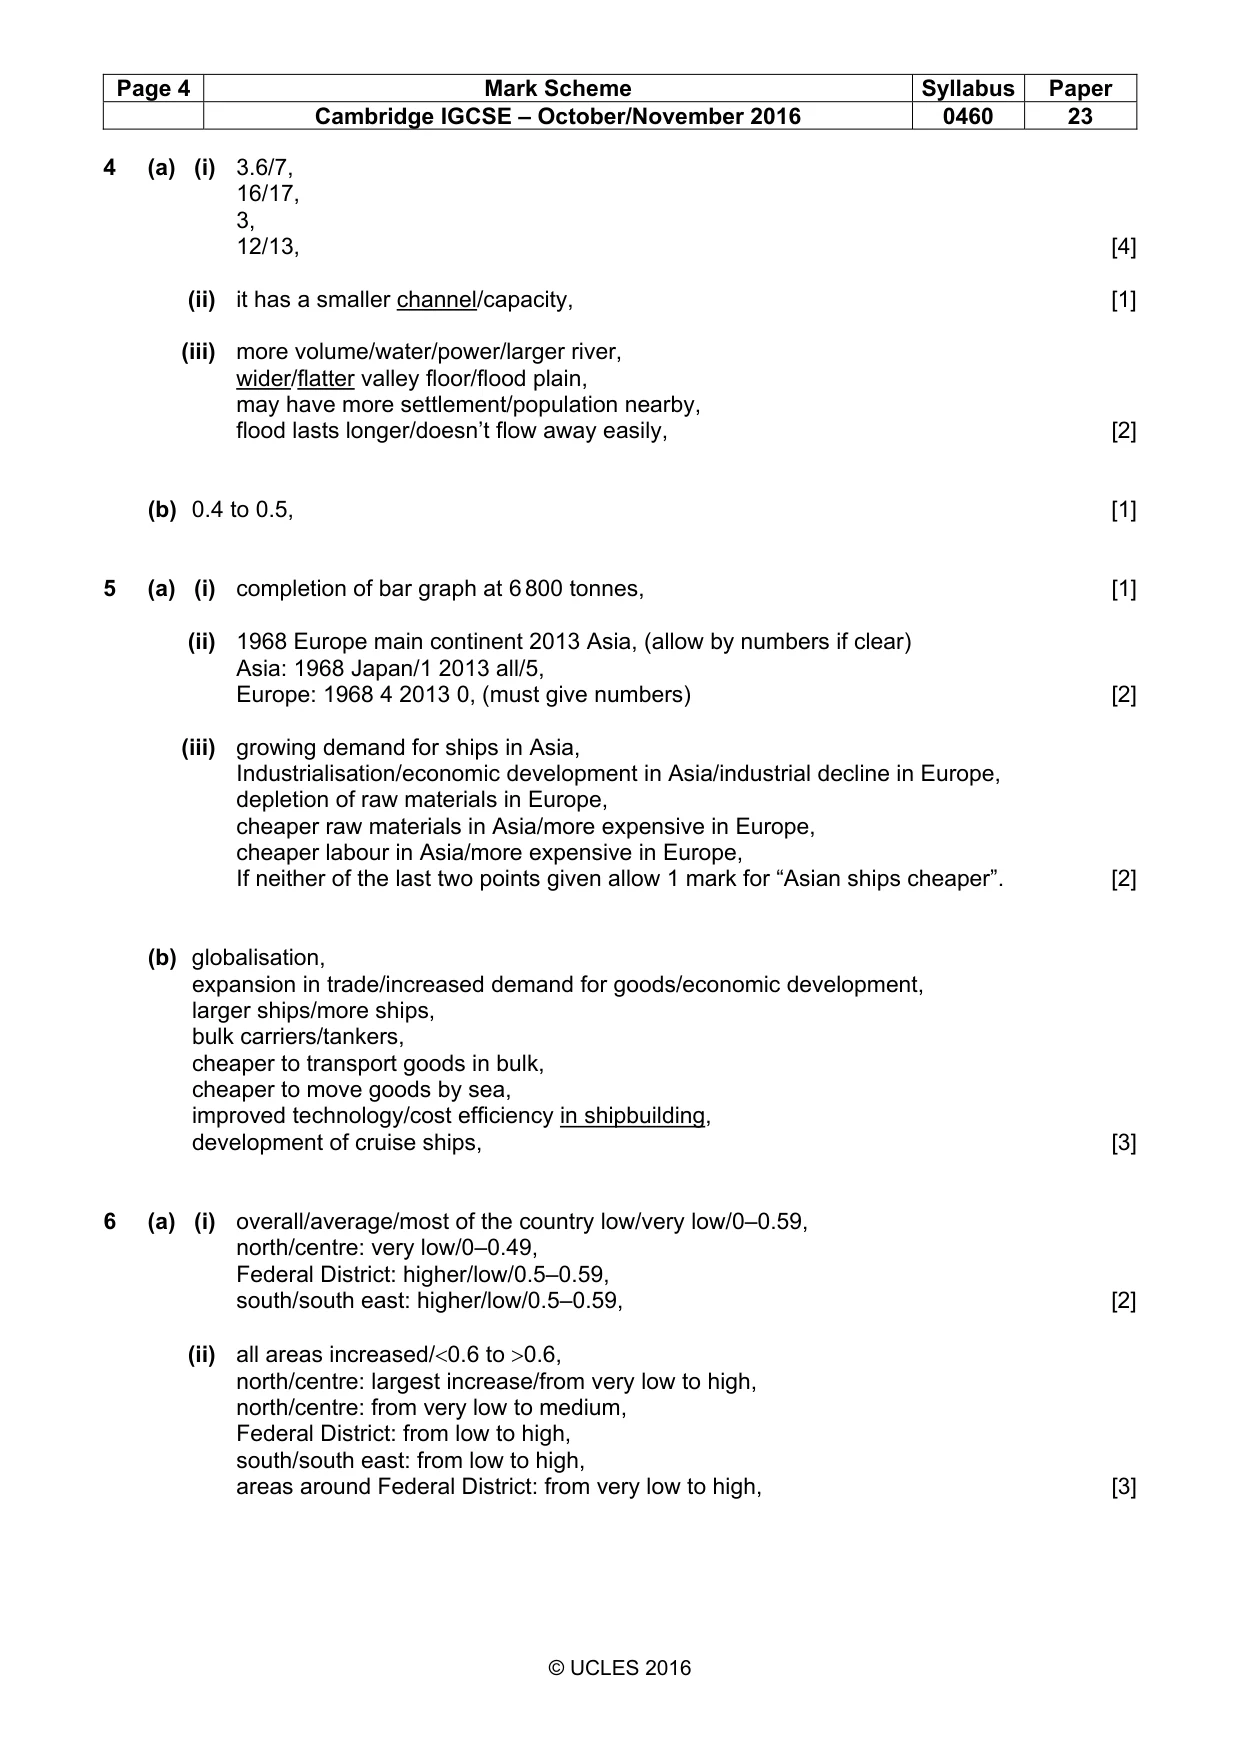
Page 4 Mark Scheme Syllabus Paper Cambridge IGCSE – October/November 2016 0460 23 © UCLES 2016 4 (a) (i) 3.6/7, 16/17, 3, 12/13, [4] (ii) it has a smaller channel/capacity, [1] (iii) more volume/water/power/larger river, wider/flatter valley floor/flood plain, may have more settlement/population nearby, flood lasts longer/doesn’t flow away easily, [2] (b) 0.4 to 0.5, [1] 5 (a) (i) completion of bar graph at 6 800 tonnes, [1] (ii) 1968 Europe main continent 2013 Asia, (allow by numbers if clear) Asia: 1968 Japan/1 2013 all/5, Europe: 1968 4 2013 0, (must give numbers) [2] (iii) growing demand for ships in Asia, Industrialisation/economic development in Asia/industrial decline in Europe, depletion of raw materials in Europe, cheaper raw materials in Asia/more expensive in Europe, cheaper labour in Asia/more expensive in Europe, If neither of the last two points given allow 1 mark for “Asian ships cheaper”. [2] (b) globalisation, expansion in trade/increased demand for goods/economic development, larger ships/more ships, bulk carriers/tankers, cheaper to transport goods in bulk, cheaper to move goods by sea, improved technology/cost efficiency in shipbuilding, development of cruise ships, [3] 6 (a) (i) overall/average/most of the country low/very low/0–0.59, north/centre: very low/0–0.49, Federal District: higher/low/0.5–0.59, south/south east: higher/low/0.5–0.59, [2] (ii) all areas increased/<0.6 to >0.6, north/centre: largest increase/from very low to high, north/centre: from very low to medium, Federal District: from low to high, south/south east: from low to high, areas around Federal District: from very low to high, [3]
Mark scheme, page 5
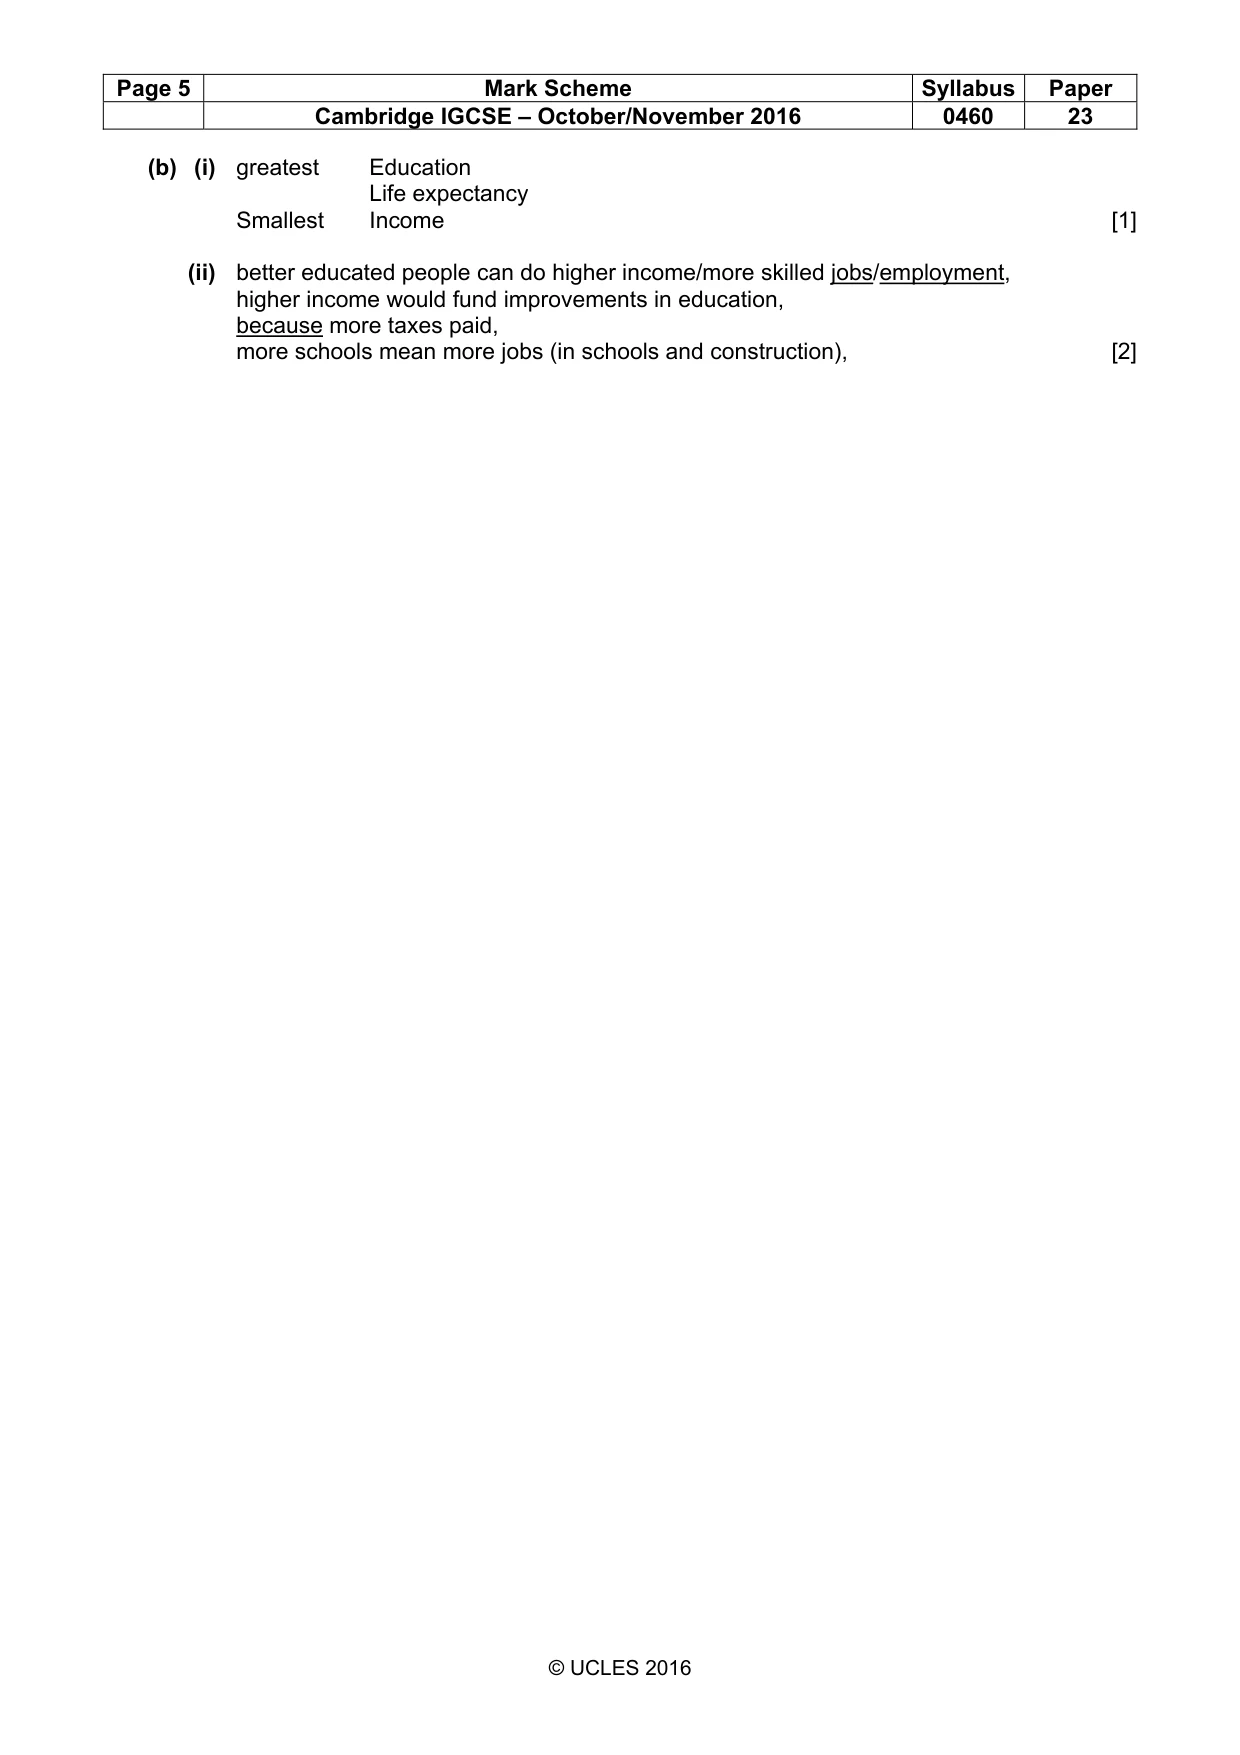
Page 5 Mark Scheme Syllabus Paper Cambridge IGCSE – October/November 2016 0460 23 © UCLES 2016 (b) (i) greatest Education Life expectancy Smallest Income [1] (ii) better educated people can do higher income/more skilled jobs/employment, higher income would fund improvements in education, because more taxes paid, more schools mean more jobs (in schools and construction), [2]
What you needed in this session
Cambridge’s own grade thresholds for 2016 Oct/Nov, Paper 2 · Variant 3. A higher threshold means an easier paper — the bar moves with how the cohort did.