Cambridge IGCSE Geography 0460 — 2016 May/June Paper 4 · Variant 1
0460/41/M/J/16 · 60 marks · ≈68 min
The question paper and its mark scheme, free to read here and free to download. This is Cambridge’s own paper, exactly as it was sat.
Question paper16 pages



Mark scheme5 pages
Answers below. Sit the paper first if you are practising.
Paper as text
Question paper, page 1
This document consists of 16 printed pages and 1 Insert. DC (LK/SW) 114168/5 © UCLES 2016 [Turn over * 2 2 8 6 2 5 7 3 6 6 * GEOGRAPHY 0460/41 Paper 4 Alternative to Coursework May/June 2016 1 hour 30 minutes Candidates answer on the Question Paper. Additional Materials: Calculator Protractor Ruler READ THESE INSTRUCTIONS FIRST Write your Centre number, candidate number and name in the spaces provided. Write in dark blue or black pen. You may use an HB pencil for any diagrams or graphs. Do not use staples, paper clips, glue or correction fluid. DO NOT WRITE IN ANY BARCODES. Write your answer to each question in the space provided. If additional space is required, you should use the lined pages at the end of the booklet. The question number(s) must be clearly shown. Answer all questions. The Insert contains Fig. 1, Table 1 and Photograph A for Question 1, and Fig. 5, Tables 2, 3 and 4 for Question 2. The Insert is not required by the Examiner. Sketch maps and diagrams should be drawn whenever they serve to illustrate an answer. At the end of the examination, fasten all your work securely together. The number of marks is given in brackets [ ] at the end of each question or part question. The syllabus is approved for use in England, Wales and Northern Ireland as a Cambridge International Level 1/Level 2 Certificate. Cambridge International Examinations Cambridge International General Certificate of Secondary Education
Question paper, page 2
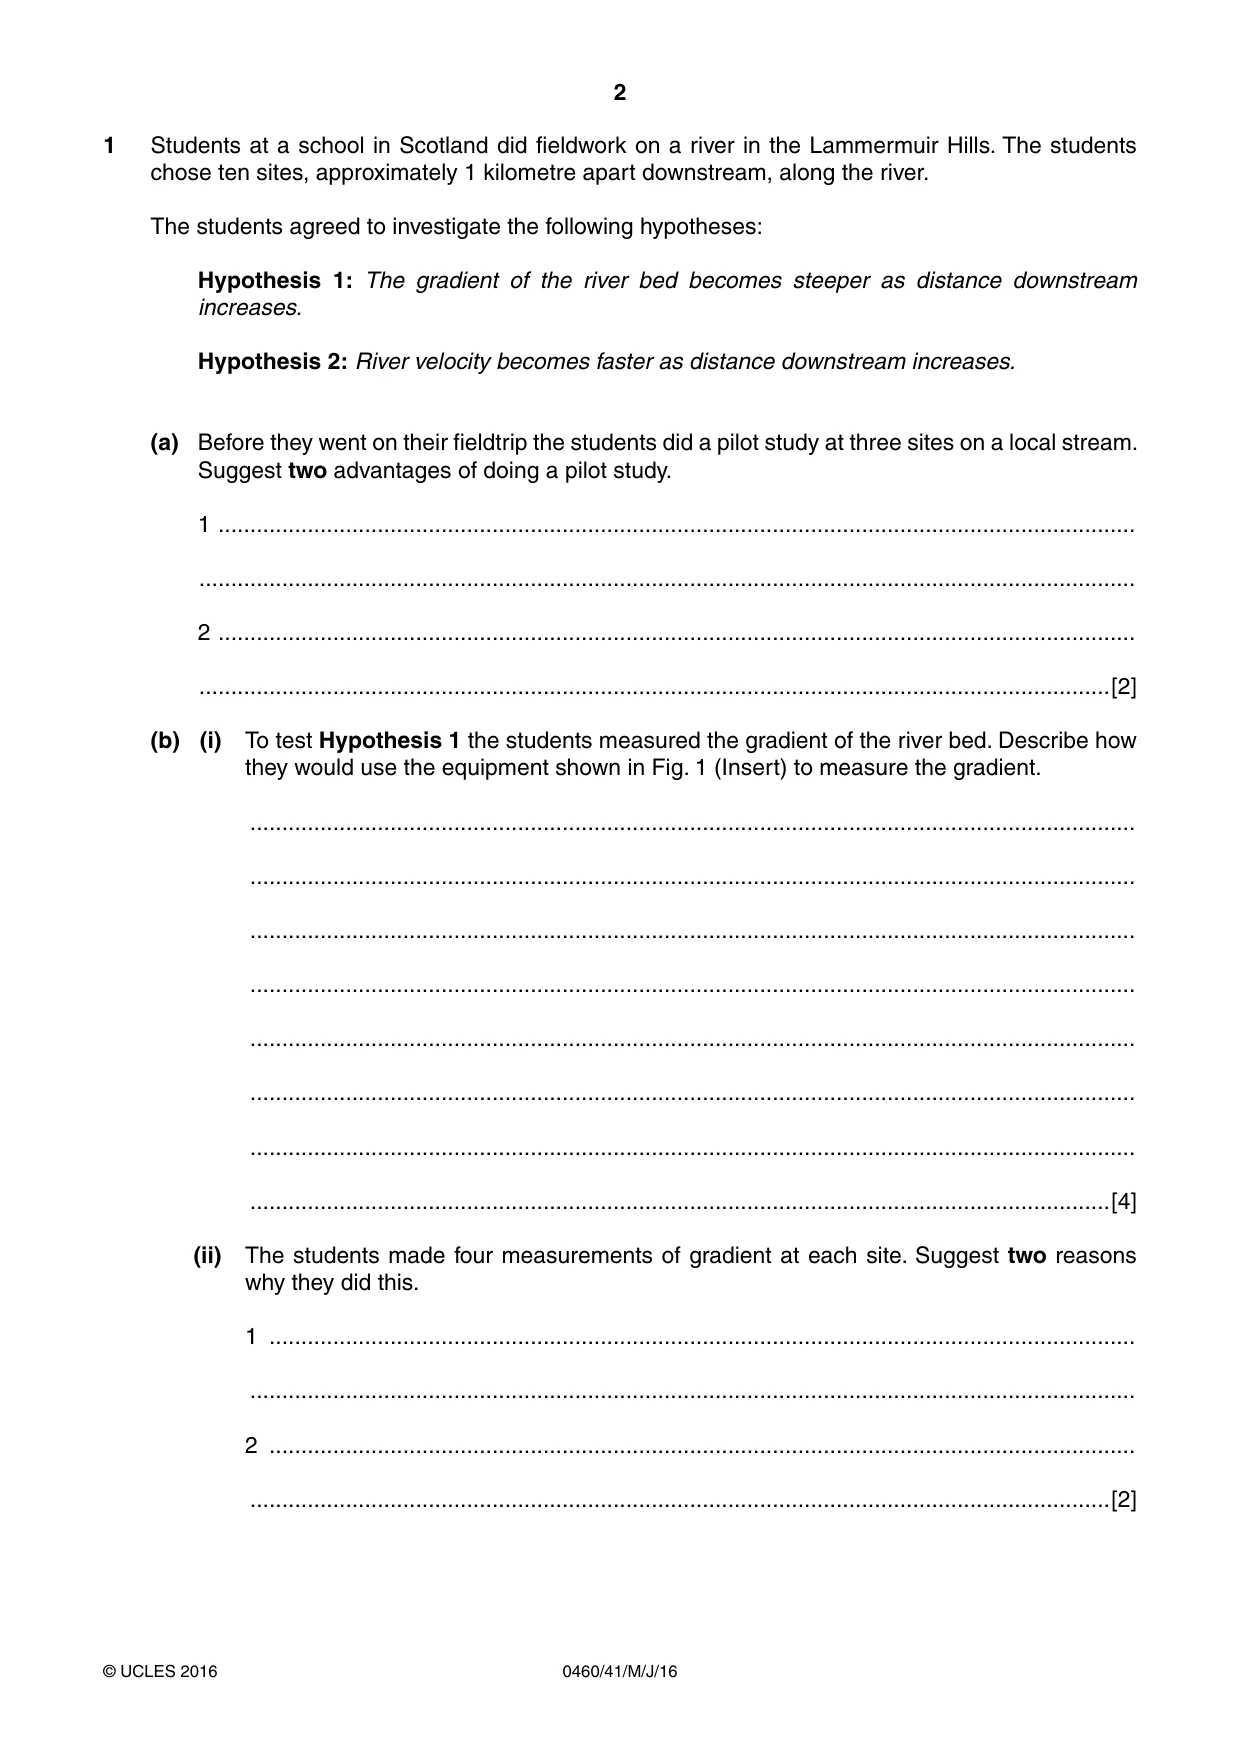
2 0460/41/M/J/16 © UCLES 2016 1 Students at a school in Scotland did fieldwork on a river in the Lammermuir Hills. The students chose ten sites, approximately 1 kilometre apart downstream, along the river. The students agreed to investigate the following hypotheses: Hypothesis 1: The gradient of the river bed becomes steeper as distance downstream increases. Hypothesis 2: River velocity becomes faster as distance downstream increases. (a) Before they went on their fieldtrip the students did a pilot study at three sites on a local stream. Suggest two advantages of doing a pilot study. 1 … … 2 … …[2] (b) (i) To test Hypothesis 1 the students measured the gradient of the river bed. Describe how they would use the equipment shown in Fig. 1 (Insert) to measure the gradient. … … … … … … … …[4] (ii) The students made four measurements of gradient at each site. Suggest two reasons why they did this. 1 … … 2 … …[2]
Question paper, page 3
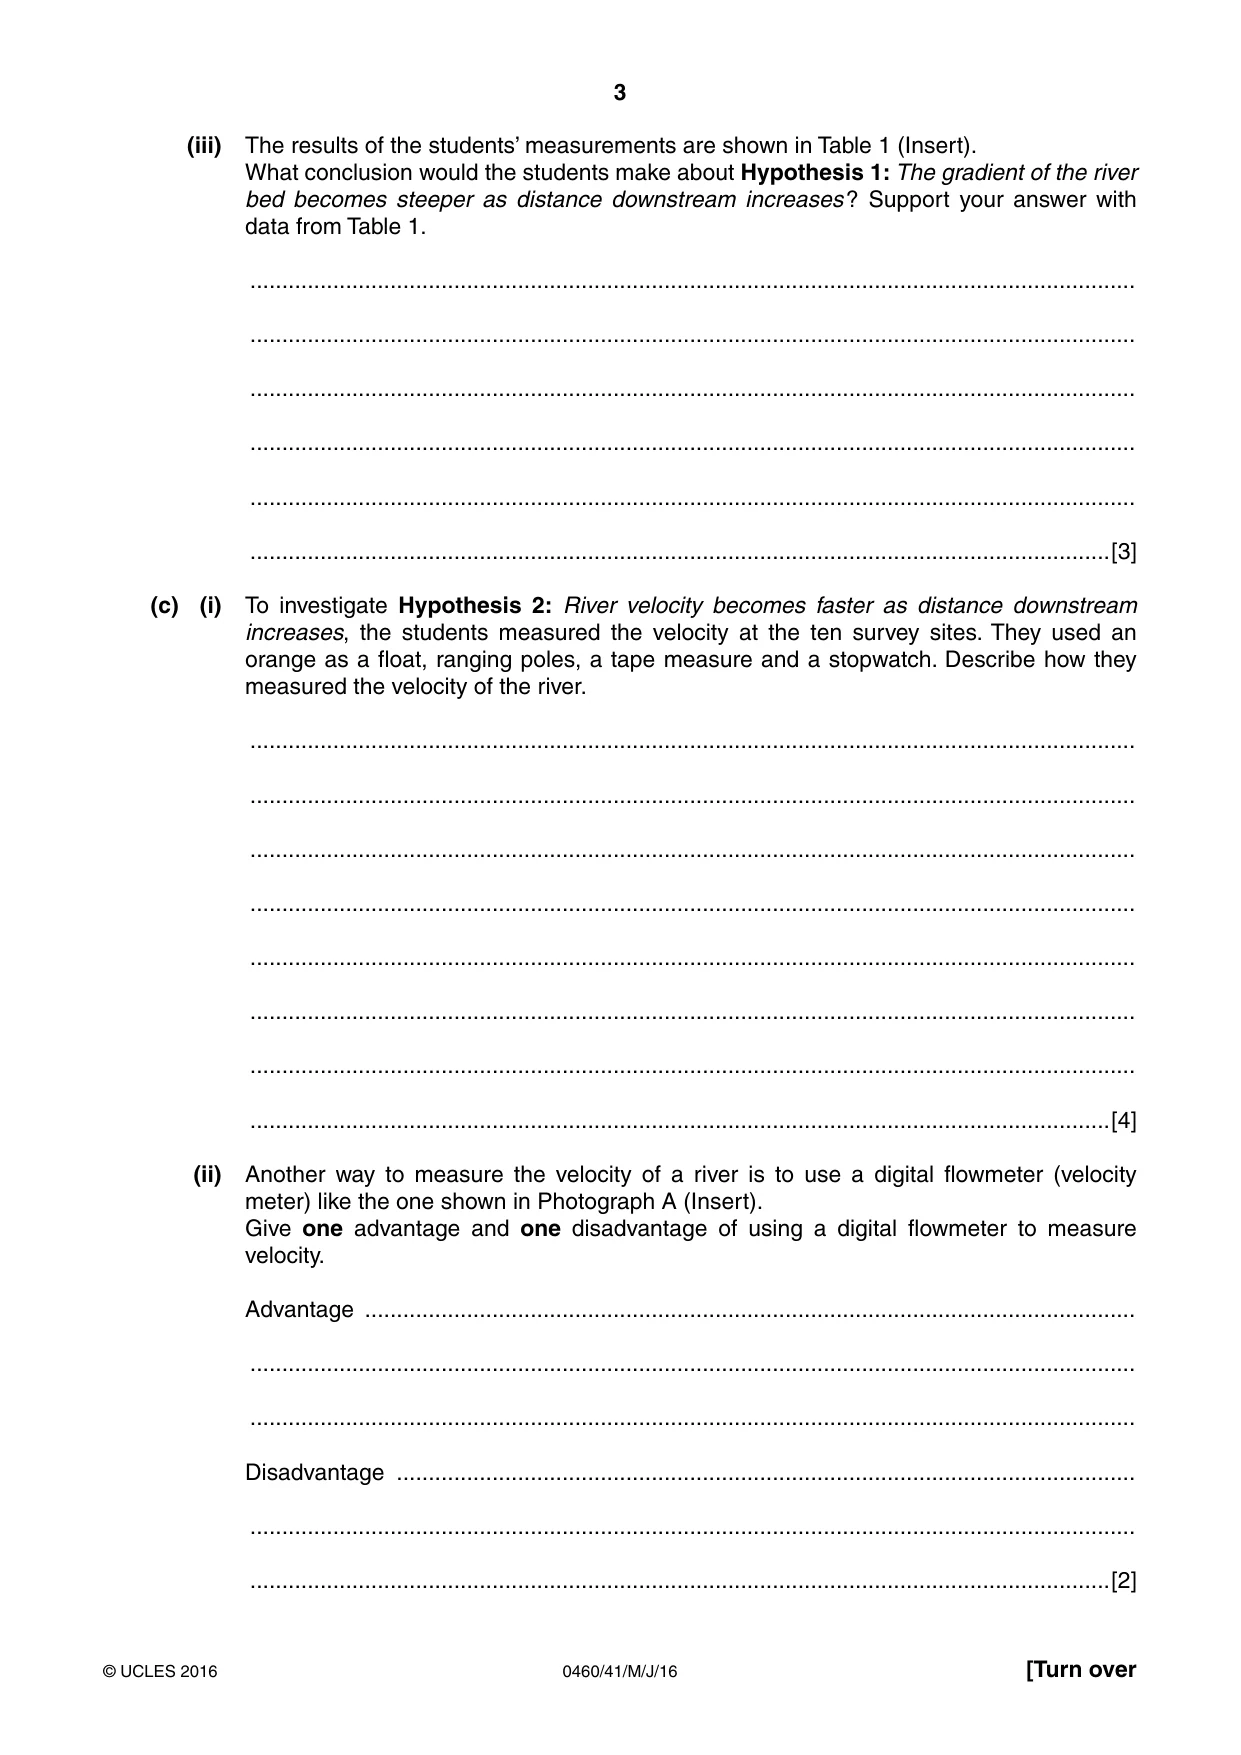
3 0460/41/M/J/16 © UCLES 2016 [Turn over (iii) The results of the students’ measurements are shown in Table 1 (Insert). What conclusion would the students make about Hypothesis 1: The gradient of the river bed becomes steeper as distance downstream increases ? Support your answer with data from Table 1. … … … … … …[3] (c) (i) To investigate Hypothesis 2: River velocity becomes faster as distance downstream increases, the students measured the velocity at the ten survey sites. They used an orange as a float, ranging poles, a tape measure and a stopwatch. Describe how they measured the velocity of the river. … … … … … … … …[4] (ii) Another way to measure the velocity of a river is to use a digital flowmeter (velocity meter) like the one shown in Photograph A (Insert). Give one advantage and one disadvantage of using a digital flowmeter to measure velocity. Advantage … … … Disadvantage … … …[2]
Question paper, page 4
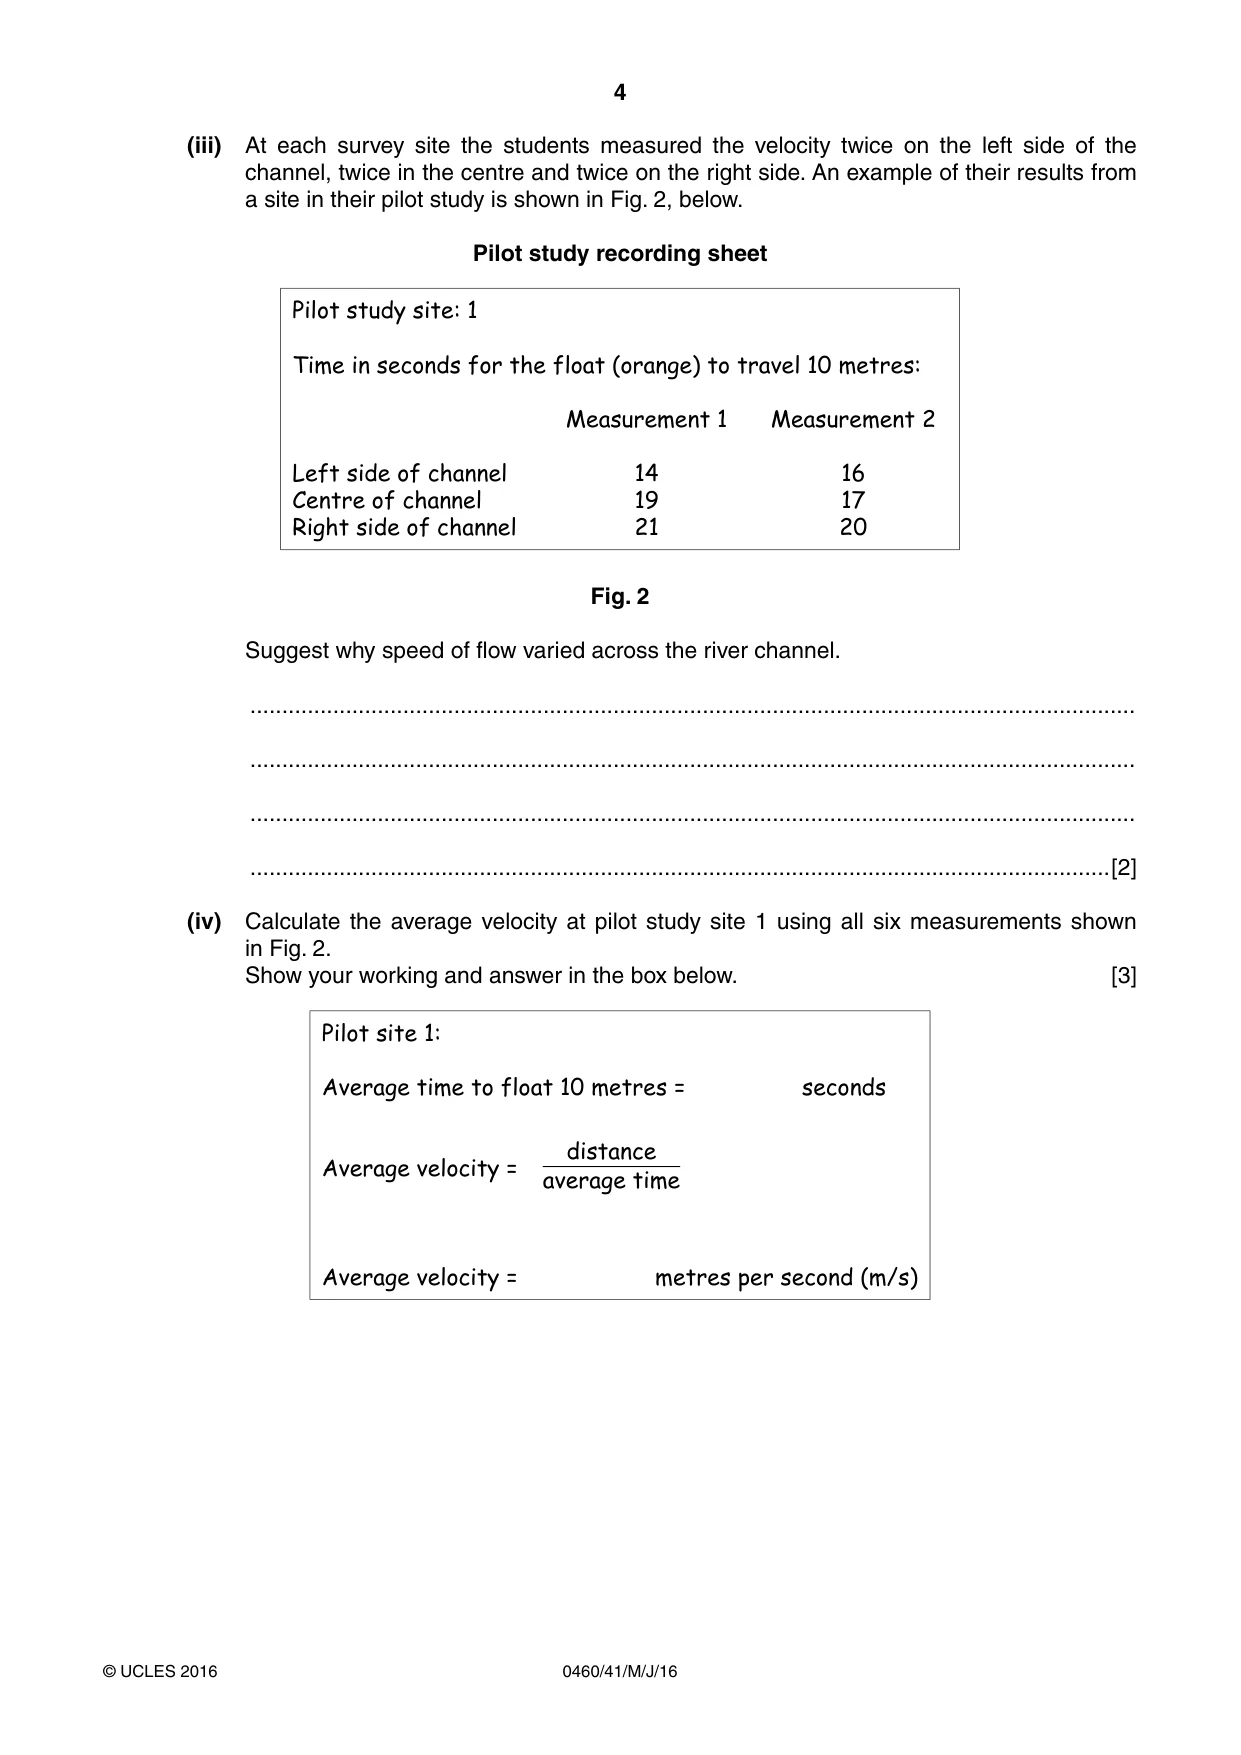
4 0460/41/M/J/16 © UCLES 2016 (iii) At each survey site the students measured the velocity twice on the left side of the channel, twice in the centre and twice on the right side. An example of their results from a site in their pilot study is shown in Fig. 2, below. Pilot study recording sheet Pilot study site: 1 Time in seconds for the float (orange) to travel 10 metres: Measurement 1 Measurement 2 Left side of channel 14 16 Centre of channel 19 17 Right side of channel 21 20 Fig. 2 Suggest why speed of flow varied across the river channel. … … … …[2] (iv) Calculate the average velocity at pilot study site 1 using all six measurements shown in Fig. 2. Show your working and answer in the box below. [3] Pilot site 1: Average time to float 10 metres = seconds Average velocity = distance average time Average velocity = metres per second (m/s)
Question paper, page 5
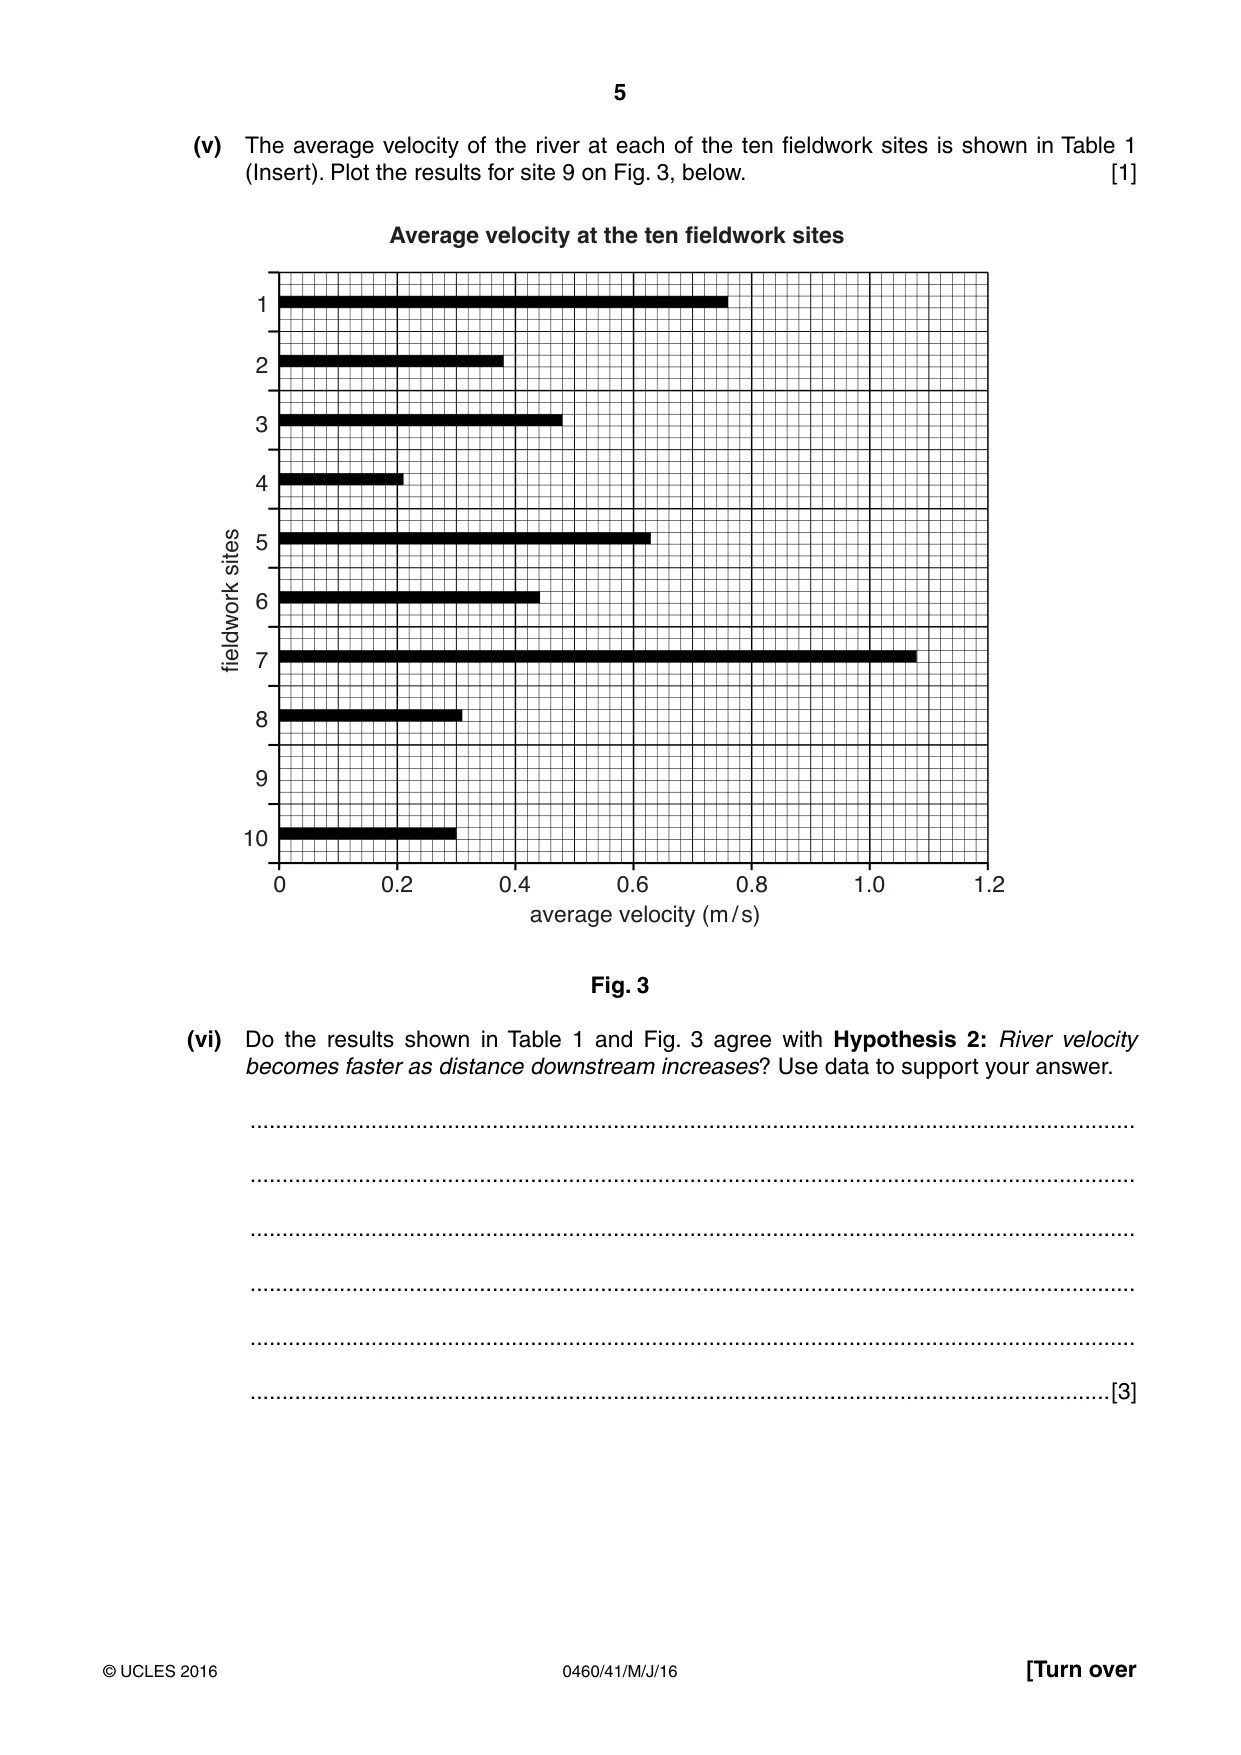
5 0460/41/M/J/16 © UCLES 2016 [Turn over (v) The average velocity of the river at each of the ten fieldwork sites is shown in Table 1 (Insert). Plot the results for site 9 on Fig. 3, below. [1] Average velocity at the ten fieldwork sites fieldwork sites 0 10 0.2 0.4 0.6 average velocity (m / s) 0.8 1.0 1.2 9 8 7 6 5 4 3 2 1 Fig. 3 (vi) Do the results shown in Table 1 and Fig. 3 agree with Hypothesis 2: River velocity becomes faster as distance downstream increases? Use data to support your answer. … … … … … …[3]
Question paper, page 6
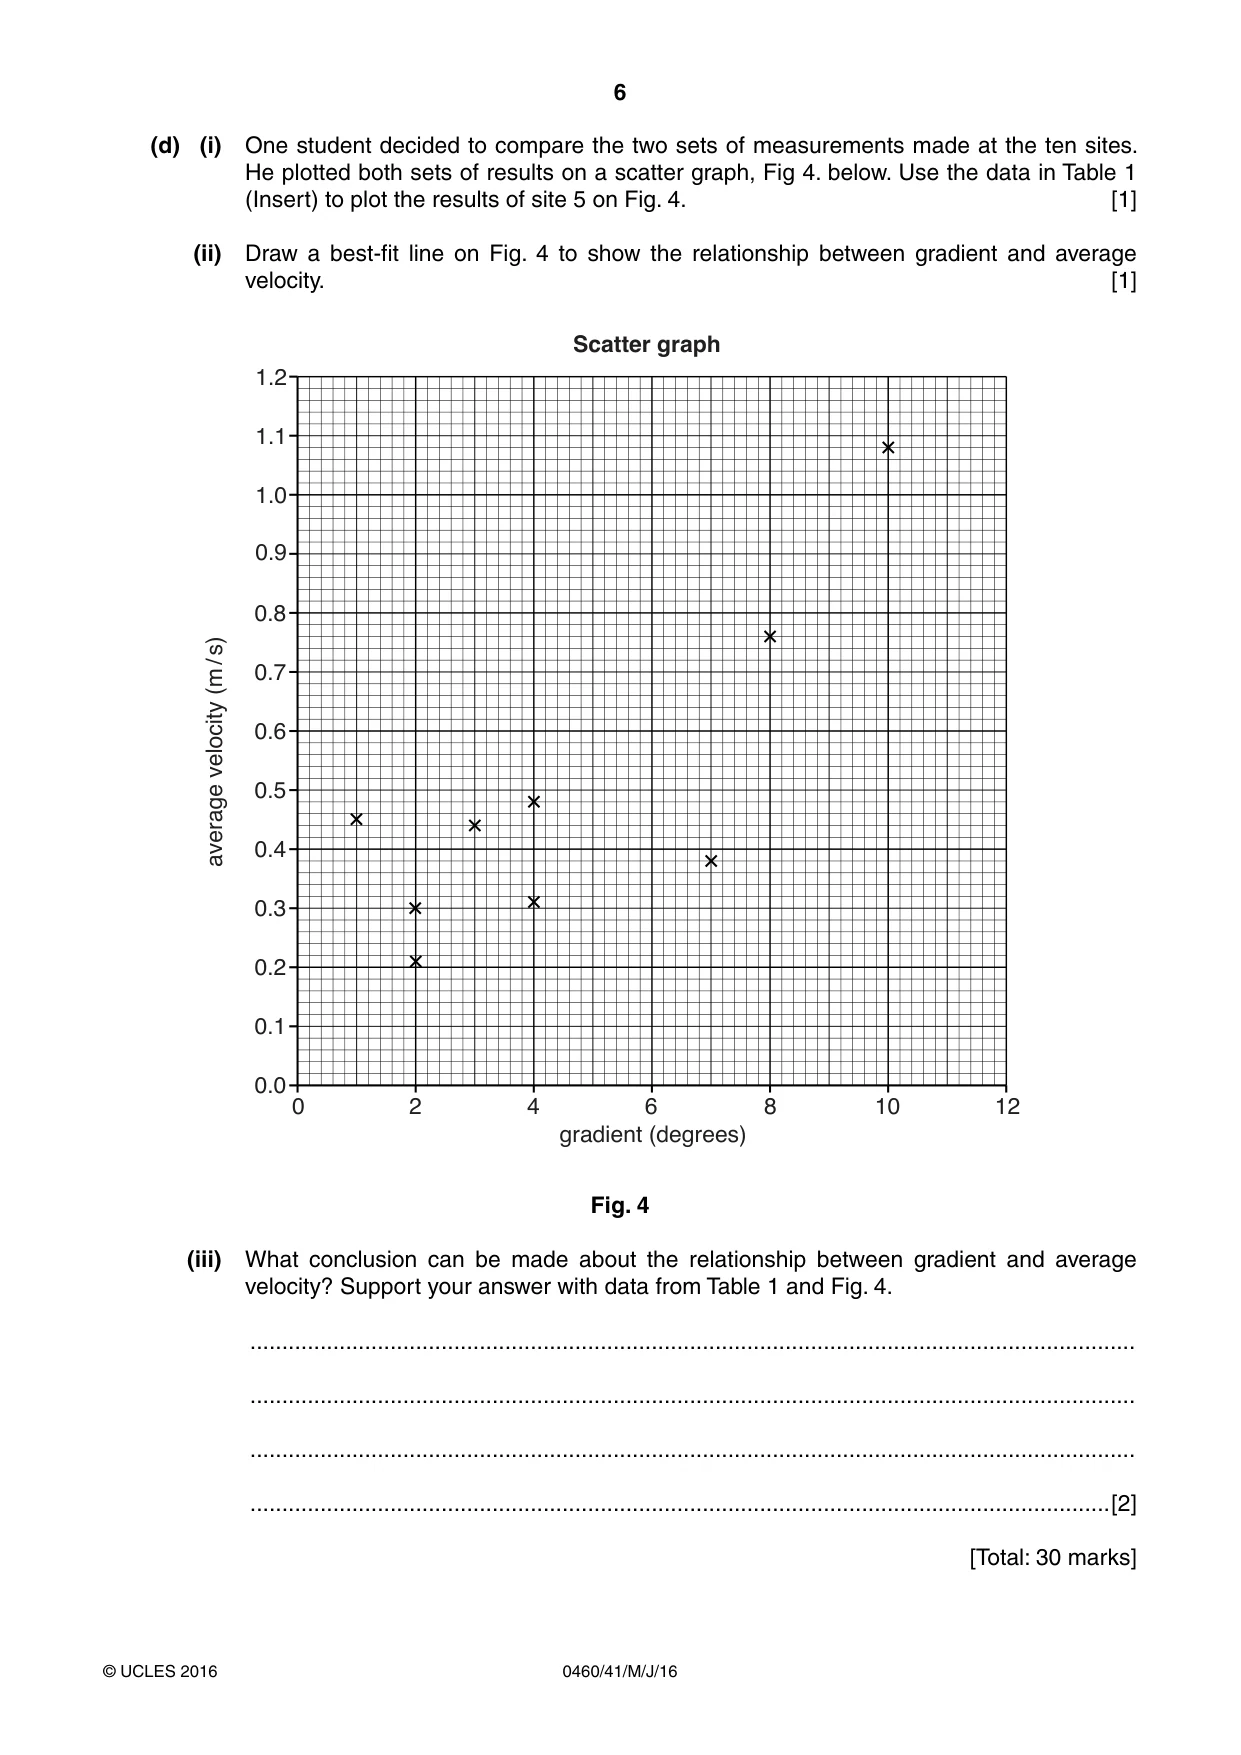
6 0460/41/M/J/16 © UCLES 2016 (d) (i) One student decided to compare the two sets of measurements made at the ten sites. He plotted both sets of results on a scatter graph, Fig 4. below. Use the data in Table 1 (Insert) to plot the results of site 5 on Fig. 4. [1] (ii) Draw a best-fit line on Fig. 4 to show the relationship between gradient and average velocity. [1] average velocity (m / s) gradient (degrees) Scatter graph 0 0.0 2 4 6 8 10 12 0.1 0.2 0.3 0.4 0.5 0.6 0.7 0.8 0.9 1.0 1.1 1.2 Fig. 4 (iii) What conclusion can be made about the relationship between gradient and average velocity? Support your answer with data from Table 1 and Fig. 4. … … … …[2] [Total: 30 marks]
Question paper, page 7
7 0460/41/M/J/16 © UCLES 2016 [Turn over 2 A class of students in Tianjin, China were studying land use in the local area. They identified three main roads which went through their local area towards the city centre on which to do their fieldwork. The three roads shown on Fig. 5 (Insert) are Weijin Nan Lu, Zijinshan Lu and Youyi Lu. On each road the students worked along a section approximately 4 kilometres long. Their aim was to test the following hypotheses: Hypothesis 1: There is the same pattern of land use along all three roads. Hypothesis 2: Most of the residential and business buildings on the three roads are old. (a) In order to test their hypotheses the class of 18 students was divided into six groups of three. Two groups worked separately on each road. (i) Suggest two reasons why their teacher split the class into groups. 1 … … 2 … …[2]
Question paper, page 8
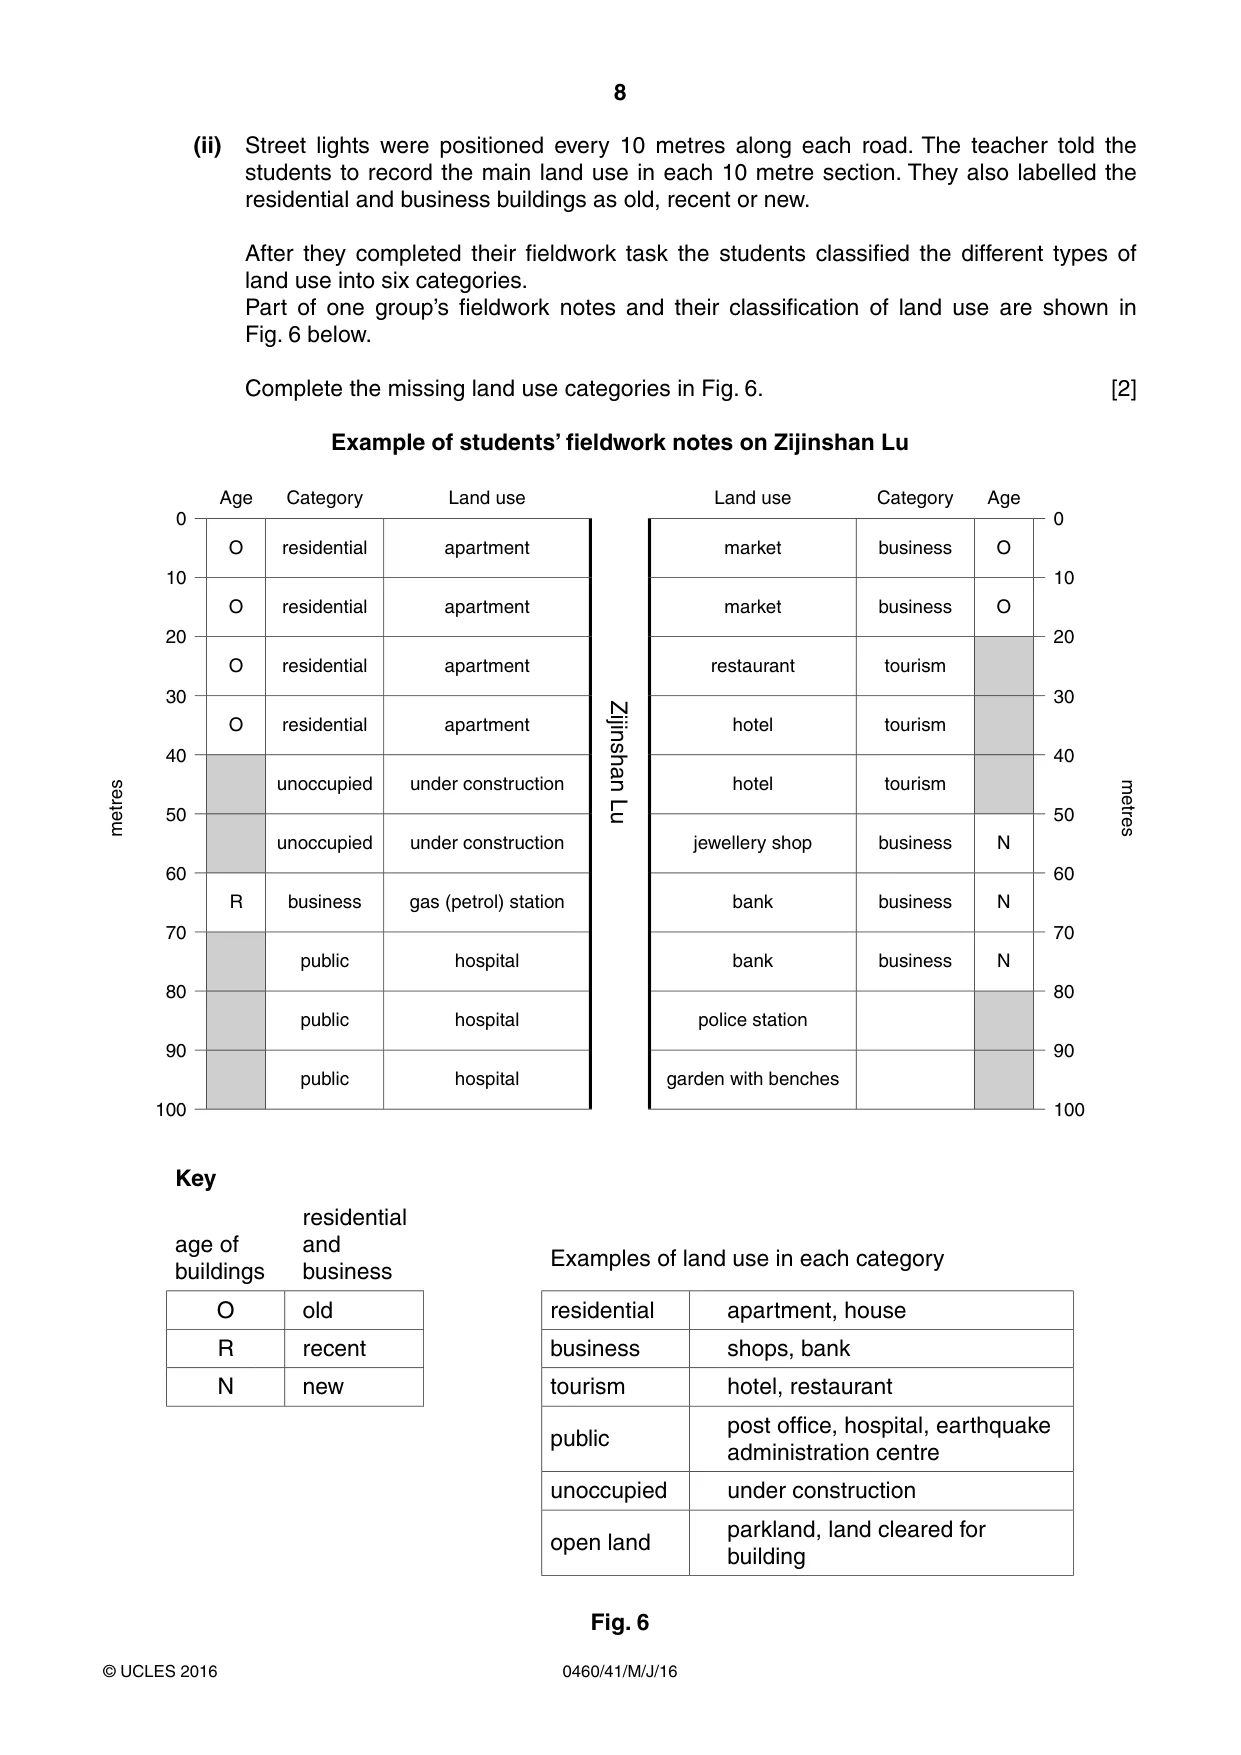
8 0460/41/M/J/16 © UCLES 2016 (ii) Street lights were positioned every 10 metres along each road. The teacher told the students to record the main land use in each 10 metre section. They also labelled the residential and business buildings as old, recent or new. After they completed their fieldwork task the students classified the different types of land use into six categories. Part of one group’s fieldwork notes and their classification of land use are shown in Fig. 6 below. Complete the missing land use categories in Fig. 6. [2] Example of students’ fieldwork notes on Zijinshan Lu metres 0 10 20 30 40 50 60 70 80 90 100 Age Category Land use Zijinshan Lu Land use Category Age 0 10 20 30 40 50 60 70 80 90 100 metres O residential apartment market business O O residential apartment market business O O residential apartment restaurant tourism O residential apartment hotel tourism unoccupied under construction hotel tourism unoccupied under construction jewellery shop business N R business gas (petrol) station bank business N public hospital bank business N public hospital police station public hospital garden with benches Key age of buildings residential and business Examples of land use in each category O old residential apartment, house R recent business shops, bank N new tourism hotel, restaurant public post office, hospital, earthquake administration centre unoccupied under construction open land parkland, land cleared for building Fig. 6
Question paper, page 9
9 0460/41/M/J/16 © UCLES 2016 [Turn over (iii) The results of the land use classification of the two groups working on Zijinshan Lu are shown in Table 2 (Insert). Both groups surveyed all the land use on both sides of the road. Suggest two reasons why their results are different. 1 … … 2 … … [2]
Question paper, page 10
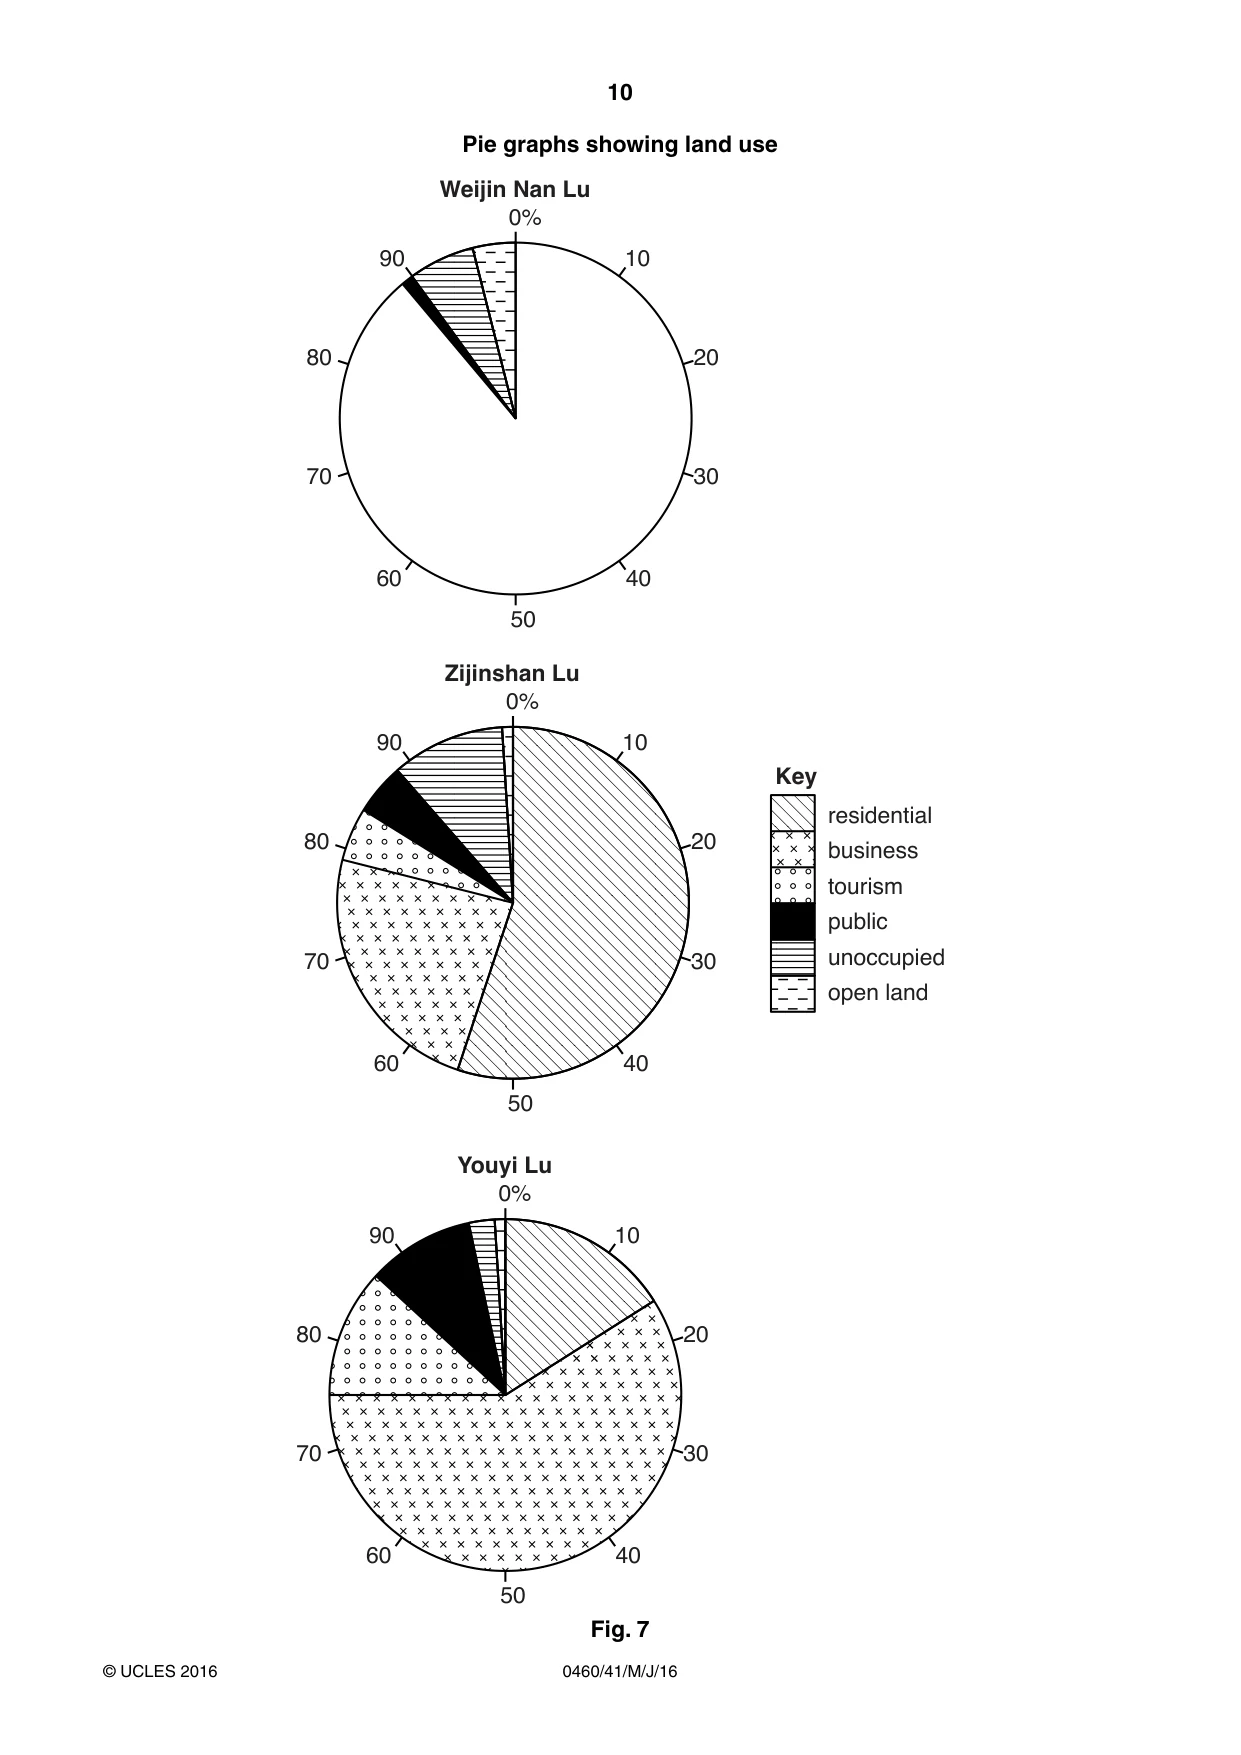
10 0460/41/M/J/16 © UCLES 2016 Pie graphs showing land use 0% 10 20 30 40 90 80 70 60 50 0% 10 20 30 40 90 80 70 60 50 0% Weijin Nan Lu Zijinshan Lu Youyi Lu 10 20 30 40 90 80 70 60 50 residential business tourism public unoccupied open land Key Fig. 7
Question paper, page 11
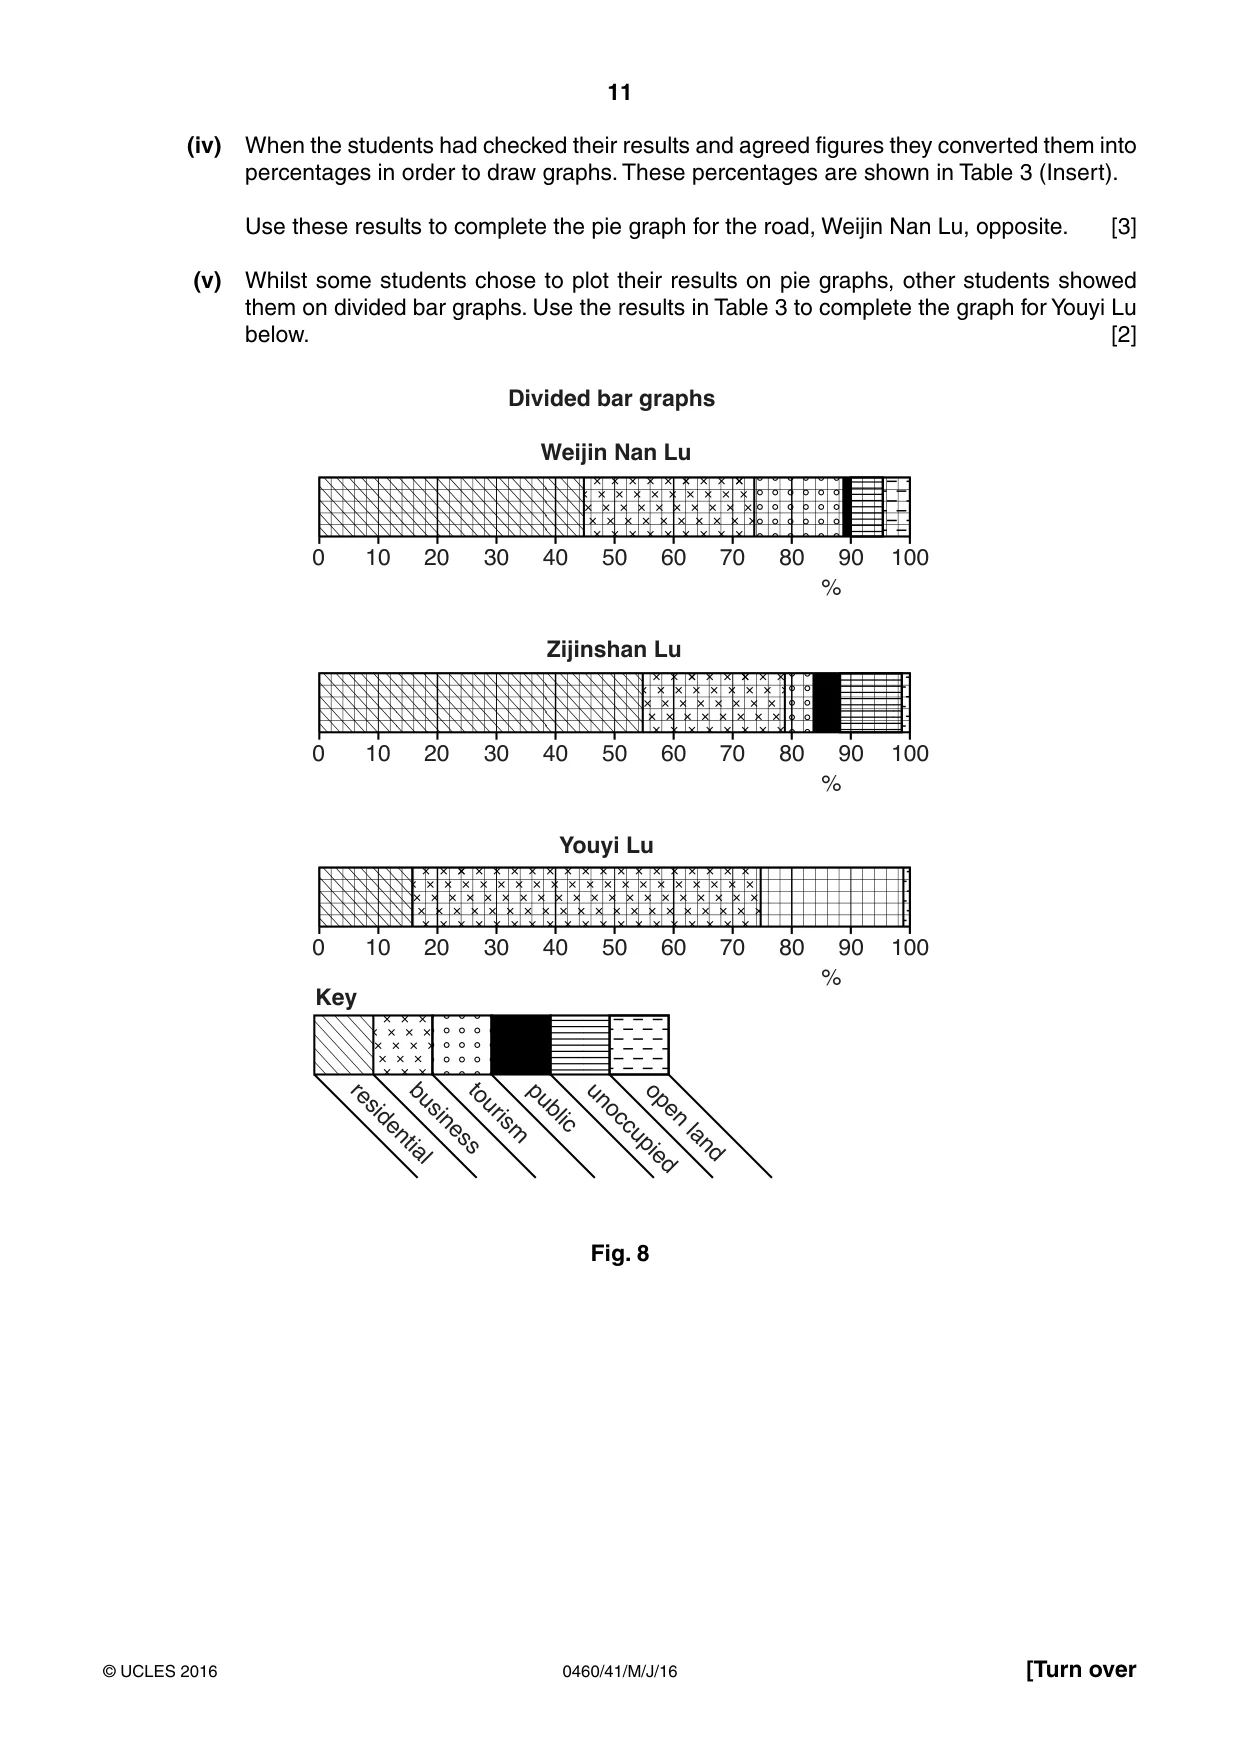
11 0460/41/M/J/16 © UCLES 2016 [Turn over (iv) When the students had checked their results and agreed figures they converted them into percentages in order to draw graphs. These percentages are shown in Table 3 (Insert). Use these results to complete the pie graph for the road, Weijin Nan Lu, opposite. [3] (v) Whilst some students chose to plot their results on pie graphs, other students showed them on divided bar graphs. Use the results in Table 3 to complete the graph for Youyi Lu below. [2] 0 10 20 30 40 50 % 60 70 80 90 100 0 10 20 30 40 50 % 60 70 80 90 100 0 10 20 30 40 50 % 60 70 80 90 100 Weijin Nan Lu Divided bar graphs Zijinshan Lu Youyi Lu Key residential business tourism public unoccupied open land Fig. 8
Question paper, page 12
12 0460/41/M/J/16 © UCLES 2016 (vi) What conclusion would the students make about Hypothesis 1: There is the same pattern of land use along all three roads? Support your answer with evidence from Table 3 and Figs. 7 or 8. … … … … … … … …[4] (b) To investigate Hypothesis 2: Most of the residential and business buildings on the three roads are old, the students looked again at their fieldwork results about the age of residential and business buildings. They had classified the sections as old, recent or new. (i) Suggest why it would be difficult for the groups of students to classify the age of buildings in this way. … … … …[2]
Question paper, page 13
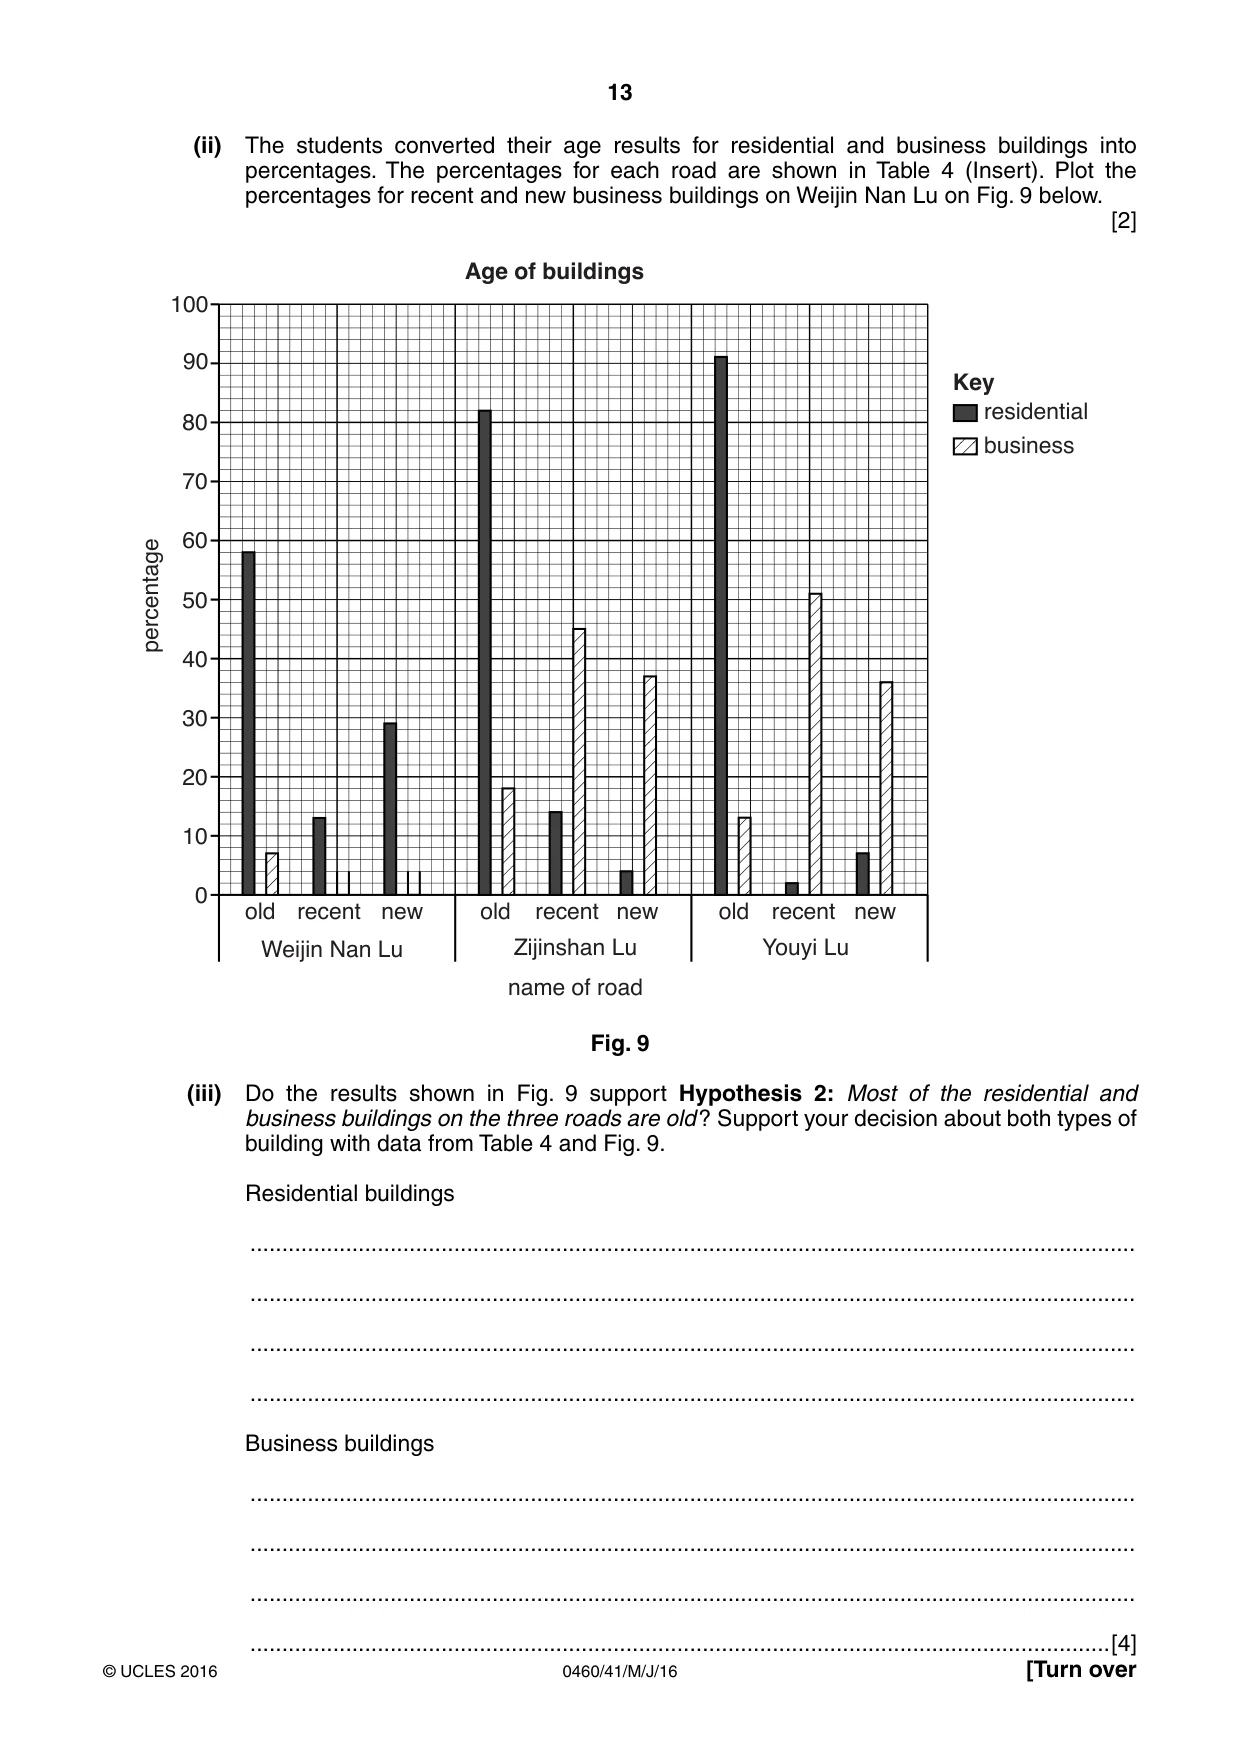
13 0460/41/M/J/16 © UCLES 2016 [Turn over (ii) The students converted their age results for residential and business buildings into percentages. The percentages for each road are shown in Table 4 (Insert). Plot the percentages for recent and new business buildings on Weijin Nan Lu on Fig. 9 below. [2] percentage residential business Key Age of buildings old recent Weijin Nan Lu new old recent Zijinshan Lu name of road new old recent Youyi Lu new 0 10 20 30 40 50 60 70 80 90 100 Fig. 9 (iii) Do the results shown in Fig. 9 support Hypothesis 2: Most of the residential and business buildings on the three roads are old ? Support your decision about both types of building with data from Table 4 and Fig. 9. Residential buildings … … … … Business buildings … … … …[4]
Question paper, page 14
14 0460/41/M/J/16 © UCLES 2016 (c) Whilst they were doing their fieldwork the students found an old map in the school library of the area as it was in 1930. This showed that much of the area in 1930 was countryside. When they compared the old map with their up-to-date map they saw that the area had become more built up. Suggest why this happened. … … … …[2] (d) One group of students decided that they would test a third hypothesis as an extra piece of fieldwork. Their hypothesis was: Business buildings are taller than residential buildings. Describe how the students could test this hypothesis. In your answer refer to how the students would do the following: • collect data; • record data; • display data; • make a conclusion. … … … … … … … … … …[5] [Total: 30 marks]
Question paper, page 15
15 0460/41/M/J/16 © UCLES 2016 Additional Pages If you use the following lined pages to complete the answer(s) to any question(s), the question number(s) must be clearly shown. … … … … … … … … … … … … … … … … … … … … … … … … … …
Question paper, page 16
16 0460/41/M/J/16 © UCLES 2016 … … … … … … … … … … … … … … … … … … … … … … … … Permission to reproduce items where third-party owned material protected by copyright is included has been sought and cleared where possible. Every reasonable effort has been made by the publisher (UCLES) to trace copyright holders, but if any items requiring clearance have unwittingly been included, the publisher will be pleased to make amends at the earliest possible opportunity. To avoid the issue of disclosure of answer-related information to candidates, all copyright acknowledgements are reproduced online in the Cambridge International Examinations Copyright Acknowledgements Booklet. This is produced for each series of examinations and is freely available to download at www.cie.org.uk after the live examination series. Cambridge International Examinations is part of the Cambridge Assessment Group. Cambridge Assessment is the brand name of University of Cambridge Local Examinations Syndicate (UCLES), which is itself a department of the University of Cambridge.
Mark scheme, page 1
® IGCSE is the registered trademark of Cambridge International Examinations. This syllabus is approved for use in England, Wales and Northern Ireland as a Cambridge International Level 1/Level 2 Certificate. This document consists of 5 printed pages. © UCLES 2016 [Turn over Cambridge International Examinations Cambridge International General Certificate of Secondary Education GEOGRAPHY 0460/41 Paper 4 Alternative to Coursework May/June 2016 MARK SCHEME Maximum Mark: 60 Published This mark scheme is published as an aid to teachers and candidates, to indicate the requirements of the examination. It shows the basis on which Examiners were instructed to award marks. It does not indicate the details of the discussions that took place at an Examiners’ meeting before marking began, which would have considered the acceptability of alternative answers. Mark schemes should be read in conjunction with the question paper and the Principal Examiner Report for Teachers. Cambridge will not enter into discussions about these mark schemes. Cambridge is publishing the mark schemes for the May/June 2016 series for most Cambridge IGCSE®, Cambridge International A and AS Level components and some Cambridge O Level components.
Mark scheme, page 2
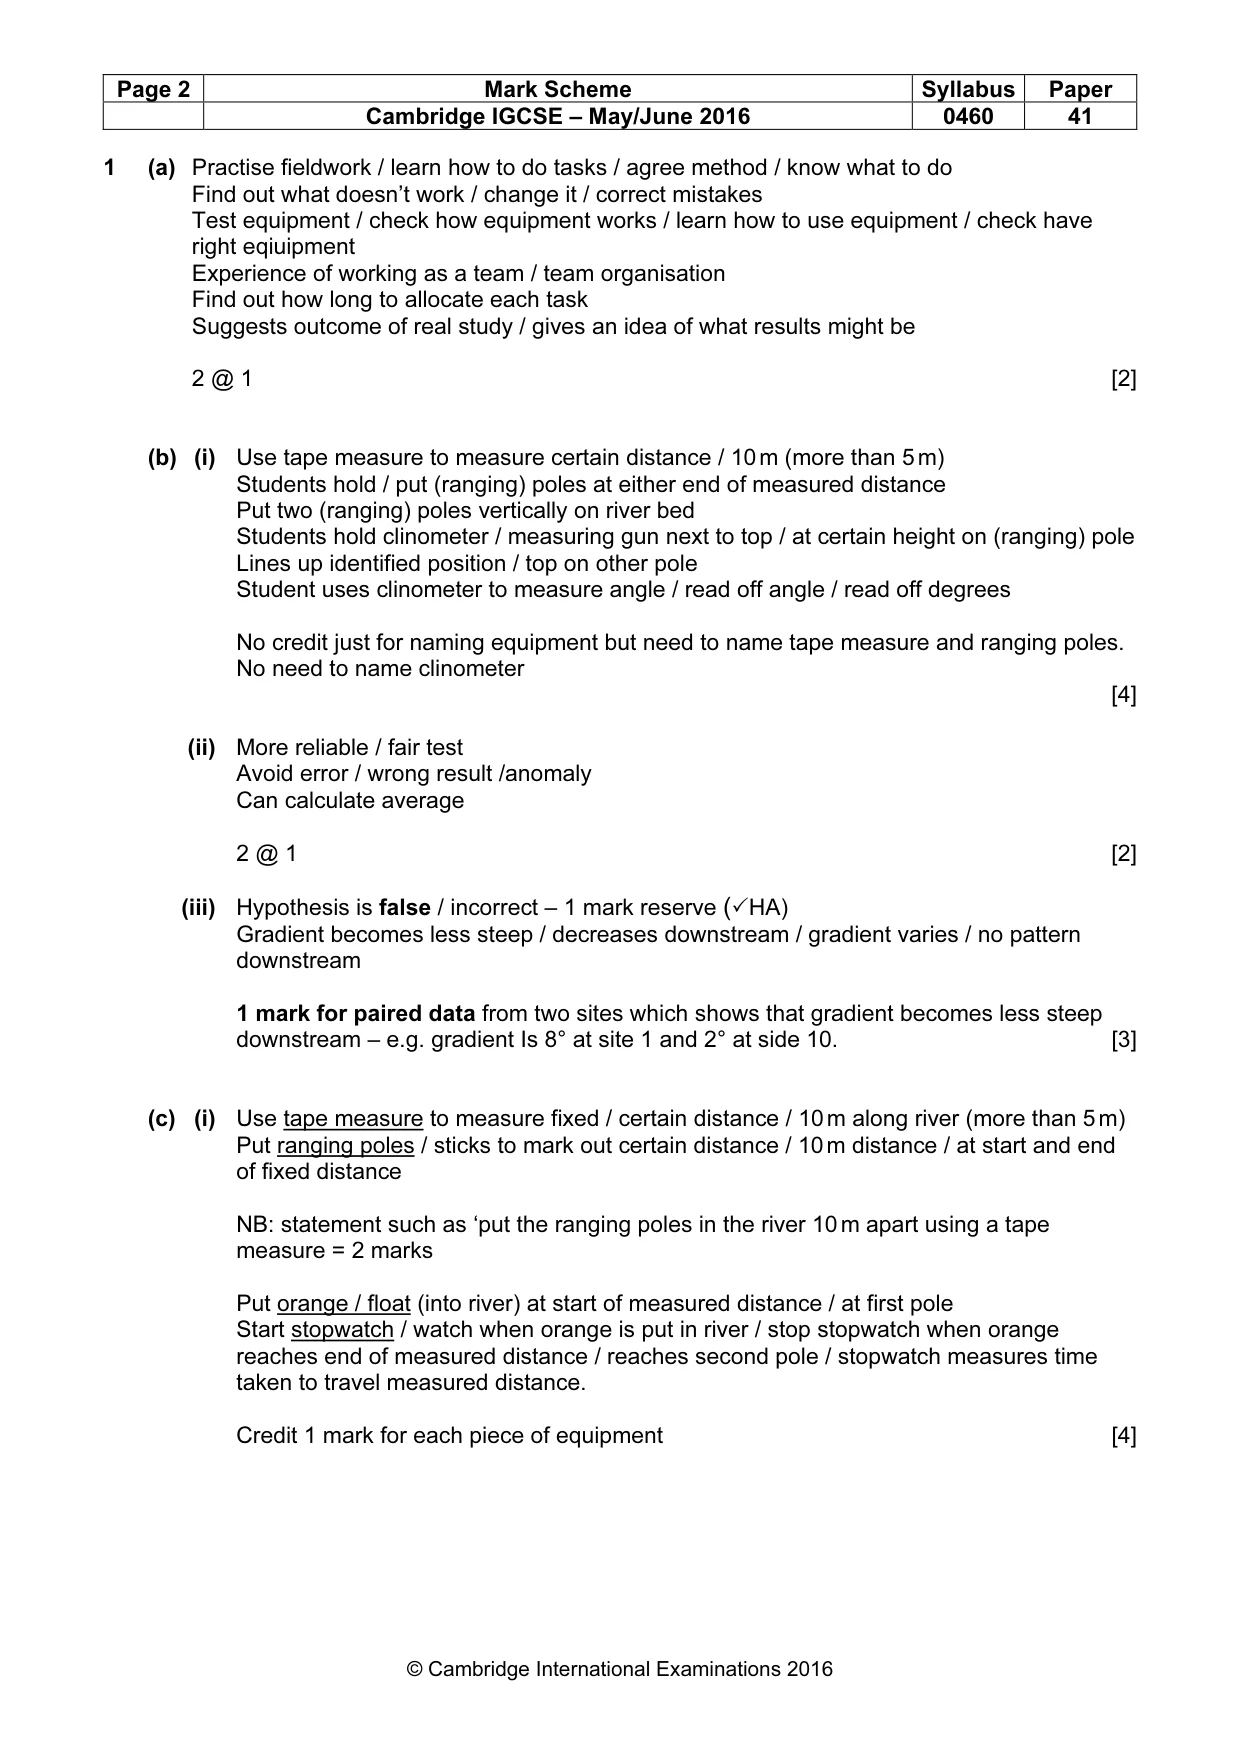
Page 2 Mark Scheme Syllabus Paper Cambridge IGCSE – May/June 2016 0460 41 © Cambridge International Examinations 2016 1 (a) Practise fieldwork / learn how to do tasks / agree method / know what to do Find out what doesn’t work / change it / correct mistakes Test equipment / check how equipment works / learn how to use equipment / check have right eqiuipment Experience of working as a team / team organisation Find out how long to allocate each task Suggests outcome of real study / gives an idea of what results might be 2 @ 1 [2] (b) (i) Use tape measure to measure certain distance / 10 m (more than 5 m) Students hold / put (ranging) poles at either end of measured distance Put two (ranging) poles vertically on river bed Students hold clinometer / measuring gun next to top / at certain height on (ranging) pole Lines up identified position / top on other pole Student uses clinometer to measure angle / read off angle / read off degrees No credit just for naming equipment but need to name tape measure and ranging poles. No need to name clinometer [4] (ii) More reliable / fair test Avoid error / wrong result /anomaly Can calculate average 2 @ 1 [2] (iii) Hypothesis is false / incorrect – 1 mark reserve (✓HA) Gradient becomes less steep / decreases downstream / gradient varies / no pattern downstream 1 mark for paired data from two sites which shows that gradient becomes less steep downstream – e.g. gradient Is 8° at site 1 and 2° at side 10. [3] (c) (i) Use tape measure to measure fixed / certain distance / 10 m along river (more than 5 m) Put ranging poles / sticks to mark out certain distance / 10 m distance / at start and end of fixed distance NB: statement such as ‘put the ranging poles in the river 10 m apart using a tape measure = 2 marks Put orange / float (into river) at start of measured distance / at first pole Start stopwatch / watch when orange is put in river / stop stopwatch when orange reaches end of measured distance / reaches second pole / stopwatch measures time taken to travel measured distance. Credit 1 mark for each piece of equipment [4]
Mark scheme, page 3
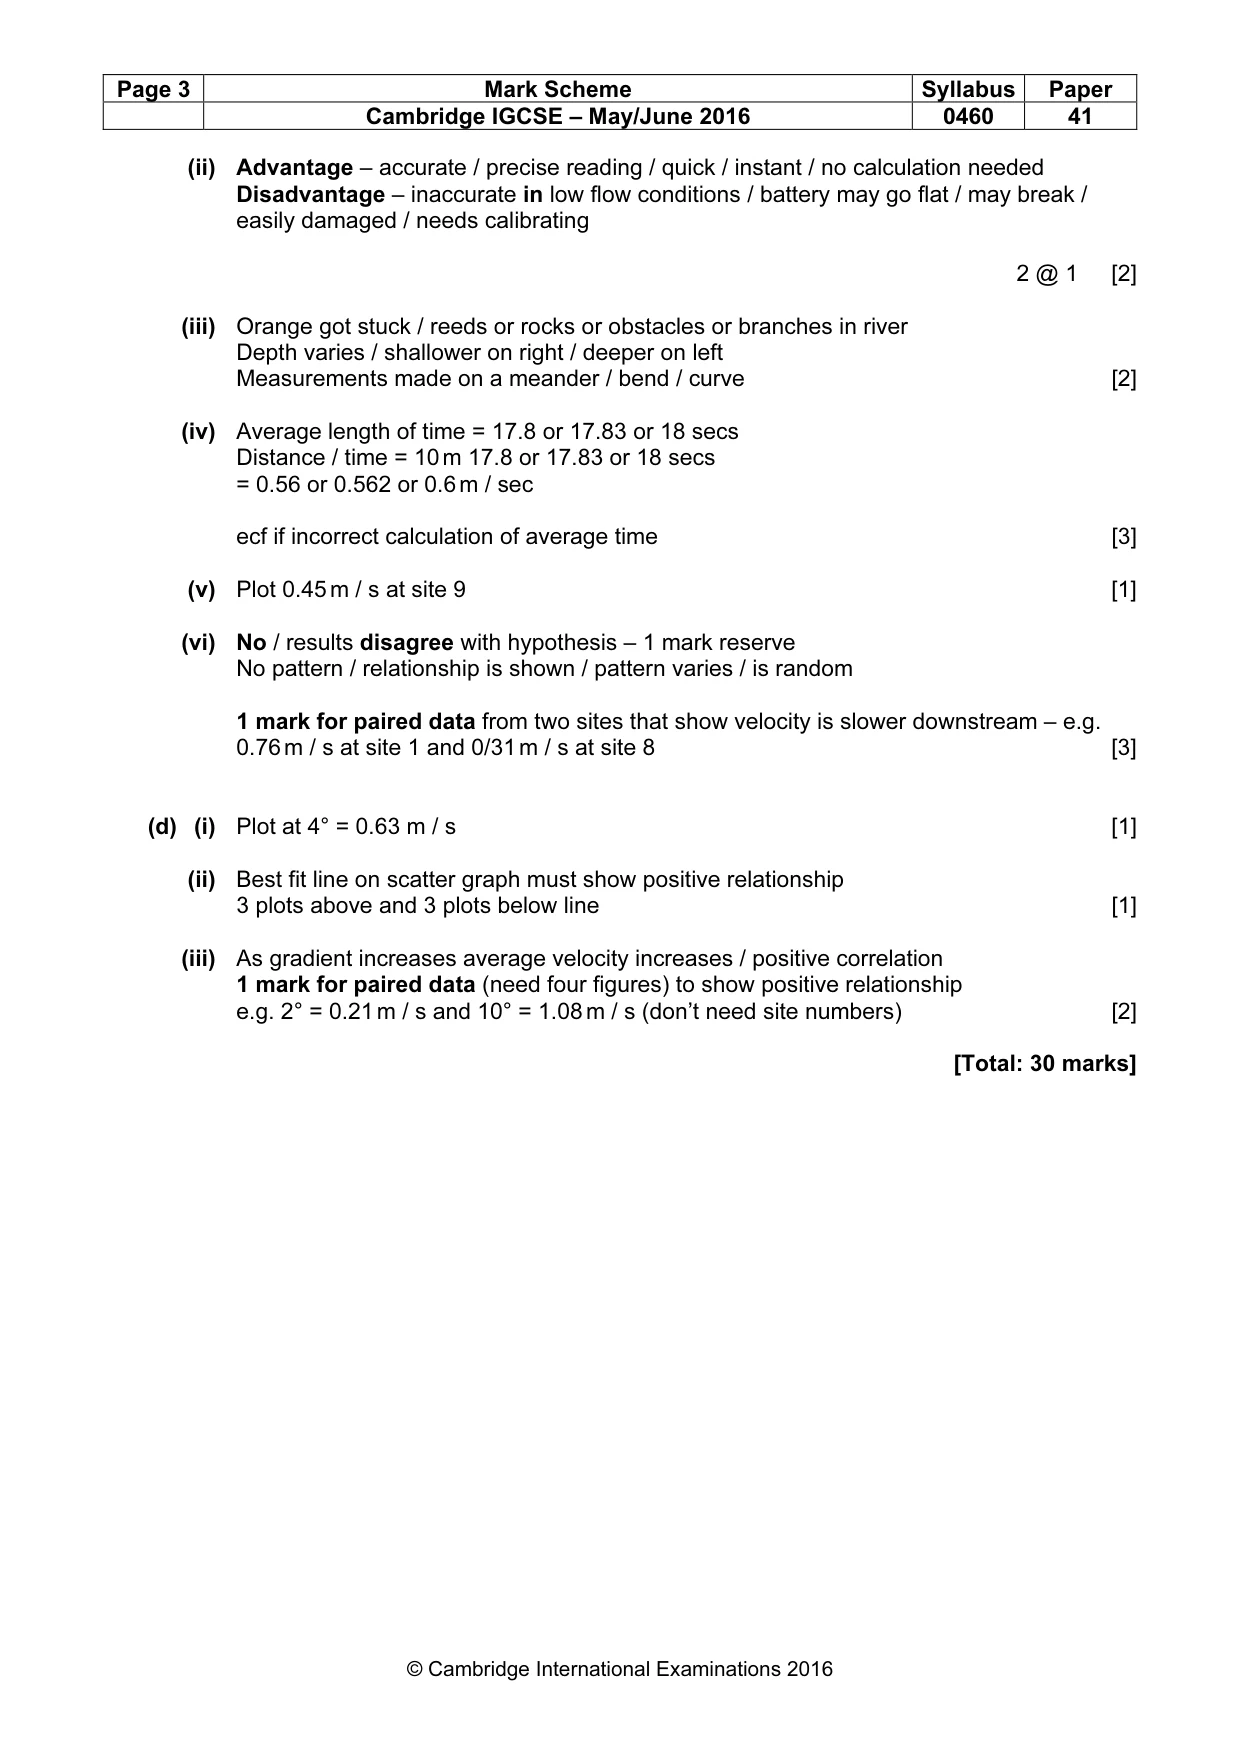
Page 3 Mark Scheme Syllabus Paper Cambridge IGCSE – May/June 2016 0460 41 © Cambridge International Examinations 2016 (ii) Advantage – accurate / precise reading / quick / instant / no calculation needed Disadvantage – inaccurate in low flow conditions / battery may go flat / may break / easily damaged / needs calibrating 2 @ 1 [2] (iii) Orange got stuck / reeds or rocks or obstacles or branches in river Depth varies / shallower on right / deeper on left Measurements made on a meander / bend / curve [2] (iv) Average length of time = 17.8 or 17.83 or 18 secs Distance / time = 10 m 17.8 or 17.83 or 18 secs = 0.56 or 0.562 or 0.6 m / sec ecf if incorrect calculation of average time [3] (v) Plot 0.45 m / s at site 9 [1] (vi) No / results disagree with hypothesis – 1 mark reserve No pattern / relationship is shown / pattern varies / is random 1 mark for paired data from two sites that show velocity is slower downstream – e.g. 0.76 m / s at site 1 and 0/31 m / s at site 8 [3] (d) (i) Plot at 4° = 0.63 m / s [1] (ii) Best fit line on scatter graph must show positive relationship 3 plots above and 3 plots below line [1] (iii) As gradient increases average velocity increases / positive correlation 1 mark for paired data (need four figures) to show positive relationship e.g. 2° = 0.21 m / s and 10° = 1.08 m / s (don’t need site numbers) [2] [Total: 30 marks]
Mark scheme, page 4
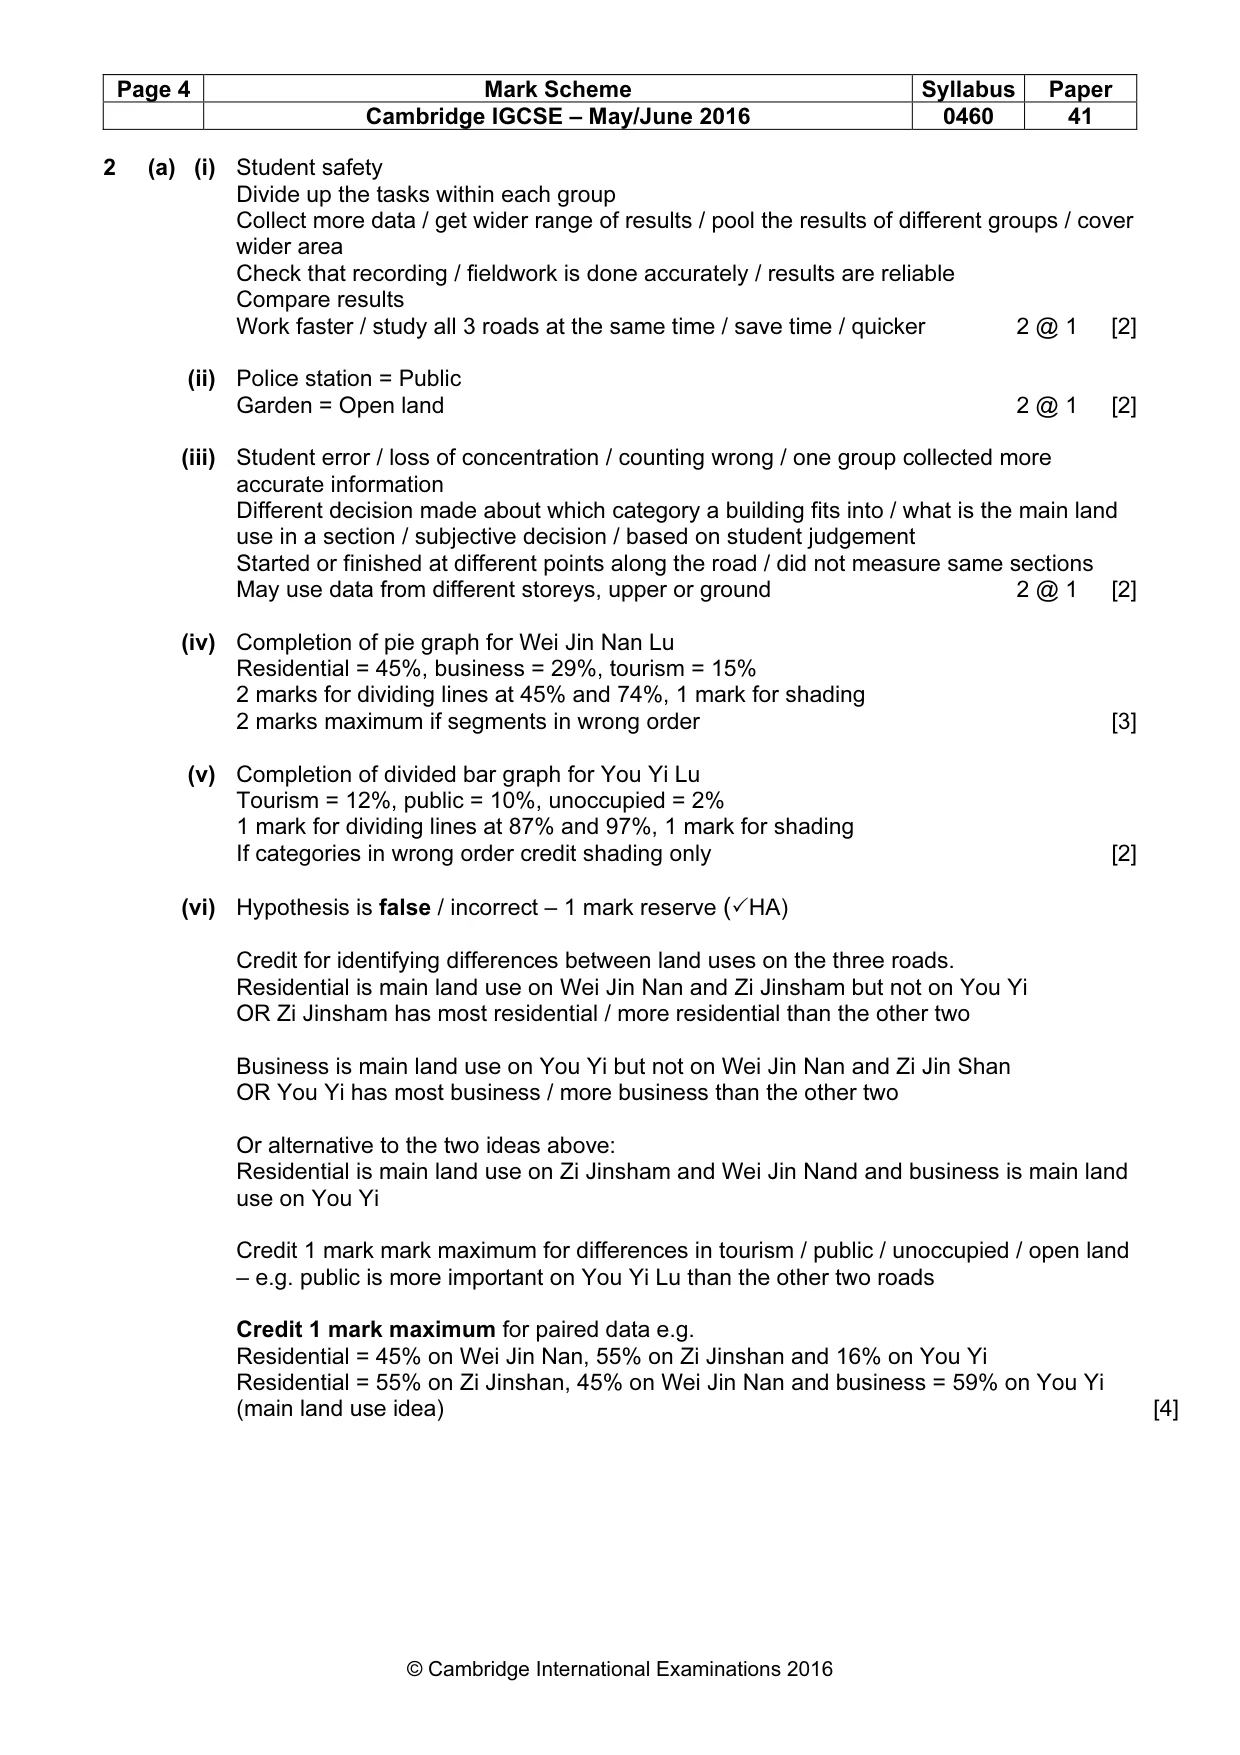
Page 4 Mark Scheme Syllabus Paper Cambridge IGCSE – May/June 2016 0460 41 © Cambridge International Examinations 2016 2 (a) (i) Student safety Divide up the tasks within each group Collect more data / get wider range of results / pool the results of different groups / cover wider area Check that recording / fieldwork is done accurately / results are reliable Compare results Work faster / study all 3 roads at the same time / save time / quicker 2 @ 1 [2] (ii) Police station = Public Garden = Open land 2 @ 1 [2] (iii) Student error / loss of concentration / counting wrong / one group collected more accurate information Different decision made about which category a building fits into / what is the main land use in a section / subjective decision / based on student judgement Started or finished at different points along the road / did not measure same sections May use data from different storeys, upper or ground 2 @ 1 [2] (iv) Completion of pie graph for Wei Jin Nan Lu Residential = 45%, business = 29%, tourism = 15% 2 marks for dividing lines at 45% and 74%, 1 mark for shading 2 marks maximum if segments in wrong order [3] (v) Completion of divided bar graph for You Yi Lu Tourism = 12%, public = 10%, unoccupied = 2% 1 mark for dividing lines at 87% and 97%, 1 mark for shading If categories in wrong order credit shading only [2] (vi) Hypothesis is false / incorrect – 1 mark reserve (✓HA) Credit for identifying differences between land uses on the three roads. Residential is main land use on Wei Jin Nan and Zi Jinsham but not on You Yi OR Zi Jinsham has most residential / more residential than the other two Business is main land use on You Yi but not on Wei Jin Nan and Zi Jin Shan OR You Yi has most business / more business than the other two Or alternative to the two ideas above: Residential is main land use on Zi Jinsham and Wei Jin Nand and business is main land use on You Yi Credit 1 mark mark maximum for differences in tourism / public / unoccupied / open land – e.g. public is more important on You Yi Lu than the other two roads Credit 1 mark maximum for paired data e.g. Residential = 45% on Wei Jin Nan, 55% on Zi Jinshan and 16% on You Yi Residential = 55% on Zi Jinshan, 45% on Wei Jin Nan and business = 59% on You Yi (main land use idea) [4]
Mark scheme, page 5
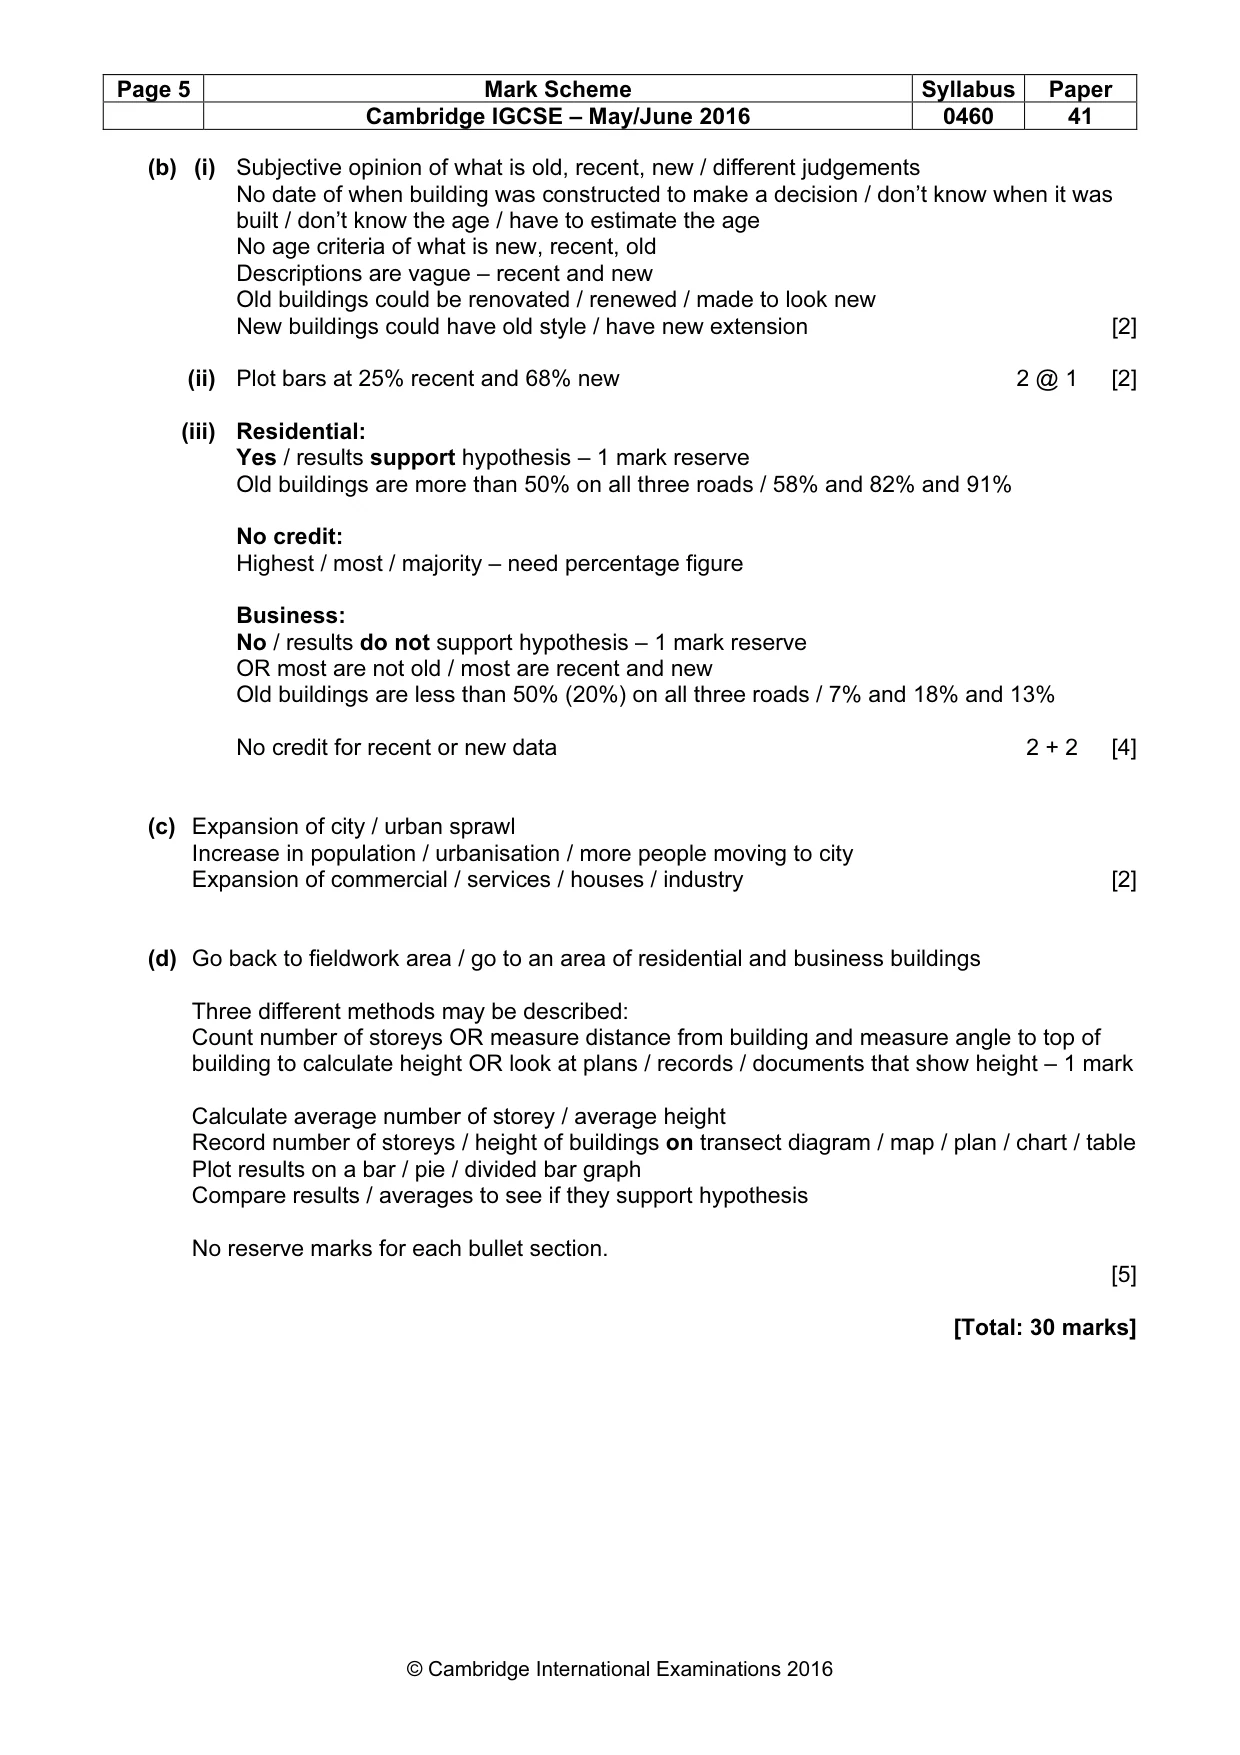
Page 5 Mark Scheme Syllabus Paper Cambridge IGCSE – May/June 2016 0460 41 © Cambridge International Examinations 2016 (b) (i) Subjective opinion of what is old, recent, new / different judgements No date of when building was constructed to make a decision / don’t know when it was built / don’t know the age / have to estimate the age No age criteria of what is new, recent, old Descriptions are vague – recent and new Old buildings could be renovated / renewed / made to look new New buildings could have old style / have new extension [2] (ii) Plot bars at 25% recent and 68% new 2 @ 1 [2] (iii) Residential: Yes / results support hypothesis – 1 mark reserve Old buildings are more than 50% on all three roads / 58% and 82% and 91% No credit: Highest / most / majority – need percentage figure Business: No / results do not support hypothesis – 1 mark reserve OR most are not old / most are recent and new Old buildings are less than 50% (20%) on all three roads / 7% and 18% and 13% No credit for recent or new data 2 + 2 [4] (c) Expansion of city / urban sprawl Increase in population / urbanisation / more people moving to city Expansion of commercial / services / houses / industry [2] (d) Go back to fieldwork area / go to an area of residential and business buildings Three different methods may be described: Count number of storeys OR measure distance from building and measure angle to top of building to calculate height OR look at plans / records / documents that show height – 1 mark Calculate average number of storey / average height Record number of storeys / height of buildings on transect diagram / map / plan / chart / table Plot results on a bar / pie / divided bar graph Compare results / averages to see if they support hypothesis No reserve marks for each bullet section. [5] [Total: 30 marks]
What you needed in this session
Cambridge’s own grade thresholds for 2016 May/June, Paper 4 · Variant 1. A higher threshold means an easier paper — the bar moves with how the cohort did.