Cambridge IGCSE Geography 0460 — 2016 May/June Paper 4 · Variant 2
0460/42/M/J/16 · 60 marks · ≈68 min
The question paper and its mark scheme, free to read here and free to download. This is Cambridge’s own paper, exactly as it was sat.
Question paper20 pages


Mark scheme6 pages
Answers below. Sit the paper first if you are practising.
Paper as text
Question paper, page 1
This document consists of 19 printed pages, 1 blank page and 1 Insert. DC (NH/SG) 114172/5 © UCLES 2016 [Turn over * 6 6 0 5 3 1 2 6 3 7 * GEOGRAPHY 0460/42 Paper 4 Alternative to Coursework May/June 2016 1 hour 30 minutes Candidates answer on the Question Paper. Additional Materials: Ruler Calculator Protractor READ THESE INSTRUCTIONS FIRST Write your Centre number, candidate number and name in the spaces provided. Write in dark blue or black pen. You may use an HB pencil for any diagrams or graphs. Do not use staples, paper clips, glue or correction fluid. DO NOT WRITE IN ANY BARCODES. Write your answer to each question in the space provided. If additional space is required, you should use the lined pages at the end of this booklet. The question number(s) must be clearly shown. Answer all questions. The Insert contains Tables 1 and 2 and Fig. 3 for Question 1, and Fig. 8 and Table 7 for Question 2. The Insert is not required by the Examiner. Sketch maps and diagrams should be drawn whenever they serve to illustrate an answer. At the end of the examination, fasten all your work securely together. The number of marks is given in brackets [ ] at the end of each question or part question. The syllabus is approved for use in England, Wales and Northern Ireland as a Cambridge International Level 1/Level 2 Certificate. Cambridge International Examinations Cambridge International General Certificate of Secondary Education
Question paper, page 2
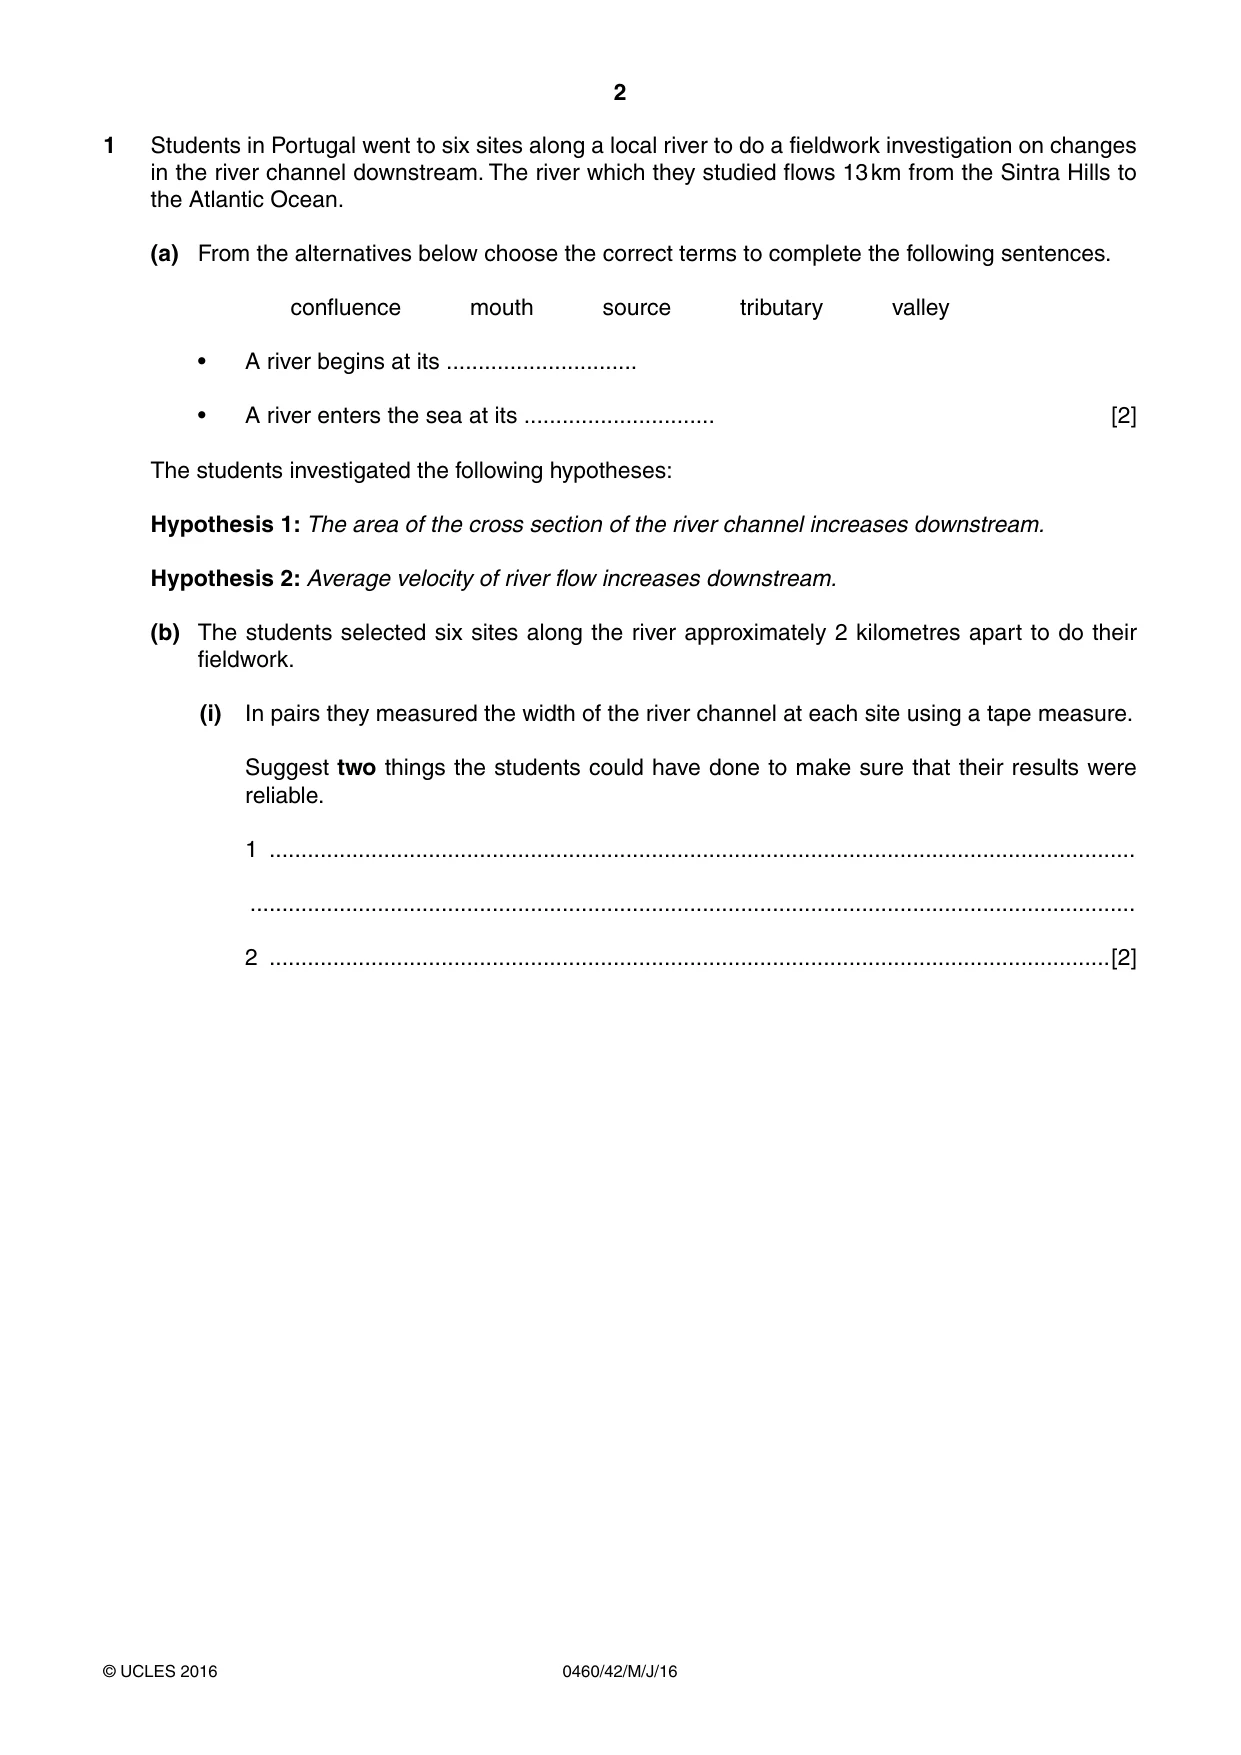
2 0460/42/M/J/16 © UCLES 2016 1 Students in Portugal went to six sites along a local river to do a fieldwork investigation on changes in the river channel downstream. The river which they studied flows 13 km from the Sintra Hills to the Atlantic Ocean. (a) From the alternatives below choose the correct terms to complete the following sentences. confluence mouth source tributary valley • A river begins at its … • A river enters the sea at its … [2] The students investigated the following hypotheses: Hypothesis 1: The area of the cross section of the river channel increases downstream. Hypothesis 2: Average velocity of river flow increases downstream. (b) The students selected six sites along the river approximately 2 kilometres apart to do their fieldwork. (i) In pairs they measured the width of the river channel at each site using a tape measure. Suggest two things the students could have done to make sure that their results were reliable. 1 … … 2 …[2]
Question paper, page 3
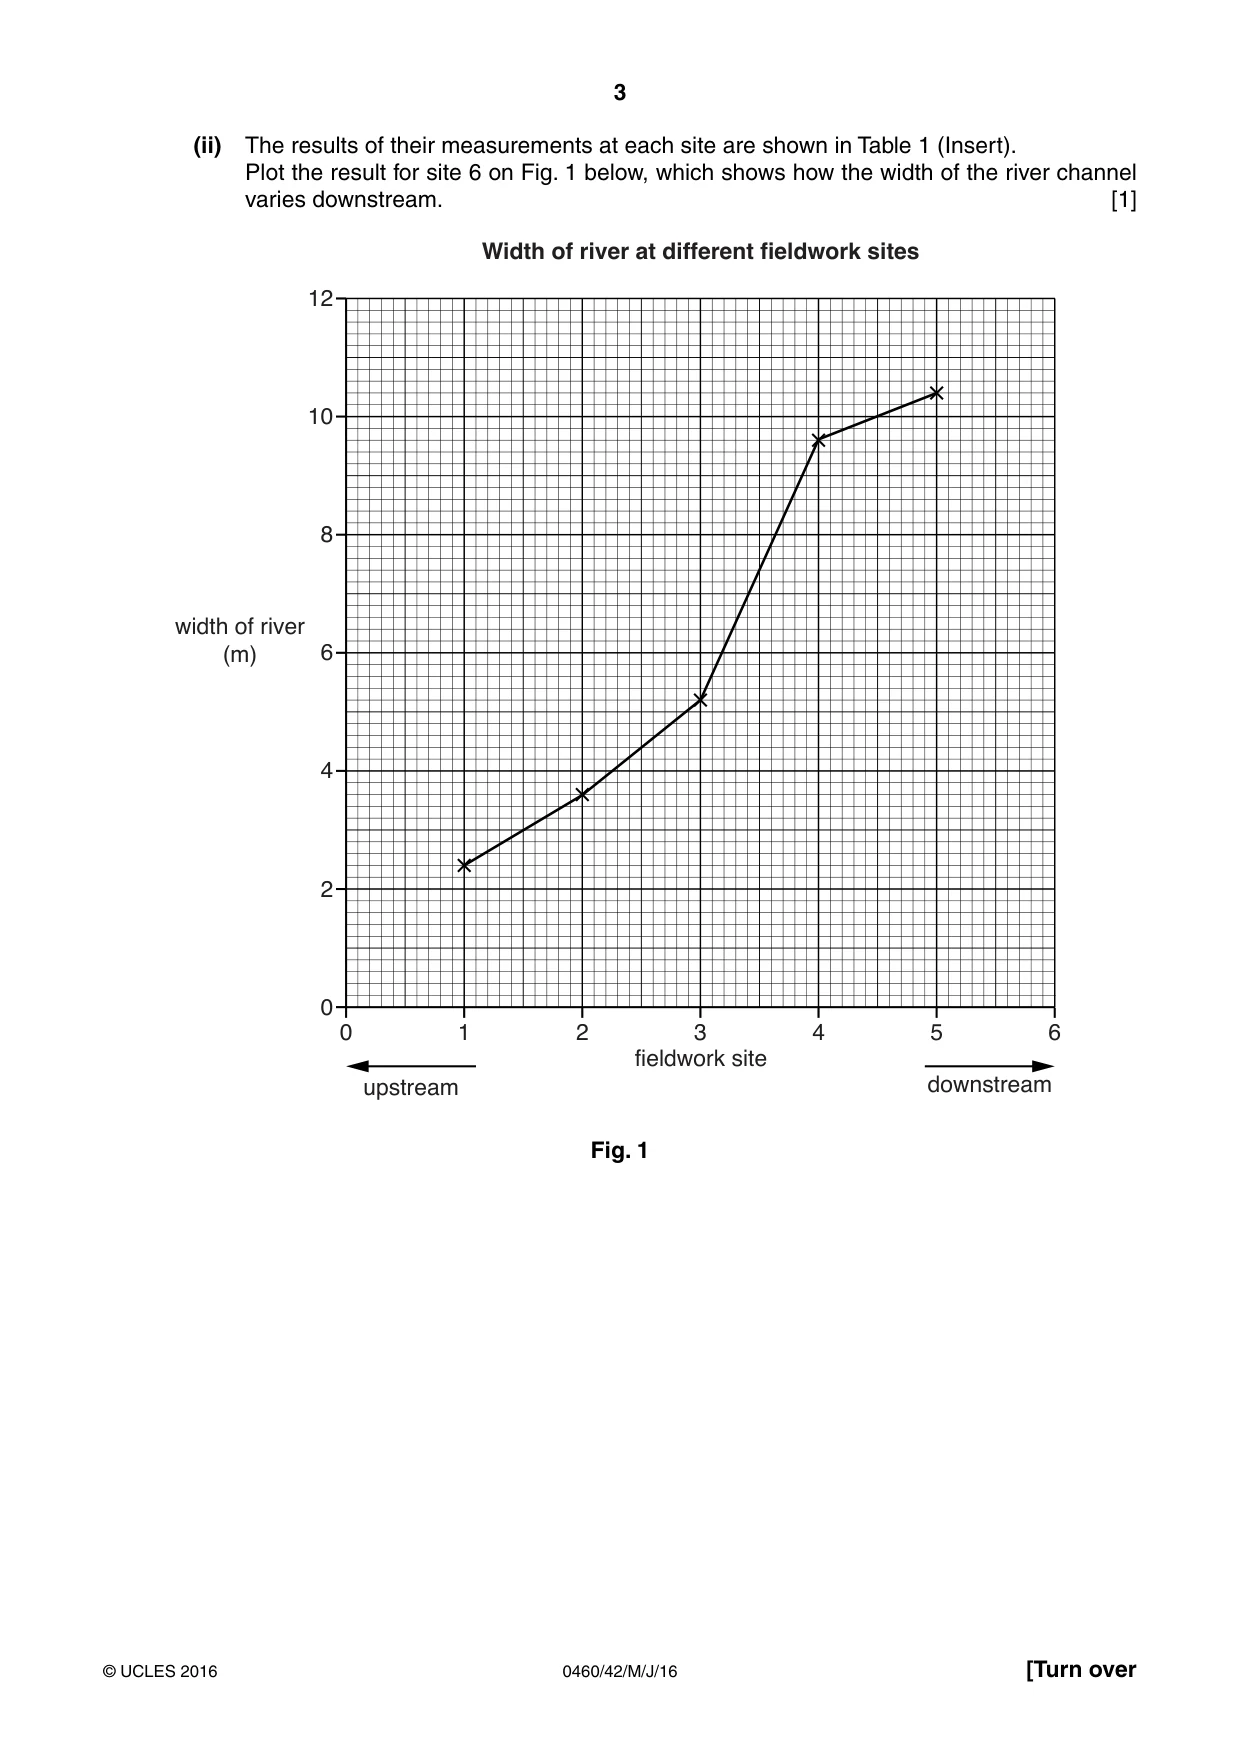
3 0460/42/M/J/16 © UCLES 2016 [Turn over (ii) The results of their measurements at each site are shown in Table 1 (Insert). Plot the result for site 6 on Fig. 1 below, which shows how the width of the river channel varies downstream. [1] 12 10 8 6 4 2 0 0 1 2 3 4 5 6 fieldwork site upstream downstream width of river (m) Width of river at different fieldwork sites Fig. 1
Question paper, page 4
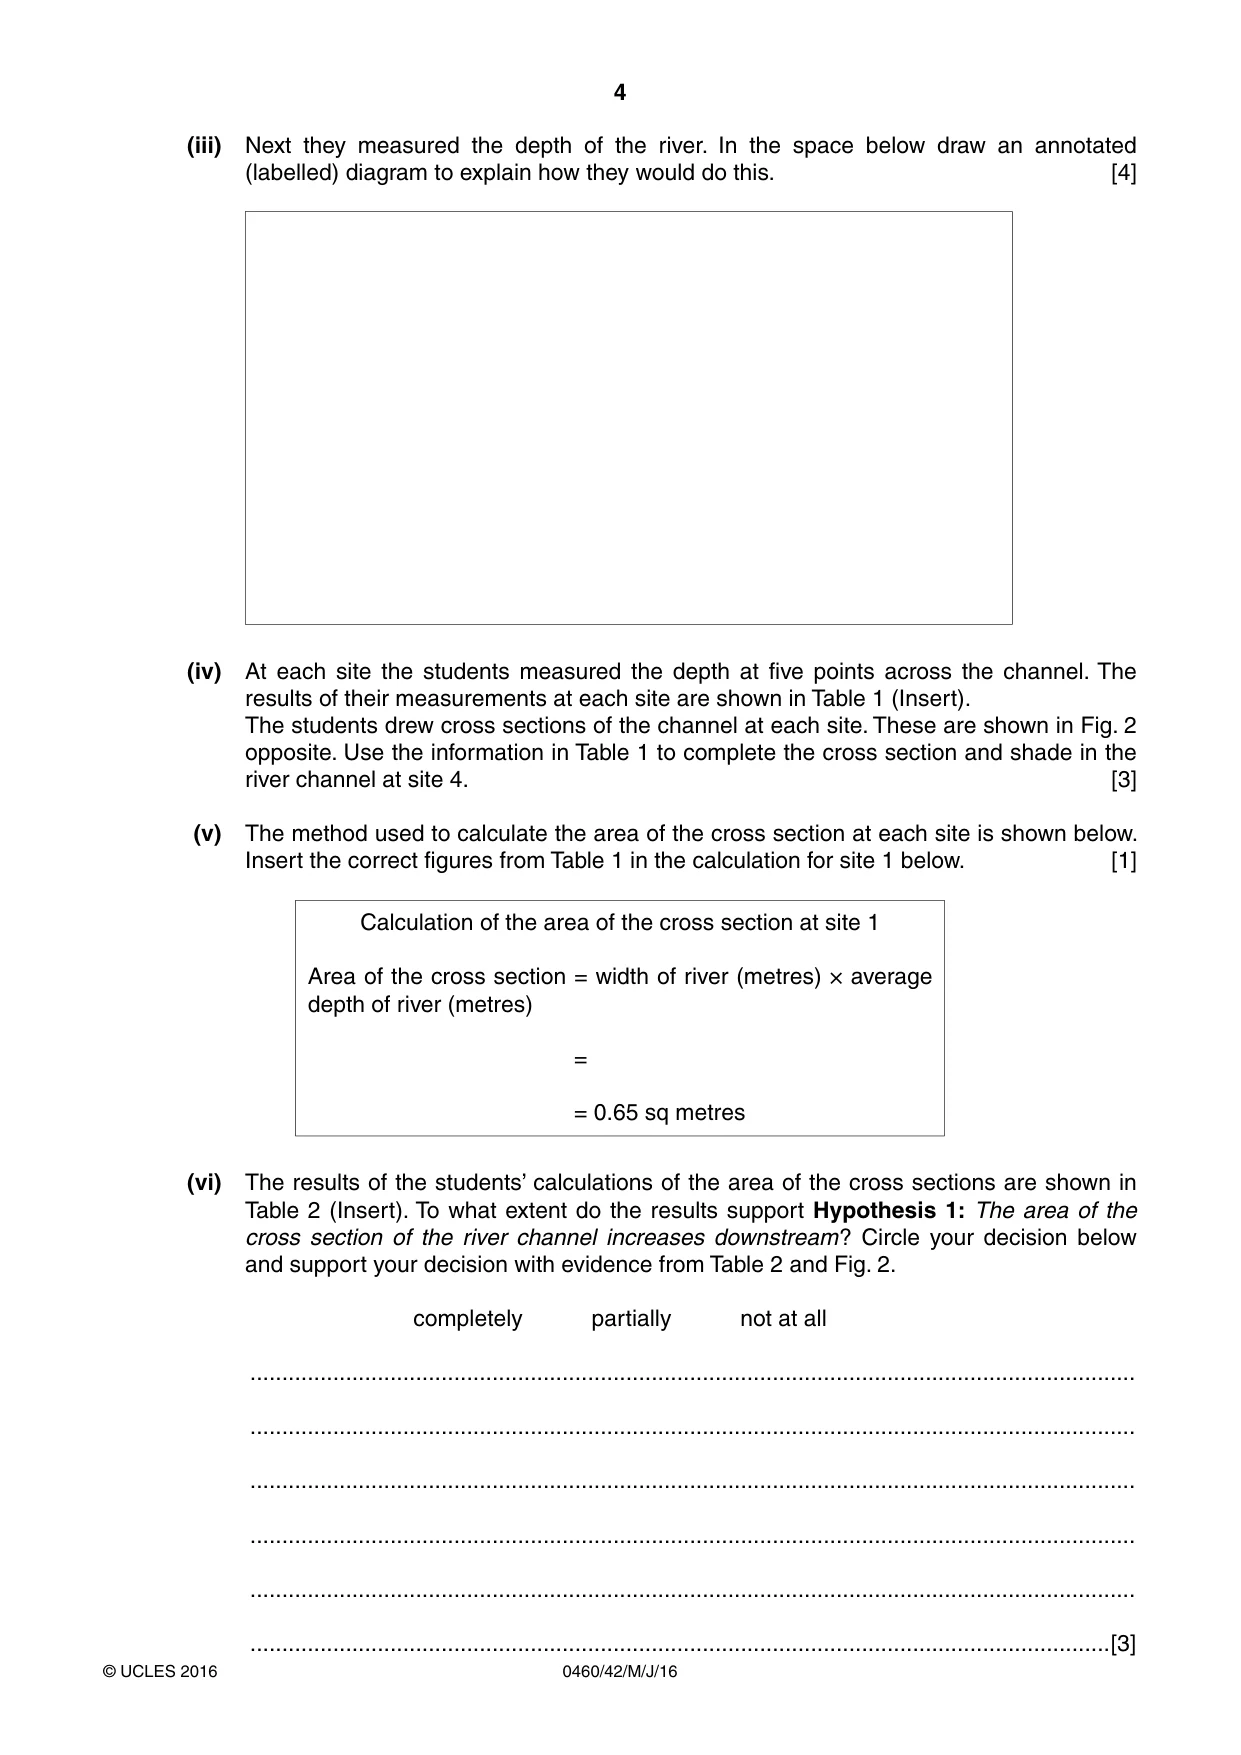
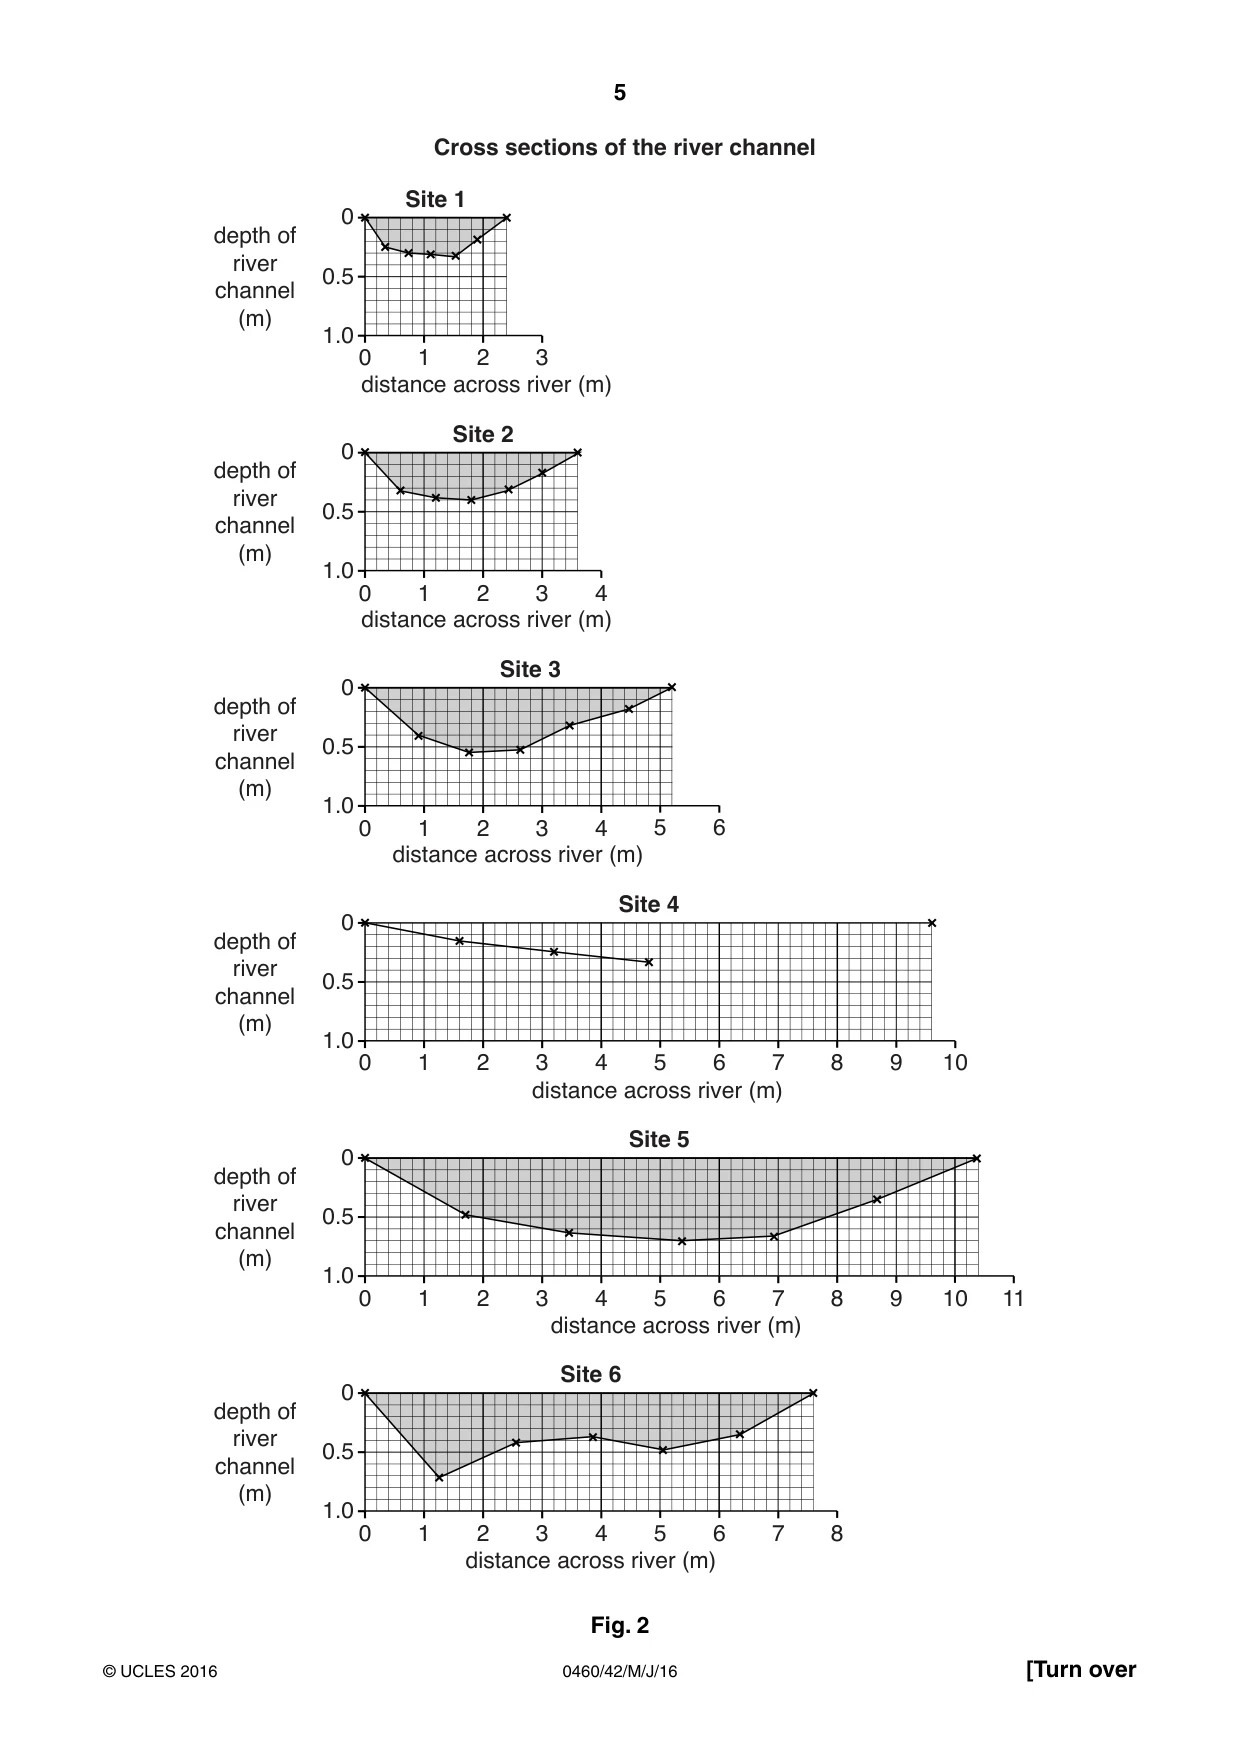
4 0460/42/M/J/16 © UCLES 2016 (iii) Next they measured the depth of the river. In the space below draw an annotated (labelled) diagram to explain how they would do this. [4] (iv) At each site the students measured the depth at five points across the channel. The results of their measurements at each site are shown in Table 1 (Insert). The students drew cross sections of the channel at each site. These are shown in Fig. 2 opposite. Use the information in Table 1 to complete the cross section and shade in the river channel at site 4. [3] (v) The method used to calculate the area of the cross section at each site is shown below. Insert the correct figures from Table 1 in the calculation for site 1 below. [1] Calculation of the area of the cross section at site 1 Area of the cross section = width of river (metres) × average depth of river (metres) = = 0.65 sq metres (vi) The results of the students’ calculations of the area of the cross sections are shown in Table 2 (Insert). To what extent do the results support Hypothesis 1: The area of the cross section of the river channel increases downstream? Circle your decision below and support your decision with evidence from Table 2 and Fig. 2. completely partially not at all … … … … … …[3]
Question paper, page 5
5 0460/42/M/J/16 © UCLES 2016 [Turn over depth of river channel (m) distance across river (m) 0 0.5 1.0 0 1 2 3 Site 1 depth of river channel (m) distance across river (m) 0 0.5 1.0 0 1 2 3 4 Site 2 depth of river channel (m) distance across river (m) 0 0.5 1.0 0 1 2 3 4 5 6 Site 3 depth of river channel (m) distance across river (m) 0 0.5 1.0 0 1 2 3 4 5 6 7 8 9 10 Site 4 depth of river channel (m) distance across river (m) 0 0.5 1.0 0 1 2 3 4 5 6 7 8 9 10 11 Site 5 depth of river channel (m) distance across river (m) 0 0.5 1.0 0 1 2 3 4 5 6 7 8 Site 6 Cross sections of the river channel Fig. 2
Question paper, page 6
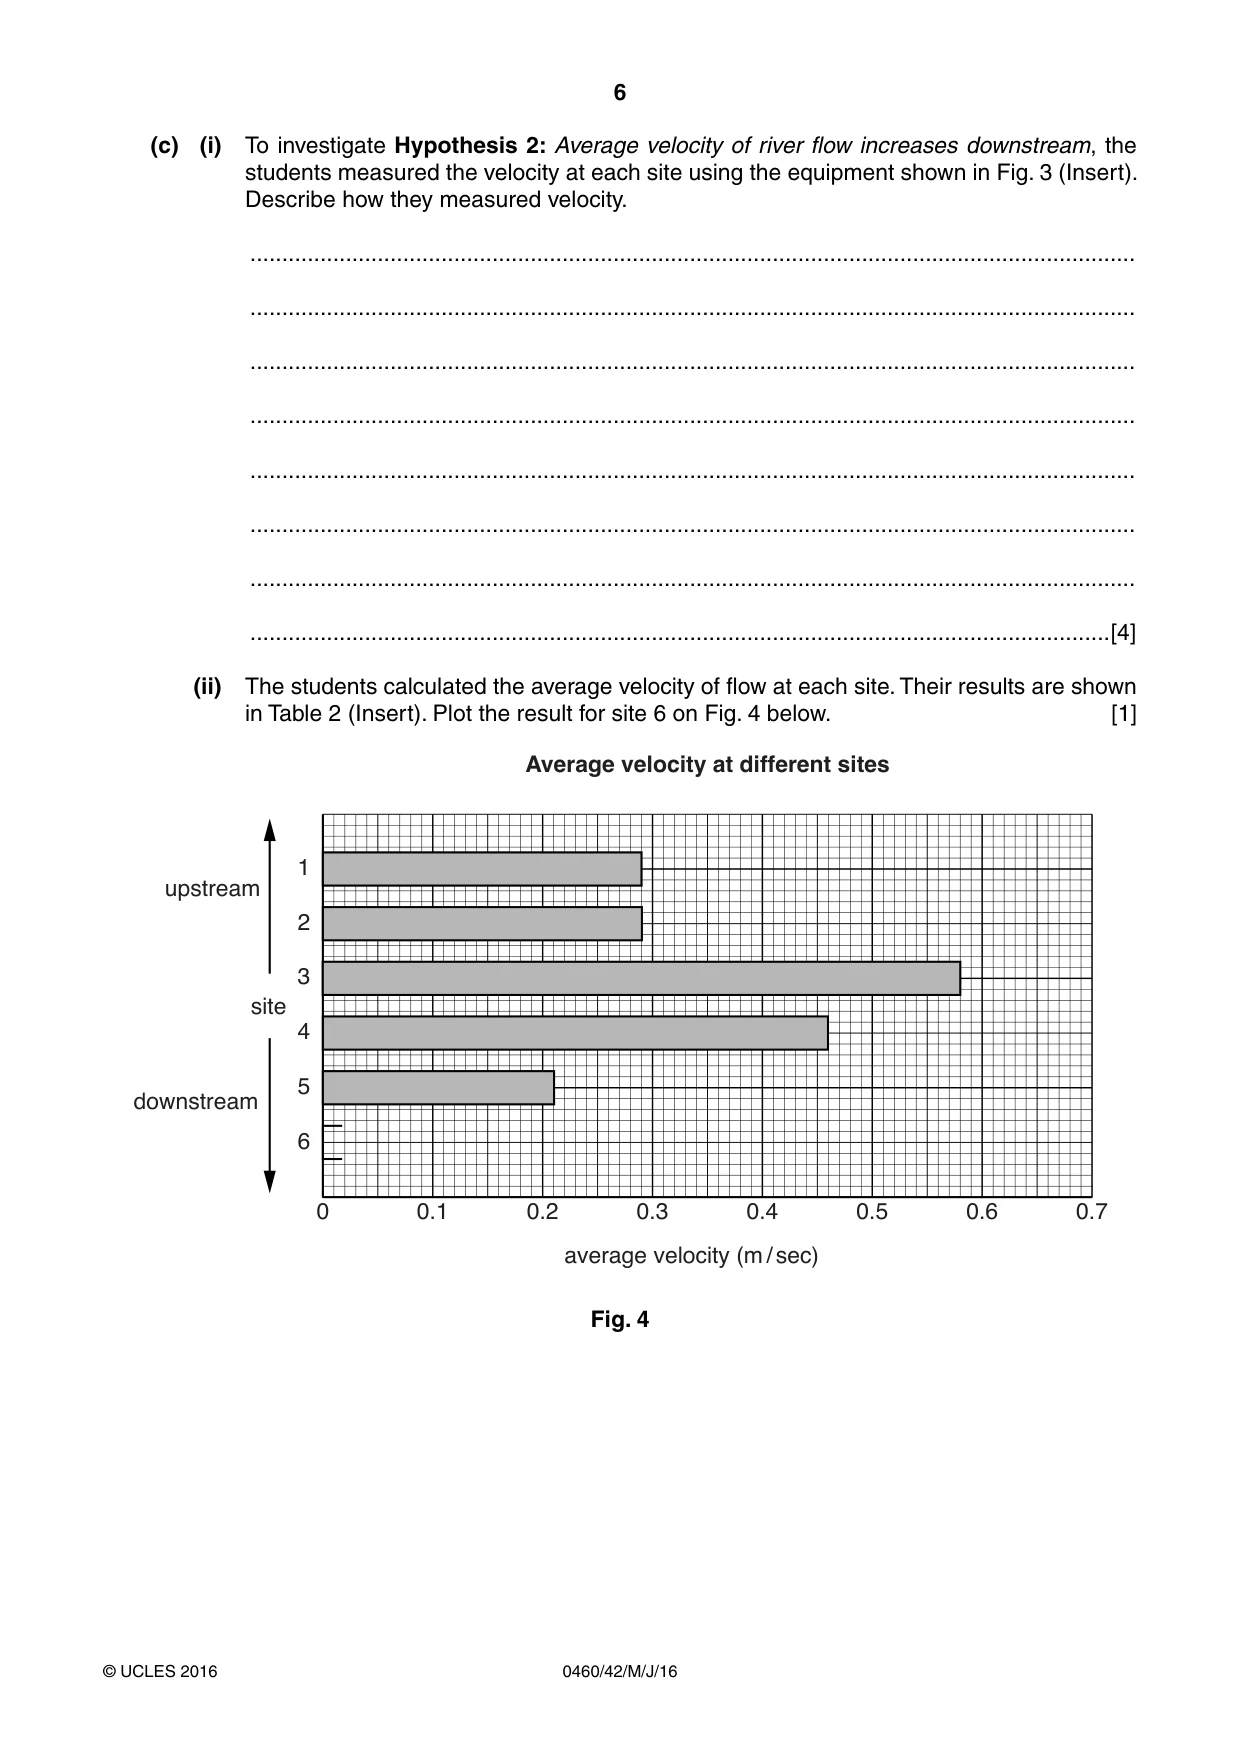
6 0460/42/M/J/16 © UCLES 2016 (c) (i) To investigate Hypothesis 2: Average velocity of river flow increases downstream, the students measured the velocity at each site using the equipment shown in Fig. 3 (Insert). Describe how they measured velocity. … … … … … … … …[4] (ii) The students calculated the average velocity of flow at each site. Their results are shown in Table 2 (Insert). Plot the result for site 6 on Fig. 4 below. [1] Average velocity at different sites 1 2 3 4 5 6 0 0.1 0.2 0.3 0.4 0.5 0.6 0.7 site upstream downstream average velocity (m / sec) Fig. 4
Question paper, page 7
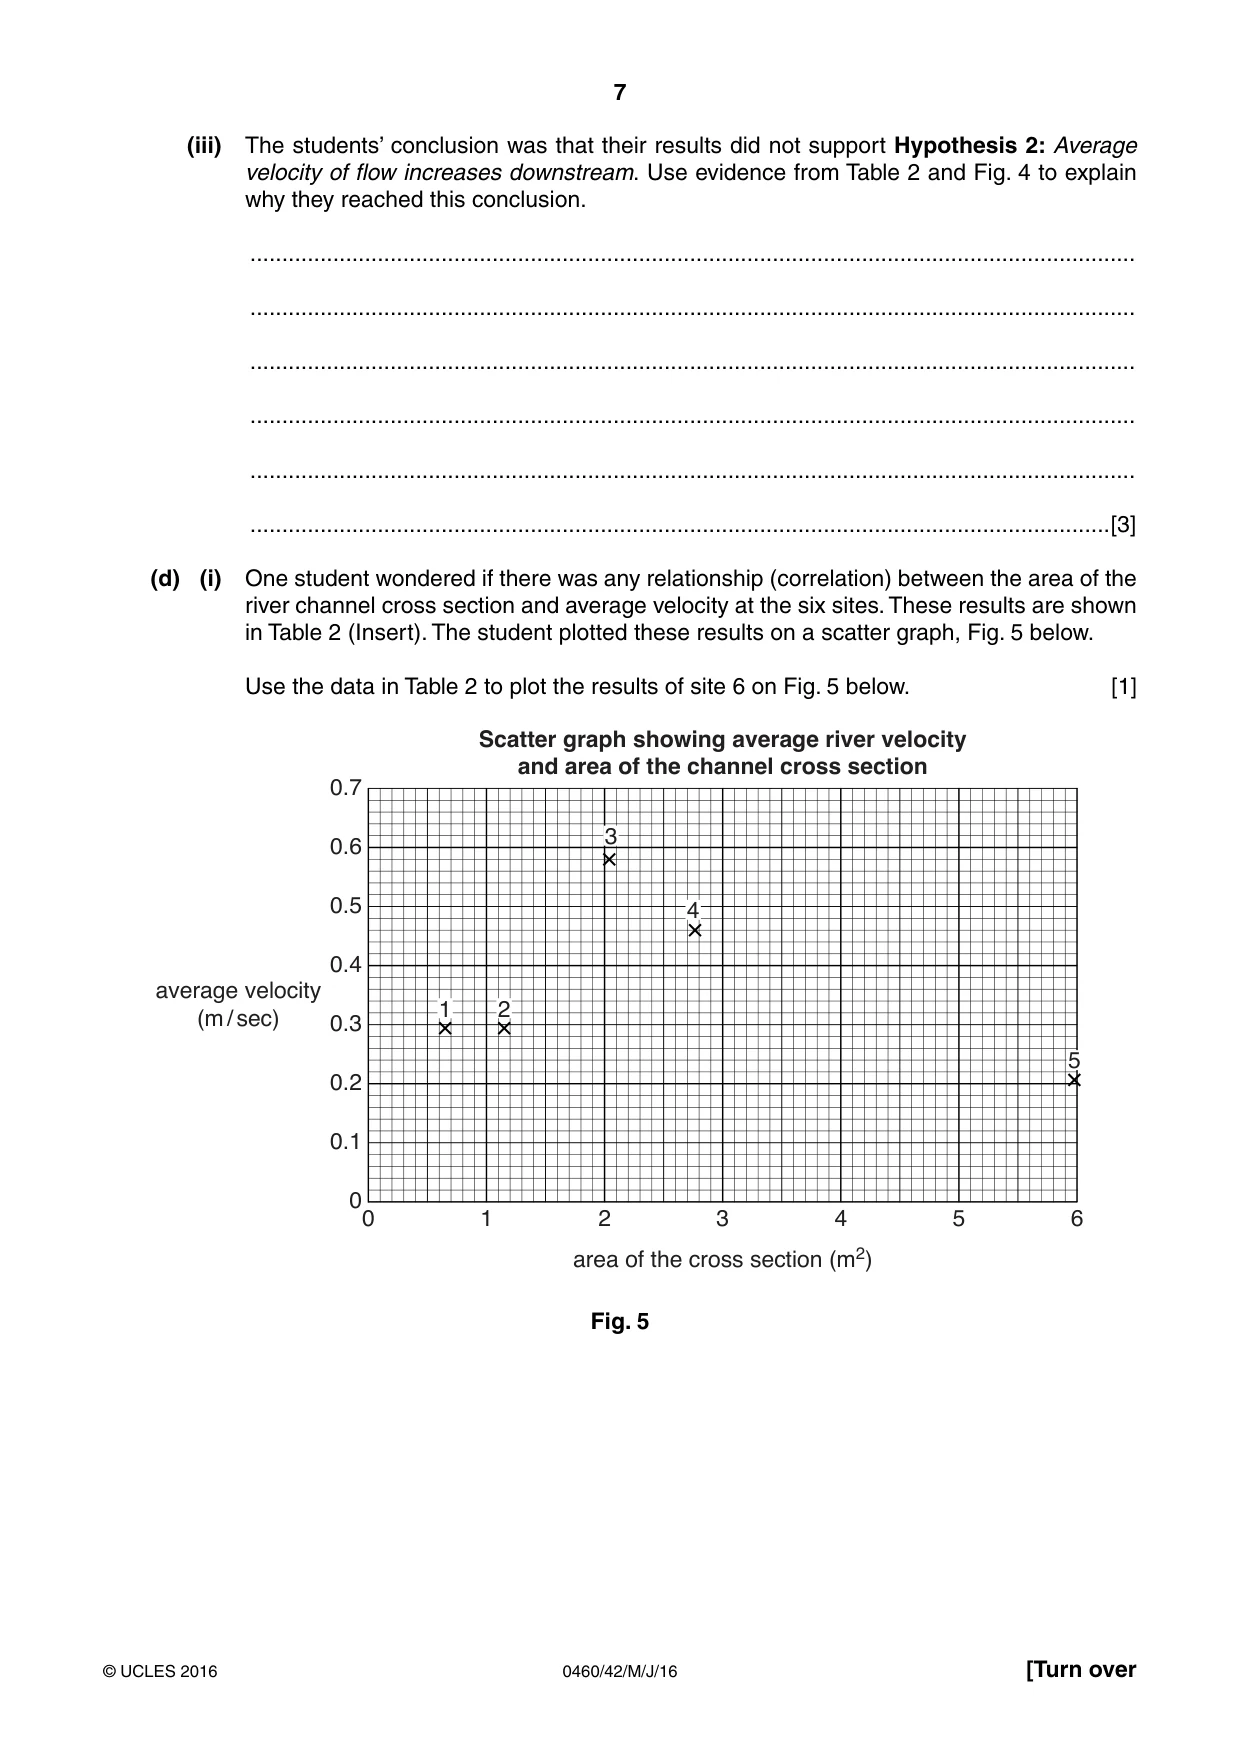
7 0460/42/M/J/16 © UCLES 2016 [Turn over (iii) The students’ conclusion was that their results did not support Hypothesis 2: Average velocity of flow increases downstream. Use evidence from Table 2 and Fig. 4 to explain why they reached this conclusion. … … … … … …[3] (d) (i) One student wondered if there was any relationship (correlation) between the area of the river channel cross section and average velocity at the six sites. These results are shown in Table 2 (Insert). The student plotted these results on a scatter graph, Fig. 5 below. Use the data in Table 2 to plot the results of site 6 on Fig. 5 below. [1] 0.7 0.6 0.5 0.4 0.3 0.2 0.1 0 0 1 2 3 4 5 6 area of the cross section (m2) average velocity (m / sec) Scatter graph showing average river velocity and area of the channel cross section 1 2 3 4 5 Fig. 5
Question paper, page 8
8 0460/42/M/J/16 © UCLES 2016 (ii) The student decided that there was a partial relationship (correlation) between the area of the river channel cross section and average velocity. Support this decision with evidence from Table 2 and Fig. 5. … … … … … …[3] (iii) Explain why the area of the river channel cross section may affect average velocity. … … … …[2] [Total: 30 marks]
Question paper, page 9
9 0460/42/M/J/16 © UCLES 2016 [Turn over TURN PAGE FOR QUESTION 2
Question paper, page 10
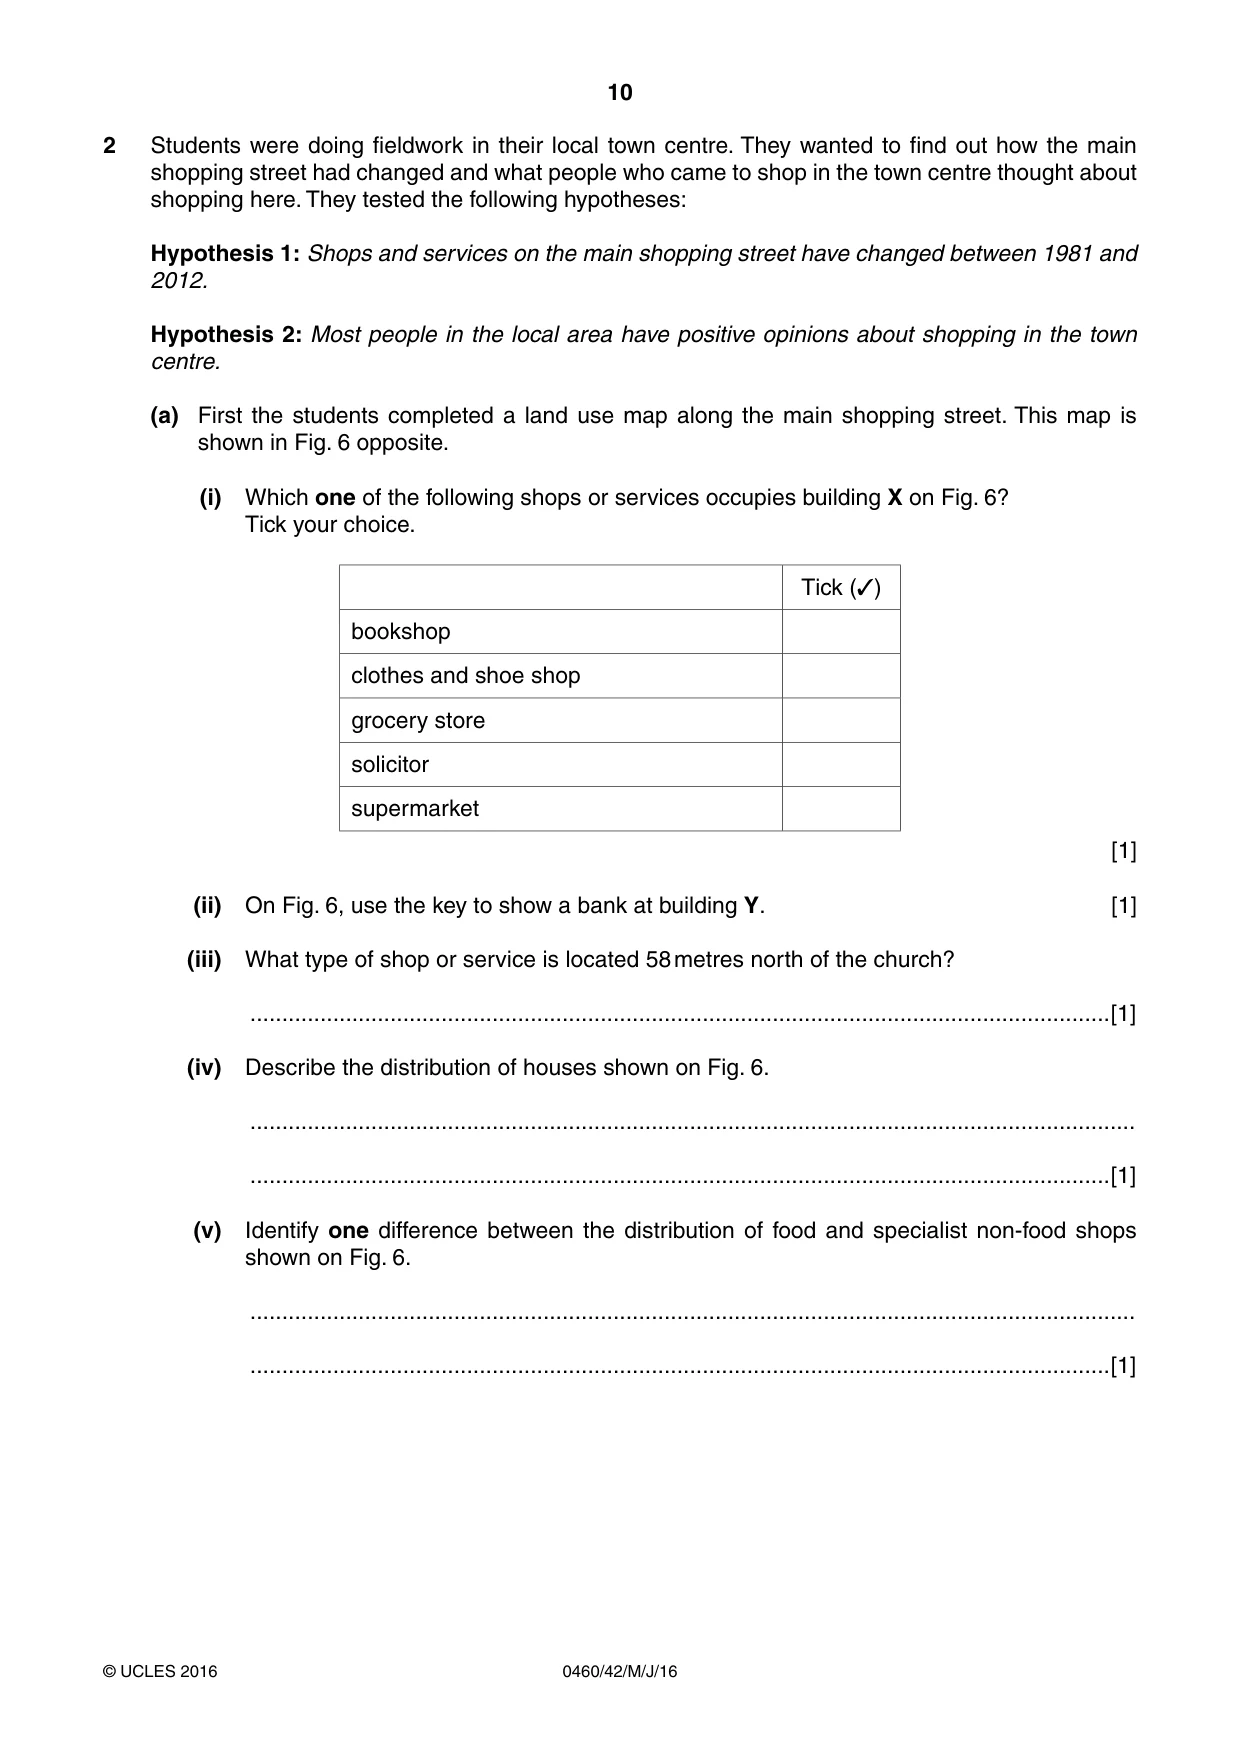
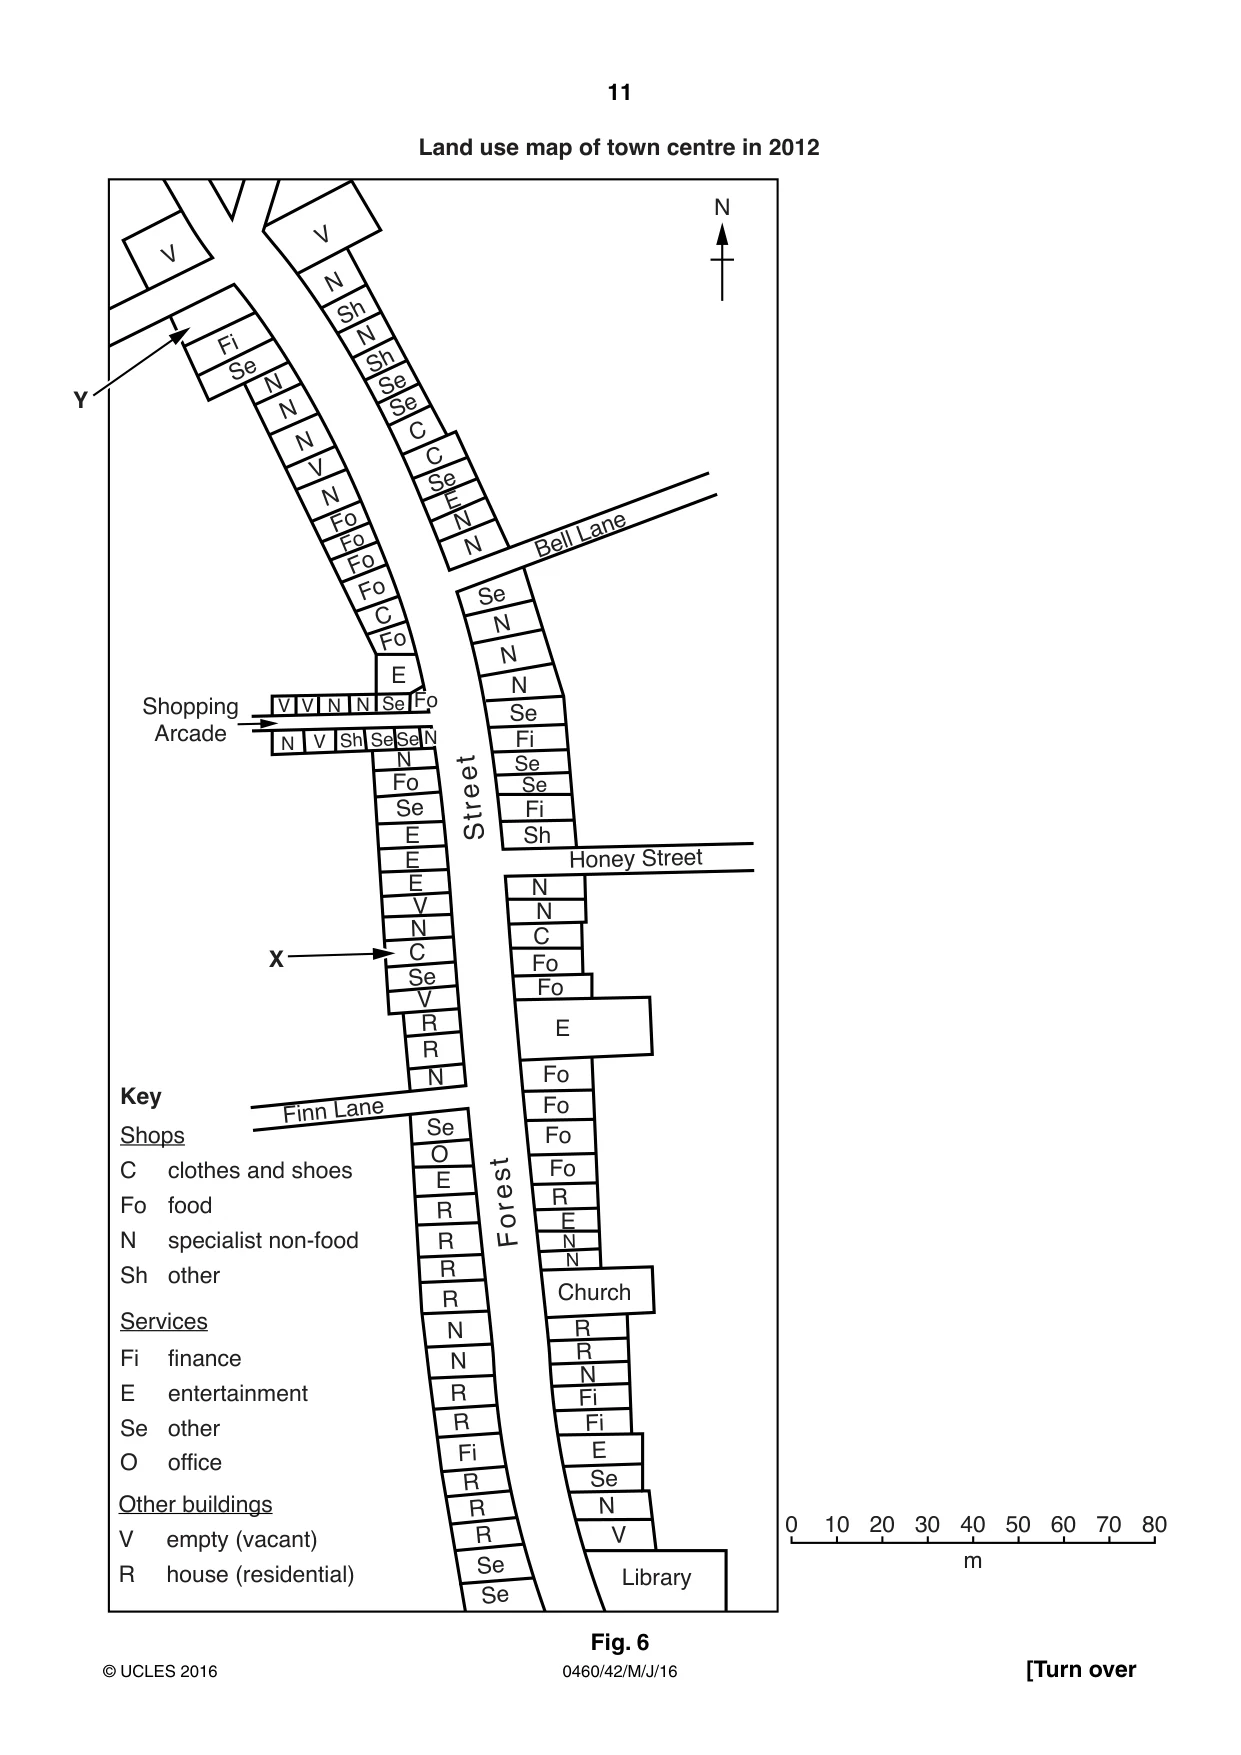
10 0460/42/M/J/16 © UCLES 2016 2 Students were doing fieldwork in their local town centre. They wanted to find out how the main shopping street had changed and what people who came to shop in the town centre thought about shopping here. They tested the following hypotheses: Hypothesis 1: Shops and services on the main shopping street have changed between 1981 and 2012. Hypothesis 2: Most people in the local area have positive opinions about shopping in the town centre. (a) First the students completed a land use map along the main shopping street. This map is shown in Fig. 6 opposite. (i) Which one of the following shops or services occupies building X on Fig. 6? Tick your choice. Tick (✓) bookshop clothes and shoe shop grocery store solicitor supermarket [1] (ii) On Fig. 6, use the key to show a bank at building Y. [1] (iii) What type of shop or service is located 58 metres north of the church? …[1] (iv) Describe the distribution of houses shown on Fig. 6. … …[1] (v) Identify one difference between the distribution of food and specialist non-food shops shown on Fig. 6. … …[1]
Question paper, page 11
11 0460/42/M/J/16 © UCLES 2016 [Turn over Fo Library Se Se R R R R R R R R R R R R Se N N N Fi Fi E Fi N N N N N R R V V V Se O Fo Fo Fo Fo Fo E Fo E E Finn Lane N N N N E N N Church Se Se Se Se Se Se N N N V N N N N N V V Sh Sh Se Se Se Fi E Se C C E E E C C Honey Street Sh Fi Fi Fo Fo Fo Fo Fo C Fo Se N N N V V V Se Se Sh N Bell Lane Forest Street Shopping Arcade Y X Key Shops Services Other buildings C clothes and shoes food specialist non-food other Fo N Sh Fi finance entertainment other office E Se O empty (vacant) house (residential) V R 0 10 20 30 40 50 60 70 80 m Land use map of town centre in 2012 N Fig. 6
Question paper, page 12
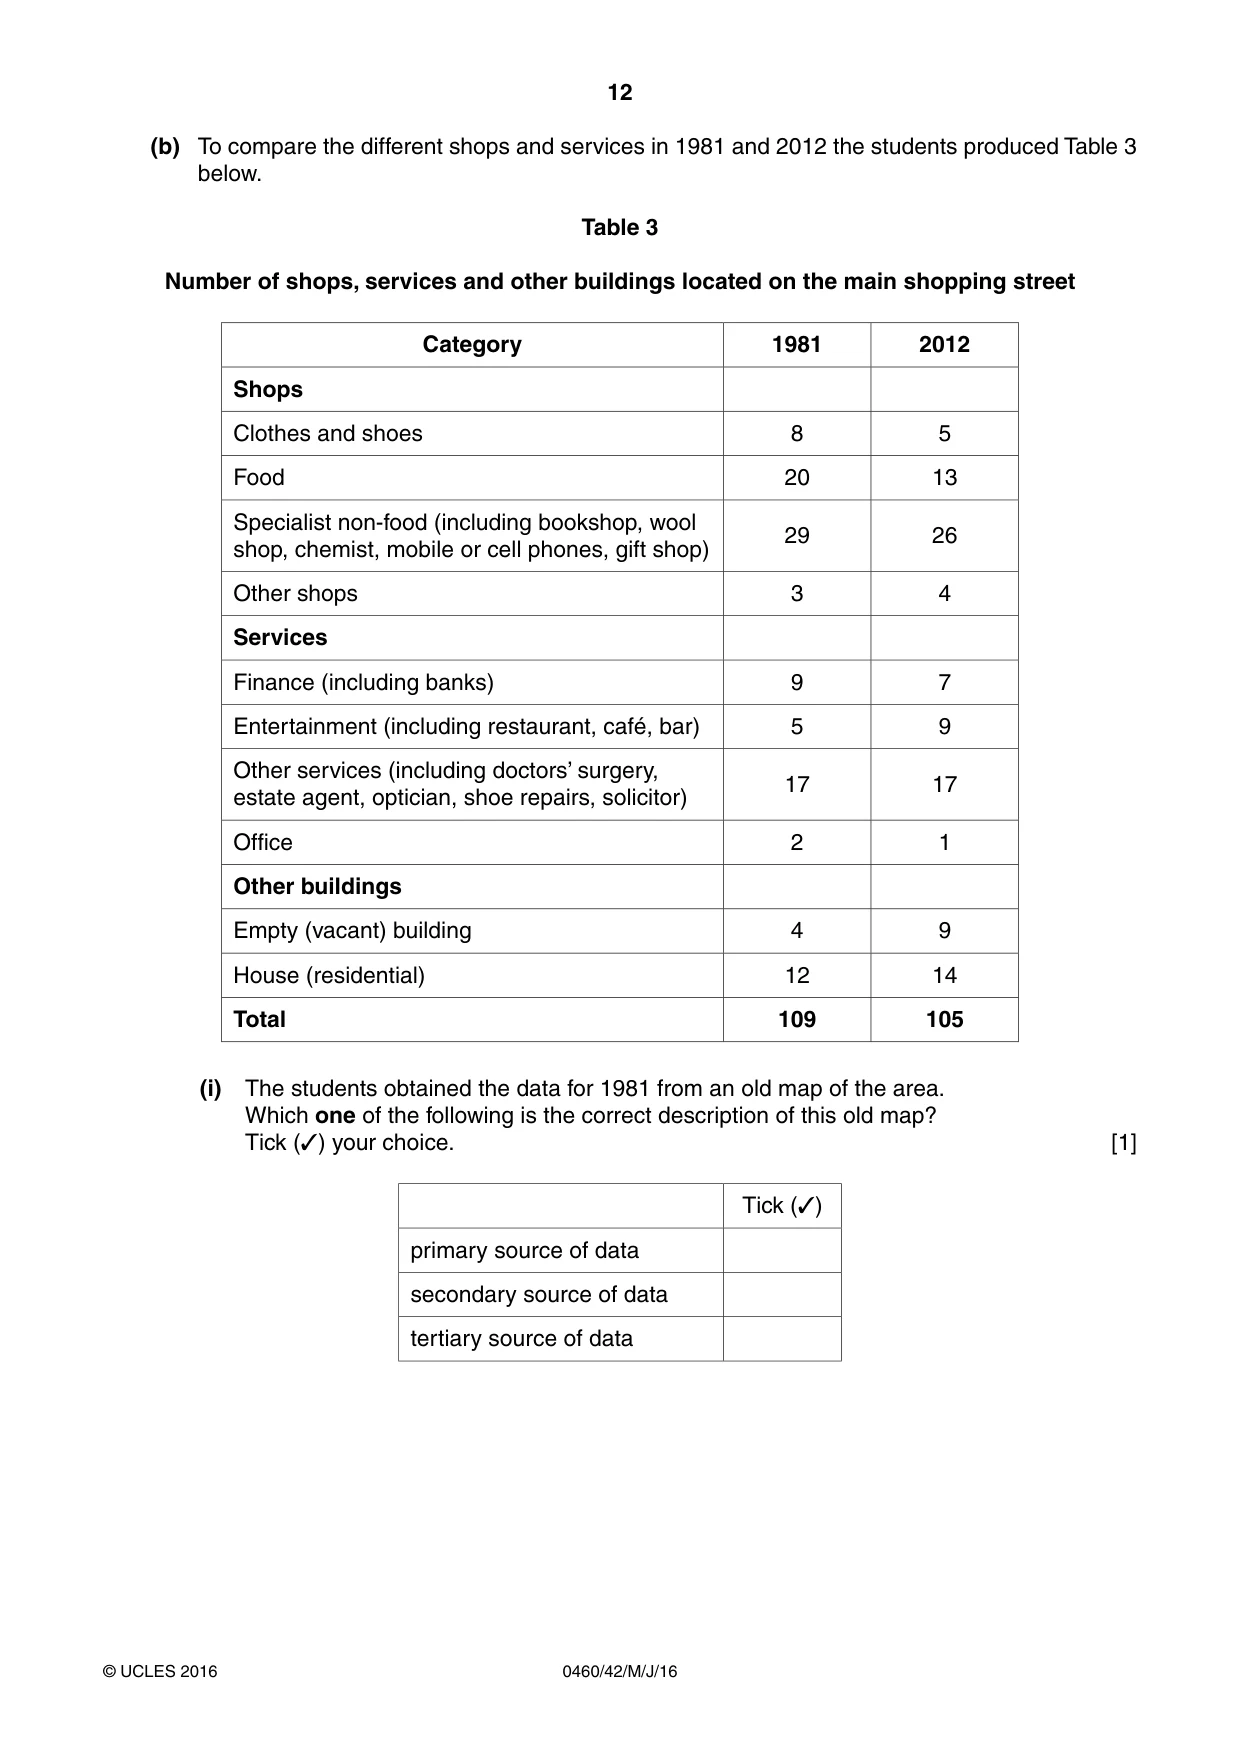
12 0460/42/M/J/16 © UCLES 2016 (b) To compare the different shops and services in 1981 and 2012 the students produced Table 3 below. Table 3 Number of shops, services and other buildings located on the main shopping street Category 1981 2012 Shops Clothes and shoes 8 5 Food 20 13 Specialist non-food (including bookshop, wool shop, chemist, mobile or cell phones, gift shop) 29 26 Other shops 3 4 Services Finance (including banks) 9 7 Entertainment (including restaurant, café, bar) 5 9 Other services (including doctors’ surgery, estate agent, optician, shoe repairs, solicitor) 17 17 Office 2 1 Other buildings Empty (vacant) building 4 9 House (residential) 12 14 Total 109 105 (i) The students obtained the data for 1981 from an old map of the area. Which one of the following is the correct description of this old map? Tick (✓) your choice. [1] Tick (✓) primary source of data secondary source of data tertiary source of data
Question paper, page 13
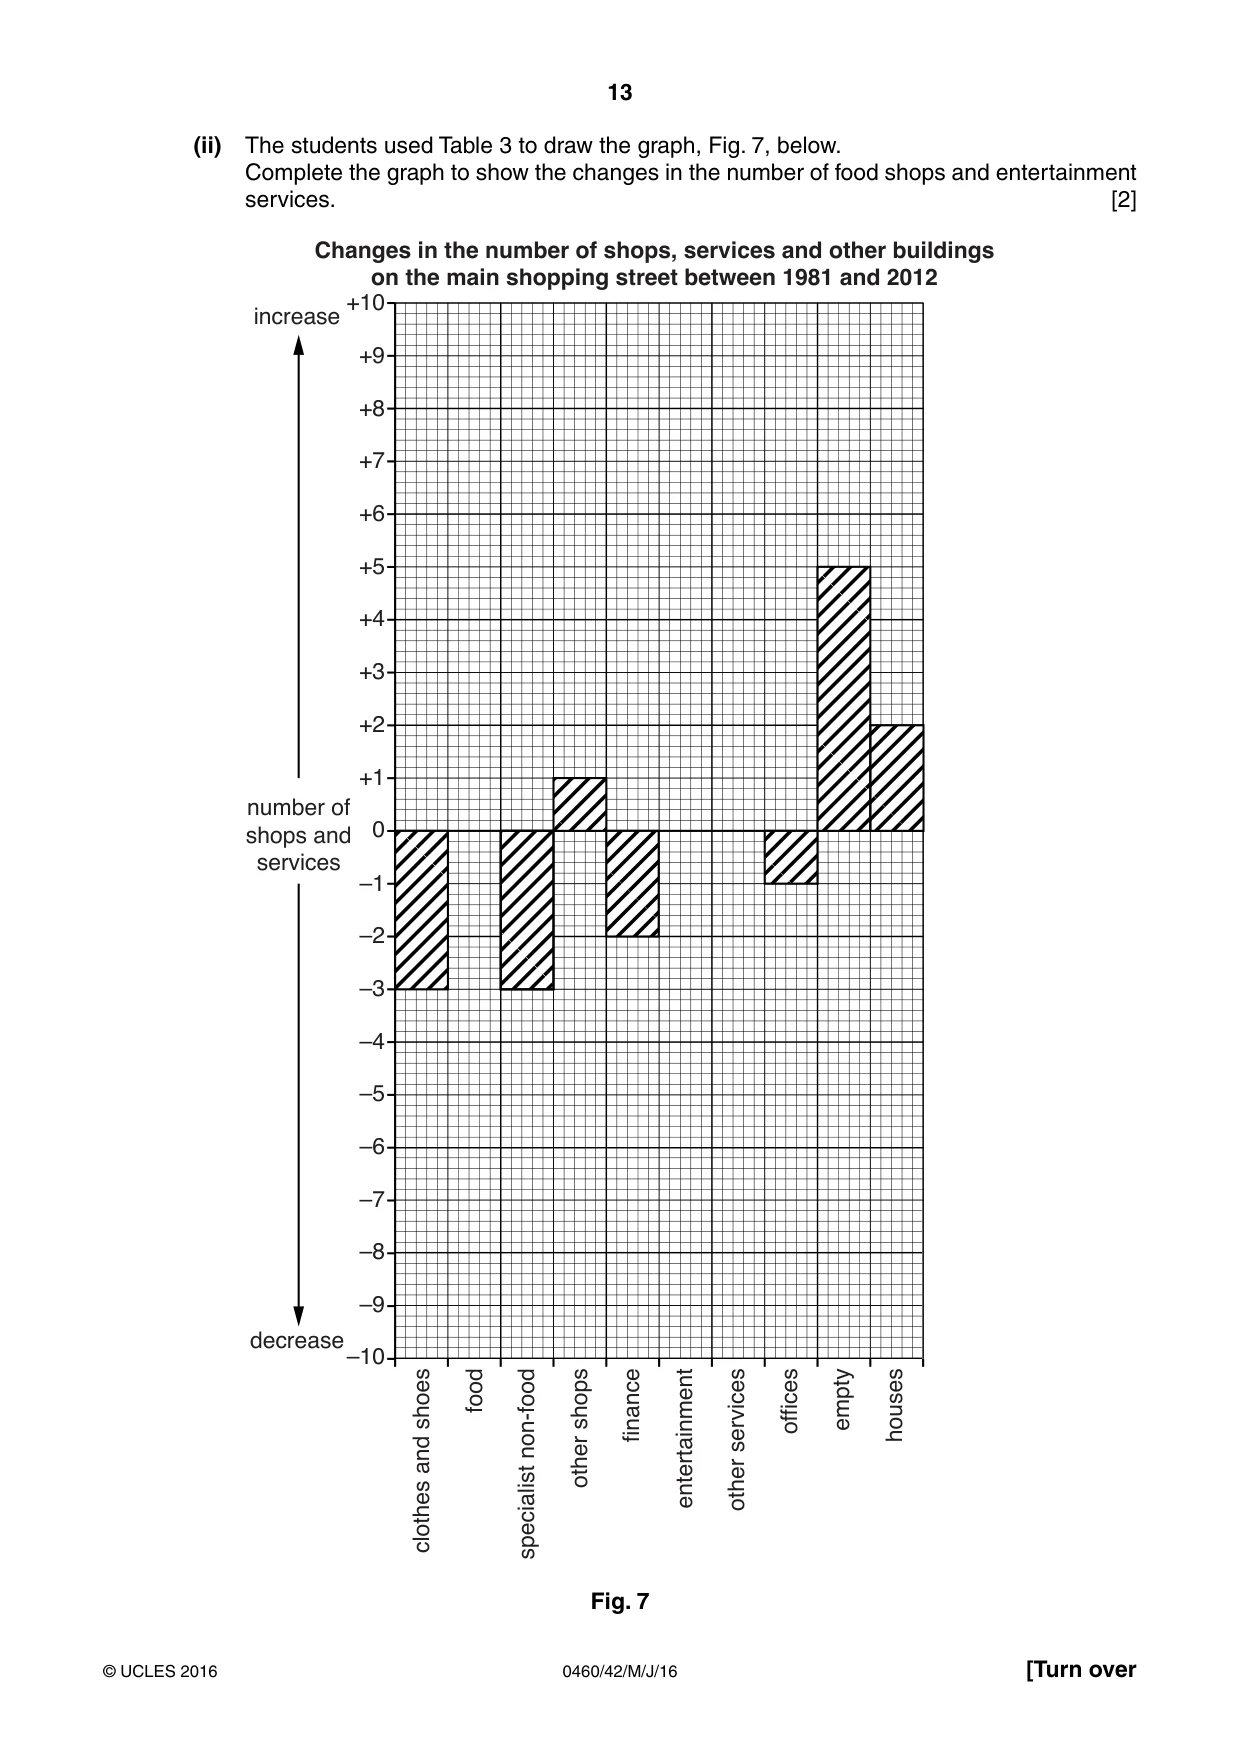
13 0460/42/M/J/16 © UCLES 2016 [Turn over (ii) The students used Table 3 to draw the graph, Fig. 7, below. Complete the graph to show the changes in the number of food shops and entertainment services. [2] +10 +9 +8 +7 +6 +5 +4 +3 +2 +1 0 –1 –2 –3 –4 –5 –6 –7 –8 –9 –10 clothes and shoes food specialist non-food other shops finance entertainment other services offices empty houses Changes in the number of shops, services and other buildings on the main shopping street between 1981 and 2012 number of shops and services increase decrease Fig. 7
Question paper, page 14
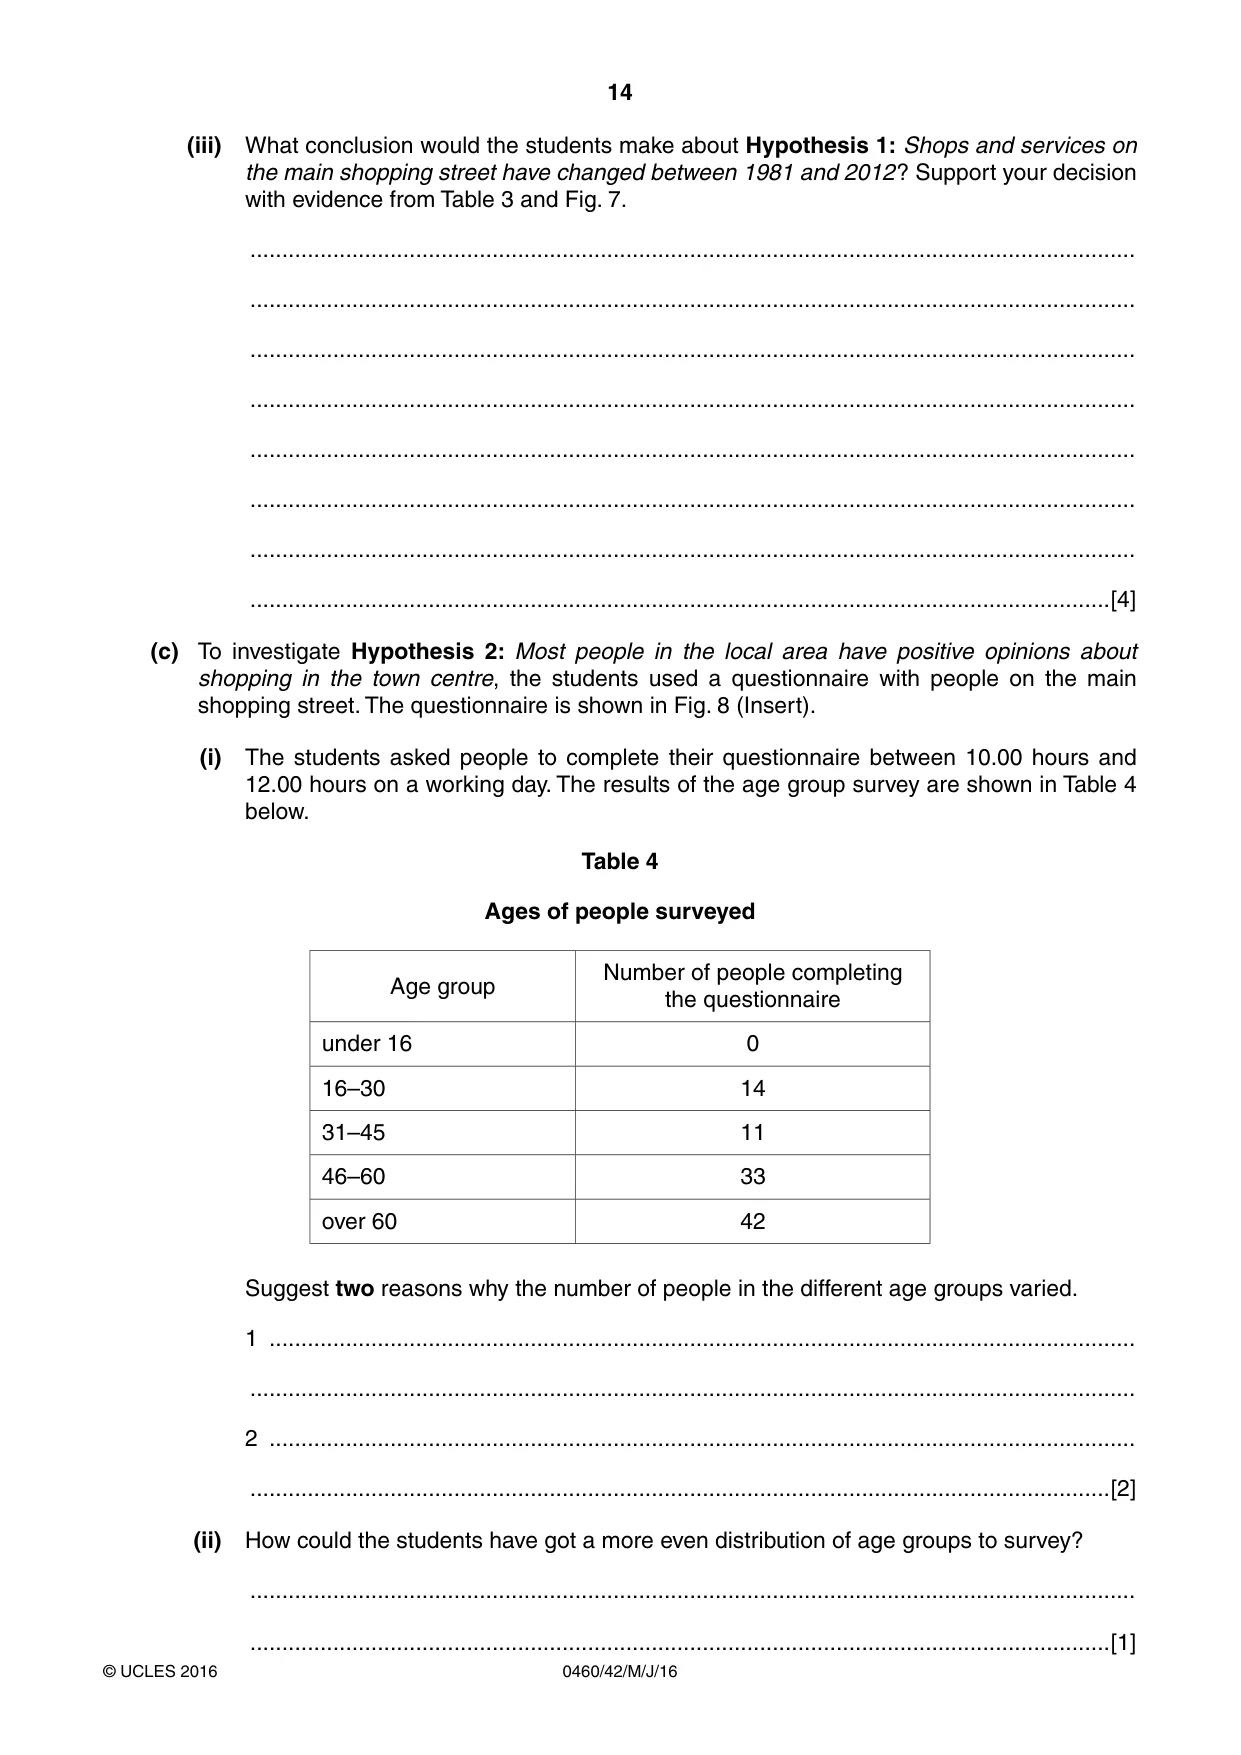
14 0460/42/M/J/16 © UCLES 2016 (iii) What conclusion would the students make about Hypothesis 1: Shops and services on the main shopping street have changed between 1981 and 2012? Support your decision with evidence from Table 3 and Fig. 7. … … … … … … … …[4] (c) To investigate Hypothesis 2: Most people in the local area have positive opinions about shopping in the town centre, the students used a questionnaire with people on the main shopping street. The questionnaire is shown in Fig. 8 (Insert). (i) The students asked people to complete their questionnaire between 10.00 hours and 12.00 hours on a working day. The results of the age group survey are shown in Table 4 below. Table 4 Ages of people surveyed Age group Number of people completing the questionnaire under 16 0 16–30 14 31–45 11 46–60 33 over 60 42 Suggest two reasons why the number of people in the different age groups varied. 1 … … 2 … …[2] (ii) How could the students have got a more even distribution of age groups to survey? … …[1]
Question paper, page 15
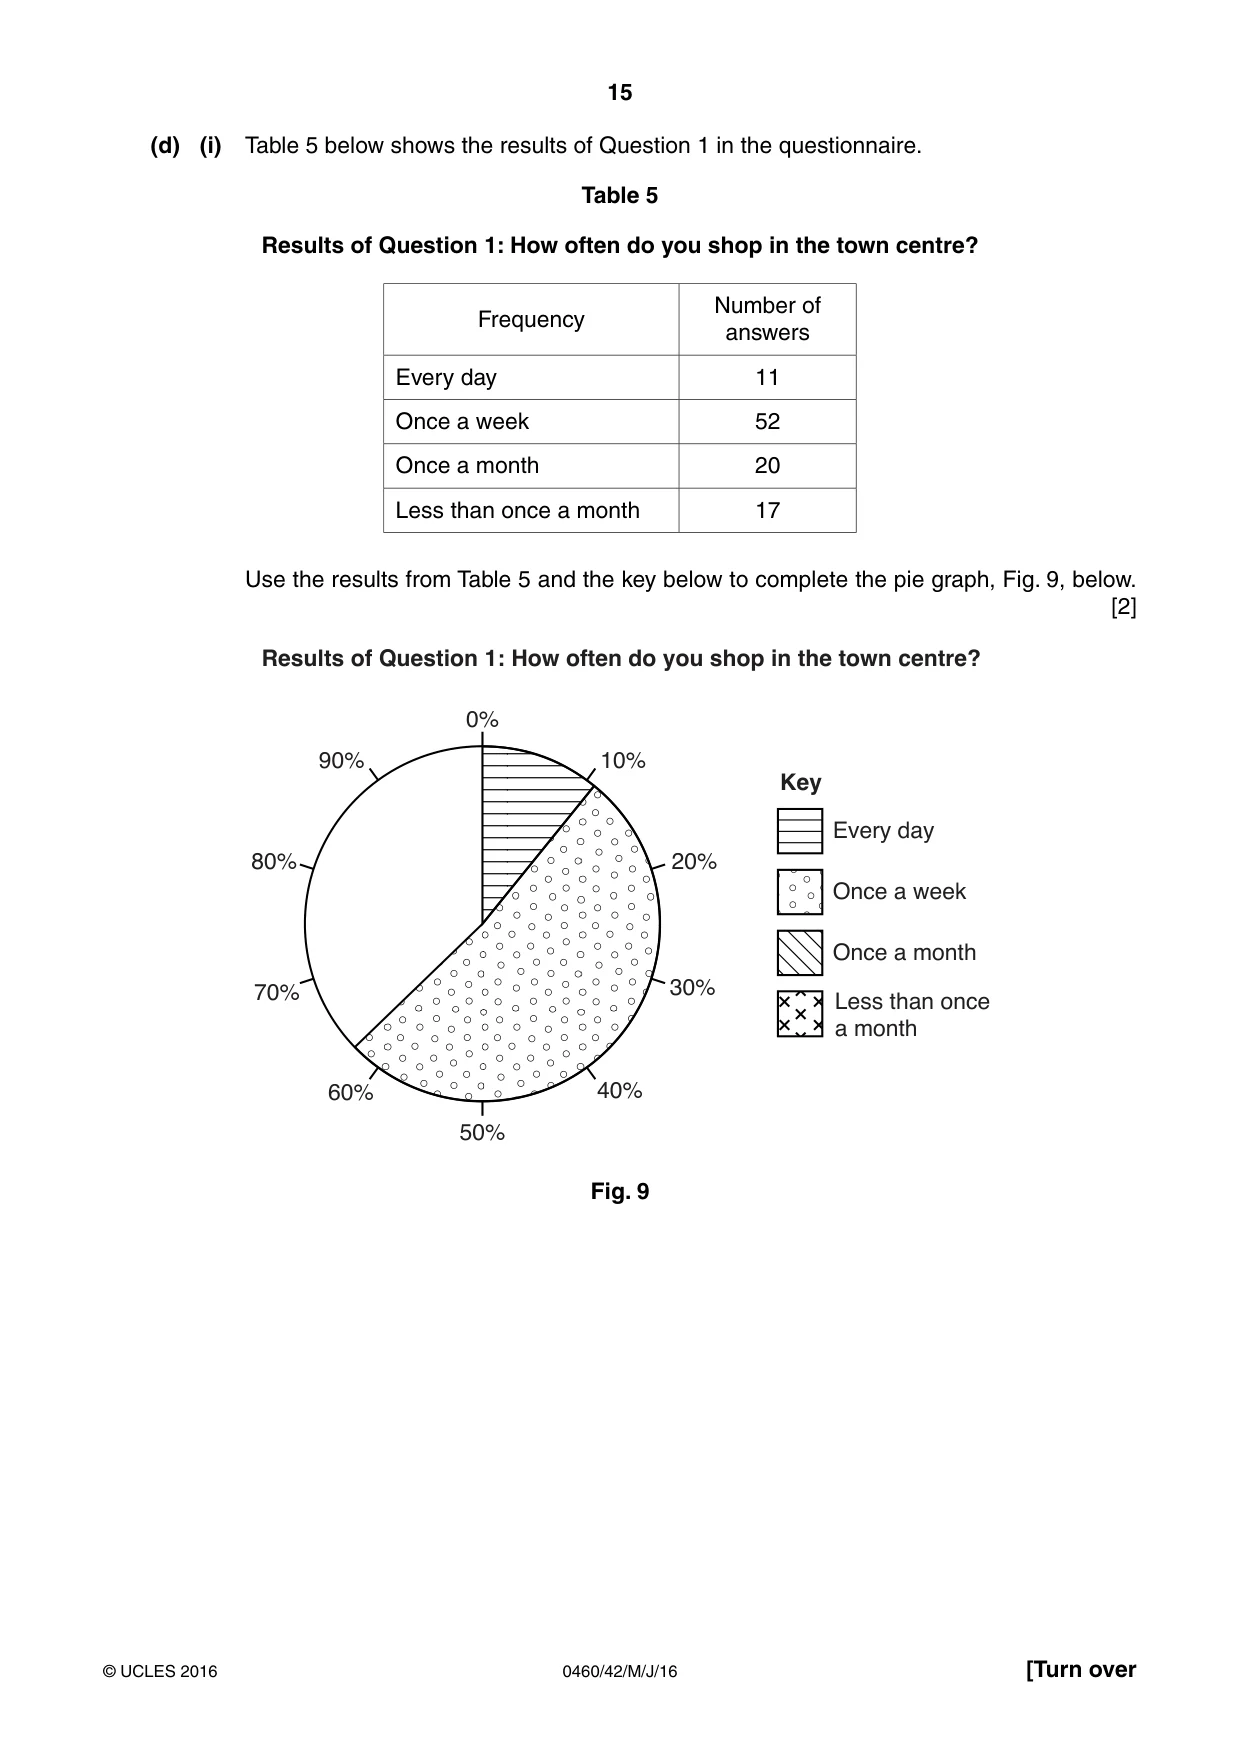
15 0460/42/M/J/16 © UCLES 2016 [Turn over (d) (i) Table 5 below shows the results of Question 1 in the questionnaire. Table 5 Results of Question 1: How often do you shop in the town centre? Frequency Number of answers Every day 11 Once a week 52 Once a month 20 Less than once a month 17 Use the results from Table 5 and the key below to complete the pie graph, Fig. 9, below. [2] 0% 50% 10% 20% 30% 40% 60% 70% 80% 90% Results of Question 1: How often do you shop in the town centre? Key Every day Once a week Once a month Less than once a month Fig. 9
Question paper, page 16
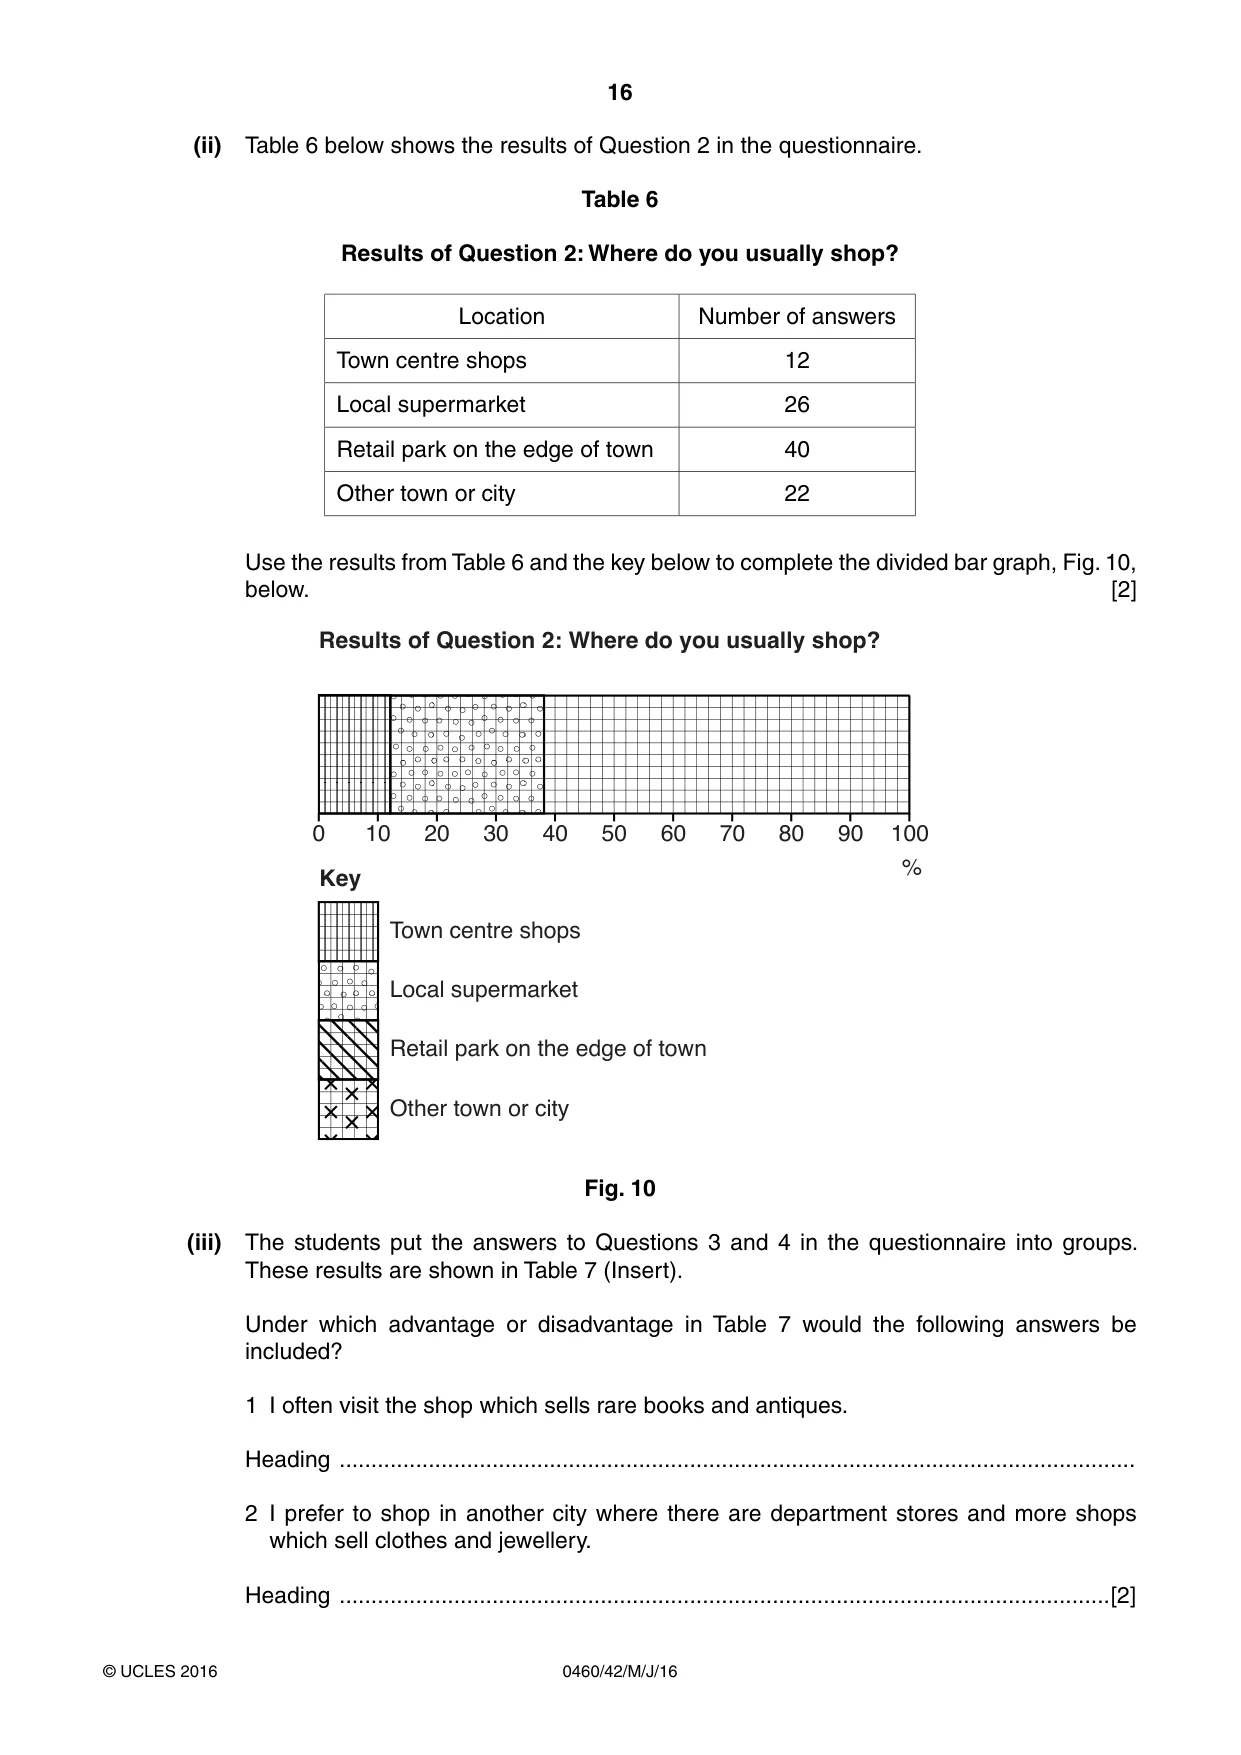
16 0460/42/M/J/16 © UCLES 2016 (ii) Table 6 below shows the results of Question 2 in the questionnaire. Table 6 Results of Question 2: Where do you usually shop? Location Number of answers Town centre shops 12 Local supermarket 26 Retail park on the edge of town 40 Other town or city 22 Use the results from Table 6 and the key below to complete the divided bar graph, Fig. 10, below. [2] 0 10 20 30 40 50 60 70 80 90 100 % Results of Question 2: Where do you usually shop? Town centre shops Local supermarket Retail park on the edge of town Other town or city Key Fig. 10 (iii) The students put the answers to Questions 3 and 4 in the questionnaire into groups. These results are shown in Table 7 (Insert). Under which advantage or disadvantage in Table 7 would the following answers be included? 1 I often visit the shop which sells rare books and antiques. Heading … 2 I prefer to shop in another city where there are department stores and more shops which sell clothes and jewellery. Heading …[2]
Question paper, page 17
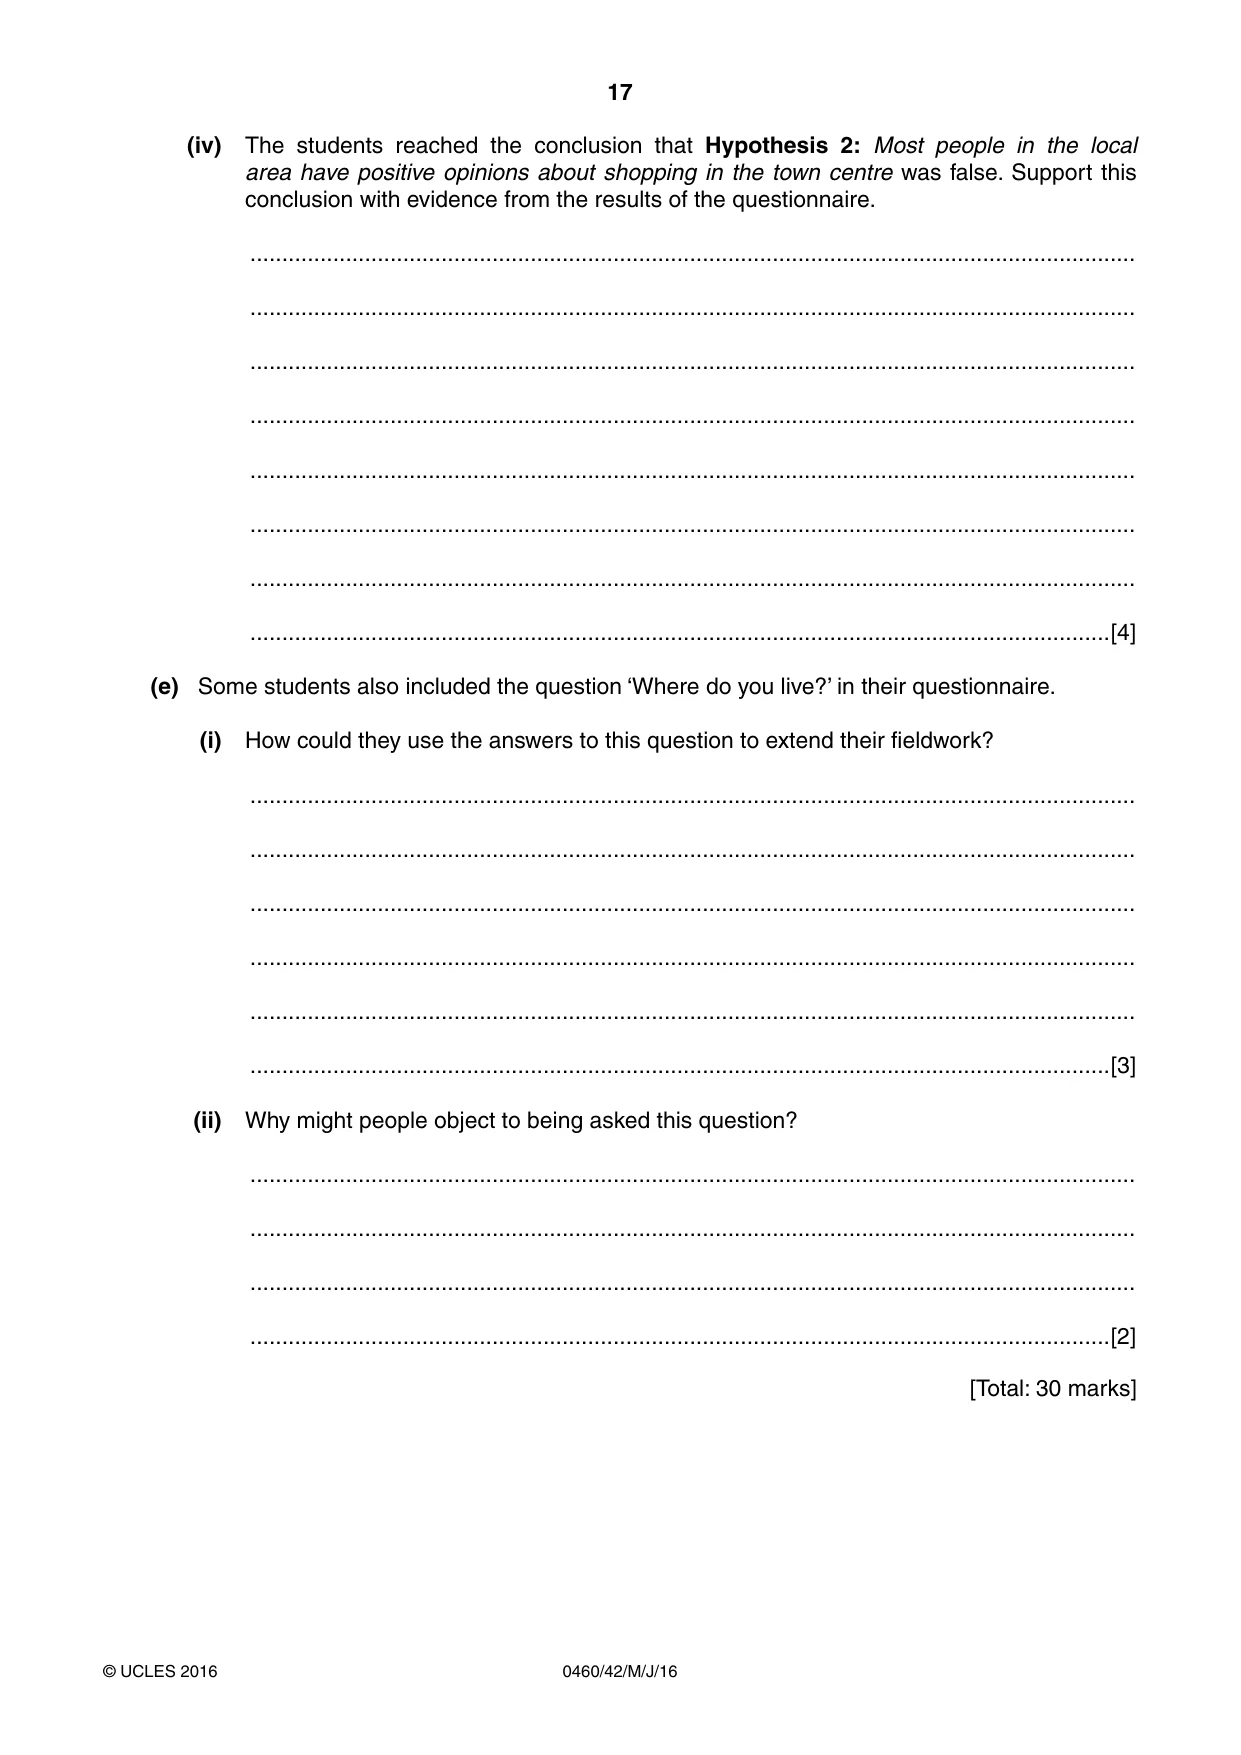
17 0460/42/M/J/16 © UCLES 2016 (iv) The students reached the conclusion that Hypothesis 2: Most people in the local area have positive opinions about shopping in the town centre was false. Support this conclusion with evidence from the results of the questionnaire. … … … … … … … …[4] (e) Some students also included the question ‘Where do you live?’ in their questionnaire. (i) How could they use the answers to this question to extend their fieldwork? … … … … … …[3] (ii) Why might people object to being asked this question? … … … …[2] [Total: 30 marks]
Question paper, page 18
18 0460/42/M/J/16 © UCLES 2016 Additional Pages If you use the following lined pages to complete the answer(s) to any question(s), the question number(s) must be clearly shown. … … … … … … … … … … … … … … … … … … … … … … … … … …
Question paper, page 19
19 0460/42/M/J/16 © UCLES 2016 … … … … … … … … … … … … … … … … … … … … … … … … … … …
Question paper, page 20
20 0460/42/M/J/16 © UCLES 2016 BLANK PAGE Permission to reproduce items where third-party owned material protected by copyright is included has been sought and cleared where possible. Every reasonable effort has been made by the publisher (UCLES) to trace copyright holders, but if any items requiring clearance have unwittingly been included, the publisher will be pleased to make amends at the earliest possible opportunity. To avoid the issue of disclosure of answer-related information to candidates, all copyright acknowledgements are reproduced online in the Cambridge International Examinations Copyright Acknowledgements Booklet. This is produced for each series of examinations and is freely available to download at www.cie.org.uk after the live examination series. Cambridge International Examinations is part of the Cambridge Assessment Group. Cambridge Assessment is the brand name of University of Cambridge Local Examinations Syndicate (UCLES), which is itself a department of the University of Cambridge.
Mark scheme, page 1
® IGCSE is the registered trademark of Cambridge International Examinations. This syllabus is approved for use in England, Wales and Northern Ireland as a Cambridge International Level 1/Level 2 Certificate. This document consists of 6 printed pages. © UCLES 2016 [Turn over Cambridge International Examinations Cambridge International General Certificate of Secondary Education GEOGRAPHY 0460/42 Paper 4 Alternative to Coursework May/June 2016 MARK SCHEME Maximum Mark: 60 Published This mark scheme is published as an aid to teachers and candidates, to indicate the requirements of the examination. It shows the basis on which Examiners were instructed to award marks. It does not indicate the details of the discussions that took place at an Examiners’ meeting before marking began, which would have considered the acceptability of alternative answers. Mark schemes should be read in conjunction with the question paper and the Principal Examiner Report for Teachers. Cambridge will not enter into discussions about these mark schemes. Cambridge is publishing the mark schemes for the May/June 2016 series for most Cambridge IGCSE®, Cambridge International A and AS Level components and some Cambridge O Level components.
Mark scheme, page 2
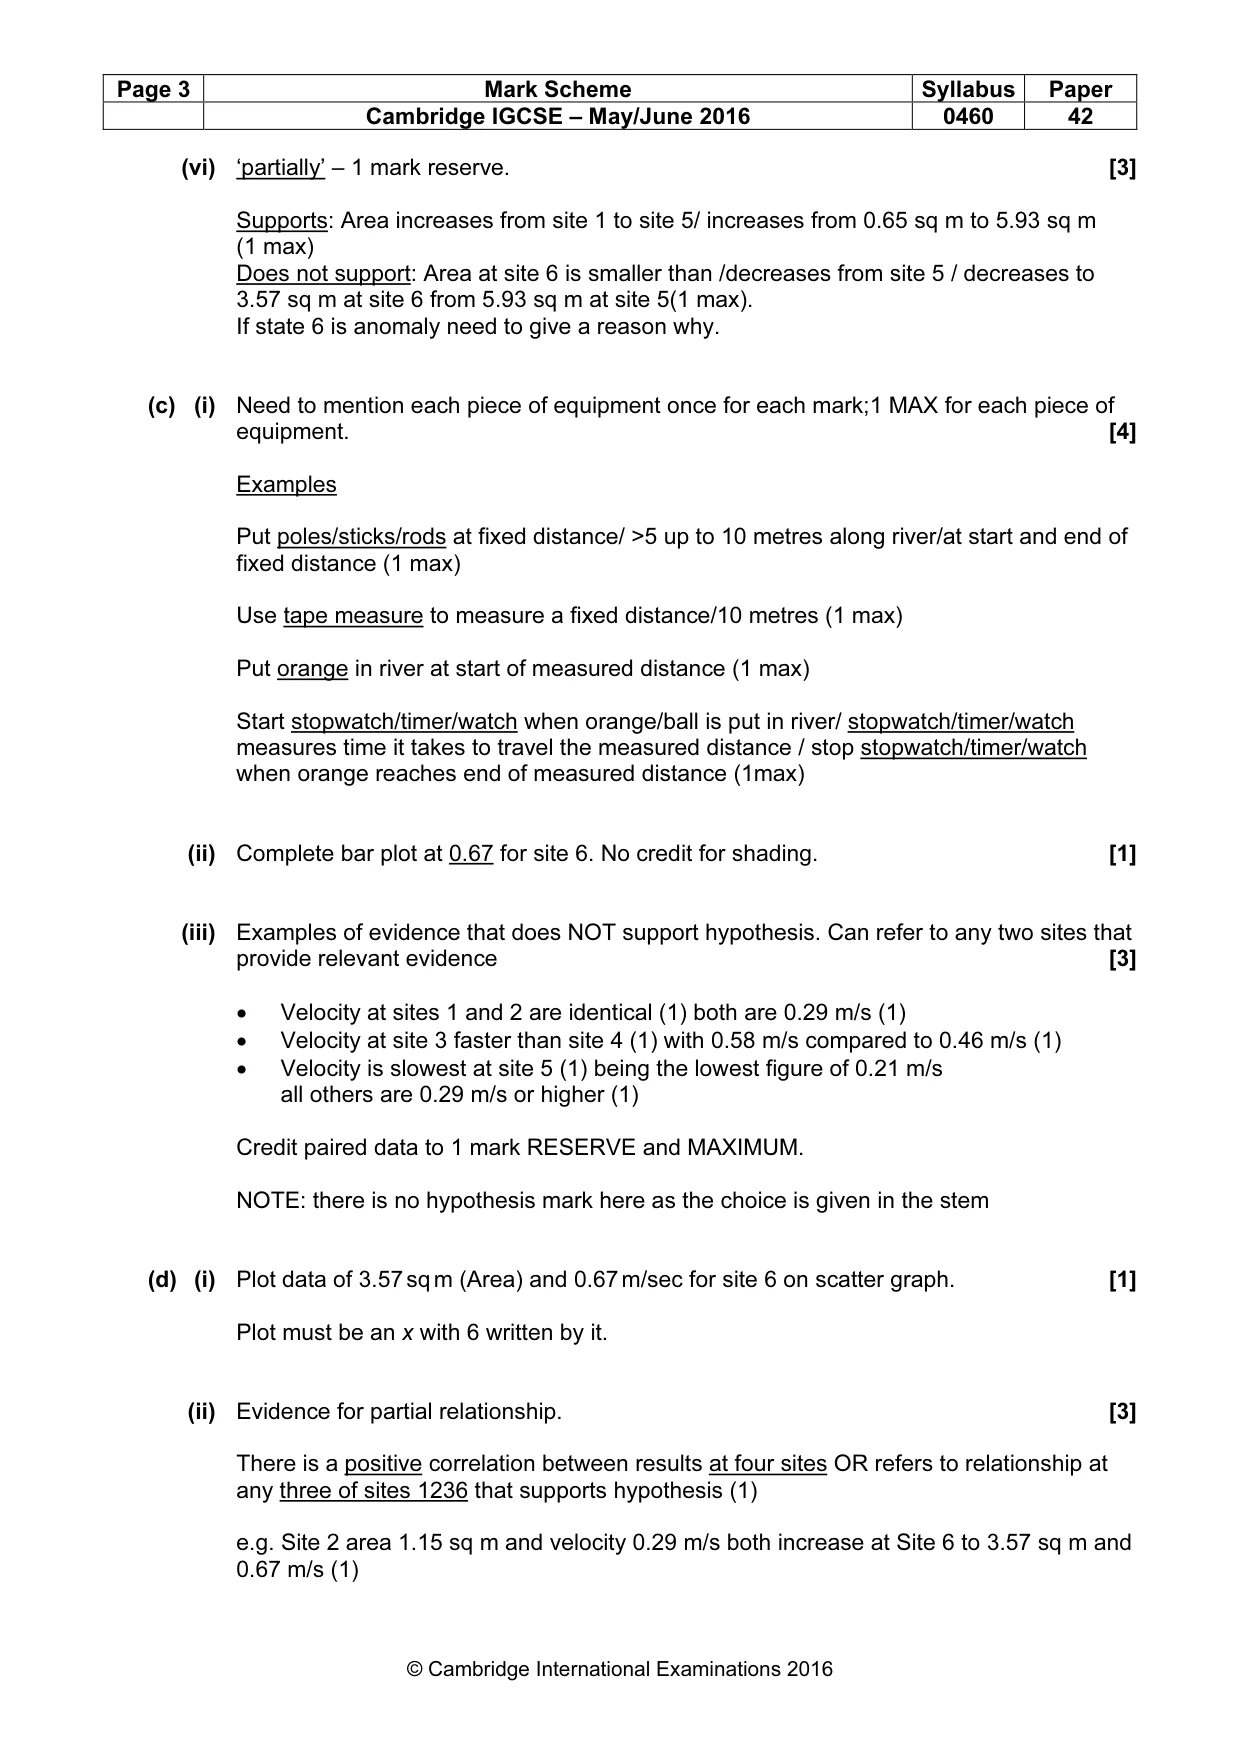
Page 2 Mark Scheme Syllabus Paper Cambridge IGCSE – May/June 2016 0460 42 © Cambridge International Examinations 2016 1 (a) Source (1) [2] Mouth (1) (b) (i) Examples [2] • Check measurement by repeating process and take average (1) • Another student/pair checks the measurement (1) • Make sure the tape is taut/stretched out/tight/flexed (1) • Make sure the tape is at right angles/straight across the river (1) (ii) Plot width of 7.6 at site 6. [1] (iii) One general RESERVE mark for a diagram that shows measuring across a river or a cross-section. [4] Three marks MAX for labelling. Diagram to show LABELS in correct context: • Measuring stick/ pole / ruler (must be labelled and in the water) (1) • Vertical (1) • Equal distance apart (1) • Pole / ruler touches bed (1) • Water level/ river/ water named (1) • Measure section which is wet (1) • Tape measure across river (1) • One ranging pole on each bank (1) (iv) Two correct plots at Site 4 [3] Plot at 6.4/0.4 (1) Plot at 8.0/0.32 (1) Shade in cross-sectional area = 1 mark (v) 2.4 × 0.27 i.e. Width × average depth. [1] Accept international conventions i.e. · instead of × and , instead of decimal point. Ignore any calculated figure they provide
Mark scheme, page 3
Page 3 Mark Scheme Syllabus Paper Cambridge IGCSE – May/June 2016 0460 42 © Cambridge International Examinations 2016 (vi) ‘partially’ – 1 mark reserve. [3] Supports: Area increases from site 1 to site 5/ increases from 0.65 sq m to 5.93 sq m (1 max) Does not support: Area at site 6 is smaller than /decreases from site 5 / decreases to 3.57 sq m at site 6 from 5.93 sq m at site 5(1 max). If state 6 is anomaly need to give a reason why. (c) (i) Need to mention each piece of equipment once for each mark;1 MAX for each piece of equipment. [4] Examples Put poles/sticks/rods at fixed distance/ >5 up to 10 metres along river/at start and end of fixed distance (1 max) Use tape measure to measure a fixed distance/10 metres (1 max) Put orange in river at start of measured distance (1 max) Start stopwatch/timer/watch when orange/ball is put in river/ stopwatch/timer/watch measures time it takes to travel the measured distance / stop stopwatch/timer/watch when orange reaches end of measured distance (1max) (ii) Complete bar plot at 0.67 for site 6. No credit for shading. [1] (iii) Examples of evidence that does NOT support hypothesis. Can refer to any two sites that provide relevant evidence [3] • Velocity at sites 1 and 2 are identical (1) both are 0.29 m/s (1) • Velocity at site 3 faster than site 4 (1) with 0.58 m/s compared to 0.46 m/s (1) • Velocity is slowest at site 5 (1) being the lowest figure of 0.21 m/s all others are 0.29 m/s or higher (1) Credit paired data to 1 mark RESERVE and MAXIMUM. NOTE: there is no hypothesis mark here as the choice is given in the stem (d) (i) Plot data of 3.57 sq m (Area) and 0.67 m/sec for site 6 on scatter graph. [1] Plot must be an x with 6 written by it. (ii) Evidence for partial relationship. [3] There is a positive correlation between results at four sites OR refers to relationship at any three of sites 1236 that supports hypothesis (1) e.g. Site 2 area 1.15 sq m and velocity 0.29 m/s both increase at Site 6 to 3.57 sq m and 0.67 m/s (1)
Mark scheme, page 4
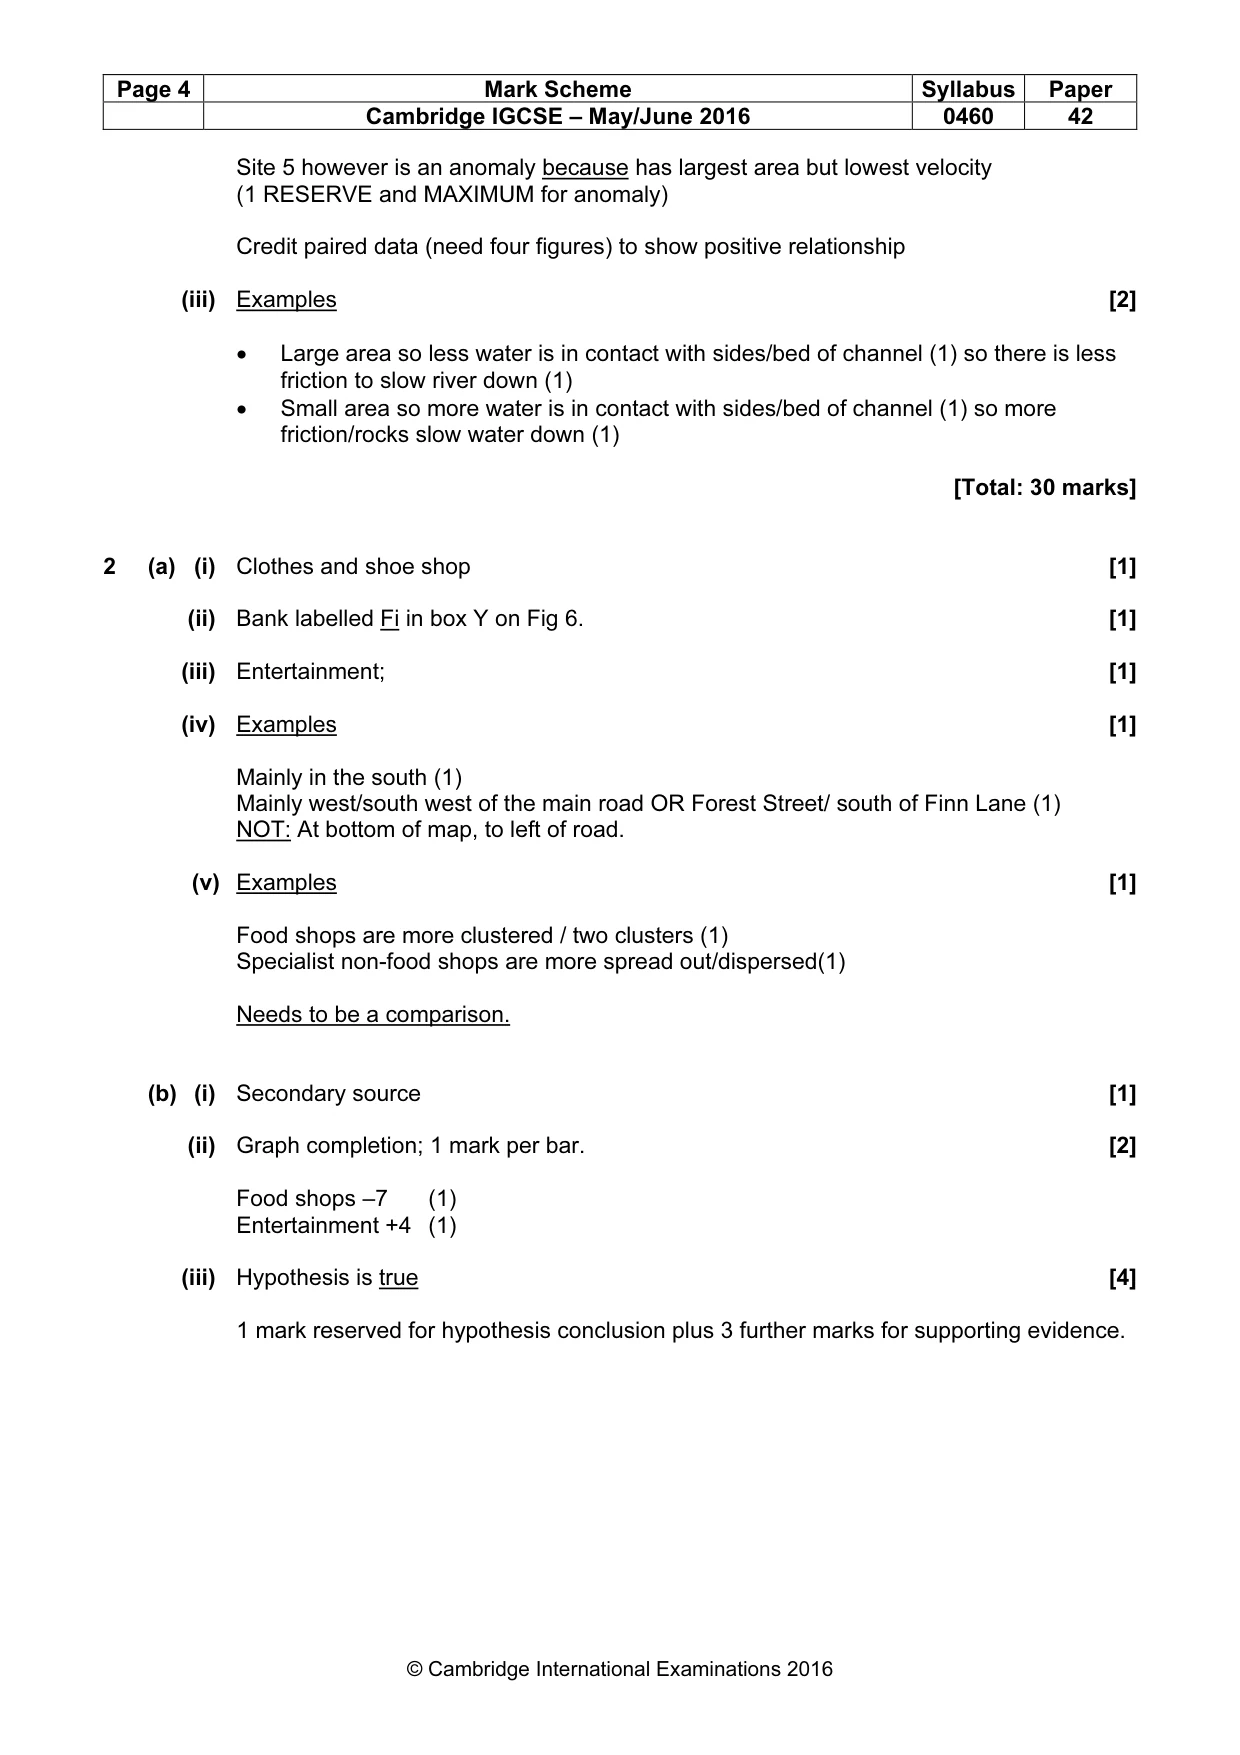
Page 4 Mark Scheme Syllabus Paper Cambridge IGCSE – May/June 2016 0460 42 © Cambridge International Examinations 2016 Site 5 however is an anomaly because has largest area but lowest velocity (1 RESERVE and MAXIMUM for anomaly) Credit paired data (need four figures) to show positive relationship (iii) Examples [2] • Large area so less water is in contact with sides/bed of channel (1) so there is less friction to slow river down (1) • Small area so more water is in contact with sides/bed of channel (1) so more friction/rocks slow water down (1) [Total: 30 marks] 2 (a) (i) Clothes and shoe shop [1] (ii) Bank labelled Fi in box Y on Fig 6. [1] (iii) Entertainment; [1] (iv) Examples [1] Mainly in the south (1) Mainly west/south west of the main road OR Forest Street/ south of Finn Lane (1) NOT: At bottom of map, to left of road. (v) Examples [1] Food shops are more clustered / two clusters (1) Specialist non-food shops are more spread out/dispersed(1) Needs to be a comparison. (b) (i) Secondary source [1] (ii) Graph completion; 1 mark per bar. [2] Food shops –7 (1) Entertainment +4 (1) (iii) Hypothesis is true [4] 1 mark reserved for hypothesis conclusion plus 3 further marks for supporting evidence.
Mark scheme, page 5
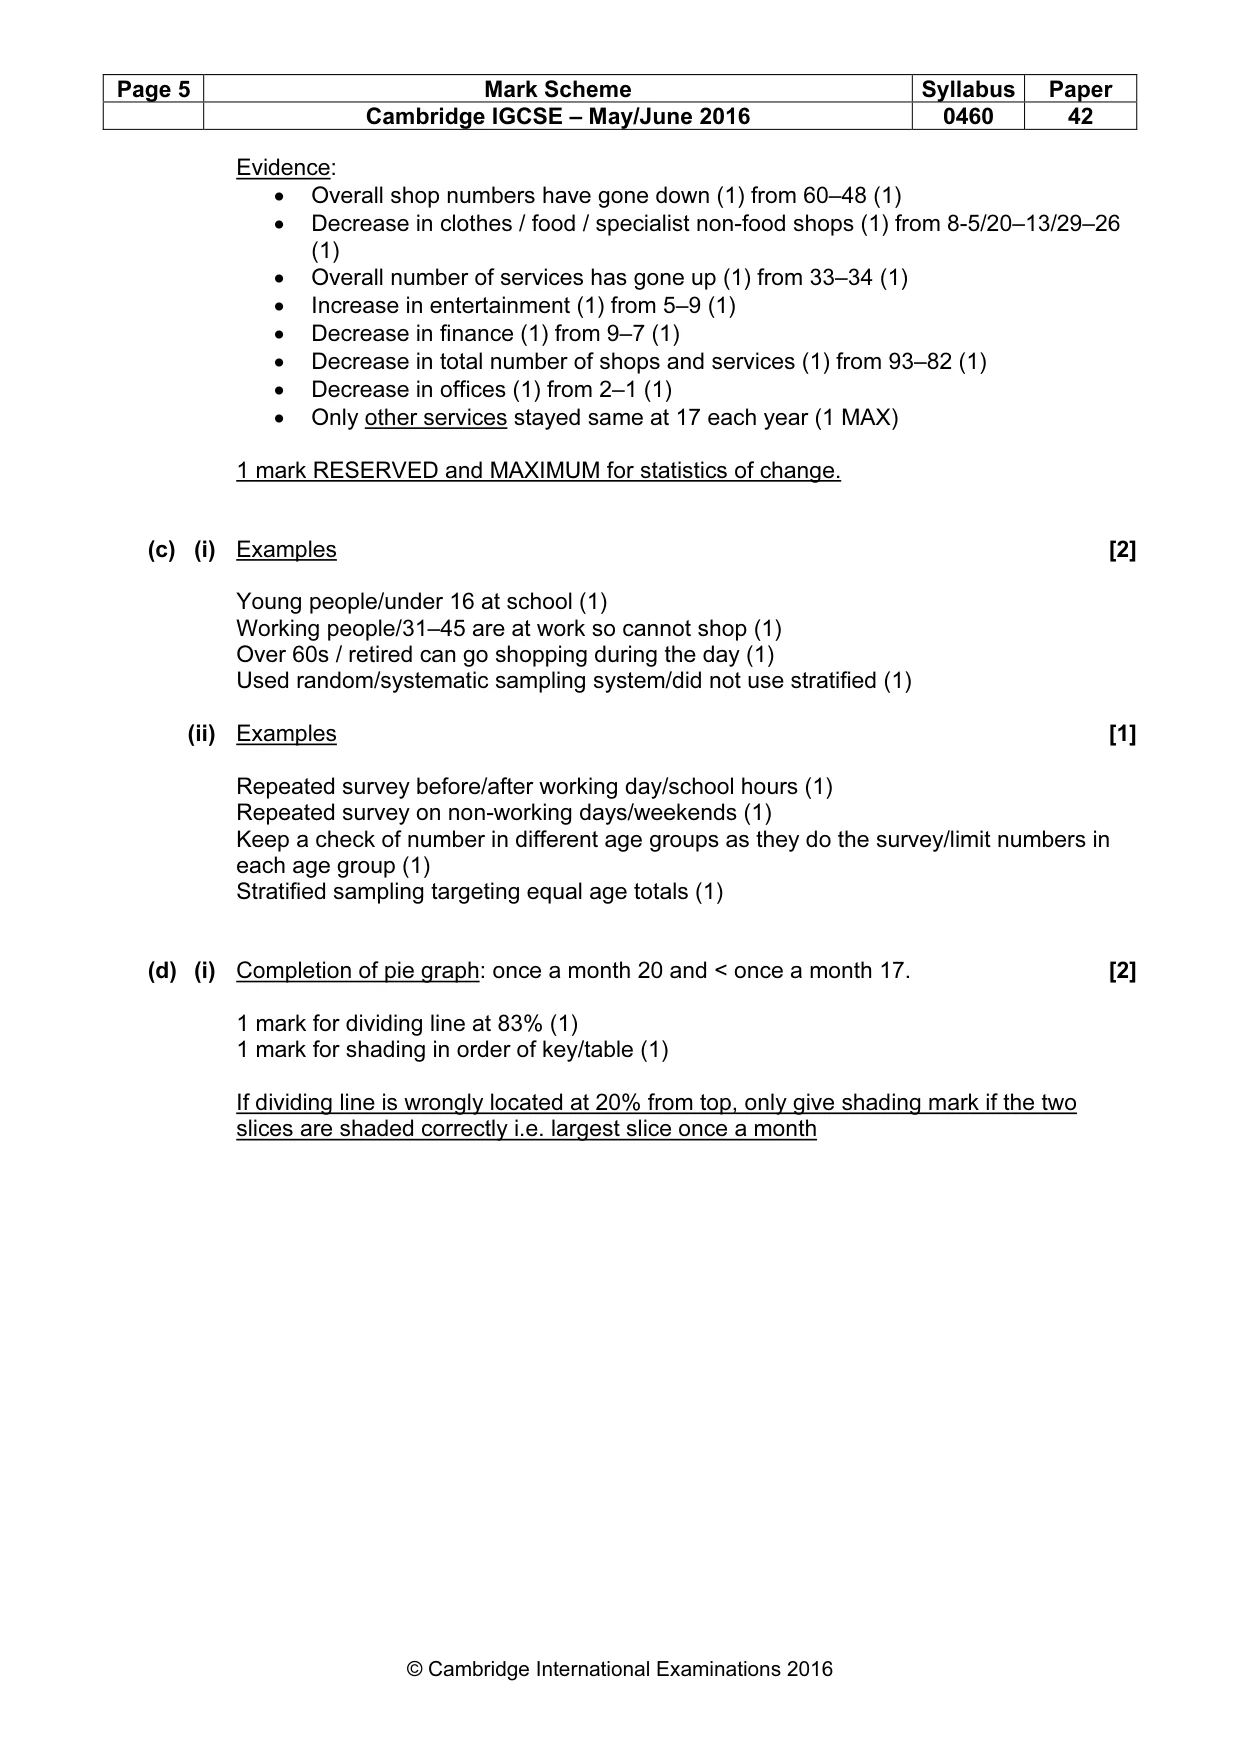
Page 5 Mark Scheme Syllabus Paper Cambridge IGCSE – May/June 2016 0460 42 © Cambridge International Examinations 2016 Evidence: • Overall shop numbers have gone down (1) from 60–48 (1) • Decrease in clothes / food / specialist non-food shops (1) from 8-5/20–13/29–26 (1) • Overall number of services has gone up (1) from 33–34 (1) • Increase in entertainment (1) from 5–9 (1) • Decrease in finance (1) from 9–7 (1) • Decrease in total number of shops and services (1) from 93–82 (1) • Decrease in offices (1) from 2–1 (1) • Only other services stayed same at 17 each year (1 MAX) 1 mark RESERVED and MAXIMUM for statistics of change. (c) (i) Examples [2] Young people/under 16 at school (1) Working people/31–45 are at work so cannot shop (1) Over 60s / retired can go shopping during the day (1) Used random/systematic sampling system/did not use stratified (1) (ii) Examples [1] Repeated survey before/after working day/school hours (1) Repeated survey on non-working days/weekends (1) Keep a check of number in different age groups as they do the survey/limit numbers in each age group (1) Stratified sampling targeting equal age totals (1) (d) (i) Completion of pie graph: once a month 20 and < once a month 17. [2] 1 mark for dividing line at 83% (1) 1 mark for shading in order of key/table (1) If dividing line is wrongly located at 20% from top, only give shading mark if the two slices are shaded correctly i.e. largest slice once a month
Mark scheme, page 6
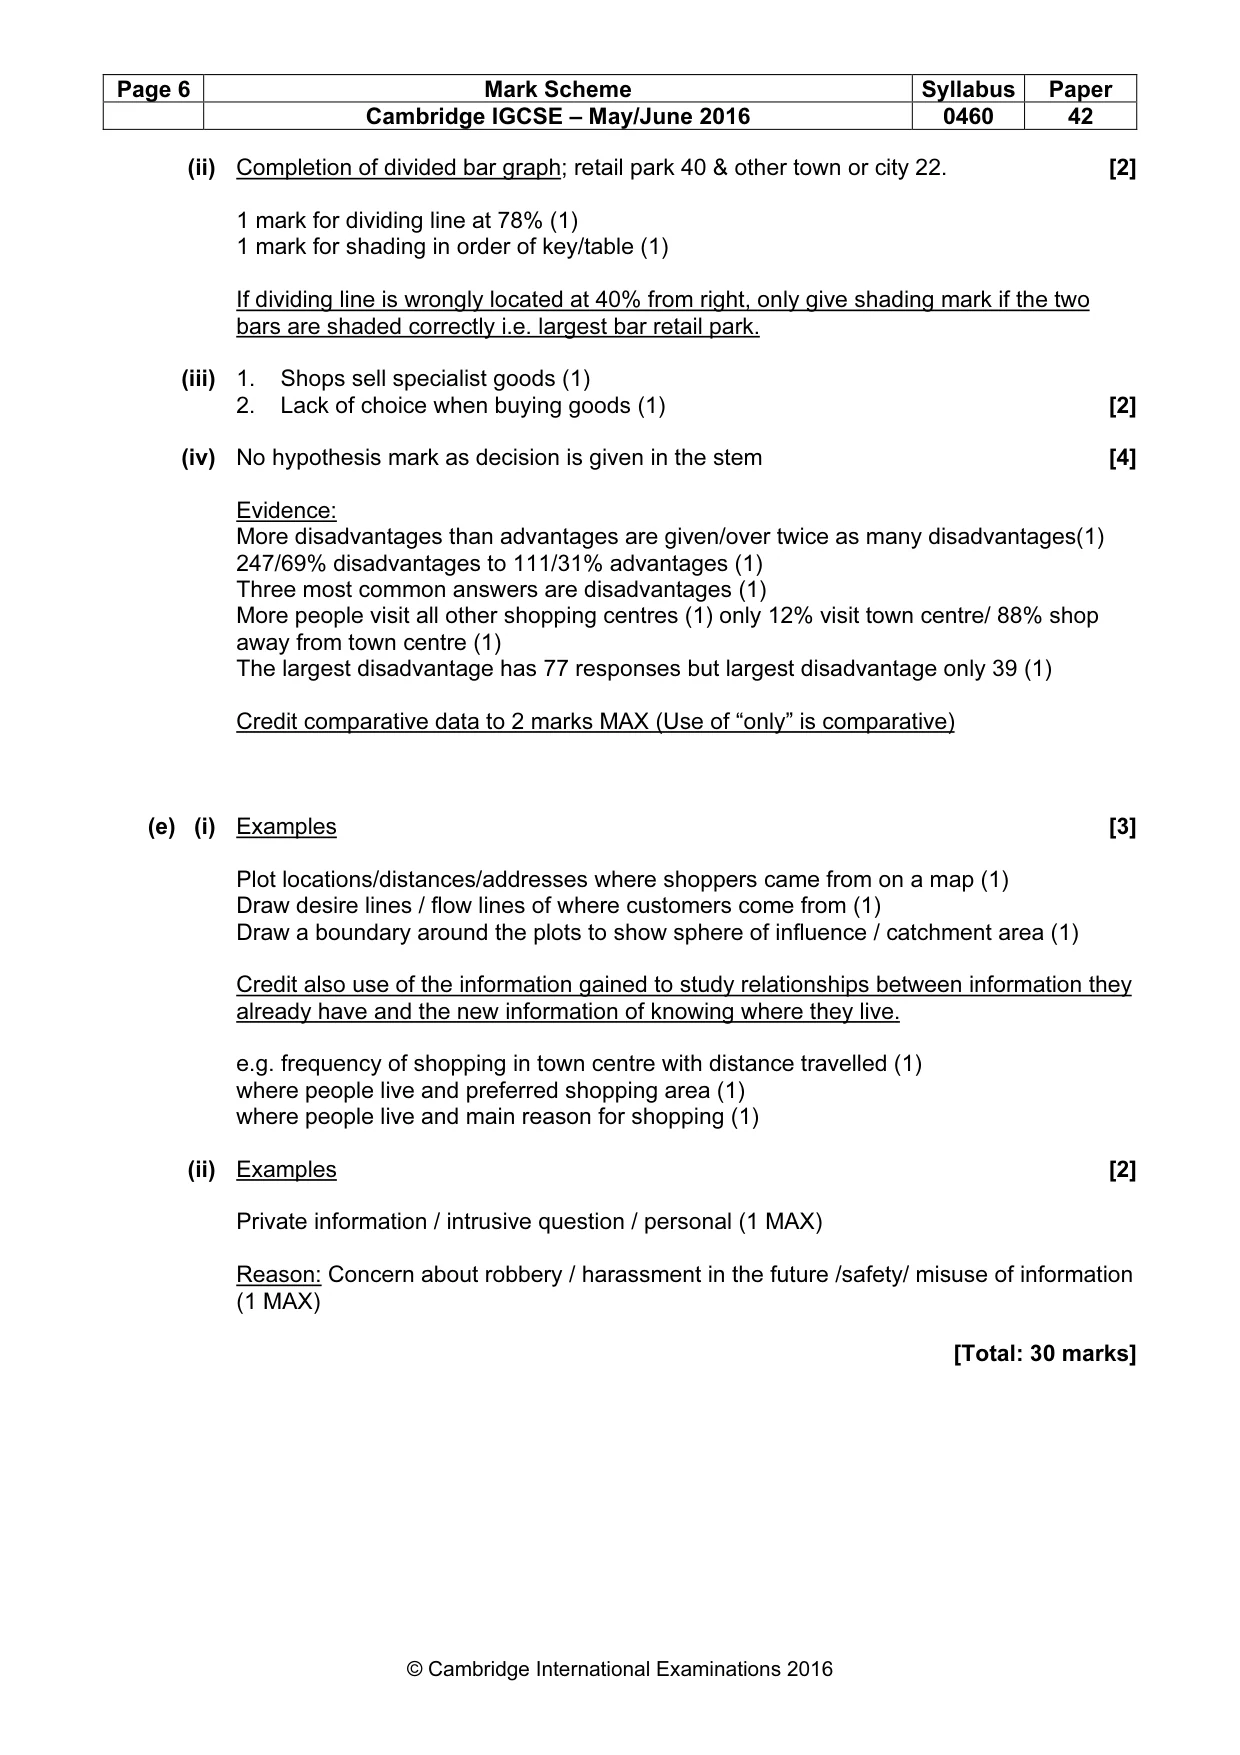
Page 6 Mark Scheme Syllabus Paper Cambridge IGCSE – May/June 2016 0460 42 © Cambridge International Examinations 2016 (ii) Completion of divided bar graph; retail park 40 & other town or city 22. [2] 1 mark for dividing line at 78% (1) 1 mark for shading in order of key/table (1) If dividing line is wrongly located at 40% from right, only give shading mark if the two bars are shaded correctly i.e. largest bar retail park. (iii) 1. Shops sell specialist goods (1) 2. Lack of choice when buying goods (1) [2] (iv) No hypothesis mark as decision is given in the stem [4] Evidence: More disadvantages than advantages are given/over twice as many disadvantages(1) 247/69% disadvantages to 111/31% advantages (1) Three most common answers are disadvantages (1) More people visit all other shopping centres (1) only 12% visit town centre/ 88% shop away from town centre (1) The largest disadvantage has 77 responses but largest disadvantage only 39 (1) Credit comparative data to 2 marks MAX (Use of “only” is comparative) (e) (i) Examples [3] Plot locations/distances/addresses where shoppers came from on a map (1) Draw desire lines / flow lines of where customers come from (1) Draw a boundary around the plots to show sphere of influence / catchment area (1) Credit also use of the information gained to study relationships between information they already have and the new information of knowing where they live. e.g. frequency of shopping in town centre with distance travelled (1) where people live and preferred shopping area (1) where people live and main reason for shopping (1) (ii) Examples [2] Private information / intrusive question / personal (1 MAX) Reason: Concern about robbery / harassment in the future /safety/ misuse of information (1 MAX) [Total: 30 marks]
What you needed in this session
Cambridge’s own grade thresholds for 2016 May/June, Paper 4 · Variant 2. A higher threshold means an easier paper — the bar moves with how the cohort did.