Cambridge IGCSE Geography 0460 — 2016 May/June Paper 2 · Variant 1
0460/21/M/J/16 · 60 marks · ≈68 min
The question paper and its mark scheme, free to read here and free to download. This is Cambridge’s own paper, exactly as it was sat.
Question paper20 pages
Mark scheme5 pages
Answers below. Sit the paper first if you are practising.
Paper as text
Question paper, page 1
This document consists of 19 printed pages, 1 blank page and 1 Insert. DC (NH/JG) 114178/6 © UCLES 2016 [Turn over * 4 5 4 7 5 5 0 1 7 9 * GEOGRAPHY 0460/21 Paper 2 May/June 2016 1 hour 30 minutes Candidates answer on the Question Paper. Additional Materials: Ruler Protractor Plain paper Calculator 1:25 000 Survey Map Extract is enclosed with this Question Paper. READ THESE INSTRUCTIONS FIRST Write your Centre number, candidate number and name in the spaces provided. Write in dark blue or black pen. You may use an HB pencil for any diagrams or graphs. Do not use staples, paper clips, glue or correction fluid. DO NOT WRITE IN ANY BARCODES. Write your answer to each question in the space provided. If additional space is required, you should use the lined pages at the end of this booklet. The question number(s) must be clearly shown. Answer all questions. The Insert contains Photograph A for Question 3, and Photographs B, C and D for Question 6. The Insert is not required by the Examiner. Sketch maps and diagrams should be drawn whenever they serve to illustrate an answer. At the end of the examination, fasten all your work securely together. The number of marks is given in brackets [ ] at the end of each question or part question. Definitions MEDCs – More Economically Developed Countries LEDCs – Less Economically Developed Countries The syllabus is approved for use in England, Wales and Northern Ireland as a Cambridge International Level 1/Level 2 Certificate. Cambridge International Examinations Cambridge International General Certificate of Secondary Education
Question paper, page 2
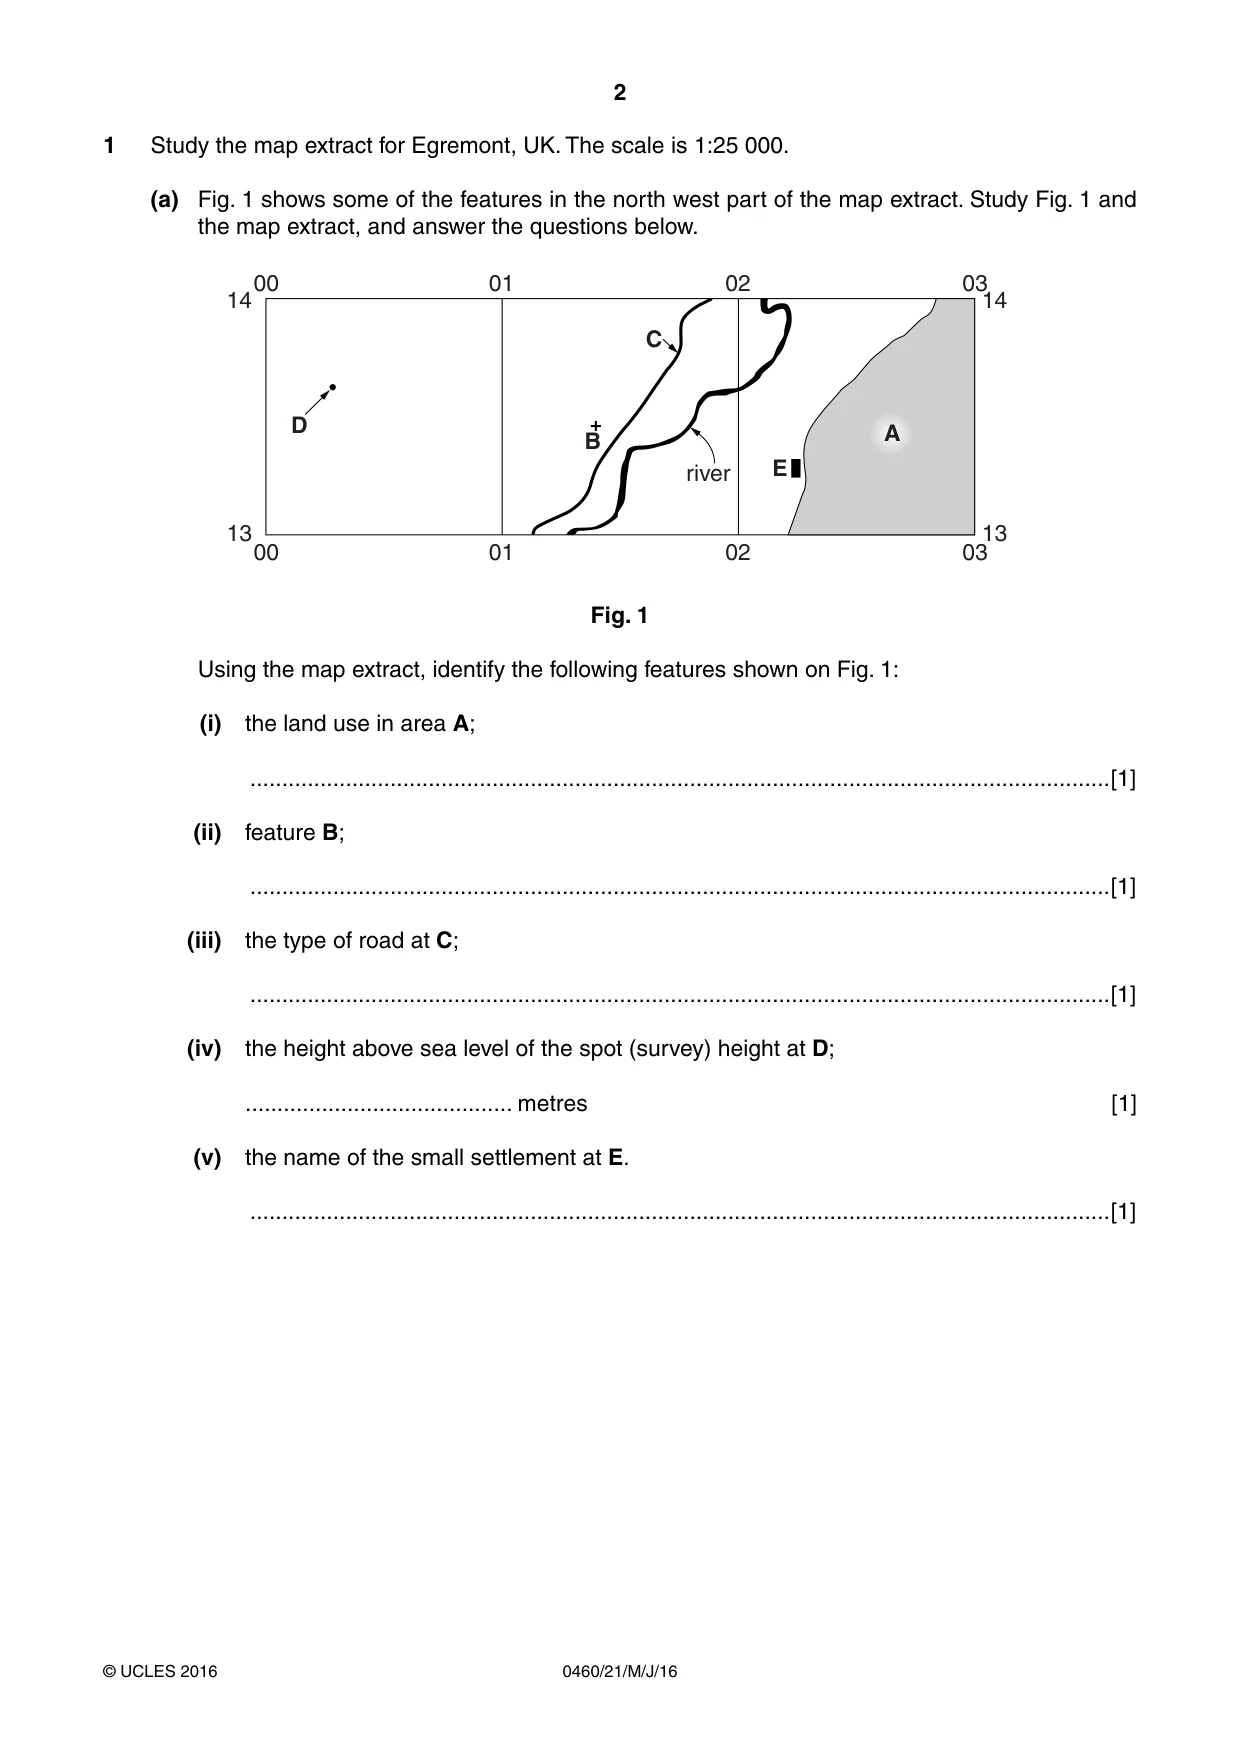
2 0460/21/M/J/16 © UCLES 2016 1 Study the map extract for Egremont, UK. The scale is 1:25 000. (a) Fig. 1 shows some of the features in the north west part of the map extract. Study Fig. 1 and the map extract, and answer the questions below. B E C 00 01 02 03 00 01 02 03 D A river 14 13 14 13 Fig. 1 Using the map extract, identify the following features shown on Fig. 1: (i) the land use in area A; …[1] (ii) feature B; …[1] (iii) the type of road at C; …[1] (iv) the height above sea level of the spot (survey) height at D; … metres [1] (v) the name of the small settlement at E. …[1]
Question paper, page 3
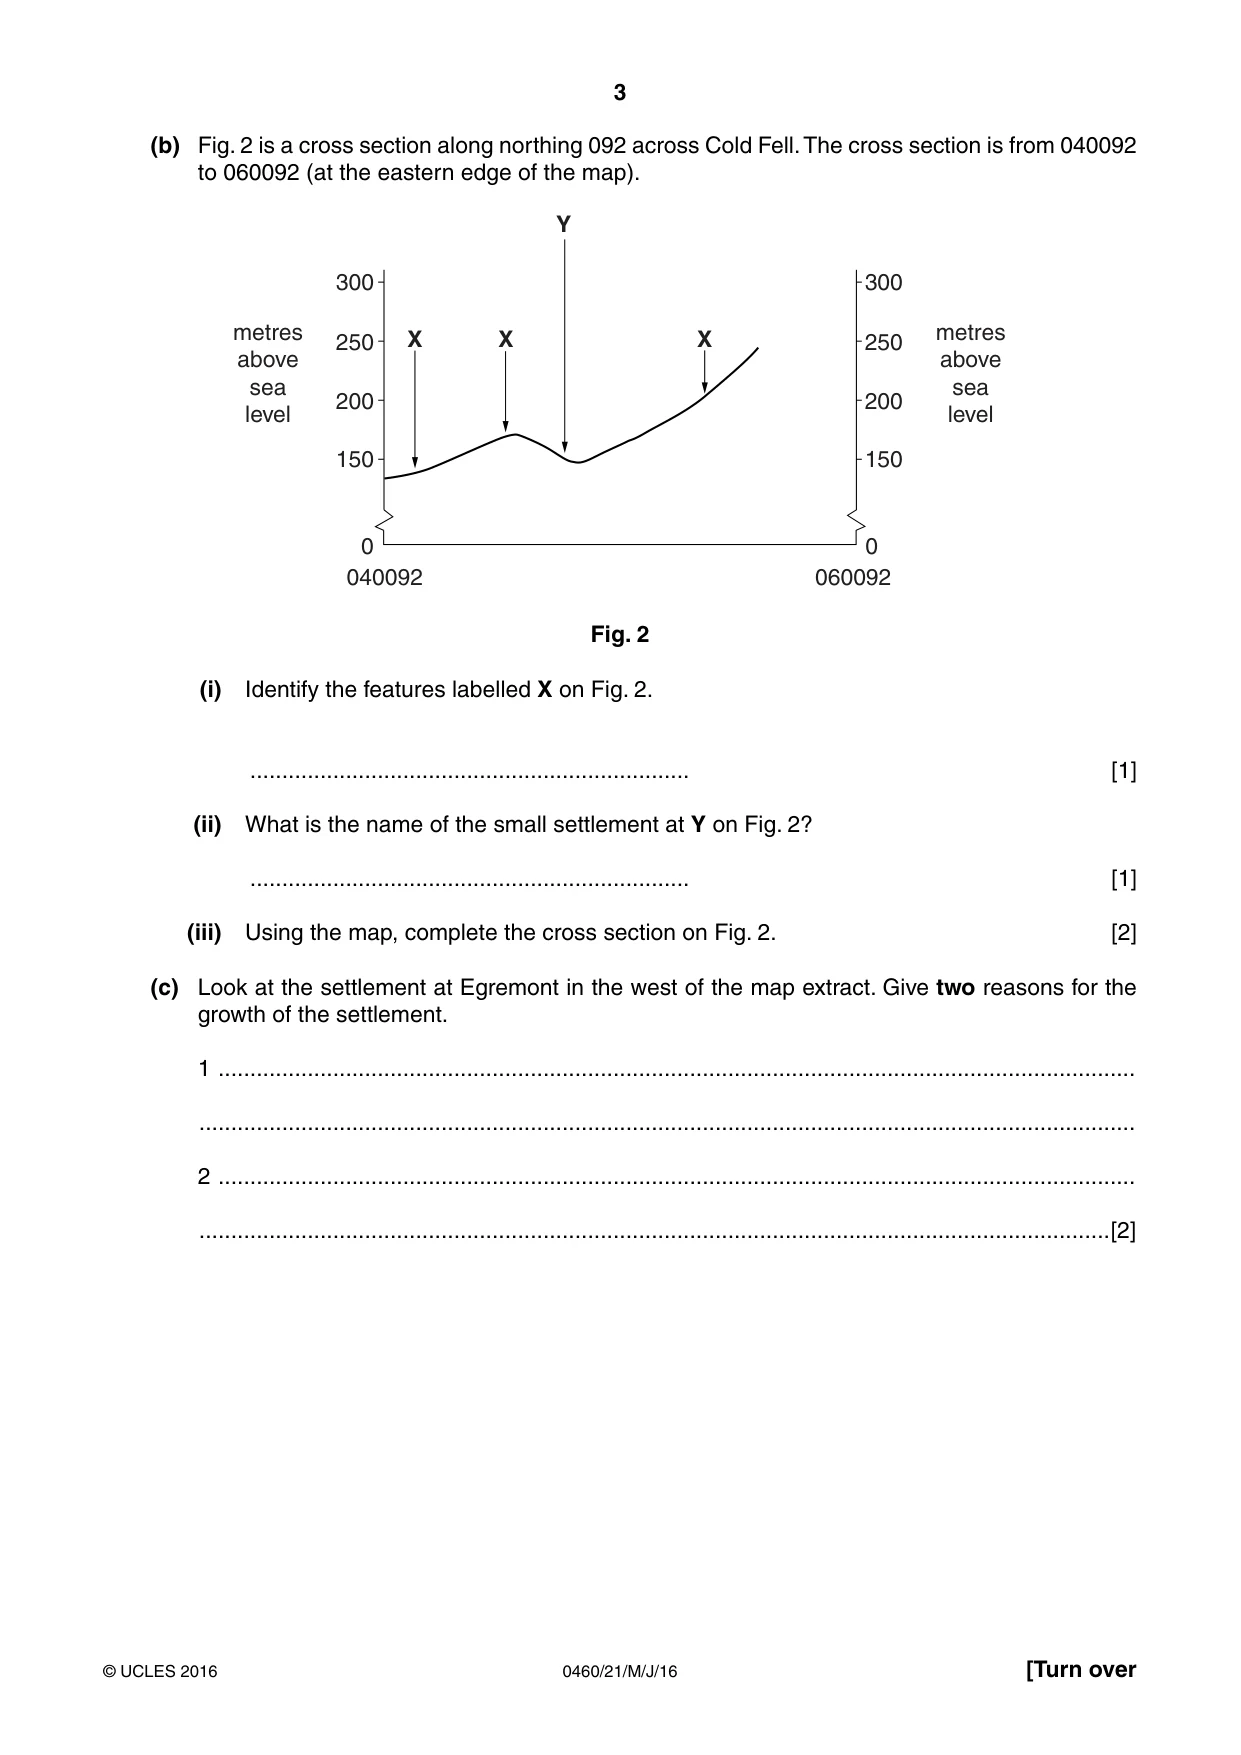
3 0460/21/M/J/16 © UCLES 2016 [Turn over (b) Fig. 2 is a cross section along northing 092 across Cold Fell. The cross section is from 040092 to 060092 (at the eastern edge of the map). 300 250 200 150 metres above sea level metres above sea level 300 X X X Y 250 200 150 0 0 040092 060092 Fig. 2 (i) Identify the features labelled X on Fig. 2. … [1] (ii) What is the name of the small settlement at Y on Fig. 2? … [1] (iii) Using the map, complete the cross section on Fig. 2. [2] (c) Look at the settlement at Egremont in the west of the map extract. Give two reasons for the growth of the settlement. 1 … … 2 … …[2]
Question paper, page 4
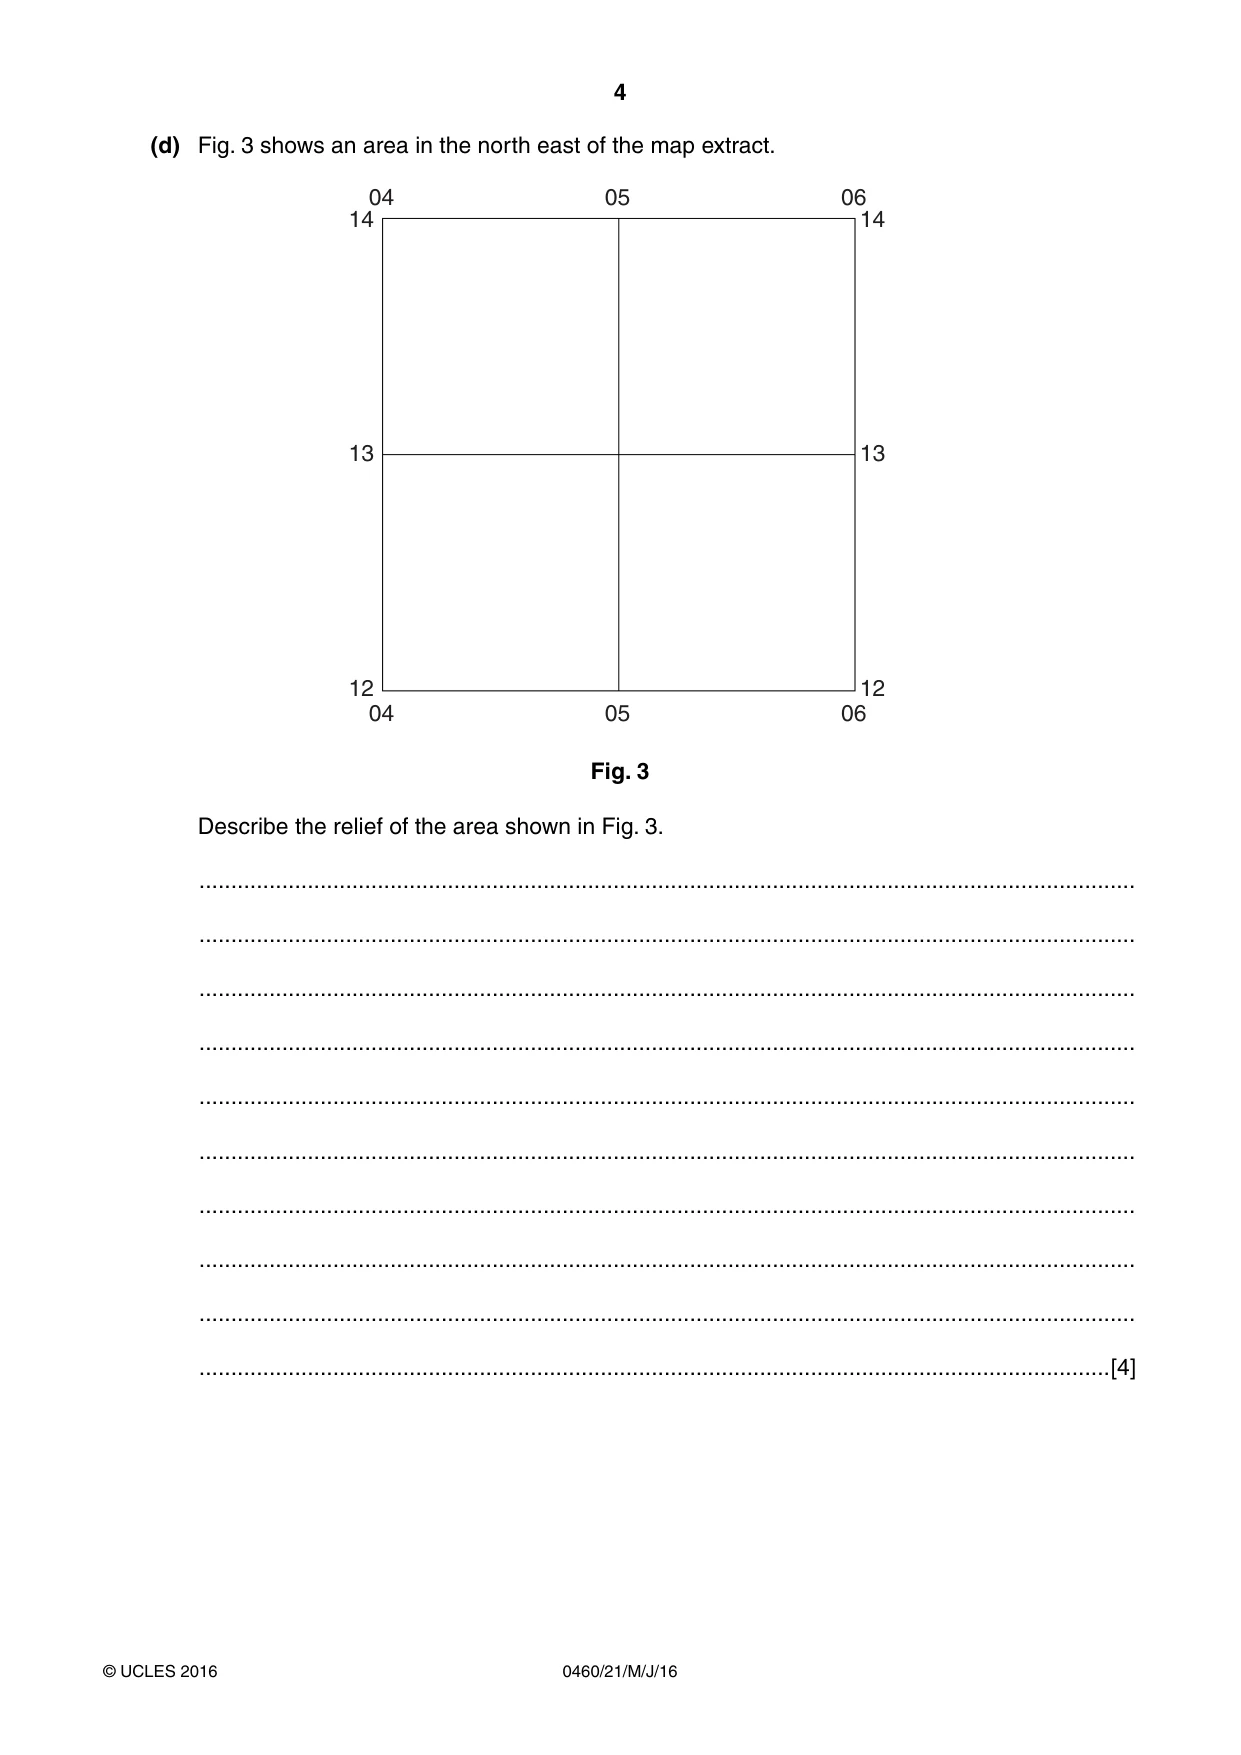
4 0460/21/M/J/16 © UCLES 2016 (d) Fig. 3 shows an area in the north east of the map extract. 04 05 06 04 05 06 12 13 14 12 13 14 Fig. 3 Describe the relief of the area shown in Fig. 3. … … … … … … … … … …[4]
Question paper, page 5
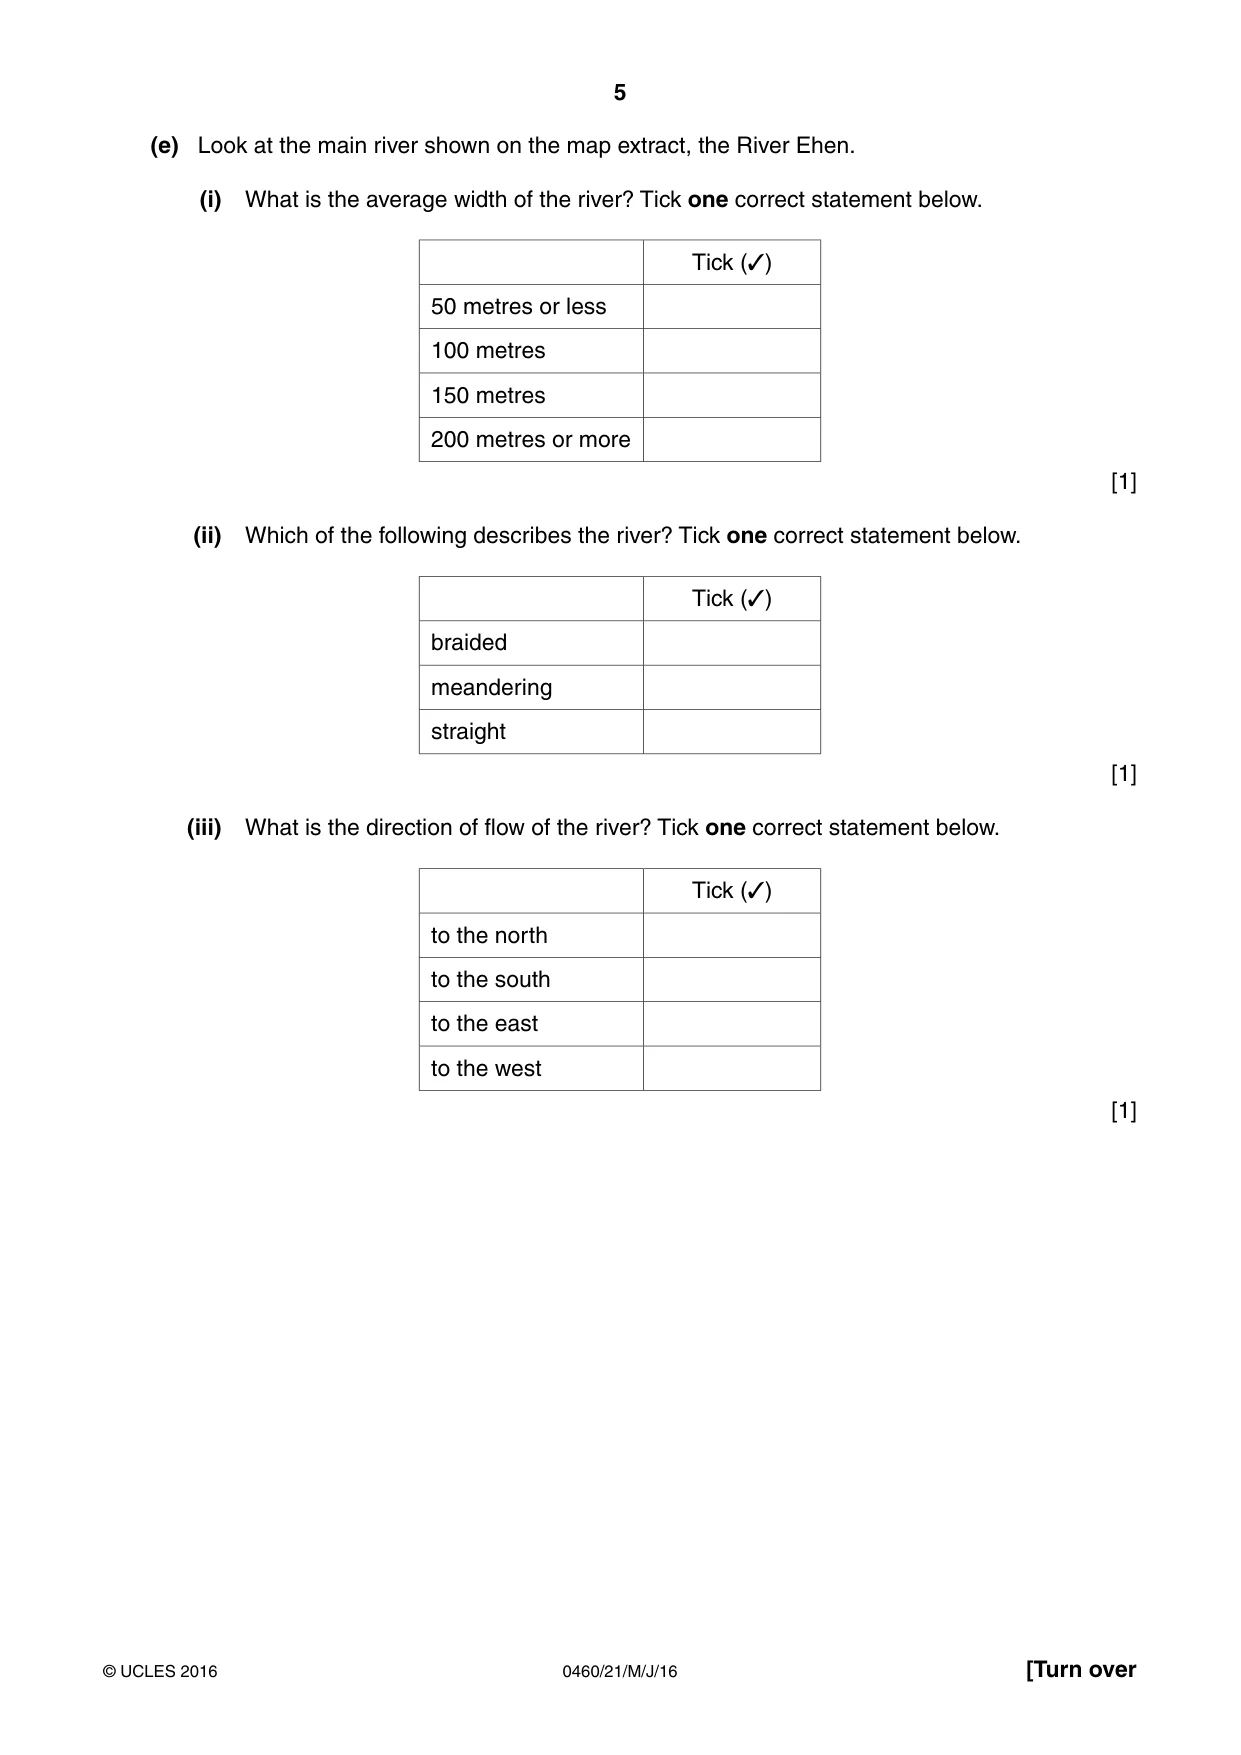
5 0460/21/M/J/16 © UCLES 2016 [Turn over (e) Look at the main river shown on the map extract, the River Ehen. (i) What is the average width of the river? Tick one correct statement below. Tick (✓) 50 metres or less 100 metres 150 metres 200 metres or more [1] (ii) Which of the following describes the river? Tick one correct statement below. Tick (✓) braided meandering straight [1] (iii) What is the direction of flow of the river? Tick one correct statement below. Tick (✓) to the north to the south to the east to the west [1]
Question paper, page 6
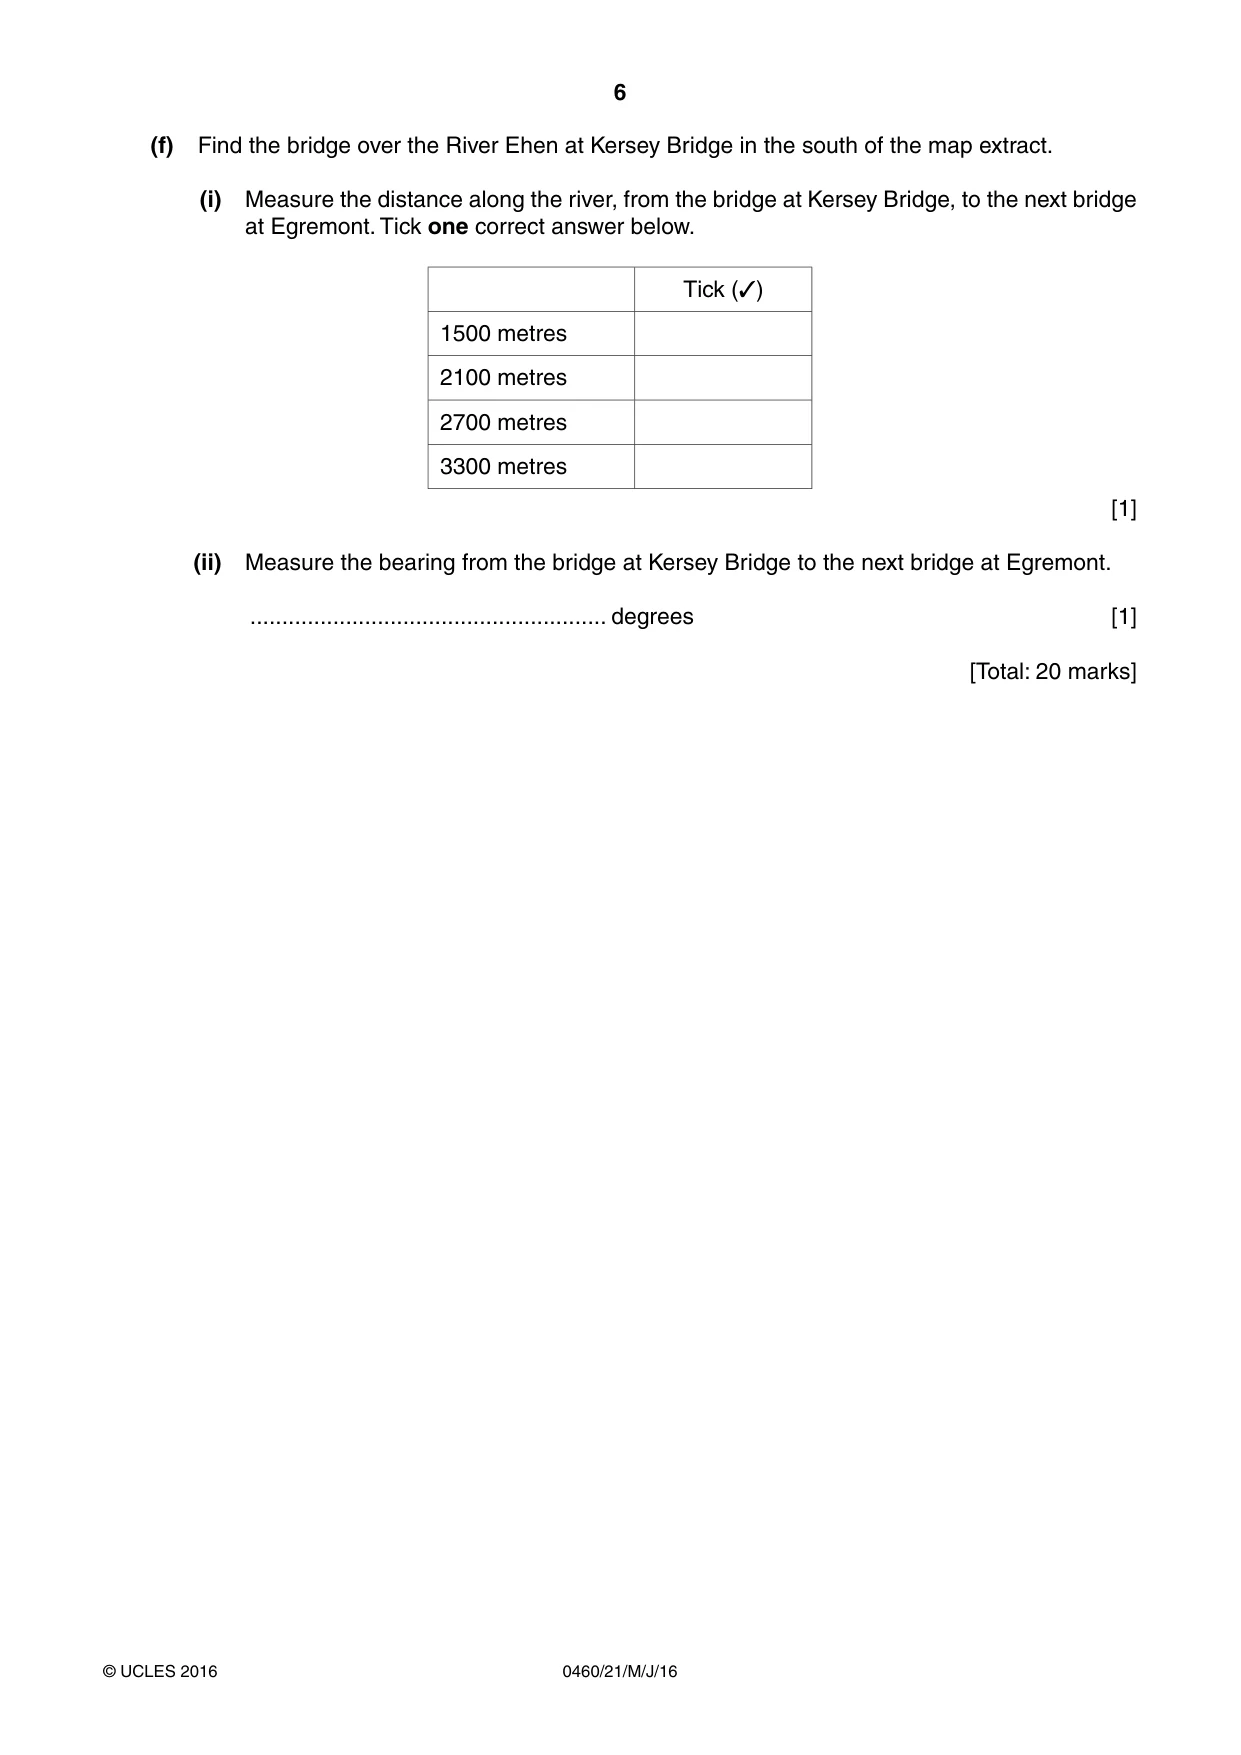
6 0460/21/M/J/16 © UCLES 2016 (f) Find the bridge over the River Ehen at Kersey Bridge in the south of the map extract. (i) Measure the distance along the river, from the bridge at Kersey Bridge, to the next bridge at Egremont. Tick one correct answer below. Tick (✓) 1500 metres 2100 metres 2700 metres 3300 metres [1] (ii) Measure the bearing from the bridge at Kersey Bridge to the next bridge at Egremont. … degrees [1] [Total: 20 marks]
Question paper, page 7
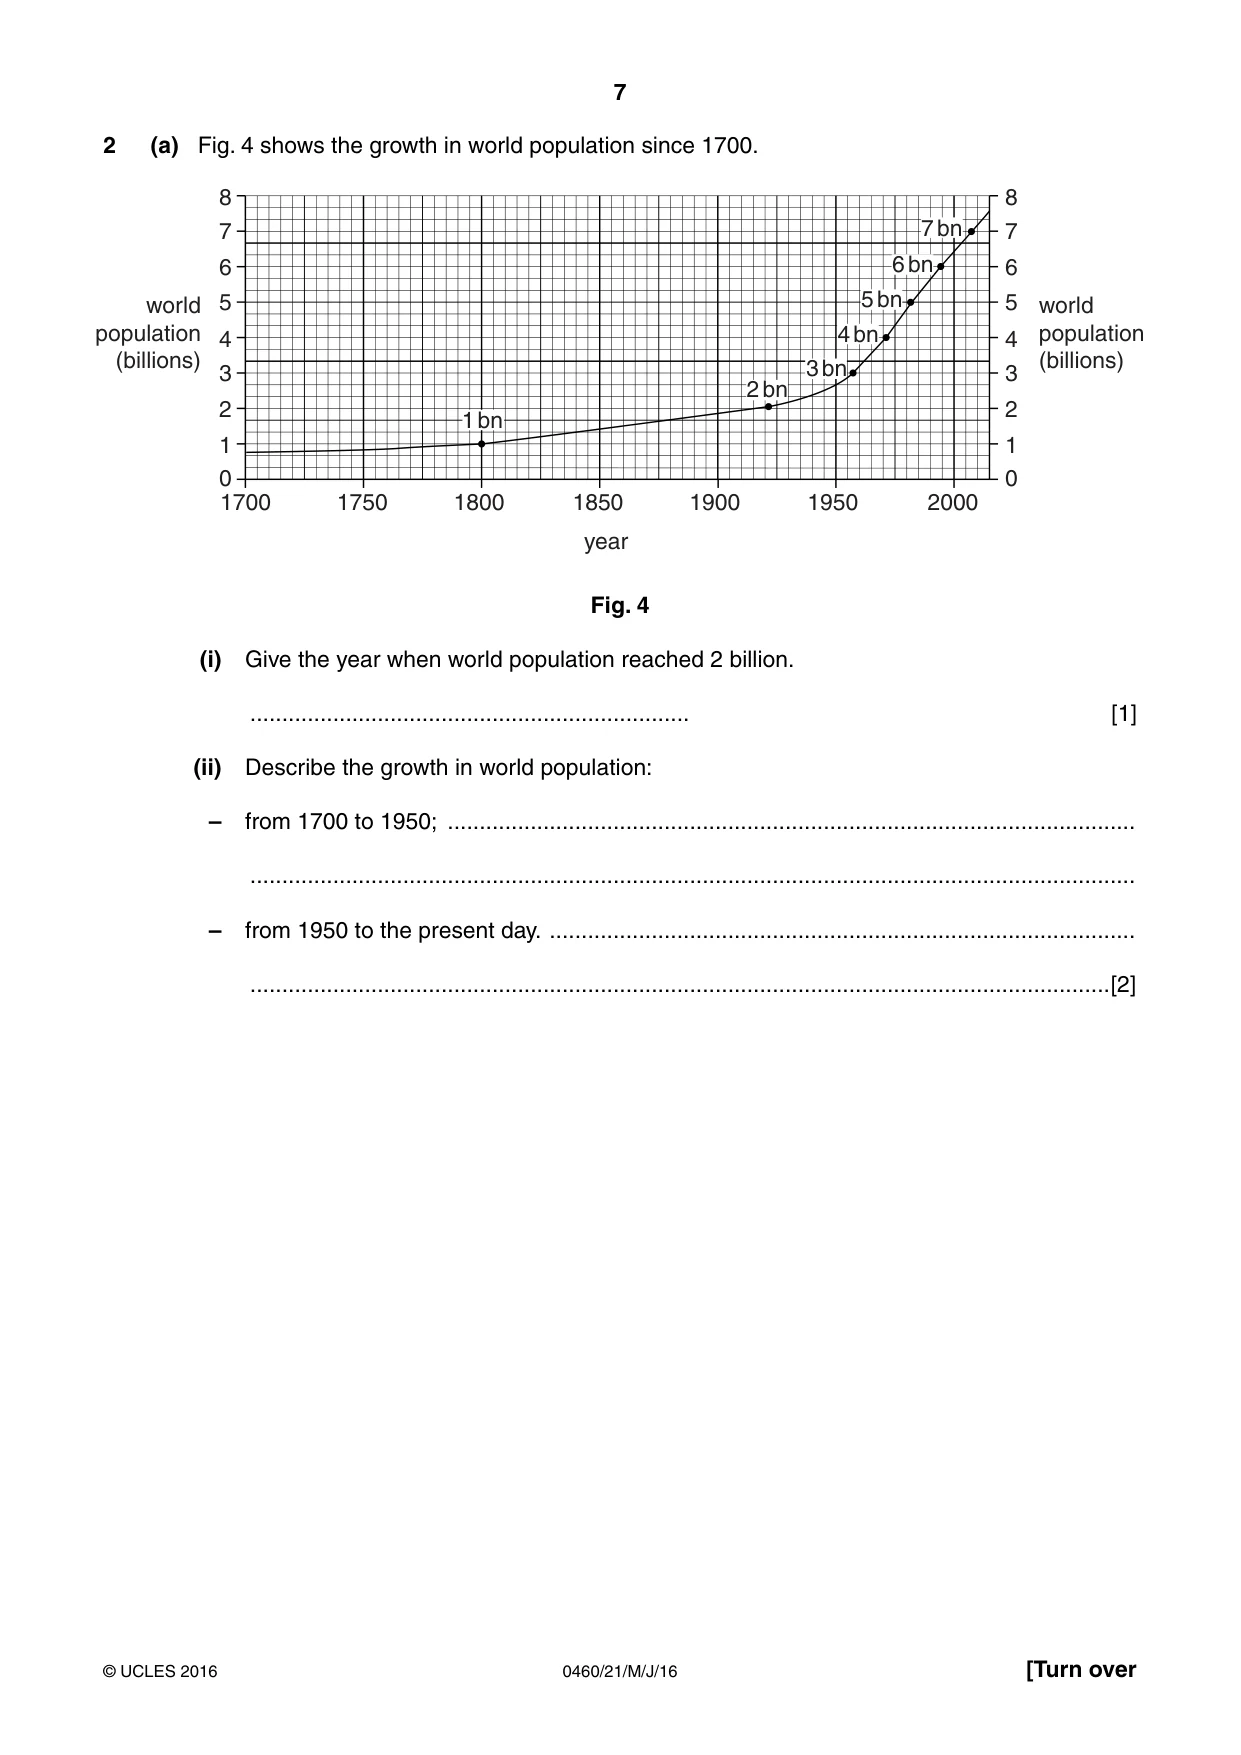
7 0460/21/M/J/16 © UCLES 2016 [Turn over 2 (a) Fig. 4 shows the growth in world population since 1700. 1700 1750 1800 1850 1900 1950 2000 year 7 bn 1 bn 2 bn 3 bn 4 bn 5 bn 6 bn 7 bn 8 7 6 5 4 3 2 1 0 8 7 6 5 4 3 2 1 0 world population (billions) world population (billions) Fig. 4 (i) Give the year when world population reached 2 billion. … [1] (ii) Describe the growth in world population: – from 1700 to 1950; … … – from 1950 to the present day. … …[2]
Question paper, page 8
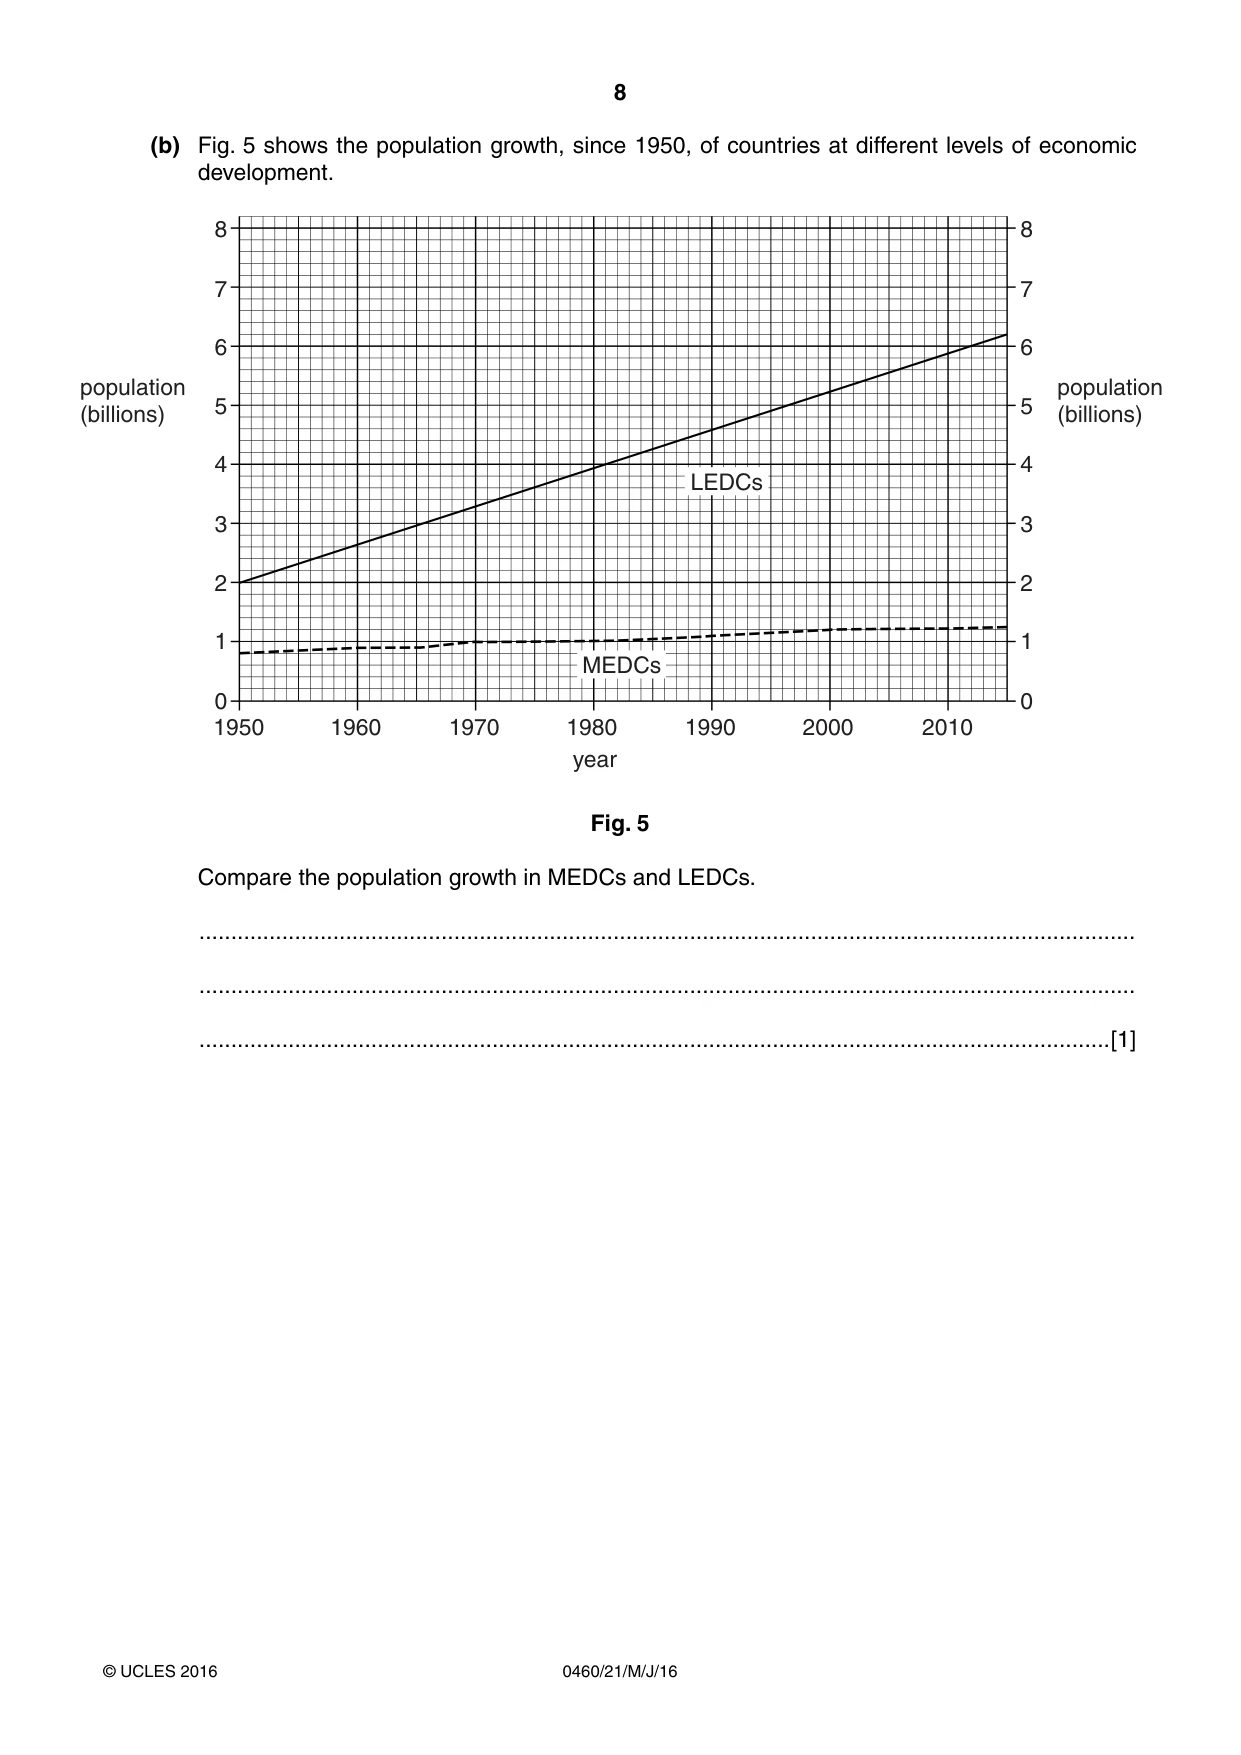
8 0460/21/M/J/16 © UCLES 2016 (b) Fig. 5 shows the population growth, since 1950, of countries at different levels of economic development. 8 7 6 5 4 3 2 1 0 8 7 6 5 4 3 2 1 0 1950 1960 1970 1980 1990 2000 2010 year population (billions) population (billions) LEDCs MEDCs Fig. 5 Compare the population growth in MEDCs and LEDCs. … … …[1]
Question paper, page 9
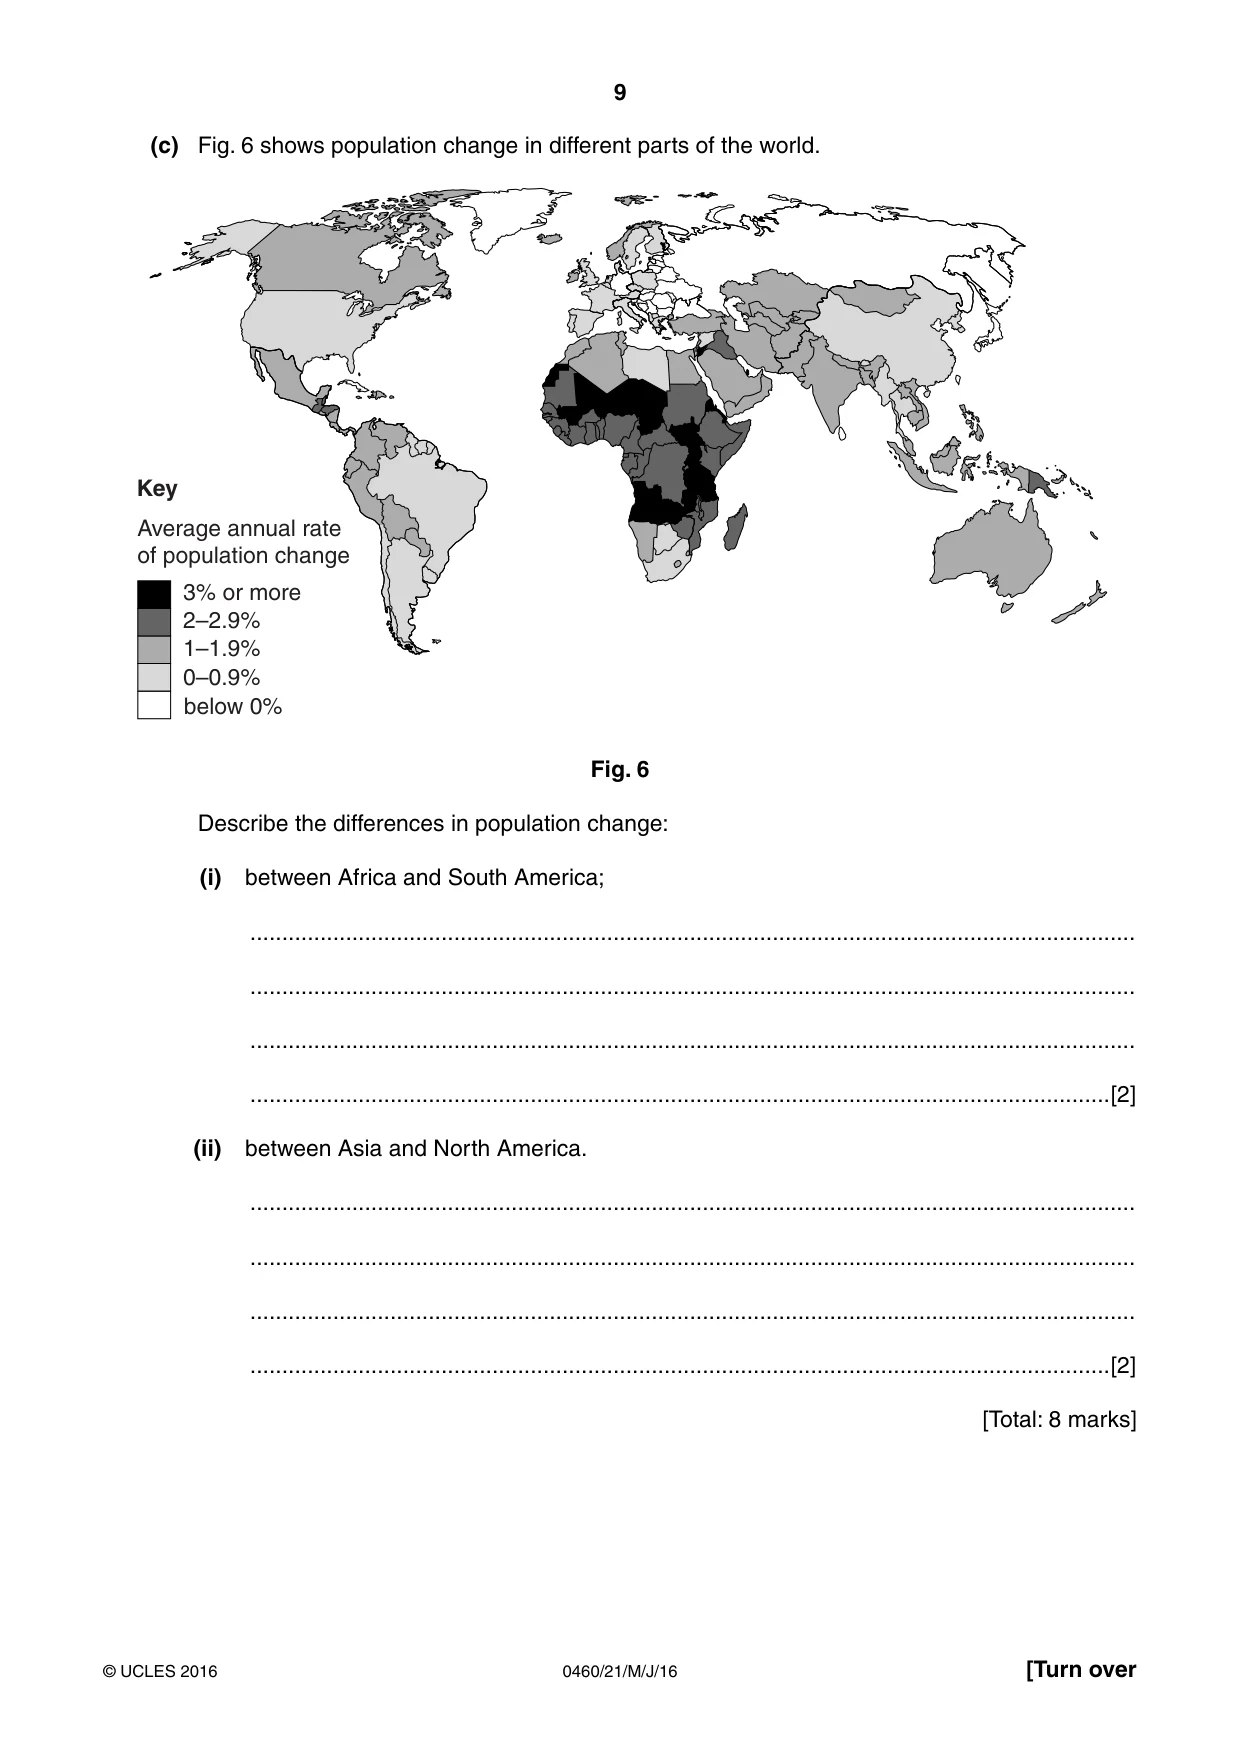
9 0460/21/M/J/16 © UCLES 2016 [Turn over (c) Fig. 6 shows population change in different parts of the world. Average annual rate of population change 0–0.9% 1–1.9% 2–2.9% 3% or more below 0% Key Fig. 6 Describe the differences in population change: (i) between Africa and South America; … … … …[2] (ii) between Asia and North America. … … … …[2] [Total: 8 marks]
Question paper, page 10
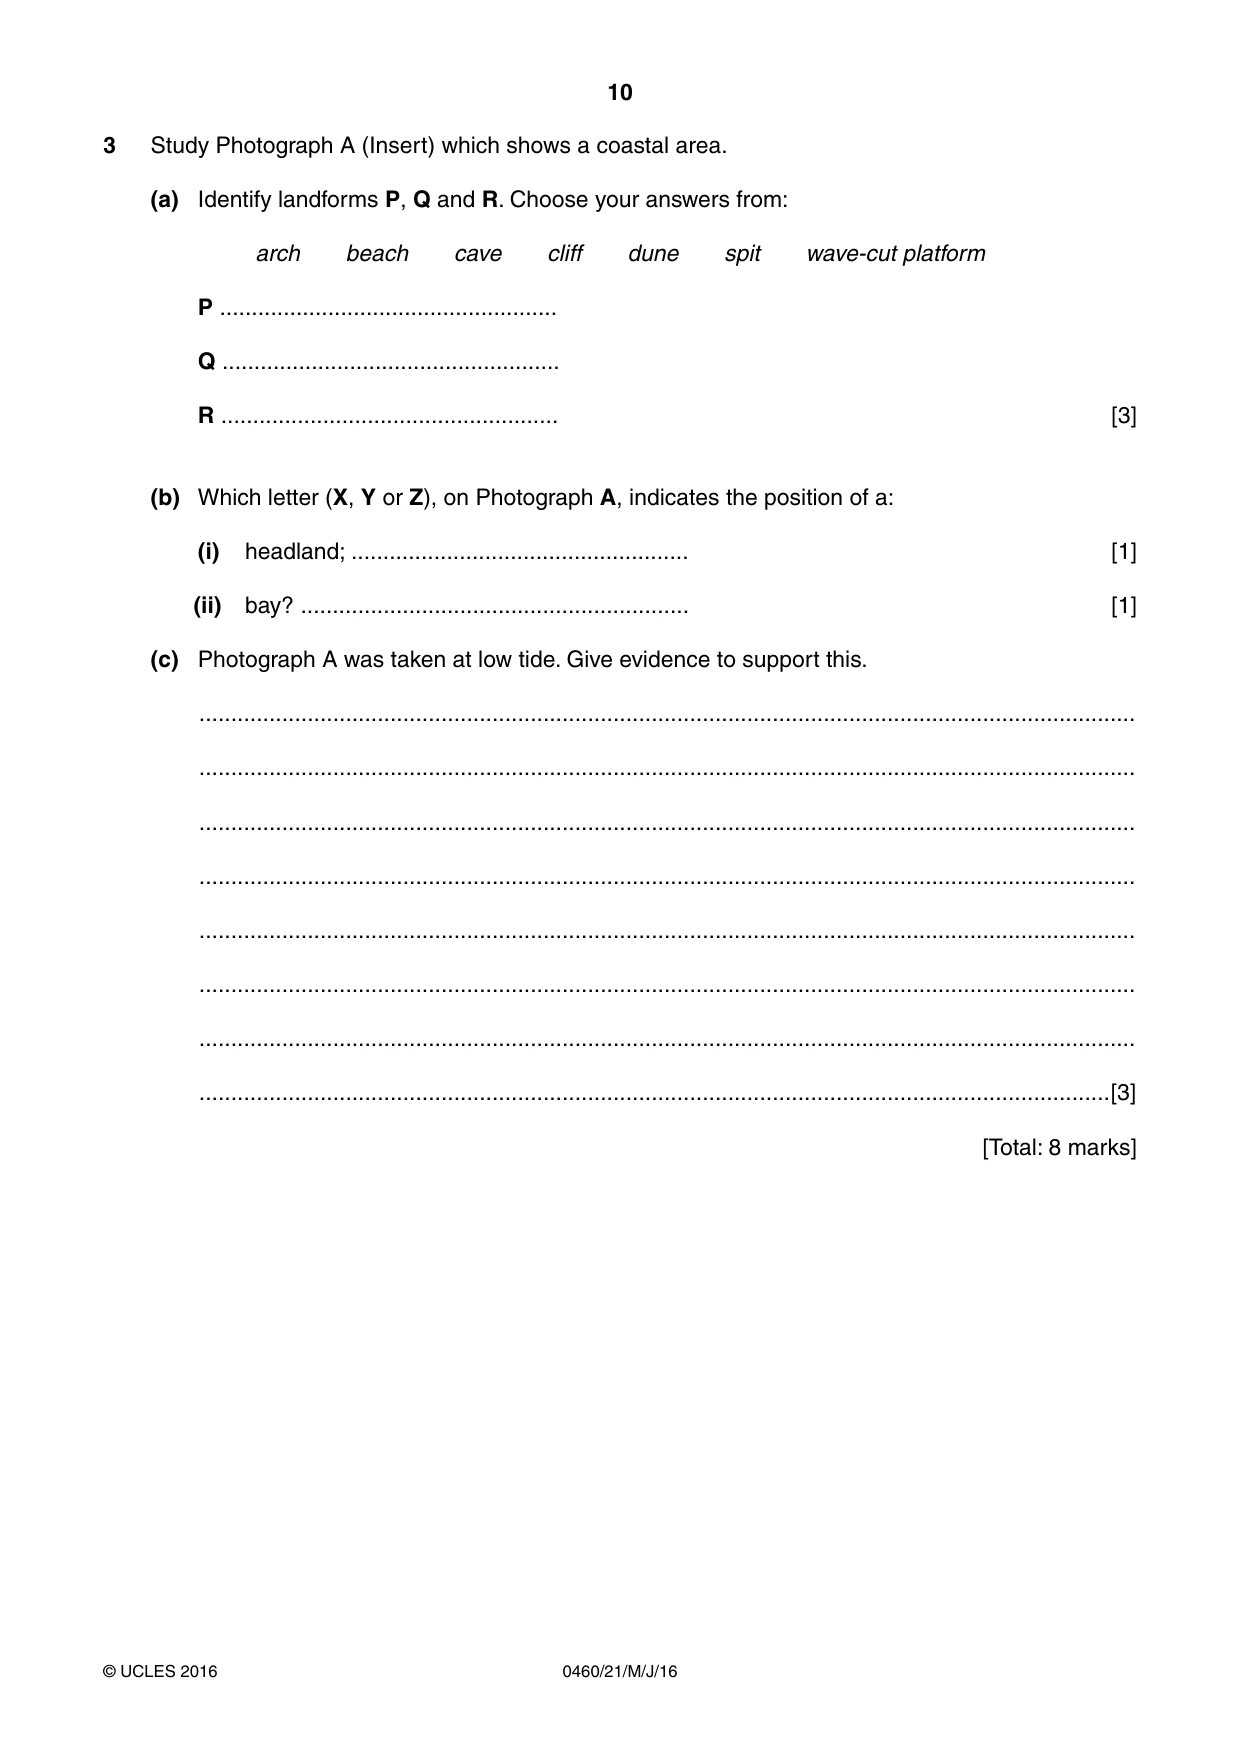
10 0460/21/M/J/16 © UCLES 2016 3 Study Photograph A (Insert) which shows a coastal area. (a) Identify landforms P, Q and R. Choose your answers from: arch beach cave cliff dune spit wave-cut platform P … Q … R … [3] (b) Which letter (X, Y or Z), on Photograph A, indicates the position of a: (i) headland; … [1] (ii) bay? … [1] (c) Photograph A was taken at low tide. Give evidence to support this. … … … … … … … …[3] [Total: 8 marks]
Question paper, page 11
11 0460/21/M/J/16 © UCLES 2016 [Turn over TURN PAGE FOR QUESTION 4
Question paper, page 12
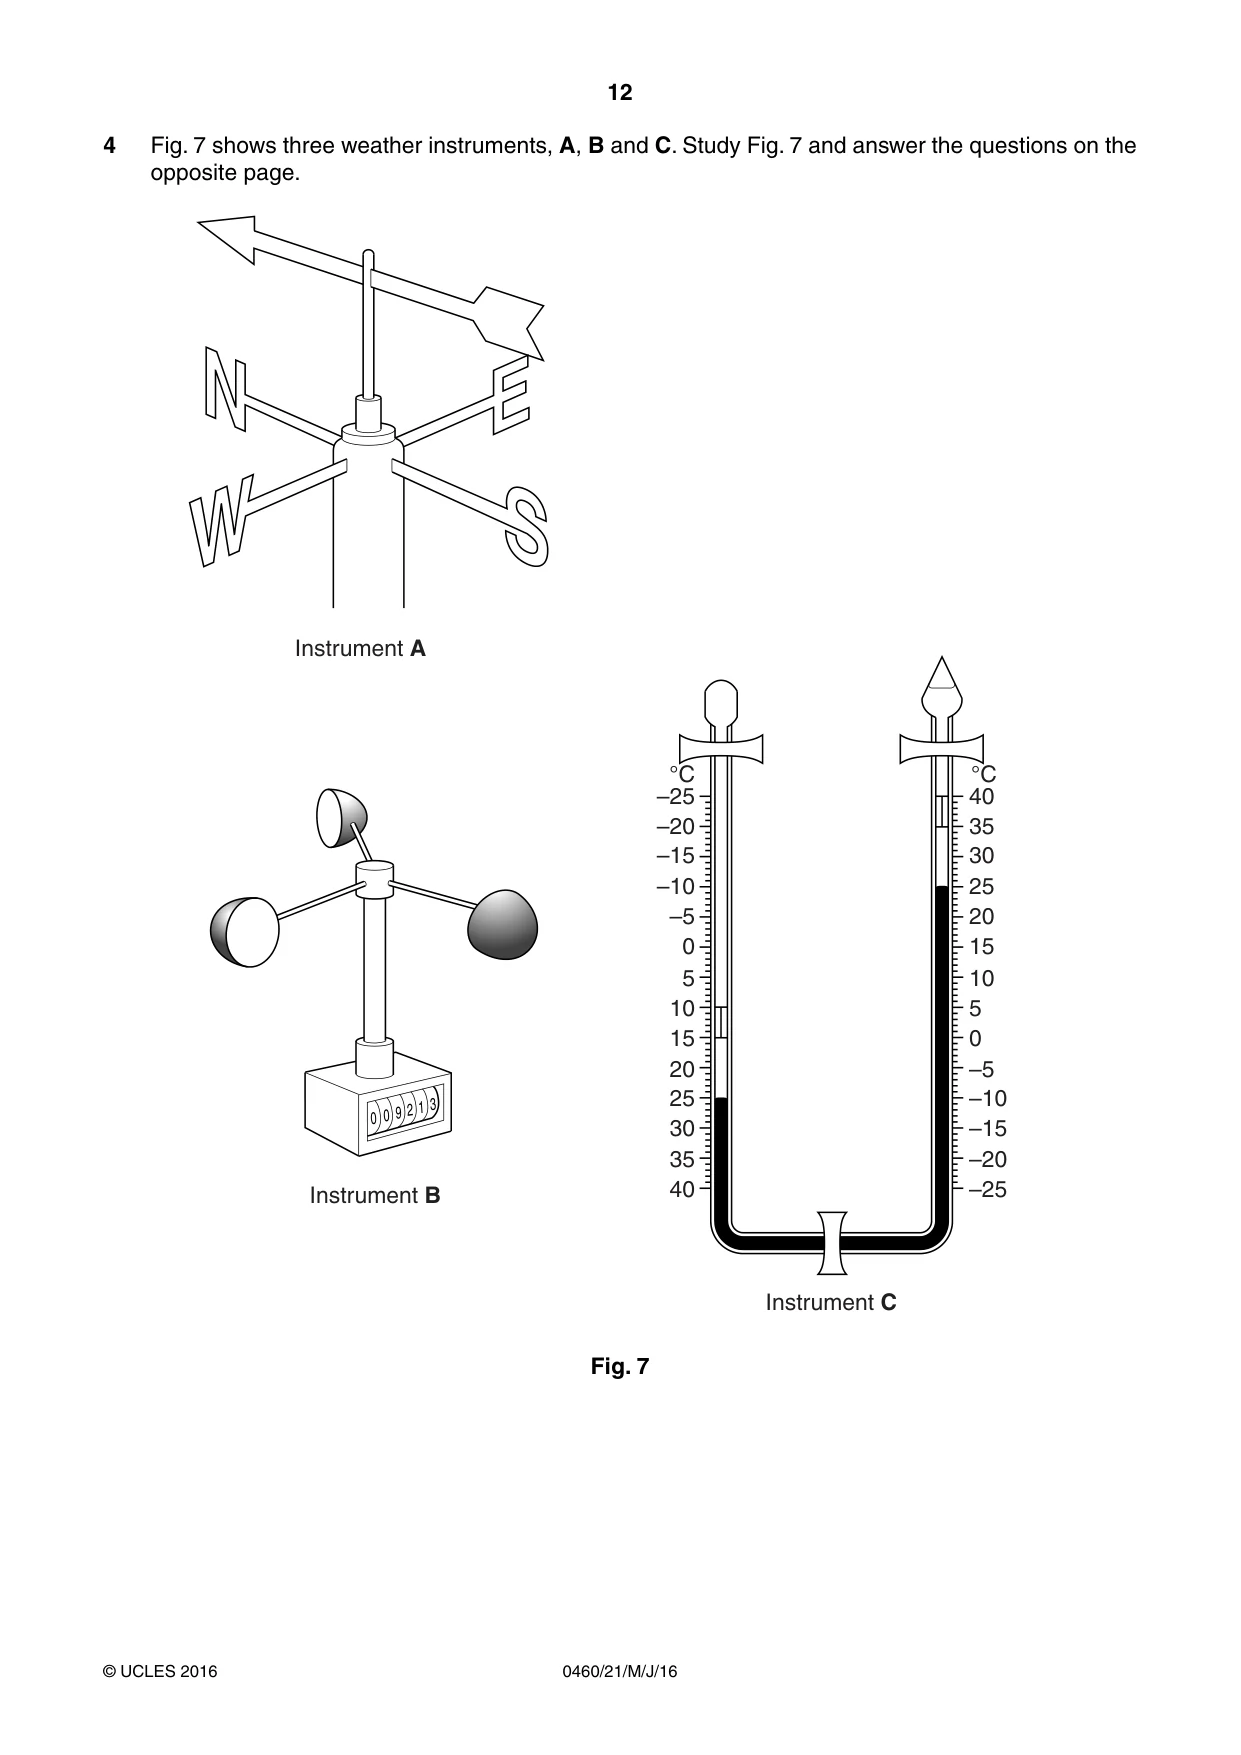
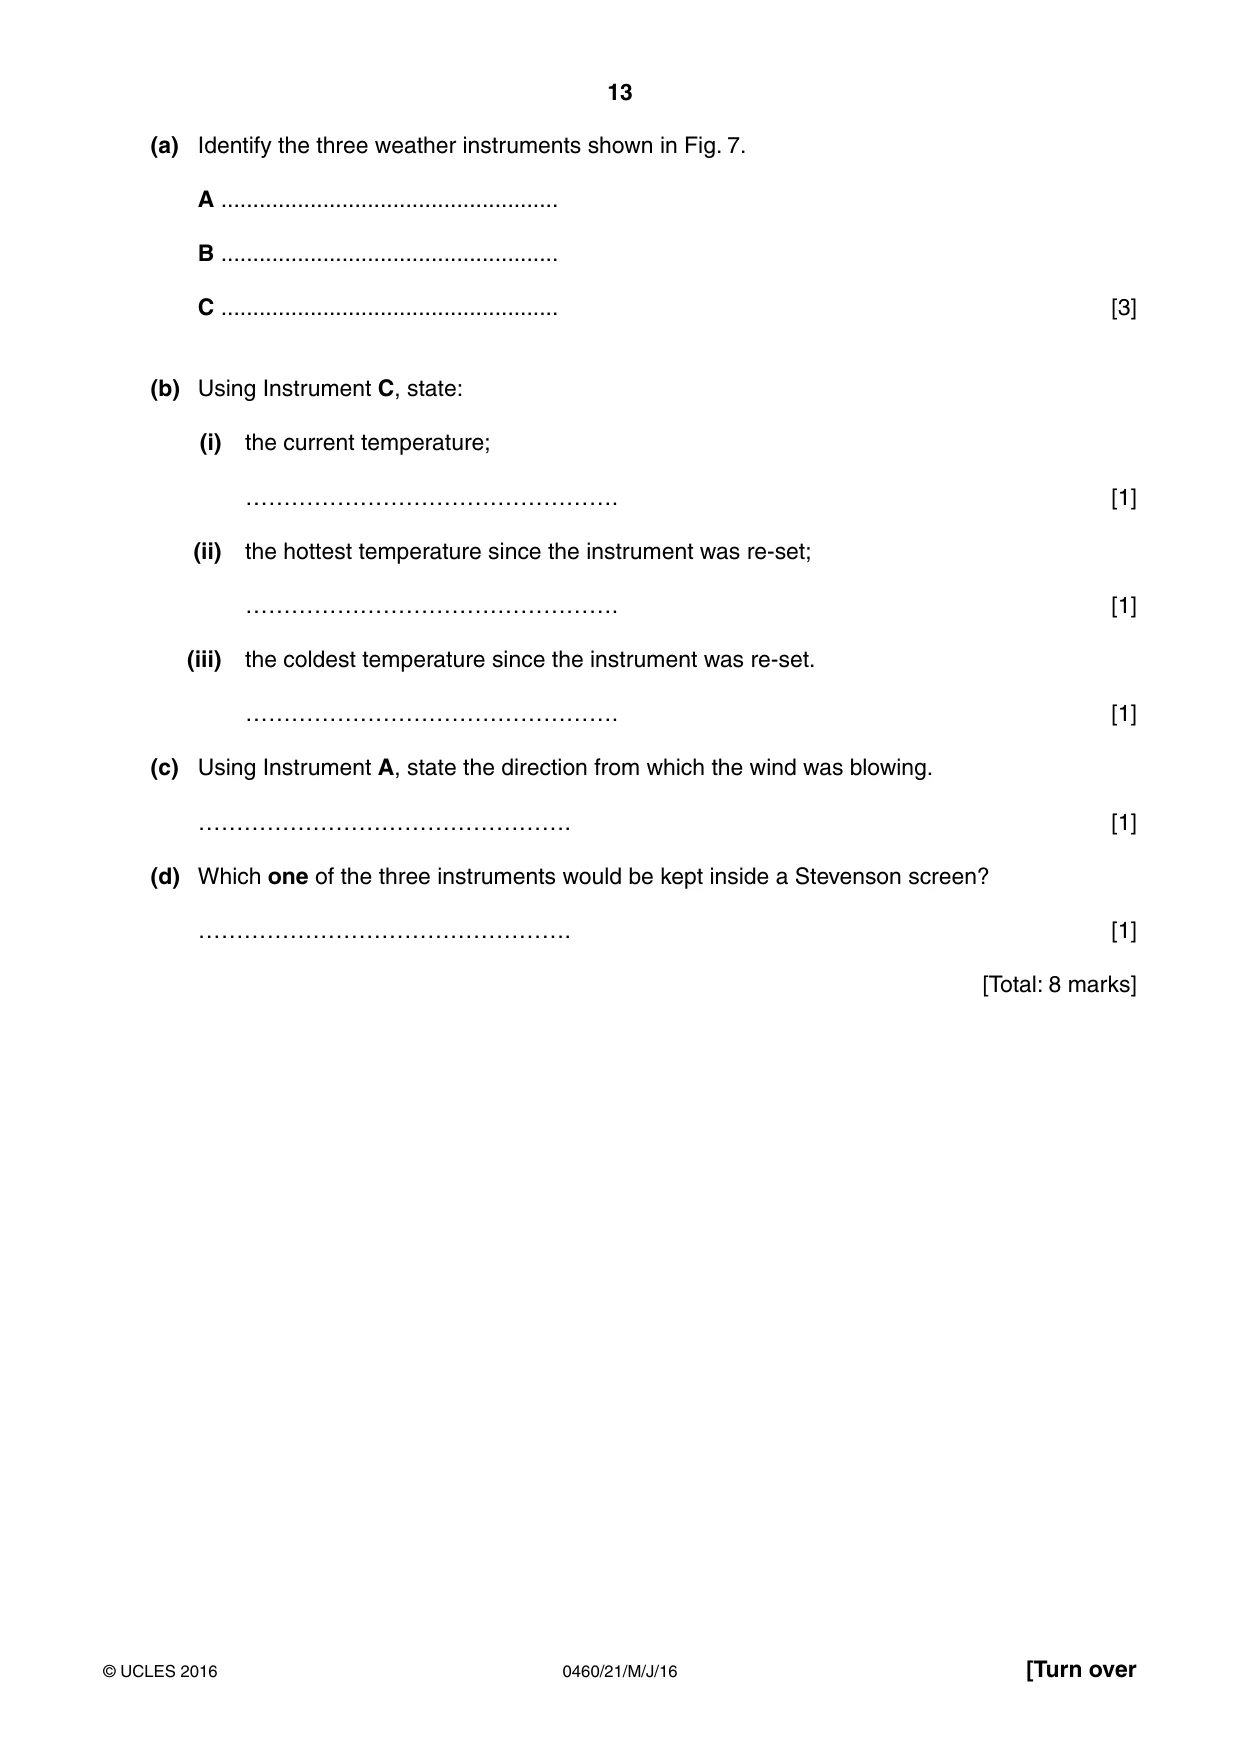
12 0460/21/M/J/16 © UCLES 2016 4 Fig. 7 shows three weather instruments, A, B and C. Study Fig. 7 and answer the questions on the opposite page. 40 35 30 25 20 15 10 5 0 –5 –10 –15 –20 –25 °C –25 –20 –15 –10 –5 0 5 10 15 20 25 30 35 40 °C Instrument B Instrument C Instrument A Fig. 7
Question paper, page 13
13 0460/21/M/J/16 © UCLES 2016 [Turn over (a) Identify the three weather instruments shown in Fig. 7. A … B … C … [3] (b) Using Instrument C, state: (i) the current temperature; …………………………………………. [1] (ii) the hottest temperature since the instrument was re-set; …………………………………………. [1] (iii) the coldest temperature since the instrument was re-set. …………………………………………. [1] (c) Using Instrument A, state the direction from which the wind was blowing. …………………………………………. [1] (d) Which one of the three instruments would be kept inside a Stevenson screen? …………………………………………. [1] [Total: 8 marks]
Question paper, page 14
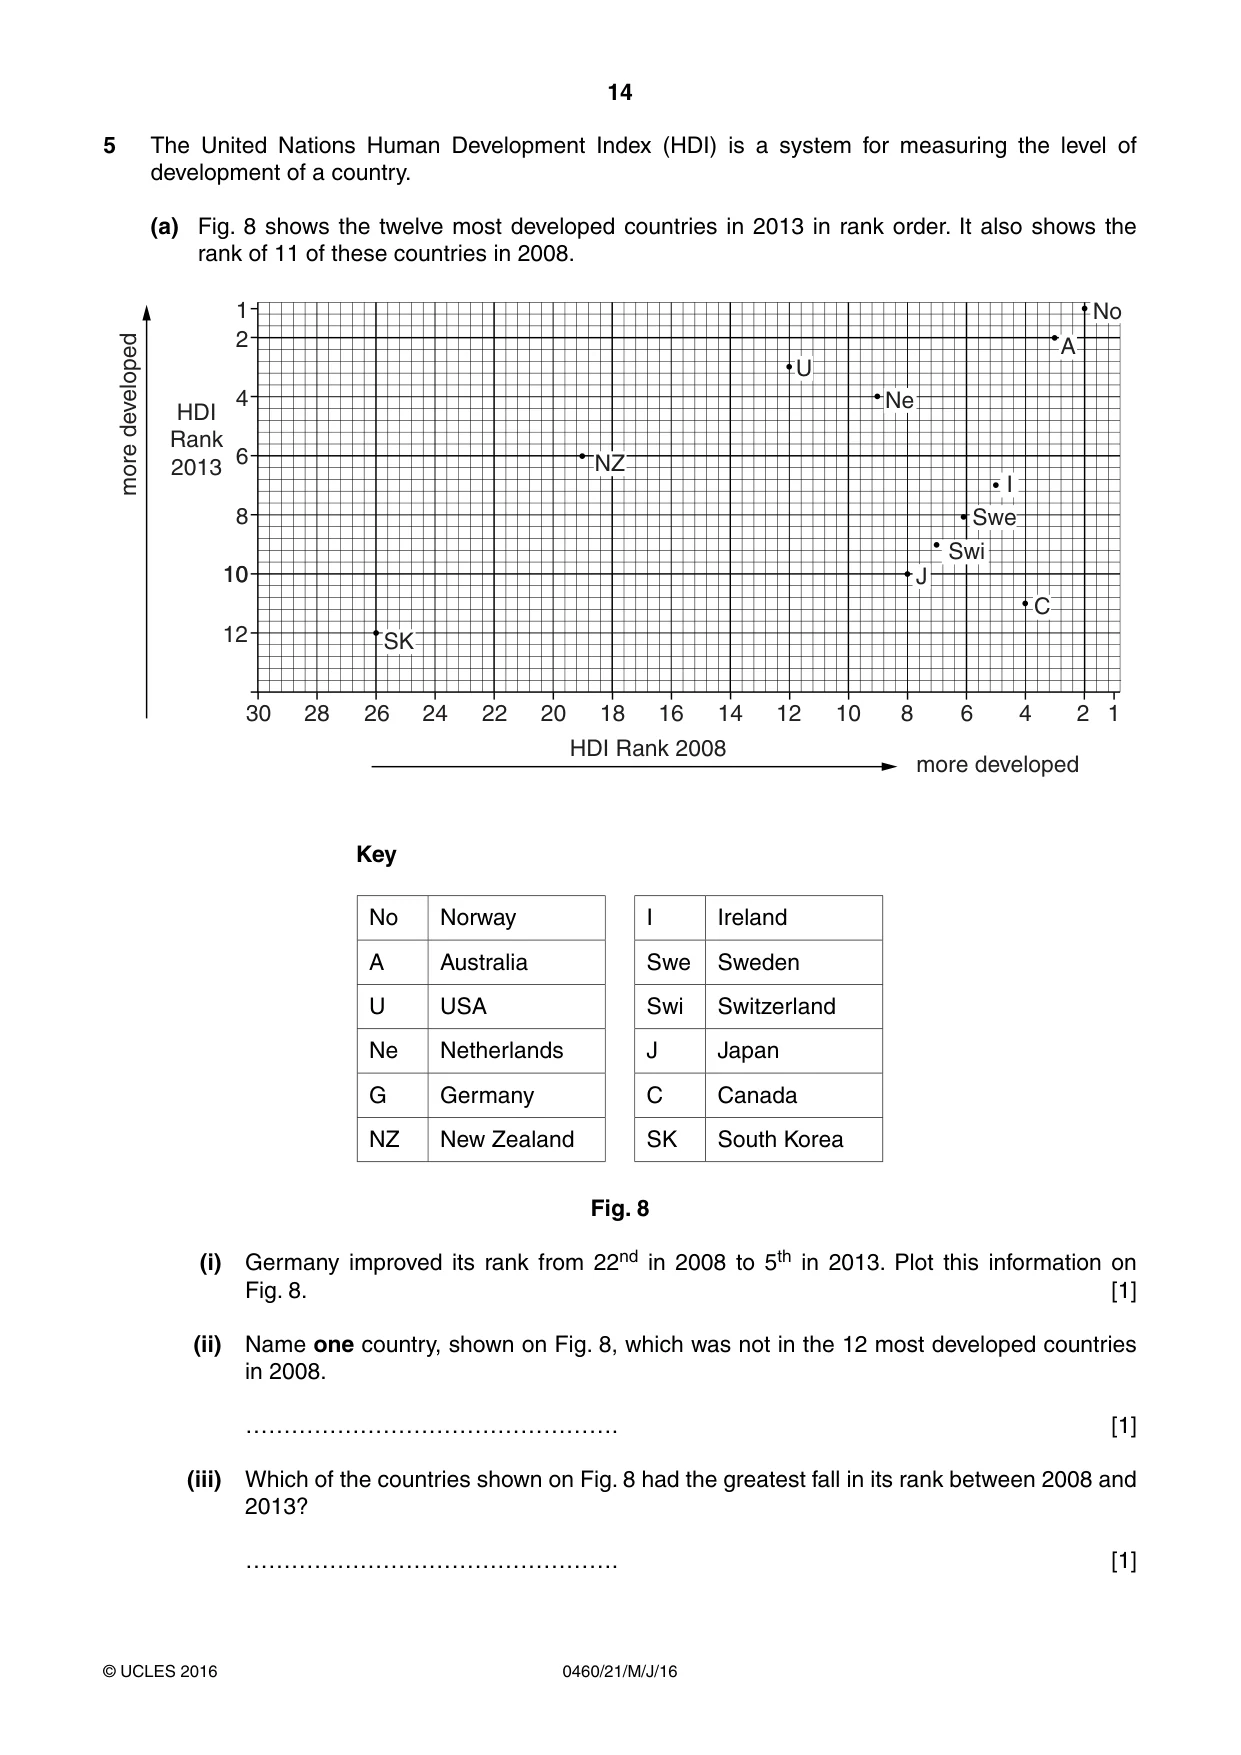
14 0460/21/M/J/16 © UCLES 2016 5 The United Nations Human Development Index (HDI) is a system for measuring the level of development of a country. (a) Fig. 8 shows the twelve most developed countries in 2013 in rank order. It also shows the rank of 11 of these countries in 2008. more developed SK NZ Ne No I Swe Swi A J C U 30 12 10 10 8 6 4 2 1 28 26 24 22 20 18 16 14 12 10 8 6 4 2 1 HDI Rank 2013 more developed HDI Rank 2008 Key No Norway I Ireland A Australia Swe Sweden U USA Swi Switzerland Ne Netherlands J Japan G Germany C Canada NZ New Zealand SK South Korea Fig. 8 (i) Germany improved its rank from 22nd in 2008 to 5th in 2013. Plot this information on Fig. 8. [1] (ii) Name one country, shown on Fig. 8, which was not in the 12 most developed countries in 2008. …………………………………………. [1] (iii) Which of the countries shown on Fig. 8 had the greatest fall in its rank between 2008 and 2013? …………………………………………. [1]
Question paper, page 15
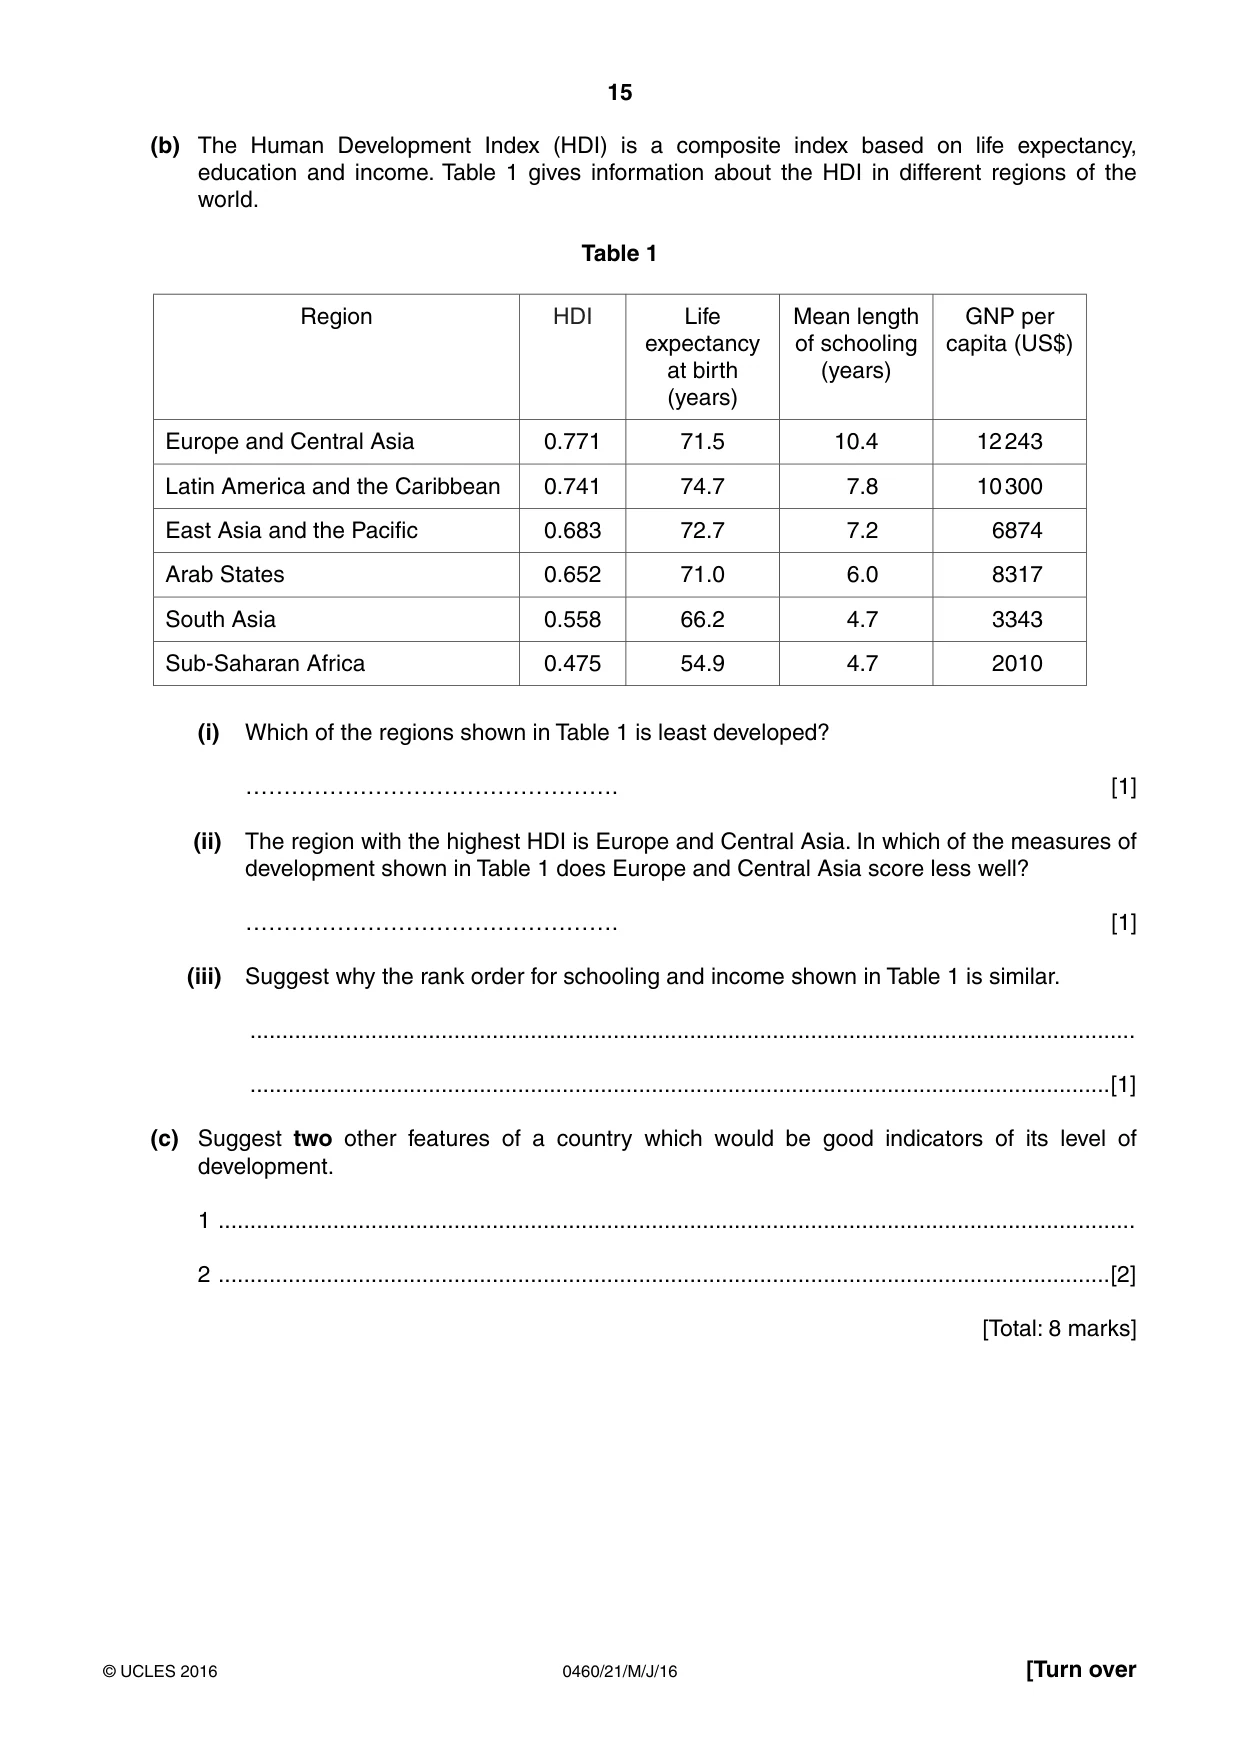
15 0460/21/M/J/16 © UCLES 2016 [Turn over (b) The Human Development Index (HDI) is a composite index based on life expectancy, education and income. Table 1 gives information about the HDI in different regions of the world. Table 1 Region HDI Life expectancy at birth (years) Mean length of schooling (years) GNP per capita (US$) Europe and Central Asia 0.771 71.5 10.4 12 243 Latin America and the Caribbean 0.741 74.7 7.8 10 300 East Asia and the Pacific 0.683 72.7 7.2 6874 Arab States 0.652 71.0 6.0 8317 South Asia 0.558 66.2 4.7 3343 Sub-Saharan Africa 0.475 54.9 4.7 2010 (i) Which of the regions shown in Table 1 is least developed? …………………………………………. [1] (ii) The region with the highest HDI is Europe and Central Asia. In which of the measures of development shown in Table 1 does Europe and Central Asia score less well? …………………………………………. [1] (iii) Suggest why the rank order for schooling and income shown in Table 1 is similar. … …[1] (c) Suggest two other features of a country which would be good indicators of its level of development. 1 … 2 …[2] [Total: 8 marks]
Question paper, page 16
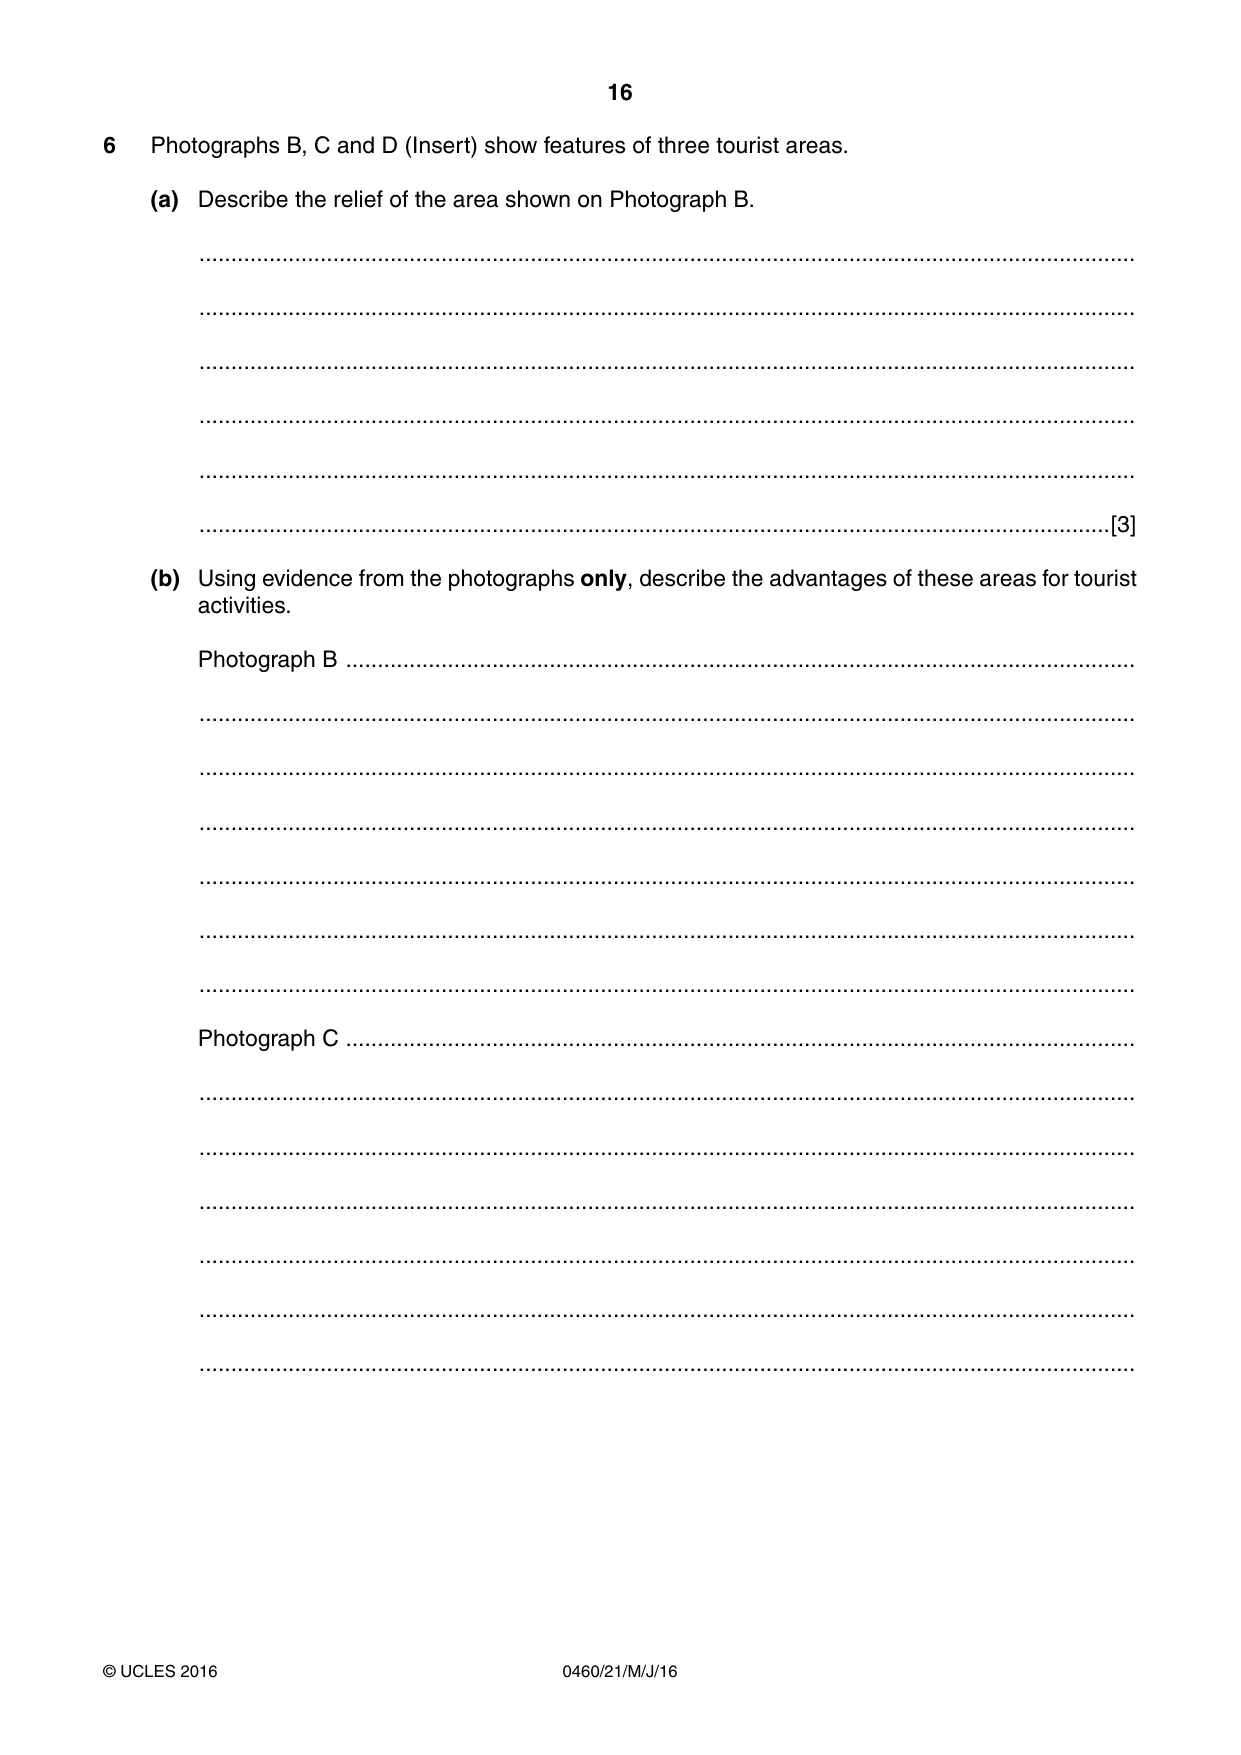
16 0460/21/M/J/16 © UCLES 2016 6 Photographs B, C and D (Insert) show features of three tourist areas. (a) Describe the relief of the area shown on Photograph B. … … … … … …[3] (b) Using evidence from the photographs only, describe the advantages of these areas for tourist activities. Photograph B … … … … … … … Photograph C … … … … … … …
Question paper, page 17
17 0460/21/M/J/16 © UCLES 2016 Photograph D … … … … … … …[5] [Total: 8 marks]
Question paper, page 18
18 0460/21/M/J/16 © UCLES 2016 Additional Pages If you use the following lined pages to complete the answer(s) to any question(s), the question number(s) must be clearly shown. … … … … … … … … … … … … … … … … … … … … … … … … … …
Question paper, page 19
19 0460/21/M/J/16 © UCLES 2016 … … … … … … … … … … … … … … … … … … … … … … … … … … …
Question paper, page 20
20 0460/21/M/J/16 © UCLES 2016 BLANK PAGE Permission to reproduce items where third-party owned material protected by copyright is included has been sought and cleared where possible. Every reasonable effort has been made by the publisher (UCLES) to trace copyright holders, but if any items requiring clearance have unwittingly been included, the publisher will be pleased to make amends at the earliest possible opportunity. To avoid the issue of disclosure of answer-related information to candidates, all copyright acknowledgements are reproduced online in the Cambridge International Examinations Copyright Acknowledgements Booklet. This is produced for each series of examinations and is freely available to download at www.cie.org.uk after the live examination series. Cambridge International Examinations is part of the Cambridge Assessment Group. Cambridge Assessment is the brand name of University of Cambridge Local Examinations Syndicate (UCLES), which is itself a department of the University of Cambridge.
Mark scheme, page 1
® IGCSE is the registered trademark of Cambridge International Examinations. This document consists of 5 printed pages. © UCLES 2016 [Turn over Cambridge International Examinations Cambridge International General Certificate of Secondary Education GEOGRAPHY 0460/21 Paper 2 May/June 2016 MARK SCHEME Maximum Mark: 60 Published This mark scheme is published as an aid to teachers and candidates, to indicate the requirements of the examination. It shows the basis on which Examiners were instructed to award marks. It does not indicate the details of the discussions that took place at an Examiners’ meeting before marking began, which would have considered the acceptability of alternative answers. Mark schemes should be read in conjunction with the question paper and the Principal Examiner Report for Teachers. Cambridge will not enter into discussions about these mark schemes. Cambridge is publishing the mark schemes for the May/June 2016 series for most Cambridge IGCSE®, Cambridge International A and AS Level components and some Cambridge O Level components.
Mark scheme, page 2
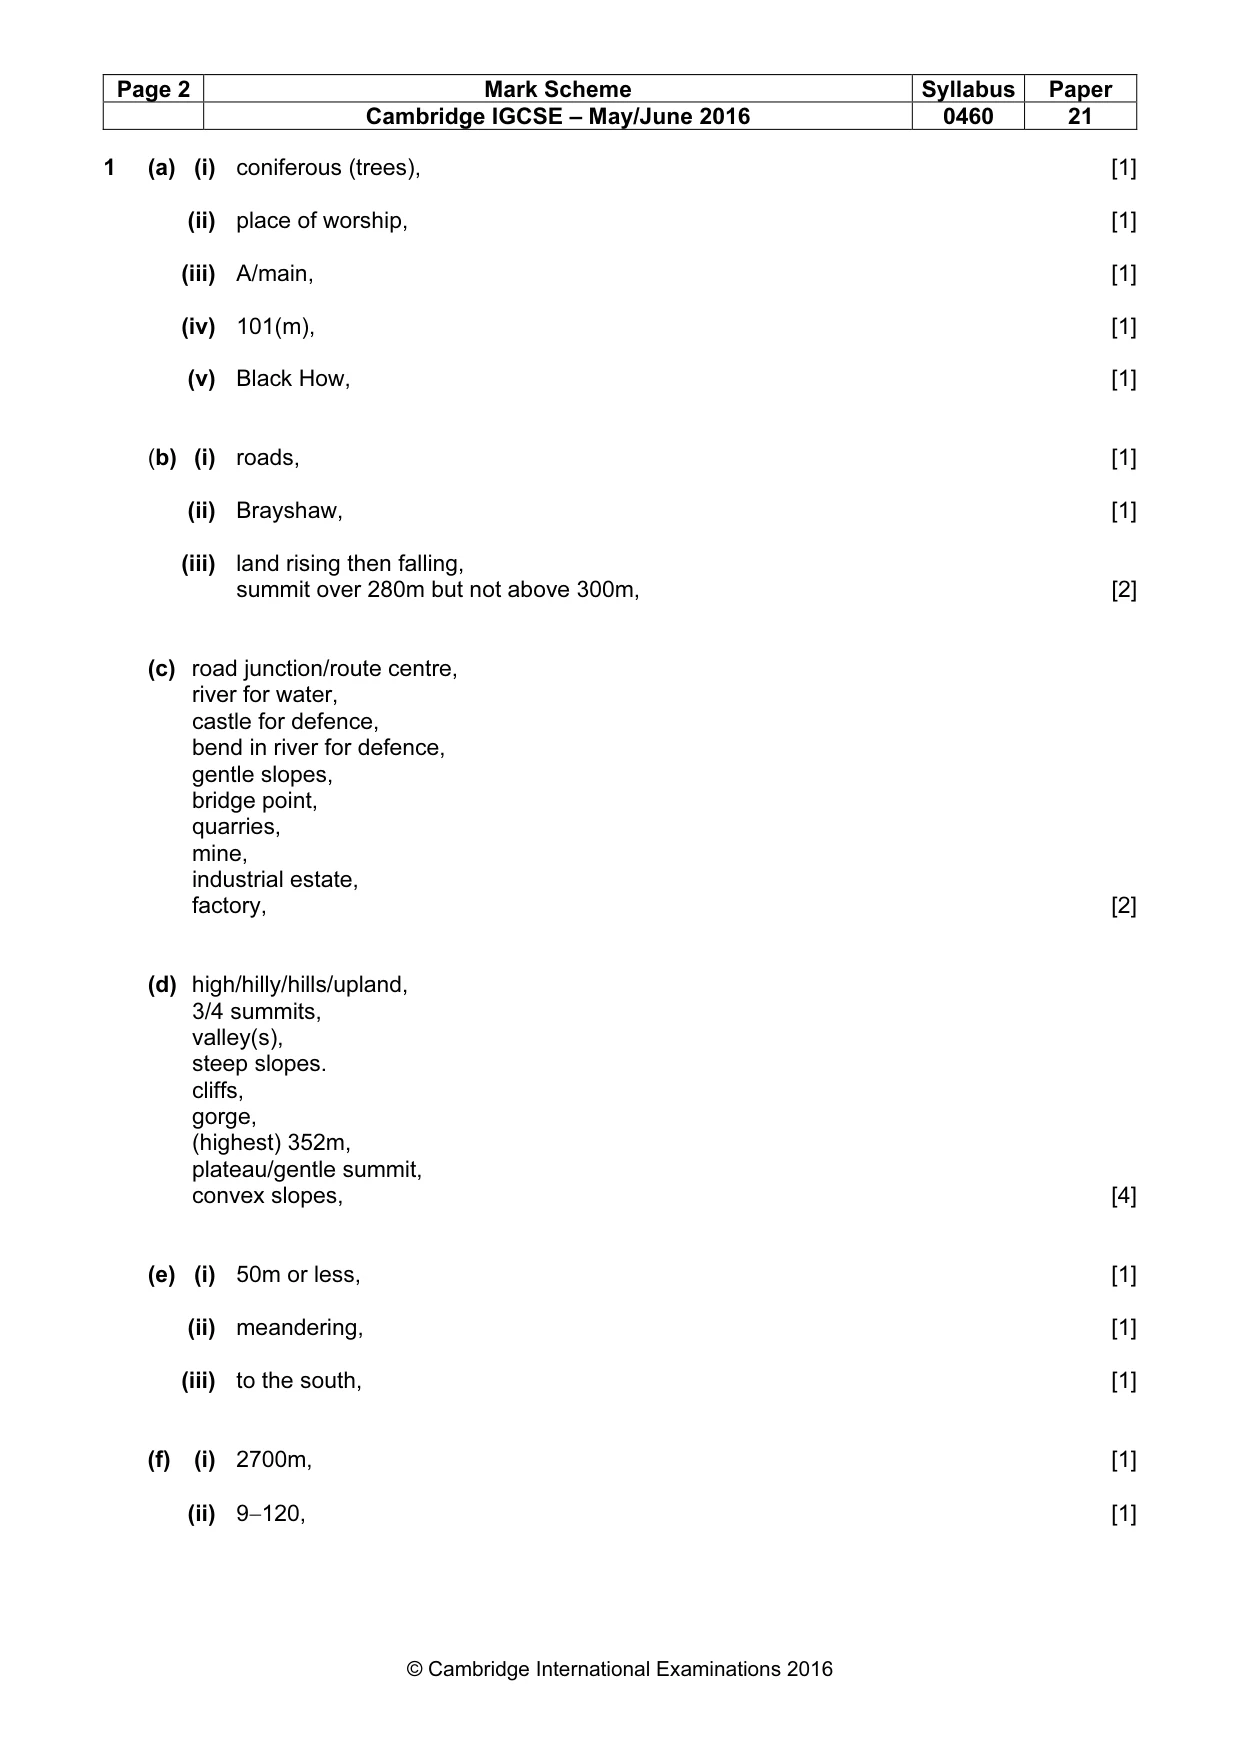
Page 2 Mark Scheme Syllabus Paper Cambridge IGCSE – May/June 2016 0460 21 © Cambridge International Examinations 2016 1 (a) (i) coniferous (trees), [1] (ii) place of worship, [1] (iii) A/main, [1] (iv) 101(m), [1] (v) Black How, [1] (b) (i) roads, [1] (ii) Brayshaw, [1] (iii) land rising then falling, summit over 280m but not above 300m, [2] (c) road junction/route centre, river for water, castle for defence, bend in river for defence, gentle slopes, bridge point, quarries, mine, industrial estate, factory, [2] (d) high/hilly/hills/upland, 3/4 summits, valley(s), steep slopes. cliffs, gorge, (highest) 352m, plateau/gentle summit, convex slopes, [4] (e) (i) 50m or less, [1] (ii) meandering, [1] (iii) to the south, [1] (f) (i) 2700m, [1] (ii) 9−120, [1]
Mark scheme, page 3
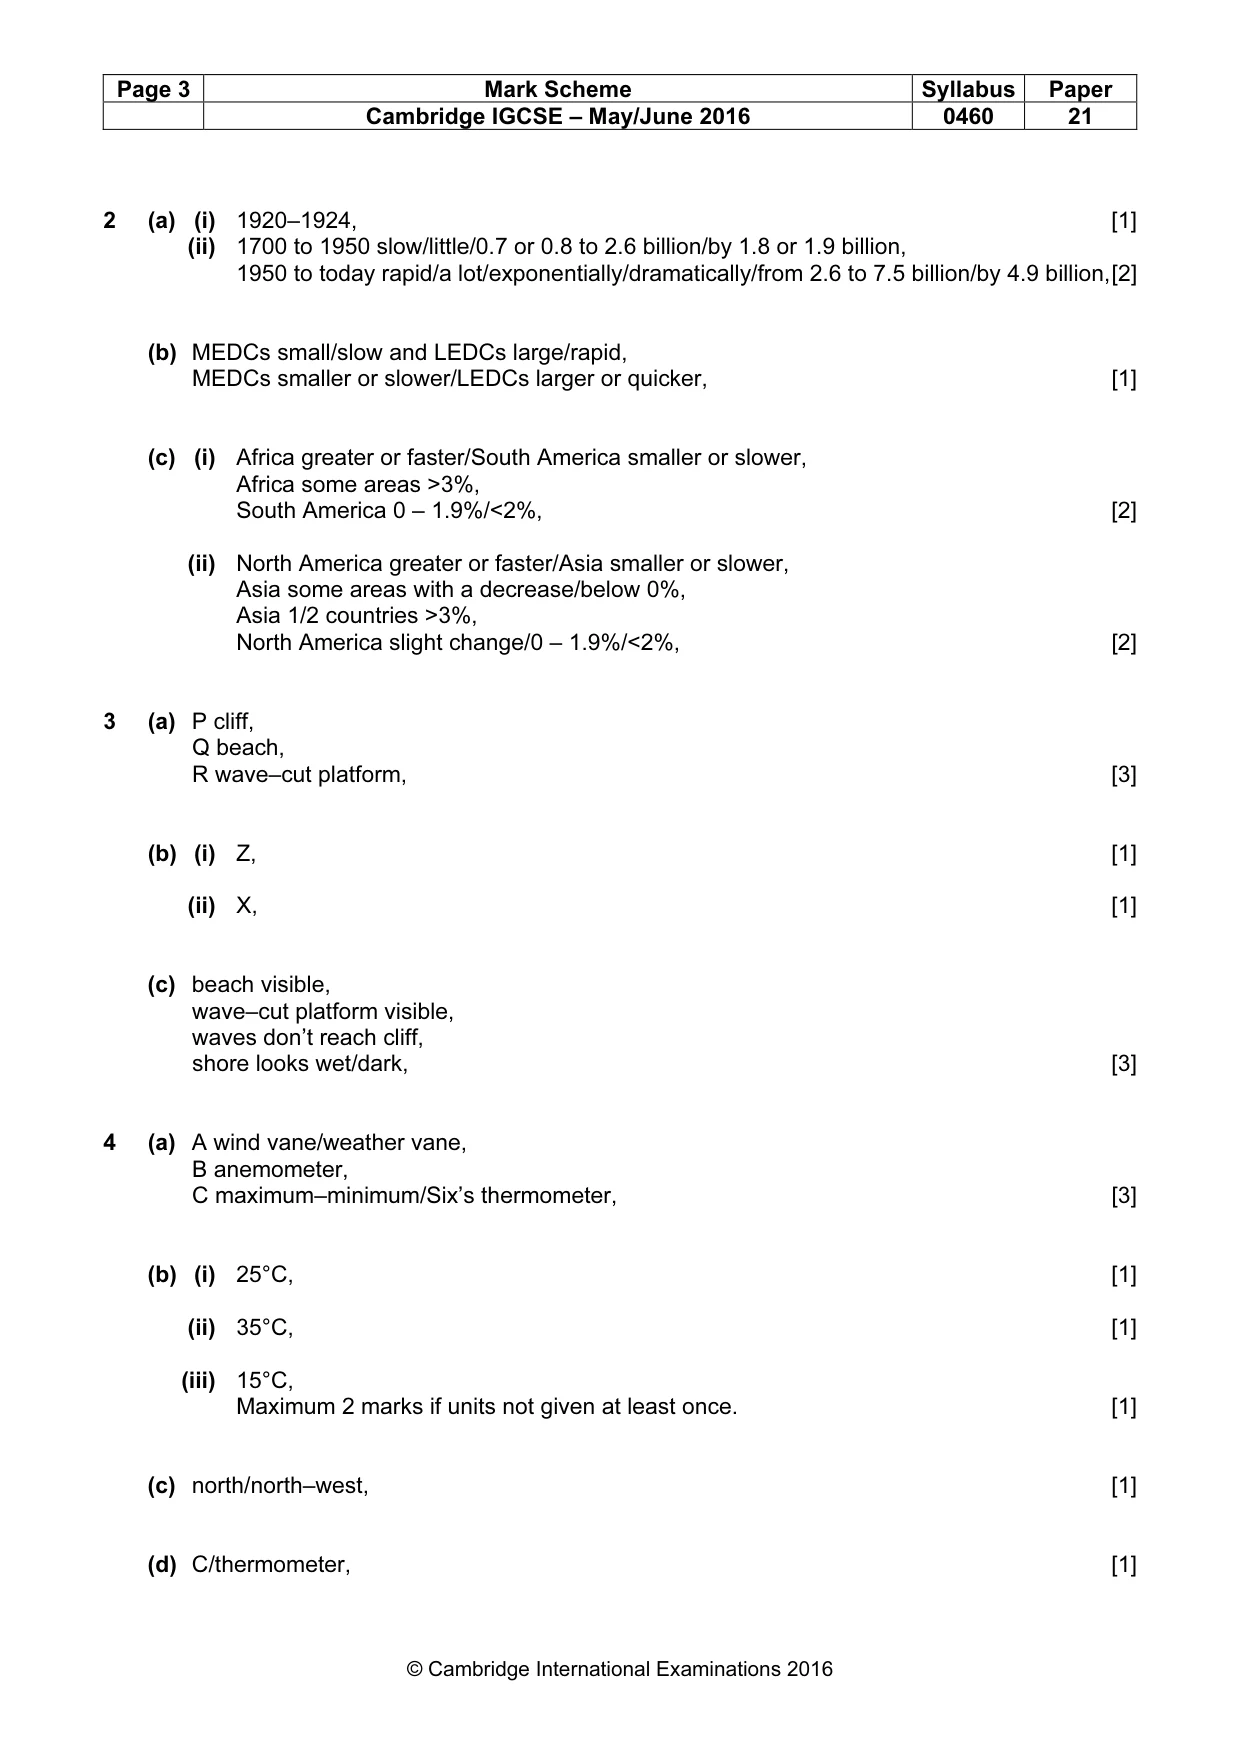
Page 3 Mark Scheme Syllabus Paper Cambridge IGCSE – May/June 2016 0460 21 © Cambridge International Examinations 2016 2 (a) (i) 1920–1924, [1] (ii) 1700 to 1950 slow/little/0.7 or 0.8 to 2.6 billion/by 1.8 or 1.9 billion, 1950 to today rapid/a lot/exponentially/dramatically/from 2.6 to 7.5 billion/by 4.9 billion, [2] (b) MEDCs small/slow and LEDCs large/rapid, MEDCs smaller or slower/LEDCs larger or quicker, [1] (c) (i) Africa greater or faster/South America smaller or slower, Africa some areas >3%, South America 0 – 1.9%/<2%, [2] (ii) North America greater or faster/Asia smaller or slower, Asia some areas with a decrease/below 0%, Asia 1/2 countries >3%, North America slight change/0 – 1.9%/<2%, [2] 3 (a) P cliff, Q beach, R wave–cut platform, [3] (b) (i) Z, [1] (ii) X, [1] (c) beach visible, wave–cut platform visible, waves don’t reach cliff, shore looks wet/dark, [3] 4 (a) A wind vane/weather vane, B anemometer, C maximum–minimum/Six’s thermometer, [3] (b) (i) 25°C, [1] (ii) 35°C, [1] (iii) 15°C, Maximum 2 marks if units not given at least once. [1] (c) north/north–west, [1] (d) C/thermometer, [1]
Mark scheme, page 4
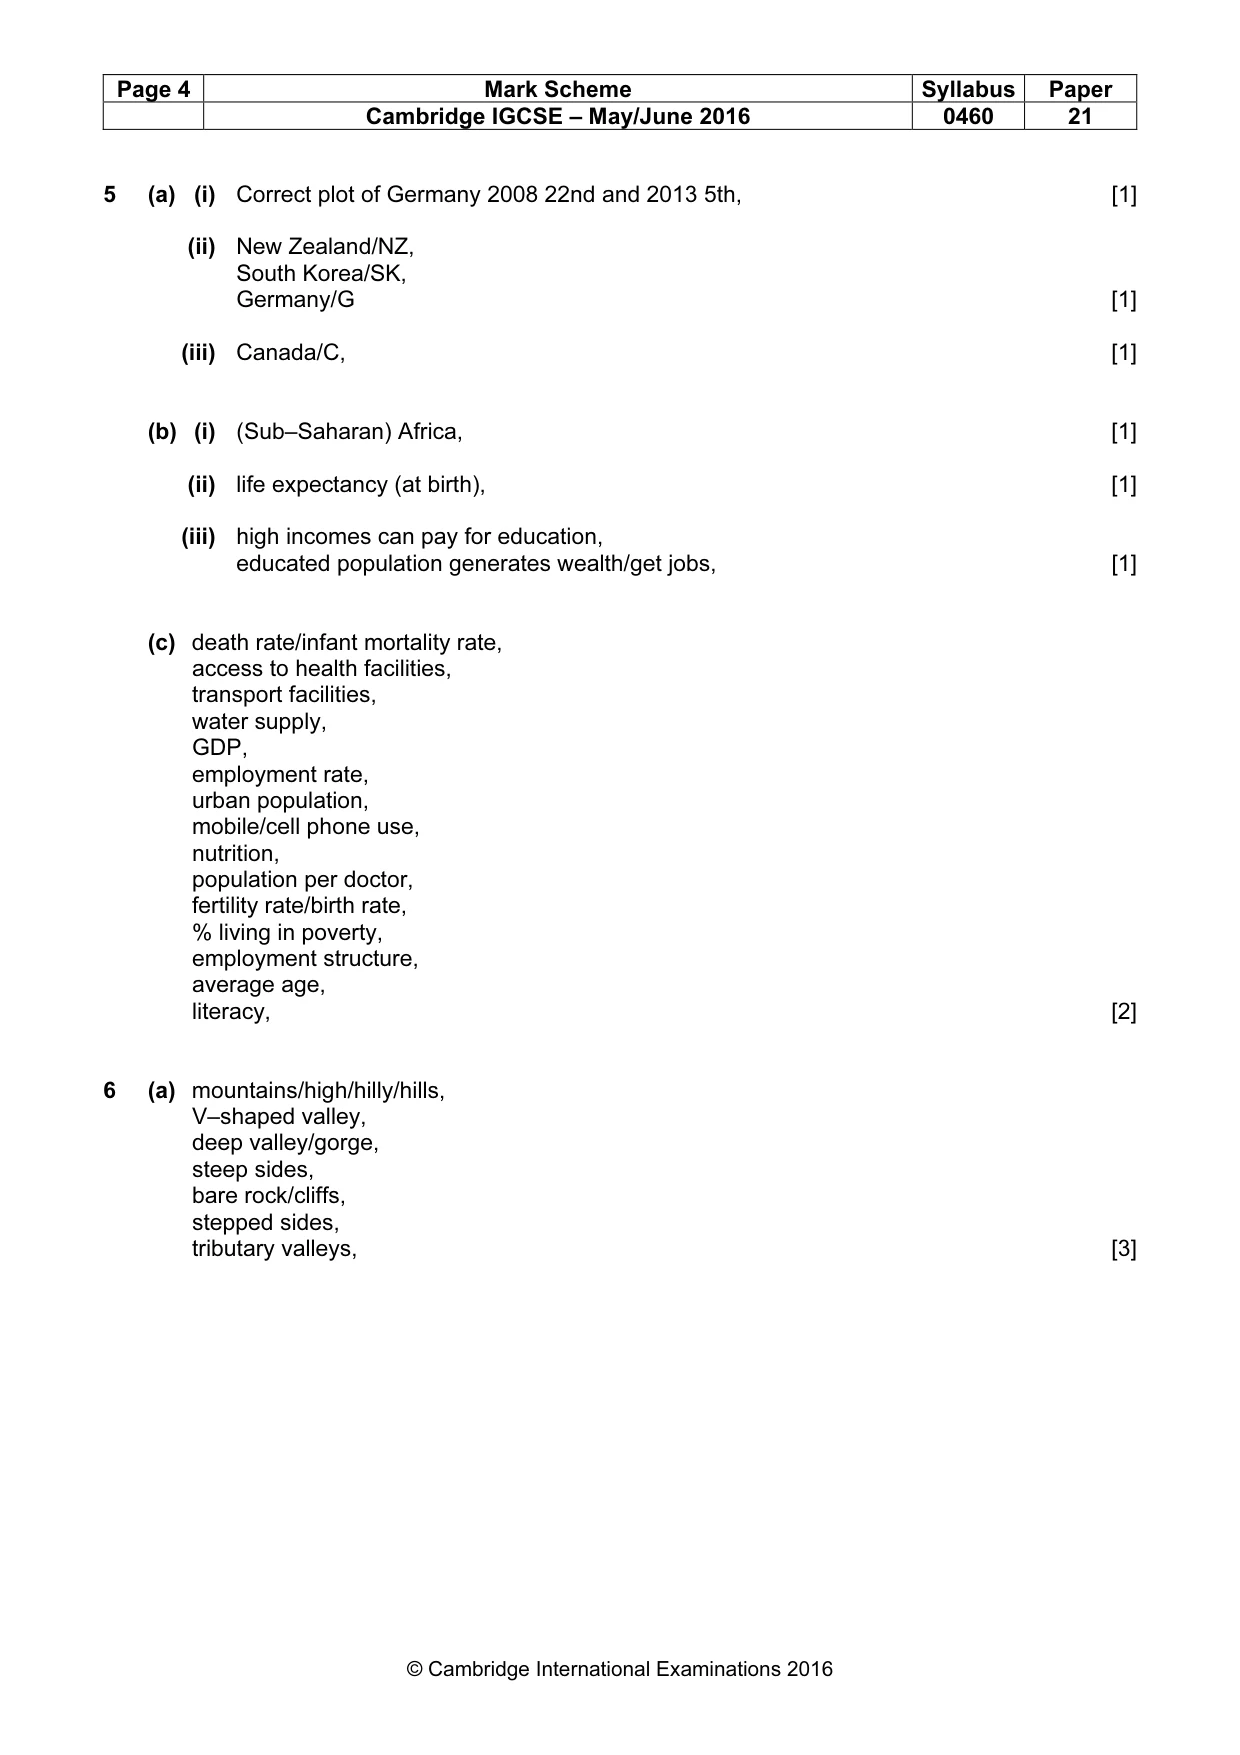
Page 4 Mark Scheme Syllabus Paper Cambridge IGCSE – May/June 2016 0460 21 © Cambridge International Examinations 2016 5 (a) (i) Correct plot of Germany 2008 22nd and 2013 5th, [1] (ii) New Zealand/NZ, South Korea/SK, Germany/G [1] (iii) Canada/C, [1] (b) (i) (Sub–Saharan) Africa, [1] (ii) life expectancy (at birth), [1] (iii) high incomes can pay for education, educated population generates wealth/get jobs, [1] (c) death rate/infant mortality rate, access to health facilities, transport facilities, water supply, GDP, employment rate, urban population, mobile/cell phone use, nutrition, population per doctor, fertility rate/birth rate, % living in poverty, employment structure, average age, literacy, [2] 6 (a) mountains/high/hilly/hills, V–shaped valley, deep valley/gorge, steep sides, bare rock/cliffs, stepped sides, tributary valleys, [3]
Mark scheme, page 5
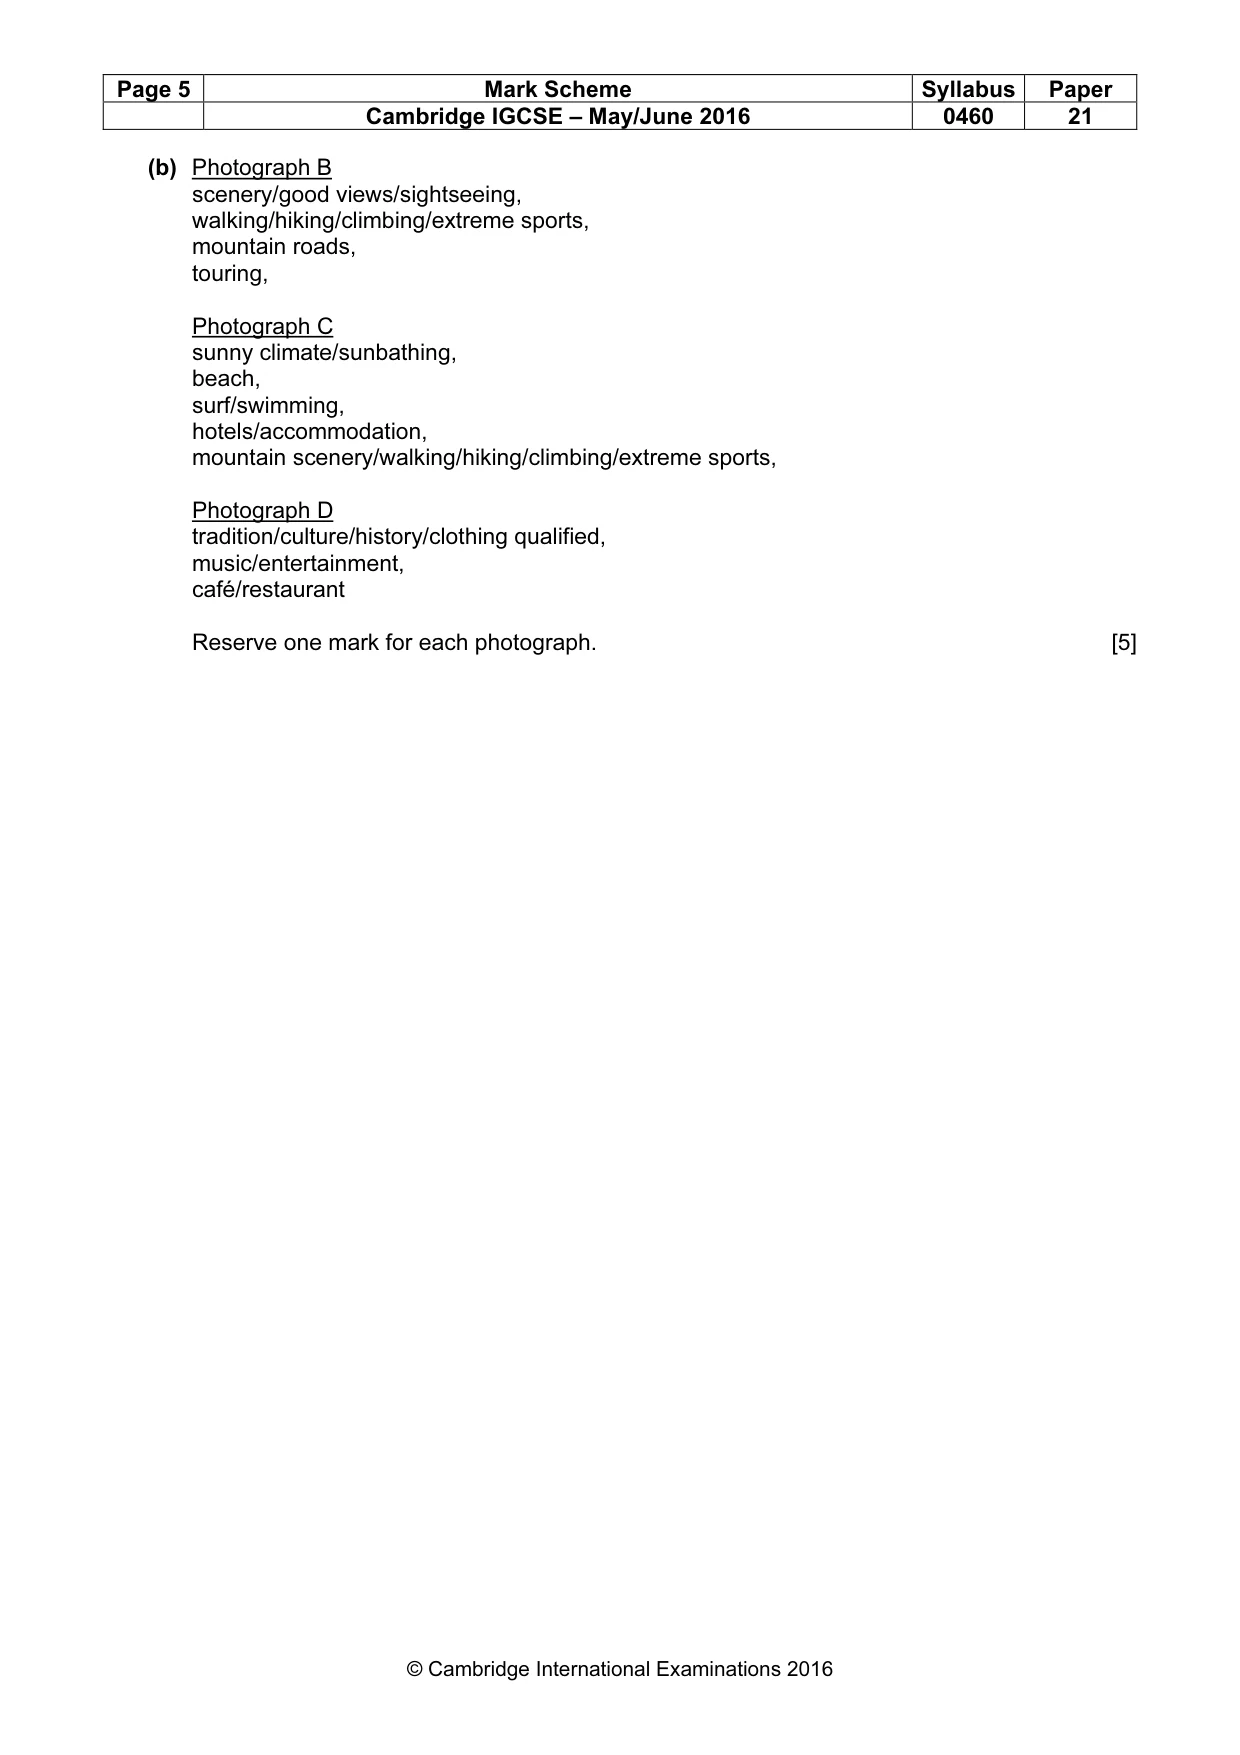
Page 5 Mark Scheme Syllabus Paper Cambridge IGCSE – May/June 2016 0460 21 © Cambridge International Examinations 2016 (b) Photograph B scenery/good views/sightseeing, walking/hiking/climbing/extreme sports, mountain roads, touring, Photograph C sunny climate/sunbathing, beach, surf/swimming, hotels/accommodation, mountain scenery/walking/hiking/climbing/extreme sports, Photograph D tradition/culture/history/clothing qualified, music/entertainment, café/restaurant Reserve one mark for each photograph. [5]
What you needed in this session
Cambridge’s own grade thresholds for 2016 May/June, Paper 2 · Variant 1. A higher threshold means an easier paper — the bar moves with how the cohort did.