Cambridge IGCSE Geography 0460 — 2015 May/June Paper 4 · Variant 3
0460/43/M/J/15 · 60 marks · ≈68 min
The question paper and its mark scheme, free to read here and free to download. This is Cambridge’s own paper, exactly as it was sat.
Question paper16 pages

Mark scheme7 pages
Answers below. Sit the paper first if you are practising.
Paper as text
Question paper, page 1
This document consists of 15 printed pages, 1 blank page and 1 Insert. DC (ST/JG) 96719/6 © UCLES 2015 [Turn over Cambridge International Examinations Cambridge International General Certificate of Secondary Education * 5 7 8 6 9 3 4 2 1 6 * GEOGRAPHY 0460/43 Paper 4 Alternative to Coursework May/June 2015 1 hour 30 minutes Candidates answer on the Question Paper. Additional Materials: Calculator Ruler READ THESE INSTRUCTIONS FIRST Write your Centre number, candidate number and name in the spaces provided. Write in dark blue or black pen. You may use an HB pencil for any diagrams or graphs. Do not use staples, paper clips, glue or correction fluid. DO NOT WRITE IN ANY BARCODES. Answer all questions. The Insert contains Photographs A and B, Table 1 and Figs 1 and 4 for Question 1, and Fig. 7 for Question 2. The Insert is not required by the Examiner. Sketch maps and diagrams should be drawn whenever they serve to illustrate an answer. At the end of the examination, fasten all your work securely together. The number of marks is given in brackets [ ] at the end of each question or part question. The syllabus is approved for use in England, Wales and Northern Ireland as a Cambridge International Level 1/Level 2 Certificate.
Question paper, page 2
2 0460/43/M/J/15 © UCLES 2015 1 Students in southern USA read a newspaper report about pollution in a local river. They decided to do some fieldwork to investigate this. However, before they started their fieldwork, their teacher warned them about the possible dangers of working in polluted water. She also suggested some precautions they might take to protect themselves. (a) (i) Suggest two dangers which their teacher may have warned them about when working in polluted water, and suggest how they might protect themselves whilst testing the level of pollution in the river. Danger 1 … … Protection … … Danger 2 … … Protection … …[4] (ii) First the students did a visual survey of the river. Suggest two ways that they would be able to see from the river bank if the river was polluted. 1 … … 2 … …[2]
Question paper, page 3
3 0460/43/M/J/15 © UCLES 2015 [Turn over (b) The students agreed on two hypotheses to investigate. Hypothesis 1: Water pollution increases as you go downstream. Hypothesis 2: The Biotic Index decreases as you go downstream. The Biotic Index is a way of measuring water pollution by looking at the animals that live in the river. To measure the level of water pollution the students decided to measure pH and oxygen levels in the river and do a simple foam test. • pH is a measure of the acidity of water. The pH score decreases as water becomes more acidic. More acidic water means that pollution is more likely. • The oxygen level of water decreases as it becomes more polluted. The students used a digital meter to measure the pH of the water. This meter is shown in Photograph A (Insert). (i) Describe two ways in which the students could make sure that their measurements were reliable. 1 … … 2 … …[2] (ii) To measure the oxygen level and to do the foam test the students took samples of river water back to school. One student described the classroom tests in her fieldwork notebook. This is shown in Fig. 1 (Insert). Suggest two reasons why these two tests may not be as reliable as using a digital meter. 1 … … 2 … …[2]
Question paper, page 4
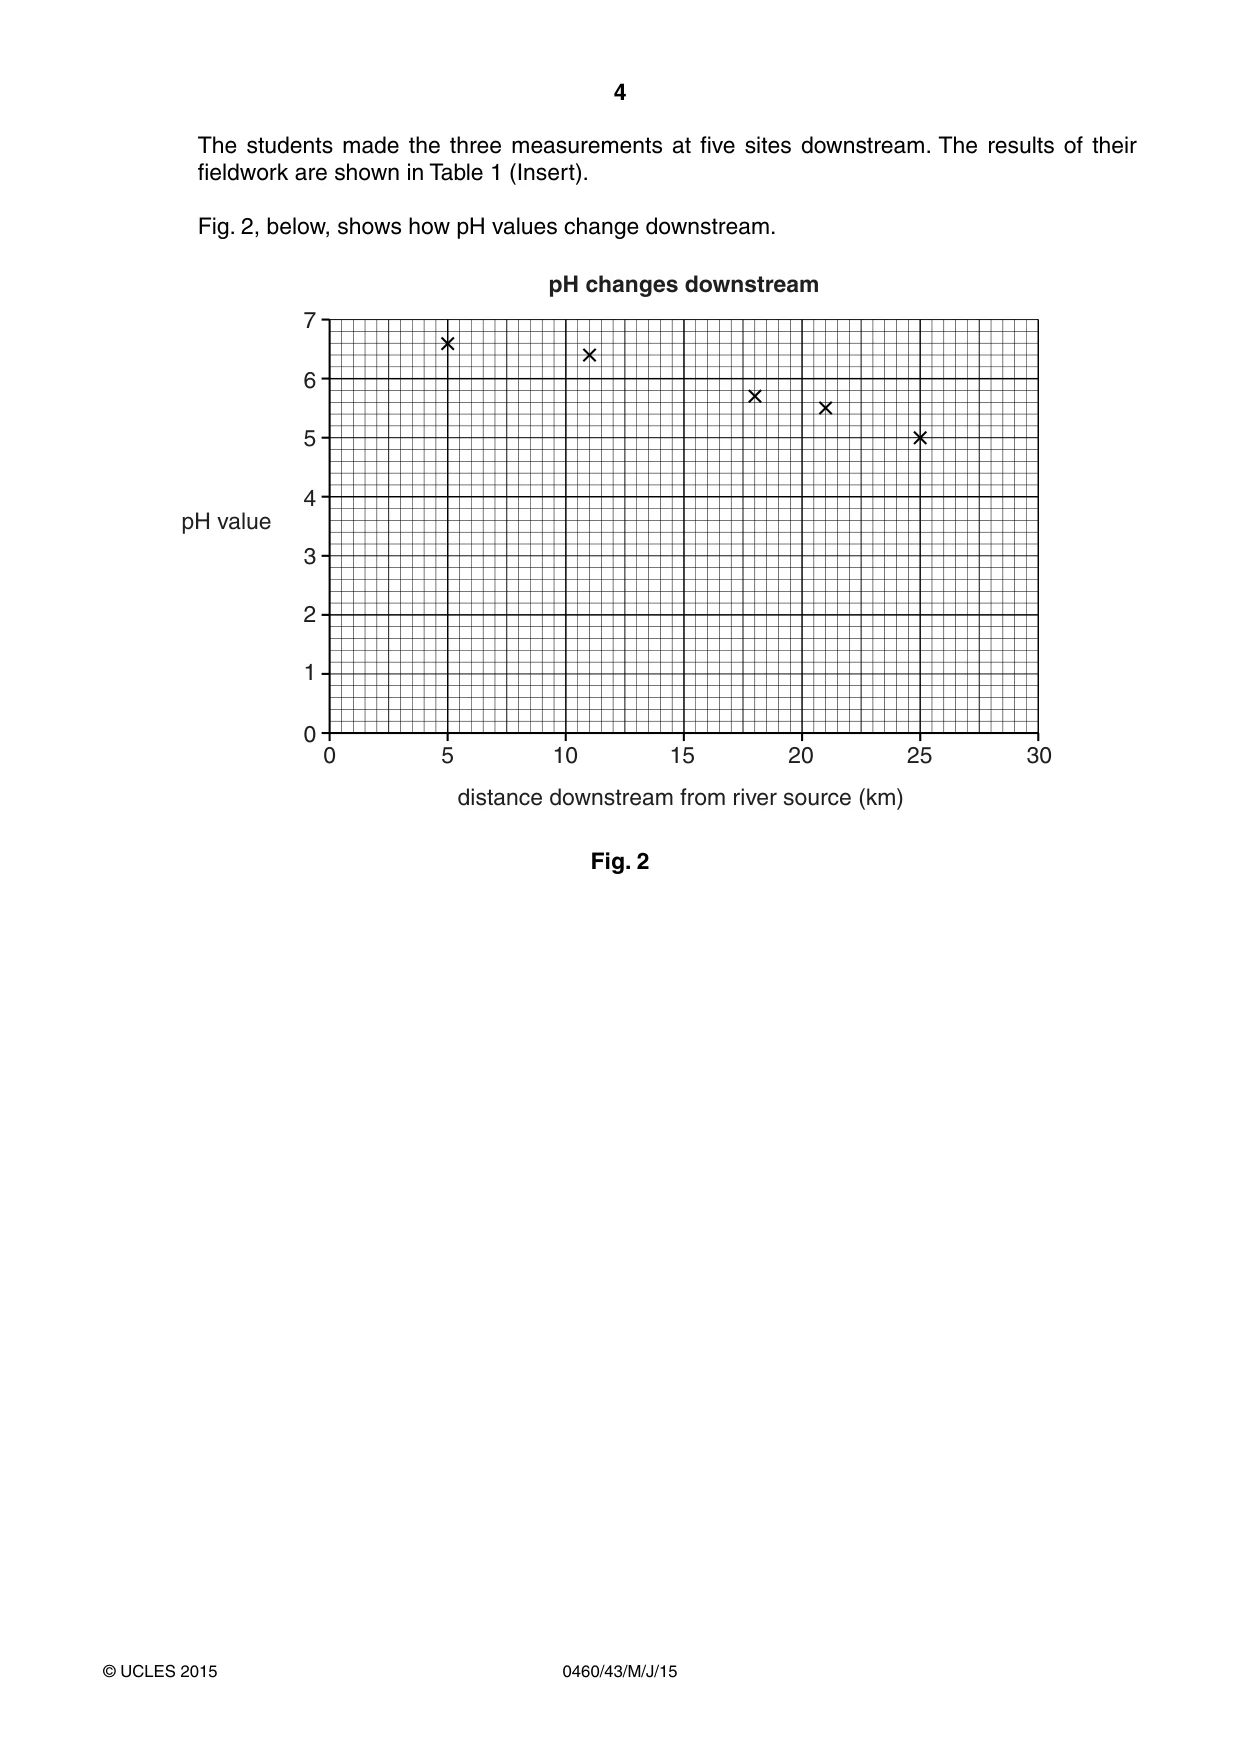
4 0460/43/M/J/15 © UCLES 2015 The students made the three measurements at five sites downstream. The results of their fieldwork are shown in Table 1 (Insert). Fig. 2, below, shows how pH values change downstream. 0 0 5 10 15 20 25 30 1 2 3 4 5 6 7 pH value distance downstream from river source (km) pH changes downstream Fig. 2
Question paper, page 5
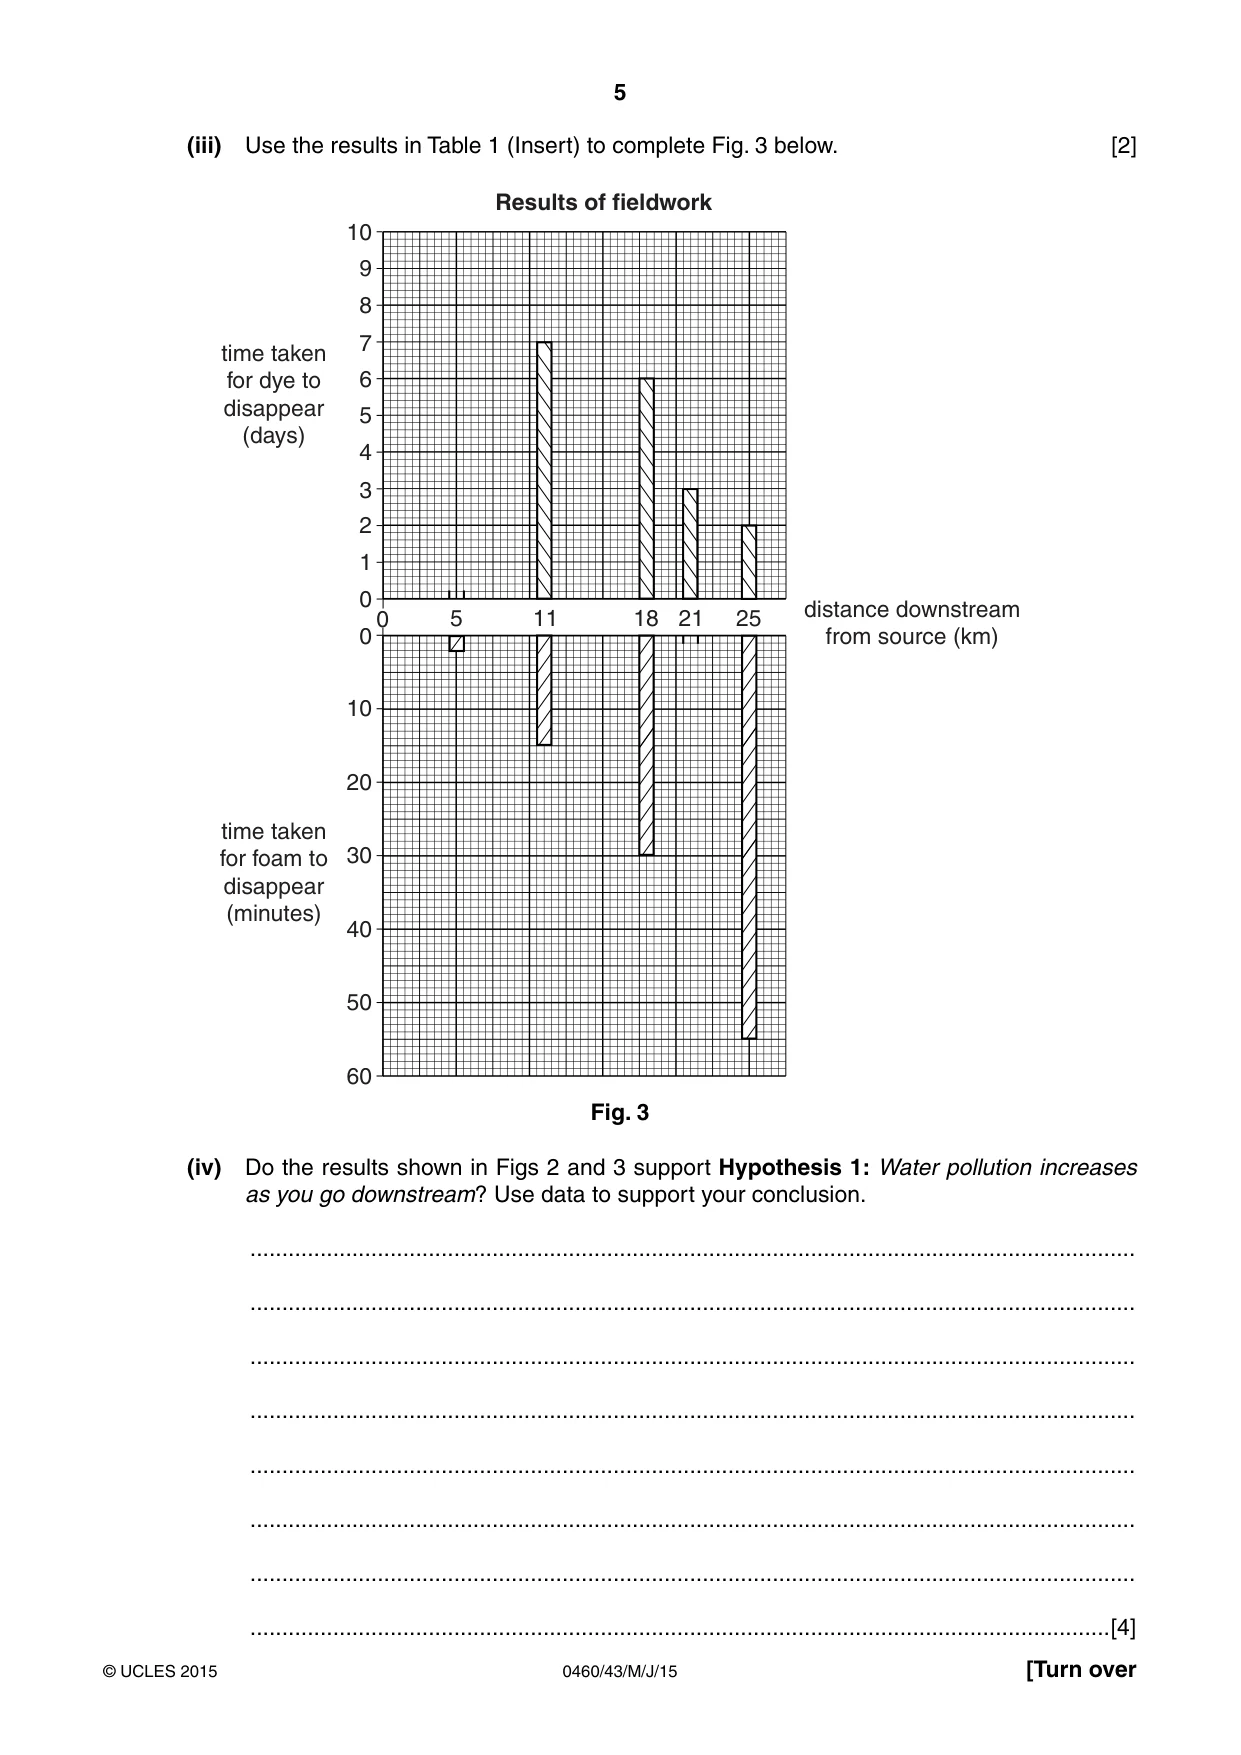
5 0460/43/M/J/15 © UCLES 2015 [Turn over (iii) Use the results in Table 1 (Insert) to complete Fig. 3 below. [2] 10 9 8 7 6 5 4 3 2 1 0 0 0 10 20 30 40 50 60 5 11 21 18 25 distance downstream from source (km) time taken for dye to disappear (days) time taken for foam to disappear (minutes) Results of fieldwork Fig. 3 (iv) Do the results shown in Figs 2 and 3 support Hypothesis 1: Water pollution increases as you go downstream? Use data to support your conclusion. … … … … … … … …[4]
Question paper, page 6
6 0460/43/M/J/15 © UCLES 2015 (v) Suggest two reasons why water pollution levels may vary along a river. 1 … … 2 … …[2] (c) To investigate Hypothesis 2: The Biotic Index decreases as you go downstream, the students did the investigation described in Fig. 4 and shown in Photograph B (Insert) at the five sites along the river. (i) Before the students began working at the five fieldwork sites they did a pilot study at a place on the river near to their school. Give two advantages of doing a pilot study. 1 … … 2 … …[2] (ii) Explain why the students disturbed the river bed when carrying out the fieldwork. … …[1] (iii) Explain why the students needed to identify the different types of animals found at each site while sampling. … …[1]
Question paper, page 7
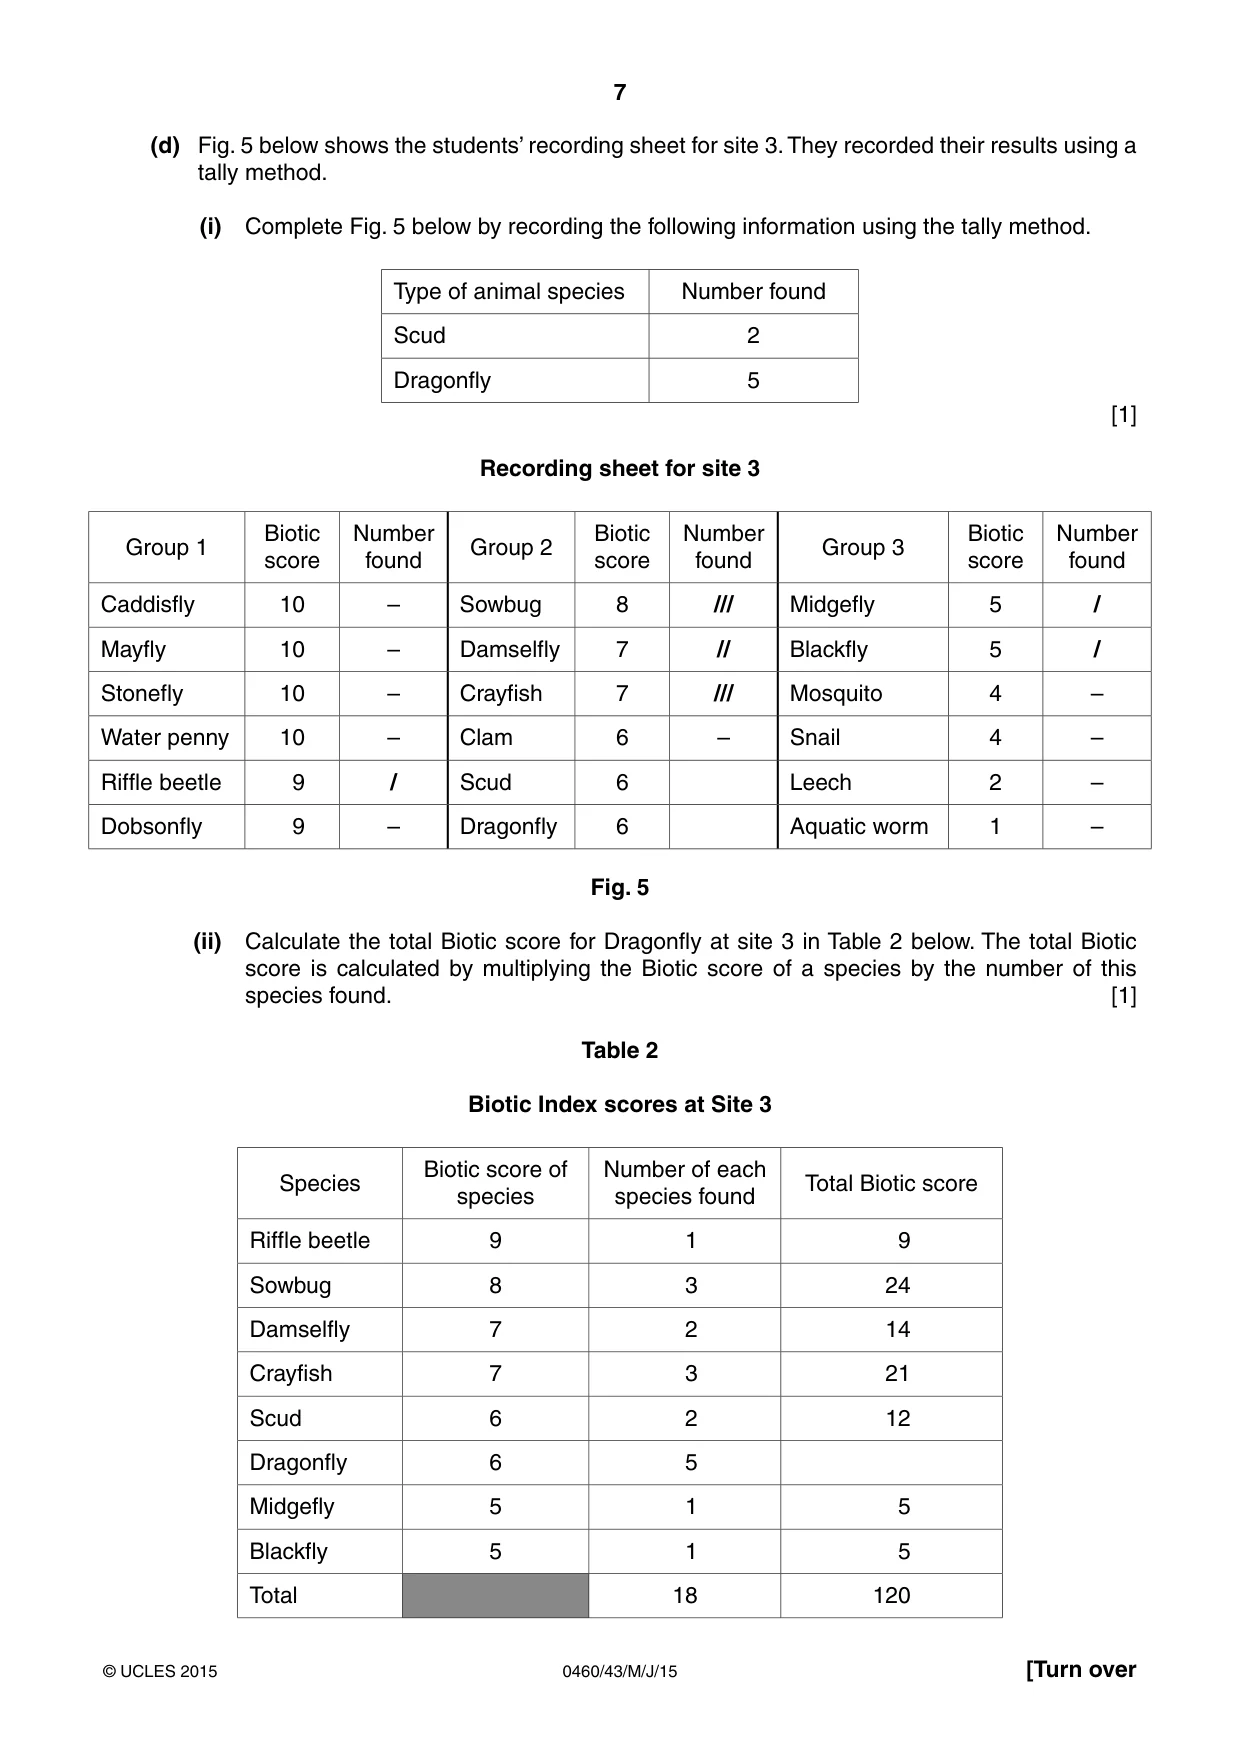
7 0460/43/M/J/15 © UCLES 2015 [Turn over (d) Fig. 5 below shows the students’ recording sheet for site 3. They recorded their results using a tally method. (i) Complete Fig. 5 below by recording the following information using the tally method. Type of animal species Number found Scud 2 Dragonfly 5 [1] Recording sheet for site 3 Group 1 Biotic score Number found Group 2 Biotic score Number found Group 3 Biotic score Number found Caddisfly 10 – Sowbug 8 /// Midgefly 5 / Mayfly 10 – Damselfly 7 // Blackfly 5 / Stonefly 10 – Crayfish 7 /// Mosquito 4 – Water penny 10 – Clam 6 – Snail 4 – Riffle beetle 9 / Scud 6 Leech 2 – Dobsonfly 9 – Dragonfly 6 Aquatic worm 1 – Fig. 5 (ii) Calculate the total Biotic score for Dragonfly at site 3 in Table 2 below. The total Biotic score is calculated by multiplying the Biotic score of a species by the number of this species found. [1] Table 2 Biotic Index scores at Site 3 Species Biotic score of species Number of each species found Total Biotic score Riffle beetle 9 1 9 Sowbug 8 3 24 Damselfly 7 2 14 Crayfish 7 3 21 Scud 6 2 12 Dragonfly 6 5 Midgefly 5 1 5 Blackfly 5 1 5 Total 18 120
Question paper, page 8
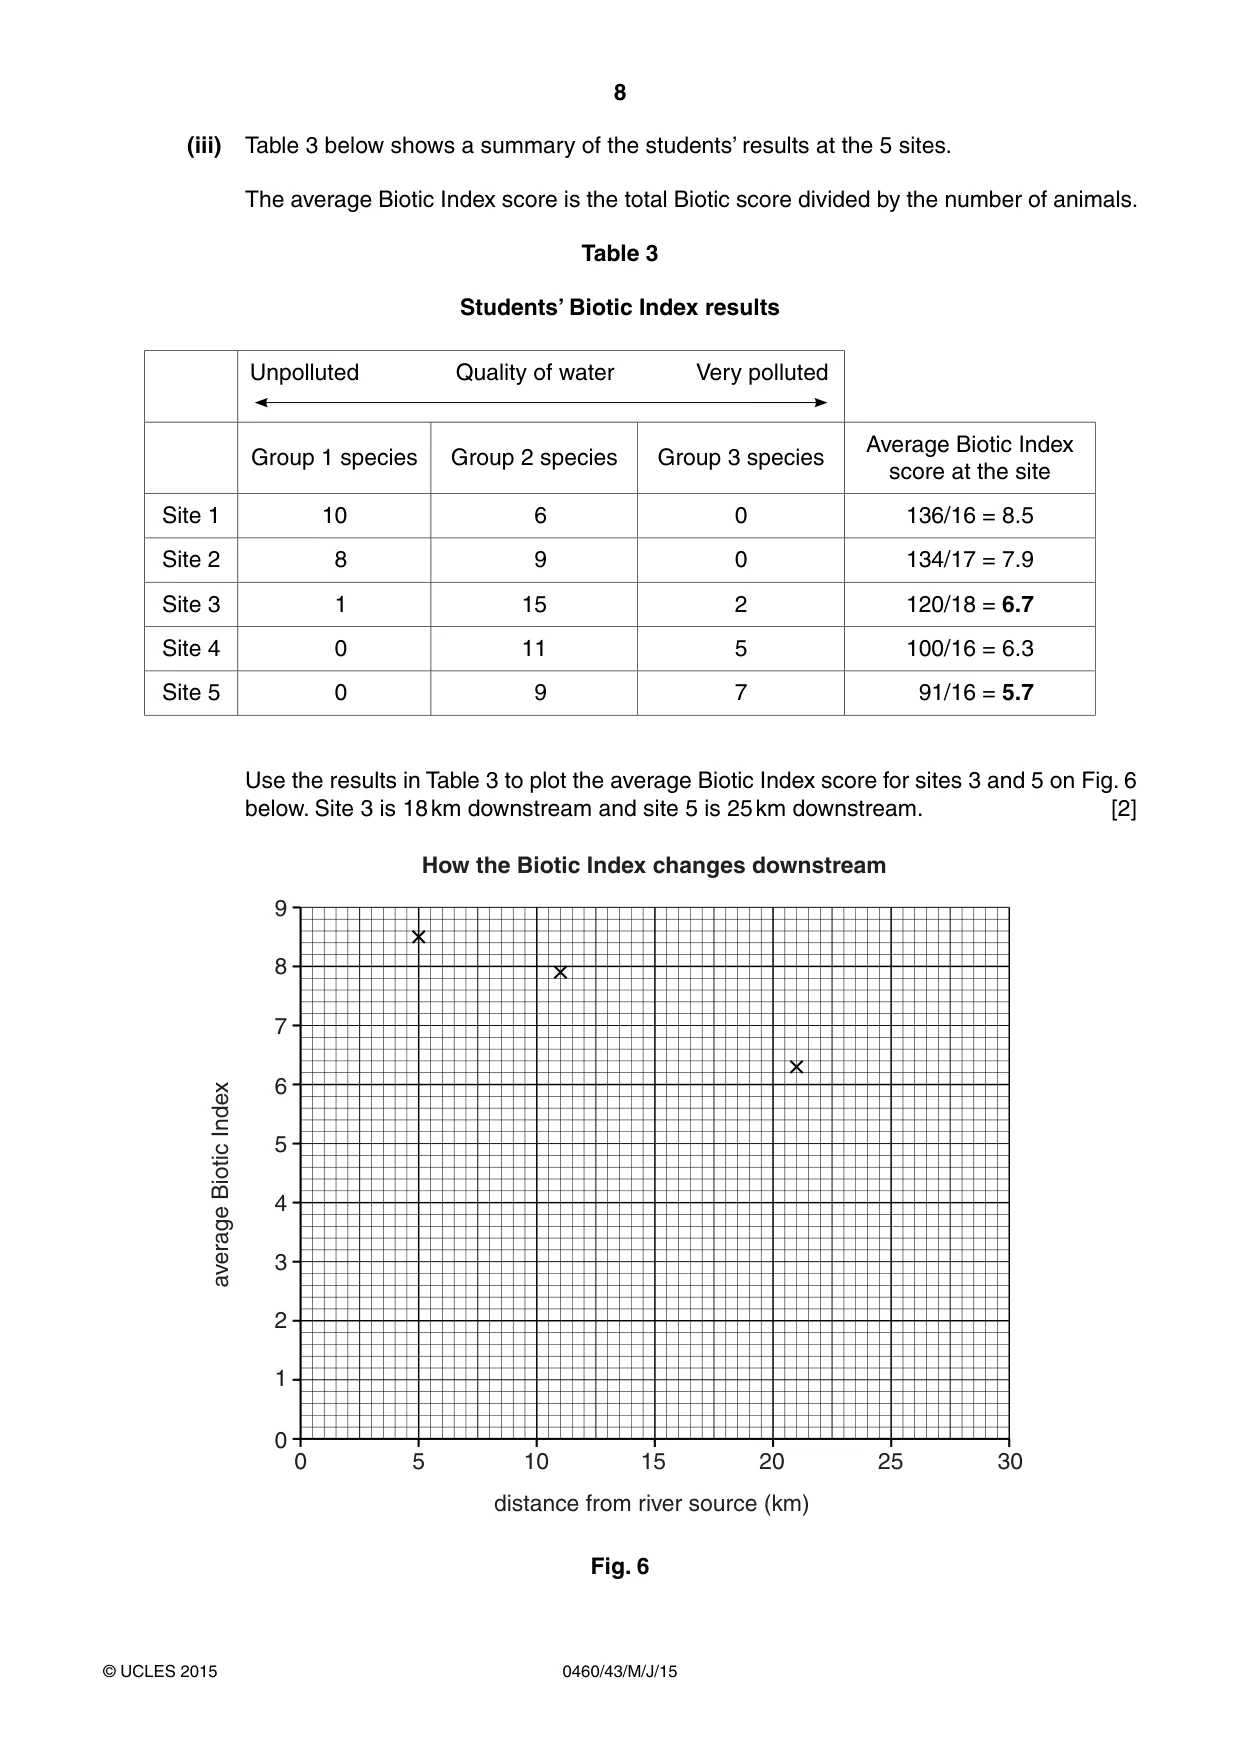
8 0460/43/M/J/15 © UCLES 2015 (iii) Table 3 below shows a summary of the students’ results at the 5 sites. The average Biotic Index score is the total Biotic score divided by the number of animals. Table 3 Students’ Biotic Index results Unpolluted Quality of water Very polluted Group 1 species Group 2 species Group 3 species Average Biotic Index score at the site Site 1 10 6 0 136/16 = 8.5 Site 2 8 9 0 134/17 = 7.9 Site 3 1 15 2 120/18 = 6.7 Site 4 0 11 5 100/16 = 6.3 Site 5 0 9 7 91/16 = 5.7 Use the results in Table 3 to plot the average Biotic Index score for sites 3 and 5 on Fig. 6 below. Site 3 is 18 km downstream and site 5 is 25 km downstream. [2] 0 0 5 10 15 20 25 30 1 2 3 4 5 6 7 8 9 average Biotic Index distance from river source (km) How the Biotic Index changes downstream Fig. 6
Question paper, page 9
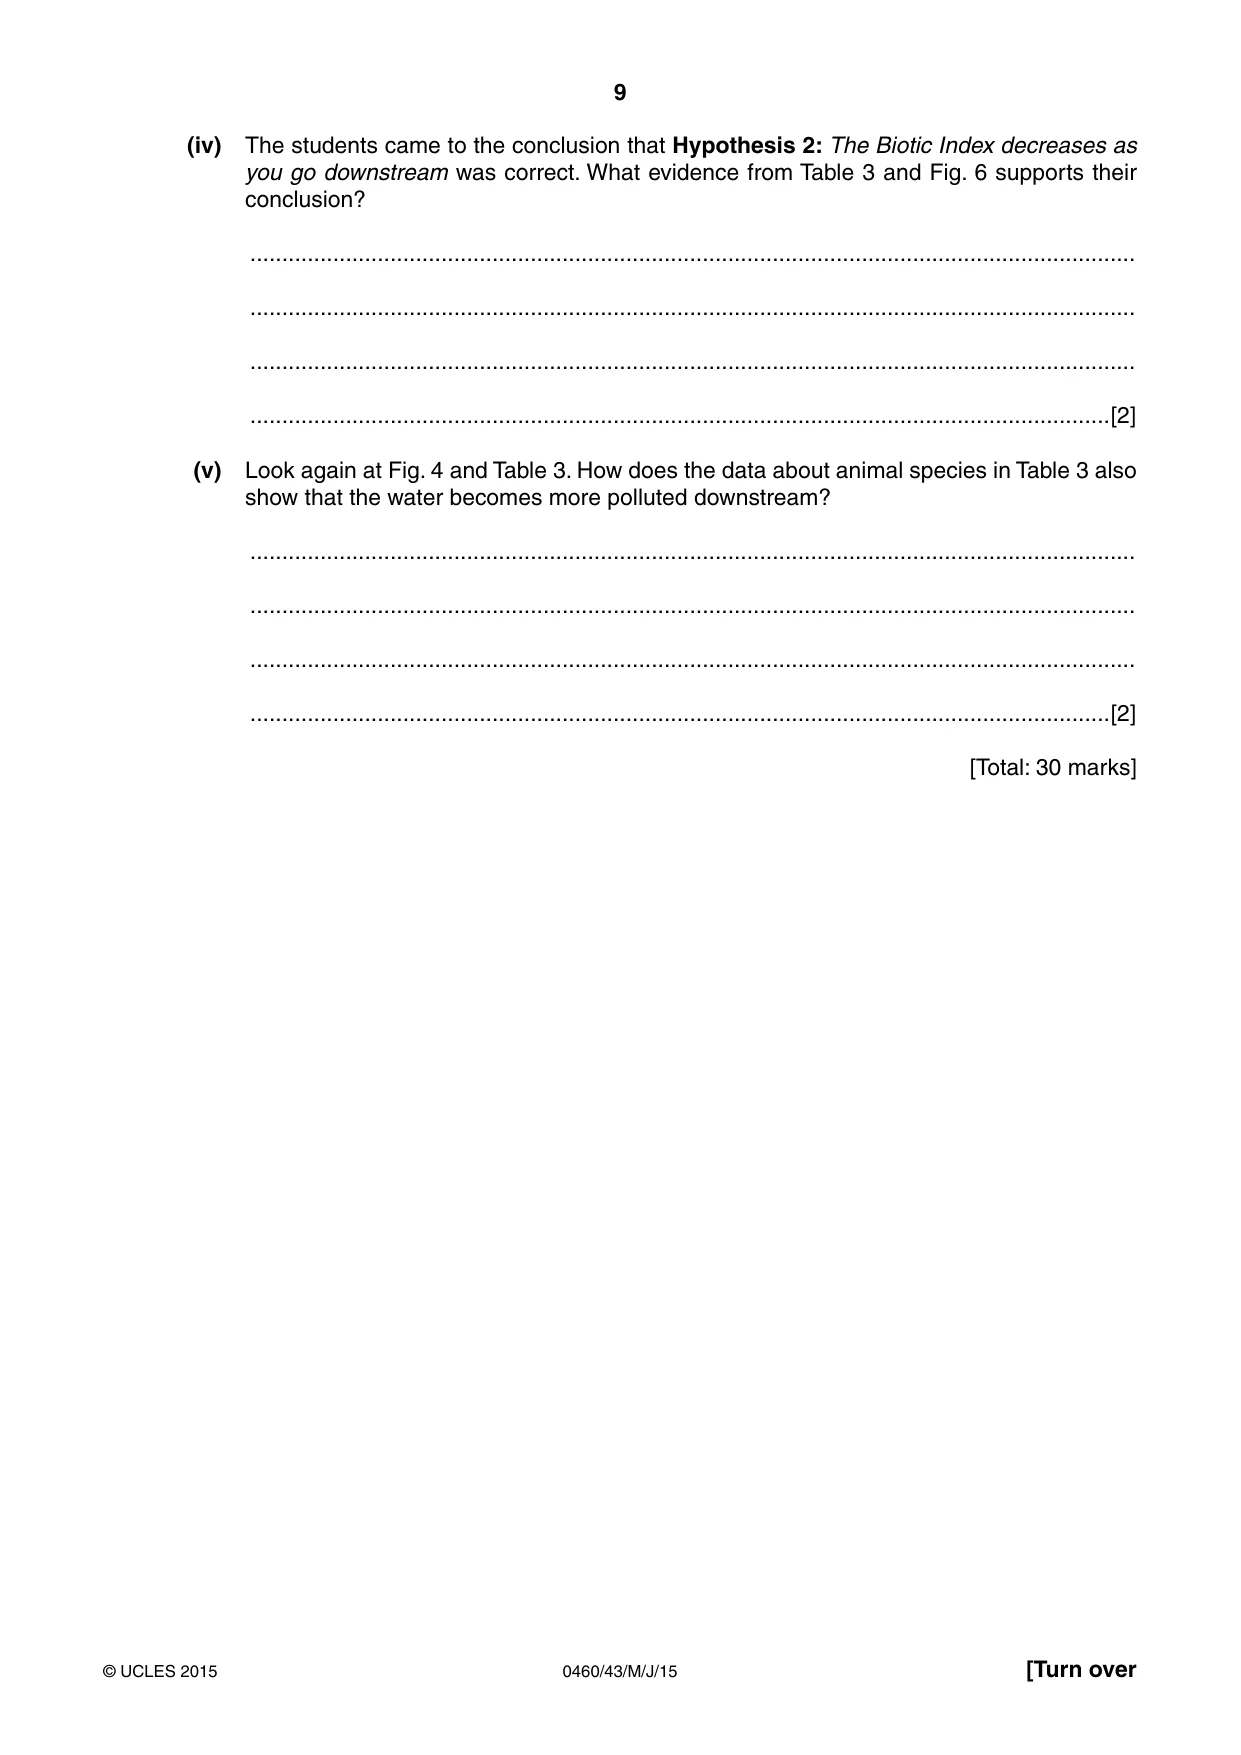
9 0460/43/M/J/15 © UCLES 2015 [Turn over (iv) The students came to the conclusion that Hypothesis 2: The Biotic Index decreases as you go downstream was correct. What evidence from Table 3 and Fig. 6 supports their conclusion? … … … …[2] (v) Look again at Fig. 4 and Table 3. How does the data about animal species in Table 3 also show that the water becomes more polluted downstream? … … … …[2] [Total: 30 marks]
Question paper, page 10
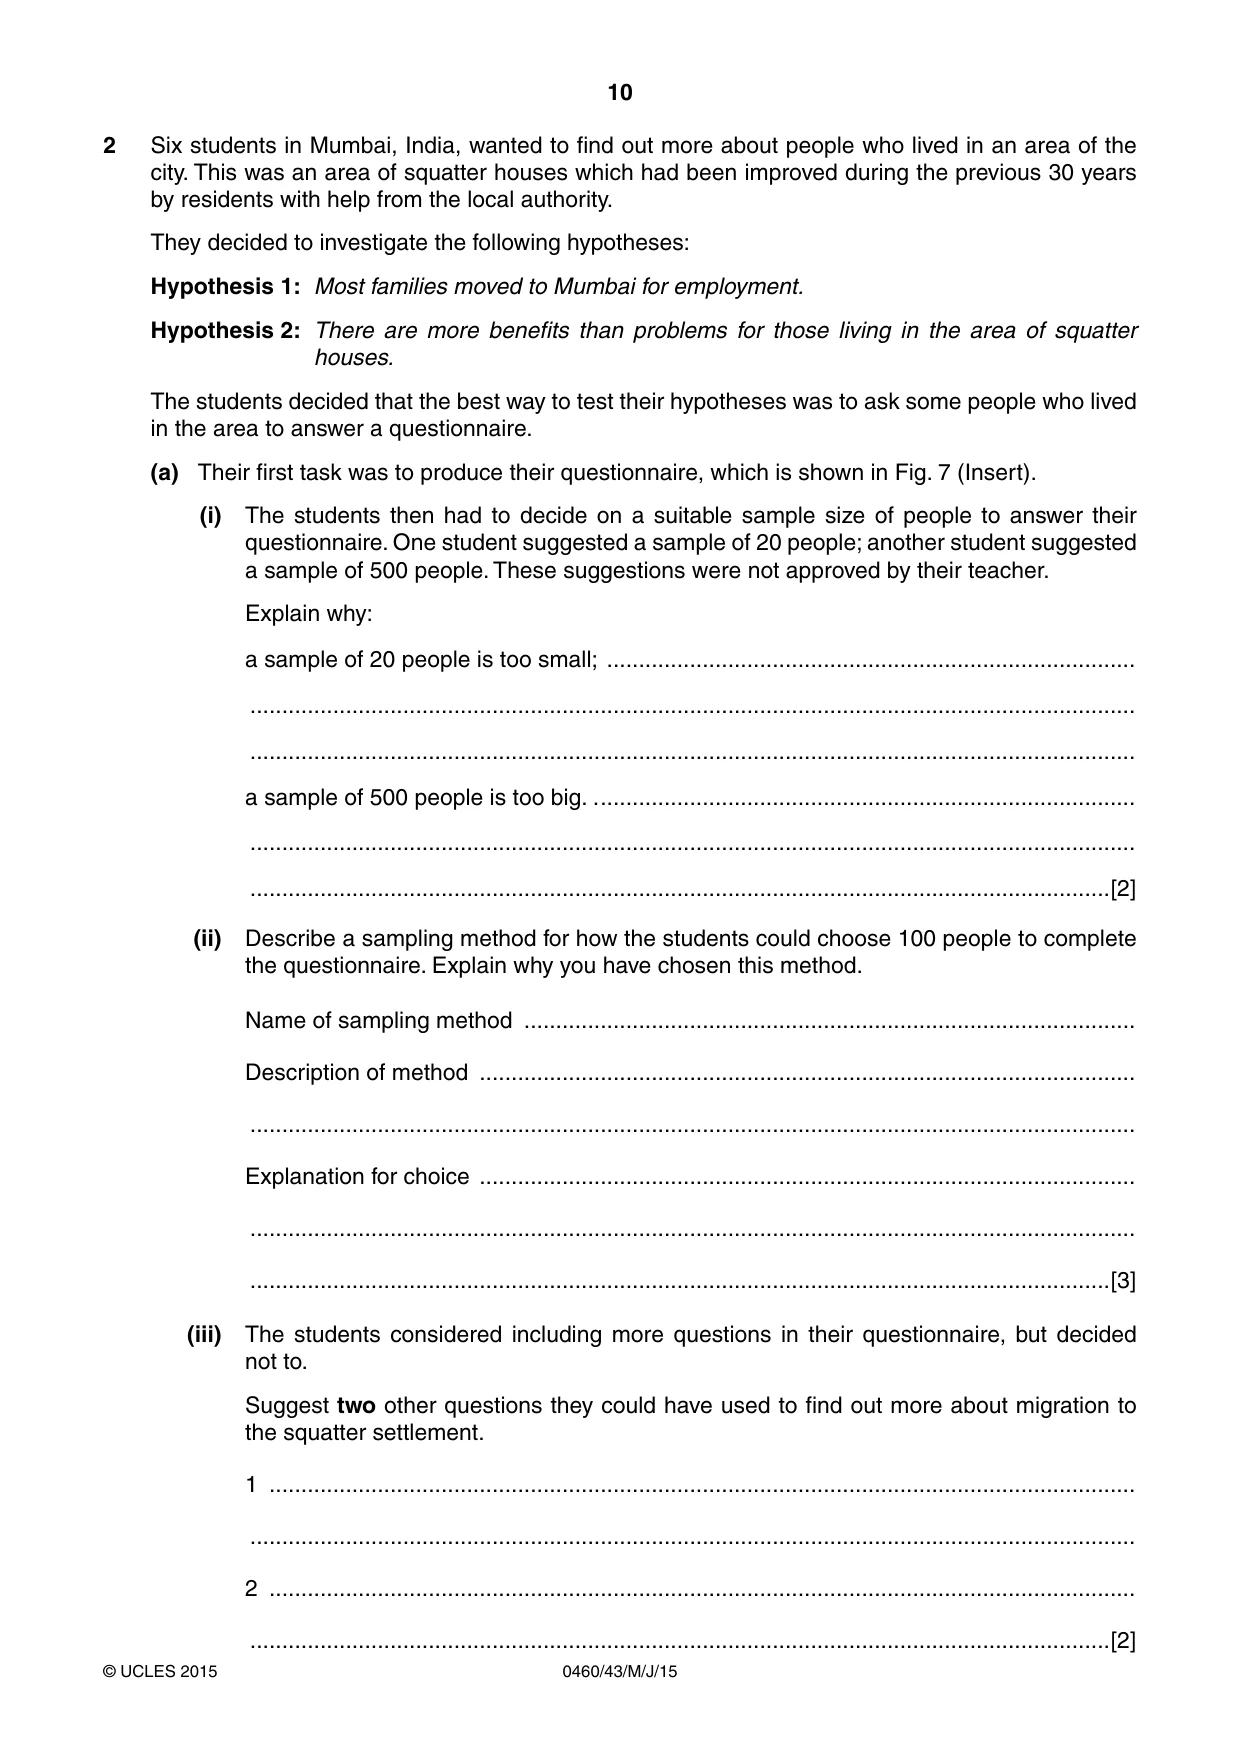
10 0460/43/M/J/15 © UCLES 2015 2 Six students in Mumbai, India, wanted to find out more about people who lived in an area of the city. This was an area of squatter houses which had been improved during the previous 30 years by residents with help from the local authority. They decided to investigate the following hypotheses: Hypothesis 1: Most families moved to Mumbai for employment. Hypothesis 2: There are more benefits than problems for those living in the area of squatter houses. The students decided that the best way to test their hypotheses was to ask some people who lived in the area to answer a questionnaire. (a) Their first task was to produce their questionnaire, which is shown in Fig. 7 (Insert). (i) The students then had to decide on a suitable sample size of people to answer their questionnaire. One student suggested a sample of 20 people; another student suggested a sample of 500 people. These suggestions were not approved by their teacher. Explain why: a sample of 20 people is too small; … … … a sample of 500 people is too big. . … … …[2] (ii) Describe a sampling method for how the students could choose 100 people to complete the questionnaire. Explain why you have chosen this method. Name of sampling method … Description of method … … Explanation for choice … … …[3] (iii) The students considered including more questions in their questionnaire, but decided not to. Suggest two other questions they could have used to find out more about migration to the squatter settlement. 1 … … 2 … …[2]
Question paper, page 11
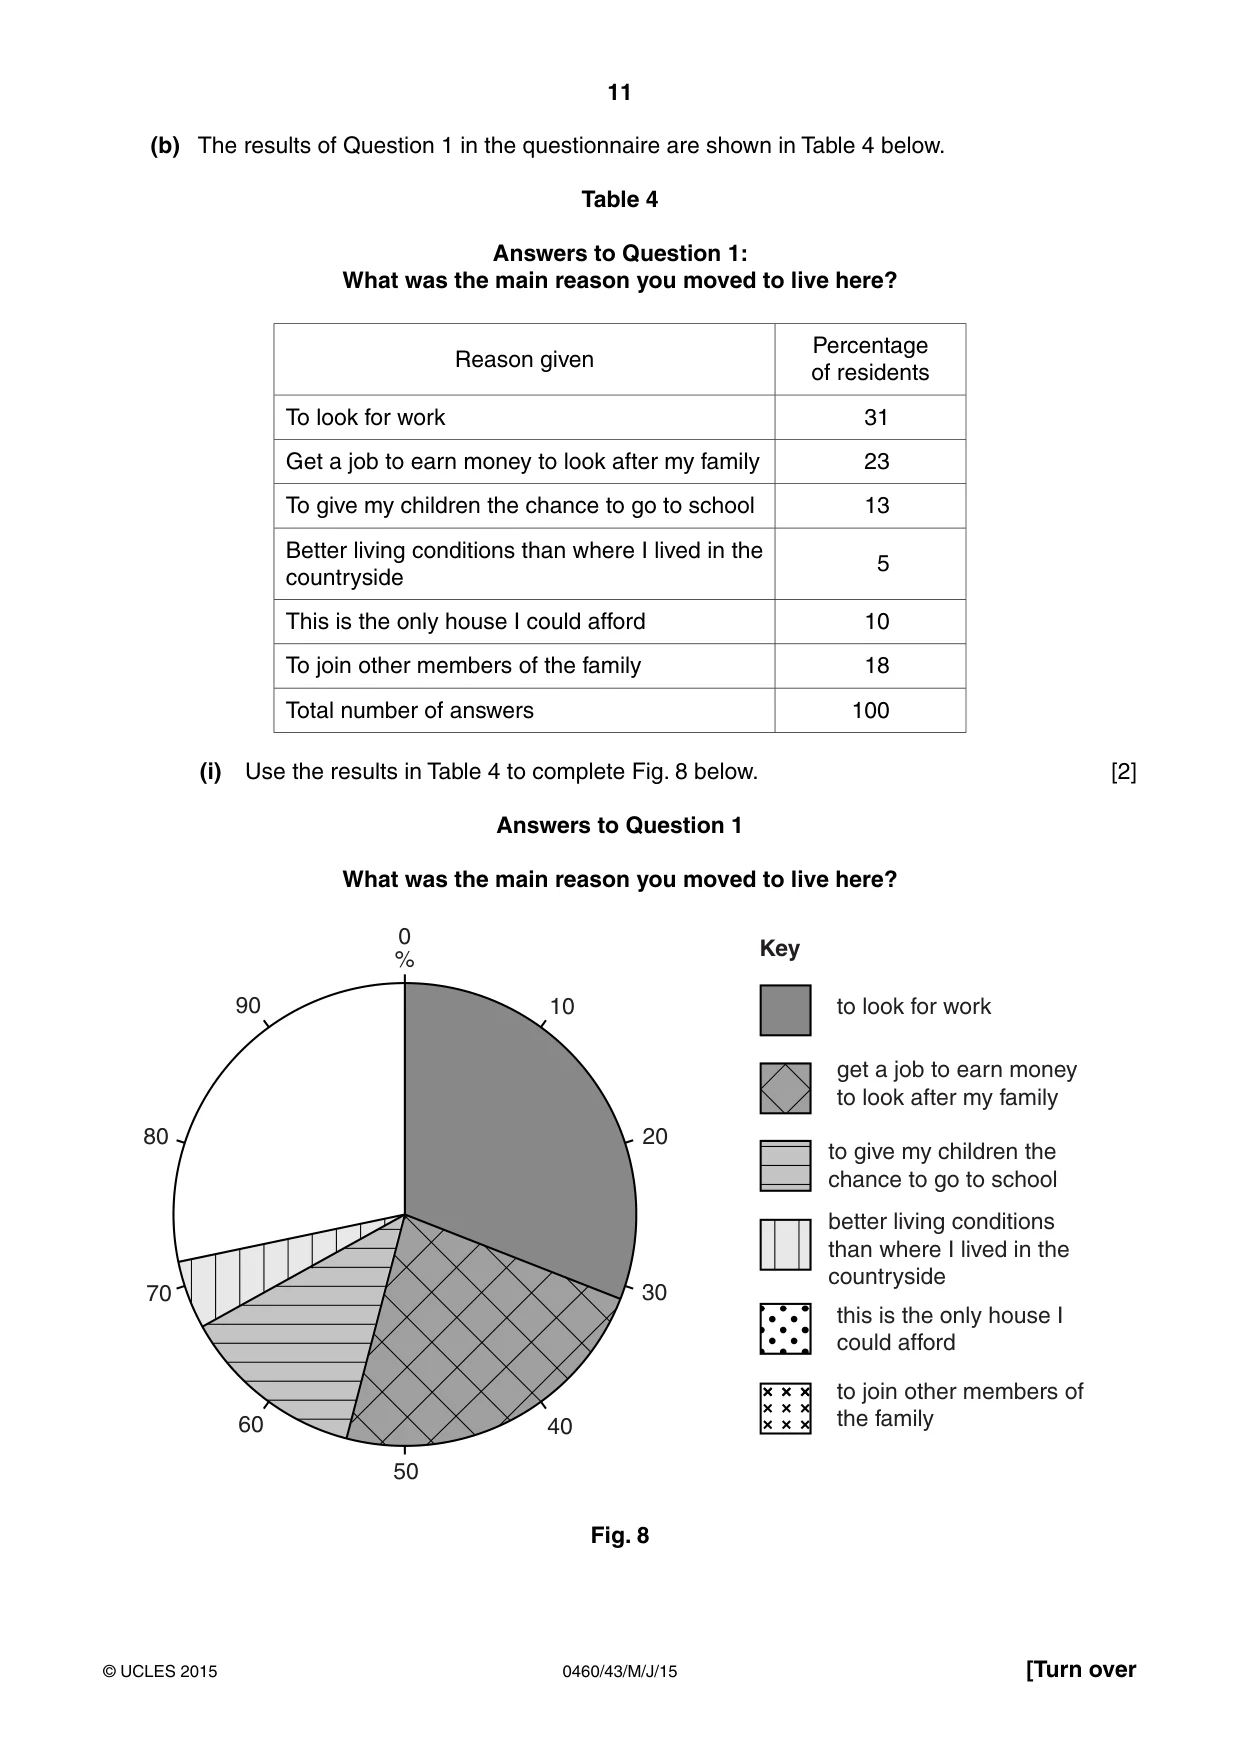
11 0460/43/M/J/15 © UCLES 2015 [Turn over (b) The results of Question 1 in the questionnaire are shown in Table 4 below. Table 4 Answers to Question 1: What was the main reason you moved to live here? Reason given Percentage of residents To look for work 31 Get a job to earn money to look after my family 23 To give my children the chance to go to school 13 Better living conditions than where I lived in the countryside 5 This is the only house I could afford 10 To join other members of the family 18 Total number of answers 100 (i) Use the results in Table 4 to complete Fig. 8 below. [2] Answers to Question 1 What was the main reason you moved to live here? to look for work get a job to earn money to look after my family this is the only house I could afford to join other members of the family to give my children the chance to go to school better living conditions than where I lived in the countryside Key 0 % 10 20 30 40 50 60 70 80 90 Fig. 8
Question paper, page 12
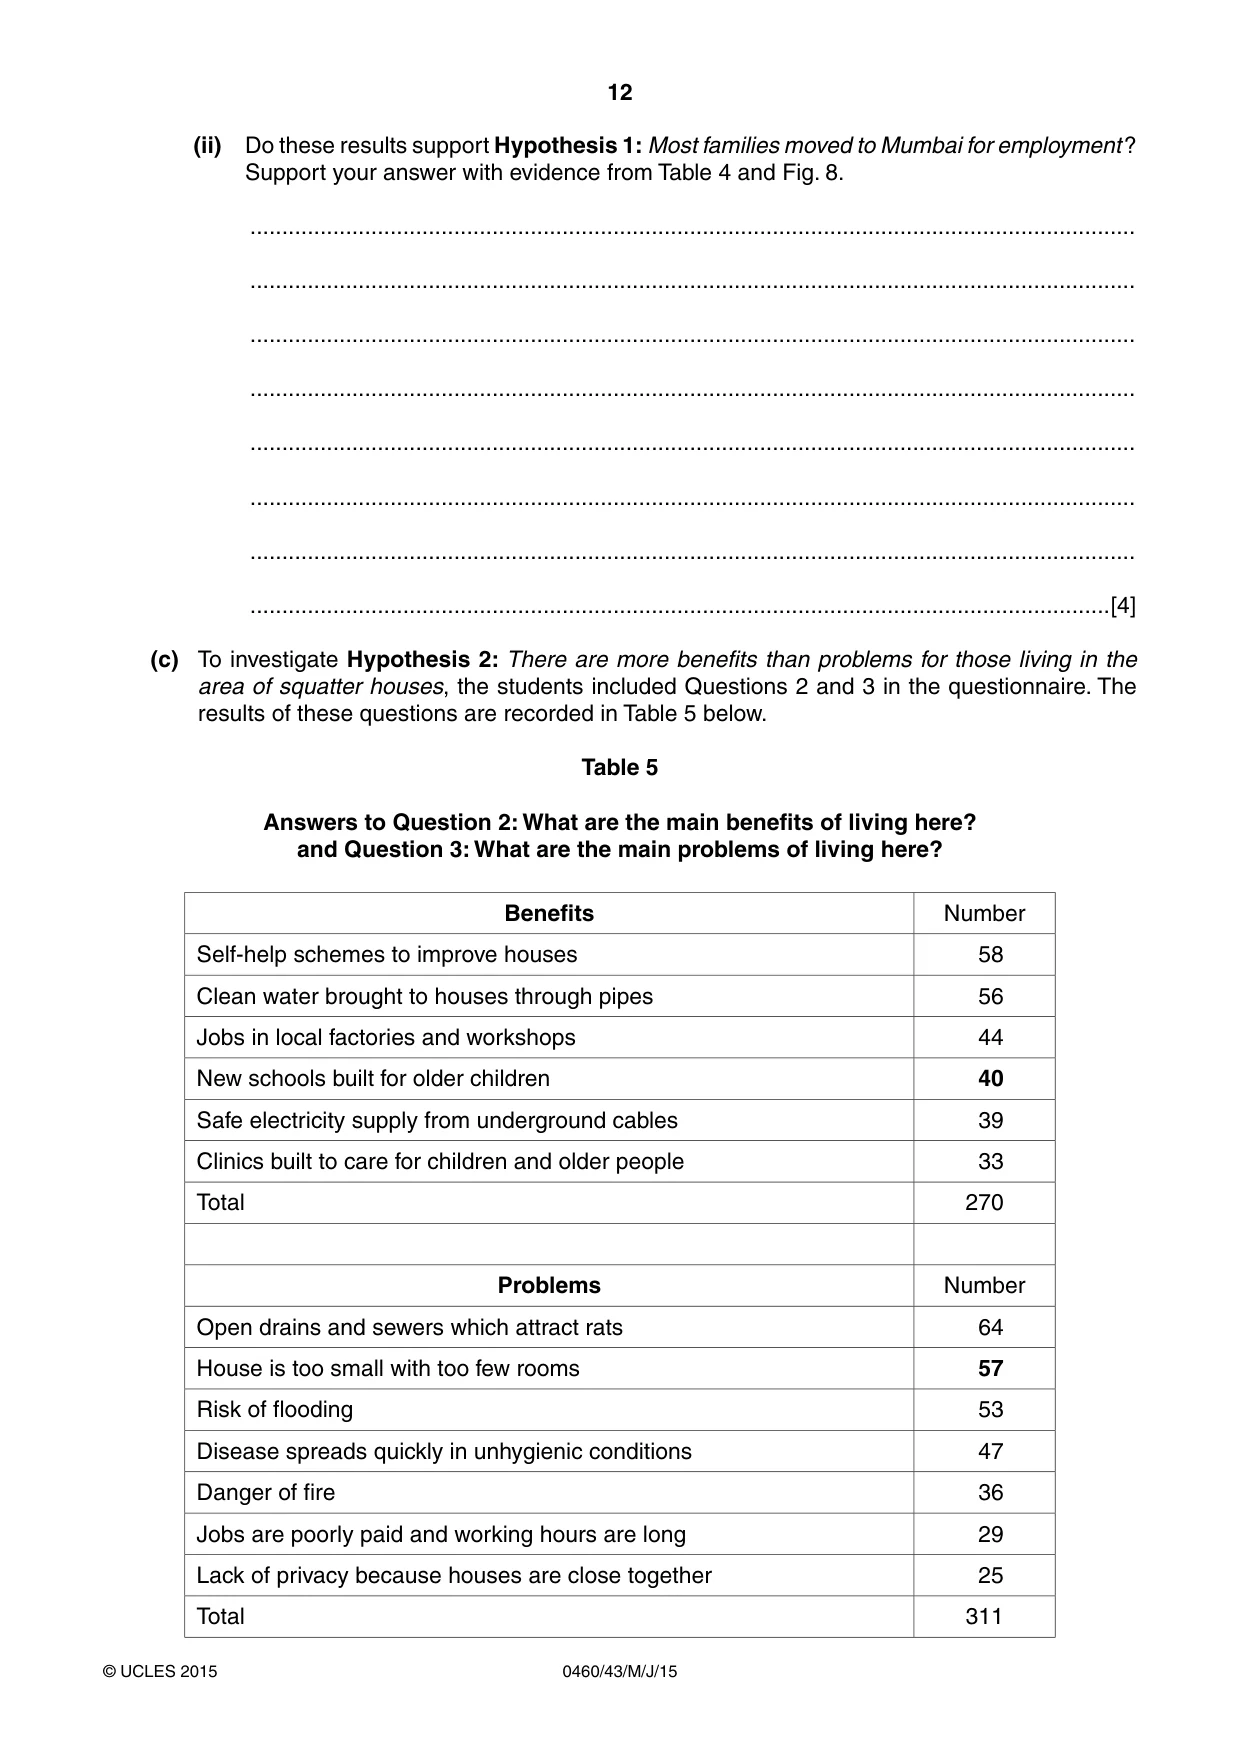
12 0460/43/M/J/15 © UCLES 2015 (ii) Do these results support Hypothesis 1: Most families moved to Mumbai for employment ? Support your answer with evidence from Table 4 and Fig. 8. … … … … … … … …[4] (c) To investigate Hypothesis 2: There are more benefits than problems for those living in the area of squatter houses, the students included Questions 2 and 3 in the questionnaire. The results of these questions are recorded in Table 5 below. Table 5 Answers to Question 2: What are the main benefits of living here? and Question 3: What are the main problems of living here? Benefits Number Self-help schemes to improve houses 58 Clean water brought to houses through pipes 56 Jobs in local factories and workshops 44 New schools built for older children 40 Safe electricity supply from underground cables 39 Clinics built to care for children and older people 33 Total 270 Problems Number Open drains and sewers which attract rats 64 House is too small with too few rooms 57 Risk of flooding 53 Disease spreads quickly in unhygienic conditions 47 Danger of fire 36 Jobs are poorly paid and working hours are long 29 Lack of privacy because houses are close together 25 Total 311
Question paper, page 13
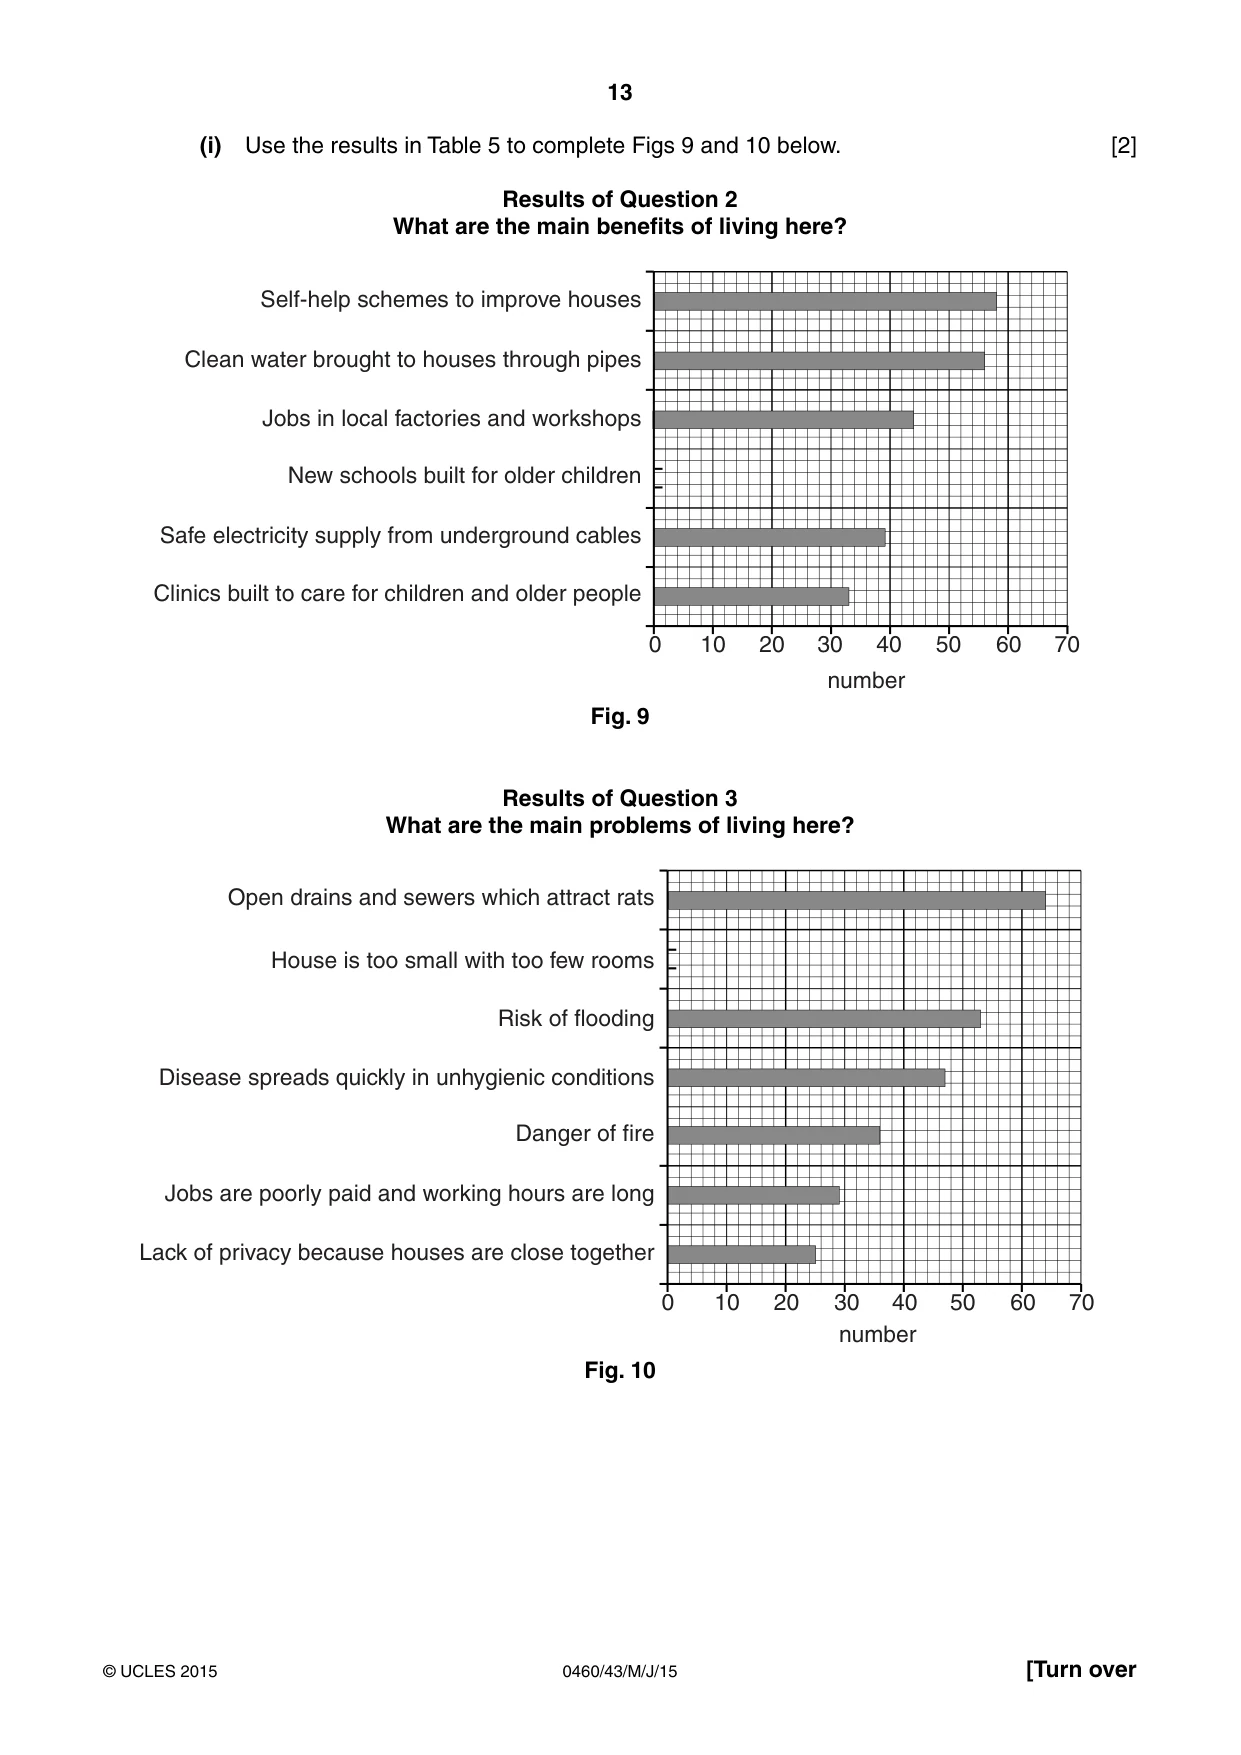
13 0460/43/M/J/15 © UCLES 2015 [Turn over (i) Use the results in Table 5 to complete Figs 9 and 10 below. [2] Results of Question 2 What are the main benefits of living here? Self-help schemes to improve houses Clean water brought to houses through pipes Jobs in local factories and workshops New schools built for older children Safe electricity supply from underground cables Clinics built to care for children and older people 0 10 20 30 40 50 60 70 number Fig. 9 Results of Question 3 What are the main problems of living here? Open drains and sewers which attract rats House is too small with too few rooms Risk of flooding Disease spreads quickly in unhygienic conditions Danger of fire Jobs are poorly paid and working hours are long Lack of privacy because houses are close together 0 10 20 30 40 50 60 70 number Fig. 10
Question paper, page 14
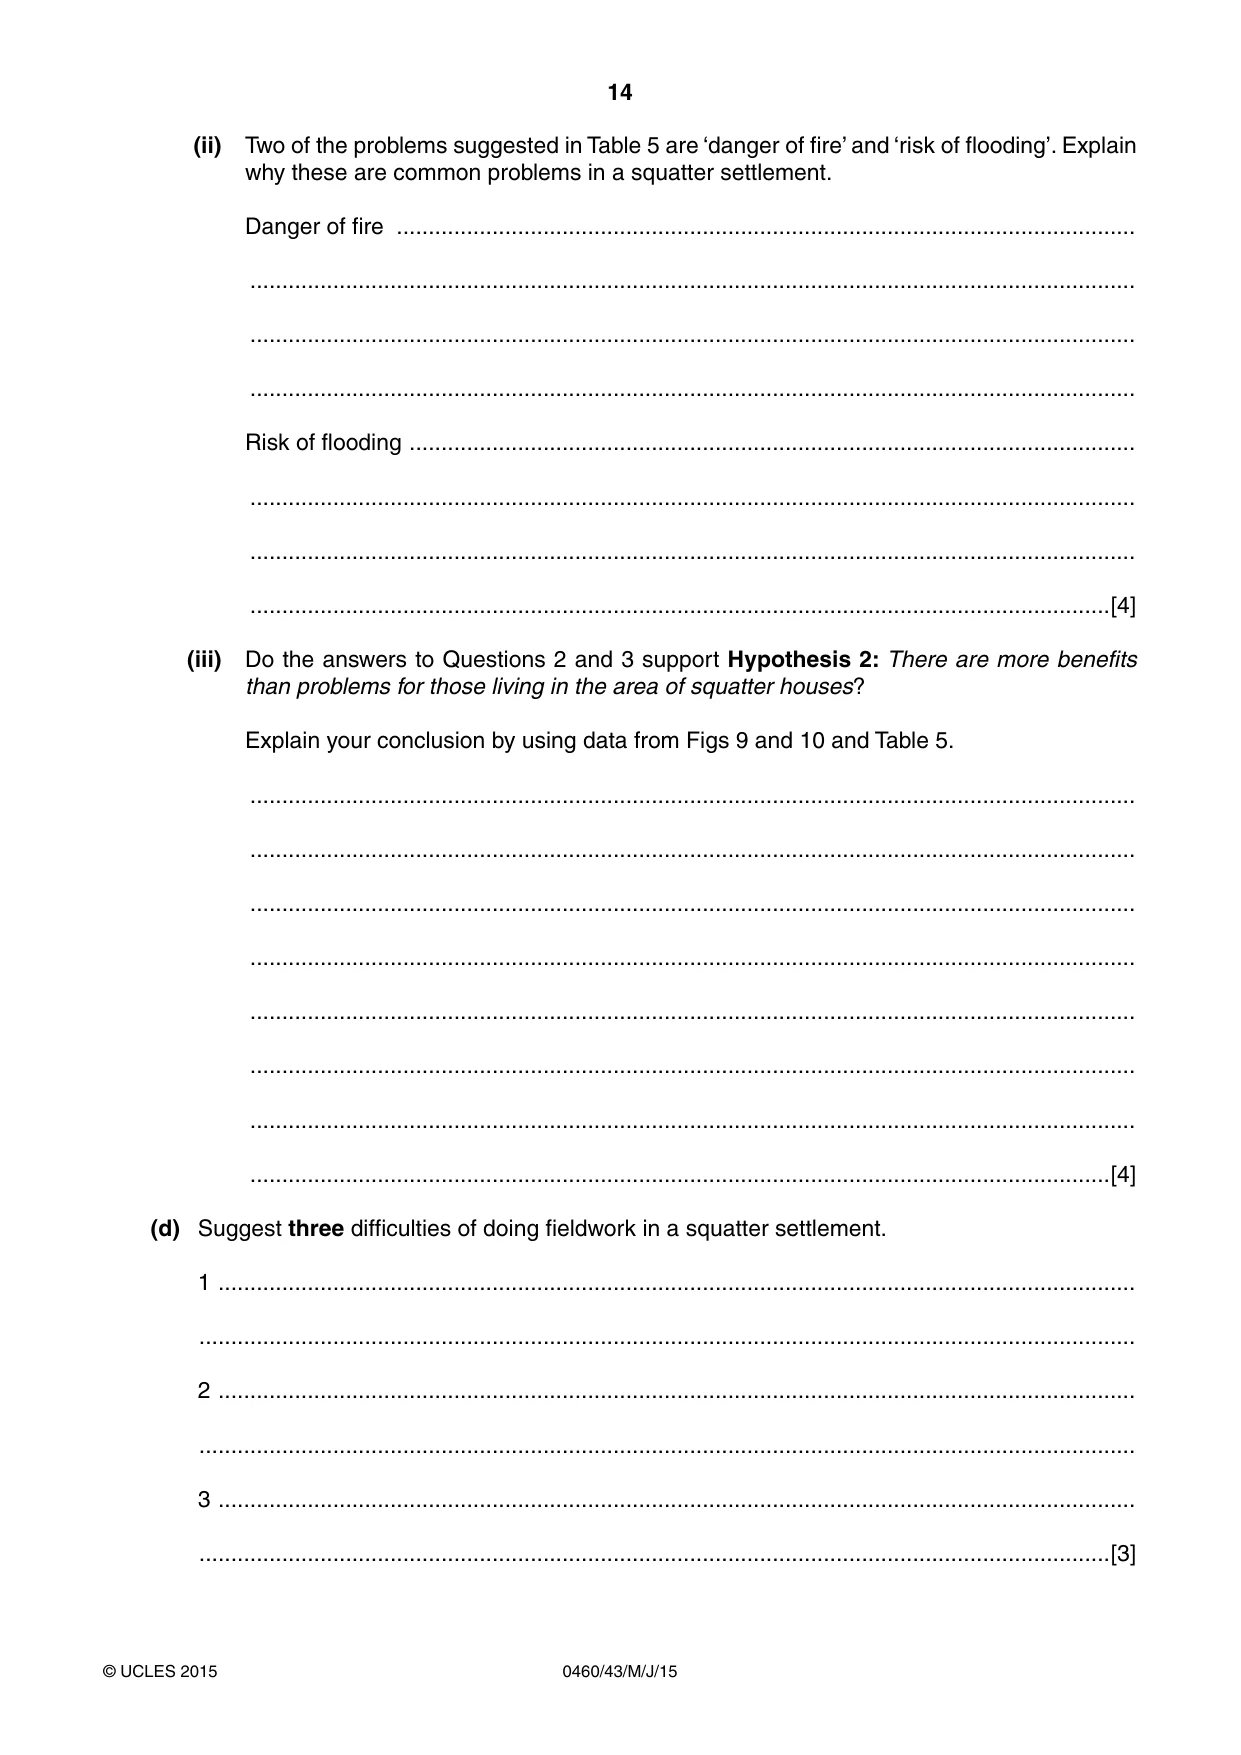
14 0460/43/M/J/15 © UCLES 2015 (ii) Two of the problems suggested in Table 5 are ‘danger of fire’ and ‘risk of flooding’. Explain why these are common problems in a squatter settlement. Danger of fire … … … … Risk of flooding … … … …[4] (iii) Do the answers to Questions 2 and 3 support Hypothesis 2: There are more benefits than problems for those living in the area of squatter houses? Explain your conclusion by using data from Figs 9 and 10 and Table 5. … … … … … … … …[4] (d) Suggest three difficulties of doing fieldwork in a squatter settlement. 1 … … 2 … … 3 … …[3]
Question paper, page 15
15 0460/43/M/J/15 © UCLES 2015 (e) Two other students decided to extend their fieldwork and investigate housing conditions in the area. Describe how they could collect information but do not include a questionnaire. … … … … … … … …[4] [Total: 30 marks]
Question paper, page 16
16 0460/43/M/J/15 © UCLES 2015 BLANK PAGE Permission to reproduce items where third-party owned material protected by copyright is included has been sought and cleared where possible. Every reasonable effort has been made by the publisher (UCLES) to trace copyright holders, but if any items requiring clearance have unwittingly been included, the publisher will be pleased to make amends at the earliest possible opportunity. To avoid the issue of disclosure of answer-related information to candidates, all copyright acknowledgements are reproduced online in the Cambridge International Examinations Copyright Acknowledgements Booklet. This is produced for each series of examinations and is freely available to download at www.cie.org.uk after the live examination series. Cambridge International Examinations is part of the Cambridge Assessment Group. Cambridge Assessment is the brand name of University of Cambridge Local Examinations Syndicate (UCLES), which is itself a department of the University of Cambridge.
Mark scheme, page 1
® IGCSE is the registered trademark of Cambridge International Examinations. CAMBRIDGE INTERNATIONAL EXAMINATIONS Cambridge International General Certificate of Secondary Education MARK SCHEME for the May/June 2015 series 0460 GEOGRAPHY 0460/43 Paper 4 (Alternative to Coursework), maximum raw mark 60 This mark scheme is published as an aid to teachers and candidates, to indicate the requirements of the examination. It shows the basis on which Examiners were instructed to award marks. It does not indicate the details of the discussions that took place at an Examiners’ meeting before marking began, which would have considered the acceptability of alternative answers. Mark schemes should be read in conjunction with the question paper and the Principal Examiner Report for Teachers. Cambridge will not enter into discussions about these mark schemes. Cambridge is publishing the mark schemes for the May/June 2015 series for most Cambridge IGCSE®, Cambridge International A and AS Level components and some Cambridge O Level components.
Mark scheme, page 2
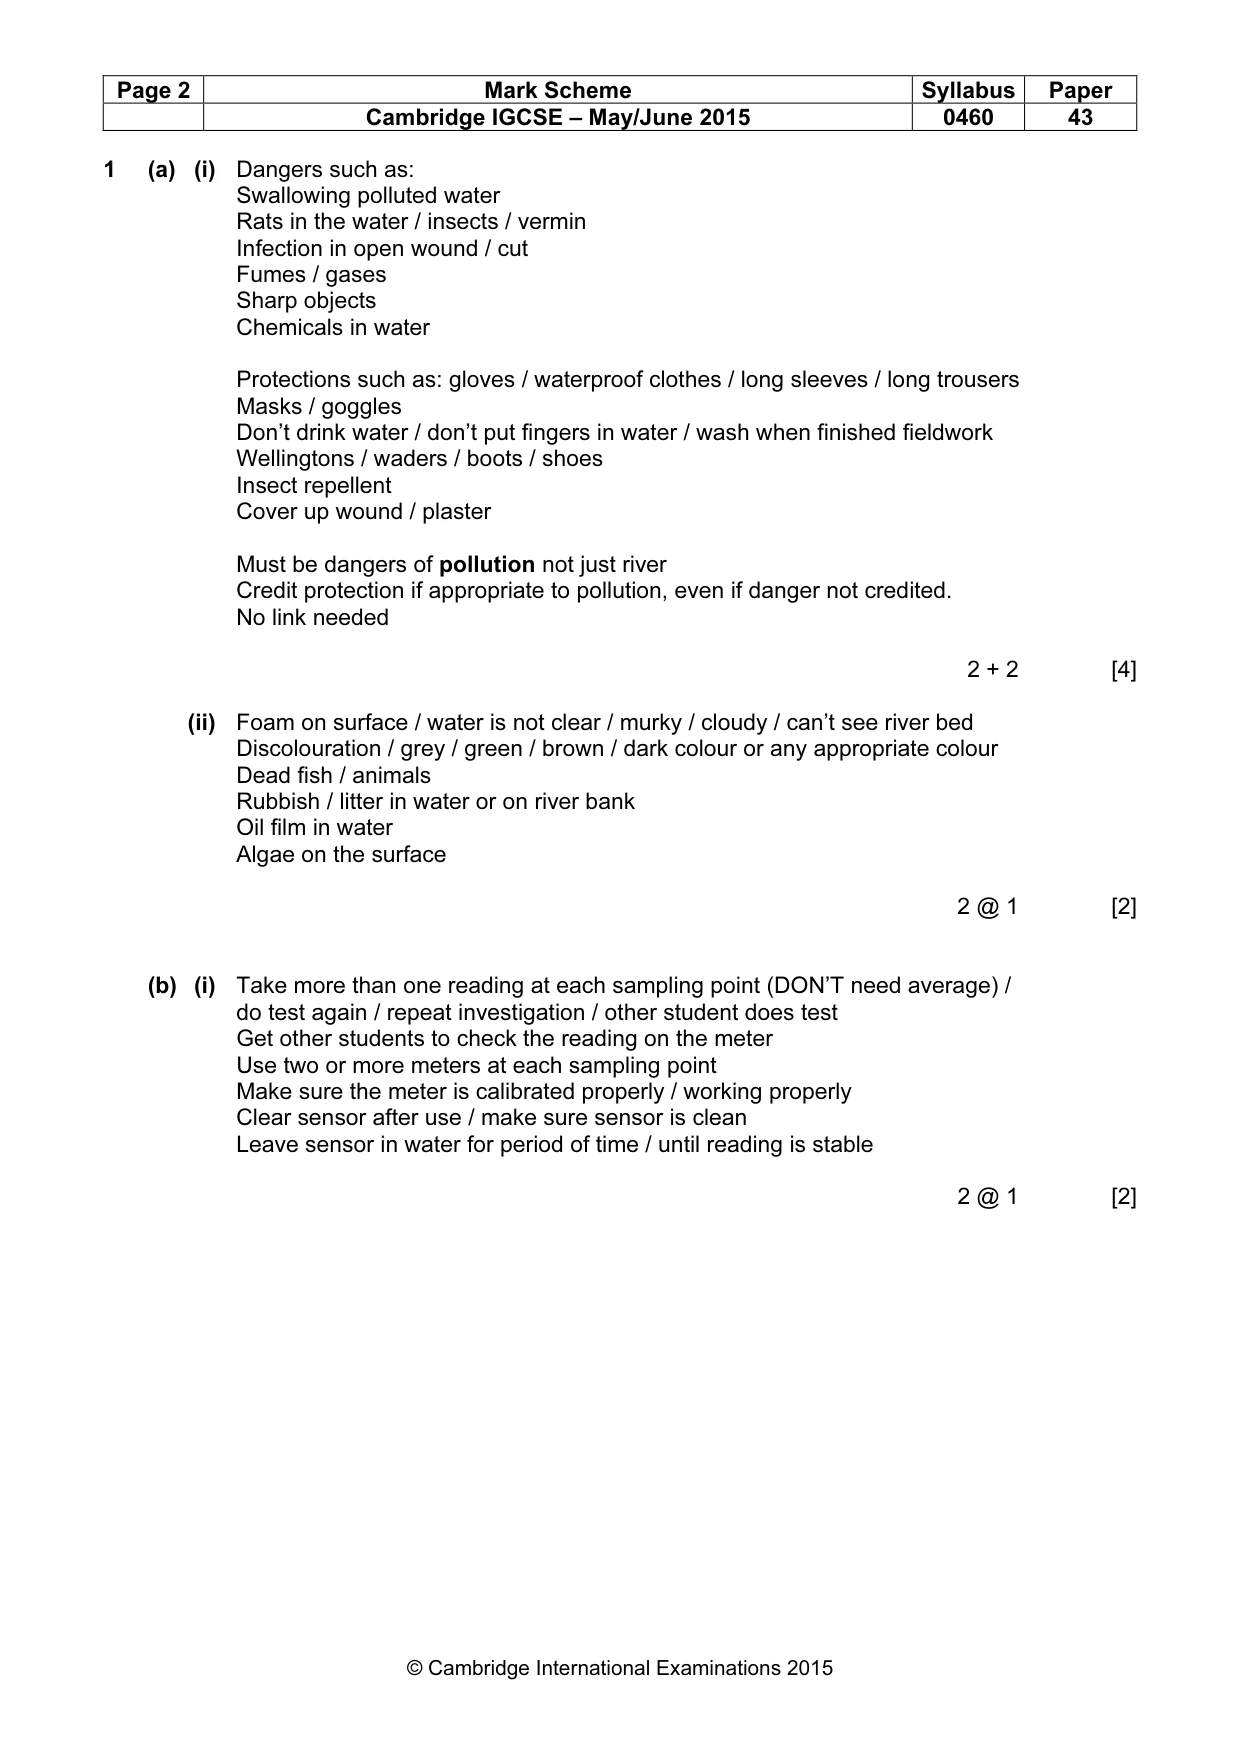
Page 2 Mark Scheme Syllabus Paper Cambridge IGCSE – May/June 2015 0460 43 © Cambridge International Examinations 2015 1 (a) (i) Dangers such as: Swallowing polluted water Rats in the water / insects / vermin Infection in open wound / cut Fumes / gases Sharp objects Chemicals in water Protections such as: gloves / waterproof clothes / long sleeves / long trousers Masks / goggles Don’t drink water / don’t put fingers in water / wash when finished fieldwork Wellingtons / waders / boots / shoes Insect repellent Cover up wound / plaster Must be dangers of pollution not just river Credit protection if appropriate to pollution, even if danger not credited. No link needed 2 + 2 [4] (ii) Foam on surface / water is not clear / murky / cloudy / can’t see river bed Discolouration / grey / green / brown / dark colour or any appropriate colour Dead fish / animals Rubbish / litter in water or on river bank Oil film in water Algae on the surface 2 @ 1 [2] (b) (i) Take more than one reading at each sampling point (DON’T need average) / do test again / repeat investigation / other student does test Get other students to check the reading on the meter Use two or more meters at each sampling point Make sure the meter is calibrated properly / working properly Clear sensor after use / make sure sensor is clean Leave sensor in water for period of time / until reading is stable 2 @ 1 [2]
Mark scheme, page 3
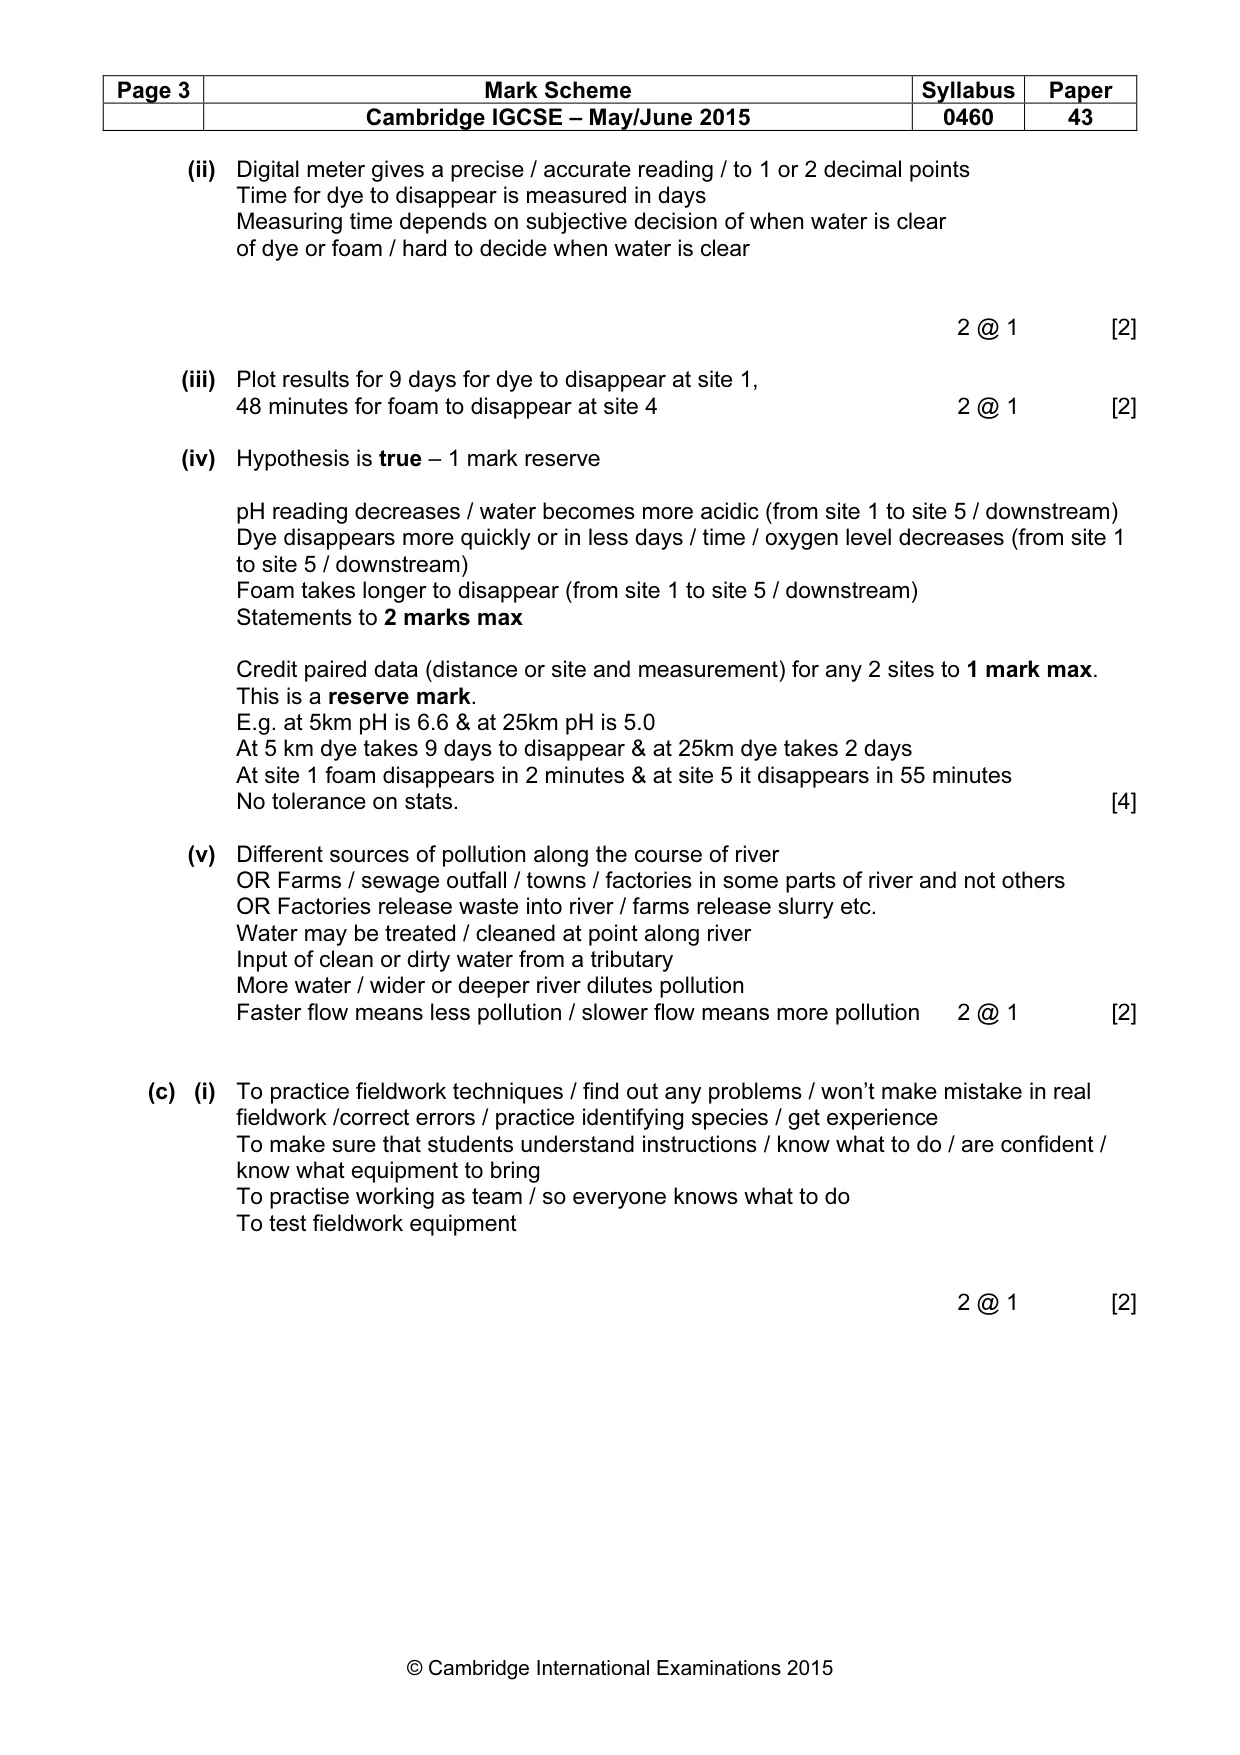
Page 3 Mark Scheme Syllabus Paper Cambridge IGCSE – May/June 2015 0460 43 © Cambridge International Examinations 2015 (ii) Digital meter gives a precise / accurate reading / to 1 or 2 decimal points Time for dye to disappear is measured in days Measuring time depends on subjective decision of when water is clear of dye or foam / hard to decide when water is clear 2 @ 1 [2] (iii) Plot results for 9 days for dye to disappear at site 1, 48 minutes for foam to disappear at site 4 2 @ 1 [2] (iv) Hypothesis is true – 1 mark reserve pH reading decreases / water becomes more acidic (from site 1 to site 5 / downstream) Dye disappears more quickly or in less days / time / oxygen level decreases (from site 1 to site 5 / downstream) Foam takes longer to disappear (from site 1 to site 5 / downstream) Statements to 2 marks max Credit paired data (distance or site and measurement) for any 2 sites to 1 mark max. This is a reserve mark. E.g. at 5km pH is 6.6 & at 25km pH is 5.0 At 5 km dye takes 9 days to disappear & at 25km dye takes 2 days At site 1 foam disappears in 2 minutes & at site 5 it disappears in 55 minutes No tolerance on stats. [4] (v) Different sources of pollution along the course of river OR Farms / sewage outfall / towns / factories in some parts of river and not others OR Factories release waste into river / farms release slurry etc. Water may be treated / cleaned at point along river Input of clean or dirty water from a tributary More water / wider or deeper river dilutes pollution Faster flow means less pollution / slower flow means more pollution 2 @ 1 [2] (c) (i) To practice fieldwork techniques / find out any problems / won’t make mistake in real fieldwork /correct errors / practice identifying species / get experience To make sure that students understand instructions / know what to do / are confident / know what equipment to bring To practise working as team / so everyone knows what to do To test fieldwork equipment 2 @ 1 [2]
Mark scheme, page 4
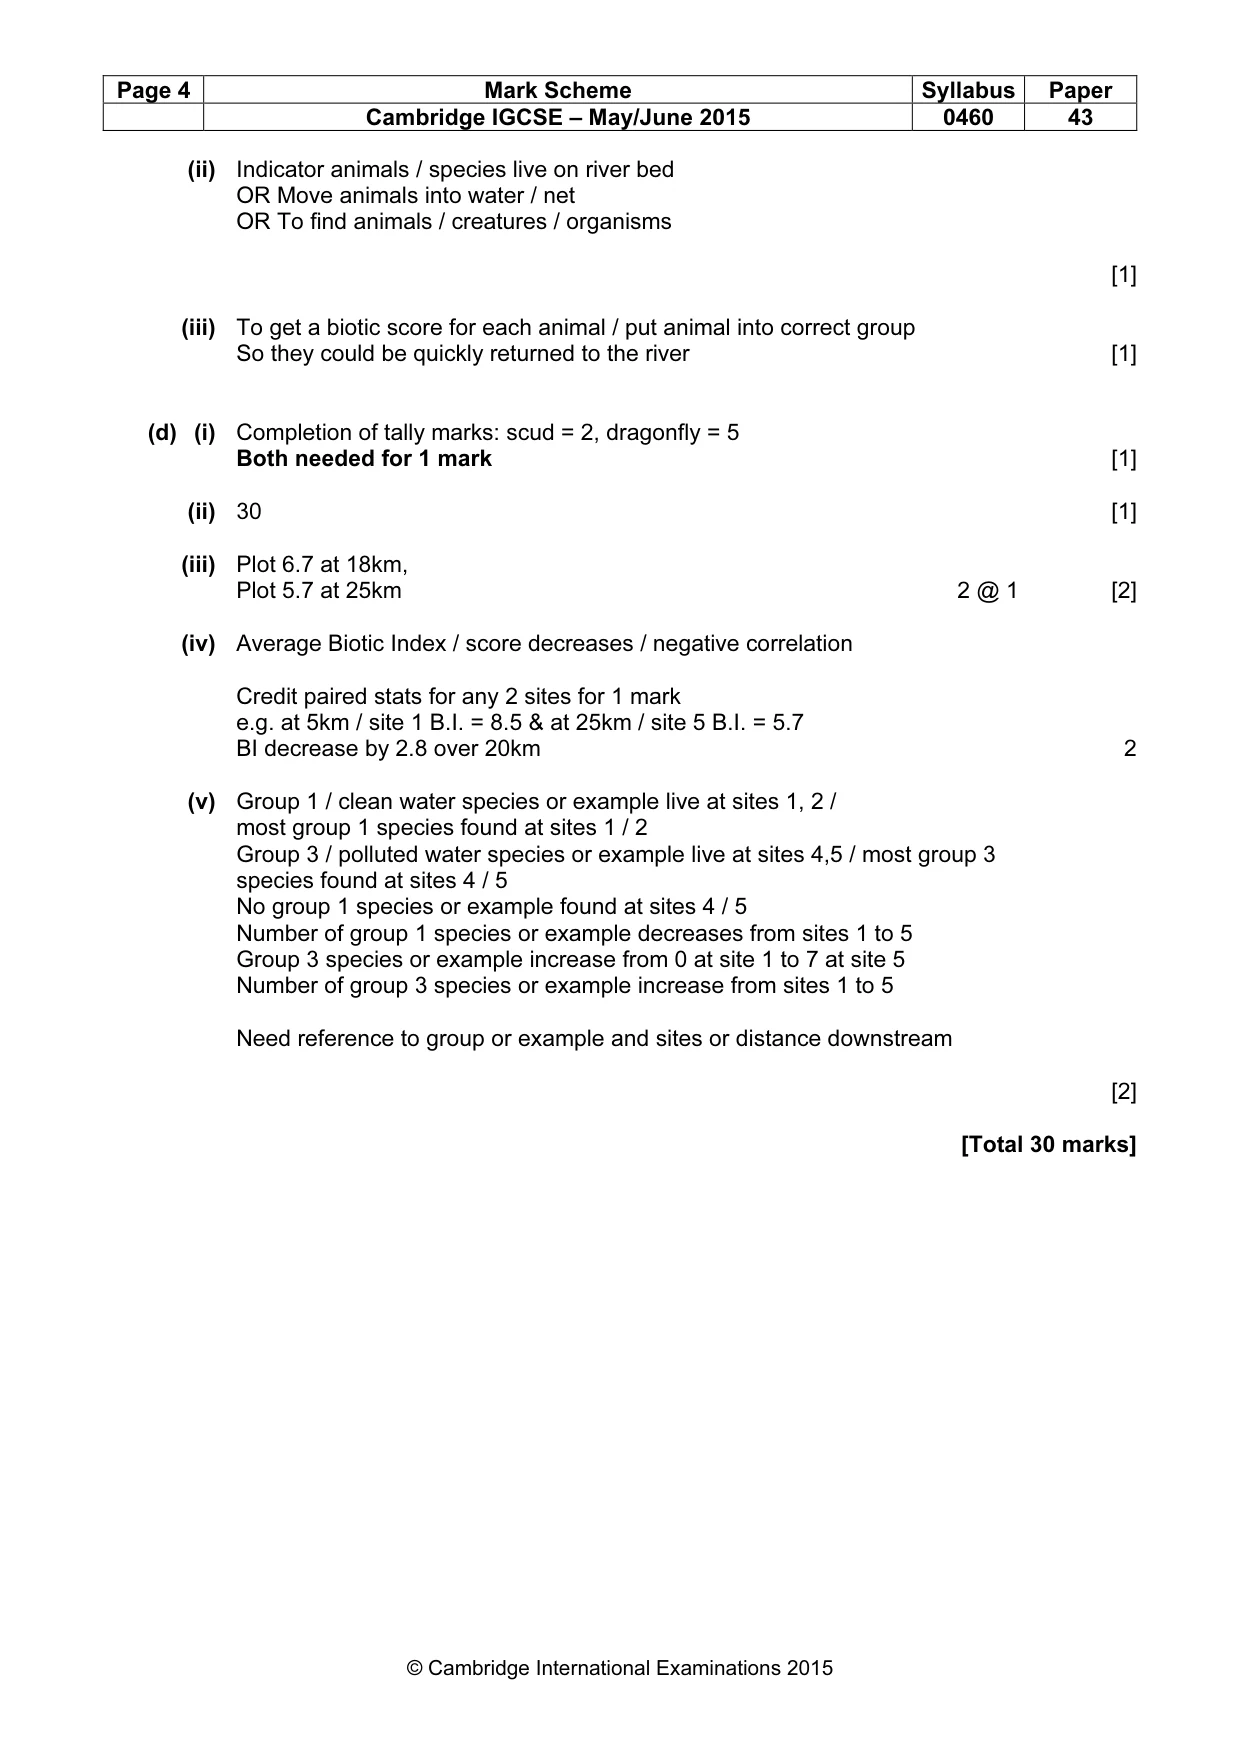
Page 4 Mark Scheme Syllabus Paper Cambridge IGCSE – May/June 2015 0460 43 © Cambridge International Examinations 2015 (ii) Indicator animals / species live on river bed OR Move animals into water / net OR To find animals / creatures / organisms [1] (iii) To get a biotic score for each animal / put animal into correct group So they could be quickly returned to the river [1] (d) (i) Completion of tally marks: scud = 2, dragonfly = 5 Both needed for 1 mark [1] (ii) 30 [1] (iii) Plot 6.7 at 18km, Plot 5.7 at 25km 2 @ 1 [2] (iv) Average Biotic Index / score decreases / negative correlation Credit paired stats for any 2 sites for 1 mark e.g. at 5km / site 1 B.I. = 8.5 & at 25km / site 5 B.I. = 5.7 BI decrease by 2.8 over 20km 2 (v) Group 1 / clean water species or example live at sites 1, 2 / most group 1 species found at sites 1 / 2 Group 3 / polluted water species or example live at sites 4,5 / most group 3 species found at sites 4 / 5 No group 1 species or example found at sites 4 / 5 Number of group 1 species or example decreases from sites 1 to 5 Group 3 species or example increase from 0 at site 1 to 7 at site 5 Number of group 3 species or example increase from sites 1 to 5 Need reference to group or example and sites or distance downstream [2] [Total 30 marks]
Mark scheme, page 5
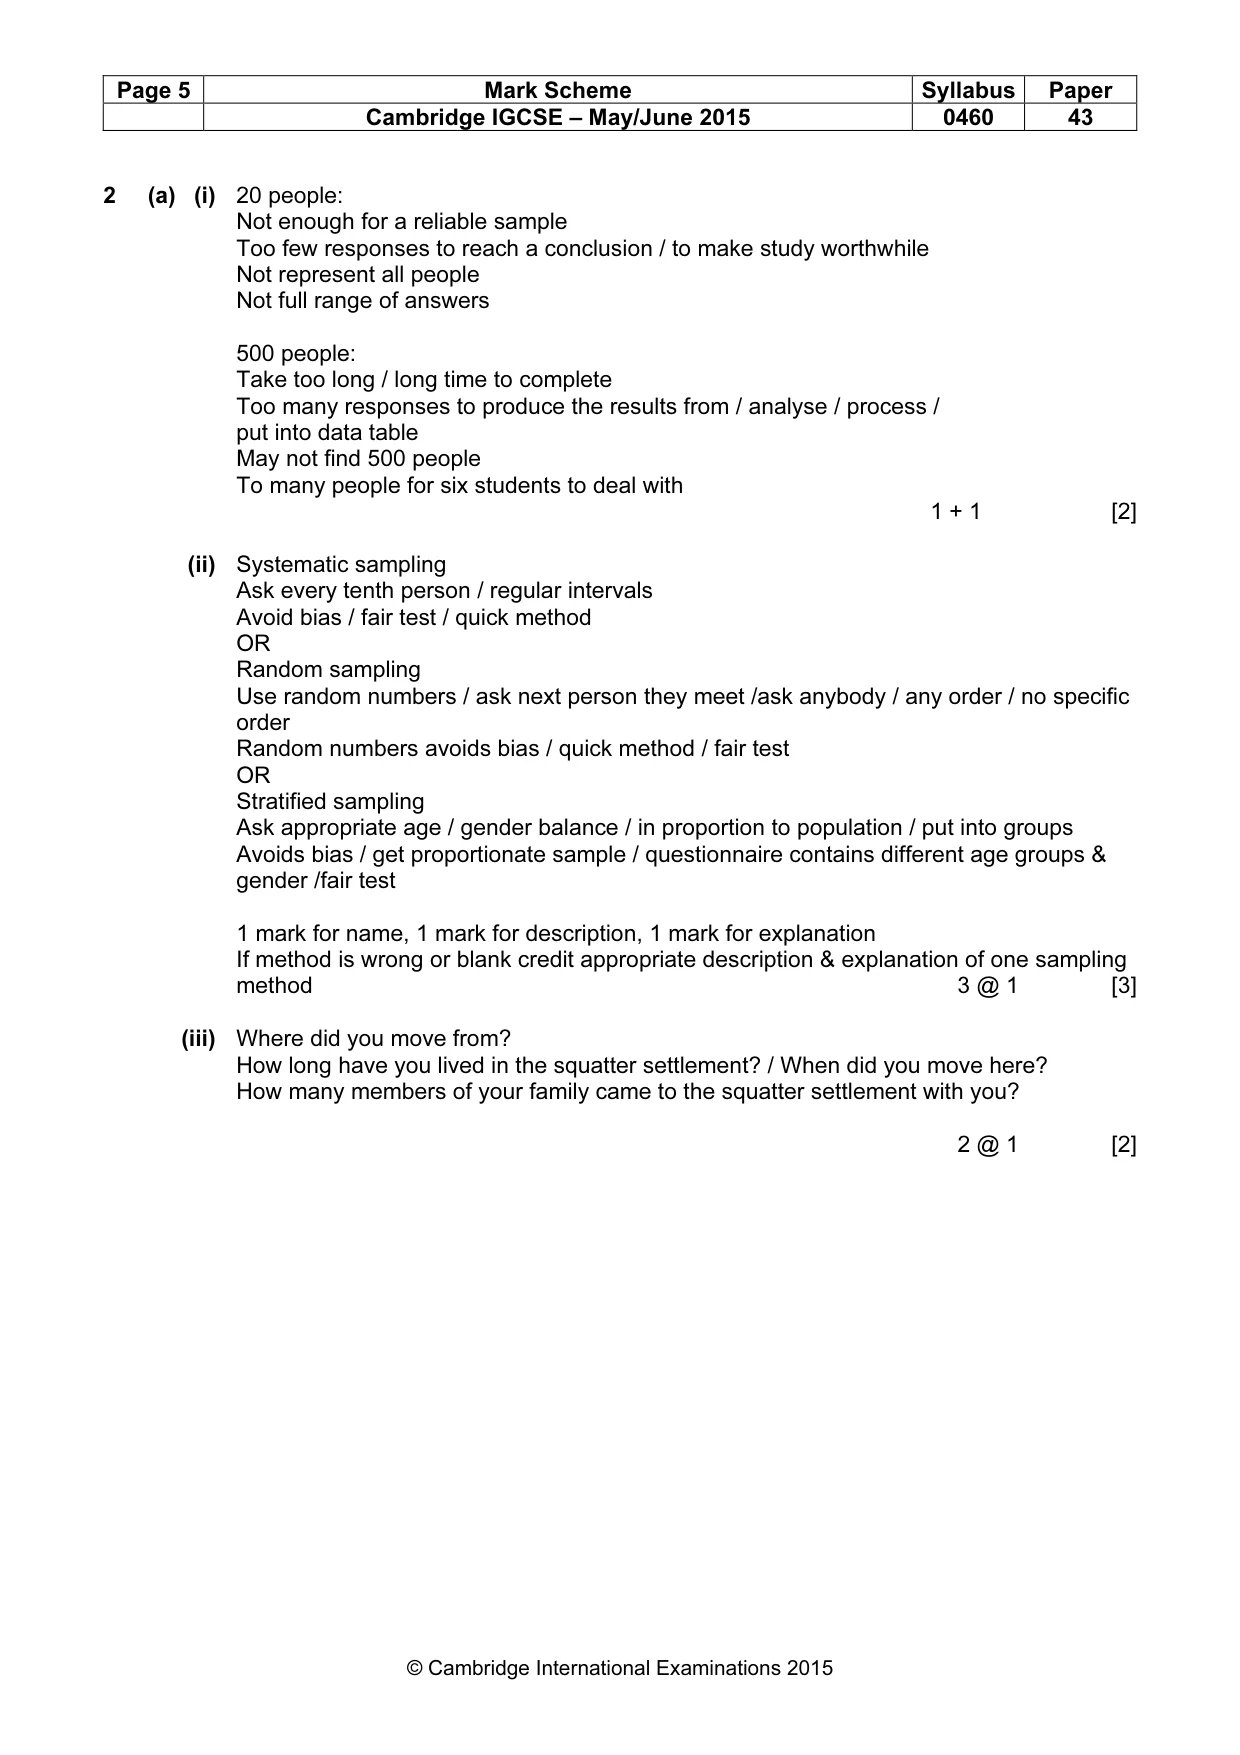
Page 5 Mark Scheme Syllabus Paper Cambridge IGCSE – May/June 2015 0460 43 © Cambridge International Examinations 2015 2 (a) (i) 20 people: Not enough for a reliable sample Too few responses to reach a conclusion / to make study worthwhile Not represent all people Not full range of answers 500 people: Take too long / long time to complete Too many responses to produce the results from / analyse / process / put into data table May not find 500 people To many people for six students to deal with 1 + 1 [2] (ii) Systematic sampling Ask every tenth person / regular intervals Avoid bias / fair test / quick method OR Random sampling Use random numbers / ask next person they meet /ask anybody / any order / no specific order Random numbers avoids bias / quick method / fair test OR Stratified sampling Ask appropriate age / gender balance / in proportion to population / put into groups Avoids bias / get proportionate sample / questionnaire contains different age groups & gender /fair test 1 mark for name, 1 mark for description, 1 mark for explanation If method is wrong or blank credit appropriate description & explanation of one sampling method 3 @ 1 [3] (iii) Where did you move from? How long have you lived in the squatter settlement? / When did you move here? How many members of your family came to the squatter settlement with you? 2 @ 1 [2]
Mark scheme, page 6
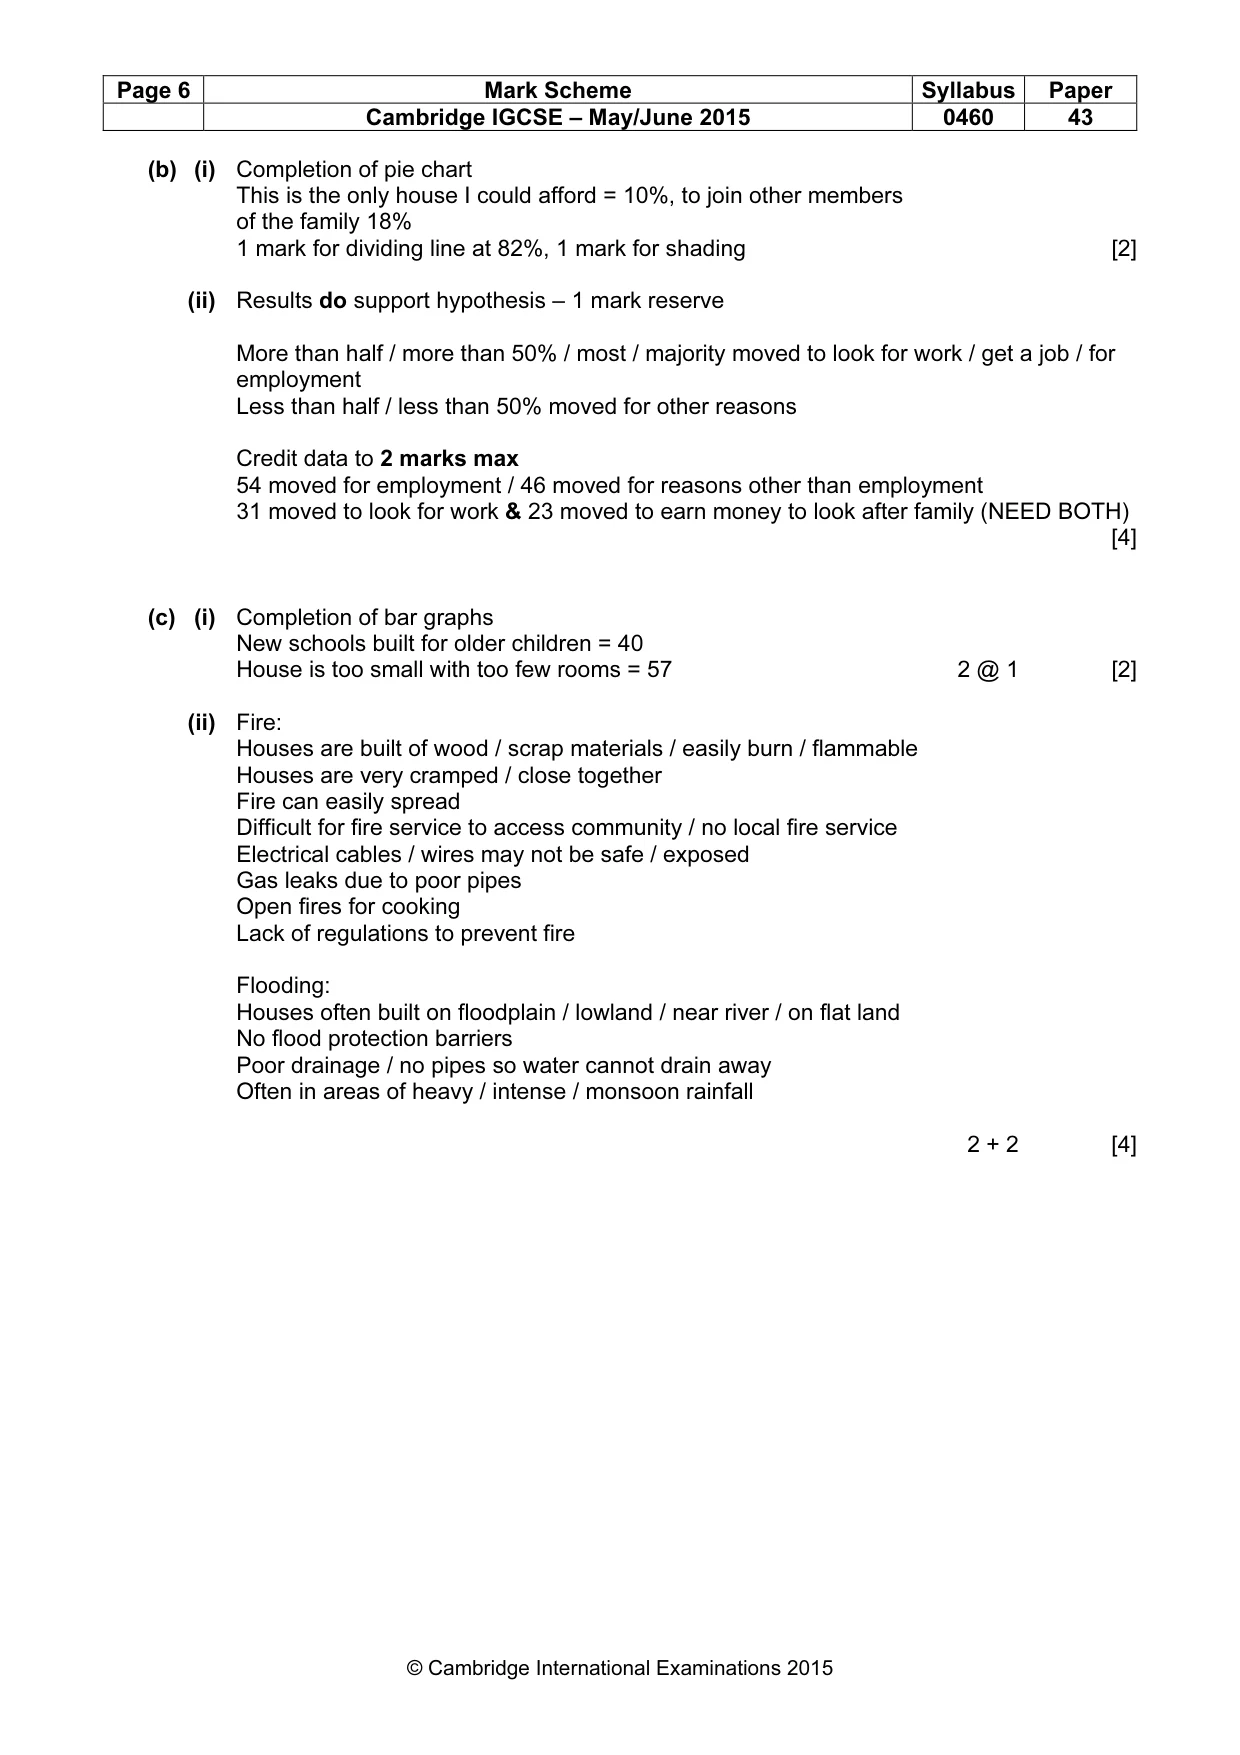
Page 6 Mark Scheme Syllabus Paper Cambridge IGCSE – May/June 2015 0460 43 © Cambridge International Examinations 2015 (b) (i) Completion of pie chart This is the only house I could afford = 10%, to join other members of the family 18% 1 mark for dividing line at 82%, 1 mark for shading [2] (ii) Results do support hypothesis – 1 mark reserve More than half / more than 50% / most / majority moved to look for work / get a job / for employment Less than half / less than 50% moved for other reasons Credit data to 2 marks max 54 moved for employment / 46 moved for reasons other than employment 31 moved to look for work & 23 moved to earn money to look after family (NEED BOTH) [4] (c) (i) Completion of bar graphs New schools built for older children = 40 House is too small with too few rooms = 57 2 @ 1 [2] (ii) Fire: Houses are built of wood / scrap materials / easily burn / flammable Houses are very cramped / close together Fire can easily spread Difficult for fire service to access community / no local fire service Electrical cables / wires may not be safe / exposed Gas leaks due to poor pipes Open fires for cooking Lack of regulations to prevent fire Flooding: Houses often built on floodplain / lowland / near river / on flat land No flood protection barriers Poor drainage / no pipes so water cannot drain away Often in areas of heavy / intense / monsoon rainfall 2 + 2 [4]
Mark scheme, page 7
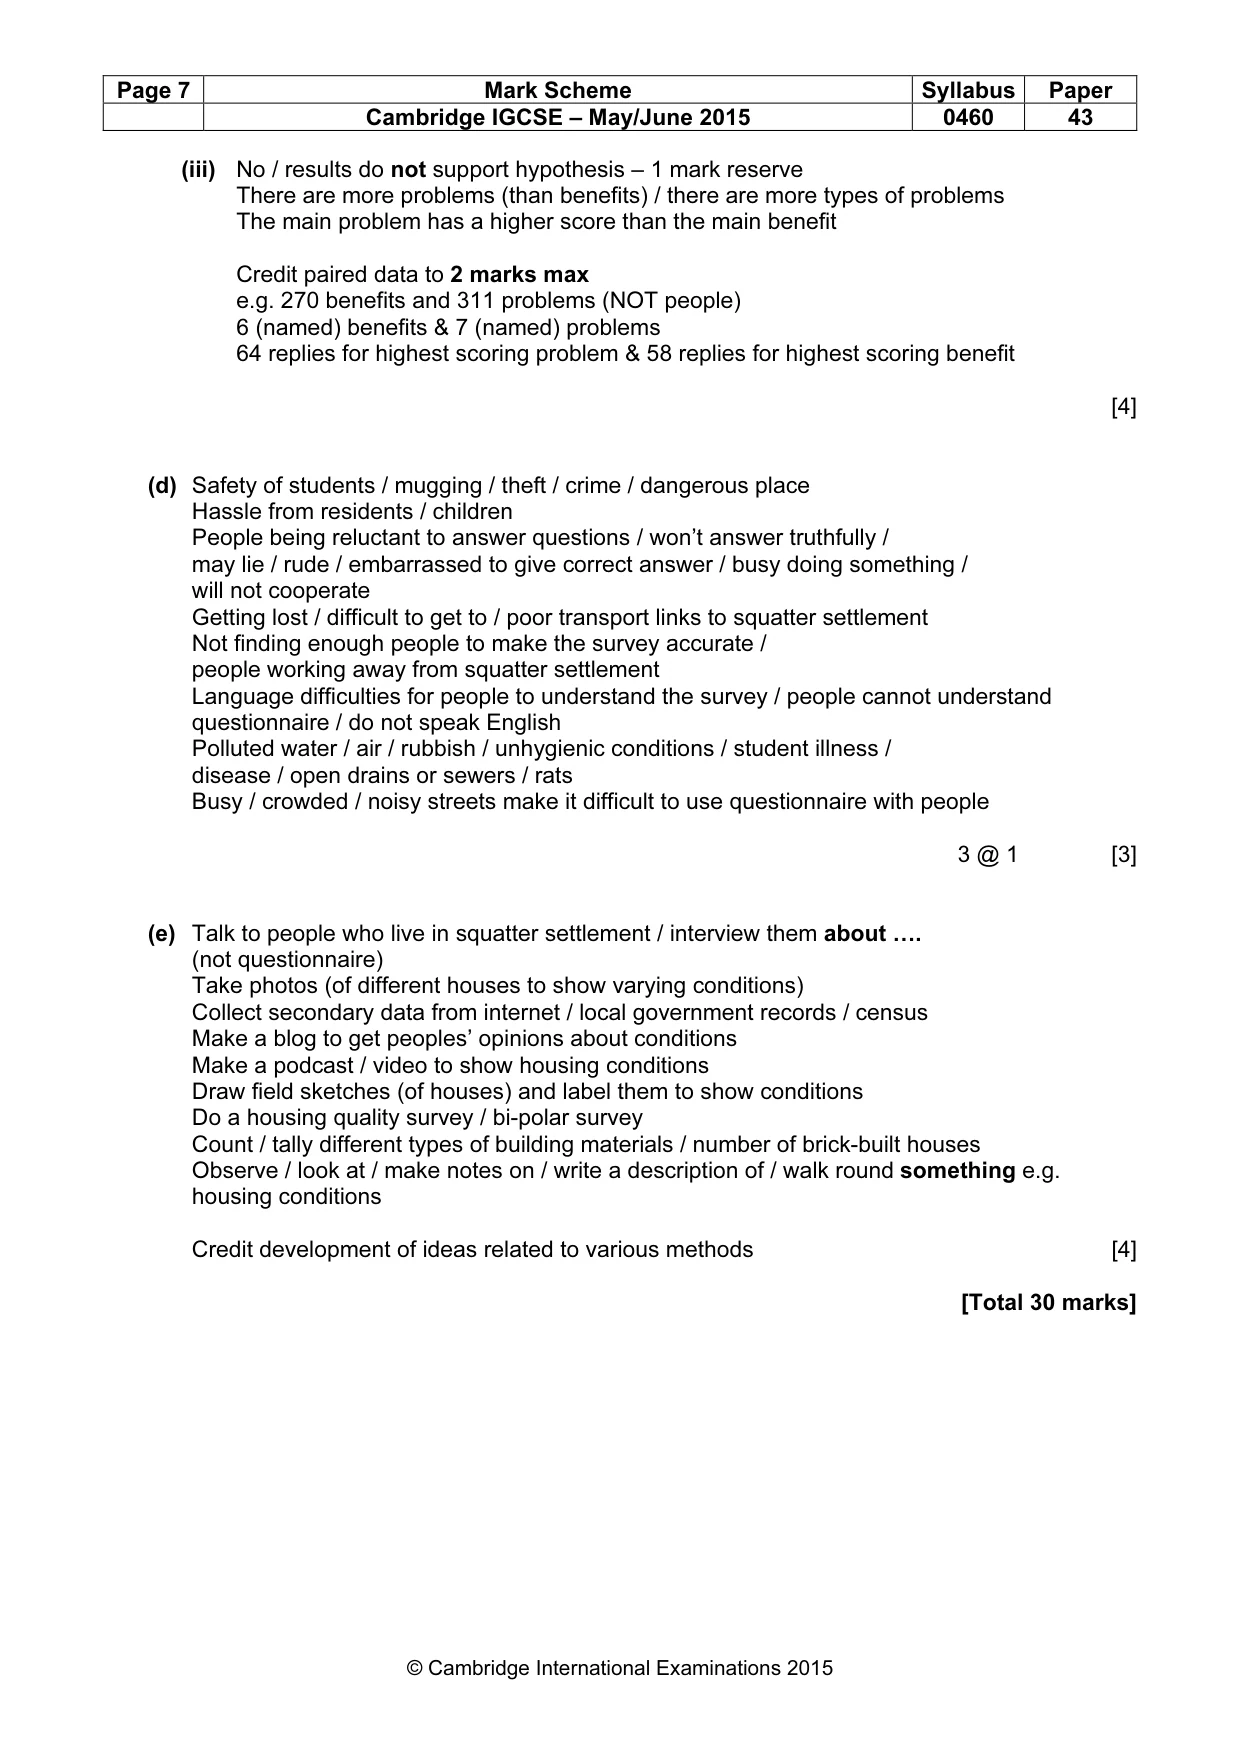
Page 7 Mark Scheme Syllabus Paper Cambridge IGCSE – May/June 2015 0460 43 © Cambridge International Examinations 2015 (iii) No / results do not support hypothesis – 1 mark reserve There are more problems (than benefits) / there are more types of problems The main problem has a higher score than the main benefit Credit paired data to 2 marks max e.g. 270 benefits and 311 problems (NOT people) 6 (named) benefits & 7 (named) problems 64 replies for highest scoring problem & 58 replies for highest scoring benefit [4] (d) Safety of students / mugging / theft / crime / dangerous place Hassle from residents / children People being reluctant to answer questions / won’t answer truthfully / may lie / rude / embarrassed to give correct answer / busy doing something / will not cooperate Getting lost / difficult to get to / poor transport links to squatter settlement Not finding enough people to make the survey accurate / people working away from squatter settlement Language difficulties for people to understand the survey / people cannot understand questionnaire / do not speak English Polluted water / air / rubbish / unhygienic conditions / student illness / disease / open drains or sewers / rats Busy / crowded / noisy streets make it difficult to use questionnaire with people 3 @ 1 [3] (e) Talk to people who live in squatter settlement / interview them about …. (not questionnaire) Take photos (of different houses to show varying conditions) Collect secondary data from internet / local government records / census Make a blog to get peoples’ opinions about conditions Make a podcast / video to show housing conditions Draw field sketches (of houses) and label them to show conditions Do a housing quality survey / bi-polar survey Count / tally different types of building materials / number of brick-built houses Observe / look at / make notes on / write a description of / walk round something e.g. housing conditions Credit development of ideas related to various methods [4] [Total 30 marks]
What you needed in this session
Cambridge’s own grade thresholds for 2015 May/June, Paper 4 · Variant 3. A higher threshold means an easier paper — the bar moves with how the cohort did.