Cambridge IGCSE Geography 0460 — 2015 May/June Paper 4 · Variant 1
0460/41/M/J/15 · 60 marks · ≈68 min
The question paper and its mark scheme, free to read here and free to download. This is Cambridge’s own paper, exactly as it was sat.
Question paper20 pages







Mark scheme6 pages
Answers below. Sit the paper first if you are practising.
Paper as text
Question paper, page 1
This document consists of 18 printed pages, 2 blank pages and 1 Insert. DC (NH/SW) 96710/7 © UCLES 2015 [Turn over * 5 3 7 7 9 6 9 6 6 0 * GEOGRAPHY 0460/41 Paper 4 Alternative to Coursework May/June 2015 1 hour 30 minutes Candidates answer on the Question Paper. Additional Materials: Calculator Ruler READ THESE INSTRUCTIONS FIRST Write your Centre number, candidate number and name in the spaces provided. Write in dark blue or black pen. You may use an HB pencil for any diagrams or graphs. Do not use staples, paper clips, glue or correction fluid. DO NOT WRITE IN ANY BARCODES. Answer all questions. The Insert contains Fig. 2 and Table 4 for Question 1, and Photograph A, Figs 7 and 10 and Table 6 for Question 2. The Insert is not required by the Examiner. Sketch maps and diagrams should be drawn whenever they serve to illustrate an answer. At the end of the examination, fasten all your work securely together. The number of marks is given in brackets [ ] at the end of each question or part question. The syllabus is approved for use in England, Wales and Northern Ireland as a Cambridge International Level 1/Level 2 Certificate. Cambridge International Examinations Cambridge International General Certificate of Secondary Education
Question paper, page 2
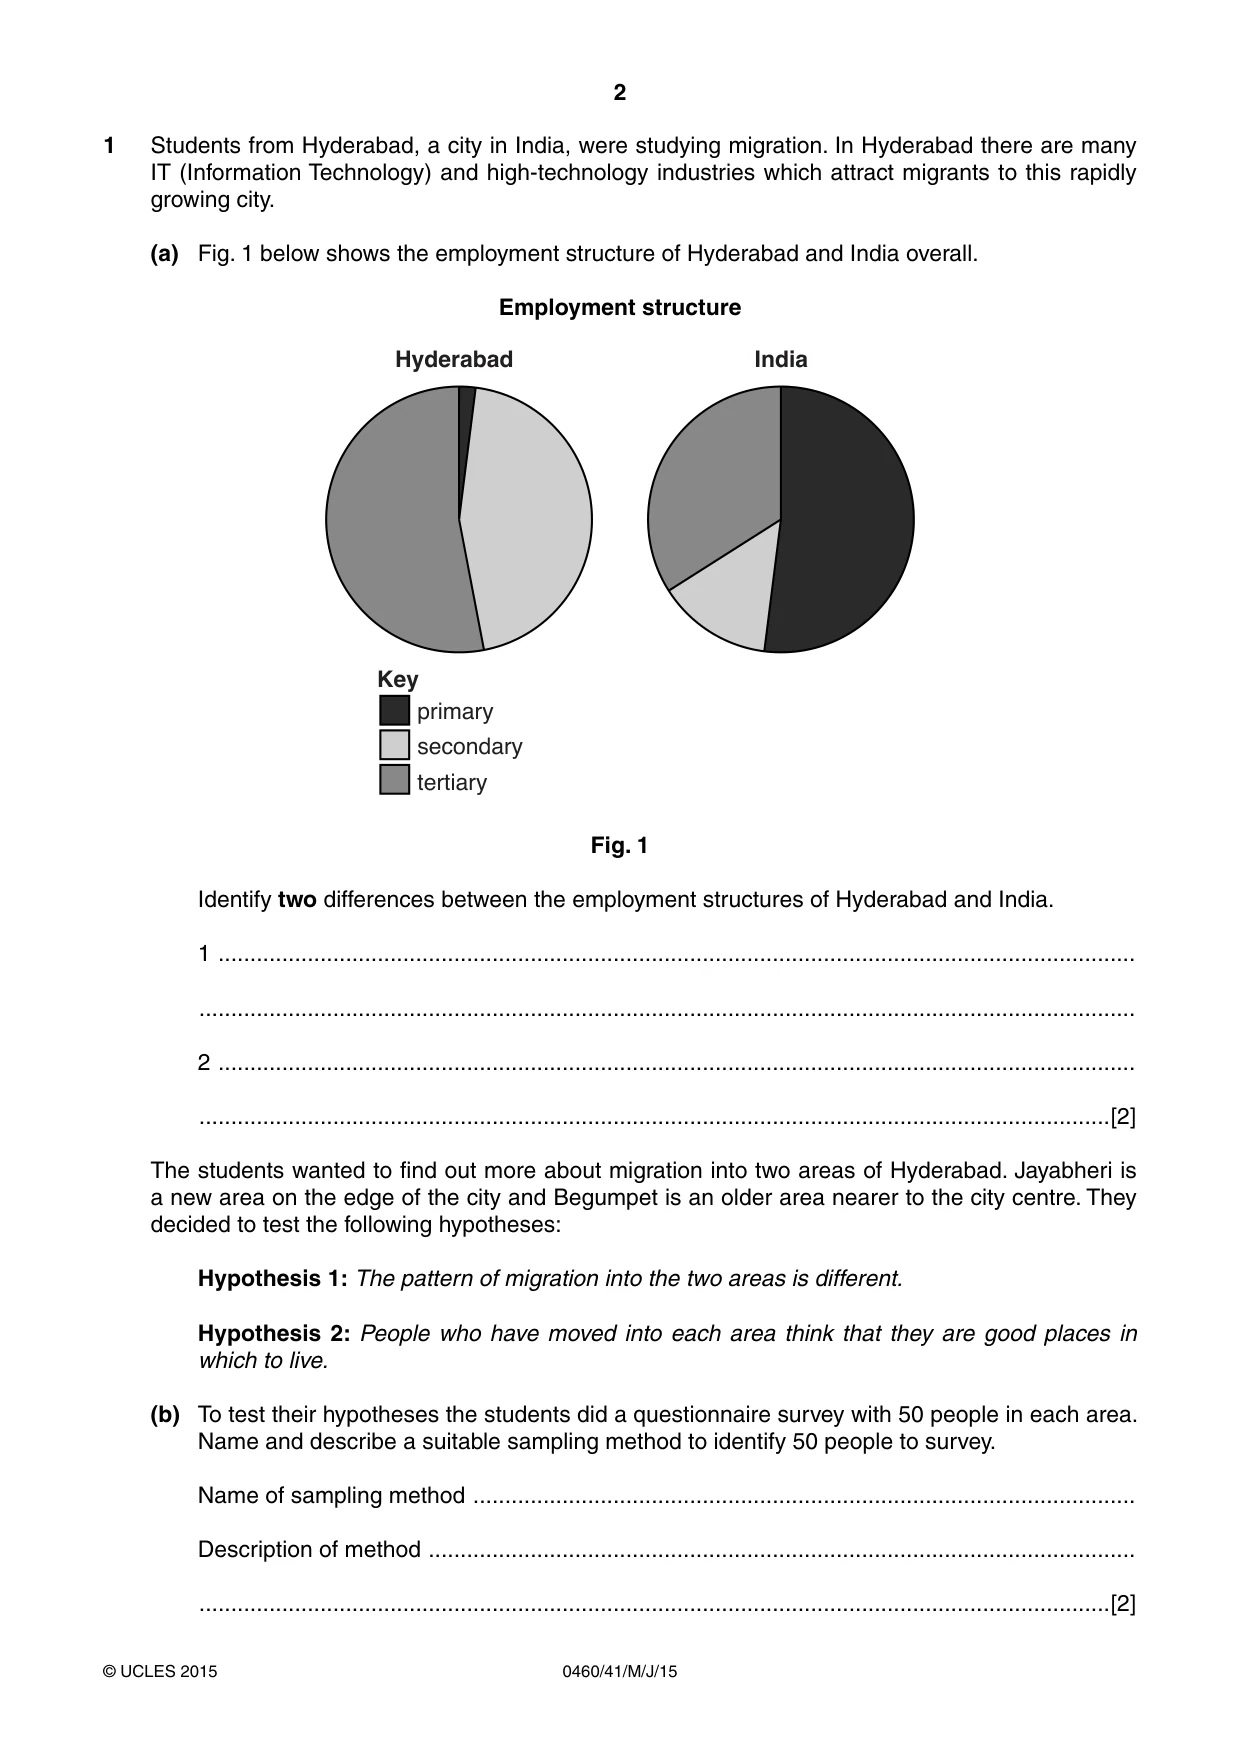
2 0460/41/M/J/15 © UCLES 2015 1 Students from Hyderabad, a city in India, were studying migration. In Hyderabad there are many IT (Information Technology) and high-technology industries which attract migrants to this rapidly growing city. (a) Fig. 1 below shows the employment structure of Hyderabad and India overall. Employment structure Hyderabad India Key primary secondary tertiary Fig. 1 Identify two differences between the employment structures of Hyderabad and India. 1 … … 2 … …[2] The students wanted to find out more about migration into two areas of Hyderabad. Jayabheri is a new area on the edge of the city and Begumpet is an older area nearer to the city centre. They decided to test the following hypotheses: Hypothesis 1: The pattern of migration into the two areas is different. Hypothesis 2: People who have moved into each area think that they are good places in which to live. (b) To test their hypotheses the students did a questionnaire survey with 50 people in each area. Name and describe a suitable sampling method to identify 50 people to survey. Name of sampling method … Description of method … …[2]
Question paper, page 3
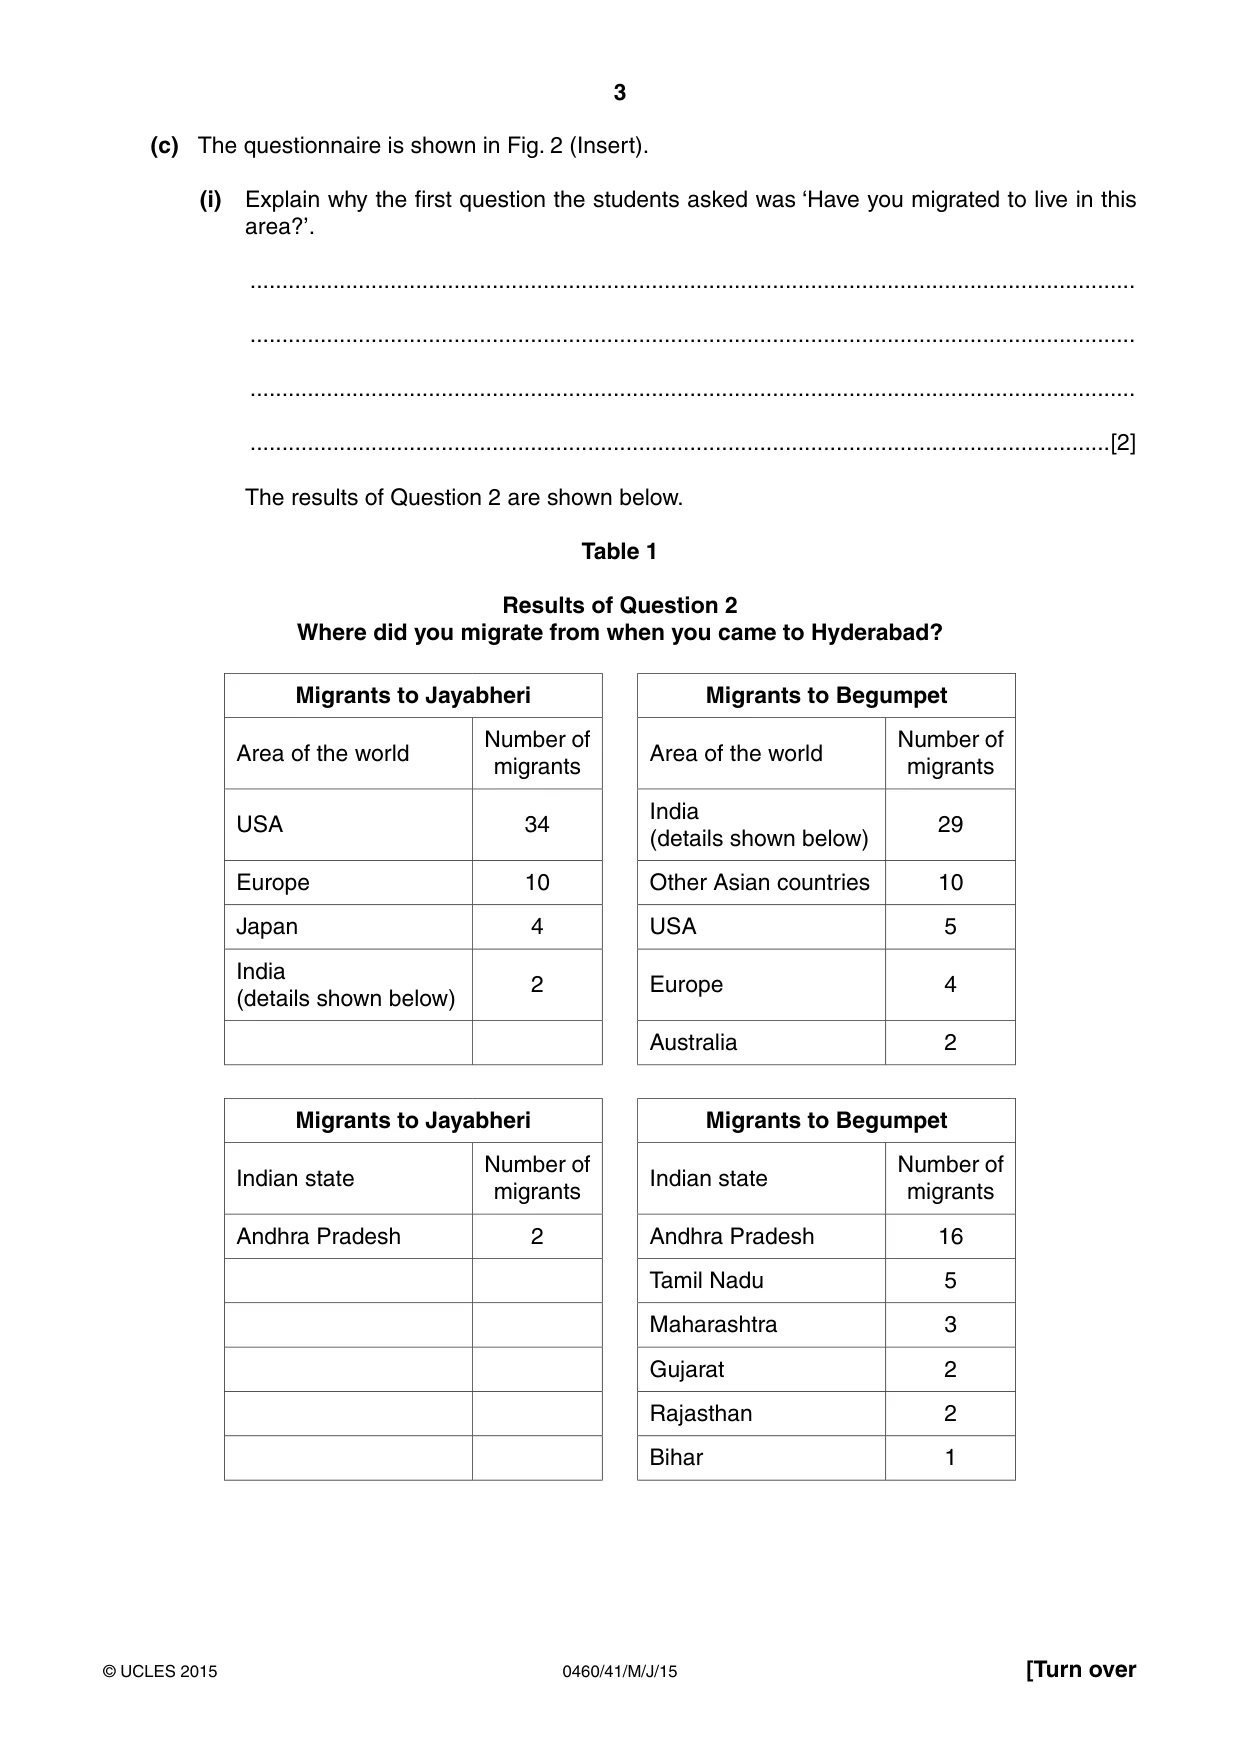
3 0460/41/M/J/15 © UCLES 2015 [Turn over (c) The questionnaire is shown in Fig. 2 (Insert). (i) Explain why the first question the students asked was ‘Have you migrated to live in this area?’. … … … …[2] The results of Question 2 are shown below. Table 1 Results of Question 2 Where did you migrate from when you came to Hyderabad? Migrants to Jayabheri Migrants to Begumpet Area of the world Number of migrants Area of the world Number of migrants USA 34 India (details shown below) 29 Europe 10 Other Asian countries 10 Japan 4 USA 5 India (details shown below) 2 Europe 4 Australia 2 Migrants to Jayabheri Migrants to Begumpet Indian state Number of migrants Indian state Number of migrants Andhra Pradesh 2 Andhra Pradesh 16 Tamil Nadu 5 Maharashtra 3 Gujarat 2 Rajasthan 2 Bihar 1
Question paper, page 4
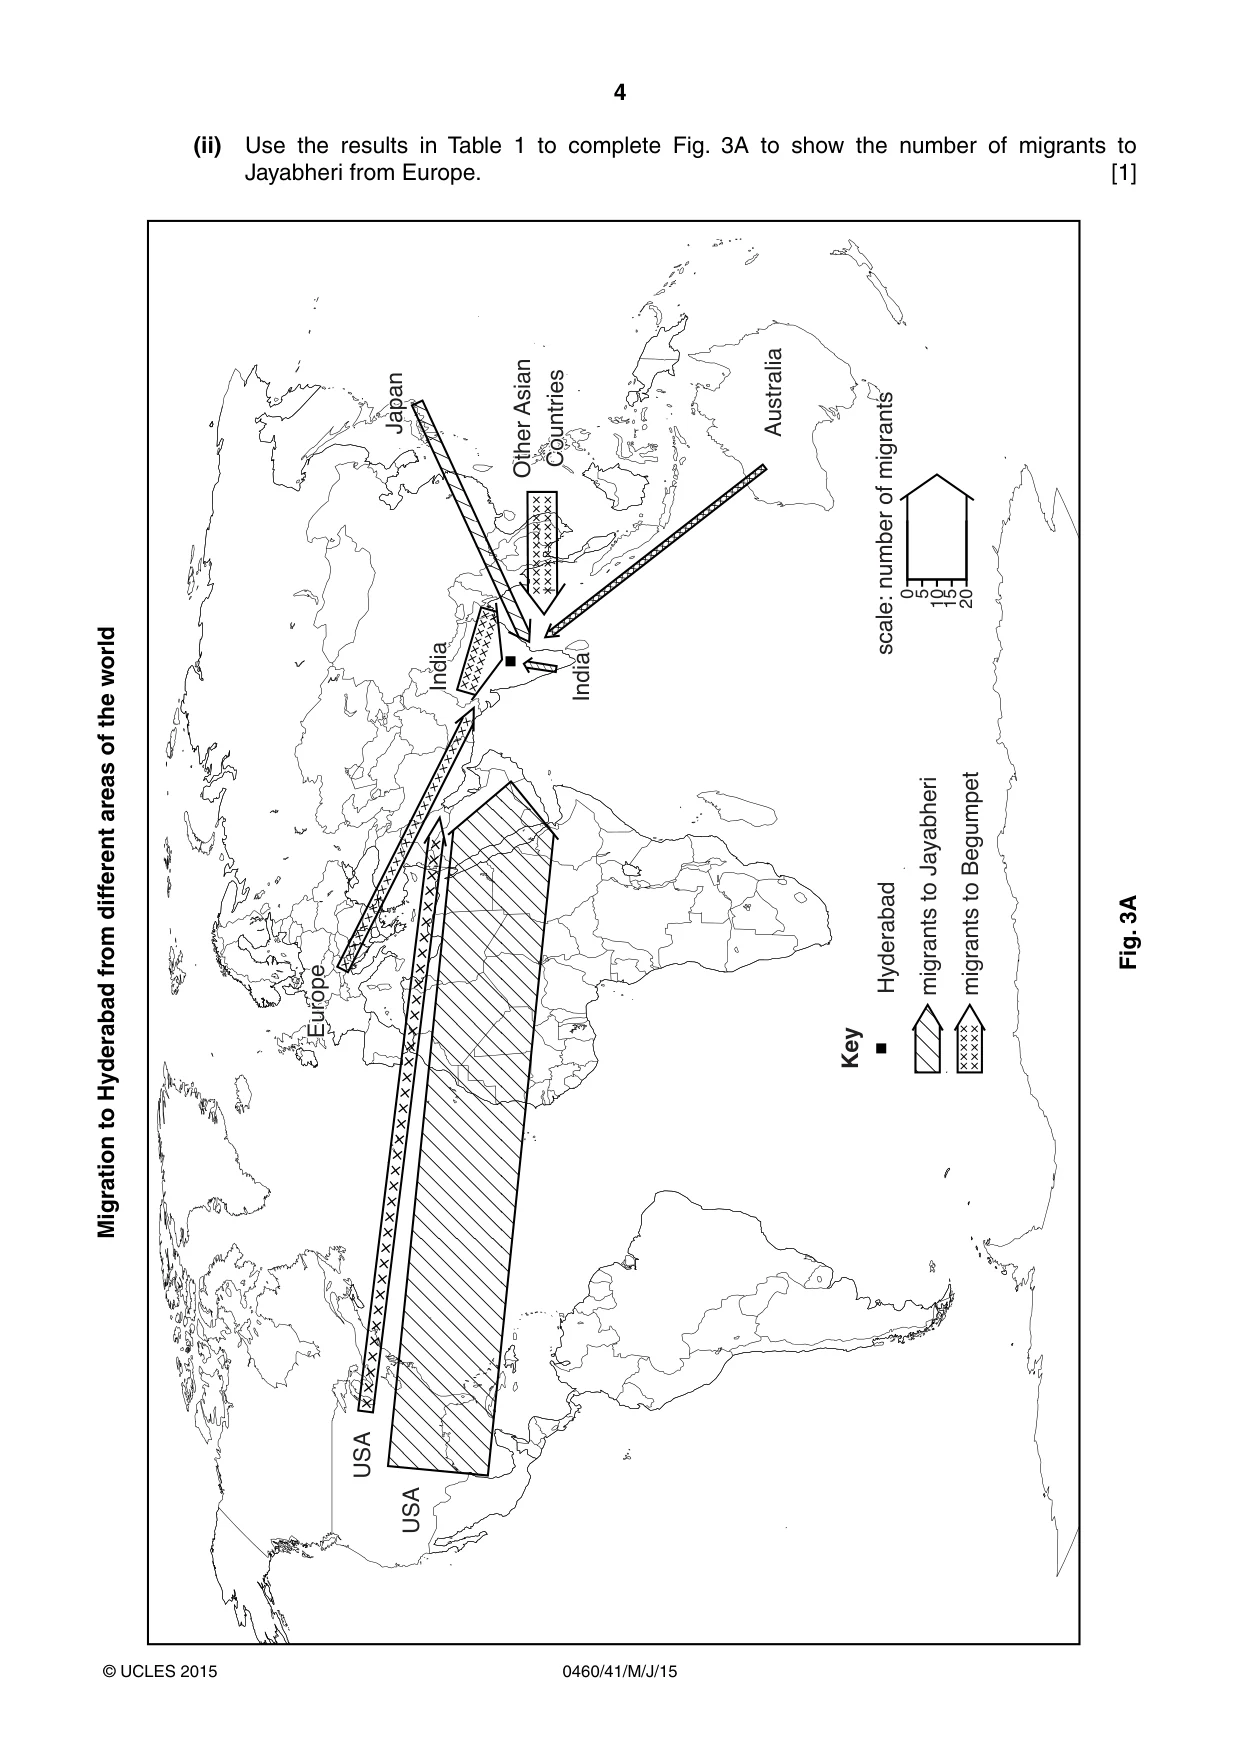
4 0460/41/M/J/15 © UCLES 2015 (ii) Use the results in Table 1 to complete Fig. 3A to show the number of migrants to Jayabheri from Europe. [1] Migration to Hyderabad from different areas of the world Key USA USA Australia Japan Other Asian Countries India India Europe migrants to Begumpet migrants to Jayabheri Hyderabad scale: number of migrants 0 5 10 15 20 Fig. 3A
Question paper, page 5
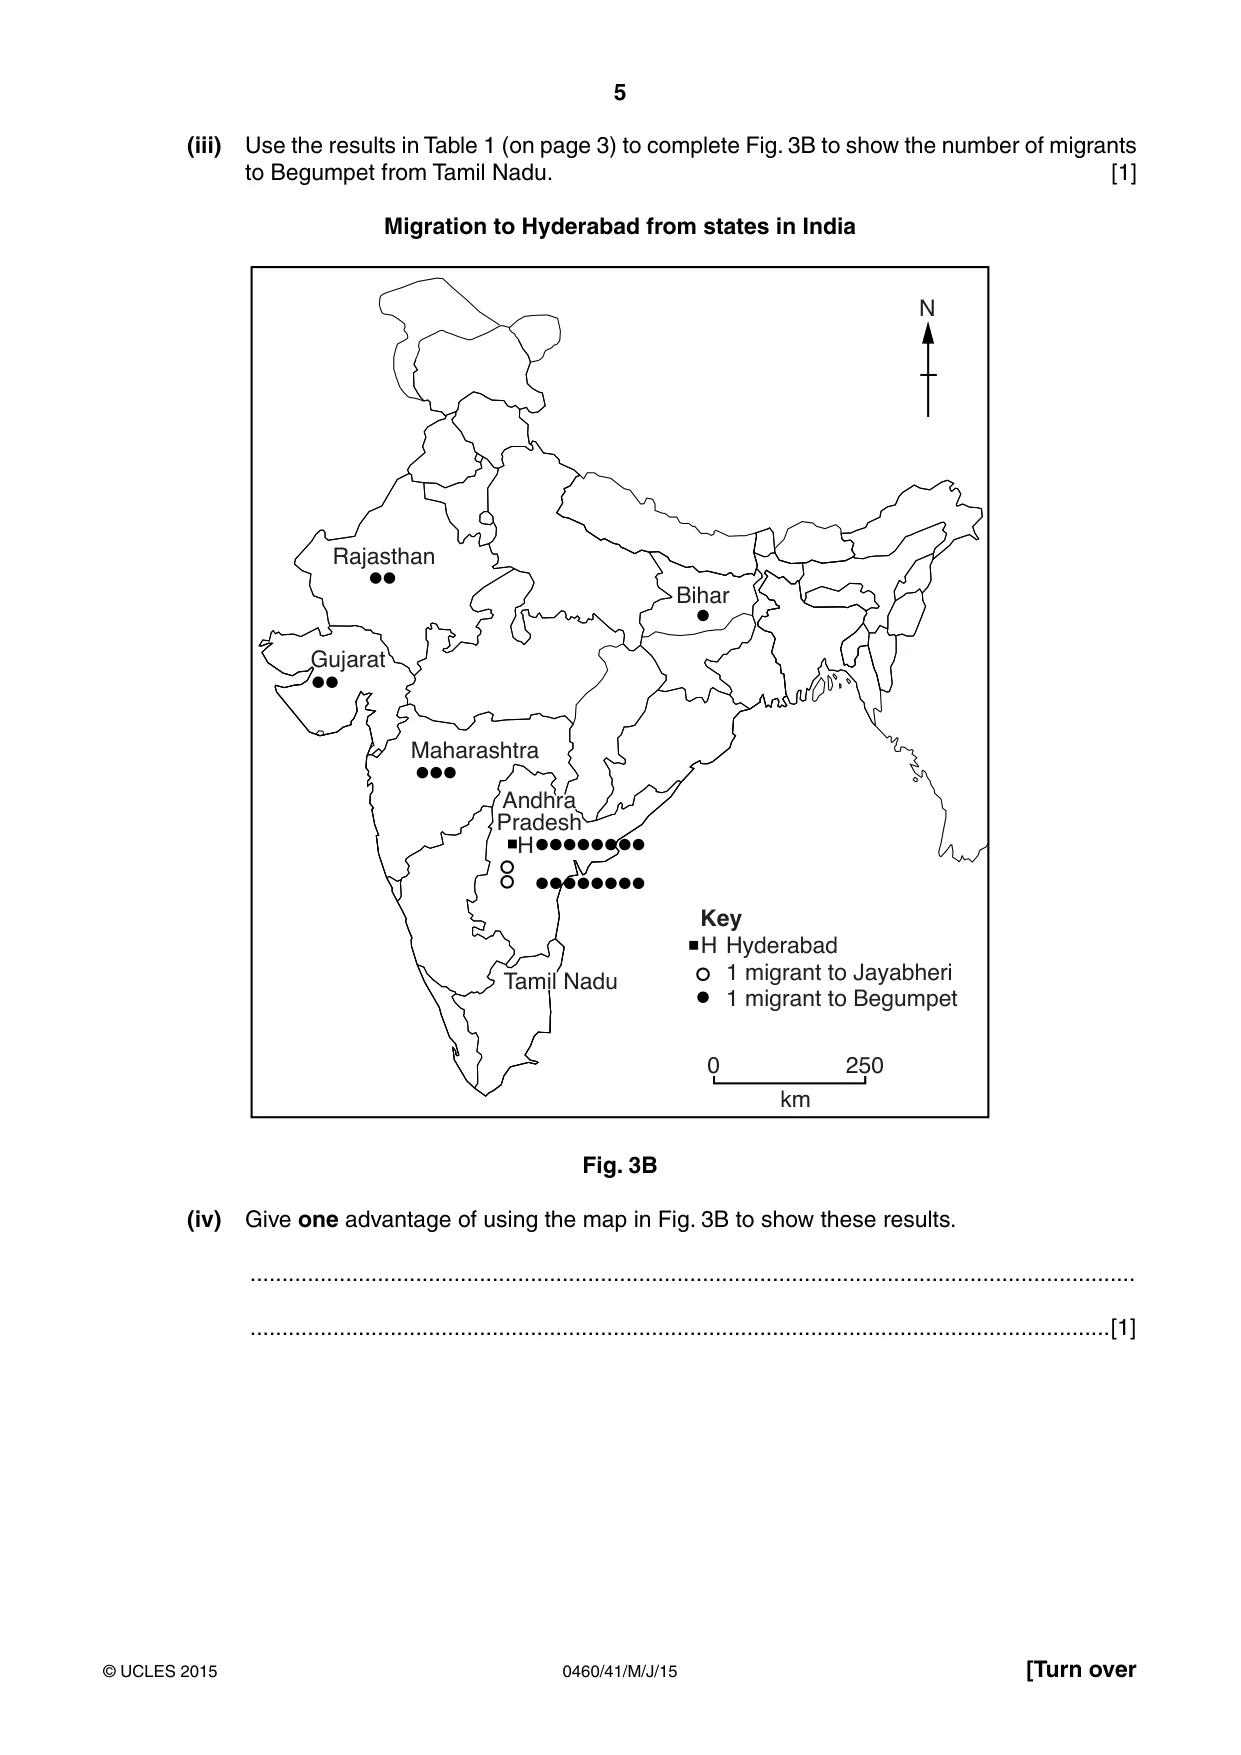
5 0460/41/M/J/15 © UCLES 2015 [Turn over (iii) Use the results in Table 1 (on page 3) to complete Fig. 3B to show the number of migrants to Begumpet from Tamil Nadu. [1] Migration to Hyderabad from states in India Hyderabad 1 migrant to Jayabheri 1 migrant to Begumpet H H Key 0 250 km N Gujarat Rajasthan Bihar Maharashtra Andhra Pradesh Tamil Nadu Fig. 3B (iv) Give one advantage of using the map in Fig. 3B to show these results. … …[1]
Question paper, page 6
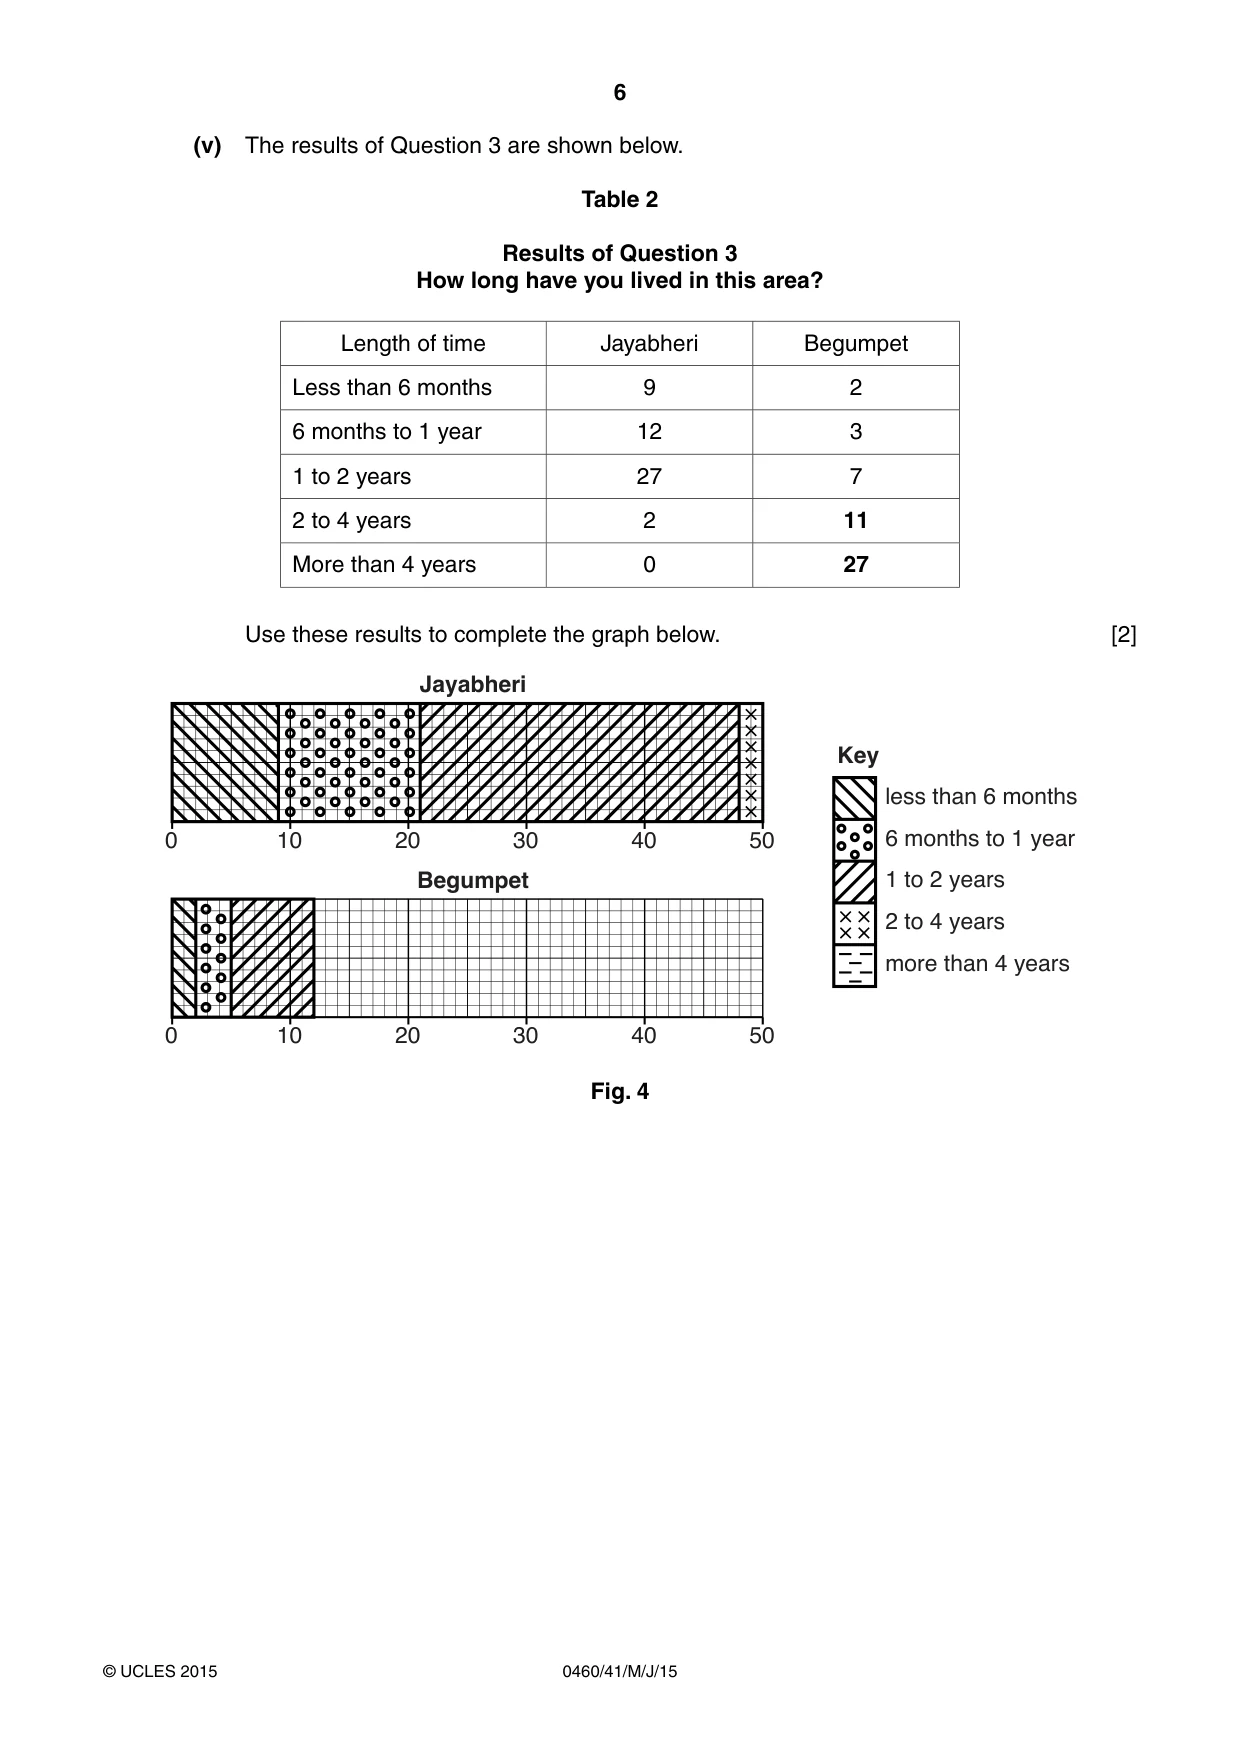
6 0460/41/M/J/15 © UCLES 2015 (v) The results of Question 3 are shown below. Table 2 Results of Question 3 How long have you lived in this area? Length of time Jayabheri Begumpet Less than 6 months 9 2 6 months to 1 year 12 3 1 to 2 years 27 7 2 to 4 years 2 11 More than 4 years 0 27 Use these results to complete the graph below. [2] 0 10 20 30 40 50 0 10 20 30 40 50 Jayabheri Begumpet less than 6 months 6 months to 1 year 1 to 2 years 2 to 4 years more than 4 years Key Fig. 4
Question paper, page 7
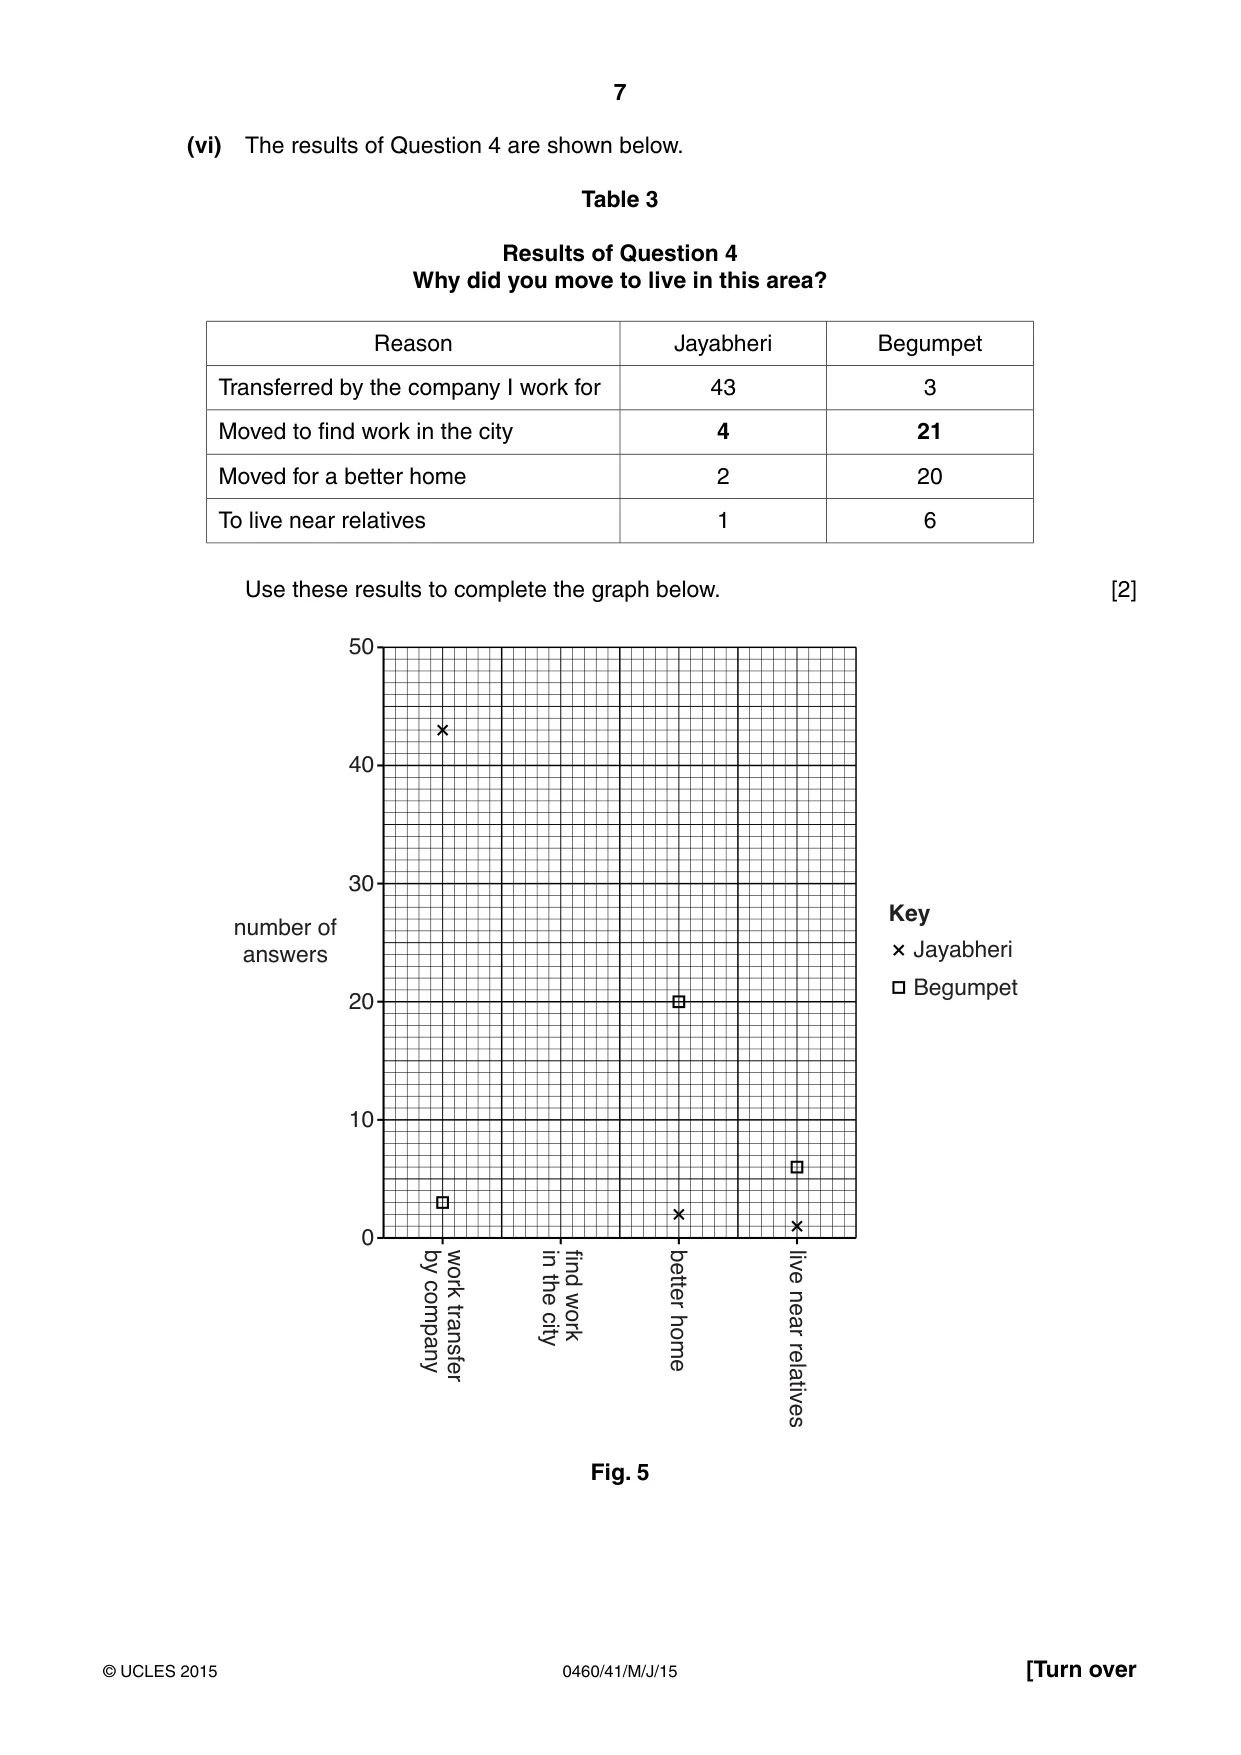
7 0460/41/M/J/15 © UCLES 2015 [Turn over (vi) The results of Question 4 are shown below. Table 3 Results of Question 4 Why did you move to live in this area? Reason Jayabheri Begumpet Transferred by the company I work for 43 3 Moved to find work in the city 4 21 Moved for a better home 2 20 To live near relatives 1 6 Use these results to complete the graph below. [2] 0 10 20 30 number of answers 40 50 work transfer by company find work in the city better home live near relatives Jayabheri Begumpet Key Fig. 5
Question paper, page 8
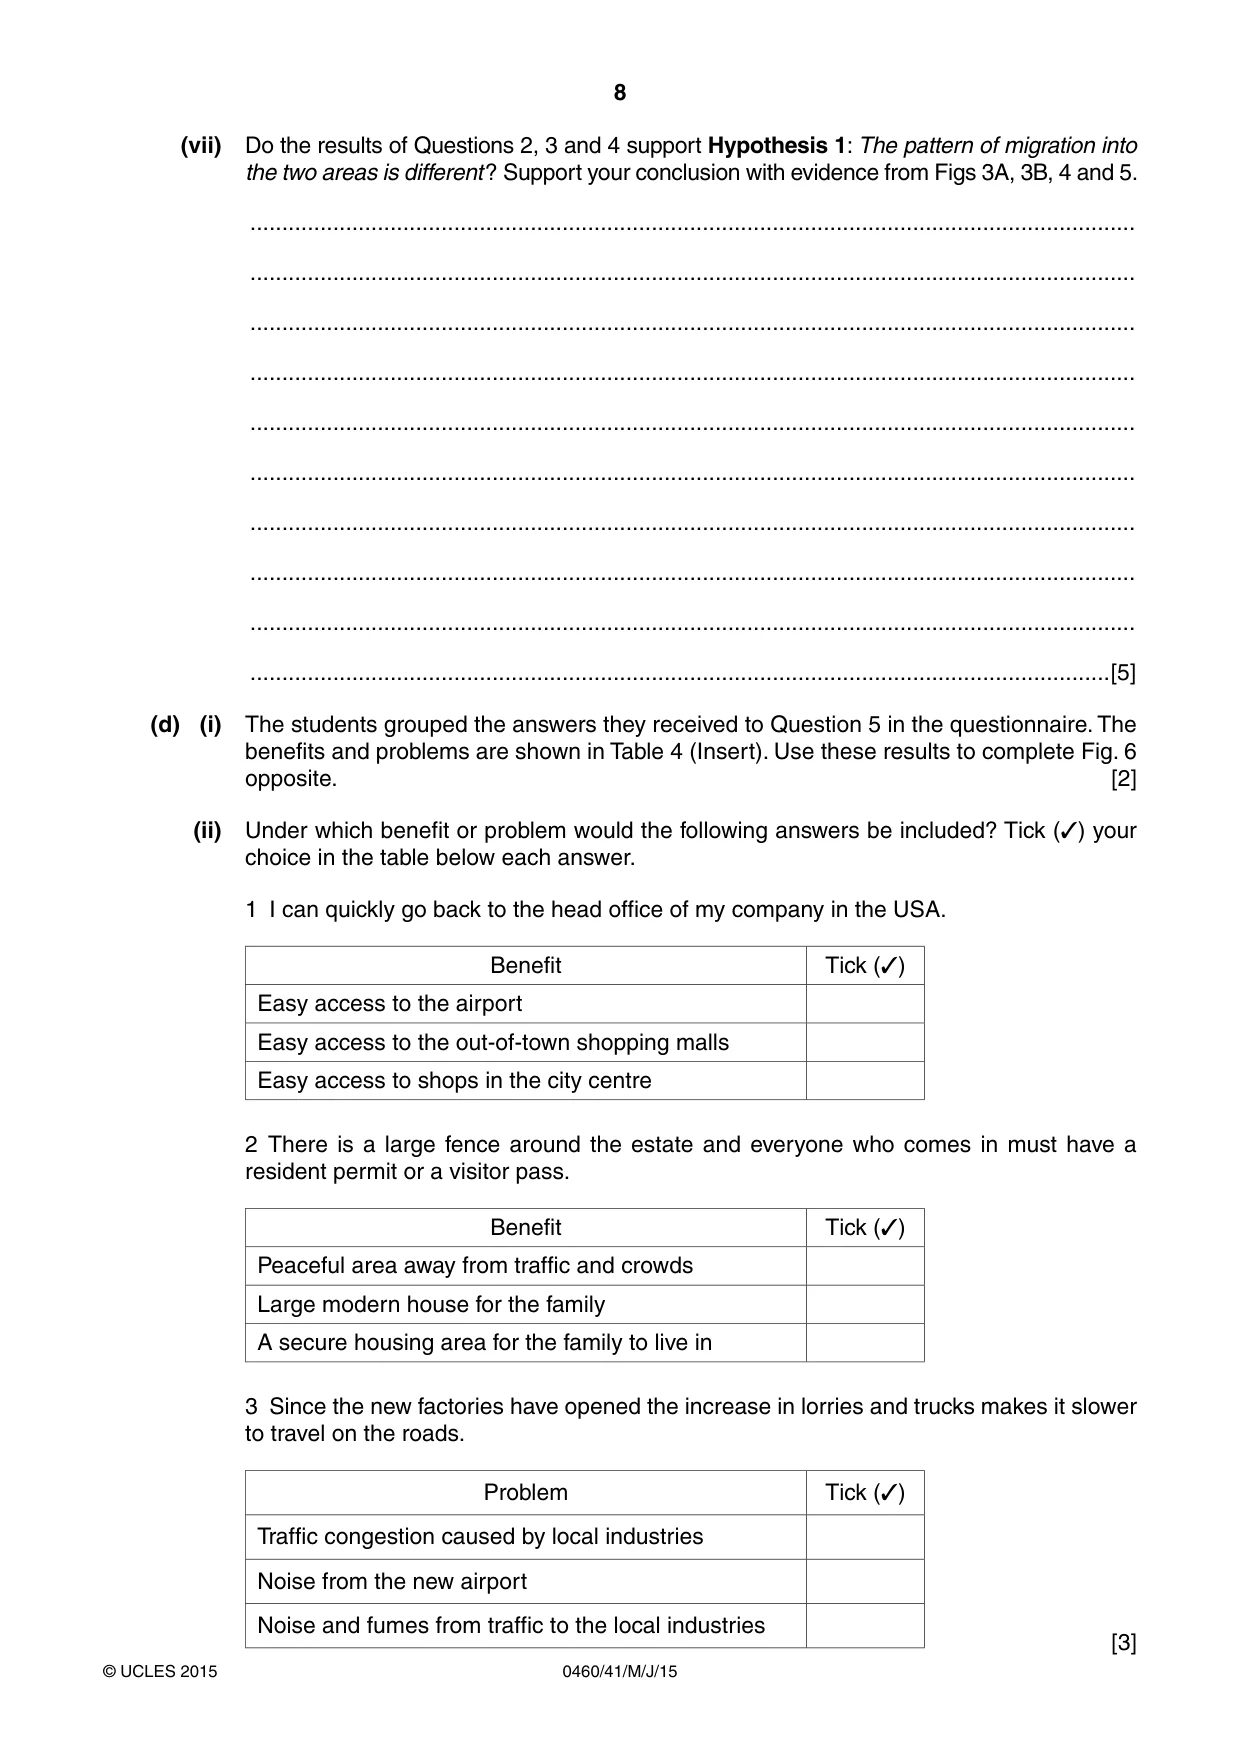
8 0460/41/M/J/15 © UCLES 2015 (vii) Do the results of Questions 2, 3 and 4 support Hypothesis 1: The pattern of migration into the two areas is different ? Support your conclusion with evidence from Figs 3A, 3B, 4 and 5. … … … … … … … … … …[5] (d) (i) The students grouped the answers they received to Question 5 in the questionnaire. The benefits and problems are shown in Table 4 (Insert). Use these results to complete Fig. 6 opposite. [2] (ii) Under which benefit or problem would the following answers be included? Tick (✓) your choice in the table below each answer. 1 I can quickly go back to the head office of my company in the USA. Benefit Tick (✓) Easy access to the airport Easy access to the out-of-town shopping malls Easy access to shops in the city centre 2 There is a large fence around the estate and everyone who comes in must have a resident permit or a visitor pass. Benefit Tick (✓) Peaceful area away from traffic and crowds Large modern house for the family A secure housing area for the family to live in 3 Since the new factories have opened the increase in lorries and trucks makes it slower to travel on the roads. Problem Tick (✓) Traffic congestion caused by local industries Noise from the new airport Noise and fumes from traffic to the local industries [3]
Question paper, page 9
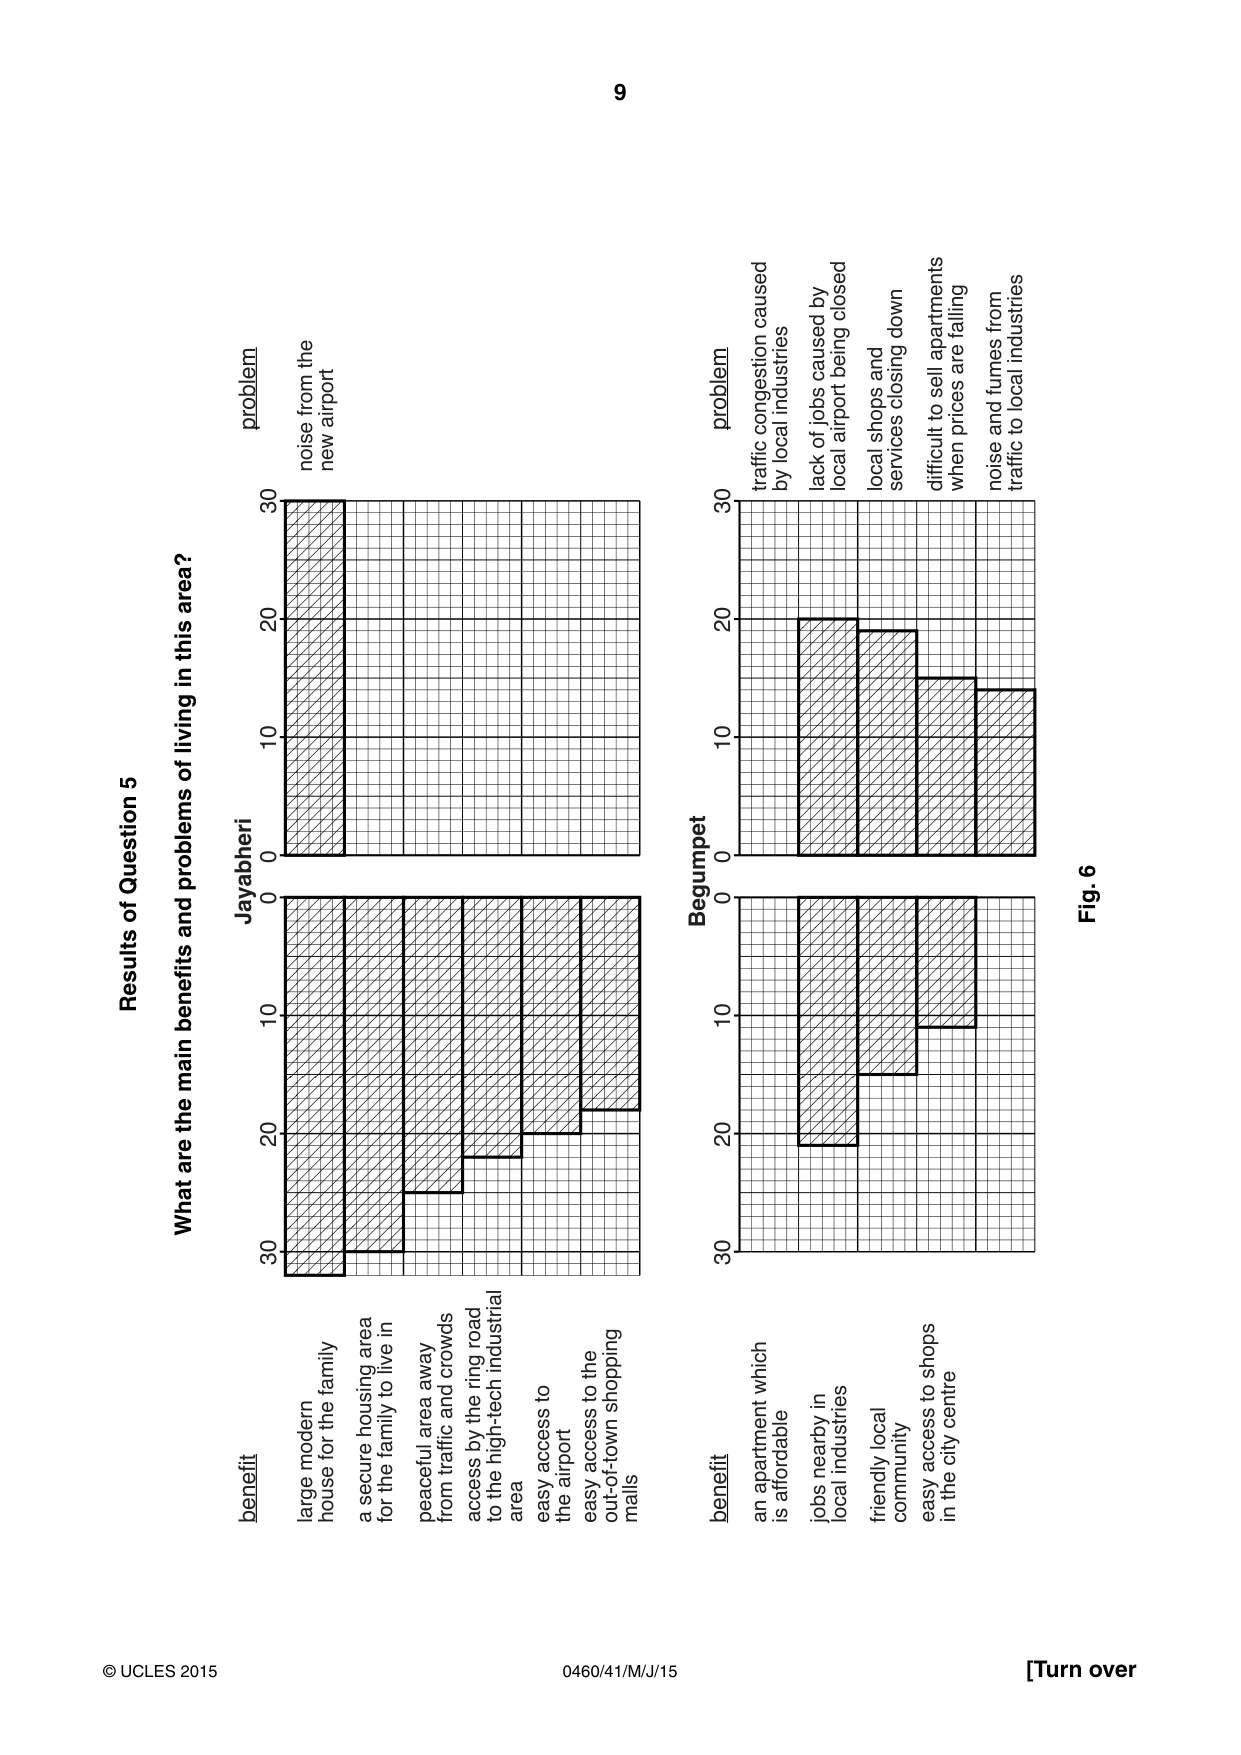
9 0460/41/M/J/15 © UCLES 2015 [Turn over Results of Question 5 What are the main benefits and problems of living in this area? 0 0 Jayabheri 10 10 20 20 30 30 large modern house for the family benefit benefit problem problem noise from the new airport traffic congestion caused by local industries lack of jobs caused by local airport being closed local shops and services closing down difficult to sell apartments when prices are falling noise and fumes from traffic to local industries a secure housing area for the family to live in peaceful area away from traffic and crowds access by the ring road to the high-tech industrial area easy access to the airport easy access to the out-of-town shopping malls 0 0 Begumpet 10 10 20 20 30 30 an apartment which is affordable jobs nearby in local industries friendly local community easy access to shops in the city centre Fig. 6
Question paper, page 10
10 0460/41/M/J/15 © UCLES 2015 (iii) The students made the conclusion that Fig. 6 supported Hypothesis 2 more in one area than the other. Hypothesis 2 was People who have moved into each area think that they are good places in which to live. Tick below the area which shows more support for Hypothesis 2. Explain why you made this conclusion using evidence from Fig. 6 and Table 4. Tick (✓) Jayabheri – new area on the edge of the city Begumpet – older area nearer to the city centre … … … …[3] (e) In other areas of Hyderabad people live in poor housing conditions or squatter settlements. The students did another fieldwork study to investigate housing and service provision in these areas. Describe methods other than a questionnaire survey to investigate housing and service provision. … … … … … … … …[4] [Total: 30 marks]
Question paper, page 11
11 0460/41/M/J/15 © UCLES 2015 [Turn over PLEASE TURN PAGE FOR QUESTION 2
Question paper, page 12
12 0460/41/M/J/15 © UCLES 2015 2 A group of students were planning fieldwork on a local beach. One of the students drew a sketch map of the area which is shown in Fig. 7 (Insert). The students wanted to investigate the action of longshore drift on the beach, and whether longshore drift could be reduced by groynes. Groynes are structures built out into the sea to stop or slow down longshore drift. Groynes are shown in Photograph A (Insert). (a) Explain why their teacher suggested the following safety precautions before the students began their fieldwork. 1 Check the times of high and low tide. … … 2 Check the weather forecast for the area. … … 3 Make sure that their cell (mobile) phone is fully charged. … …[3] (b) (i) The students had learned that the direction of longshore drift is usually related to the prevailing wind direction. Describe a simple method the students could use to work out the prevailing wind direction at the beach. … … … …[2]
Question paper, page 13
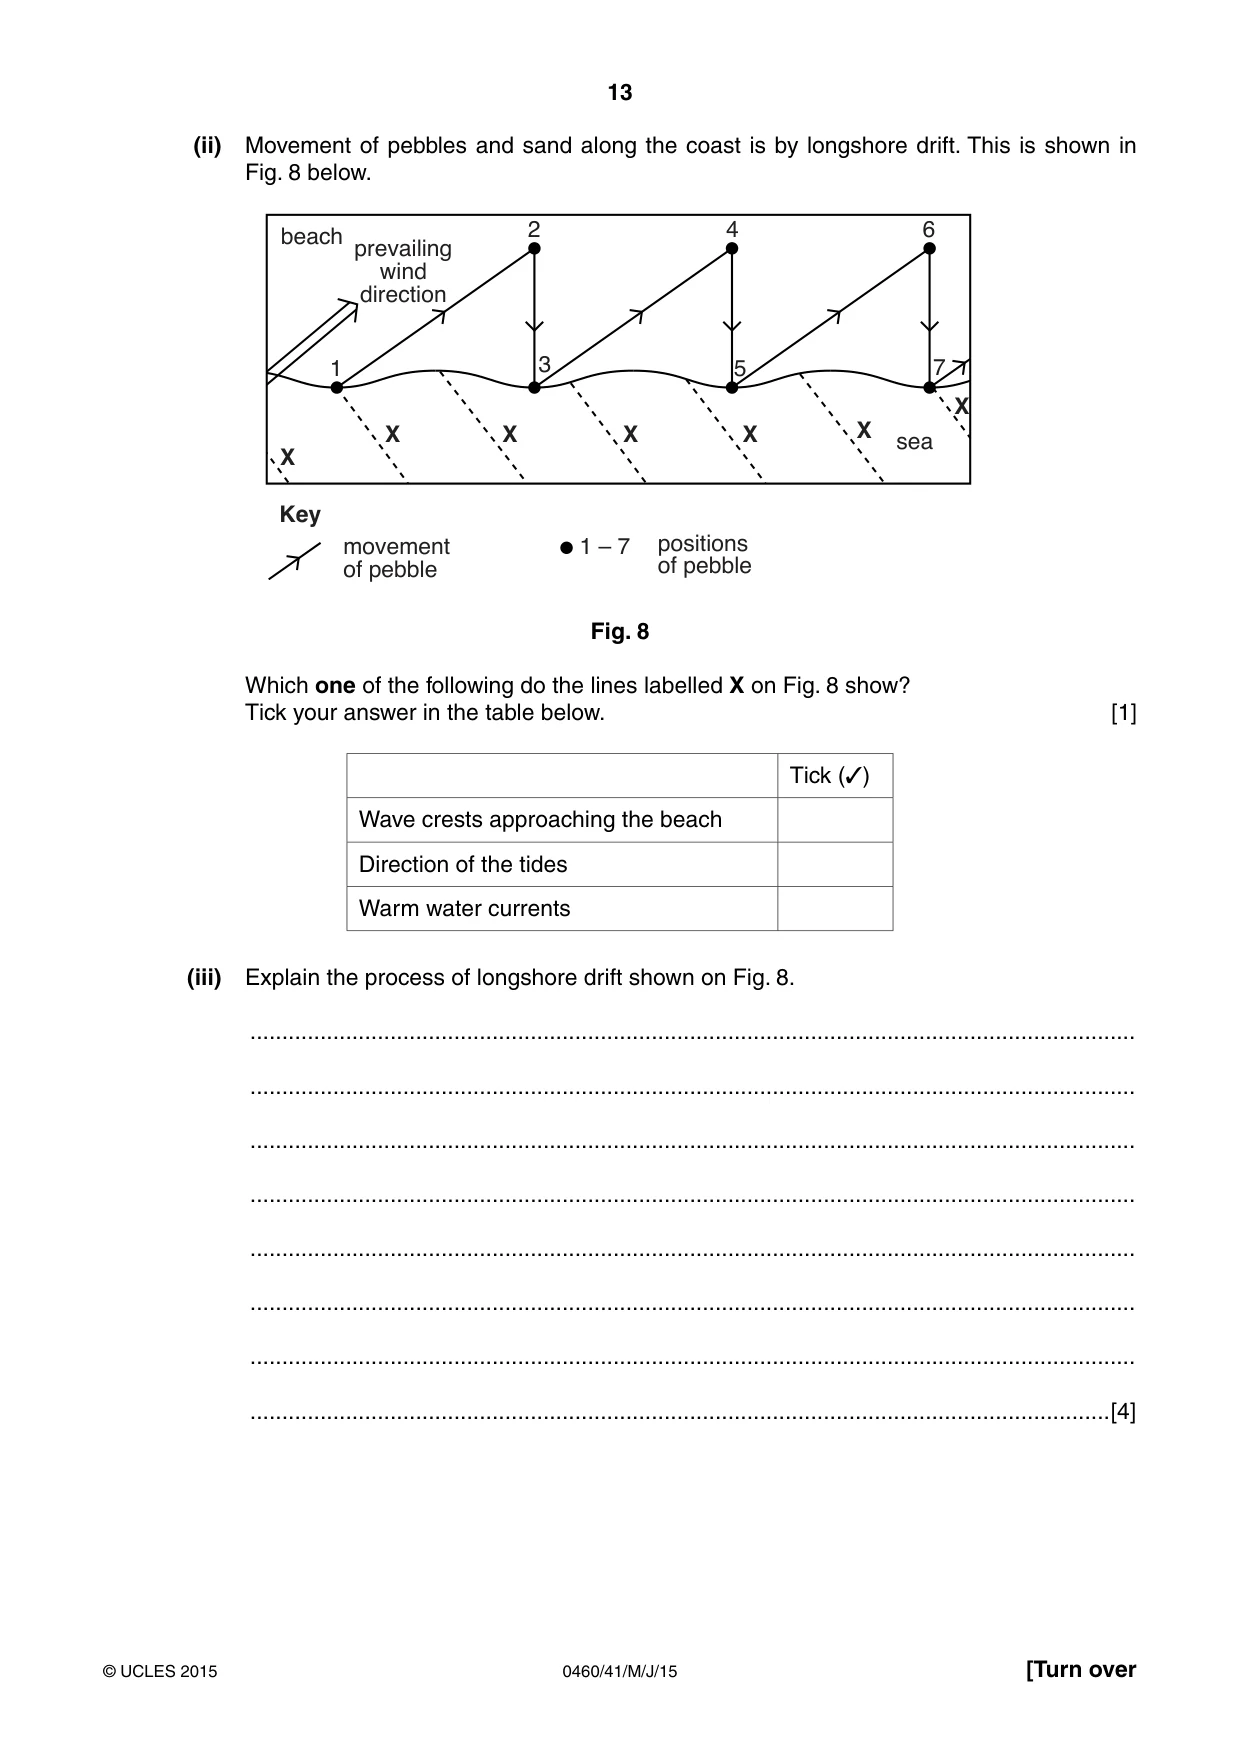
13 0460/41/M/J/15 © UCLES 2015 [Turn over (ii) Movement of pebbles and sand along the coast is by longshore drift. This is shown in Fig. 8 below. 1 2 3 beach prevailing wind direction sea X X X X X X X 4 6 5 7 movement of pebble positions of pebble Key 1 – 7 Fig. 8 Which one of the following do the lines labelled X on Fig. 8 show? Tick your answer in the table below. [1] Tick (✓) Wave crests approaching the beach Direction of the tides Warm water currents (iii) Explain the process of longshore drift shown on Fig. 8. … … … … … … … …[4]
Question paper, page 14
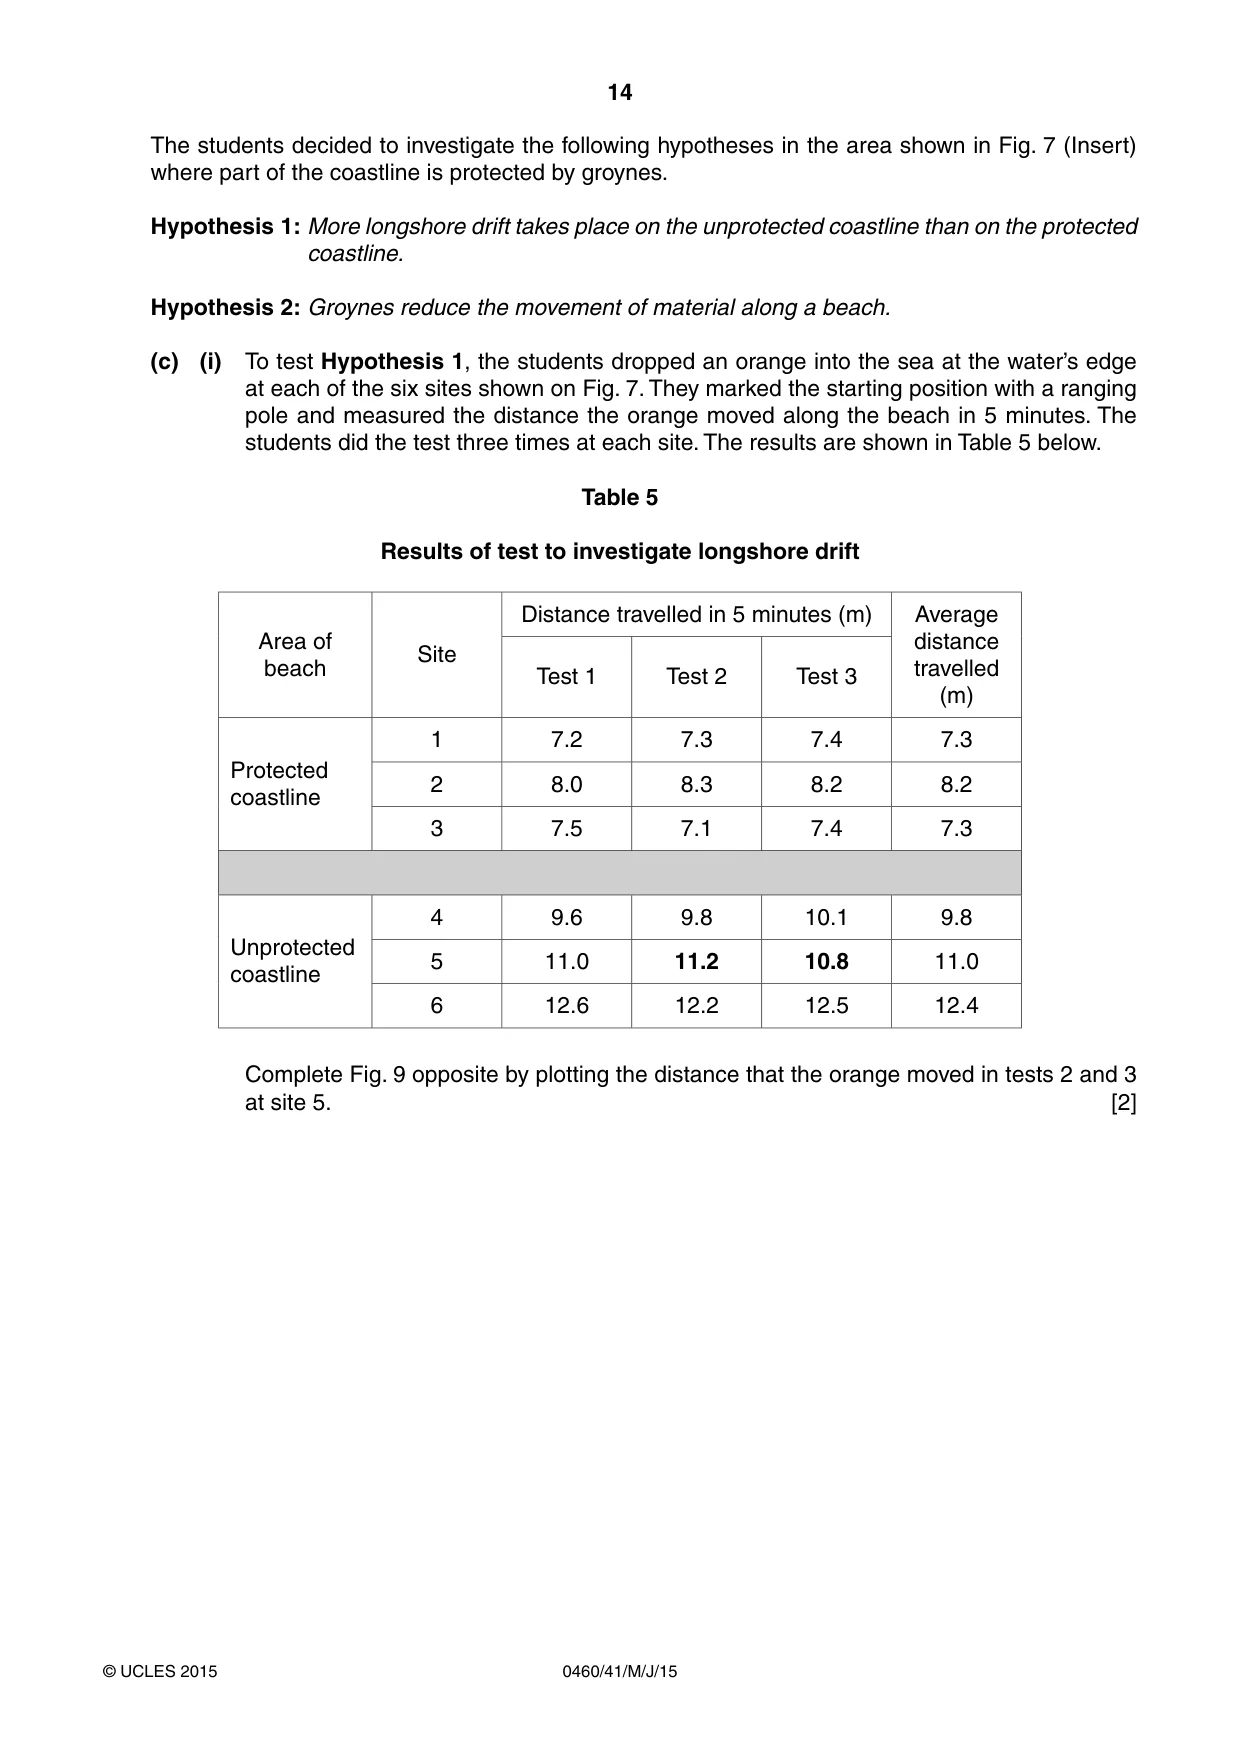
14 0460/41/M/J/15 © UCLES 2015 The students decided to investigate the following hypotheses in the area shown in Fig. 7 (Insert) where part of the coastline is protected by groynes. Hypothesis 1: More longshore drift takes place on the unprotected coastline than on the protected coastline. Hypothesis 2: Groynes reduce the movement of material along a beach. (c) (i) To test Hypothesis 1, the students dropped an orange into the sea at the water’s edge at each of the six sites shown on Fig. 7. They marked the starting position with a ranging pole and measured the distance the orange moved along the beach in 5 minutes. The students did the test three times at each site. The results are shown in Table 5 below. Table 5 Results of test to investigate longshore drift Area of beach Site Distance travelled in 5 minutes (m) Average distance travelled (m) Test 1 Test 2 Test 3 Protected coastline 1 7.2 7.3 7.4 7.3 2 8.0 8.3 8.2 8.2 3 7.5 7.1 7.4 7.3 Unprotected coastline 4 9.6 9.8 10.1 9.8 5 11.0 11.2 10.8 11.0 6 12.6 12.2 12.5 12.4 Complete Fig. 9 opposite by plotting the distance that the orange moved in tests 2 and 3 at site 5. [2]
Question paper, page 15
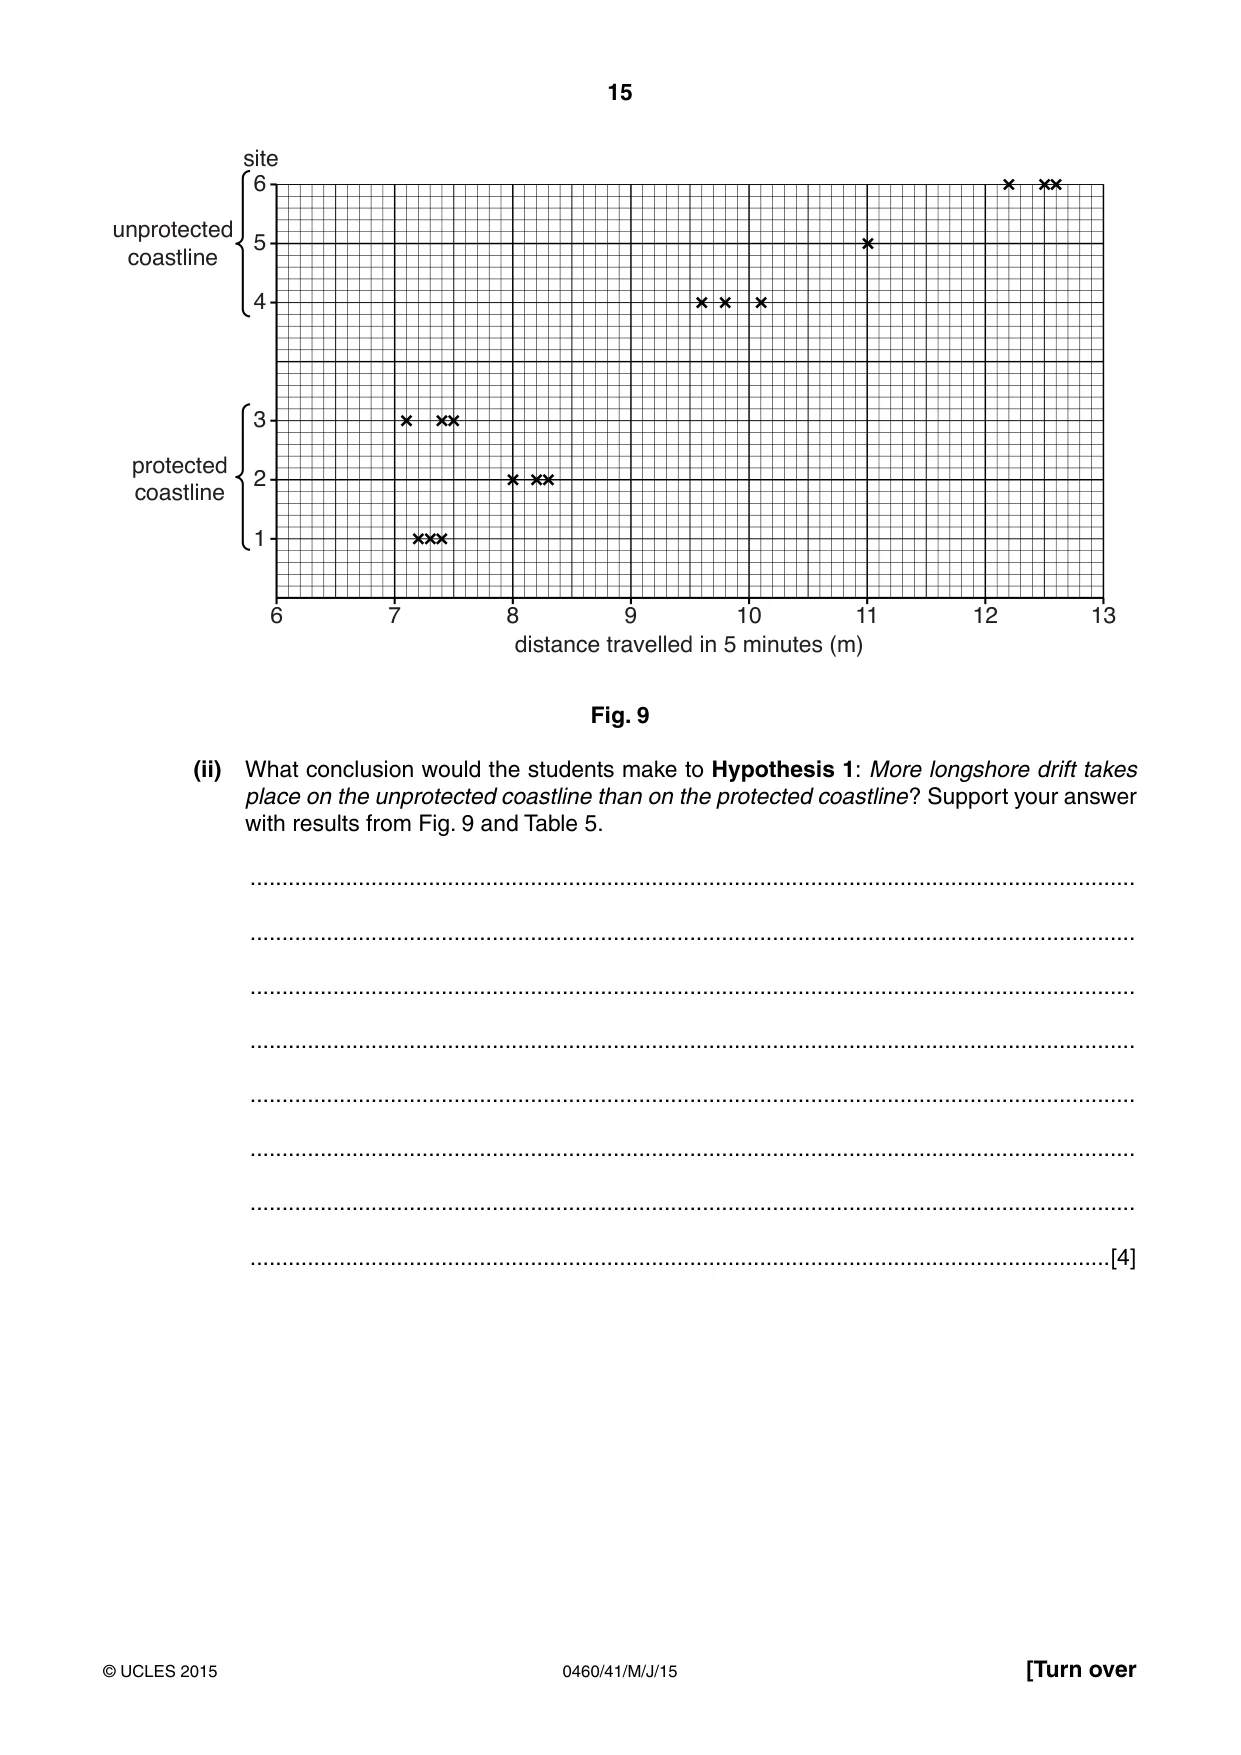
15 0460/41/M/J/15 © UCLES 2015 [Turn over 6 1 2 3 4 5 6 site 7 8 9 10 distance travelled in 5 minutes (m) unprotected coastline protected coastline 11 12 13 Fig. 9 (ii) What conclusion would the students make to Hypothesis 1: More longshore drift takes place on the unprotected coastline than on the protected coastline? Support your answer with results from Fig. 9 and Table 5. … … … … … … … …[4]
Question paper, page 16
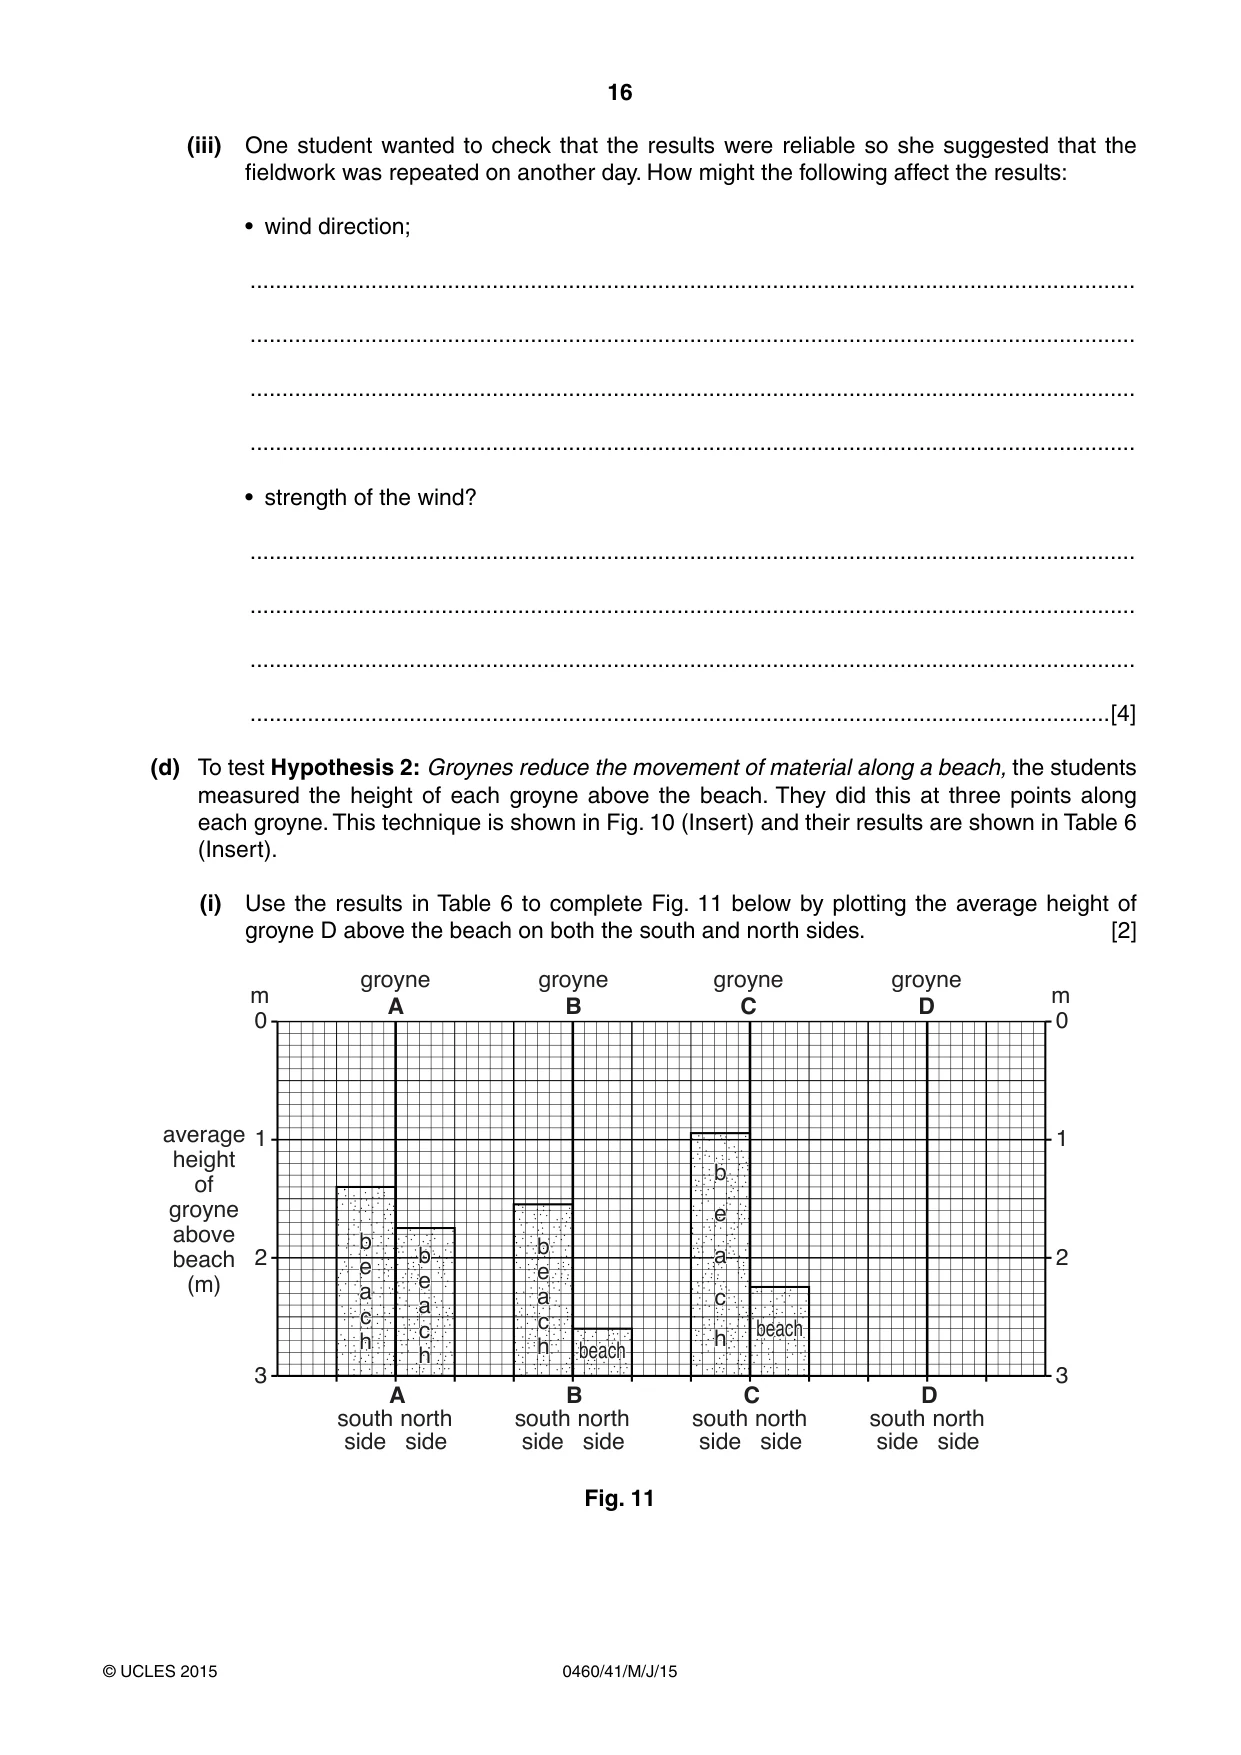
16 0460/41/M/J/15 © UCLES 2015 (iii) One student wanted to check that the results were reliable so she suggested that the fieldwork was repeated on another day. How might the following affect the results: • wind direction; … … … … • strength of the wind? … … … …[4] (d) To test Hypothesis 2: Groynes reduce the movement of material along a beach, the students measured the height of each groyne above the beach. They did this at three points along each groyne. This technique is shown in Fig. 10 (Insert) and their results are shown in Table 6 (Insert). (i) Use the results in Table 6 to complete Fig. 11 below by plotting the average height of groyne D above the beach on both the south and north sides. [2] average height of groyne above beach (m) 2 3 A groyne A groyne B groyne C groyne D south side north side B south side north side C south side north side D south side north side 1 0 m 2 3 1 0 m b e a c h b e a c h b e a c h beach beach b e a c h Fig. 11
Question paper, page 17
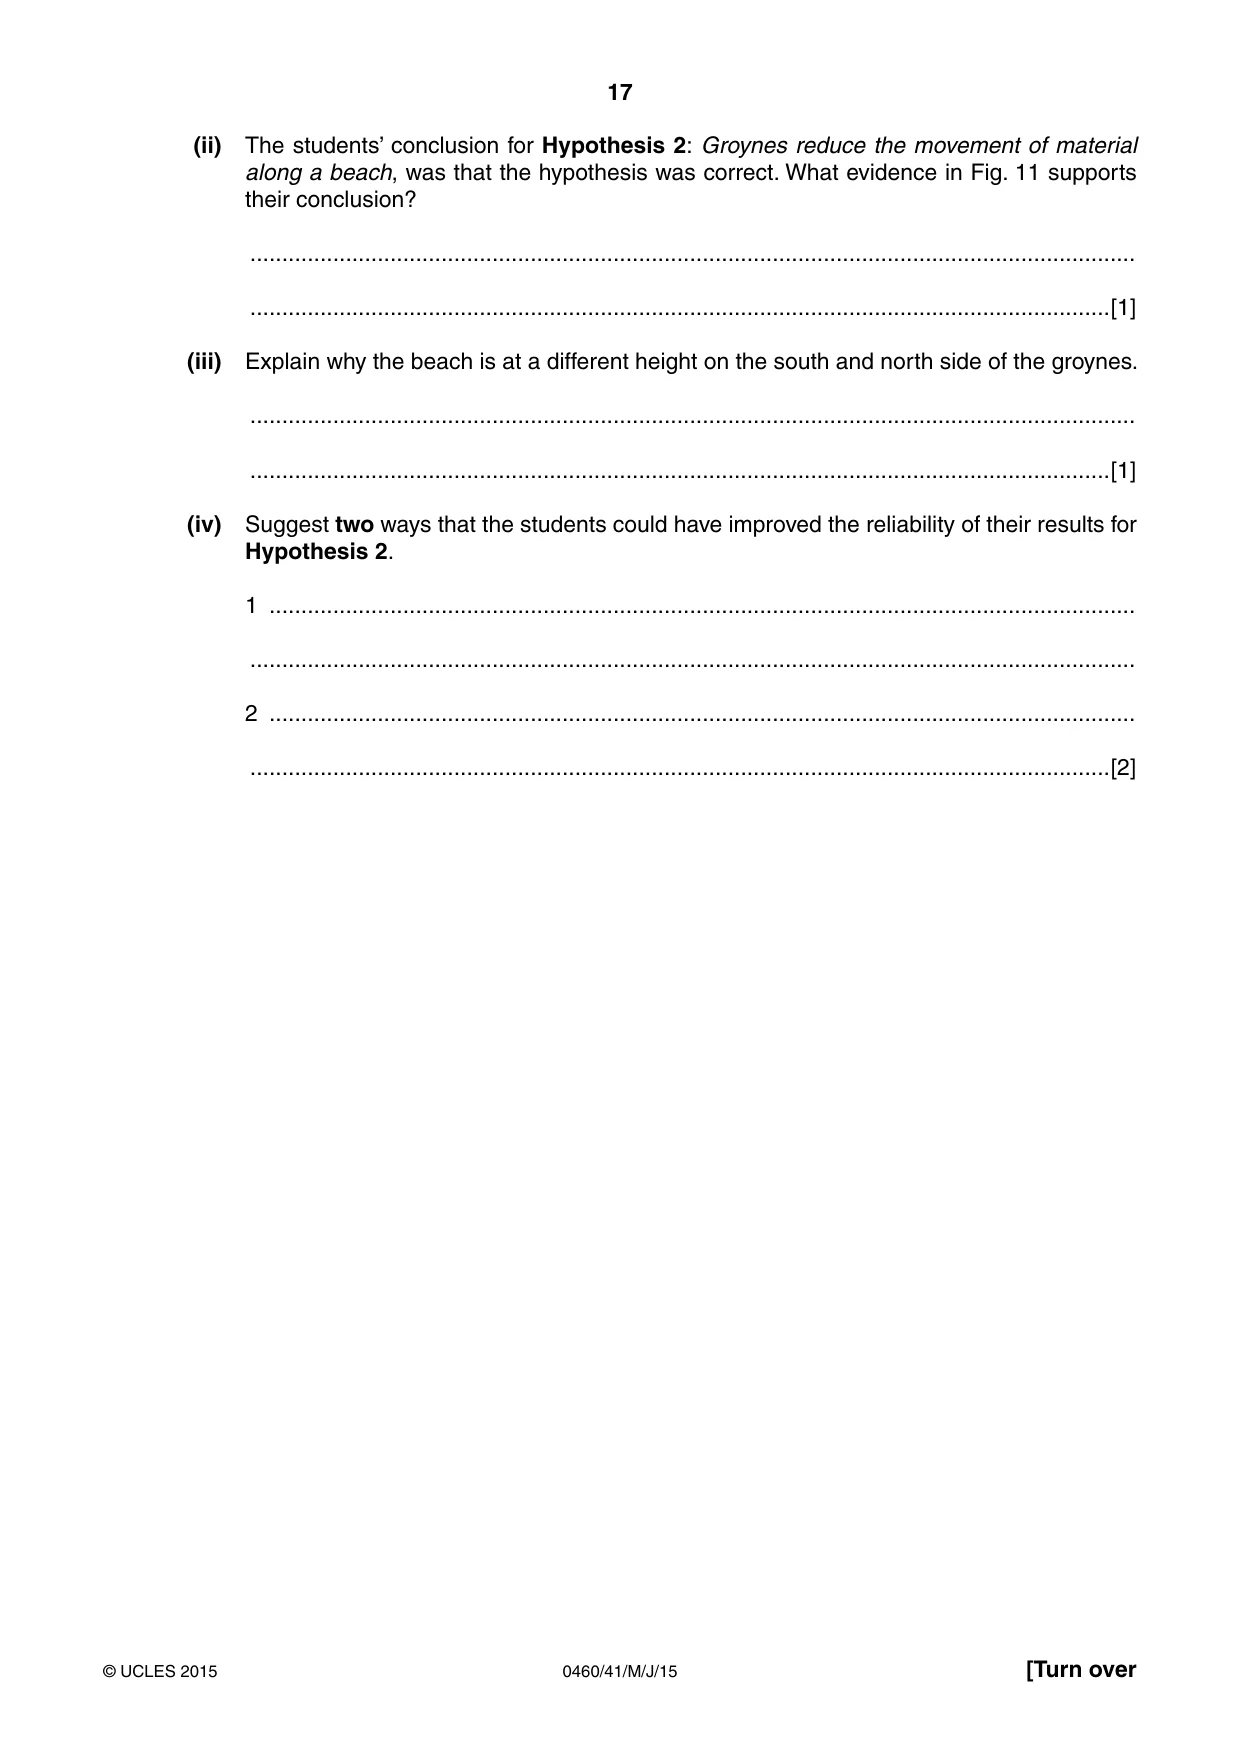
17 0460/41/M/J/15 © UCLES 2015 [Turn over (ii) The students’ conclusion for Hypothesis 2: Groynes reduce the movement of material along a beach, was that the hypothesis was correct. What evidence in Fig. 11 supports their conclusion? … …[1] (iii) Explain why the beach is at a different height on the south and north side of the groynes. … …[1] (iv) Suggest two ways that the students could have improved the reliability of their results for Hypothesis 2. 1 … … 2 … …[2]
Question paper, page 18
18 0460/41/M/J/15 © UCLES 2015 (e) As an extra piece of fieldwork some students did an investigation to compare beach profiles in different areas of coastline. Describe how they would measure a beach profile using the following equipment: • two ranging poles • a clinometer • a tape measure You may draw a diagram as part of your answer. … … … … … … … … [4] [Total: 30 marks]
Question paper, page 19
19 0460/41/M/J/15 © UCLES 2015 BLANK PAGE
Question paper, page 20
20 0460/41/M/J/15 © UCLES 2015 Permission to reproduce items where third-party owned material protected by copyright is included has been sought and cleared where possible. Every reasonable effort has been made by the publisher (UCLES) to trace copyright holders, but if any items requiring clearance have unwittingly been included, the publisher will be pleased to make amends at the earliest possible opportunity. To avoid the issue of disclosure of answer-related information to candidates, all copyright acknowledgements are reproduced online in the Cambridge International Examinations Copyright Acknowledgements Booklet. This is produced for each series of examinations and is freely available to download at www.cie.org.uk after the live examination series. Cambridge International Examinations is part of the Cambridge Assessment Group. Cambridge Assessment is the brand name of University of Cambridge Local Examinations Syndicate (UCLES), which is itself a department of the University of Cambridge. BLANK PAGE
Mark scheme, page 1
® IGCSE is the registered trademark of Cambridge International Examinations. CAMBRIDGE INTERNATIONAL EXAMINATIONS Cambridge International General Certificate of Secondary Education MARK SCHEME for the May/June 2015 series 0460 GEOGRAPHY 0460/41 Paper 4 (Alternative to Coursework), maximum raw mark 60 This mark scheme is published as an aid to teachers and candidates, to indicate the requirements of the examination. It shows the basis on which Examiners were instructed to award marks. It does not indicate the details of the discussions that took place at an Examiners’ meeting before marking began, which would have considered the acceptability of alternative answers. Mark schemes should be read in conjunction with the question paper and the Principal Examiner Report for Teachers. Cambridge will not enter into discussions about these mark schemes. Cambridge is publishing the mark schemes for the May/June 2015 series for most Cambridge IGCSE®, Cambridge International A and AS Level components and some Cambridge O Level components.
Mark scheme, page 2
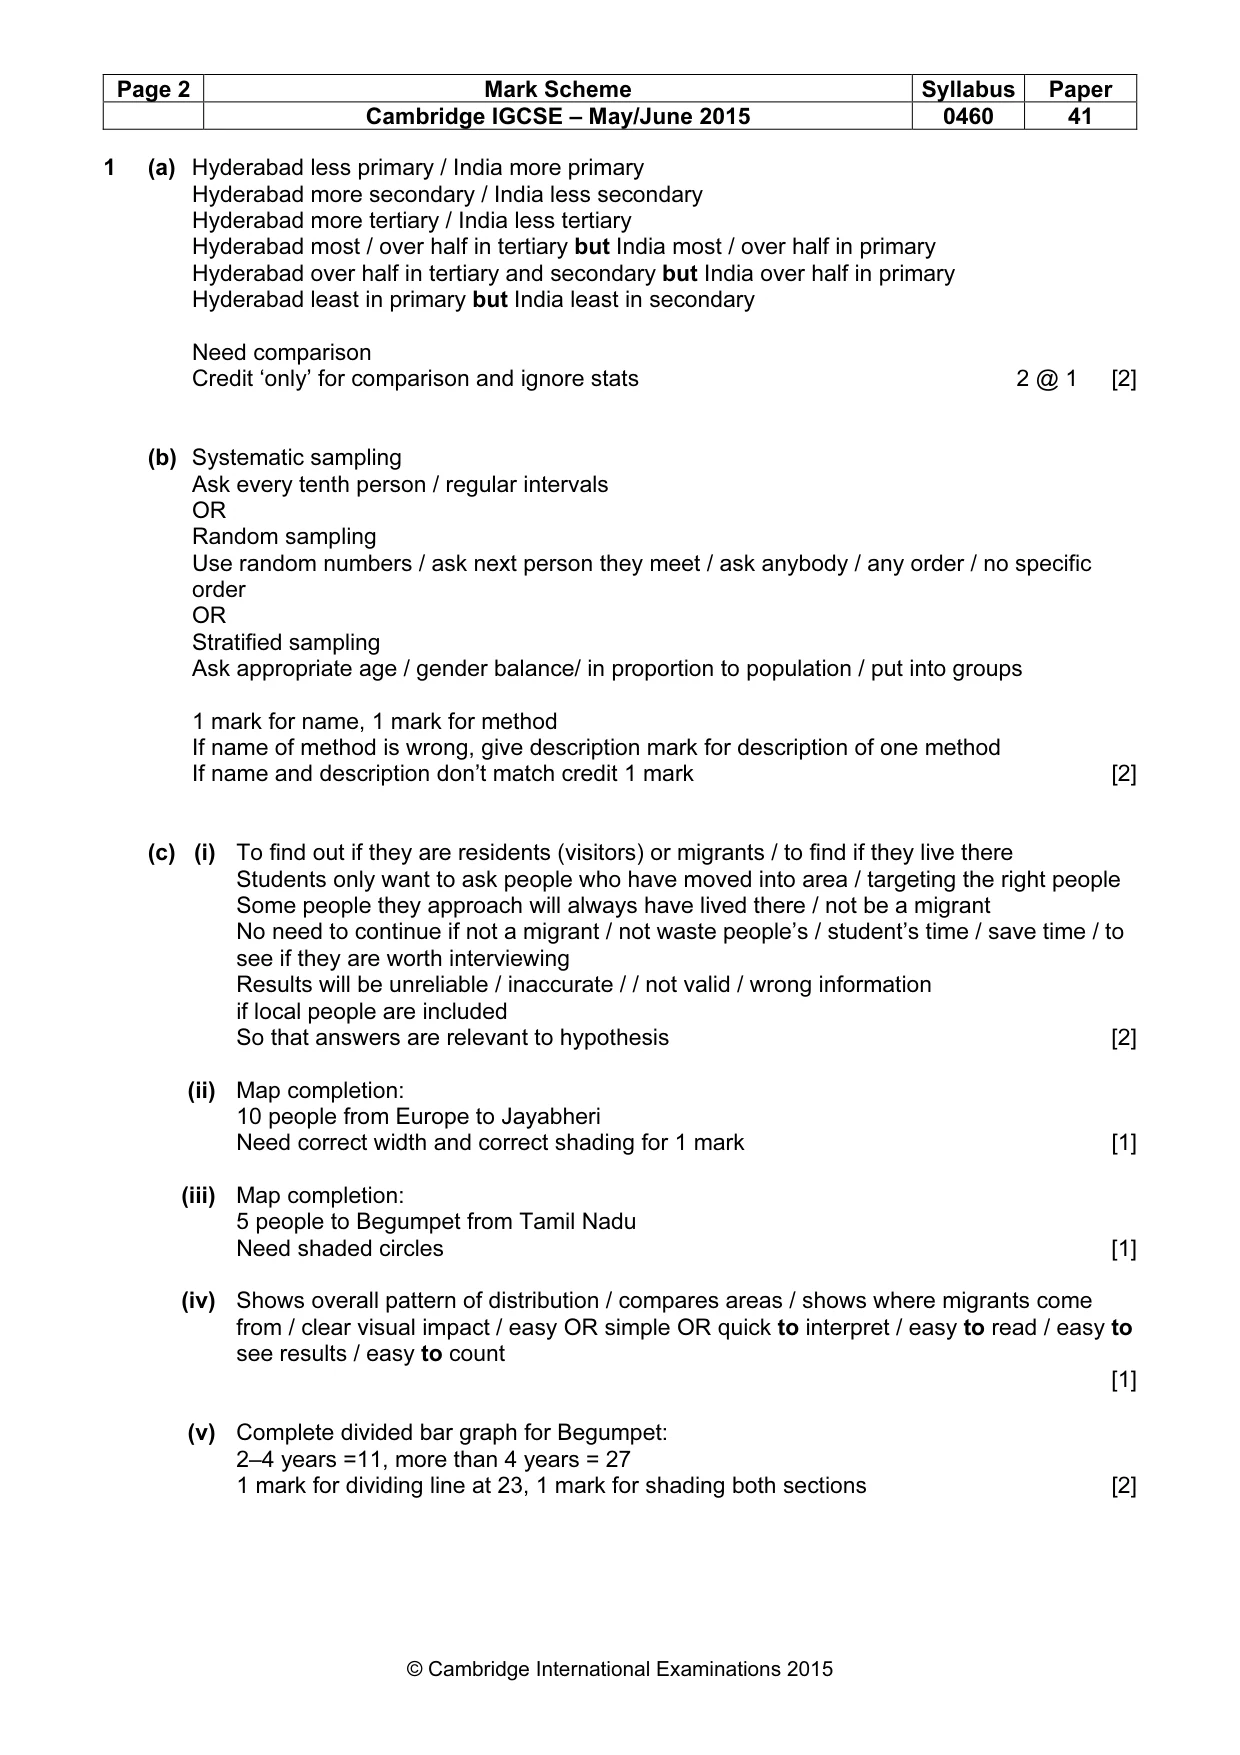
Page 2 Mark Scheme Syllabus Paper Cambridge IGCSE – May/June 2015 0460 41 © Cambridge International Examinations 2015 1 (a) Hyderabad less primary / India more primary Hyderabad more secondary / India less secondary Hyderabad more tertiary / India less tertiary Hyderabad most / over half in tertiary but India most / over half in primary Hyderabad over half in tertiary and secondary but India over half in primary Hyderabad least in primary but India least in secondary Need comparison Credit ‘only’ for comparison and ignore stats 2 @ 1 [2] (b) Systematic sampling Ask every tenth person / regular intervals OR Random sampling Use random numbers / ask next person they meet / ask anybody / any order / no specific order OR Stratified sampling Ask appropriate age / gender balance/ in proportion to population / put into groups 1 mark for name, 1 mark for method If name of method is wrong, give description mark for description of one method If name and description don’t match credit 1 mark [2] (c) (i) To find out if they are residents (visitors) or migrants / to find if they live there Students only want to ask people who have moved into area / targeting the right people Some people they approach will always have lived there / not be a migrant No need to continue if not a migrant / not waste people’s / student’s time / save time / to see if they are worth interviewing Results will be unreliable / inaccurate / / not valid / wrong information if local people are included So that answers are relevant to hypothesis [2] (ii) Map completion: 10 people from Europe to Jayabheri Need correct width and correct shading for 1 mark [1] (iii) Map completion: 5 people to Begumpet from Tamil Nadu Need shaded circles [1] (iv) Shows overall pattern of distribution / compares areas / shows where migrants come from / clear visual impact / easy OR simple OR quick to interpret / easy to read / easy to see results / easy to count [1] (v) Complete divided bar graph for Begumpet: 2–4 years =11, more than 4 years = 27 1 mark for dividing line at 23, 1 mark for shading both sections [2]
Mark scheme, page 3
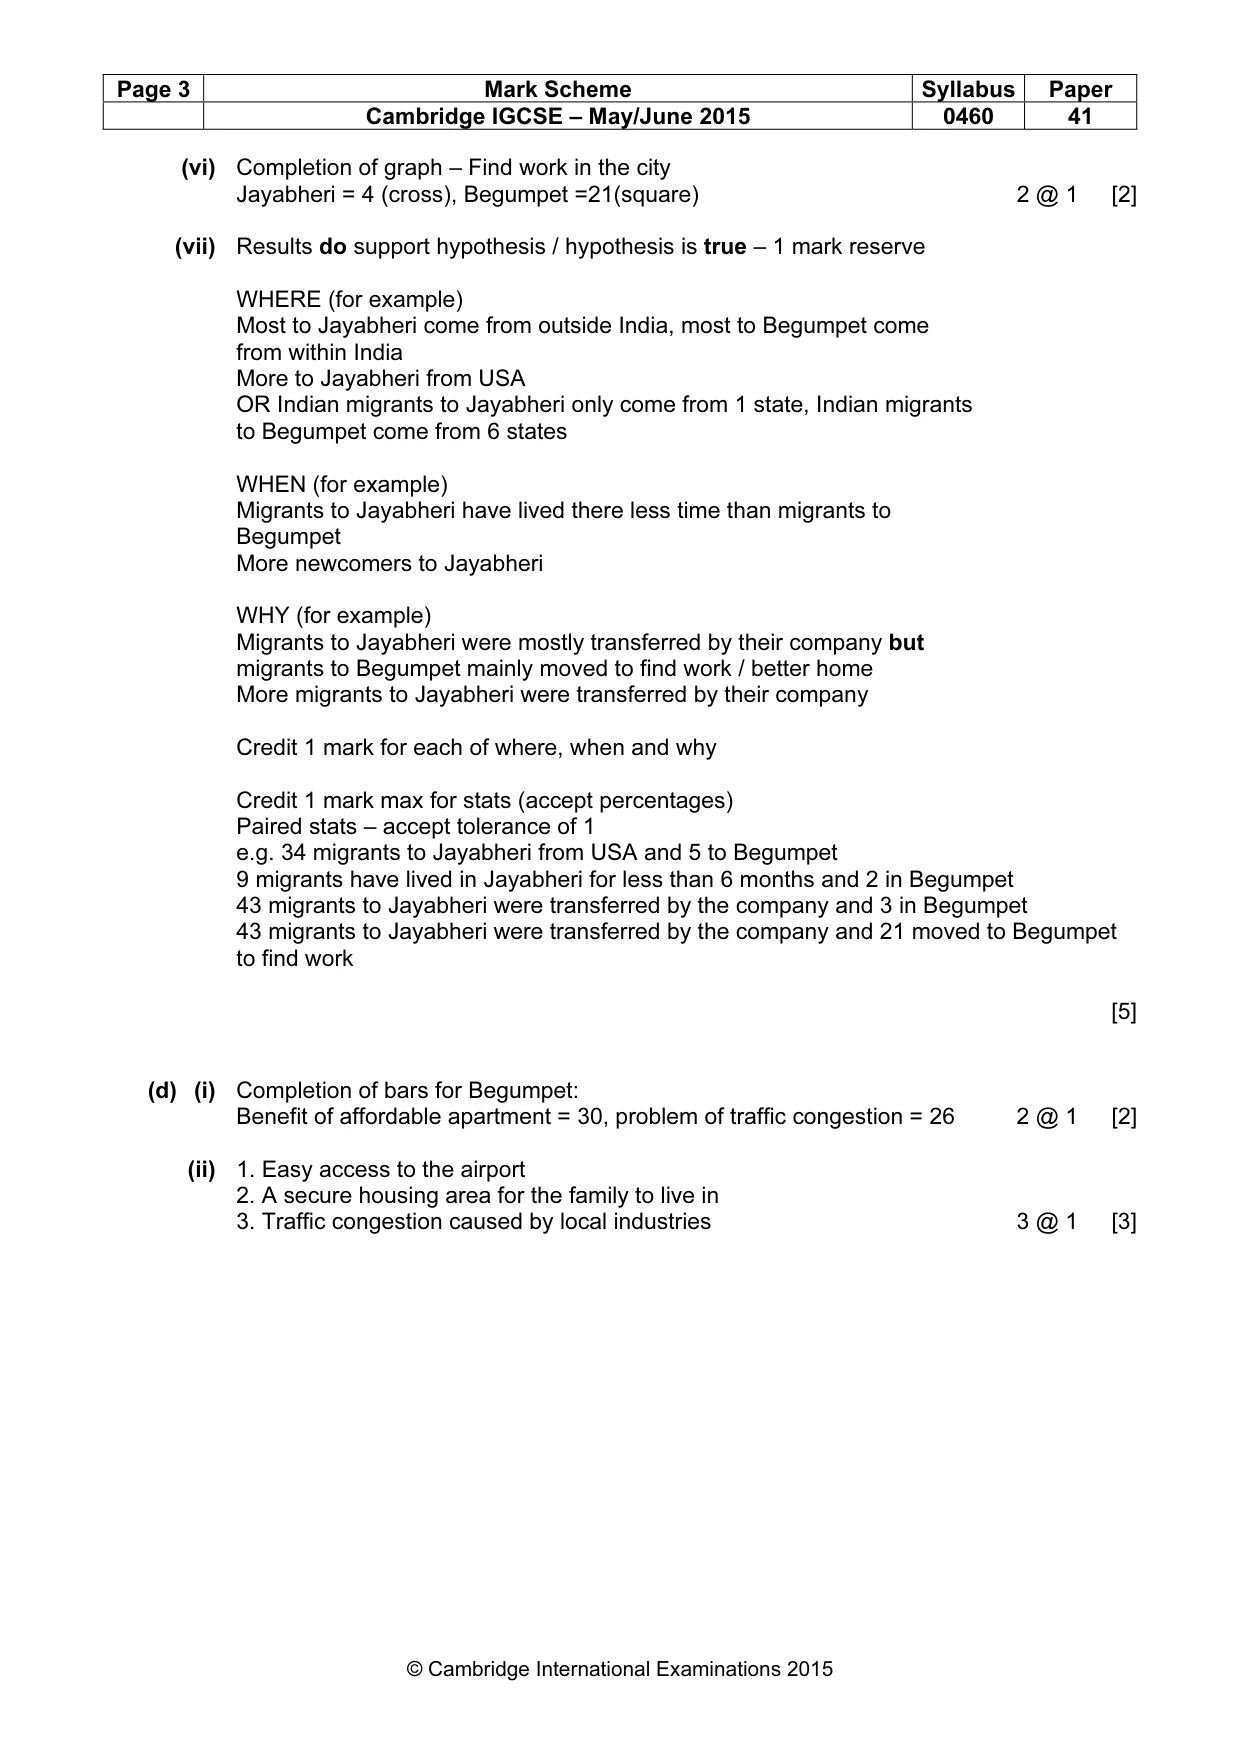
Page 3 Mark Scheme Syllabus Paper Cambridge IGCSE – May/June 2015 0460 41 © Cambridge International Examinations 2015 (vi) Completion of graph – Find work in the city Jayabheri = 4 (cross), Begumpet =21(square) 2 @ 1 [2] (vii) Results do support hypothesis / hypothesis is true – 1 mark reserve WHERE (for example) Most to Jayabheri come from outside India, most to Begumpet come from within India More to Jayabheri from USA OR Indian migrants to Jayabheri only come from 1 state, Indian migrants to Begumpet come from 6 states WHEN (for example) Migrants to Jayabheri have lived there less time than migrants to Begumpet More newcomers to Jayabheri WHY (for example) Migrants to Jayabheri were mostly transferred by their company but migrants to Begumpet mainly moved to find work / better home More migrants to Jayabheri were transferred by their company Credit 1 mark for each of where, when and why Credit 1 mark max for stats (accept percentages) Paired stats – accept tolerance of 1 e.g. 34 migrants to Jayabheri from USA and 5 to Begumpet 9 migrants have lived in Jayabheri for less than 6 months and 2 in Begumpet 43 migrants to Jayabheri were transferred by the company and 3 in Begumpet 43 migrants to Jayabheri were transferred by the company and 21 moved to Begumpet to find work [5] (d) (i) Completion of bars for Begumpet: Benefit of affordable apartment = 30, problem of traffic congestion = 26 2 @ 1 [2] (ii) 1. Easy access to the airport 2. A secure housing area for the family to live in 3. Traffic congestion caused by local industries 3 @ 1 [3]
Mark scheme, page 4
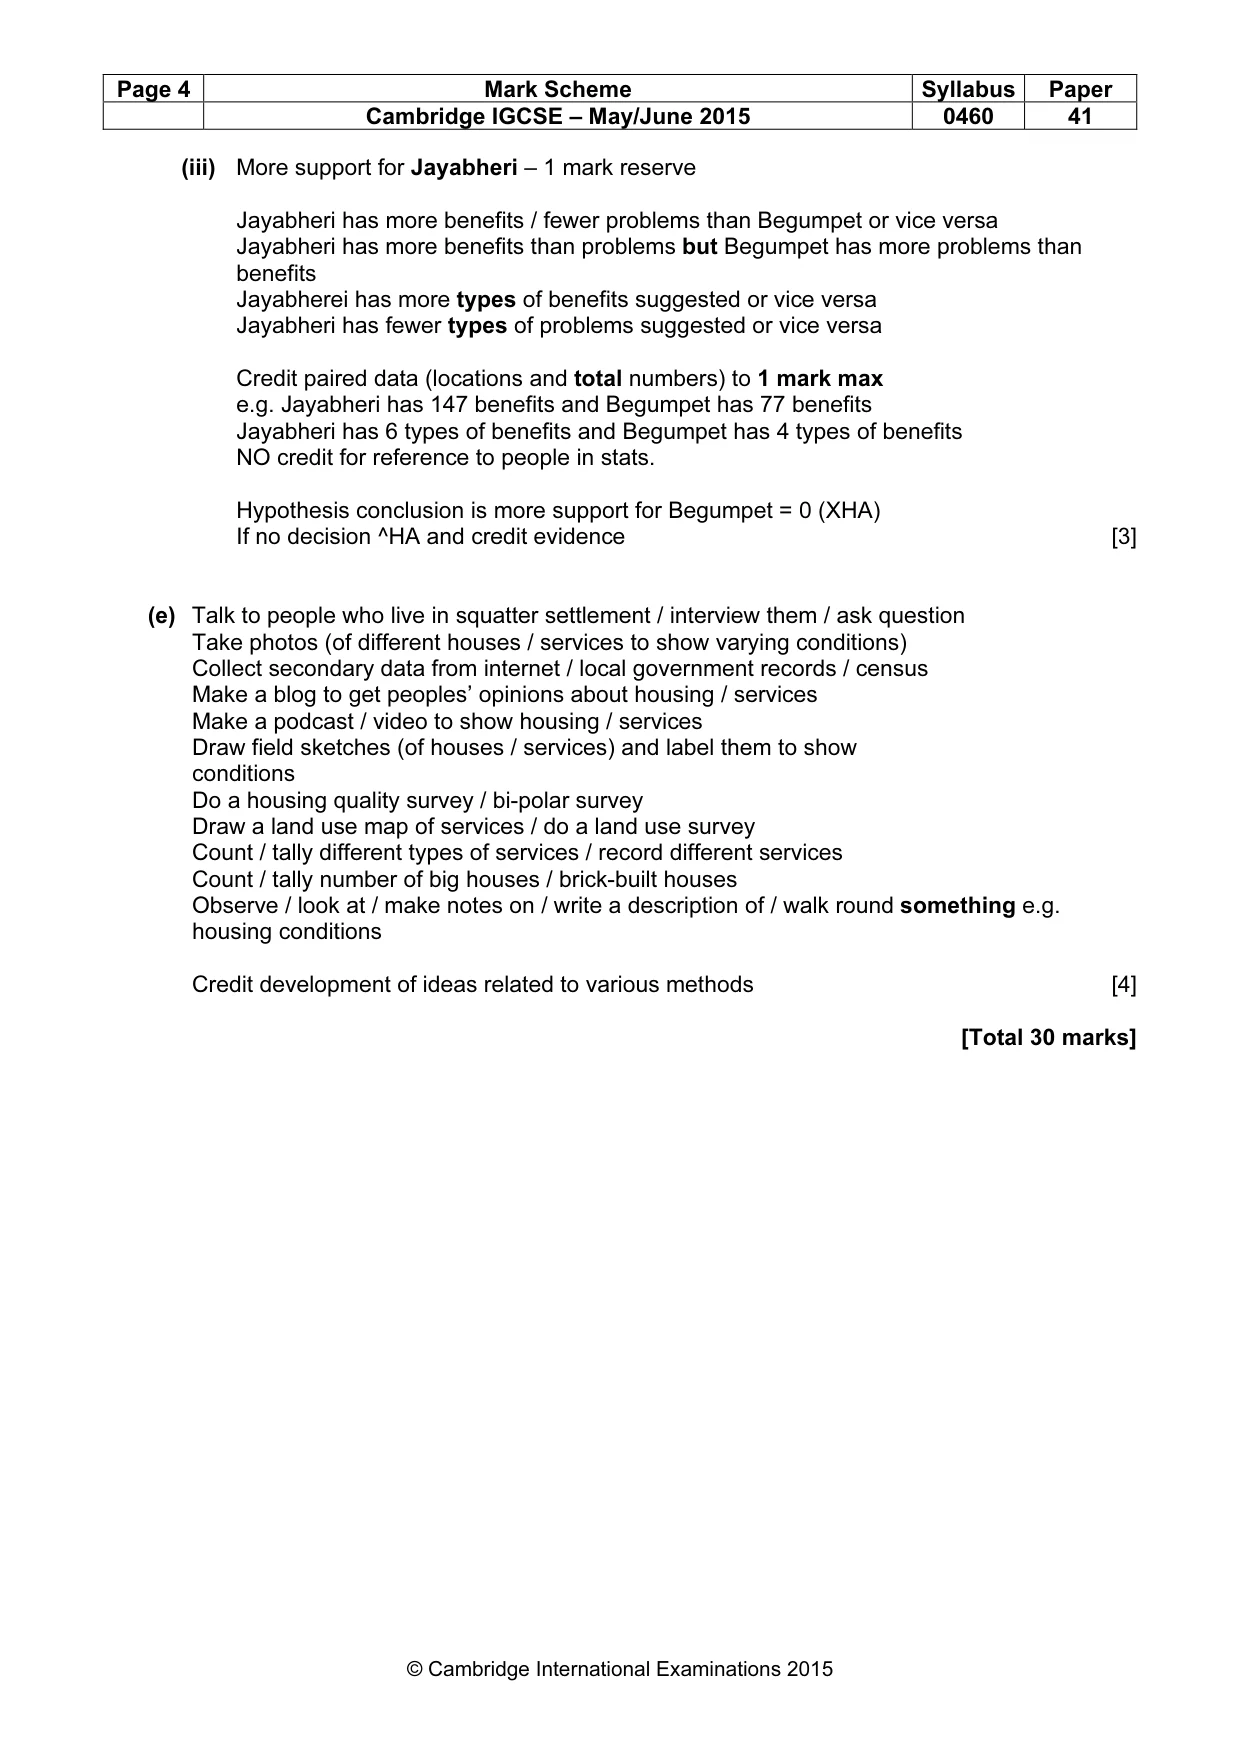
Page 4 Mark Scheme Syllabus Paper Cambridge IGCSE – May/June 2015 0460 41 © Cambridge International Examinations 2015 (iii) More support for Jayabheri – 1 mark reserve Jayabheri has more benefits / fewer problems than Begumpet or vice versa Jayabheri has more benefits than problems but Begumpet has more problems than benefits Jayabherei has more types of benefits suggested or vice versa Jayabheri has fewer types of problems suggested or vice versa Credit paired data (locations and total numbers) to 1 mark max e.g. Jayabheri has 147 benefits and Begumpet has 77 benefits Jayabheri has 6 types of benefits and Begumpet has 4 types of benefits NO credit for reference to people in stats. Hypothesis conclusion is more support for Begumpet = 0 (XHA) If no decision ^HA and credit evidence [3] (e) Talk to people who live in squatter settlement / interview them / ask question Take photos (of different houses / services to show varying conditions) Collect secondary data from internet / local government records / census Make a blog to get peoples’ opinions about housing / services Make a podcast / video to show housing / services Draw field sketches (of houses / services) and label them to show conditions Do a housing quality survey / bi-polar survey Draw a land use map of services / do a land use survey Count / tally different types of services / record different services Count / tally number of big houses / brick-built houses Observe / look at / make notes on / write a description of / walk round something e.g. housing conditions Credit development of ideas related to various methods [4] [Total 30 marks]
Mark scheme, page 5
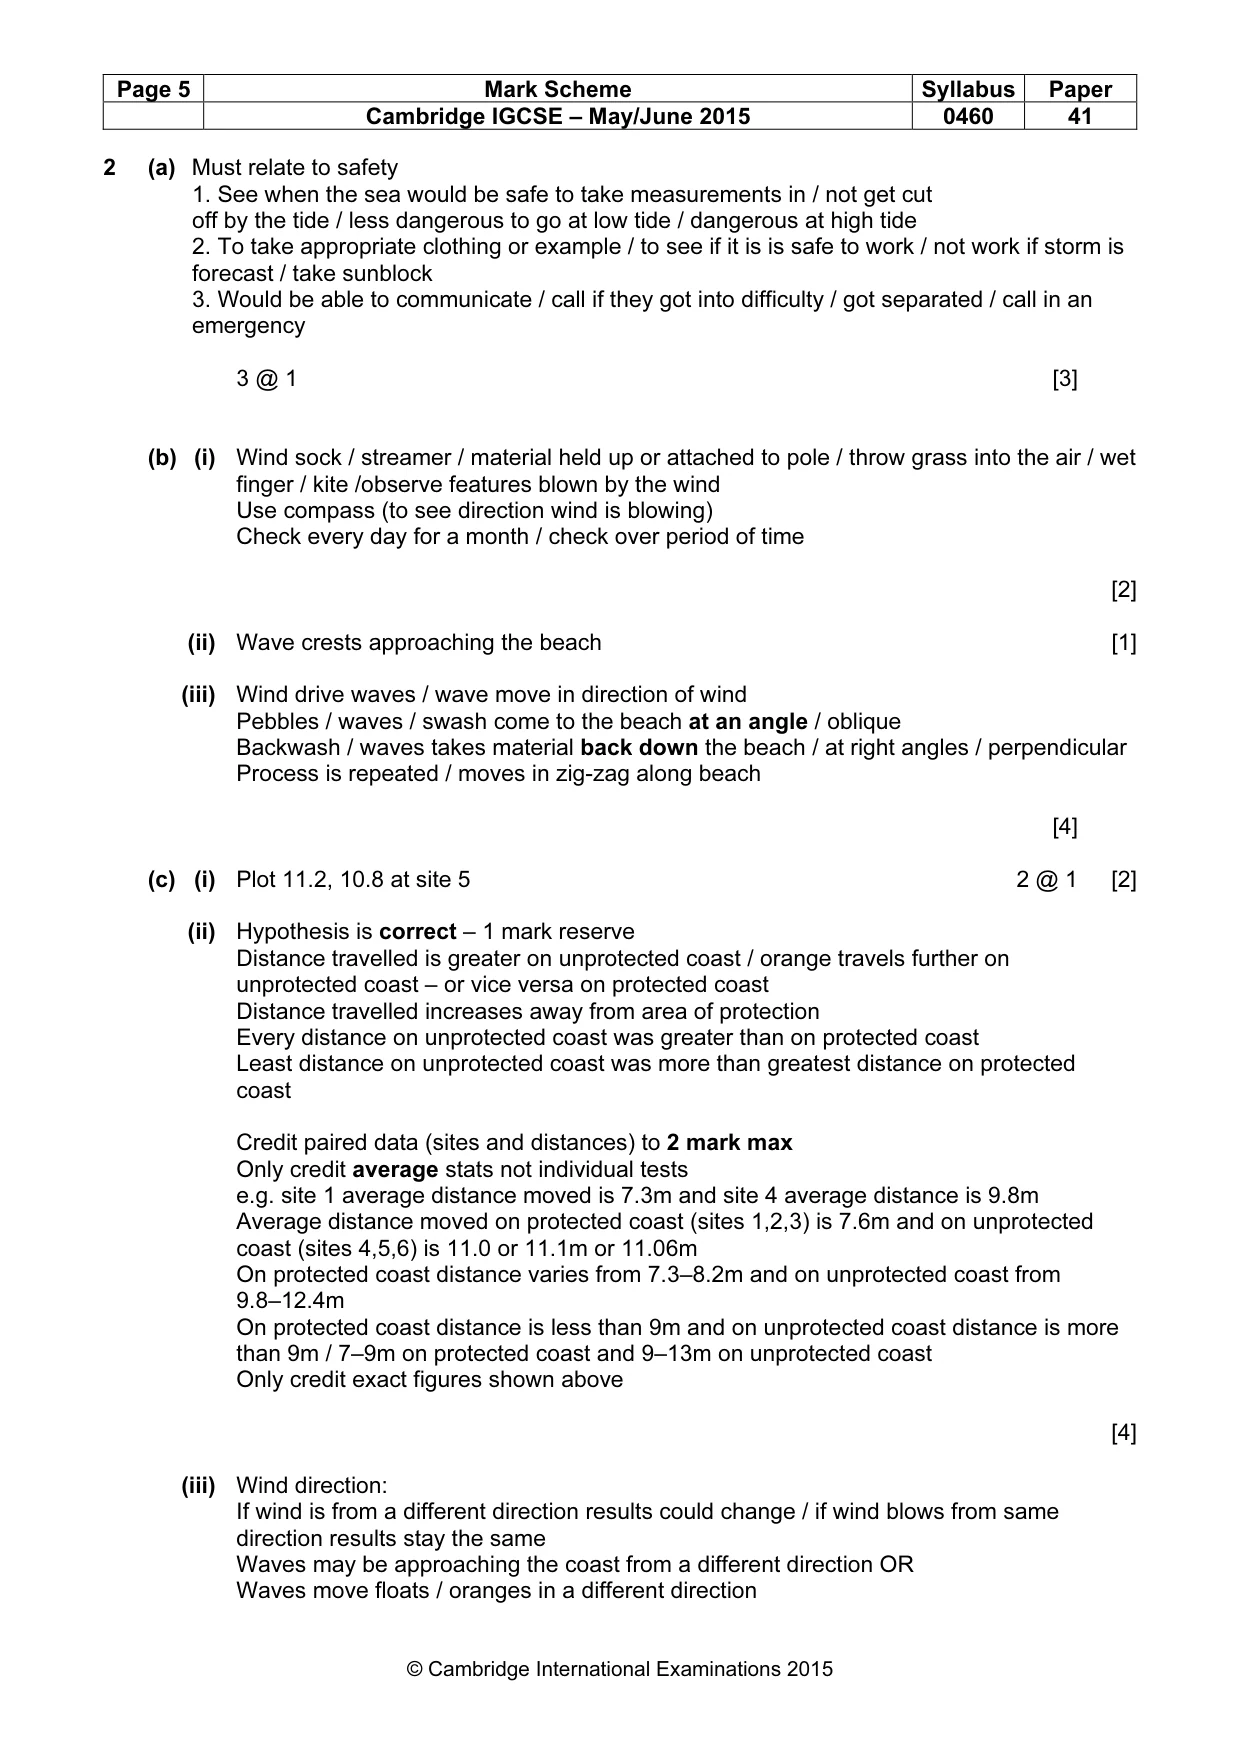
Page 5 Mark Scheme Syllabus Paper Cambridge IGCSE – May/June 2015 0460 41 © Cambridge International Examinations 2015 2 (a) Must relate to safety 1. See when the sea would be safe to take measurements in / not get cut off by the tide / less dangerous to go at low tide / dangerous at high tide 2. To take appropriate clothing or example / to see if it is is safe to work / not work if storm is forecast / take sunblock 3. Would be able to communicate / call if they got into difficulty / got separated / call in an emergency 3 @ 1 [3] (b) (i) Wind sock / streamer / material held up or attached to pole / throw grass into the air / wet finger / kite /observe features blown by the wind Use compass (to see direction wind is blowing) Check every day for a month / check over period of time [2] (ii) Wave crests approaching the beach [1] (iii) Wind drive waves / wave move in direction of wind Pebbles / waves / swash come to the beach at an angle / oblique Backwash / waves takes material back down the beach / at right angles / perpendicular Process is repeated / moves in zig-zag along beach [4] (c) (i) Plot 11.2, 10.8 at site 5 2 @ 1 [2] (ii) Hypothesis is correct – 1 mark reserve Distance travelled is greater on unprotected coast / orange travels further on unprotected coast – or vice versa on protected coast Distance travelled increases away from area of protection Every distance on unprotected coast was greater than on protected coast Least distance on unprotected coast was more than greatest distance on protected coast Credit paired data (sites and distances) to 2 mark max Only credit average stats not individual tests e.g. site 1 average distance moved is 7.3m and site 4 average distance is 9.8m Average distance moved on protected coast (sites 1,2,3) is 7.6m and on unprotected coast (sites 4,5,6) is 11.0 or 11.1m or 11.06m On protected coast distance varies from 7.3–8.2m and on unprotected coast from 9.8–12.4m On protected coast distance is less than 9m and on unprotected coast distance is more than 9m / 7–9m on protected coast and 9–13m on unprotected coast Only credit exact figures shown above [4] (iii) Wind direction: If wind is from a different direction results could change / if wind blows from same direction results stay the same Waves may be approaching the coast from a different direction OR Waves move floats / oranges in a different direction
Mark scheme, page 6
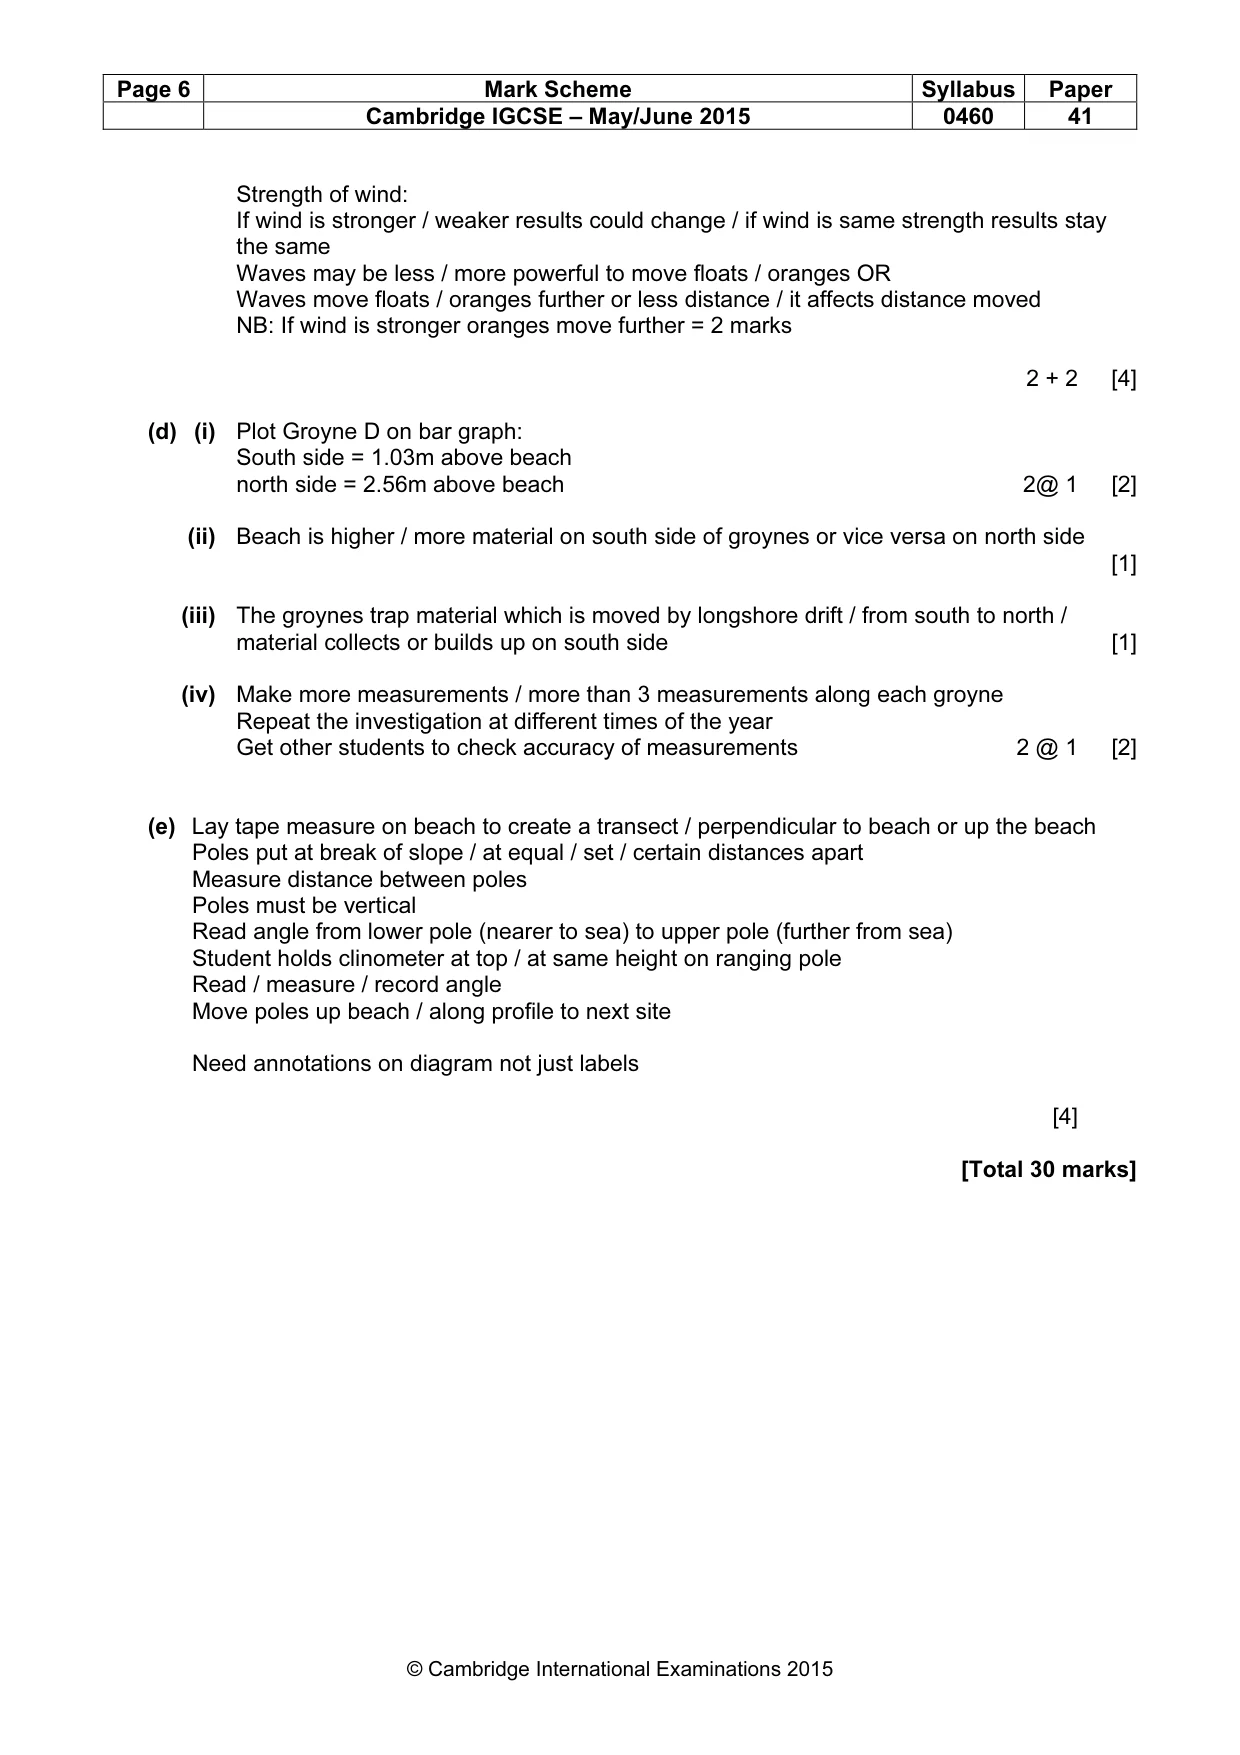
Page 6 Mark Scheme Syllabus Paper Cambridge IGCSE – May/June 2015 0460 41 © Cambridge International Examinations 2015 Strength of wind: If wind is stronger / weaker results could change / if wind is same strength results stay the same Waves may be less / more powerful to move floats / oranges OR Waves move floats / oranges further or less distance / it affects distance moved NB: If wind is stronger oranges move further = 2 marks 2 + 2 [4] (d) (i) Plot Groyne D on bar graph: South side = 1.03m above beach north side = 2.56m above beach 2@ 1 [2] (ii) Beach is higher / more material on south side of groynes or vice versa on north side [1] (iii) The groynes trap material which is moved by longshore drift / from south to north / material collects or builds up on south side [1] (iv) Make more measurements / more than 3 measurements along each groyne Repeat the investigation at different times of the year Get other students to check accuracy of measurements 2 @ 1 [2] (e) Lay tape measure on beach to create a transect / perpendicular to beach or up the beach Poles put at break of slope / at equal / set / certain distances apart Measure distance between poles Poles must be vertical Read angle from lower pole (nearer to sea) to upper pole (further from sea) Student holds clinometer at top / at same height on ranging pole Read / measure / record angle Move poles up beach / along profile to next site Need annotations on diagram not just labels [4] [Total 30 marks]
What you needed in this session
Cambridge’s own grade thresholds for 2015 May/June, Paper 4 · Variant 1. A higher threshold means an easier paper — the bar moves with how the cohort did.