Cambridge IGCSE Geography 0460 — 2015 May/June Paper 4 · Variant 2
0460/42/M/J/15 · 60 marks · ≈68 min
The question paper and its mark scheme, free to read here and free to download. This is Cambridge’s own paper, exactly as it was sat.
Question paper16 pages




Mark scheme7 pages
Answers below. Sit the paper first if you are practising.
Paper as text
Question paper, page 1
This document consists of 13 printed pages, 3 blank pages and 1 Insert. DC (ST/CGW) 96714/6 © UCLES 2015 [Turn over Cambridge International Examinations Cambridge International General Certificate of Secondary Education * 5 0 1 8 3 6 7 8 7 0 * GEOGRAPHY 0460/42 Paper 4 Alternative to Coursework May/June 2015 1 hour 30 minutes Candidates answer on the Question Paper. Additional Materials: Calculator Ruler READ THESE INSTRUCTIONS FIRST Write your Centre number, candidate number and name in the spaces provided. Write in dark blue or black pen. You may use an HB pencil for any diagrams or graphs. Do not use staples, paper clips, glue or correction fluid. DO NOT WRITE IN ANY BARCODES. Answer all questions. The Insert contains Figs 1 and 3 and Tables 1 and 2 for Question 1, and Figs 5 and 6, Table 4 and Photograph A for Question 2. The Insert is not required by the Examiner. Sketch maps and diagrams should be drawn whenever they serve to illustrate an answer. At the end of the examination, fasten all your work securely together. The number of marks is given in brackets [ ] at the end of each question or part question. The syllabus is approved for use in England, Wales and Northern Ireland as a Cambridge International Level 1/Level 2 Certificate.
Question paper, page 2
2 0460/42/M/J/15 © UCLES 2015 BLANK PAGE
Question paper, page 3
3 0460/42/M/J/15 © UCLES 2015 [Turn over 1 Students in Mar del Plata, a large tourist resort in Argentina, were interested in the effects of tourism on the city and how these varied between the summer tourist season and winter when there were fewer tourists. Their two hypotheses were: Hypothesis 1: The advantages of tourism are greater than the disadvantages. Hypothesis 2: The amount of traffic is greater in summer than in winter because of tourism. (a) The students decided to use a questionnaire to investigate Hypothesis 1. This is shown in Fig. 1 (Insert). (i) They showed the questionnaire to their teacher who suggested that before they used it with people they should first ask them if they lived in Mar del Plata. Why do you think the teacher made this suggestion? … … … …[2] (ii) Name and describe one sampling method to select 150 residents of Mar del Plata to complete the questionnaire. Name of sampling method: … Description: … …[2] (iii) Give two advantages of sampling. 1 … … 2 … …[2]
Question paper, page 4
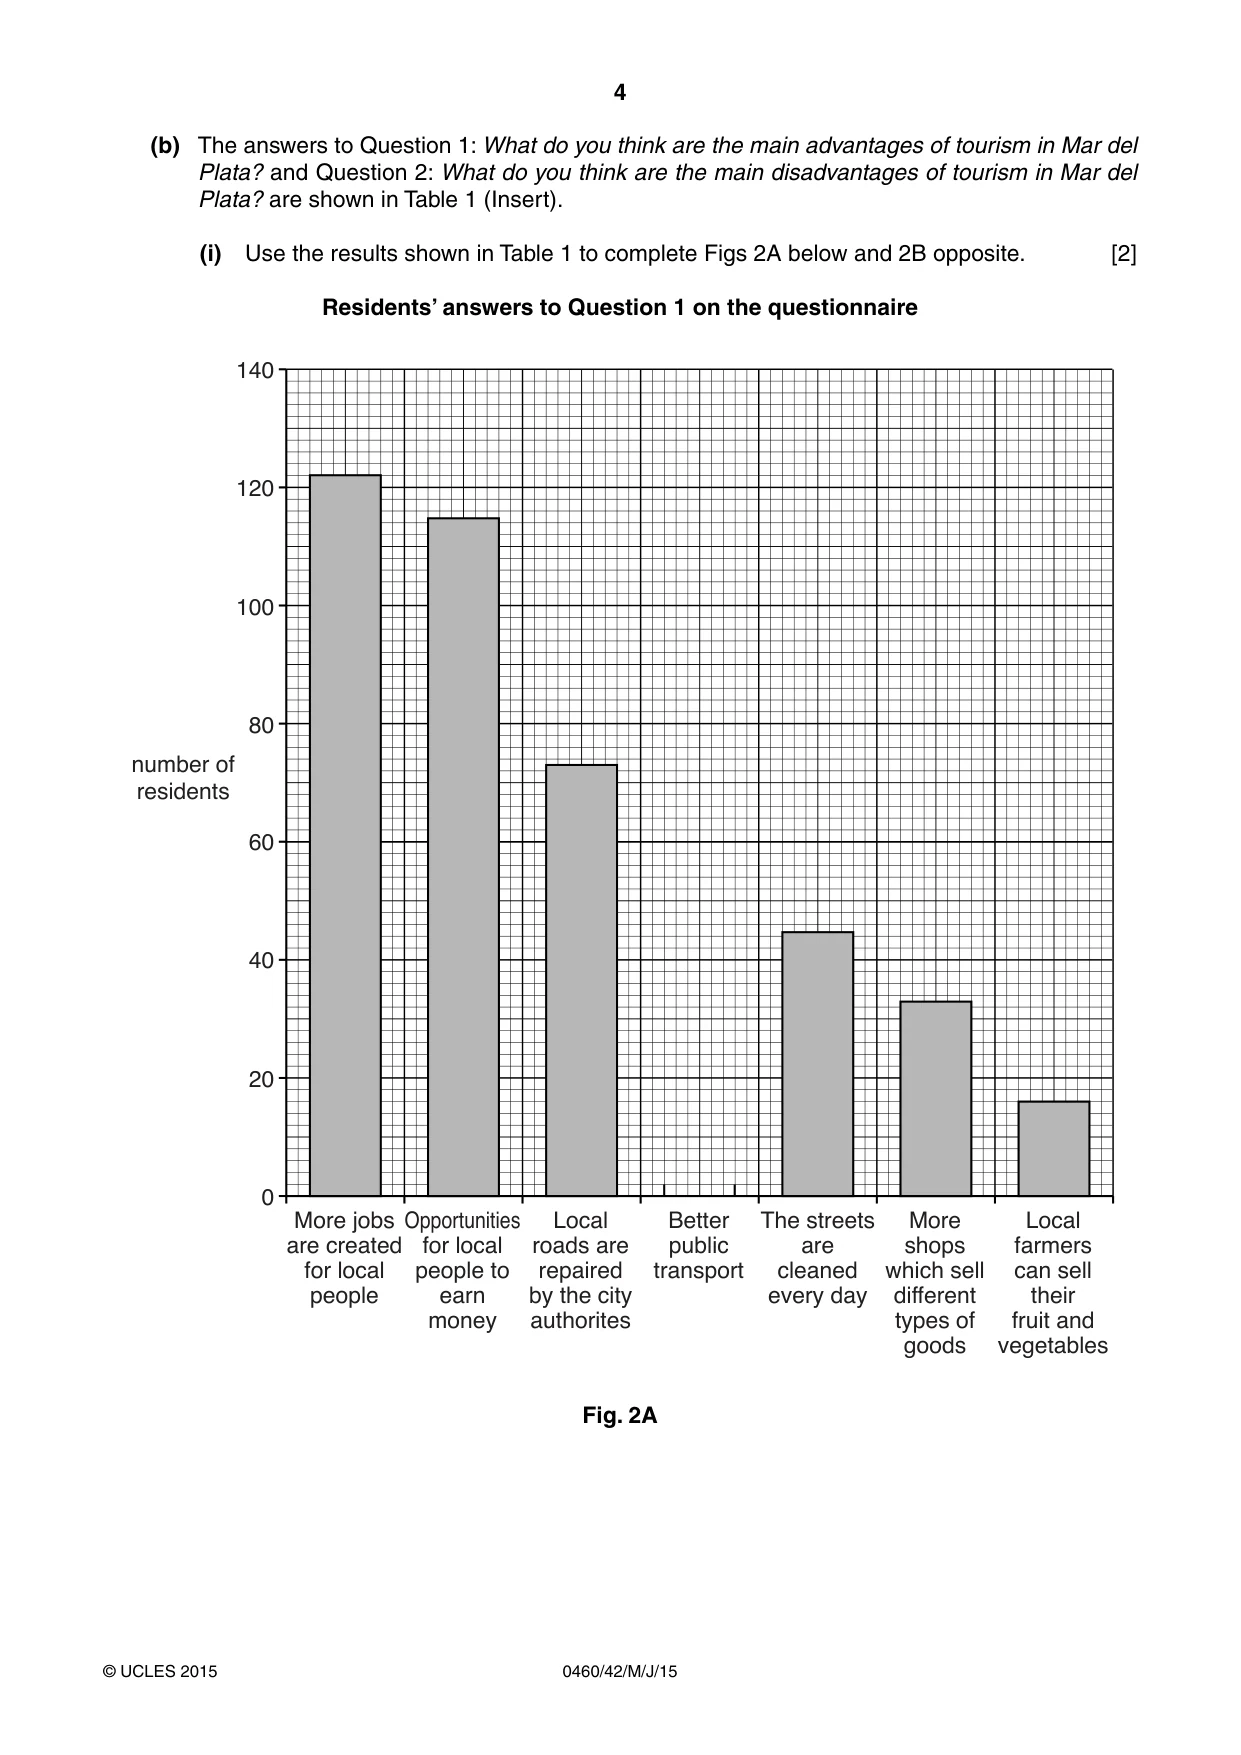
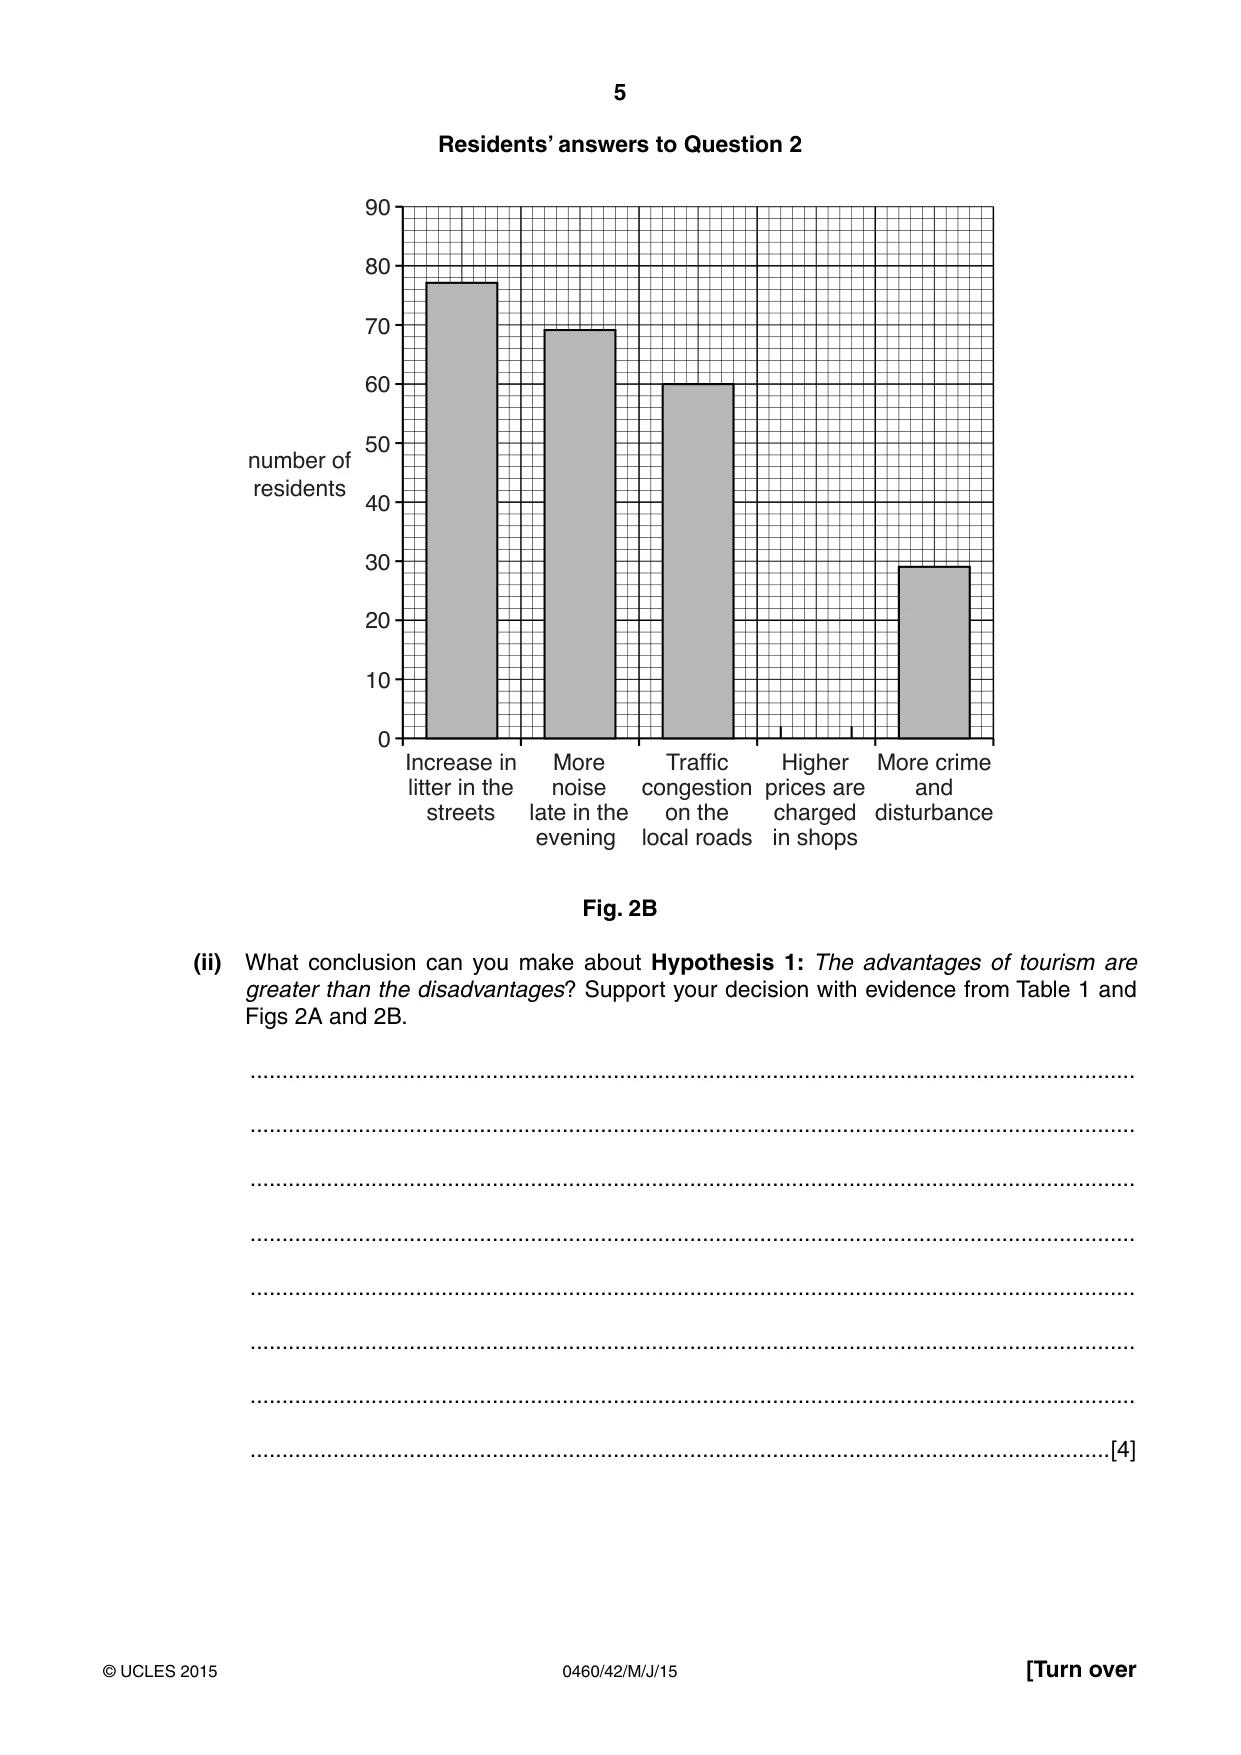
4 0460/42/M/J/15 © UCLES 2015 (b) The answers to Question 1: What do you think are the main advantages of tourism in Mar del Plata? and Question 2: What do you think are the main disadvantages of tourism in Mar del Plata? are shown in Table 1 (Insert). (i) Use the results shown in Table 1 to complete Figs 2A below and 2B opposite. [2] Residents’ answers to Question 1 on the questionnaire 0 20 More jobs are created for local people Opportunities for local people to earn money Local roads are repaired by the city authorites Better public transport The streets are cleaned every day More shops which sell different types of goods Local farmers can sell their fruit and vegetables 40 60 80 number of residents 100 120 140 Fig. 2A
Question paper, page 5
5 0460/42/M/J/15 © UCLES 2015 [Turn over Residents’ answers to Question 2 0 10 Increase in litter in the streets More noise late in the evening Traffic congestion on the local roads Higher prices are charged in shops More crime and disturbance 20 30 40 number of residents 50 60 70 80 90 Fig. 2B (ii) What conclusion can you make about Hypothesis 1: The advantages of tourism are greater than the disadvantages? Support your decision with evidence from Table 1 and Figs 2A and 2B. … … … … … … … …[4]
Question paper, page 6
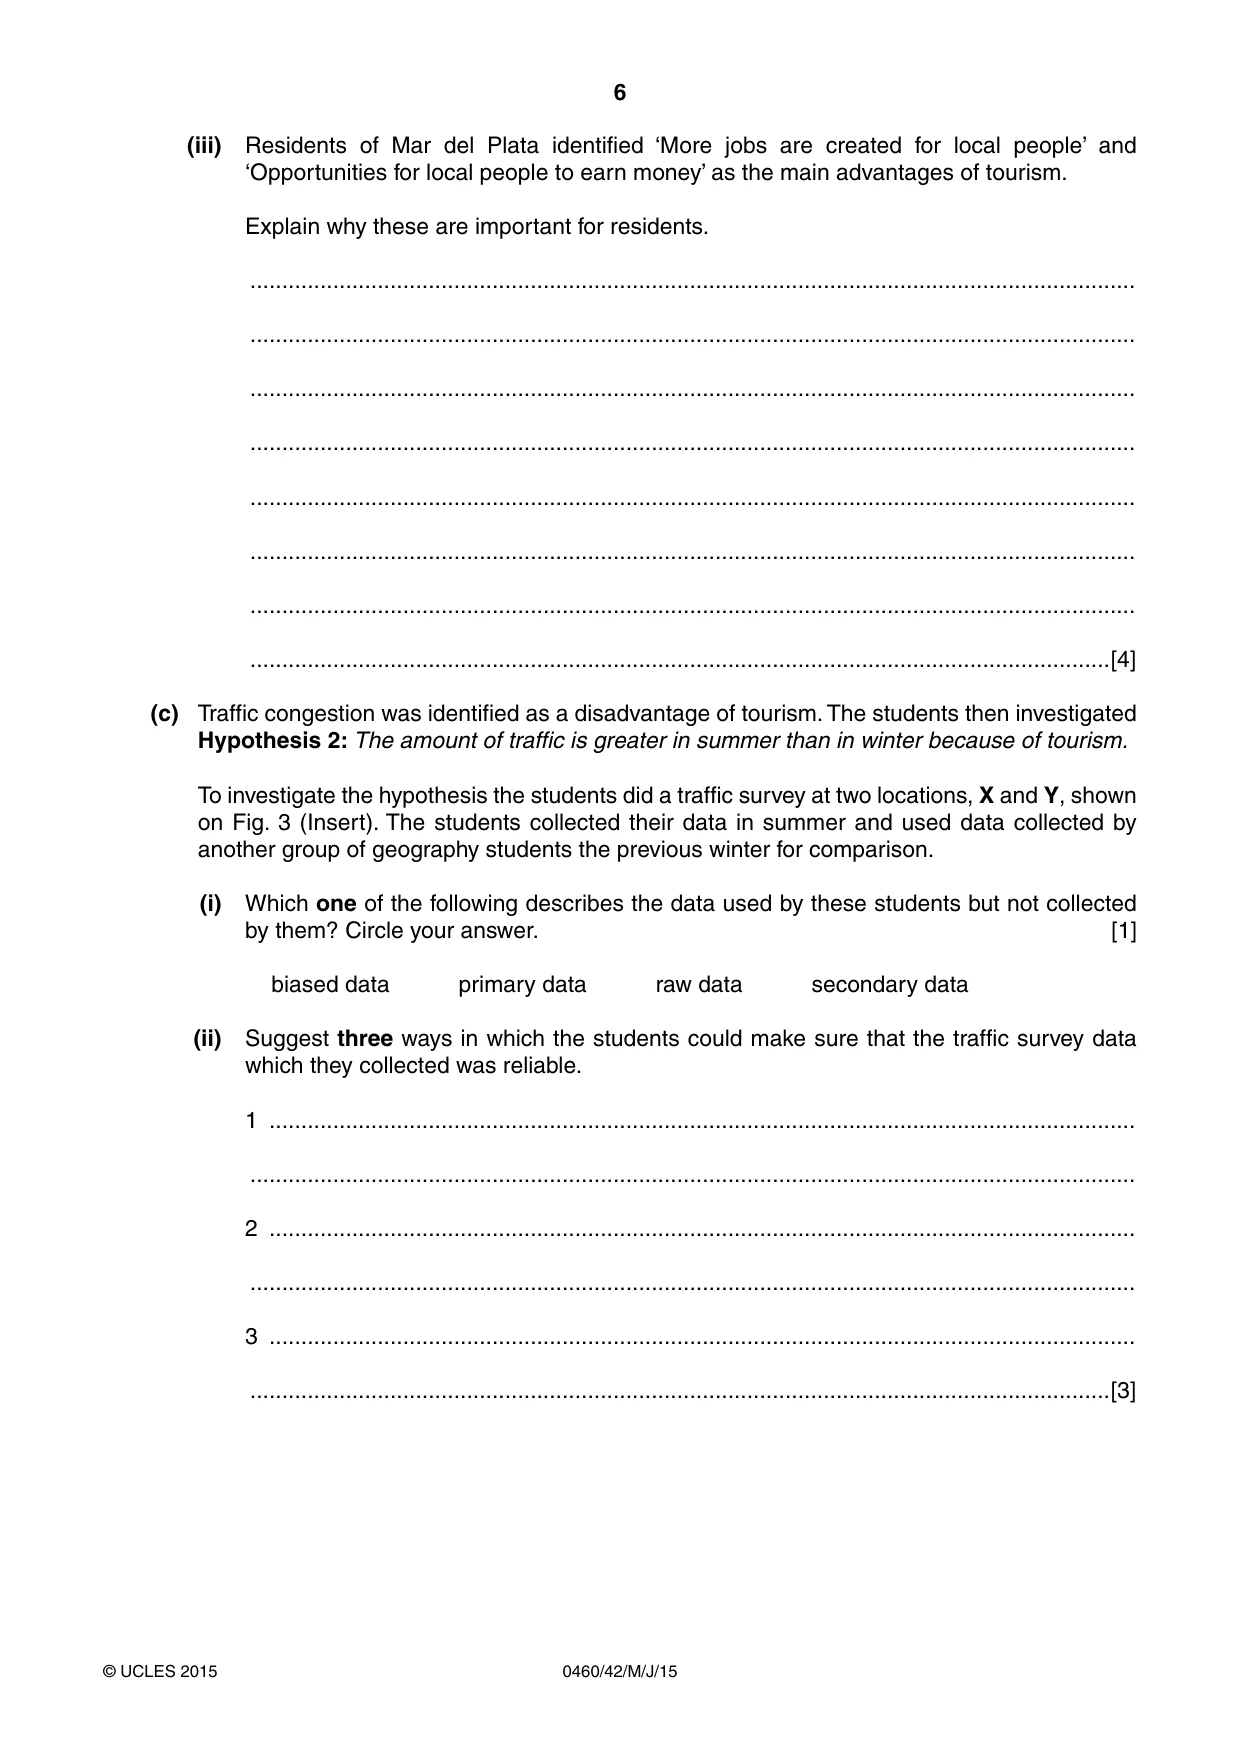
6 0460/42/M/J/15 © UCLES 2015 (iii) Residents of Mar del Plata identified ‘More jobs are created for local people’ and ‘Opportunities for local people to earn money’ as the main advantages of tourism. Explain why these are important for residents. … … … … … … … …[4] (c) Traffic congestion was identified as a disadvantage of tourism. The students then investigated Hypothesis 2: The amount of traffic is greater in summer than in winter because of tourism. To investigate the hypothesis the students did a traffic survey at two locations, X and Y, shown on Fig. 3 (Insert). The students collected their data in summer and used data collected by another group of geography students the previous winter for comparison. (i) Which one of the following describes the data used by these students but not collected by them? Circle your answer. [1] biased data primary data raw data secondary data (ii) Suggest three ways in which the students could make sure that the traffic survey data which they collected was reliable. 1 … … 2 … … 3 … …[3]
Question paper, page 7
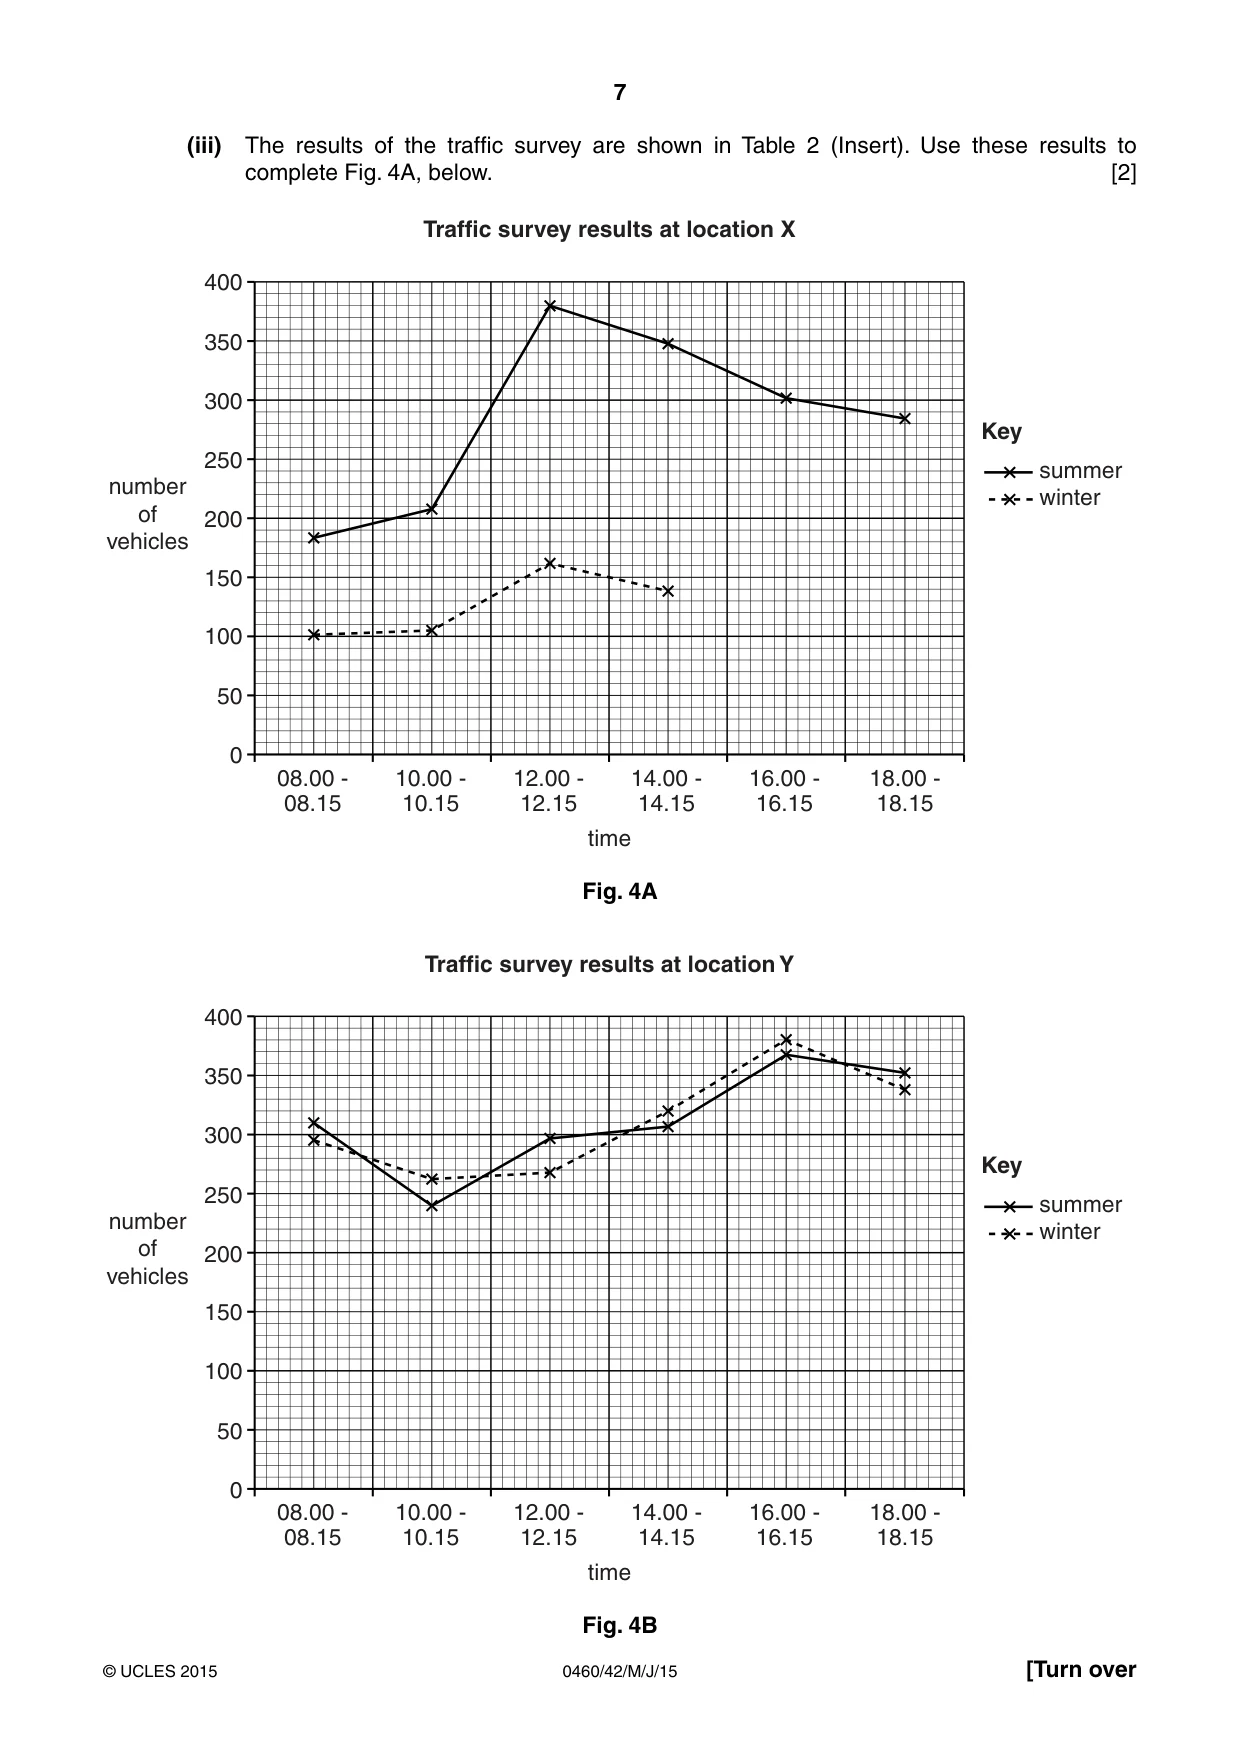
7 0460/42/M/J/15 © UCLES 2015 [Turn over (iii) The results of the traffic survey are shown in Table 2 (Insert). Use these results to complete Fig. 4A, below. [2] 0 50 08.00 - 08.15 10.00 - 10.15 12.00 - 12.15 14.00 - 14.15 time summer winter Key Traffic survey results at location X 16.00 - 16.15 18.00 - 18.15 100 150 200 number of vehicles 250 300 350 400 Fig. 4A 0 50 08.00 - 08.15 10.00 - 10.15 12.00 - 12.15 14.00 - 14.15 time summer winter Key Traffic survey results at location Y 16.00 - 16.15 18.00 - 18.15 100 150 200 number of vehicles 250 300 350 400 Fig. 4B
Question paper, page 8
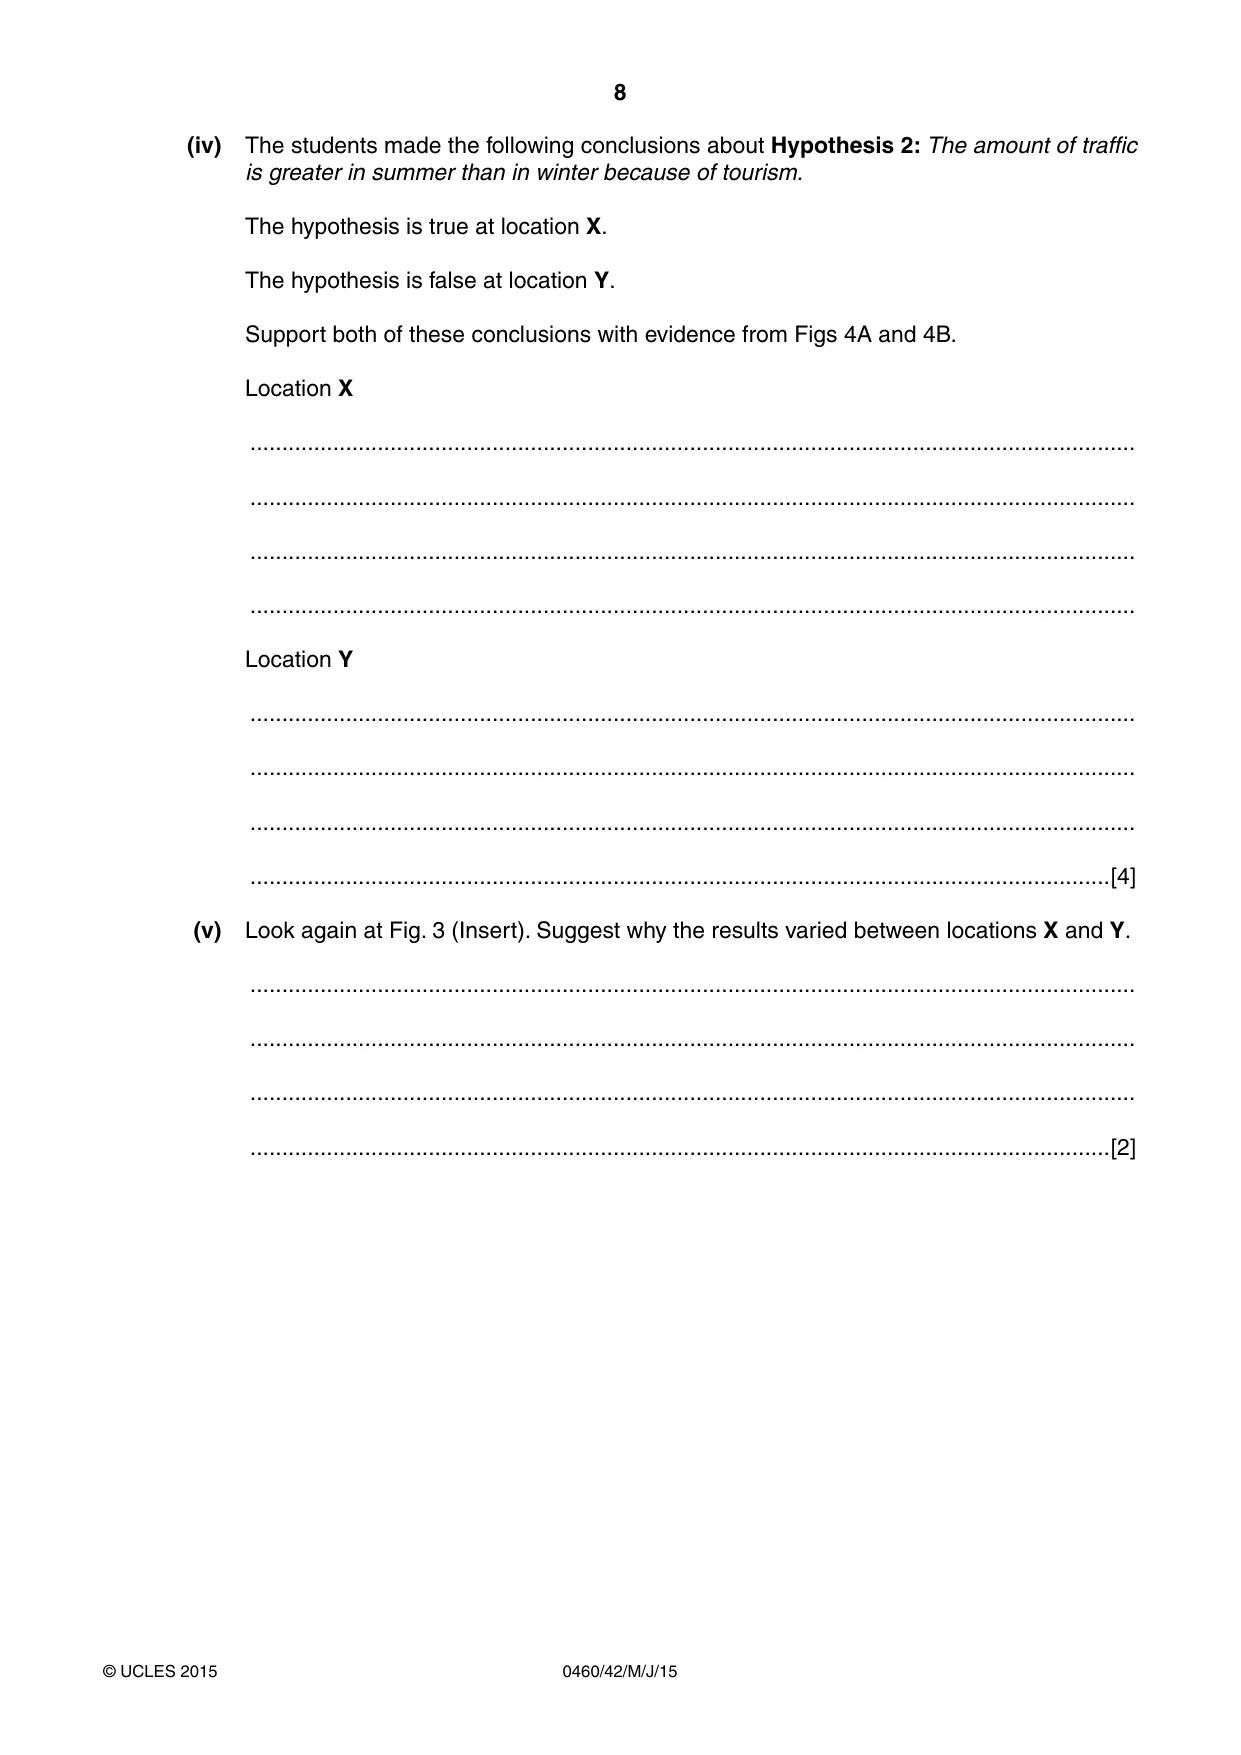
8 0460/42/M/J/15 © UCLES 2015 (iv) The students made the following conclusions about Hypothesis 2: The amount of traffic is greater in summer than in winter because of tourism. The hypothesis is true at location X. The hypothesis is false at location Y. Support both of these conclusions with evidence from Figs 4A and 4B. Location X … … … … Location Y … … … …[4] (v) Look again at Fig. 3 (Insert). Suggest why the results varied between locations X and Y. … … … …[2]
Question paper, page 9
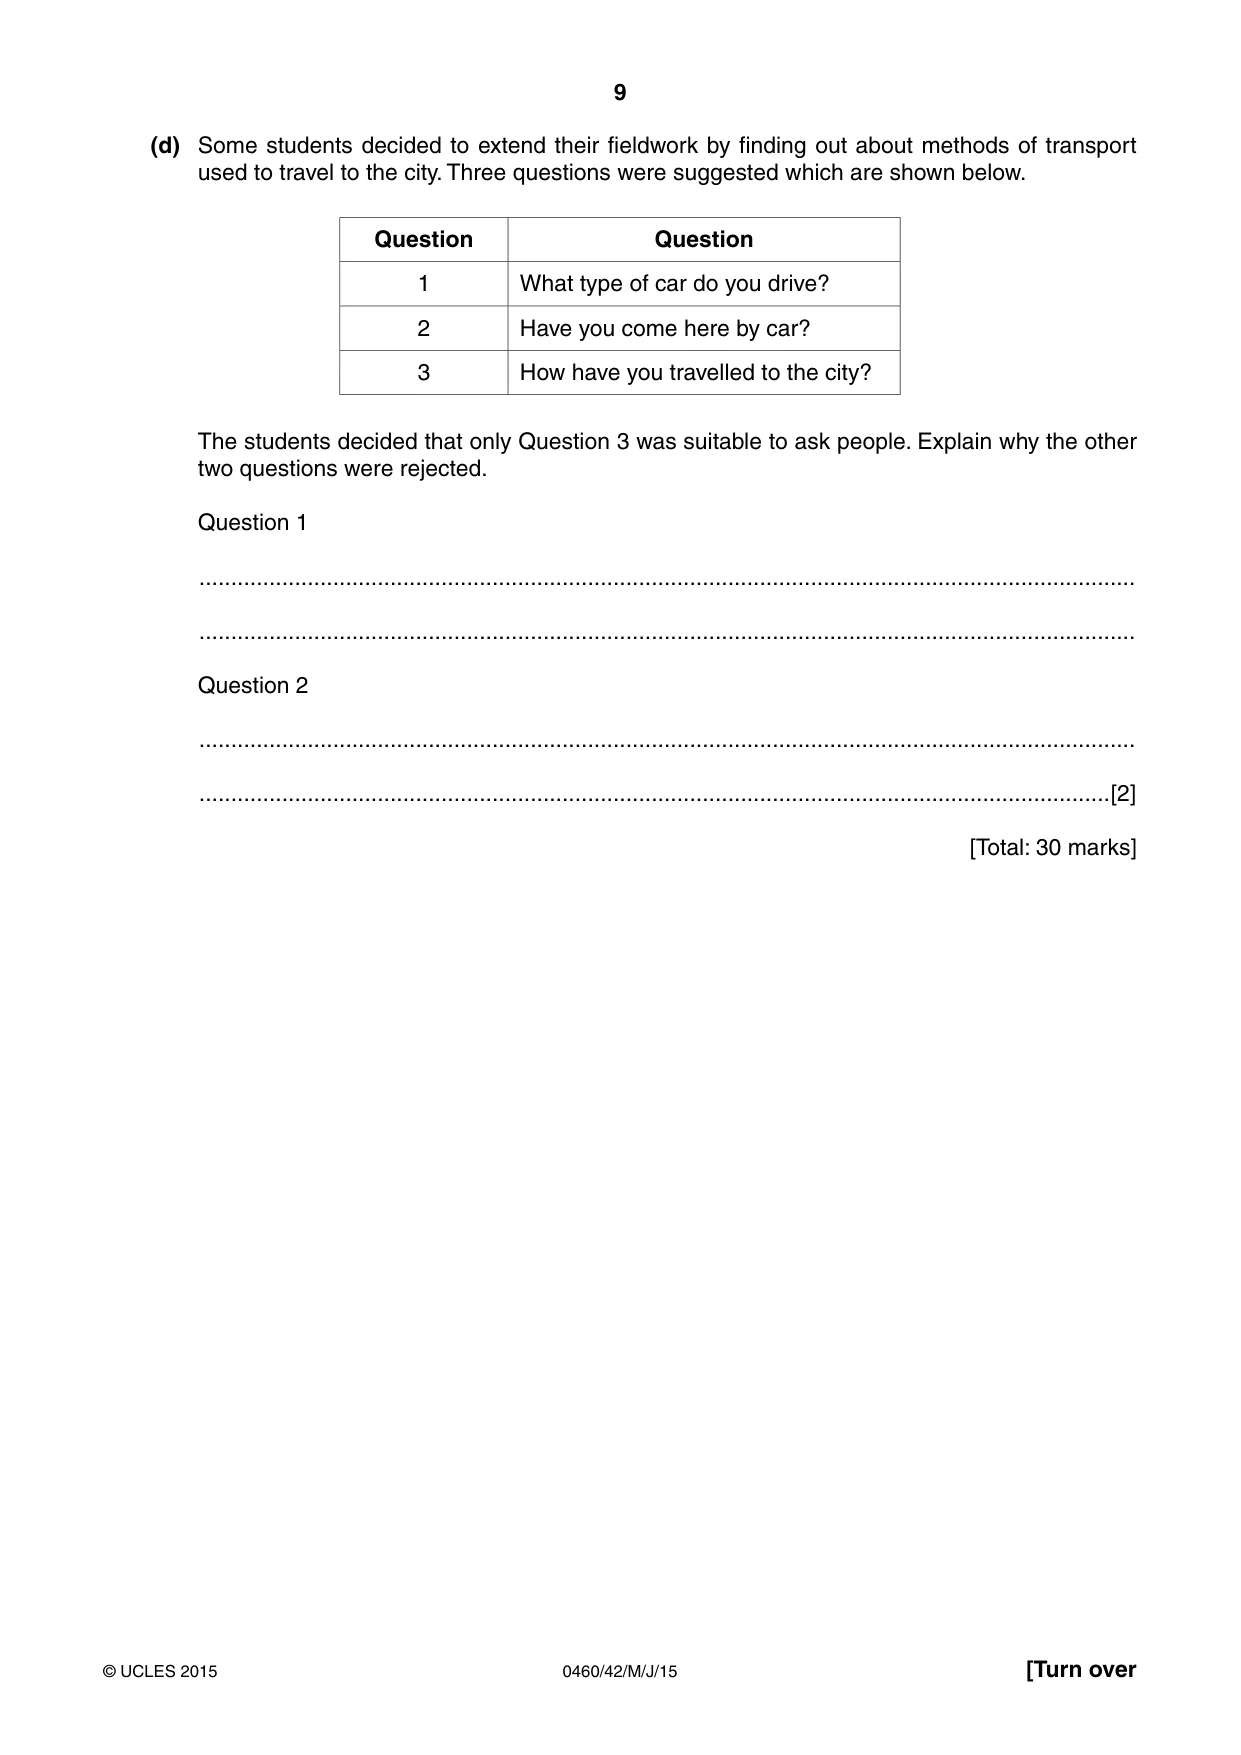
9 0460/42/M/J/15 © UCLES 2015 [Turn over (d) Some students decided to extend their fieldwork by finding out about methods of transport used to travel to the city. Three questions were suggested which are shown below. Question Question 1 What type of car do you drive? 2 Have you come here by car? 3 How have you travelled to the city? The students decided that only Question 3 was suitable to ask people. Explain why the other two questions were rejected. Question 1 … … Question 2 … …[2] [Total: 30 marks]
Question paper, page 10
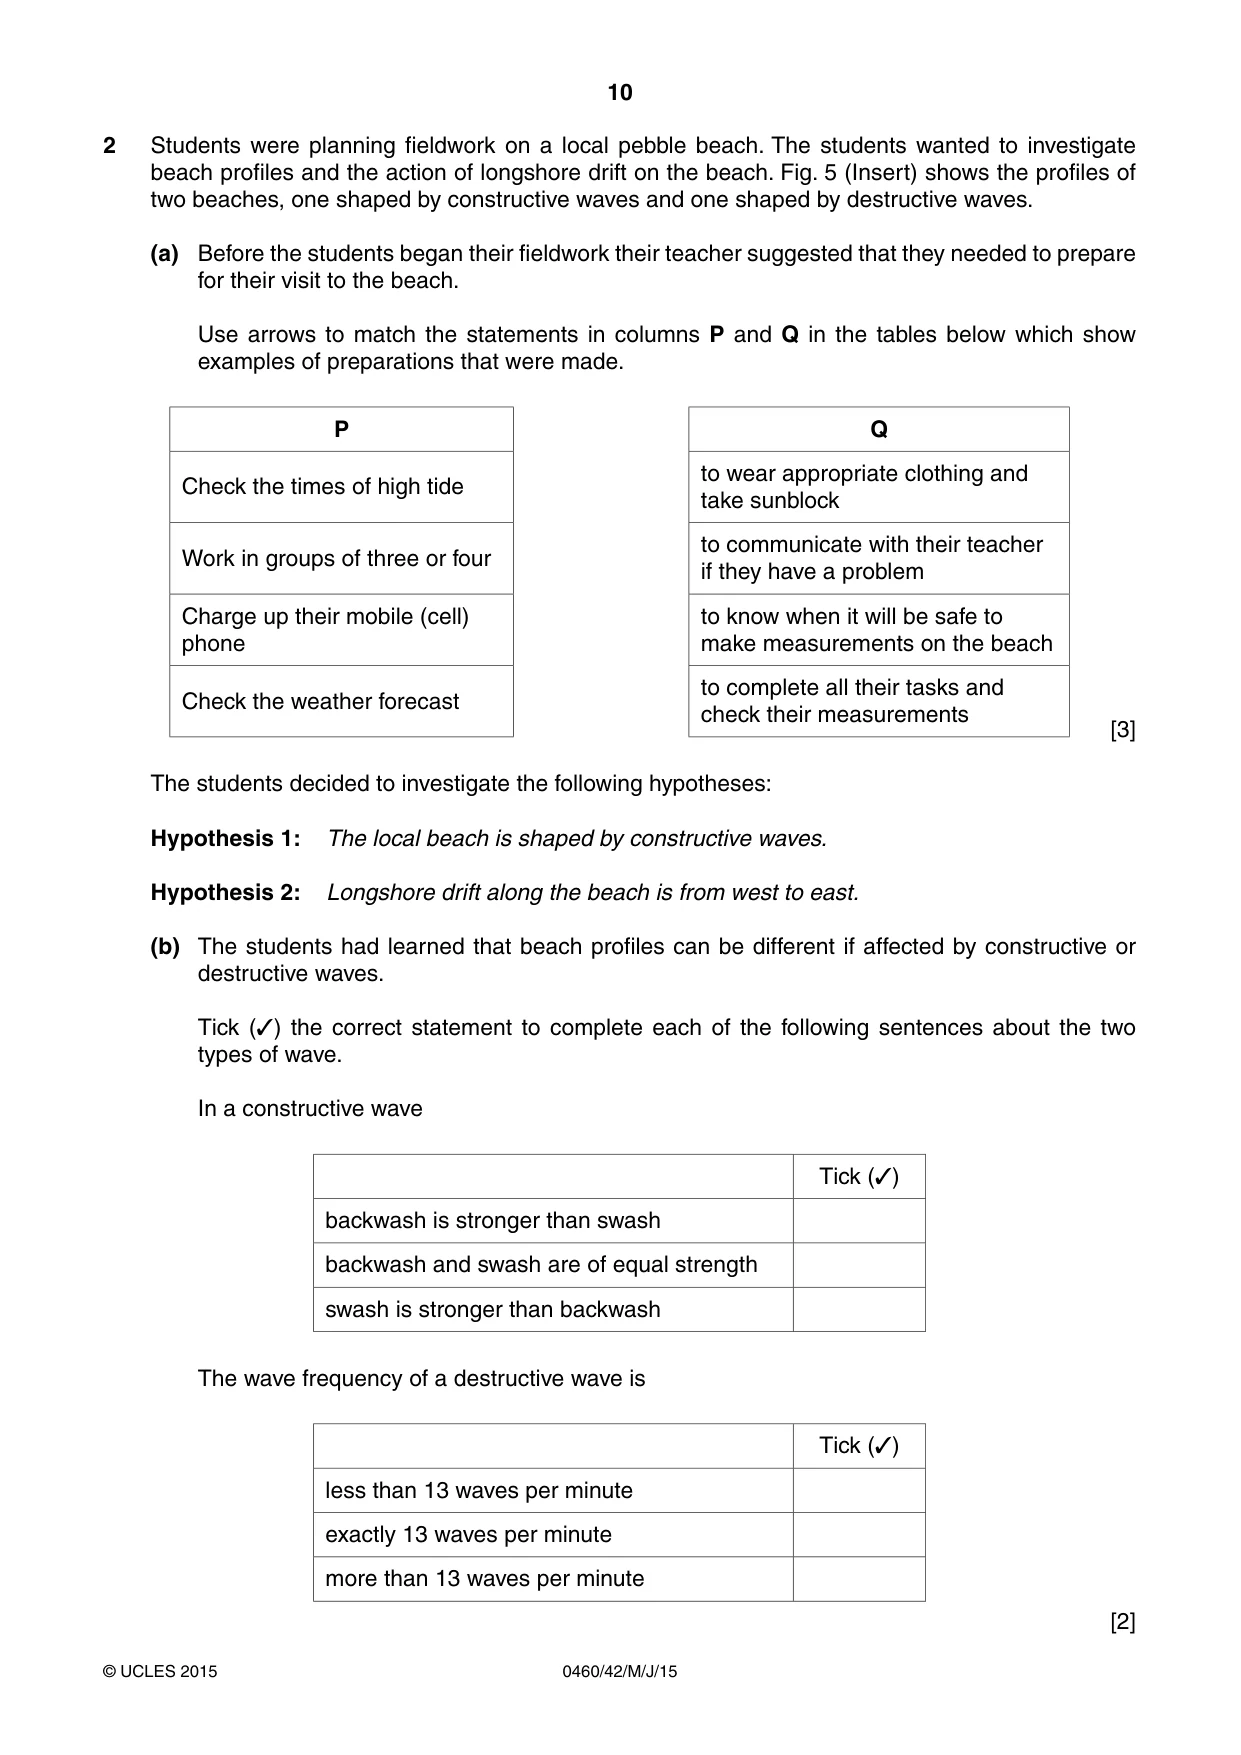
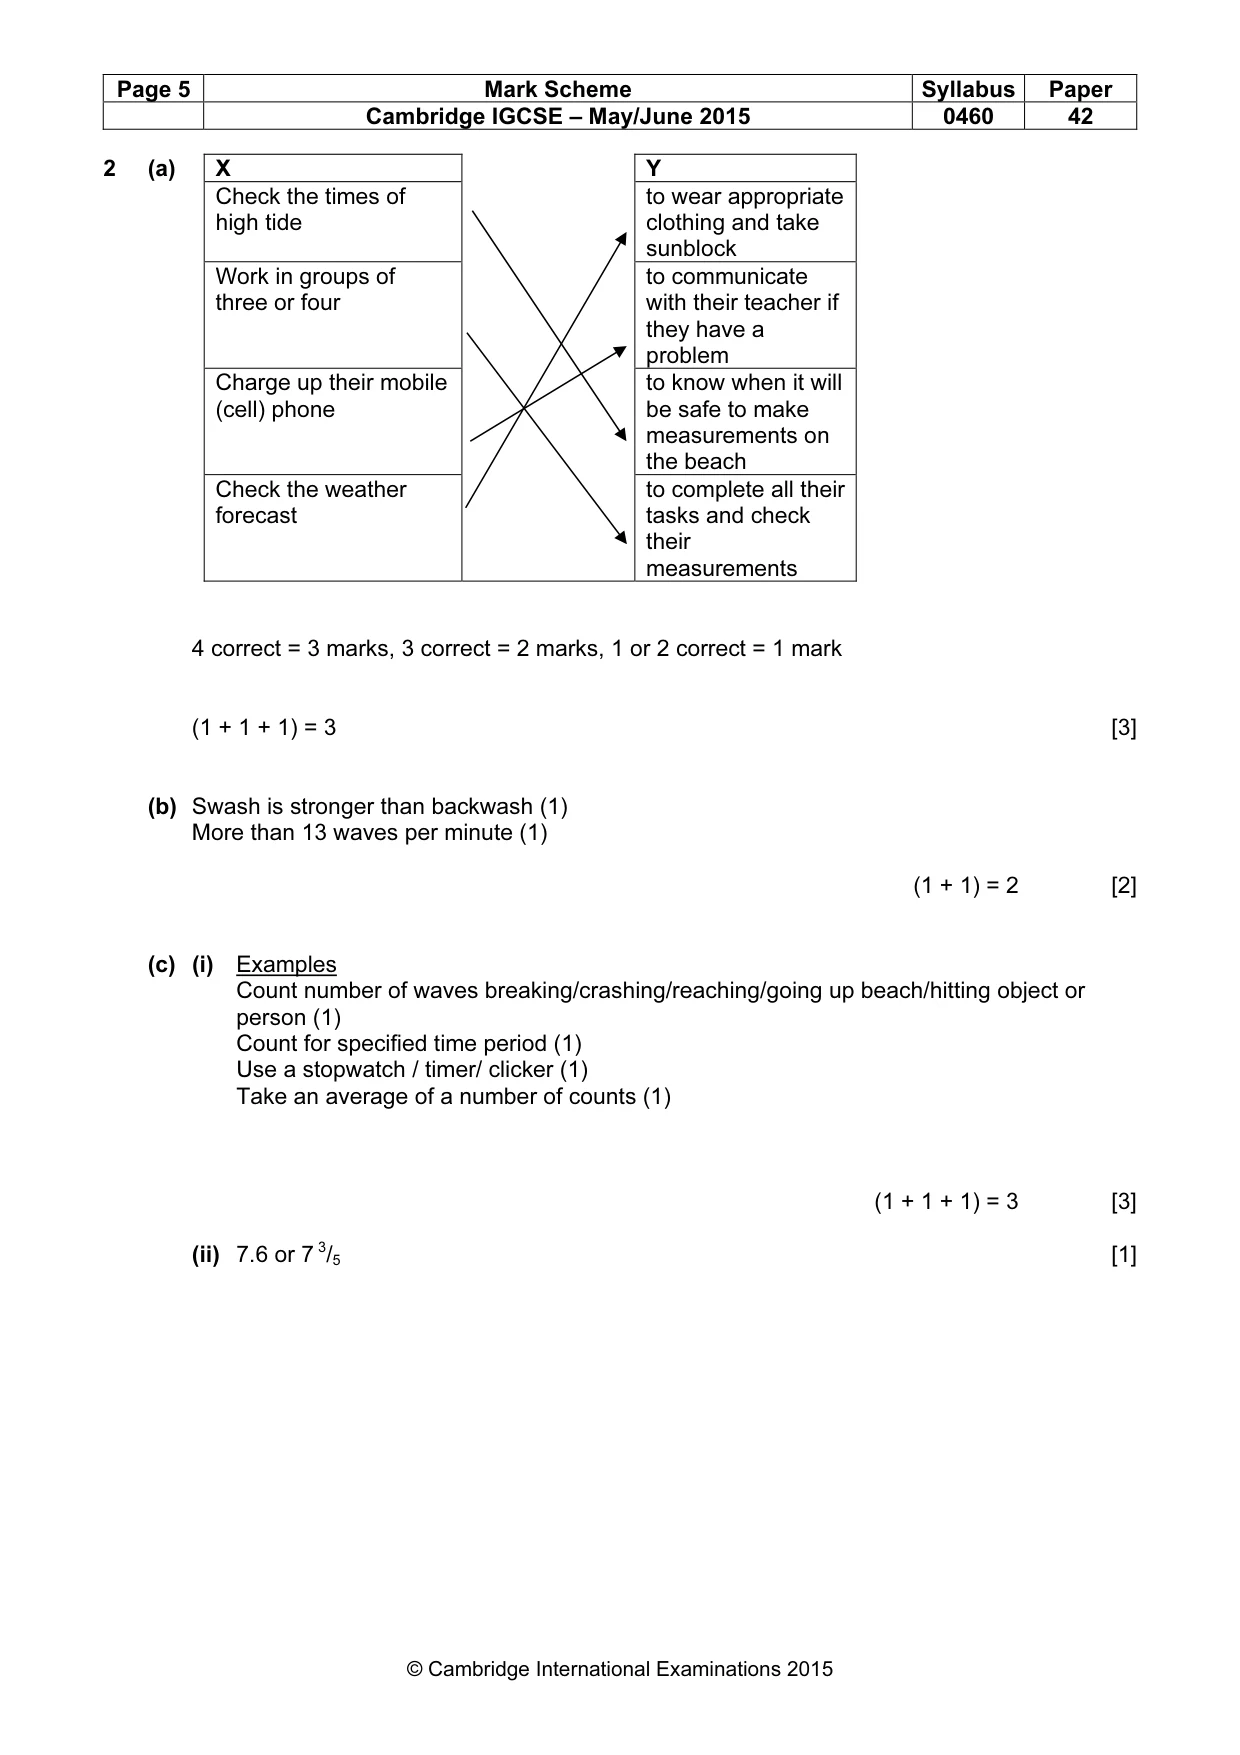
10 0460/42/M/J/15 © UCLES 2015 2 Students were planning fieldwork on a local pebble beach. The students wanted to investigate beach profiles and the action of longshore drift on the beach. Fig. 5 (Insert) shows the profiles of two beaches, one shaped by constructive waves and one shaped by destructive waves. (a) Before the students began their fieldwork their teacher suggested that they needed to prepare for their visit to the beach. Use arrows to match the statements in columns P and Q in the tables below which show examples of preparations that were made. P Q Check the times of high tide to wear appropriate clothing and take sunblock Work in groups of three or four to communicate with their teacher if they have a problem Charge up their mobile (cell) phone to know when it will be safe to make measurements on the beach Check the weather forecast to complete all their tasks and check their measurements [3] The students decided to investigate the following hypotheses: Hypothesis 1: The local beach is shaped by constructive waves. Hypothesis 2: Longshore drift along the beach is from west to east. (b) The students had learned that beach profiles can be different if affected by constructive or destructive waves. Tick (✓) the correct statement to complete each of the following sentences about the two types of wave. In a constructive wave Tick (✓) backwash is stronger than swash backwash and swash are of equal strength swash is stronger than backwash The wave frequency of a destructive wave is Tick (✓) less than 13 waves per minute exactly 13 waves per minute more than 13 waves per minute [2]
Question paper, page 11
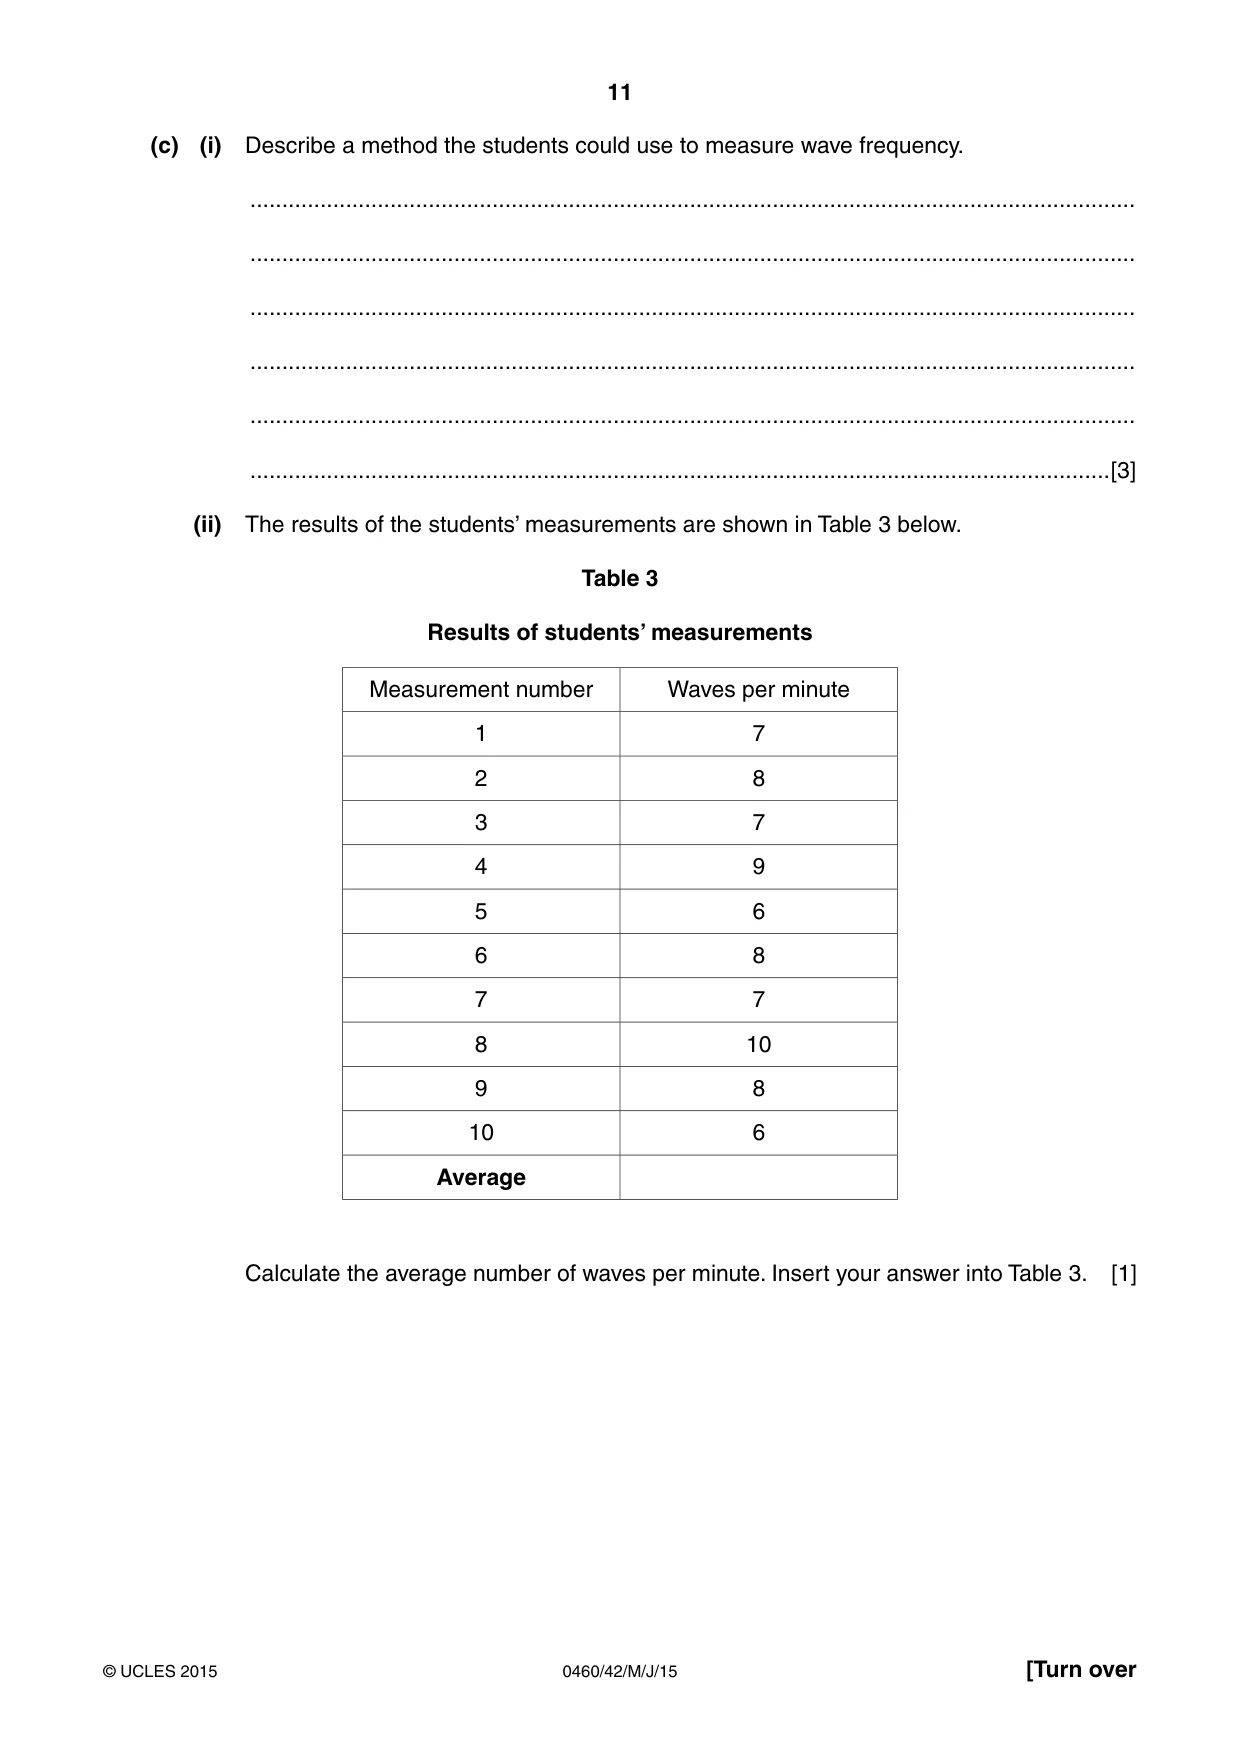
11 0460/42/M/J/15 © UCLES 2015 [Turn over (c) (i) Describe a method the students could use to measure wave frequency. … … … … … …[3] (ii) The results of the students’ measurements are shown in Table 3 below. Table 3 Results of students’ measurements Measurement number Waves per minute 1 7 2 8 3 7 4 9 5 6 6 8 7 7 8 10 9 8 10 6 Average Calculate the average number of waves per minute. Insert your answer into Table 3. [1]
Question paper, page 12
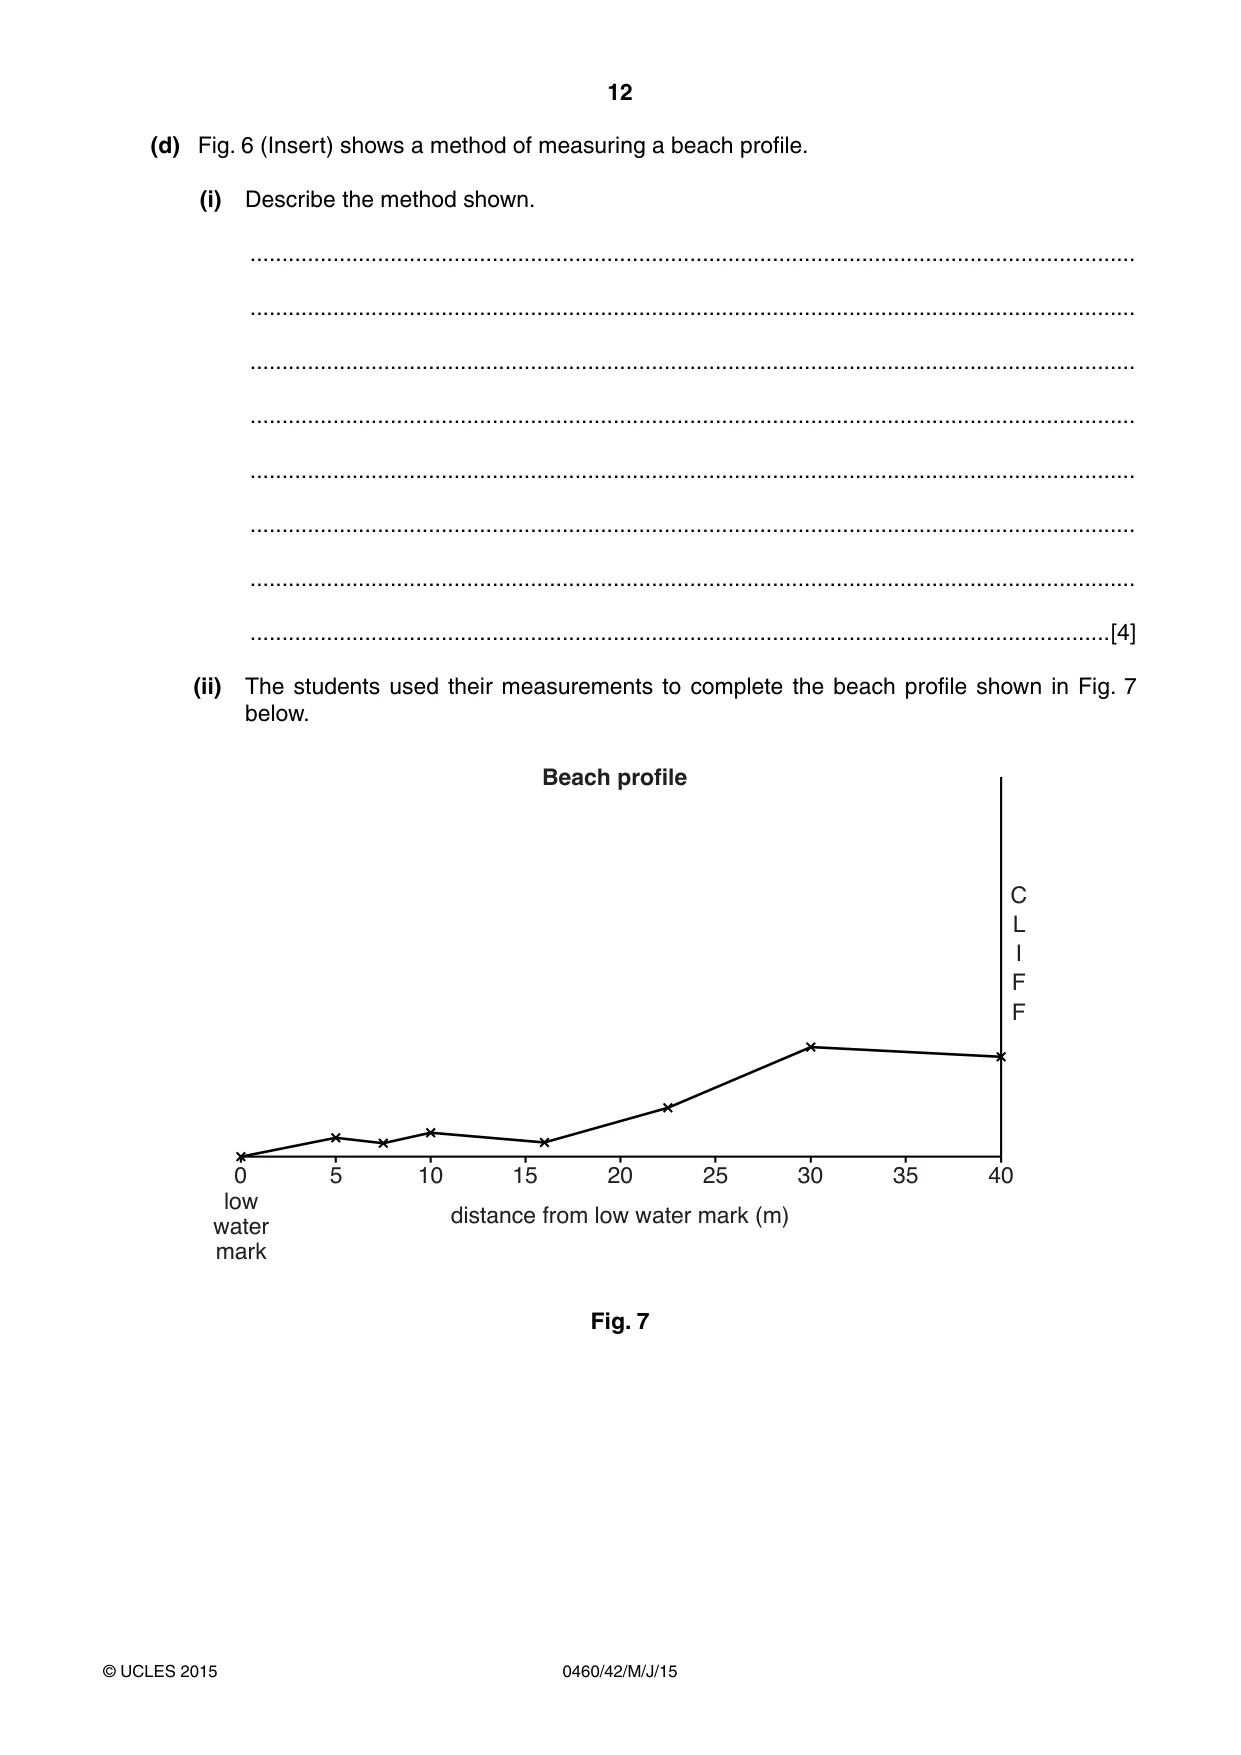
12 0460/42/M/J/15 © UCLES 2015 (d) Fig. 6 (Insert) shows a method of measuring a beach profile. (i) Describe the method shown. … … … … … … … …[4] (ii) The students used their measurements to complete the beach profile shown in Fig. 7 below. low water mark distance from low water mark (m) Beach profile C L I F F 30 25 40 35 20 15 10 5 0 Fig. 7
Question paper, page 13
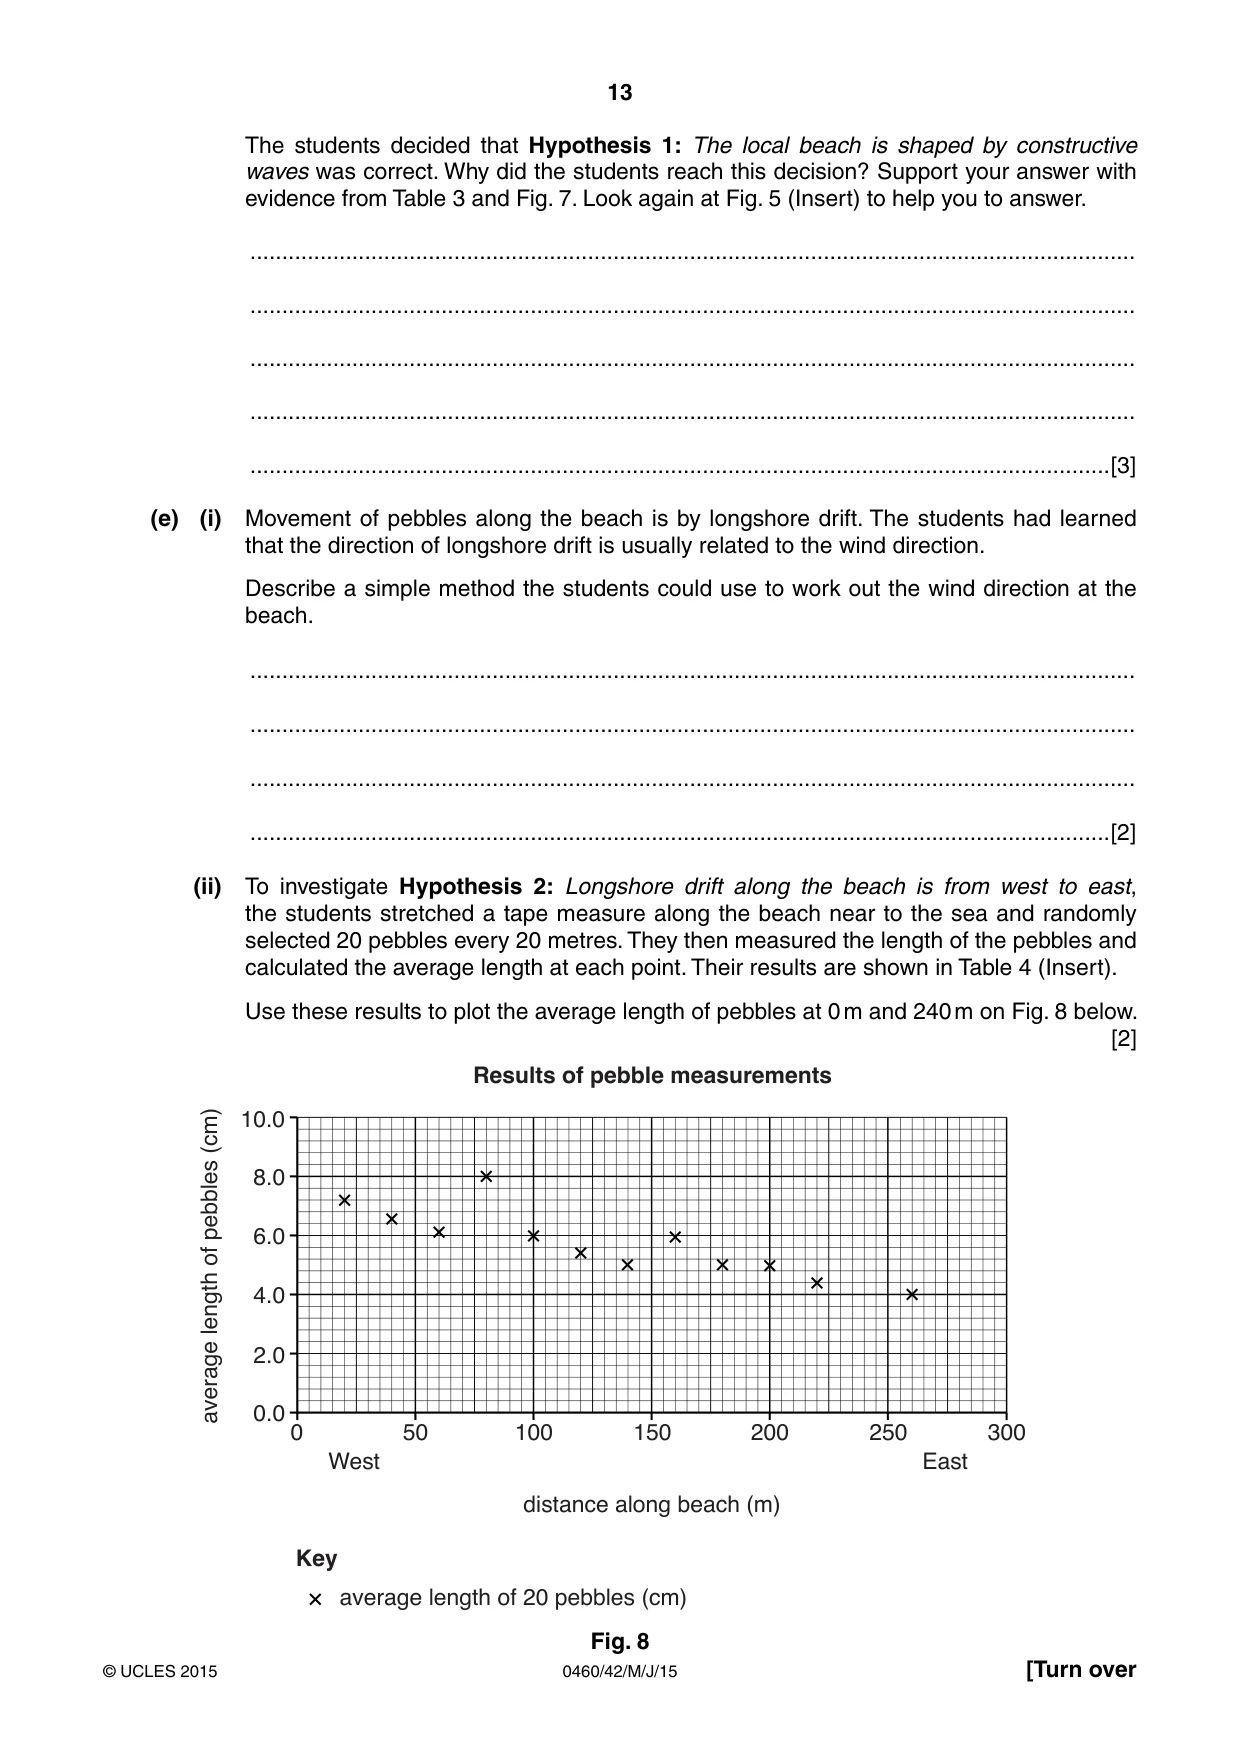
13 0460/42/M/J/15 © UCLES 2015 [Turn over The students decided that Hypothesis 1: The local beach is shaped by constructive waves was correct. Why did the students reach this decision? Support your answer with evidence from Table 3 and Fig. 7. Look again at Fig. 5 (Insert) to help you to answer. … … … … …[3] (e) (i) Movement of pebbles along the beach is by longshore drift. The students had learned that the direction of longshore drift is usually related to the wind direction. Describe a simple method the students could use to work out the wind direction at the beach. … … … …[2] (ii) To investigate Hypothesis 2: Longshore drift along the beach is from west to east, the students stretched a tape measure along the beach near to the sea and randomly selected 20 pebbles every 20 metres. They then measured the length of the pebbles and calculated the average length at each point. Their results are shown in Table 4 (Insert). Use these results to plot the average length of pebbles at 0 m and 240 m on Fig. 8 below. [2] 0.0 2.0 0 50 100 150 Results of pebble measurements 200 250 300 distance along beach (m) average length of 20 pebbles (cm) West Key East 4.0 6.0 8.0 average length of pebbles (cm) 10.0 Fig. 8
Question paper, page 14
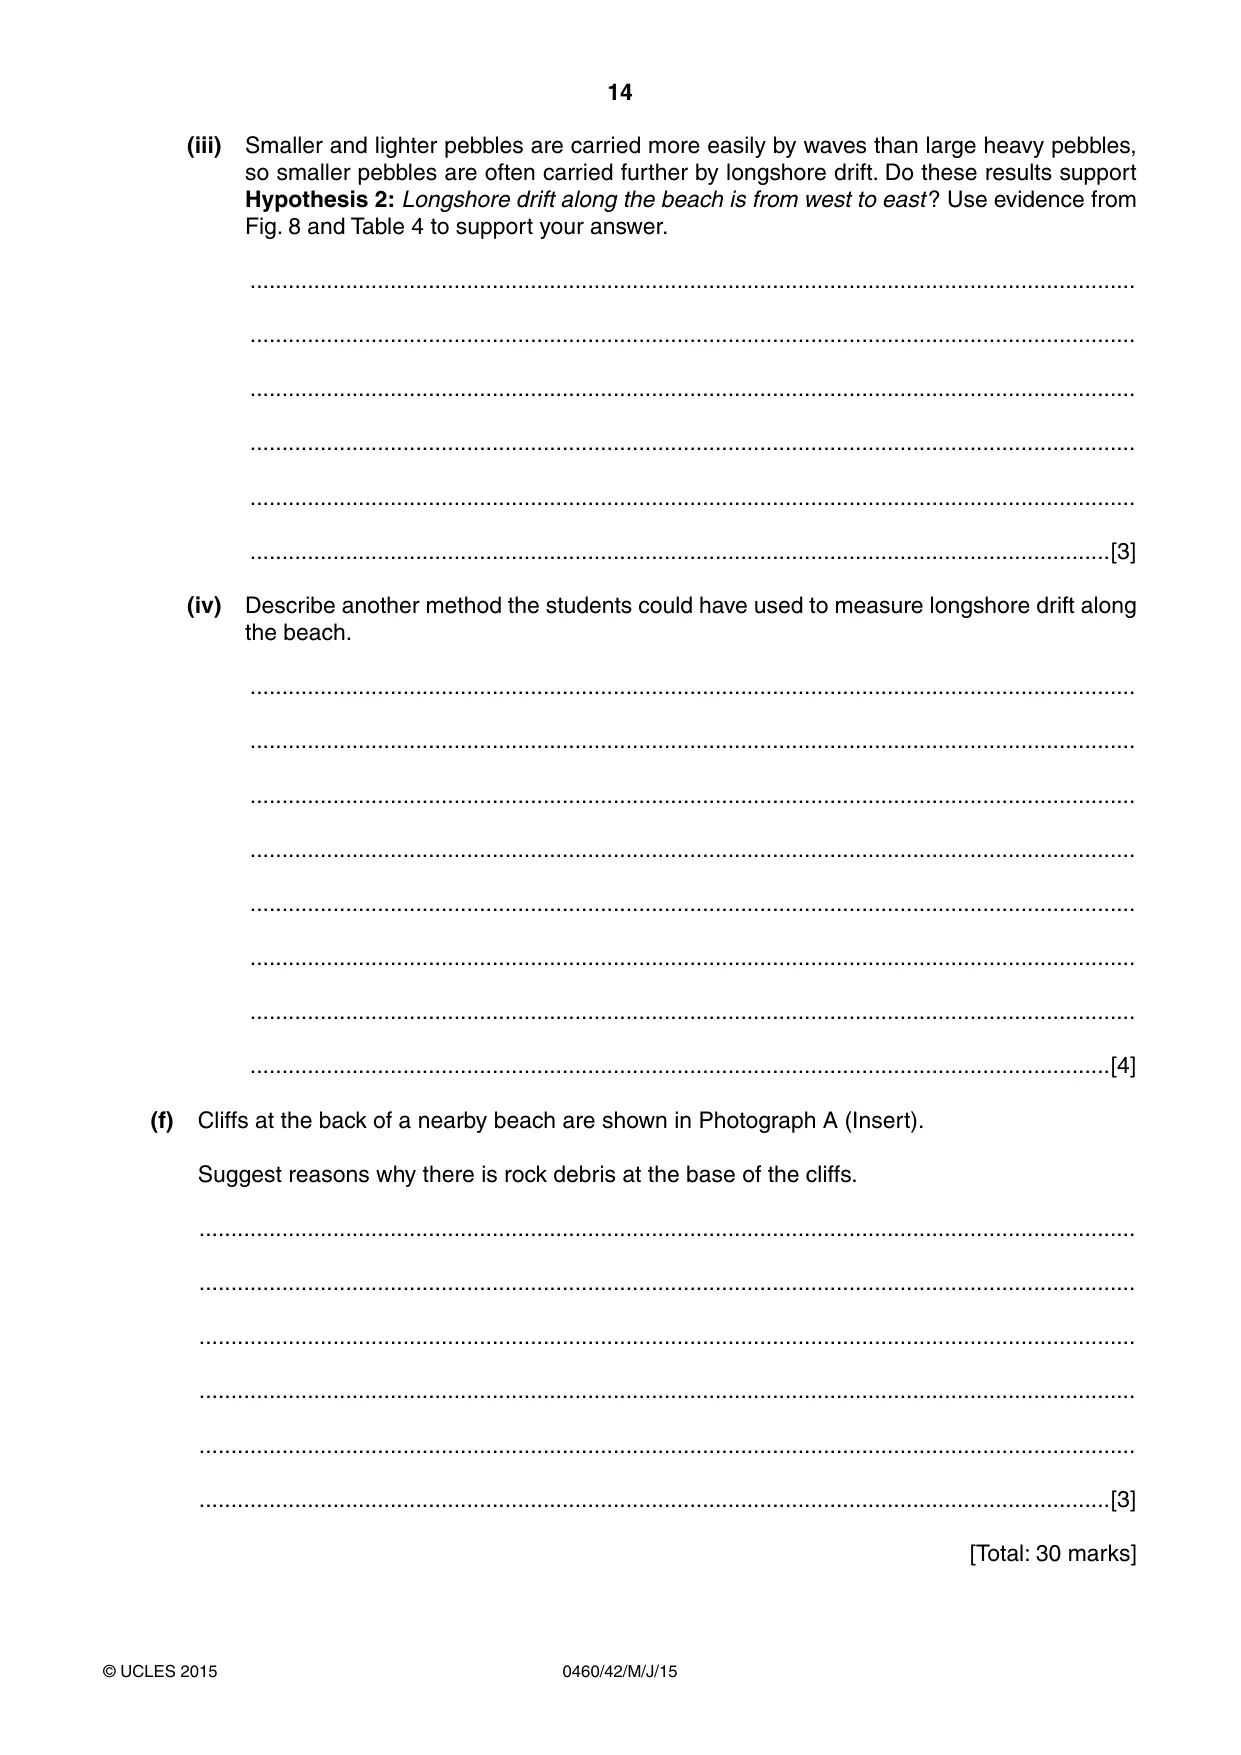
14 0460/42/M/J/15 © UCLES 2015 (iii) Smaller and lighter pebbles are carried more easily by waves than large heavy pebbles, so smaller pebbles are often carried further by longshore drift. Do these results support Hypothesis 2: Longshore drift along the beach is from west to east ? Use evidence from Fig. 8 and Table 4 to support your answer. … … … … … …[3] (iv) Describe another method the students could have used to measure longshore drift along the beach. … … … … … … … …[4] (f) Cliffs at the back of a nearby beach are shown in Photograph A (Insert). Suggest reasons why there is rock debris at the base of the cliffs. … … … … … …[3] [Total: 30 marks]
Question paper, page 15
15 0460/42/M/J/15 © UCLES 2015 BLANK PAGE
Question paper, page 16
16 0460/42/M/J/15 © UCLES 2015 BLANK PAGE Permission to reproduce items where third-party owned material protected by copyright is included has been sought and cleared where possible. Every reasonable effort has been made by the publisher (UCLES) to trace copyright holders, but if any items requiring clearance have unwittingly been included, the publisher will be pleased to make amends at the earliest possible opportunity. To avoid the issue of disclosure of answer-related information to candidates, all copyright acknowledgements are reproduced online in the Cambridge International Examinations Copyright Acknowledgements Booklet. This is produced for each series of examinations and is freely available to download at www.cie.org.uk after the live examination series. Cambridge International Examinations is part of the Cambridge Assessment Group. Cambridge Assessment is the brand name of University of Cambridge Local Examinations Syndicate (UCLES), which is itself a department of the University of Cambridge.
Mark scheme, page 1
® IGCSE is the registered trademark of Cambridge International Examinations. CAMBRIDGE INTERNATIONAL EXAMINATIONS Cambridge International General Certificate of Secondary Education MARK SCHEME for the May/June 2015 series 0460 GEOGRAPHY 0460/42 Paper 4 (Alternative to Coursework), maximum raw mark 60 This mark scheme is published as an aid to teachers and candidates, to indicate the requirements of the examination. It shows the basis on which Examiners were instructed to award marks. It does not indicate the details of the discussions that took place at an Examiners’ meeting before marking began, which would have considered the acceptability of alternative answers. Mark schemes should be read in conjunction with the question paper and the Principal Examiner Report for Teachers. Cambridge will not enter into discussions about these mark schemes. Cambridge is publishing the mark schemes for the May/June 2015 series for most Cambridge IGCSE®, Cambridge International A and AS Level components and some Cambridge O Level components.
Mark scheme, page 2
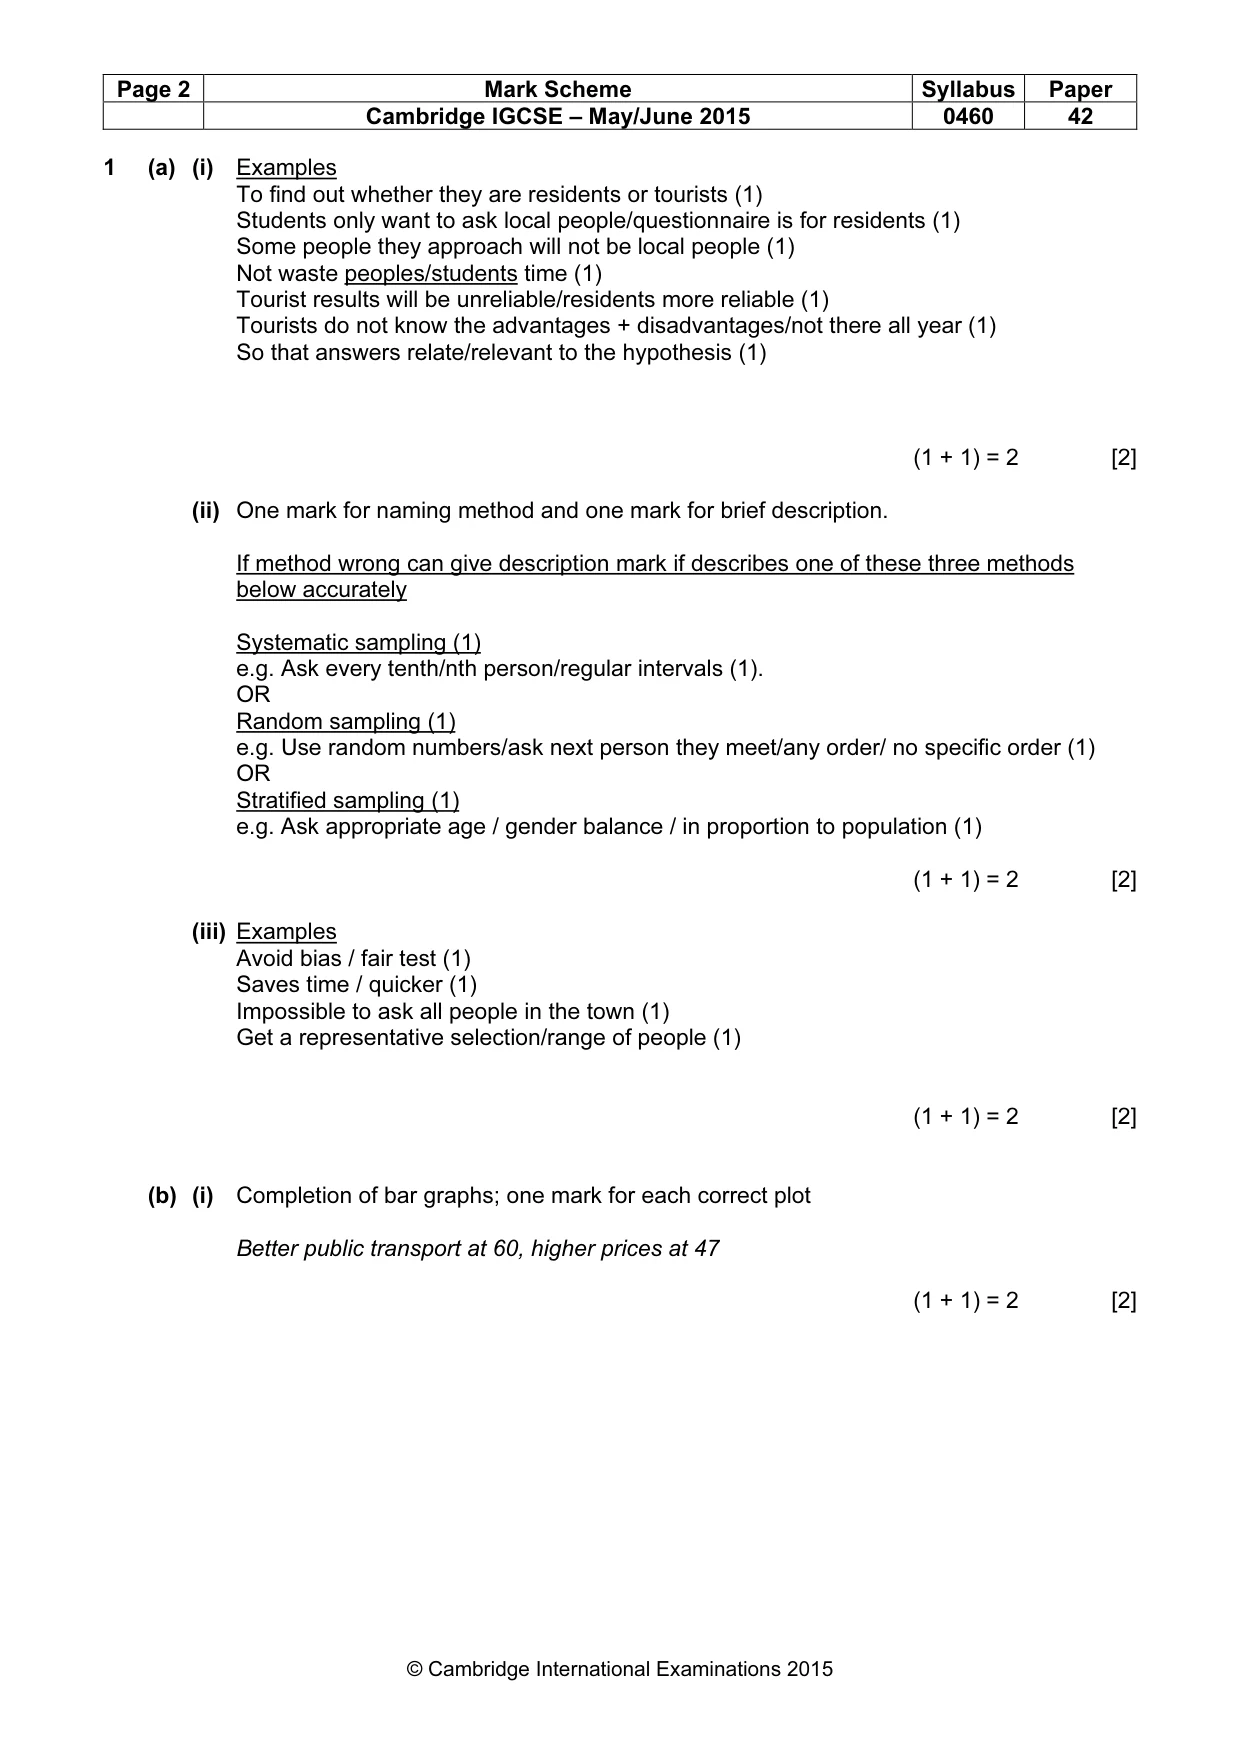
Page 2 Mark Scheme Syllabus Paper Cambridge IGCSE – May/June 2015 0460 42 © Cambridge International Examinations 2015 1 (a) (i) Examples To find out whether they are residents or tourists (1) Students only want to ask local people/questionnaire is for residents (1) Some people they approach will not be local people (1) Not waste peoples/students time (1) Tourist results will be unreliable/residents more reliable (1) Tourists do not know the advantages + disadvantages/not there all year (1) So that answers relate/relevant to the hypothesis (1) (1 + 1) = 2 [2] (ii) One mark for naming method and one mark for brief description. If method wrong can give description mark if describes one of these three methods below accurately Systematic sampling (1) e.g. Ask every tenth/nth person/regular intervals (1). OR Random sampling (1) e.g. Use random numbers/ask next person they meet/any order/ no specific order (1) OR Stratified sampling (1) e.g. Ask appropriate age / gender balance / in proportion to population (1) (1 + 1) = 2 [2] (iii) Examples Avoid bias / fair test (1) Saves time / quicker (1) Impossible to ask all people in the town (1) Get a representative selection/range of people (1) (1 + 1) = 2 [2] (b) (i) Completion of bar graphs; one mark for each correct plot Better public transport at 60, higher prices at 47 (1 + 1) = 2 [2]
Mark scheme, page 3
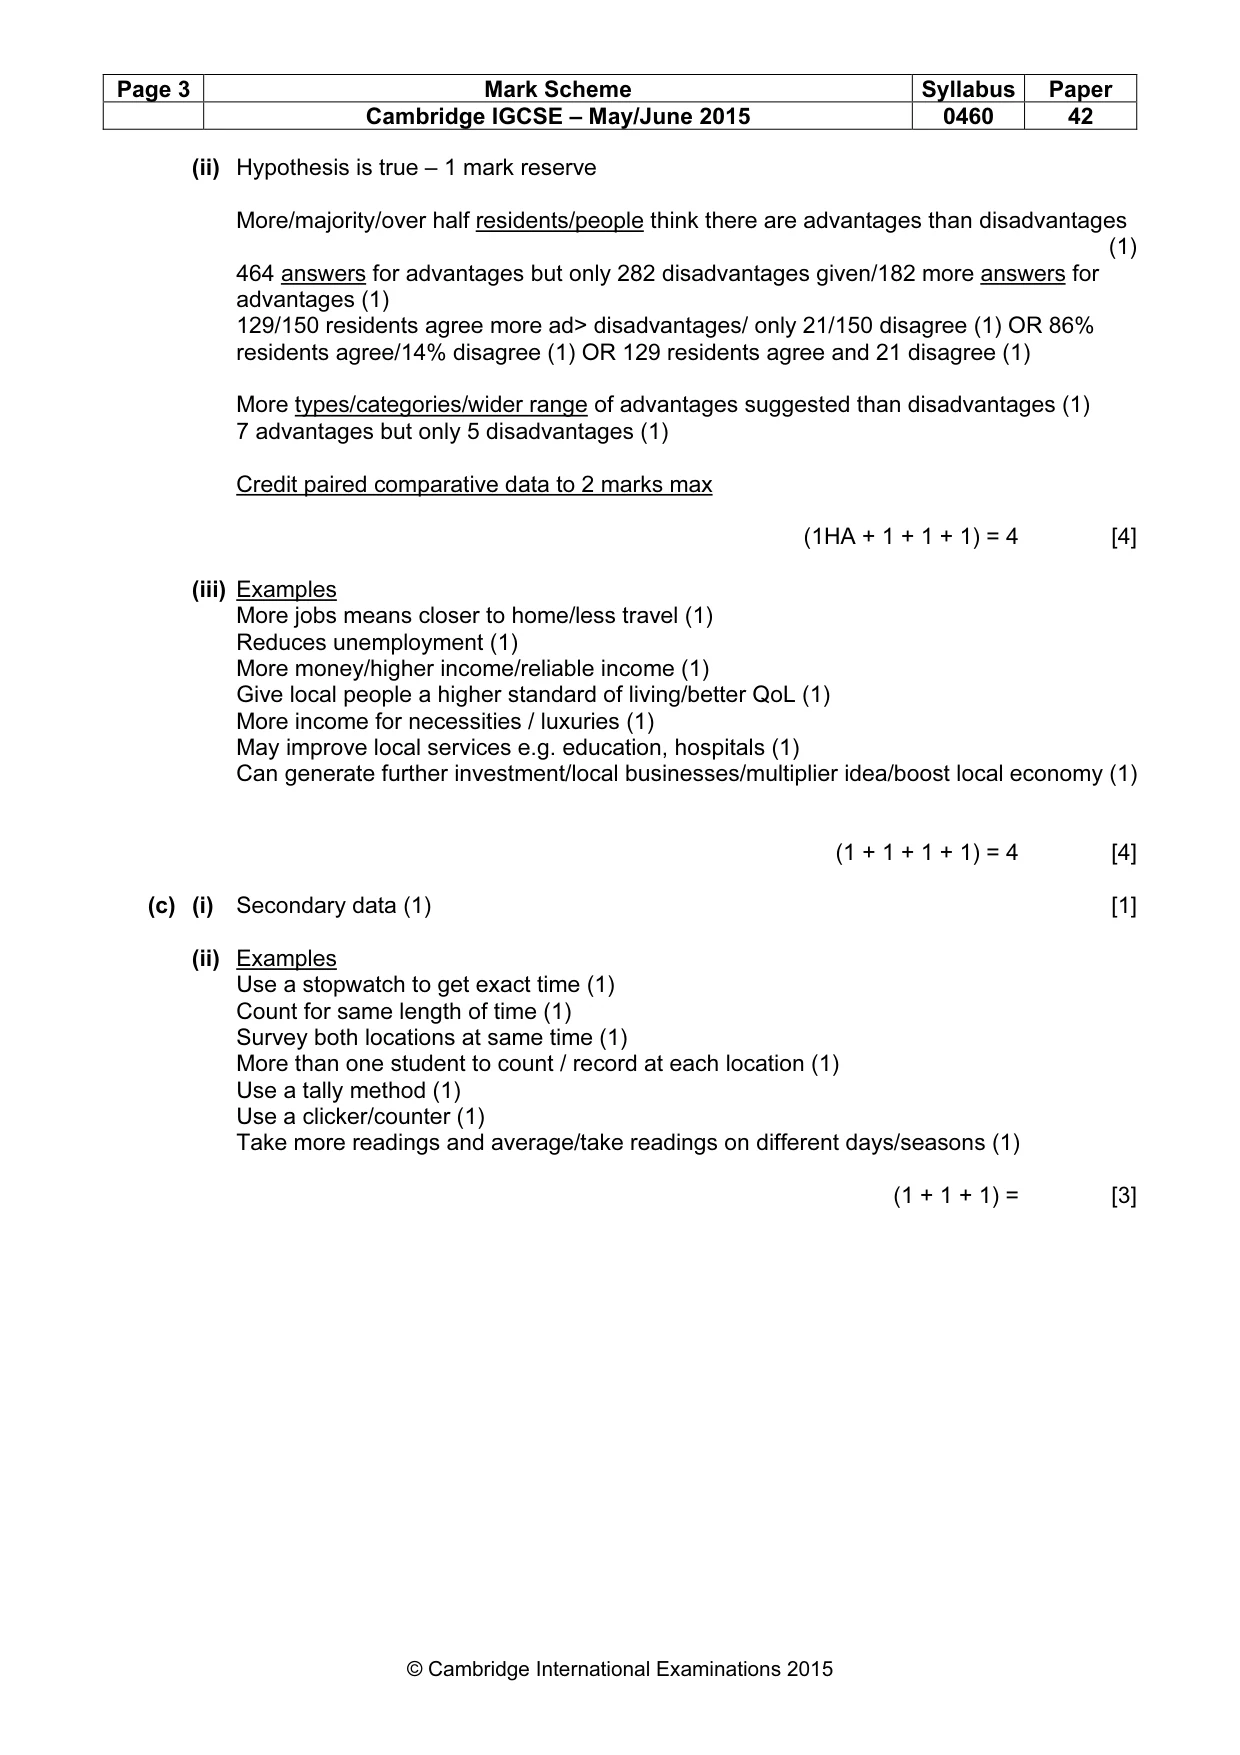
Page 3 Mark Scheme Syllabus Paper Cambridge IGCSE – May/June 2015 0460 42 © Cambridge International Examinations 2015 (ii) Hypothesis is true – 1 mark reserve More/majority/over half residents/people think there are advantages than disadvantages (1) 464 answers for advantages but only 282 disadvantages given/182 more answers for advantages (1) 129/150 residents agree more ad> disadvantages/ only 21/150 disagree (1) OR 86% residents agree/14% disagree (1) OR 129 residents agree and 21 disagree (1) More types/categories/wider range of advantages suggested than disadvantages (1) 7 advantages but only 5 disadvantages (1) Credit paired comparative data to 2 marks max (1HA + 1 + 1 + 1) = 4 [4] (iii) Examples More jobs means closer to home/less travel (1) Reduces unemployment (1) More money/higher income/reliable income (1) Give local people a higher standard of living/better QoL (1) More income for necessities / luxuries (1) May improve local services e.g. education, hospitals (1) Can generate further investment/local businesses/multiplier idea/boost local economy (1) (1 + 1 + 1 + 1) = 4 [4] (c) (i) Secondary data (1) [1] (ii) Examples Use a stopwatch to get exact time (1) Count for same length of time (1) Survey both locations at same time (1) More than one student to count / record at each location (1) Use a tally method (1) Use a clicker/counter (1) Take more readings and average/take readings on different days/seasons (1) (1 + 1 + 1) = [3]
Mark scheme, page 4
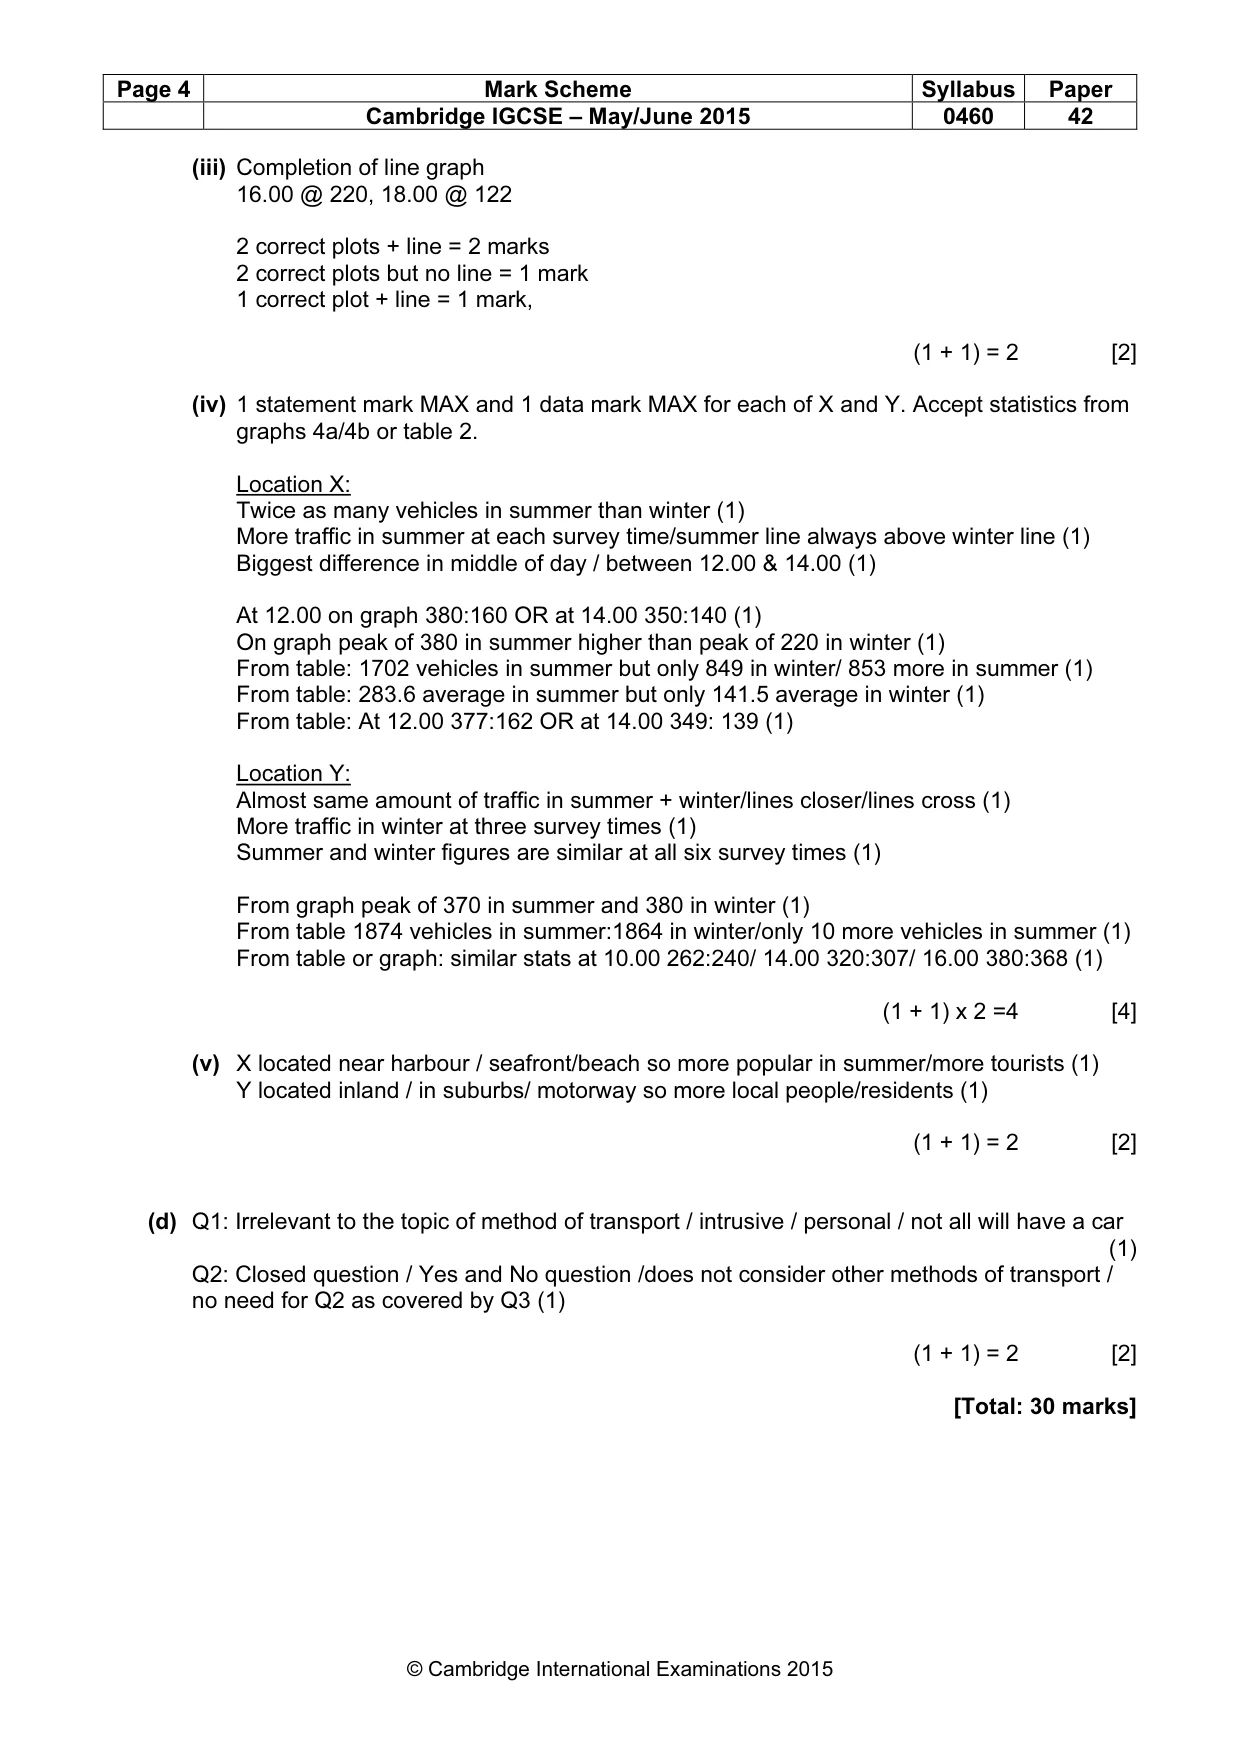
Page 4 Mark Scheme Syllabus Paper Cambridge IGCSE – May/June 2015 0460 42 © Cambridge International Examinations 2015 (iii) Completion of line graph 16.00 @ 220, 18.00 @ 122 2 correct plots + line = 2 marks 2 correct plots but no line = 1 mark 1 correct plot + line = 1 mark, (1 + 1) = 2 [2] (iv) 1 statement mark MAX and 1 data mark MAX for each of X and Y. Accept statistics from graphs 4a/4b or table 2. Location X: Twice as many vehicles in summer than winter (1) More traffic in summer at each survey time/summer line always above winter line (1) Biggest difference in middle of day / between 12.00 & 14.00 (1) At 12.00 on graph 380:160 OR at 14.00 350:140 (1) On graph peak of 380 in summer higher than peak of 220 in winter (1) From table: 1702 vehicles in summer but only 849 in winter/ 853 more in summer (1) From table: 283.6 average in summer but only 141.5 average in winter (1) From table: At 12.00 377:162 OR at 14.00 349: 139 (1) Location Y: Almost same amount of traffic in summer + winter/lines closer/lines cross (1) More traffic in winter at three survey times (1) Summer and winter figures are similar at all six survey times (1) From graph peak of 370 in summer and 380 in winter (1) From table 1874 vehicles in summer:1864 in winter/only 10 more vehicles in summer (1) From table or graph: similar stats at 10.00 262:240/ 14.00 320:307/ 16.00 380:368 (1) (1 + 1) x 2 =4 [4] (v) X located near harbour / seafront/beach so more popular in summer/more tourists (1) Y located inland / in suburbs/ motorway so more local people/residents (1) (1 + 1) = 2 [2] (d) Q1: Irrelevant to the topic of method of transport / intrusive / personal / not all will have a car (1) Q2: Closed question / Yes and No question /does not consider other methods of transport / no need for Q2 as covered by Q3 (1) (1 + 1) = 2 [2] [Total: 30 marks]
Mark scheme, page 5
Page 5 Mark Scheme Syllabus Paper Cambridge IGCSE – May/June 2015 0460 42 © Cambridge International Examinations 2015 2 (a) X Y Check the times of high tide to wear appropriate clothing and take sunblock Work in groups of three or four to communicate with their teacher if they have a problem Charge up their mobile (cell) phone to know when it will be safe to make measurements on the beach Check the weather forecast to complete all their tasks and check their measurements 4 correct = 3 marks, 3 correct = 2 marks, 1 or 2 correct = 1 mark (1 + 1 + 1) = 3 [3] (b) Swash is stronger than backwash (1) More than 13 waves per minute (1) (1 + 1) = 2 [2] (c) (i) Examples Count number of waves breaking/crashing/reaching/going up beach/hitting object or person (1) Count for specified time period (1) Use a stopwatch / timer/ clicker (1) Take an average of a number of counts (1) (1 + 1 + 1) = 3 [3] (ii) 7.6 or 7 3/5 [1]
Mark scheme, page 6
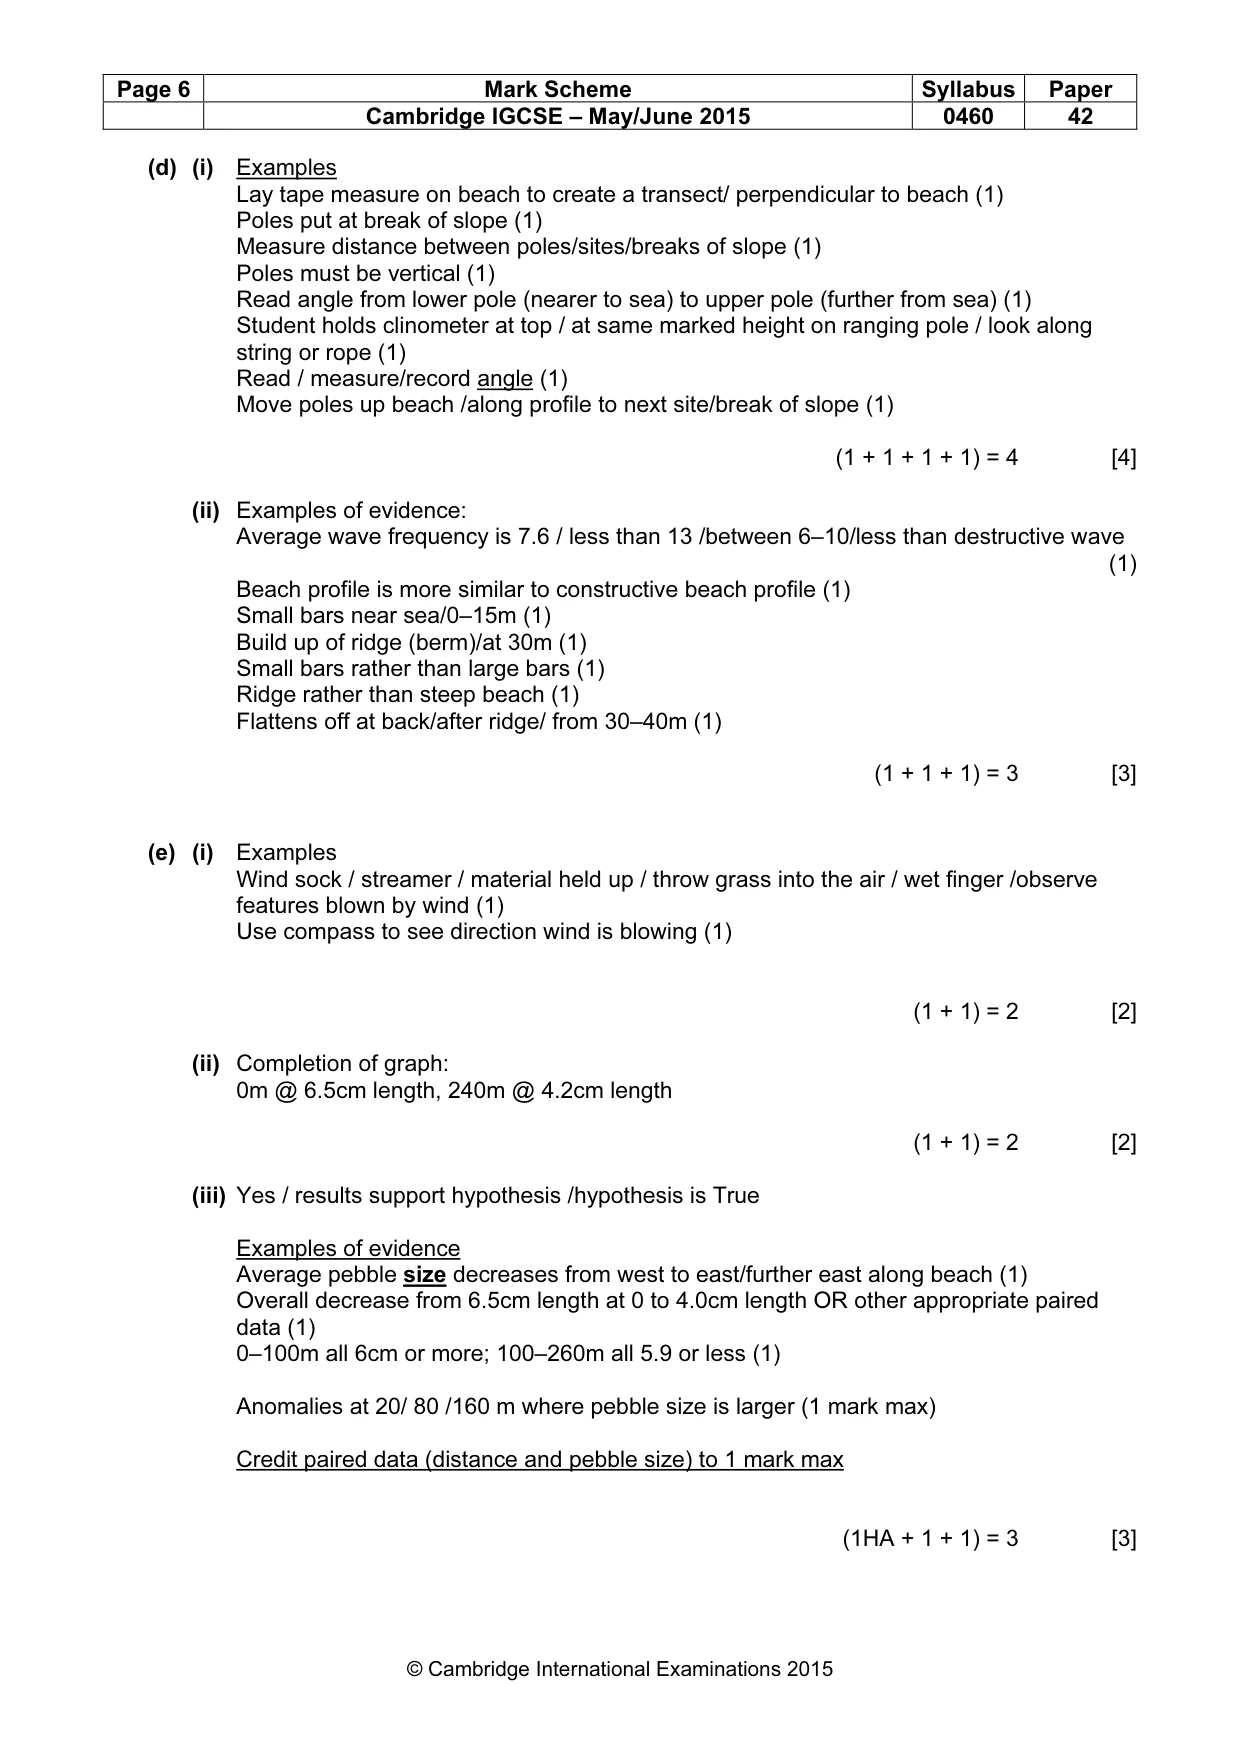
Page 6 Mark Scheme Syllabus Paper Cambridge IGCSE – May/June 2015 0460 42 © Cambridge International Examinations 2015 (d) (i) Examples Lay tape measure on beach to create a transect/ perpendicular to beach (1) Poles put at break of slope (1) Measure distance between poles/sites/breaks of slope (1) Poles must be vertical (1) Read angle from lower pole (nearer to sea) to upper pole (further from sea) (1) Student holds clinometer at top / at same marked height on ranging pole / look along string or rope (1) Read / measure/record angle (1) Move poles up beach /along profile to next site/break of slope (1) (1 + 1 + 1 + 1) = 4 [4] (ii) Examples of evidence: Average wave frequency is 7.6 / less than 13 /between 6–10/less than destructive wave (1) Beach profile is more similar to constructive beach profile (1) Small bars near sea/0–15m (1) Build up of ridge (berm)/at 30m (1) Small bars rather than large bars (1) Ridge rather than steep beach (1) Flattens off at back/after ridge/ from 30–40m (1) (1 + 1 + 1) = 3 [3] (e) (i) Examples Wind sock / streamer / material held up / throw grass into the air / wet finger /observe features blown by wind (1) Use compass to see direction wind is blowing (1) (1 + 1) = 2 [2] (ii) Completion of graph: 0m @ 6.5cm length, 240m @ 4.2cm length (1 + 1) = 2 [2] (iii) Yes / results support hypothesis /hypothesis is True Examples of evidence Average pebble size decreases from west to east/further east along beach (1) Overall decrease from 6.5cm length at 0 to 4.0cm length OR other appropriate paired data (1) 0–100m all 6cm or more; 100–260m all 5.9 or less (1) Anomalies at 20/ 80 /160 m where pebble size is larger (1 mark max) Credit paired data (distance and pebble size) to 1 mark max (1HA + 1 + 1) = 3 [3]
Mark scheme, page 7
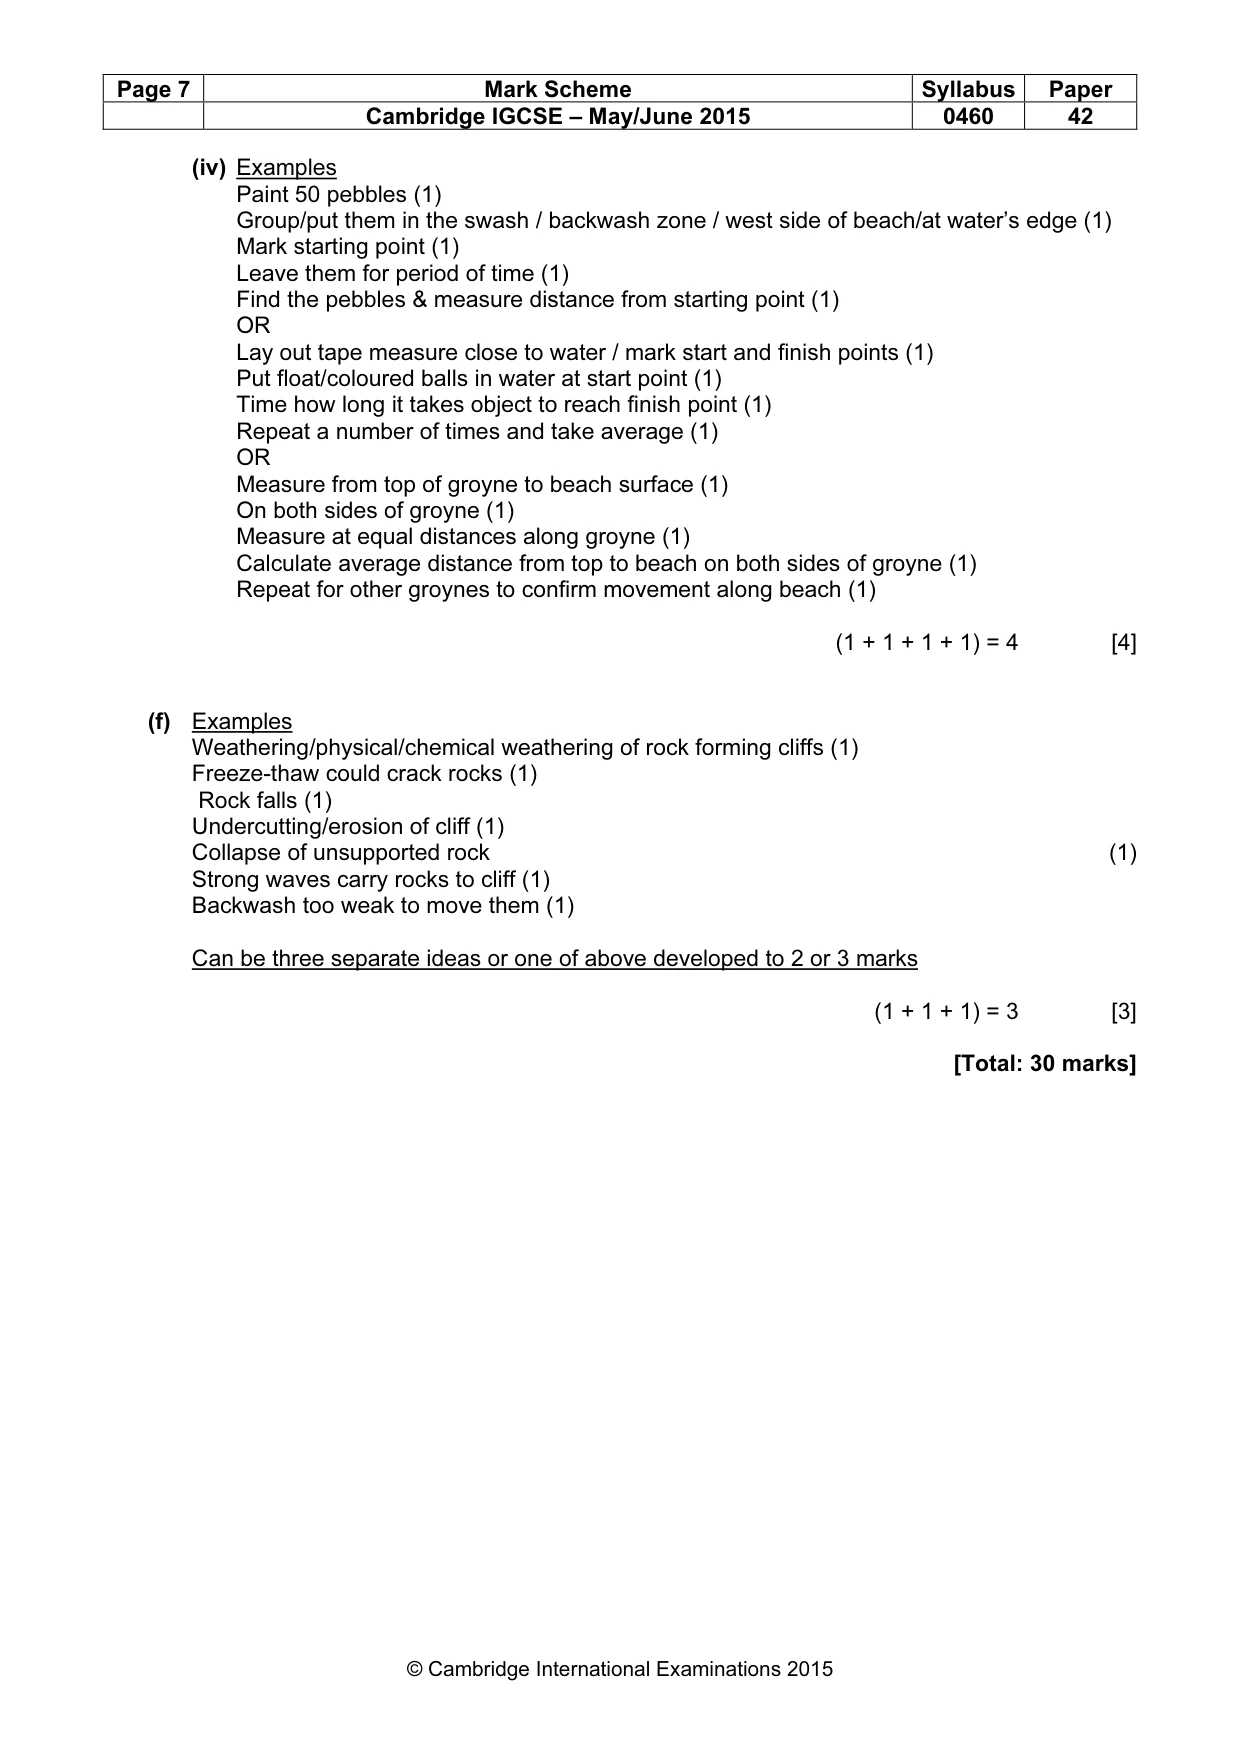
Page 7 Mark Scheme Syllabus Paper Cambridge IGCSE – May/June 2015 0460 42 © Cambridge International Examinations 2015 (iv) Examples Paint 50 pebbles (1) Group/put them in the swash / backwash zone / west side of beach/at water’s edge (1) Mark starting point (1) Leave them for period of time (1) Find the pebbles & measure distance from starting point (1) OR Lay out tape measure close to water / mark start and finish points (1) Put float/coloured balls in water at start point (1) Time how long it takes object to reach finish point (1) Repeat a number of times and take average (1) OR Measure from top of groyne to beach surface (1) On both sides of groyne (1) Measure at equal distances along groyne (1) Calculate average distance from top to beach on both sides of groyne (1) Repeat for other groynes to confirm movement along beach (1) (1 + 1 + 1 + 1) = 4 [4] (f) Examples Weathering/physical/chemical weathering of rock forming cliffs (1) Freeze-thaw could crack rocks (1) Rock falls (1) Undercutting/erosion of cliff (1) Collapse of unsupported rock (1) Strong waves carry rocks to cliff (1) Backwash too weak to move them (1) Can be three separate ideas or one of above developed to 2 or 3 marks (1 + 1 + 1) = 3 [3] [Total: 30 marks]
What you needed in this session
Cambridge’s own grade thresholds for 2015 May/June, Paper 4 · Variant 2. A higher threshold means an easier paper — the bar moves with how the cohort did.