Cambridge IGCSE Geography 0460 — 2014 Oct/Nov Paper 4 · Variant 3
0460/43/O/N/14 · 60 marks · ≈68 min
The question paper and its mark scheme, free to read here and free to download. This is Cambridge’s own paper, exactly as it was sat.
Question paper16 pages



Mark scheme6 pages
Answers below. Sit the paper first if you are practising.
Paper as text
Question paper, page 1
This document consists of 14 printed pages, 2 blank pages and 1 Insert. DC (KN/CGW) 80394/5 © UCLES 2014 [Turn over Cambridge International Examinations Cambridge International General Certificate of Secondary Education * 4 1 4 5 9 4 8 1 0 1 * GEOGRAPHY 0460/43 Paper 4 Alternative to Coursework October/November 2014 1 hour 30 minutes Candidates answer on the Question Paper. Additional Materials: Ruler Calculator READ THESE INSTRUCTIONS FIRST Write your Centre number, candidate number and name in the spaces provided. Write in dark blue or black pen. You may use an HB pencil for any diagrams or graphs. Do not use staples, paper clips, glue or correction fluid. DO NOT WRITE IN ANY BARCODES. Answer all questions. The Insert contains Figs 1 and 3, Photograph A and Tables 1 and 2 for Question 1, and Fig. 5 for Question 2. The Insert is not required by the Examiner. Sketch maps and diagrams should be drawn whenever they serve to illustrate an answer. At the end of the examination, fasten all your work securely together. The number of marks is given in brackets [ ] at the end of each question or part question. The syllabus is approved for use in England, Wales and Northern Ireland as a Cambridge International Level 1/Level 2 Certificate.
Question paper, page 2
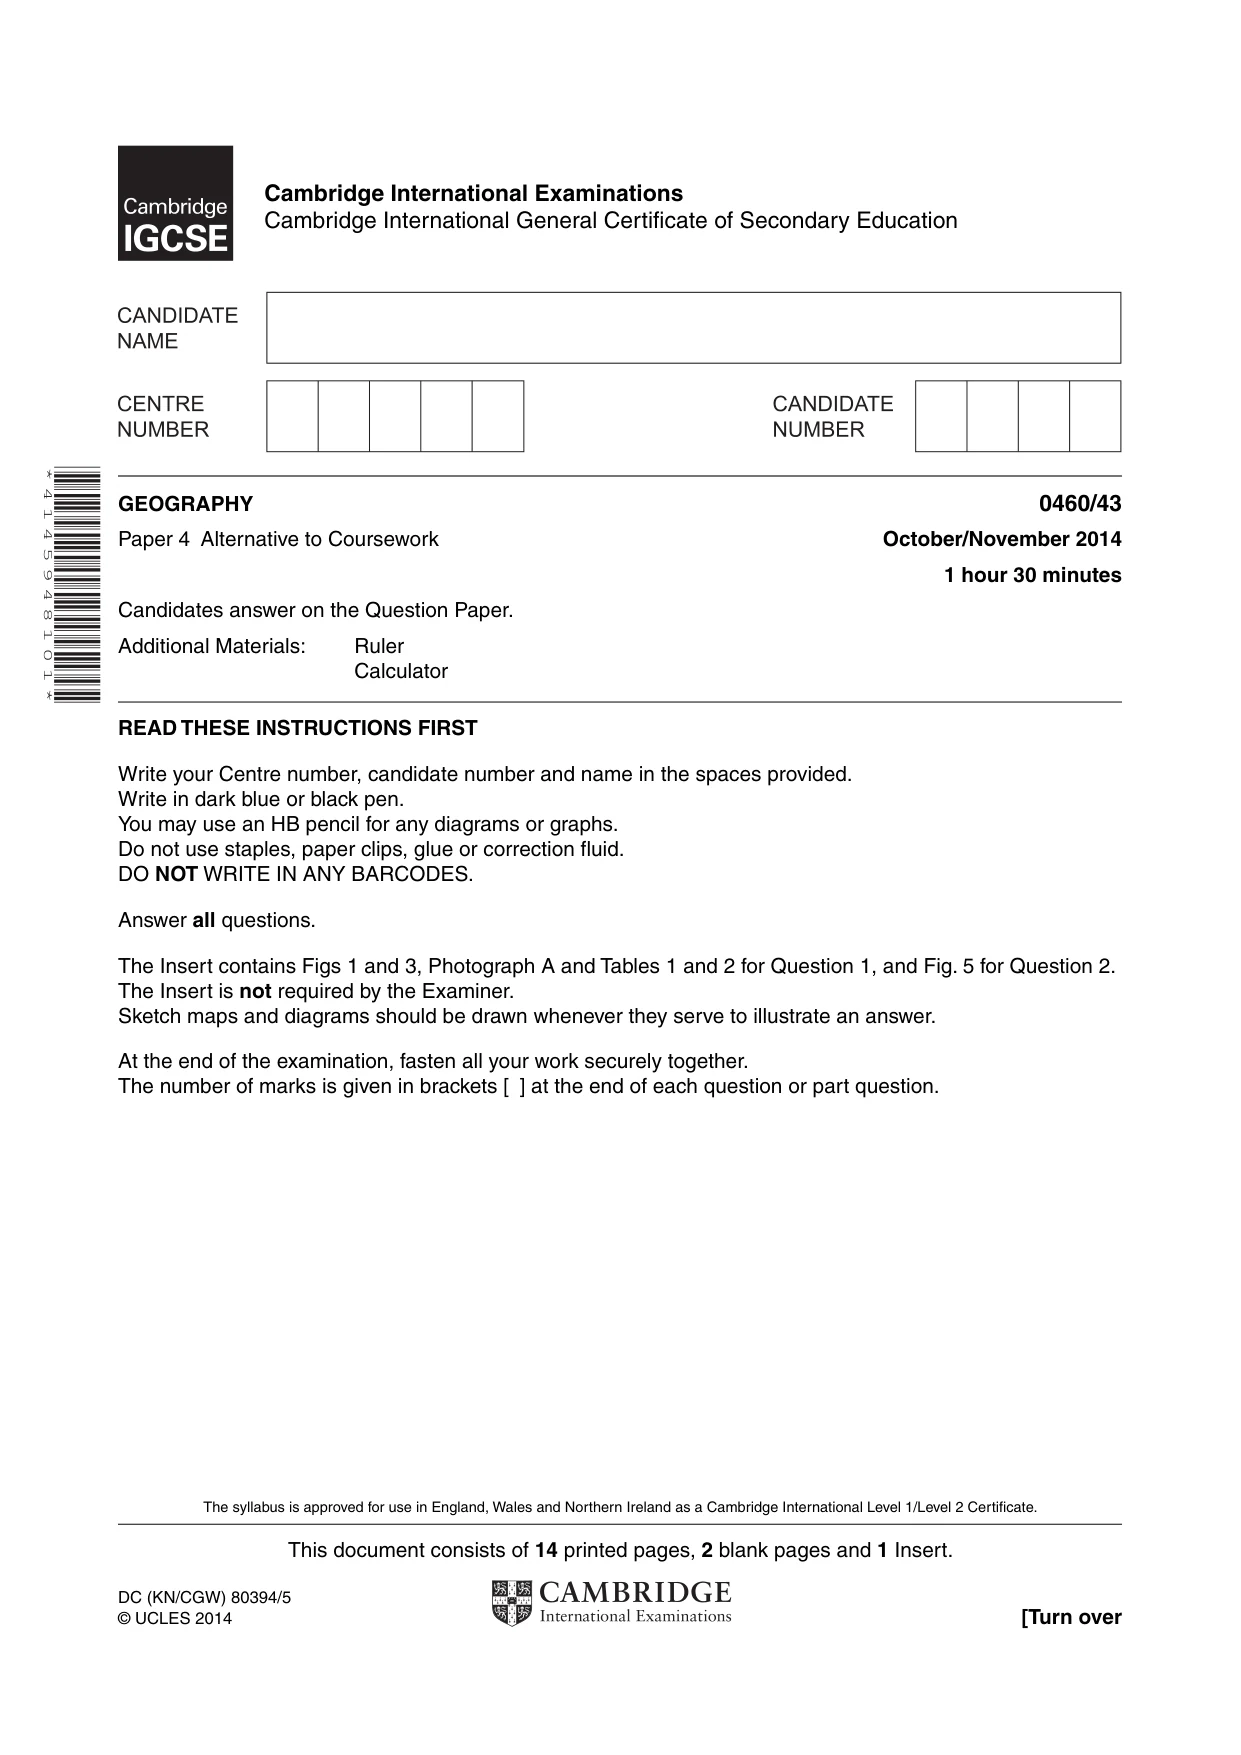
2 0460/43/O/N/14 © UCLES 2014 1 Two groups of students were doing fieldwork in the Rio Santa Valley in Peru. They chose four sites along the river to investigate how the river changes downstream. The students investigated the following hypotheses: Hypothesis 1: River velocity increases downstream. Hypothesis 2: Rocks on the bed of the river (bedload) become smaller and more rounded downstream. (a) Each group used two different methods to measure velocity. In method 1 they used floating objects and in method 2 they used a velocity meter (flow meter). The velocity meter and how it is used are shown in Photograph A and Fig. 1 (Insert). Describe the two different methods of measuring velocity. Method 1 (using floating objects) … … … … … … Method 2 (using a velocity meter) … … … … … … [6]
Question paper, page 3
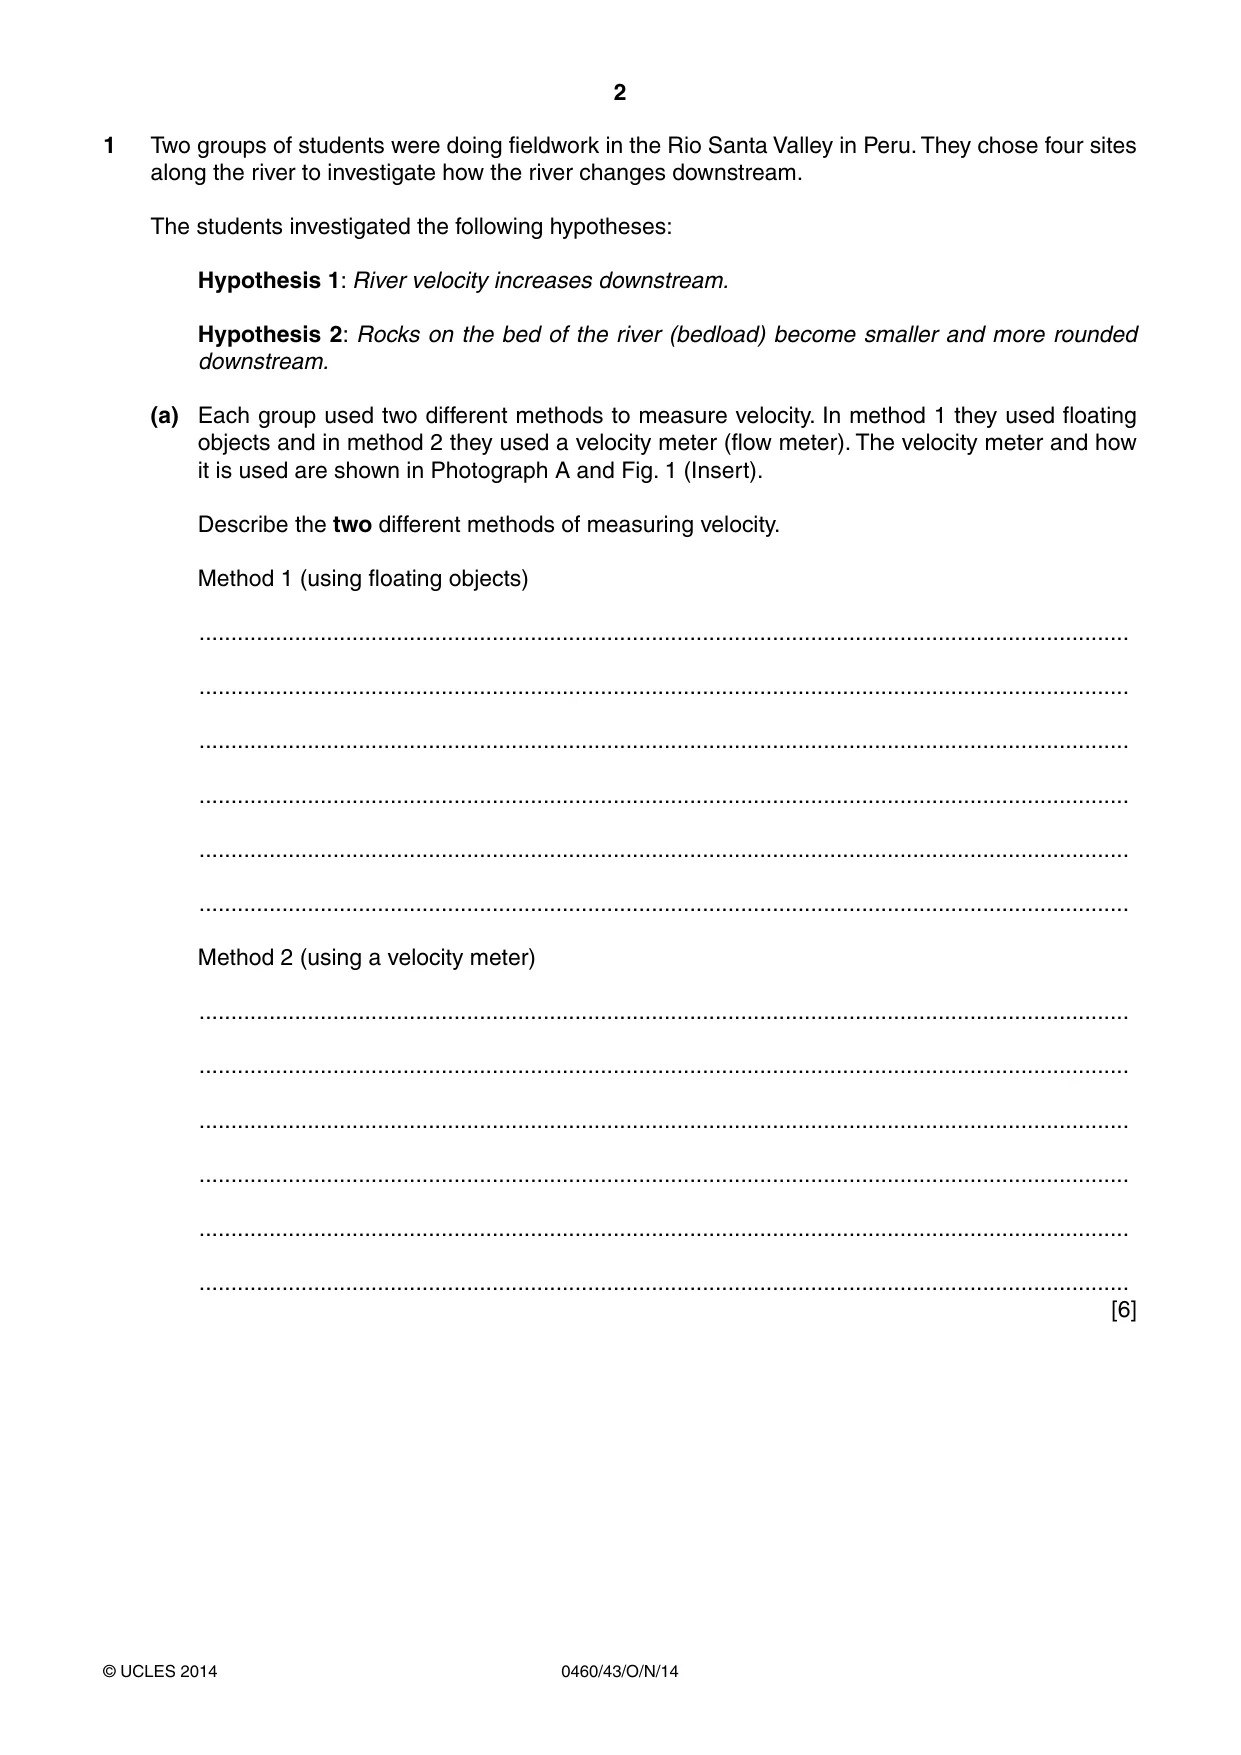
3 0460/43/O/N/14 © UCLES 2014 [Turn over (b) (i) The students agreed that method 1 (using floating objects) had produced unreliable results compared to method 2 (using a velocity meter). Suggest three reasons why method 1 may have produced unreliable results. 1 … … 2 … … 3 … … [3] (ii) The results of the students’ measurements using a velocity meter are shown in Table 1 (Insert). Use the average velocity results to complete the graph for Group A in Fig. 2 below. [2] 1.8 2.0 1.6 1.4 1.2 1.0 0.8 0.6 0.4 0.2 1 0 2 3 site Results obtained using a velocity meter downstream average speed of flow (m per sec) group A group B 4 Key Fig. 2 (iii) What conclusion would the students in Group B make about Hypothesis 1: River velocity increases downstream? Support the conclusion with evidence from Fig. 2. … … … … [2]
Question paper, page 4
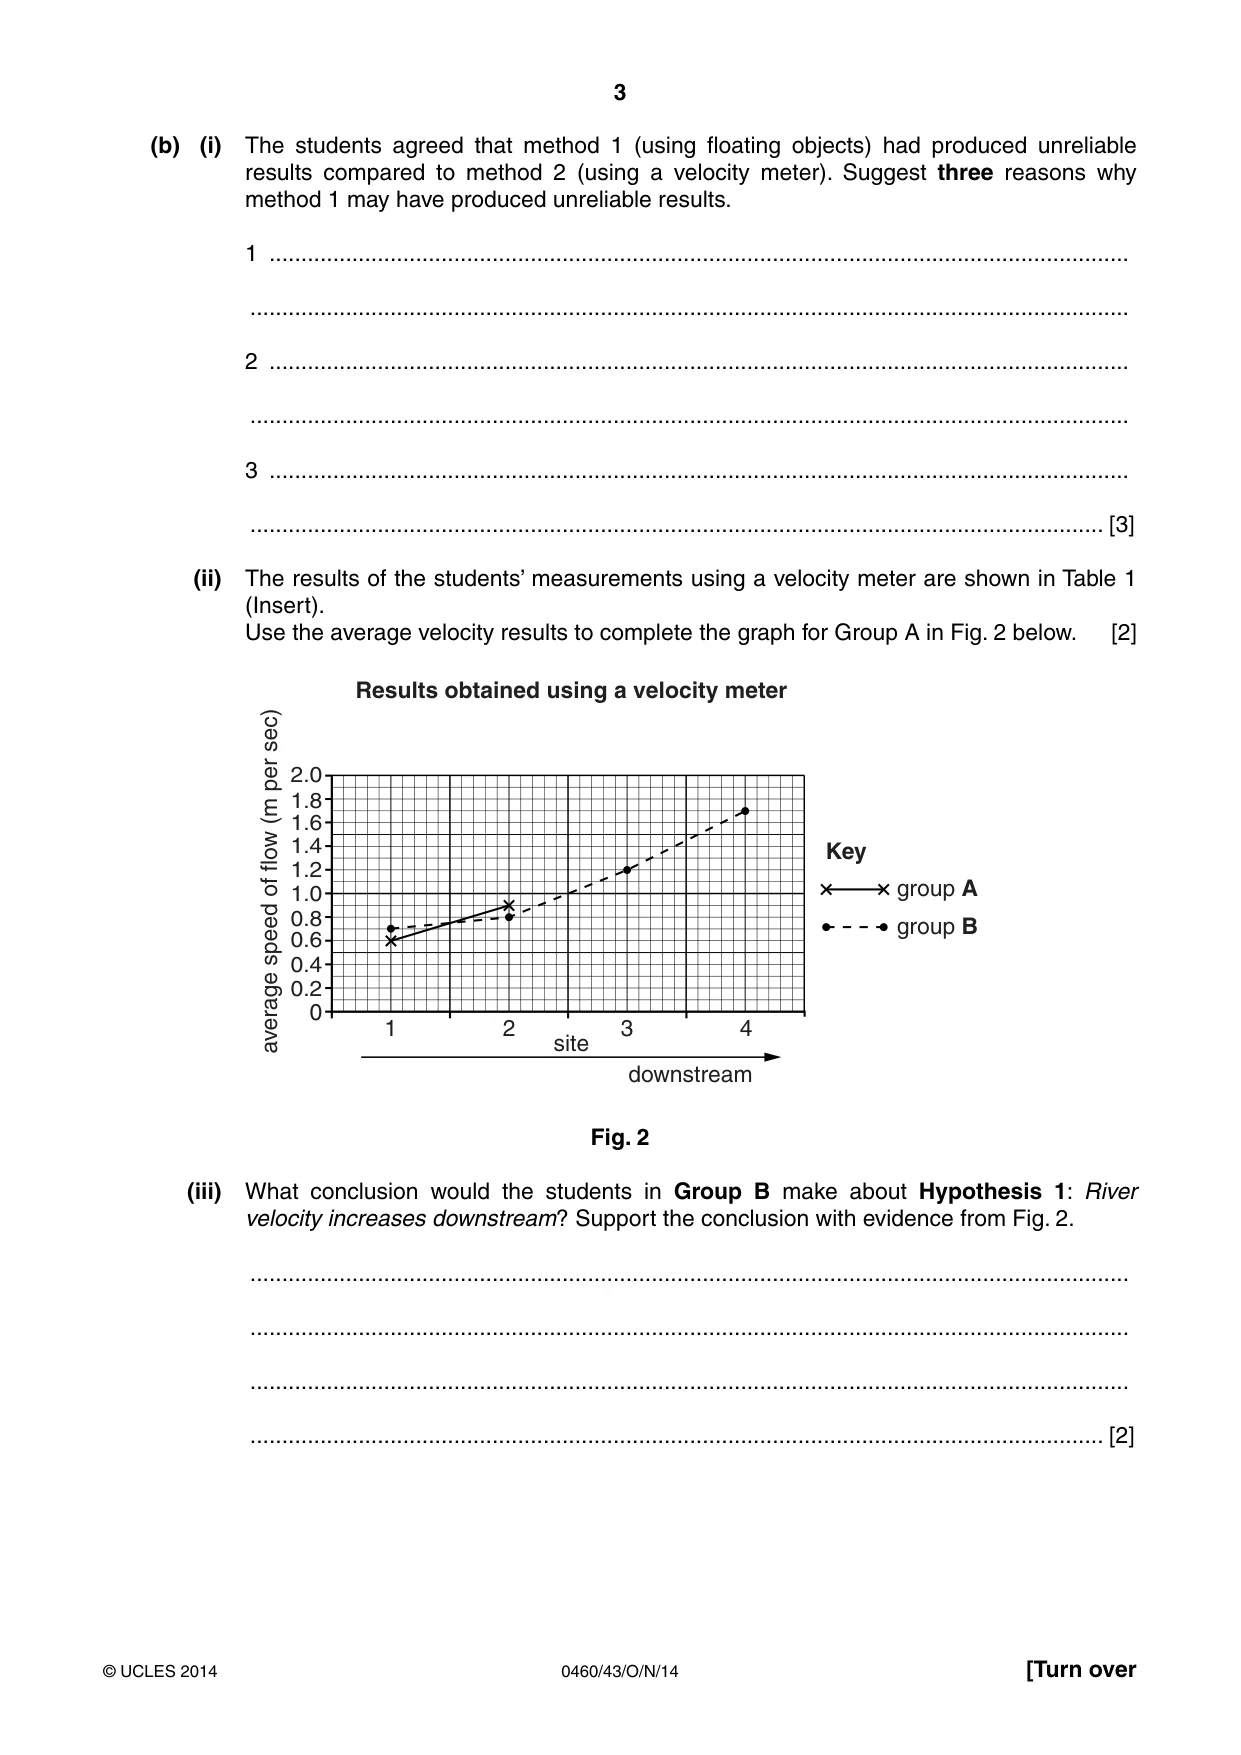
4 0460/43/O/N/14 © UCLES 2014 (c) Next the students made some measurements to investigate Hypothesis 2: Rocks on the bed of the river (bedload) become smaller and more rounded downstream. (i) At each site the two groups of students selected 10 rocks at random from the river bed. They then measured the size and roundness of each rock using the equipment shown in Fig. 3 (Insert). Describe how the students made the two measurements. Size … … Roundness … … [2] (ii) Suggest two weaknesses of selecting rocks at random. 1 … … 2 … … [2]
Question paper, page 5
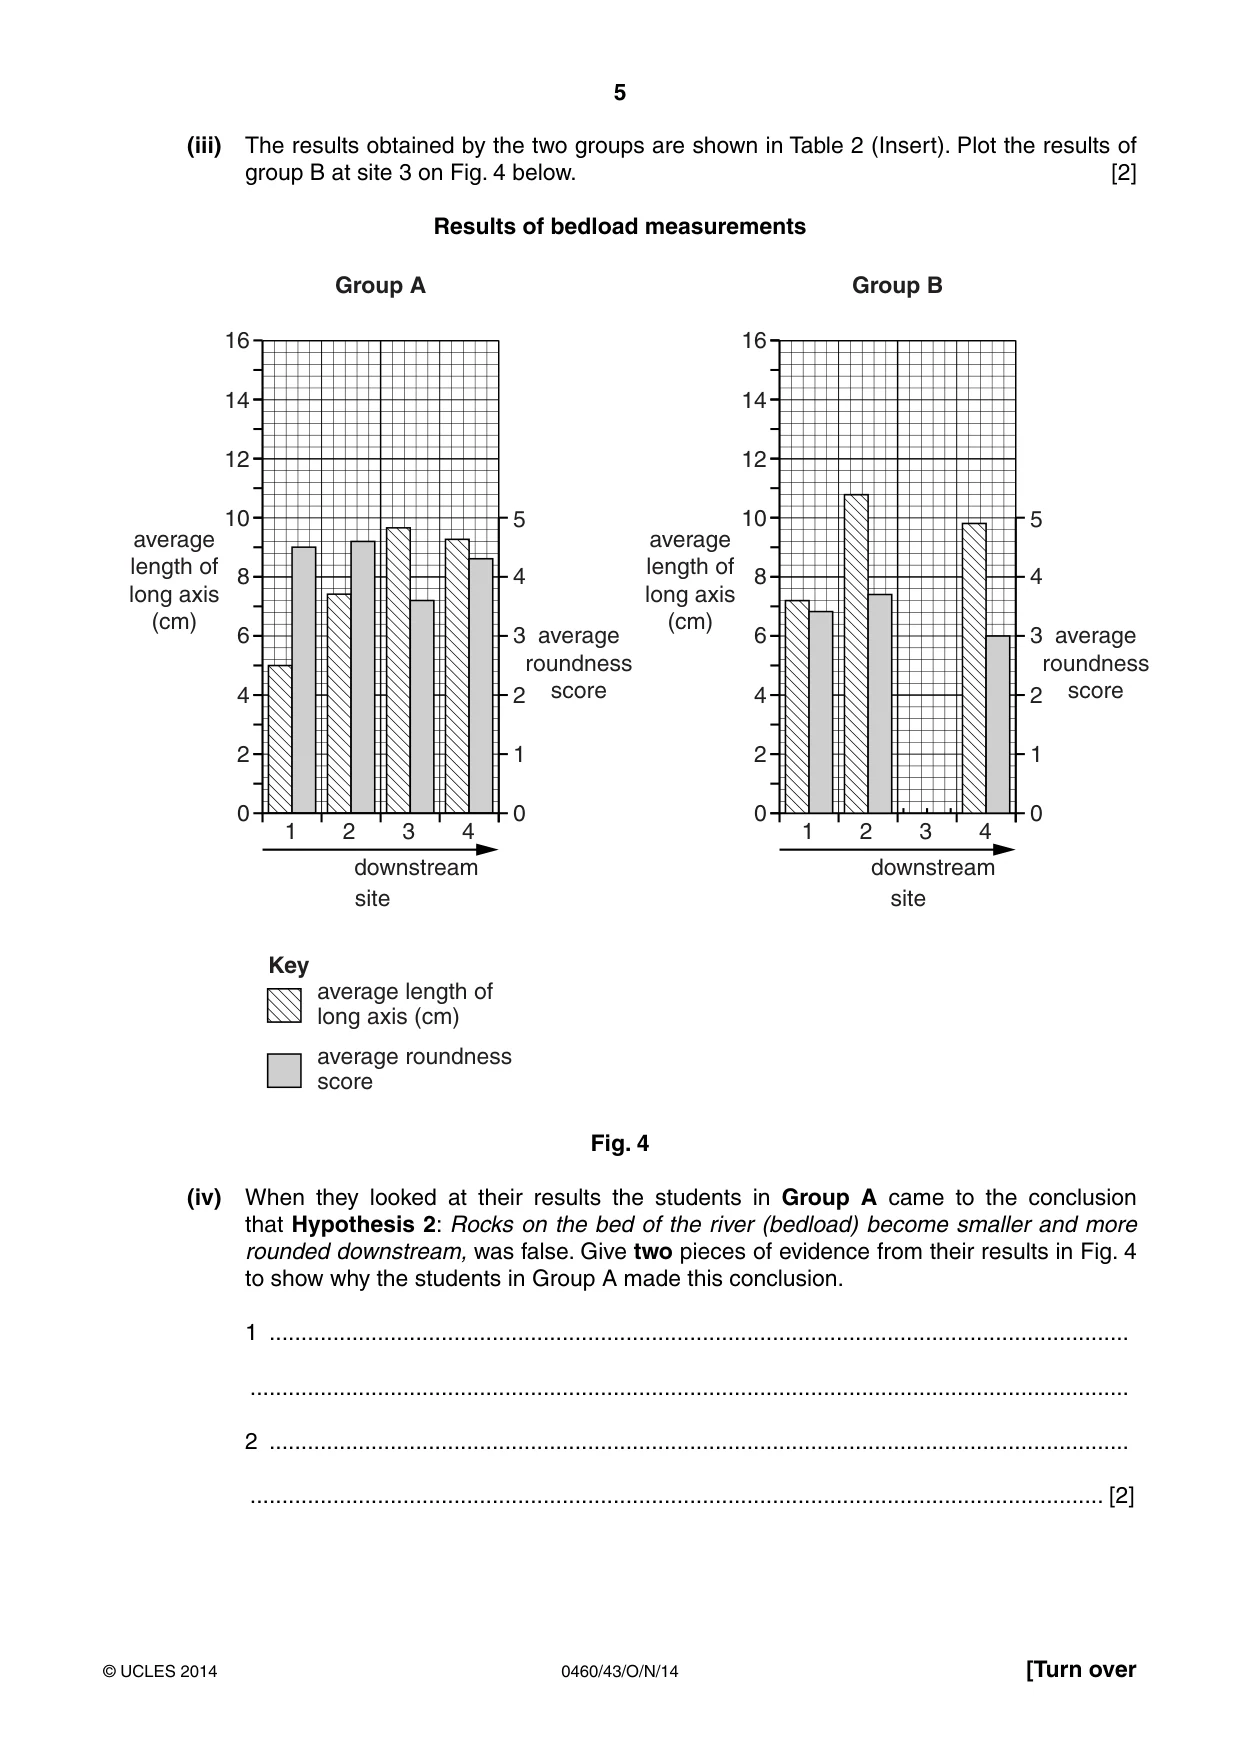
5 0460/43/O/N/14 © UCLES 2014 [Turn over (iii) The results obtained by the two groups are shown in Table 2 (Insert). Plot the results of group B at site 3 on Fig. 4 below. [2] Results of bedload measurements 16 14 12 10 8 average length of long axis (cm) average length of long axis (cm) average roundness score 6 4 1 2 3 Group A site downstream Key average length of long axis (cm) 4 2 0 4 5 3 2 1 0 16 14 12 10 8 average roundness score 6 4 1 2 3 Group B site downstream 4 2 0 4 5 3 2 1 0 average roundness score Fig. 4 (iv) When they looked at their results the students in Group A came to the conclusion that Hypothesis 2: Rocks on the bed of the river (bedload) become smaller and more rounded downstream, was false. Give two pieces of evidence from their results in Fig. 4 to show why the students in Group A made this conclusion. 1 … … 2 … … [2]
Question paper, page 6
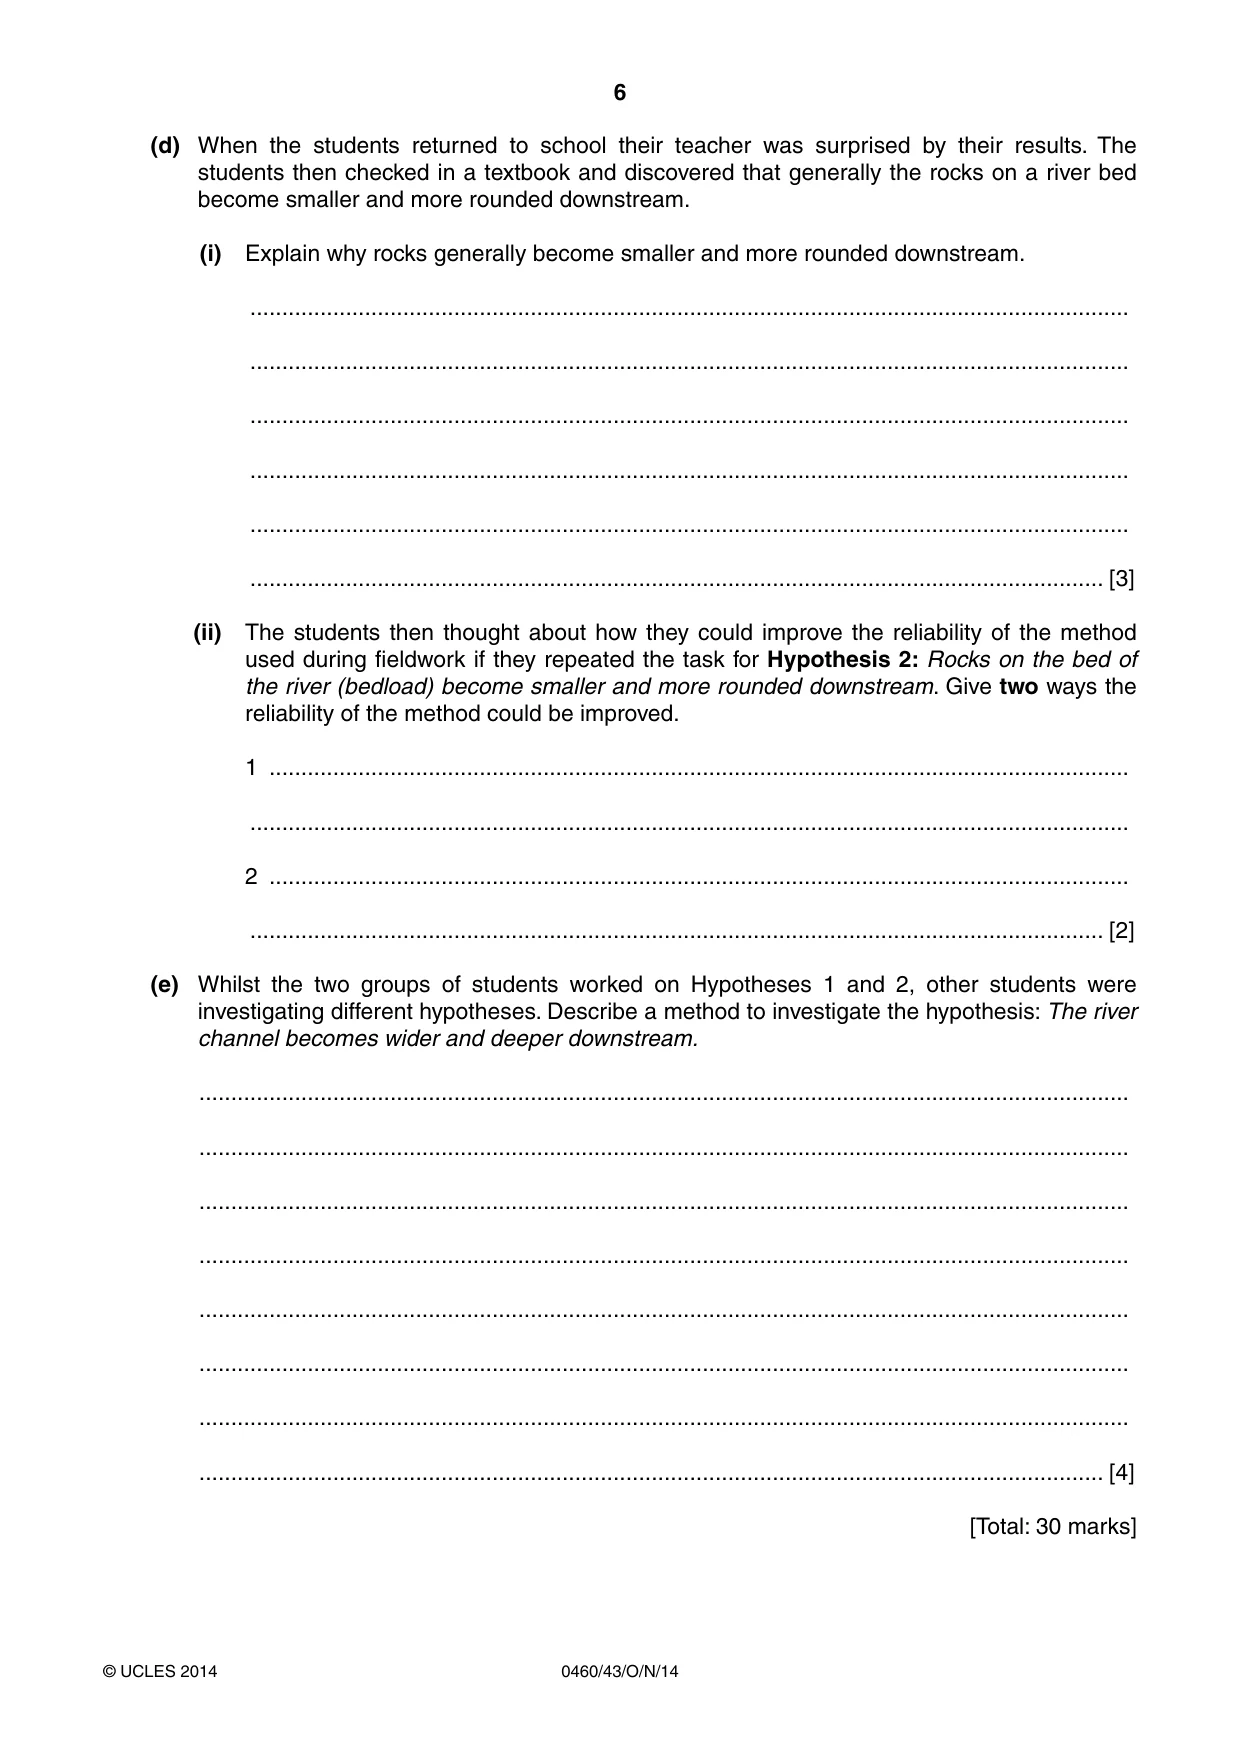
6 0460/43/O/N/14 © UCLES 2014 (d) When the students returned to school their teacher was surprised by their results. The students then checked in a textbook and discovered that generally the rocks on a river bed become smaller and more rounded downstream. (i) Explain why rocks generally become smaller and more rounded downstream. … … … … … … [3] (ii) The students then thought about how they could improve the reliability of the method used during fieldwork if they repeated the task for Hypothesis 2: Rocks on the bed of the river (bedload) become smaller and more rounded downstream. Give two ways the reliability of the method could be improved. 1 … … 2 … … [2] (e) Whilst the two groups of students worked on Hypotheses 1 and 2, other students were investigating different hypotheses. Describe a method to investigate the hypothesis: The river channel becomes wider and deeper downstream. … … … … … … … … [4] [Total: 30 marks]
Question paper, page 7
7 0460/43/O/N/14 © UCLES 2014 [Turn over TURN OVER FOR QUESTION 2
Question paper, page 8
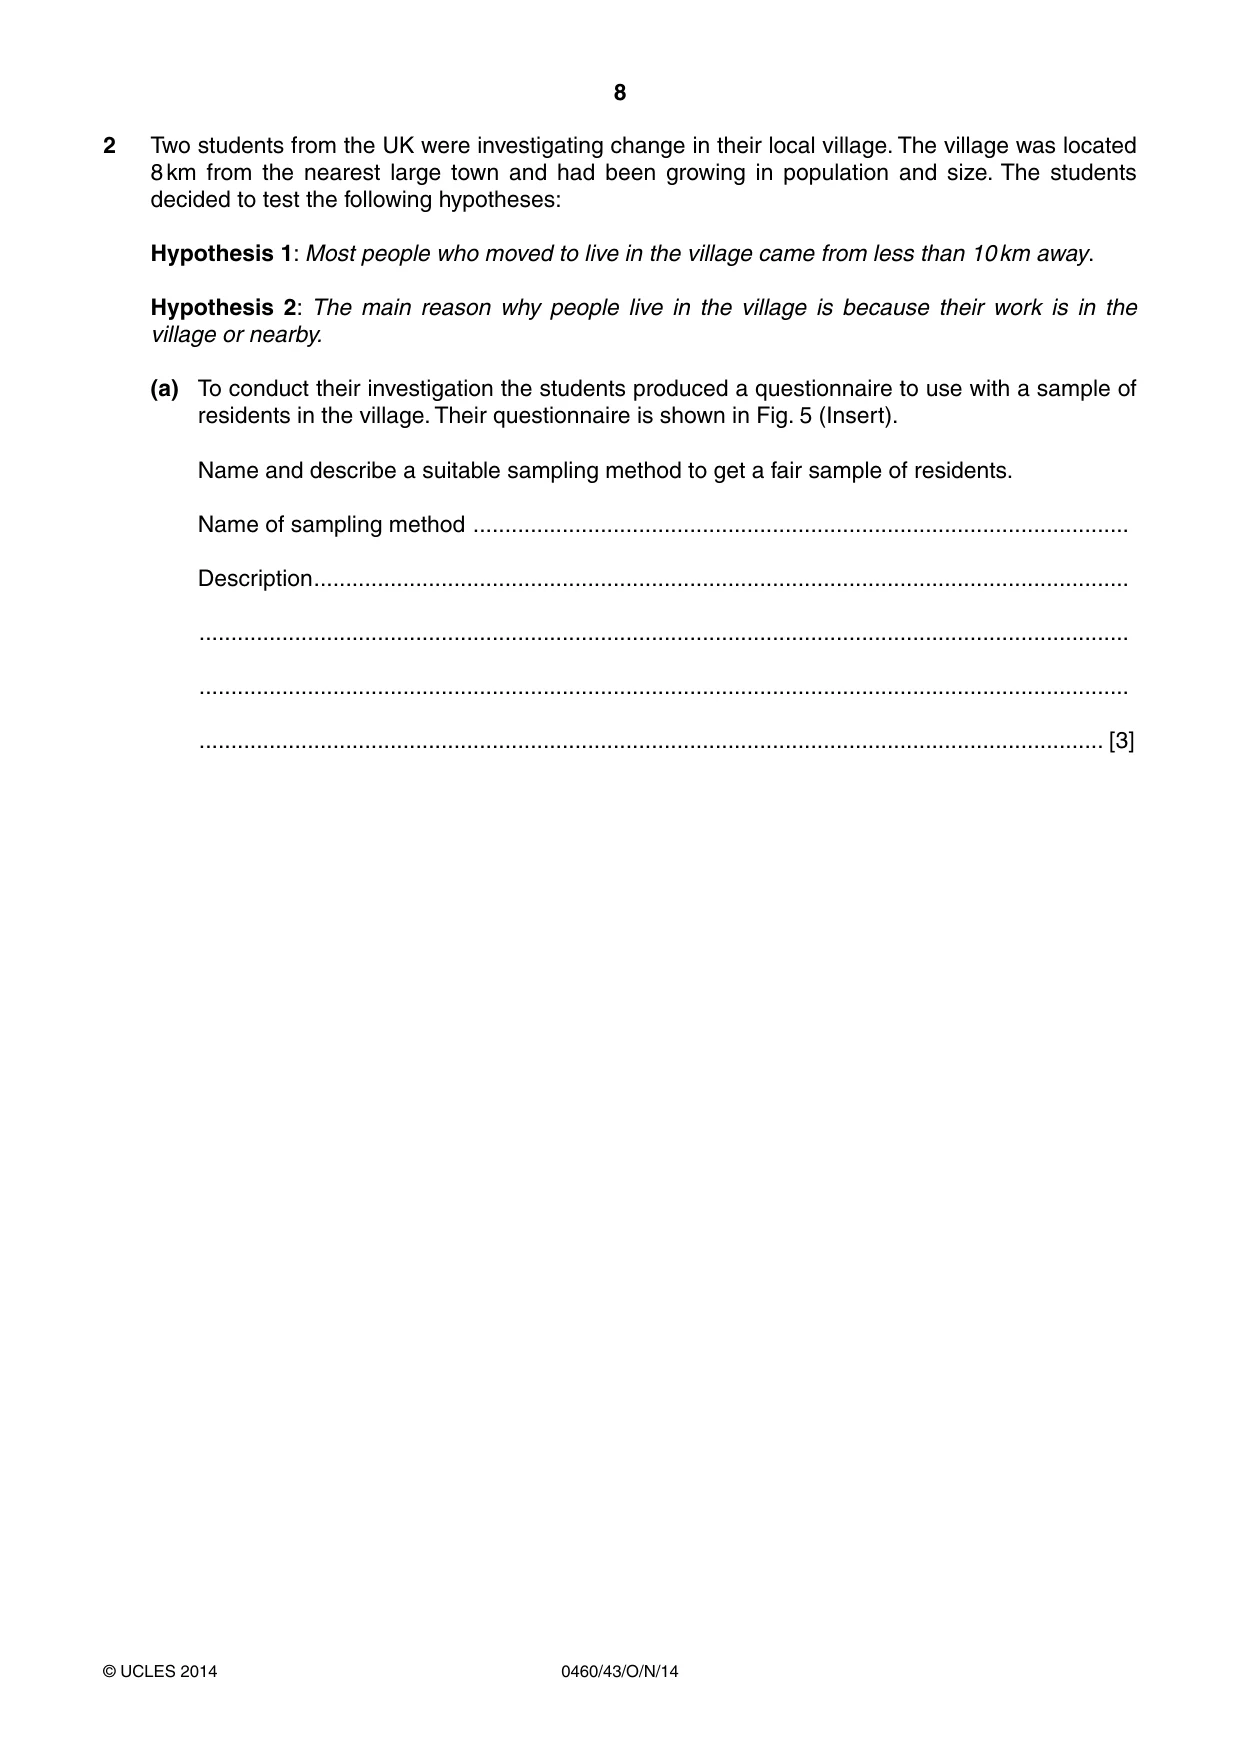
8 0460/43/O/N/14 © UCLES 2014 2 Two students from the UK were investigating change in their local village. The village was located 8 km from the nearest large town and had been growing in population and size. The students decided to test the following hypotheses: Hypothesis 1: Most people who moved to live in the village came from less than 10 km away. Hypothesis 2: The main reason why people live in the village is because their work is in the village or nearby. (a) To conduct their investigation the students produced a questionnaire to use with a sample of residents in the village. Their questionnaire is shown in Fig. 5 (Insert). Name and describe a suitable sampling method to get a fair sample of residents. Name of sampling method … Description … … … … [3]
Question paper, page 9
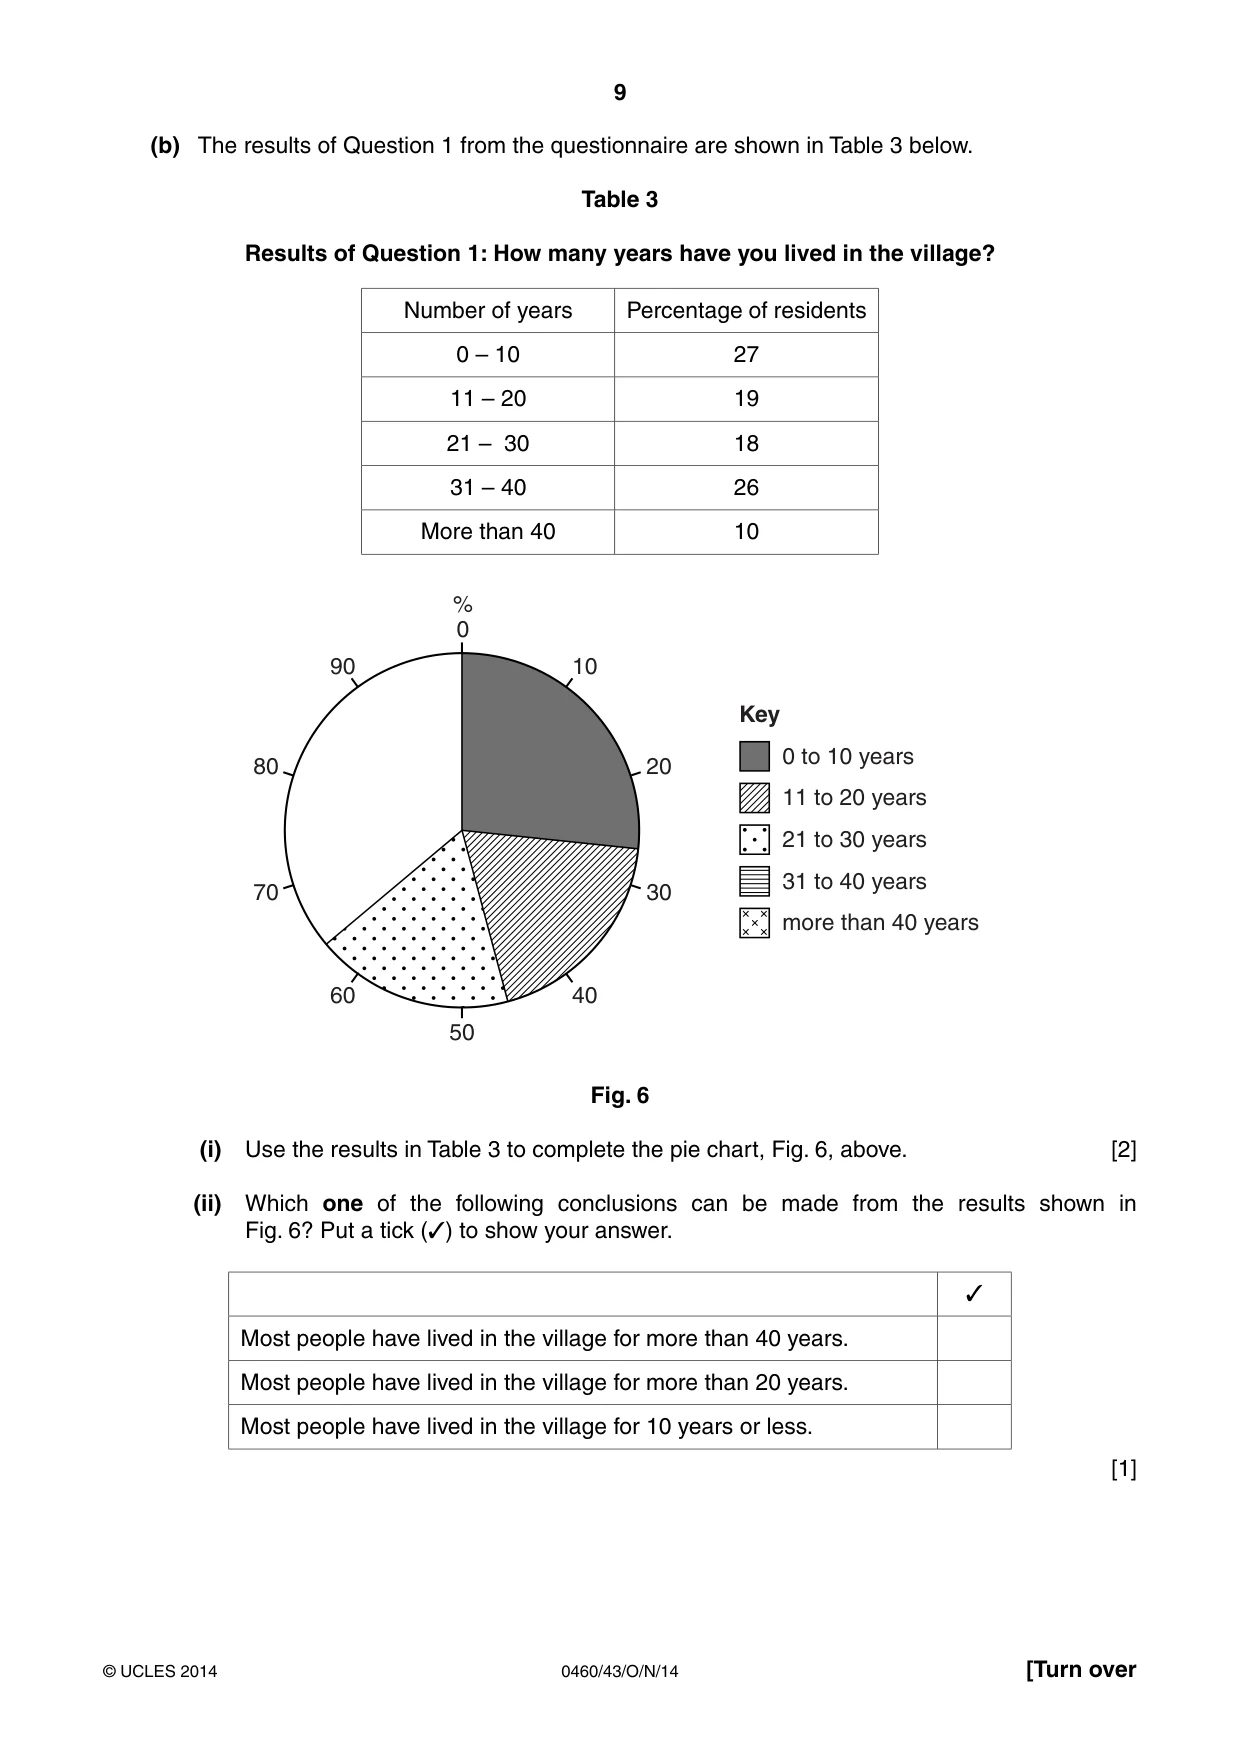
9 0460/43/O/N/14 © UCLES 2014 [Turn over (b) The results of Question 1 from the questionnaire are shown in Table 3 below. Table 3 Results of Question 1: How many years have you lived in the village? Number of years Percentage of residents 0 – 10 27 11 – 20 19 21 – 30 18 31 – 40 26 More than 40 10 % 0 50 40 10 Key 0 to 10 years 11 to 20 years 21 to 30 years more than 40 years 31 to 40 years 60 90 20 30 80 70 Fig. 6 (i) Use the results in Table 3 to complete the pie chart, Fig. 6, above. [2] (ii) Which one of the following conclusions can be made from the results shown in Fig. 6? Put a tick (✓) to show your answer. ✓ Most people have lived in the village for more than 40 years. Most people have lived in the village for more than 20 years. Most people have lived in the village for 10 years or less. [1]
Question paper, page 10
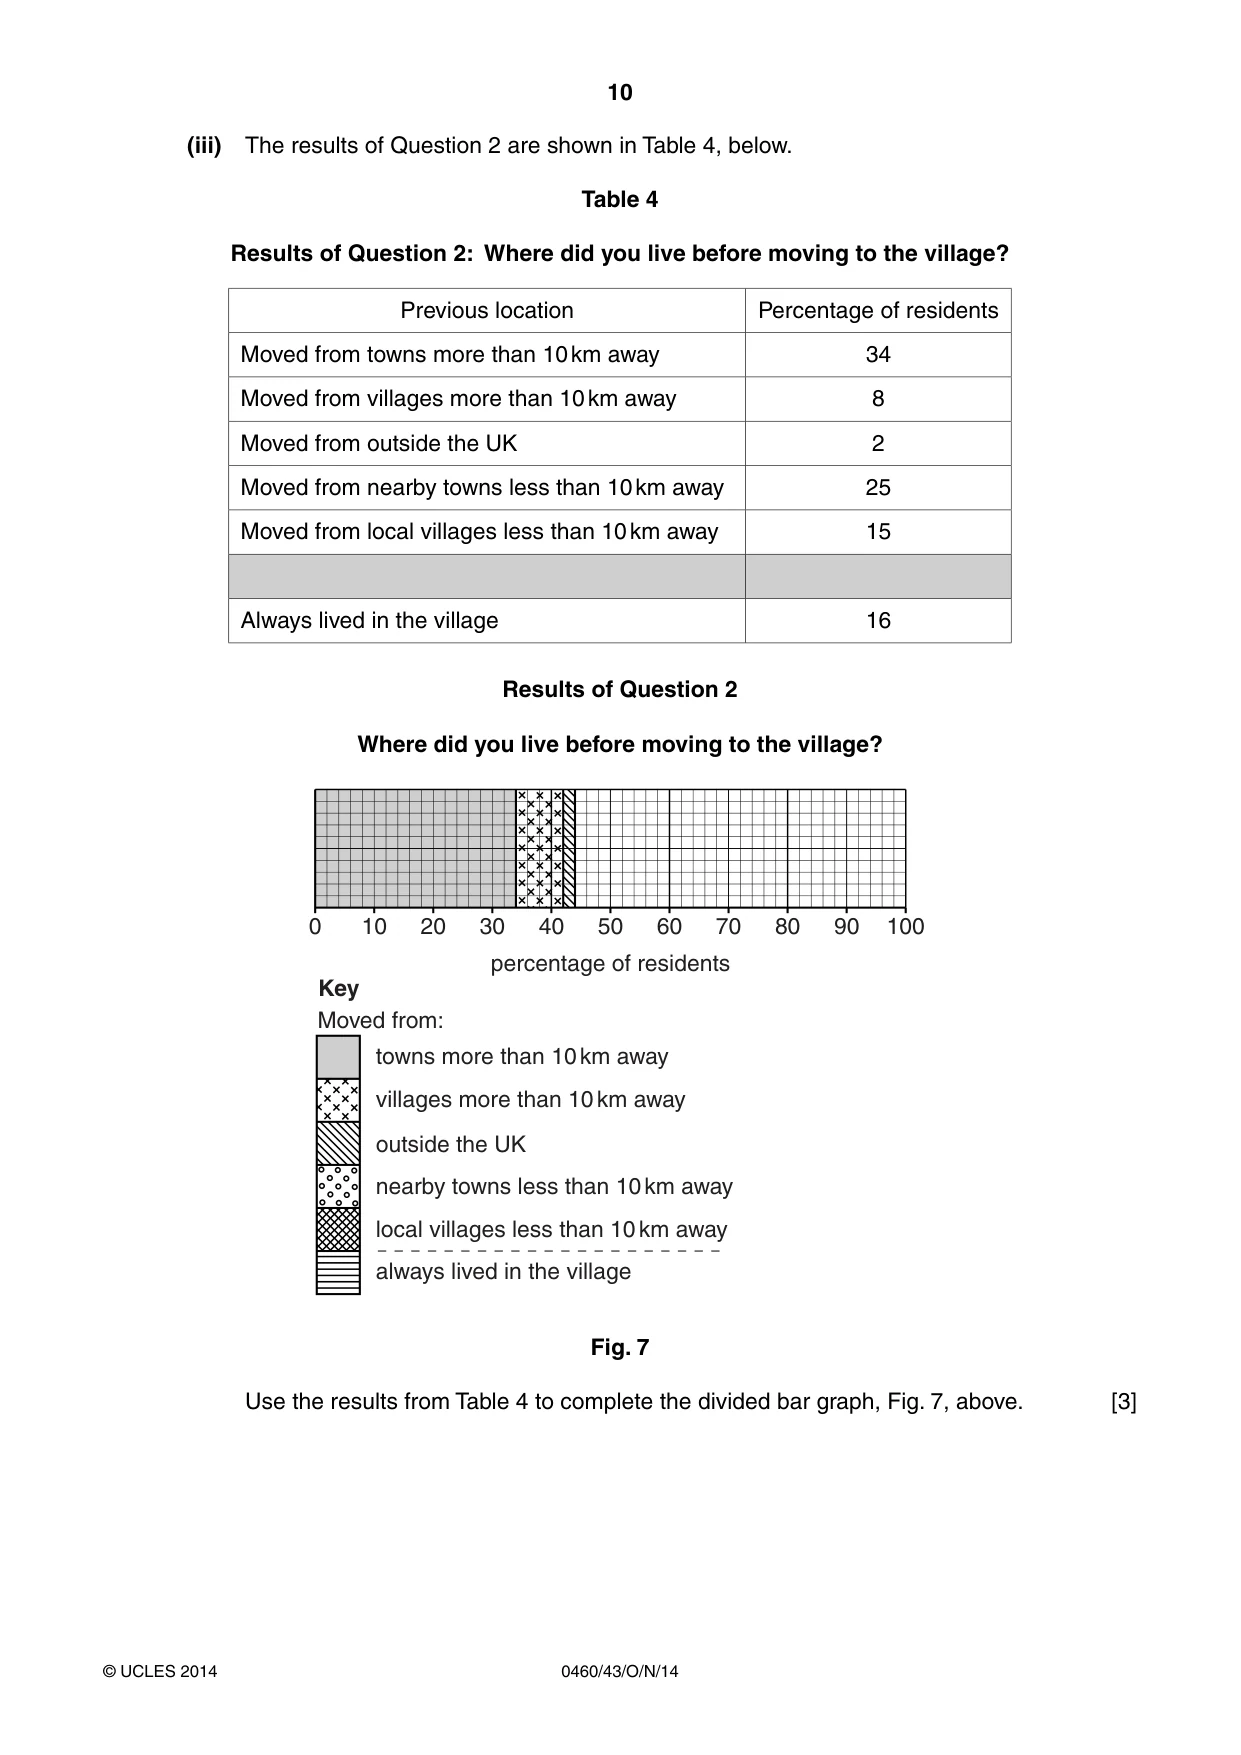
10 0460/43/O/N/14 © UCLES 2014 (iii) The results of Question 2 are shown in Table 4, below. Table 4 Results of Question 2: Where did you live before moving to the village? Previous location Percentage of residents Moved from towns more than 10 km away 34 Moved from villages more than 10 km away 8 Moved from outside the UK 2 Moved from nearby towns less than 10 km away 25 Moved from local villages less than 10 km away 15 Always lived in the village 16 Results of Question 2 Where did you live before moving to the village? 0 10 20 30 40 50 percentage of residents Key towns more than 10 km away Moved from: villages more than 10 km away outside the UK nearby towns less than 10 km away local villages less than 10 km away always lived in the village 60 70 80 90 100 Fig. 7 Use the results from Table 4 to complete the divided bar graph, Fig. 7, above. [3]
Question paper, page 11
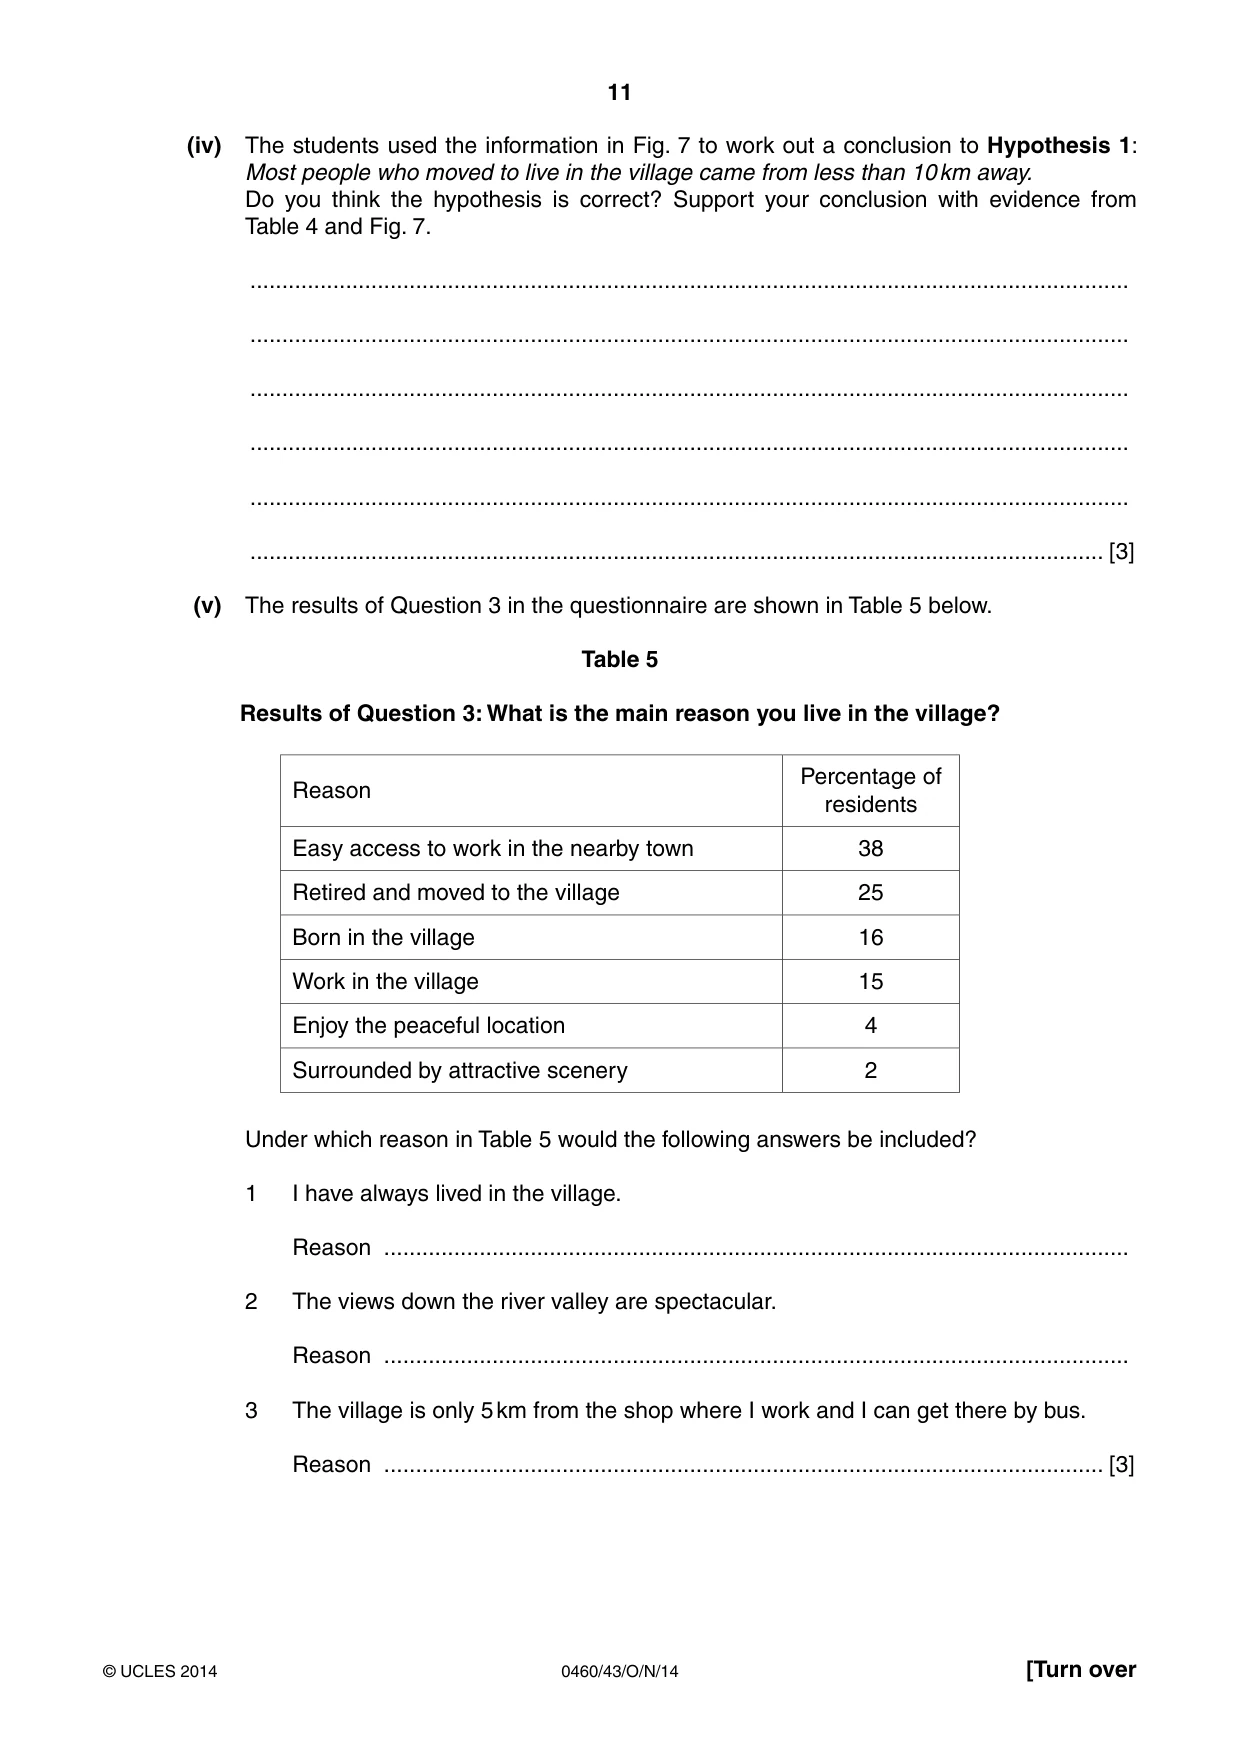
11 0460/43/O/N/14 © UCLES 2014 [Turn over (iv) The students used the information in Fig. 7 to work out a conclusion to Hypothesis 1: Most people who moved to live in the village came from less than 10 km away. Do you think the hypothesis is correct? Support your conclusion with evidence from Table 4 and Fig. 7. … … … … … … [3] (v) The results of Question 3 in the questionnaire are shown in Table 5 below. Table 5 Results of Question 3: What is the main reason you live in the village? Reason Percentage of residents Easy access to work in the nearby town 38 Retired and moved to the village 25 Born in the village 16 Work in the village 15 Enjoy the peaceful location 4 Surrounded by attractive scenery 2 Under which reason in Table 5 would the following answers be included? 1 I have always lived in the village. Reason … 2 The views down the river valley are spectacular. Reason … 3 The village is only 5 km from the shop where I work and I can get there by bus. Reason … [3]
Question paper, page 12
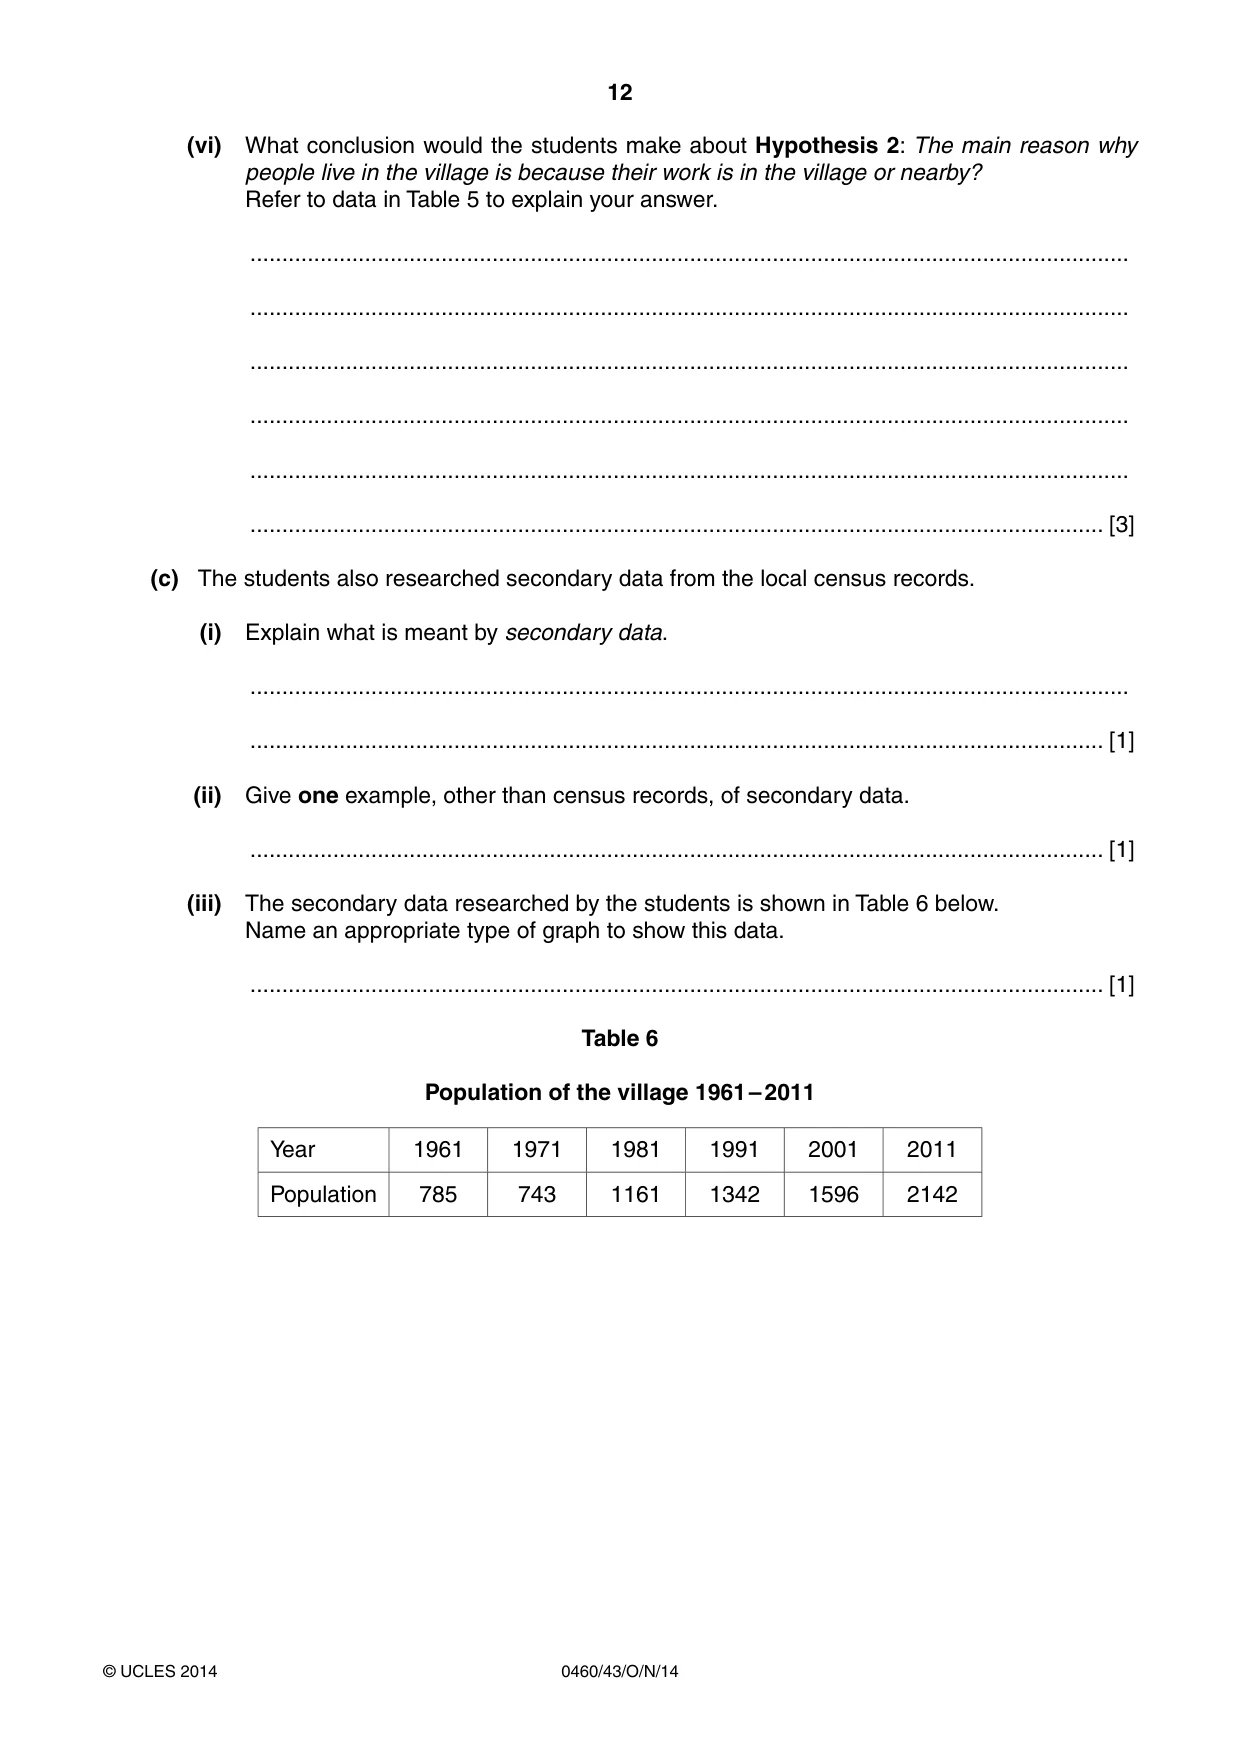
12 0460/43/O/N/14 © UCLES 2014 (vi) What conclusion would the students make about Hypothesis 2: The main reason why people live in the village is because their work is in the village or nearby? Refer to data in Table 5 to explain your answer. … … … … … … [3] (c) The students also researched secondary data from the local census records. (i) Explain what is meant by secondary data. … … [1] (ii) Give one example, other than census records, of secondary data. … [1] (iii) The secondary data researched by the students is shown in Table 6 below. Name an appropriate type of graph to show this data. … [1] Table 6 Population of the village 1961 – 2011 Year 1961 1971 1981 1991 2001 2011 Population 785 743 1161 1342 1596 2142
Question paper, page 13
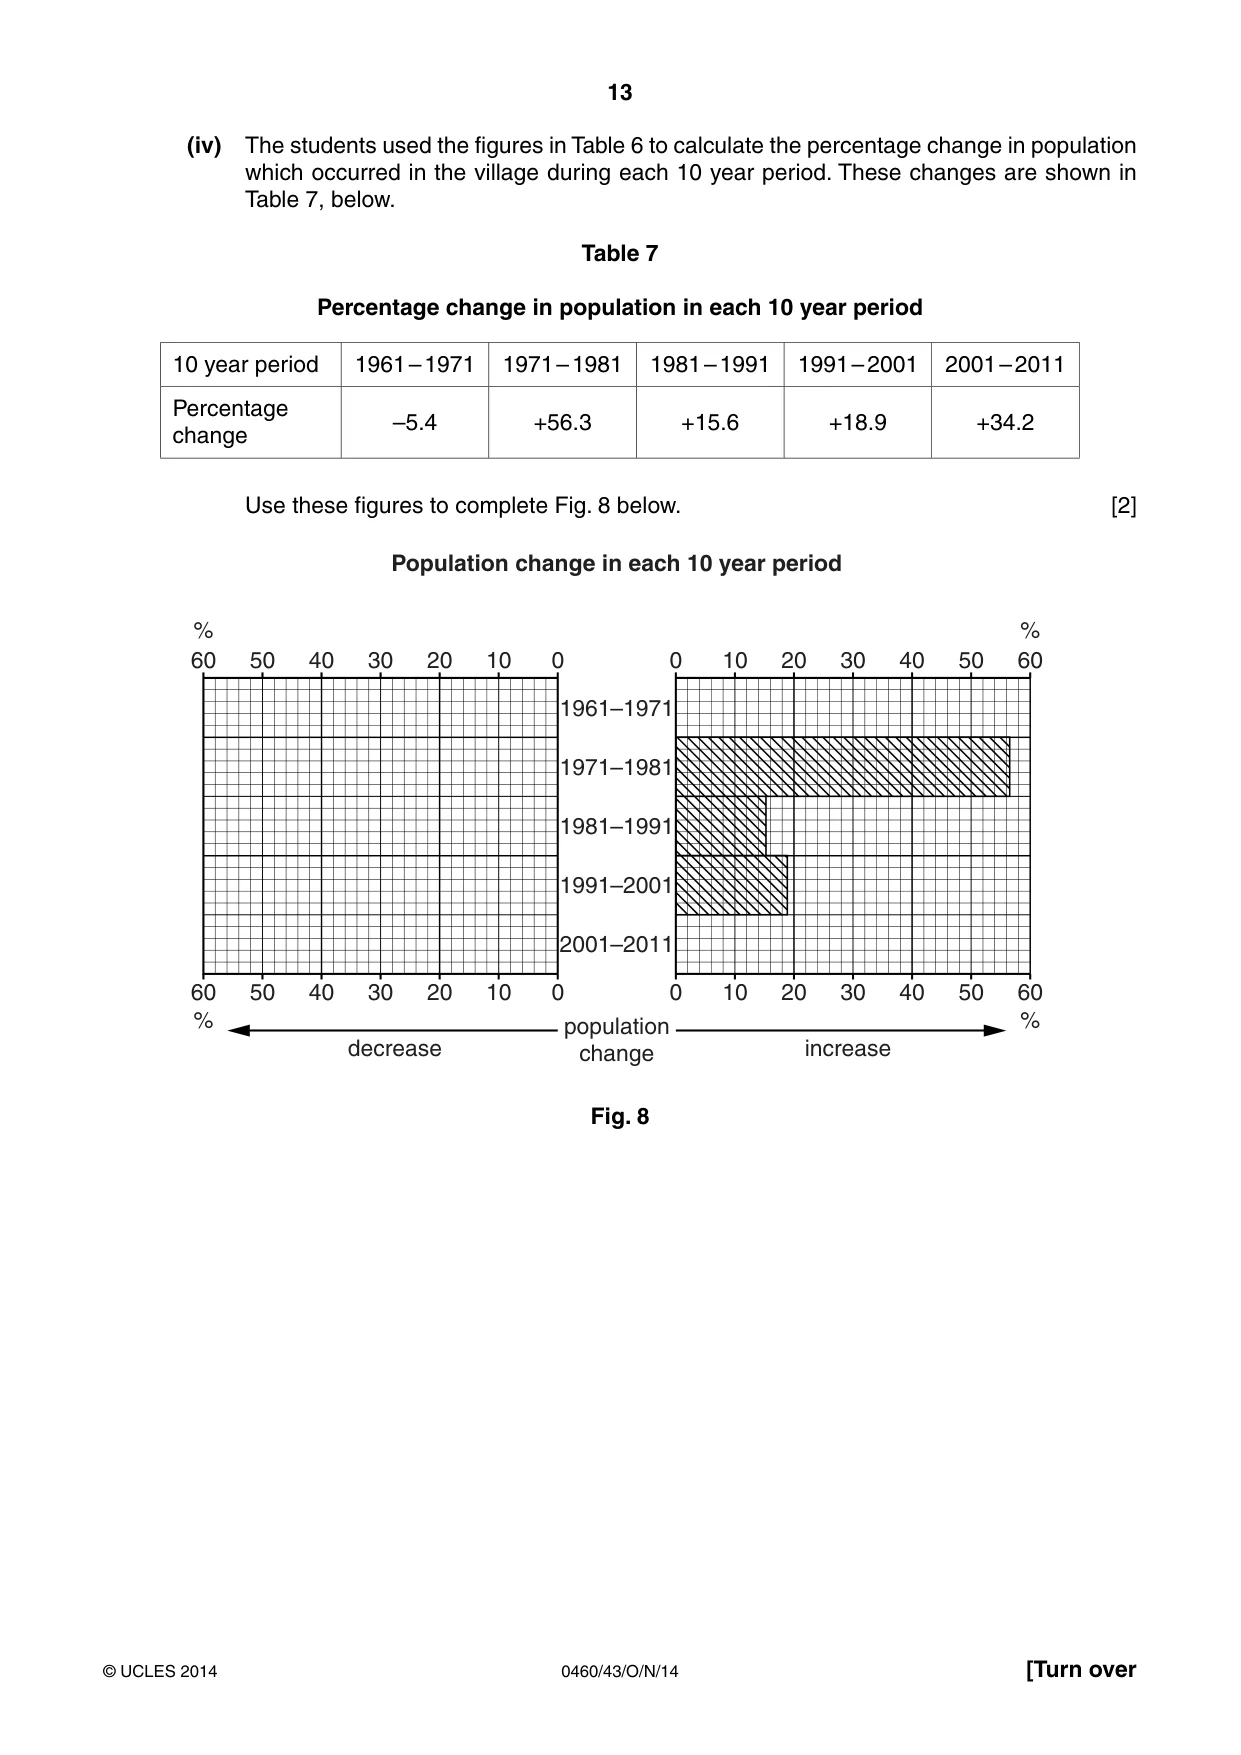
13 0460/43/O/N/14 © UCLES 2014 [Turn over (iv) The students used the figures in Table 6 to calculate the percentage change in population which occurred in the village during each 10 year period. These changes are shown in Table 7, below. Table 7 Percentage change in population in each 10 year period 10 year period 1961 – 1971 1971 – 1981 1981 – 1991 1991 – 2001 2001 – 2011 Percentage change –5.4 +56.3 +15.6 +18.9 +34.2 Use these figures to complete Fig. 8 below. [2] 60 50 40 30 20 10 population change increase decrease 0 0 10 20 30 40 50 60 60 50 40 30 20 10 0 10 20 30 40 50 60 % % % % 0 2001–2011 1991–2001 1981–1991 1961–1971 Population change in each 10 year period 1971–1981 Fig. 8
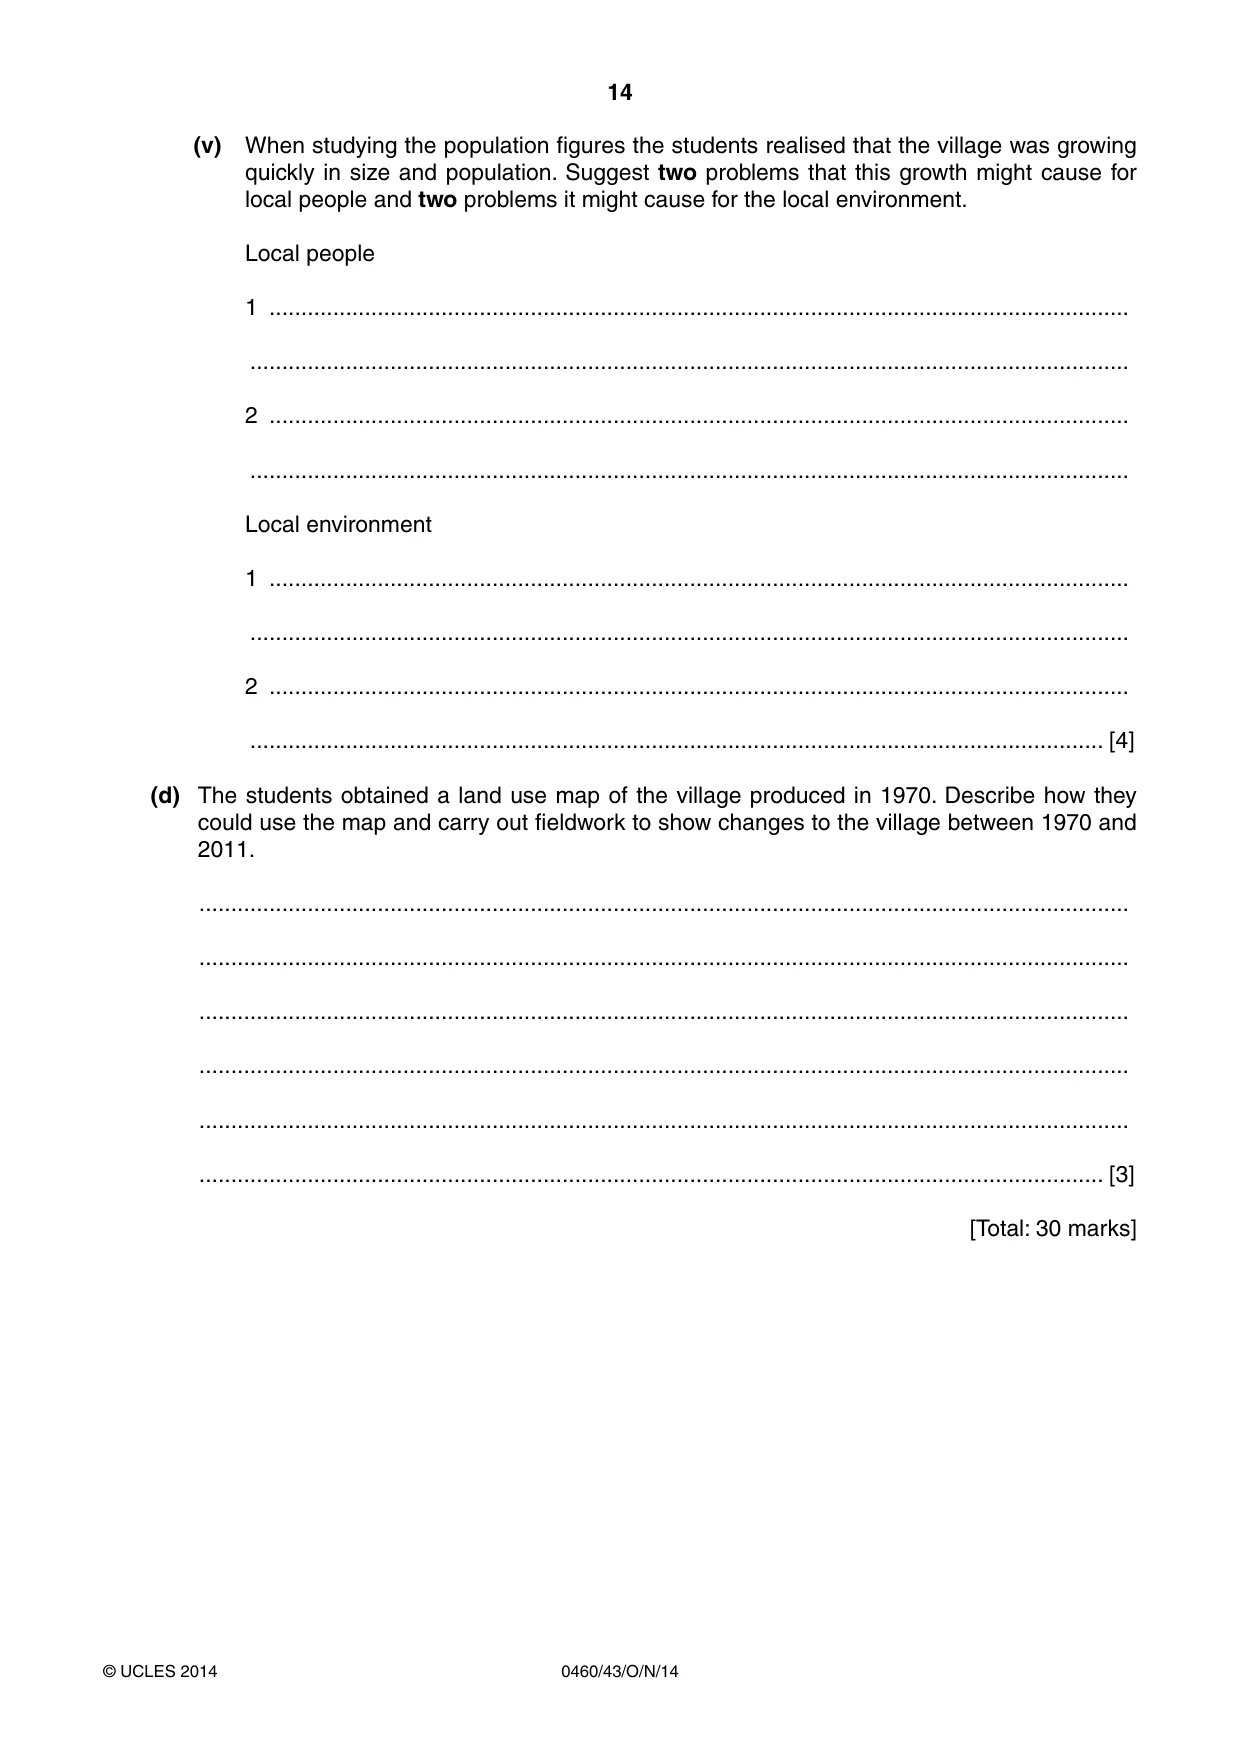
Question paper, page 14
14 0460/43/O/N/14 © UCLES 2014 (v) When studying the population figures the students realised that the village was growing quickly in size and population. Suggest two problems that this growth might cause for local people and two problems it might cause for the local environment. Local people 1 … … 2 … … Local environment 1 … … 2 … … [4] (d) The students obtained a land use map of the village produced in 1970. Describe how they could use the map and carry out fieldwork to show changes to the village between 1970 and 2011. … … … … … … [3] [Total: 30 marks]
Question paper, page 15
15 0460/43/O/N/14 © UCLES 2014 BLANK PAGE
Question paper, page 16
16 0460/43/O/N/14 © UCLES 2014 Permission to reproduce items where third-party owned material protected by copyright is included has been sought and cleared where possible. Every reasonable effort has been made by the publisher (UCLES) to trace copyright holders, but if any items requiring clearance have unwittingly been included, the publisher will be pleased to make amends at the earliest possible opportunity. Cambridge International Examinations is part of the Cambridge Assessment Group. Cambridge Assessment is the brand name of University of Cambridge Local Examinations Syndicate (UCLES), which is itself a department of the University of Cambridge. BLANK PAGE
Mark scheme, page 1
® IGCSE is the registered trademark of Cambridge International Examinations. CAMBRIDGE INTERNATIONAL EXAMINATIONS Cambridge International General Certificate of Secondary Education MARK SCHEME for the October/November 2014 series 0460 GEOGRAPHY 0460/43 Paper 4 (Alternative to Coursework), maximum raw mark 60 This mark scheme is published as an aid to teachers and candidates, to indicate the requirements of the examination. It shows the basis on which Examiners were instructed to award marks. It does not indicate the details of the discussions that took place at an Examiners’ meeting before marking began, which would have considered the acceptability of alternative answers. Mark schemes should be read in conjunction with the question paper and the Principal Examiner Report for Teachers. Cambridge will not enter into discussions about these mark schemes. Cambridge is publishing the mark schemes for the October/November 2014 series for most Cambridge IGCSE®, Cambridge International A and AS Level components and some Cambridge O Level components.
Mark scheme, page 2
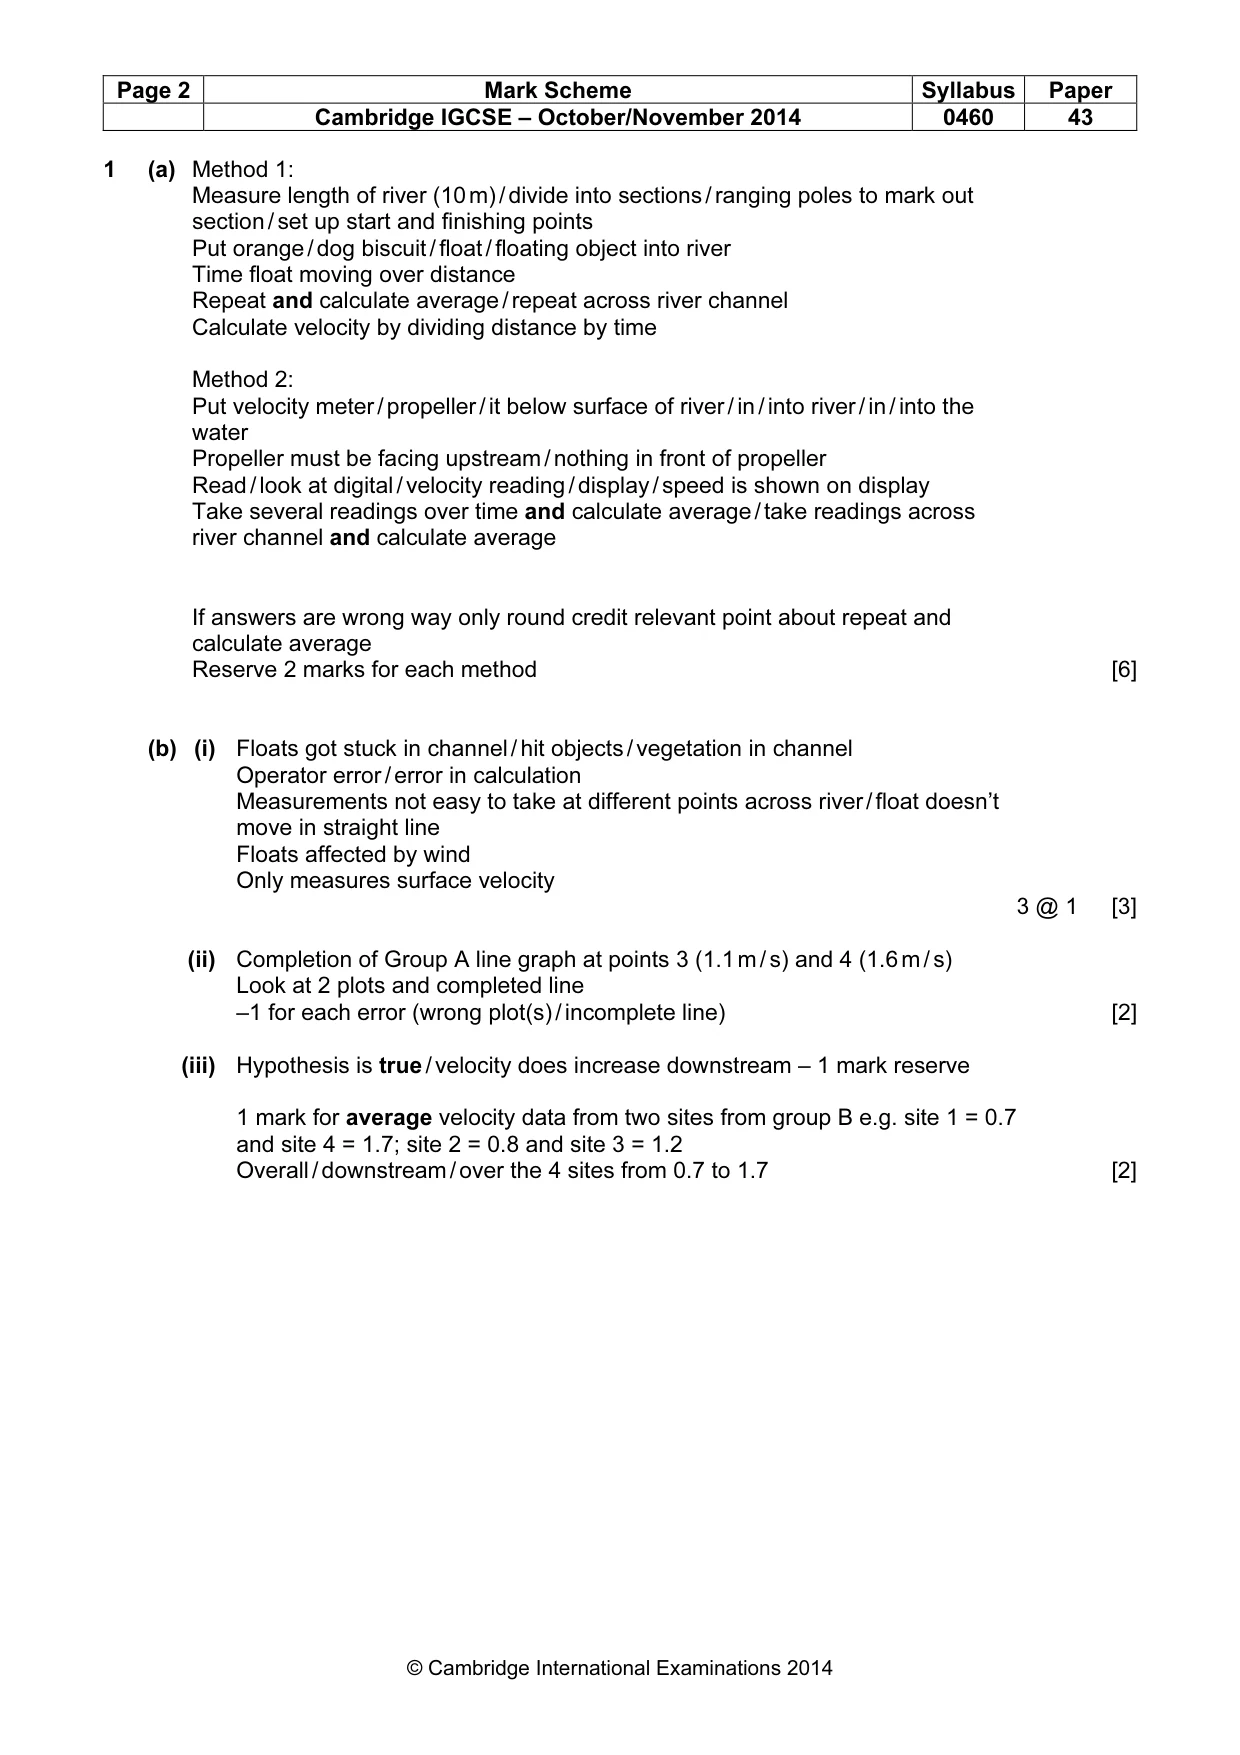
Page 2 Mark Scheme Syllabus Paper Cambridge IGCSE – October/November 2014 0460 43 © Cambridge International Examinations 2014 1 (a) Method 1: Measure length of river (10 m) / divide into sections / ranging poles to mark out section / set up start and finishing points Put orange / dog biscuit / float / floating object into river Time float moving over distance Repeat and calculate average / repeat across river channel Calculate velocity by dividing distance by time Method 2: Put velocity meter / propeller / it below surface of river / in / into river / in / into the water Propeller must be facing upstream / nothing in front of propeller Read / look at digital / velocity reading / display / speed is shown on display Take several readings over time and calculate average / take readings across river channel and calculate average If answers are wrong way only round credit relevant point about repeat and calculate average Reserve 2 marks for each method [6] (b) (i) Floats got stuck in channel / hit objects / vegetation in channel Operator error / error in calculation Measurements not easy to take at different points across river / float doesn’t move in straight line Floats affected by wind Only measures surface velocity 3 @ 1 [3] (ii) Completion of Group A line graph at points 3 (1.1 m / s) and 4 (1.6 m / s) Look at 2 plots and completed line –1 for each error (wrong plot(s) / incomplete line) [2] (iii) Hypothesis is true / velocity does increase downstream – 1 mark reserve 1 mark for average velocity data from two sites from group B e.g. site 1 = 0.7 and site 4 = 1.7; site 2 = 0.8 and site 3 = 1.2 Overall / downstream / over the 4 sites from 0.7 to 1.7 [2]
Mark scheme, page 3
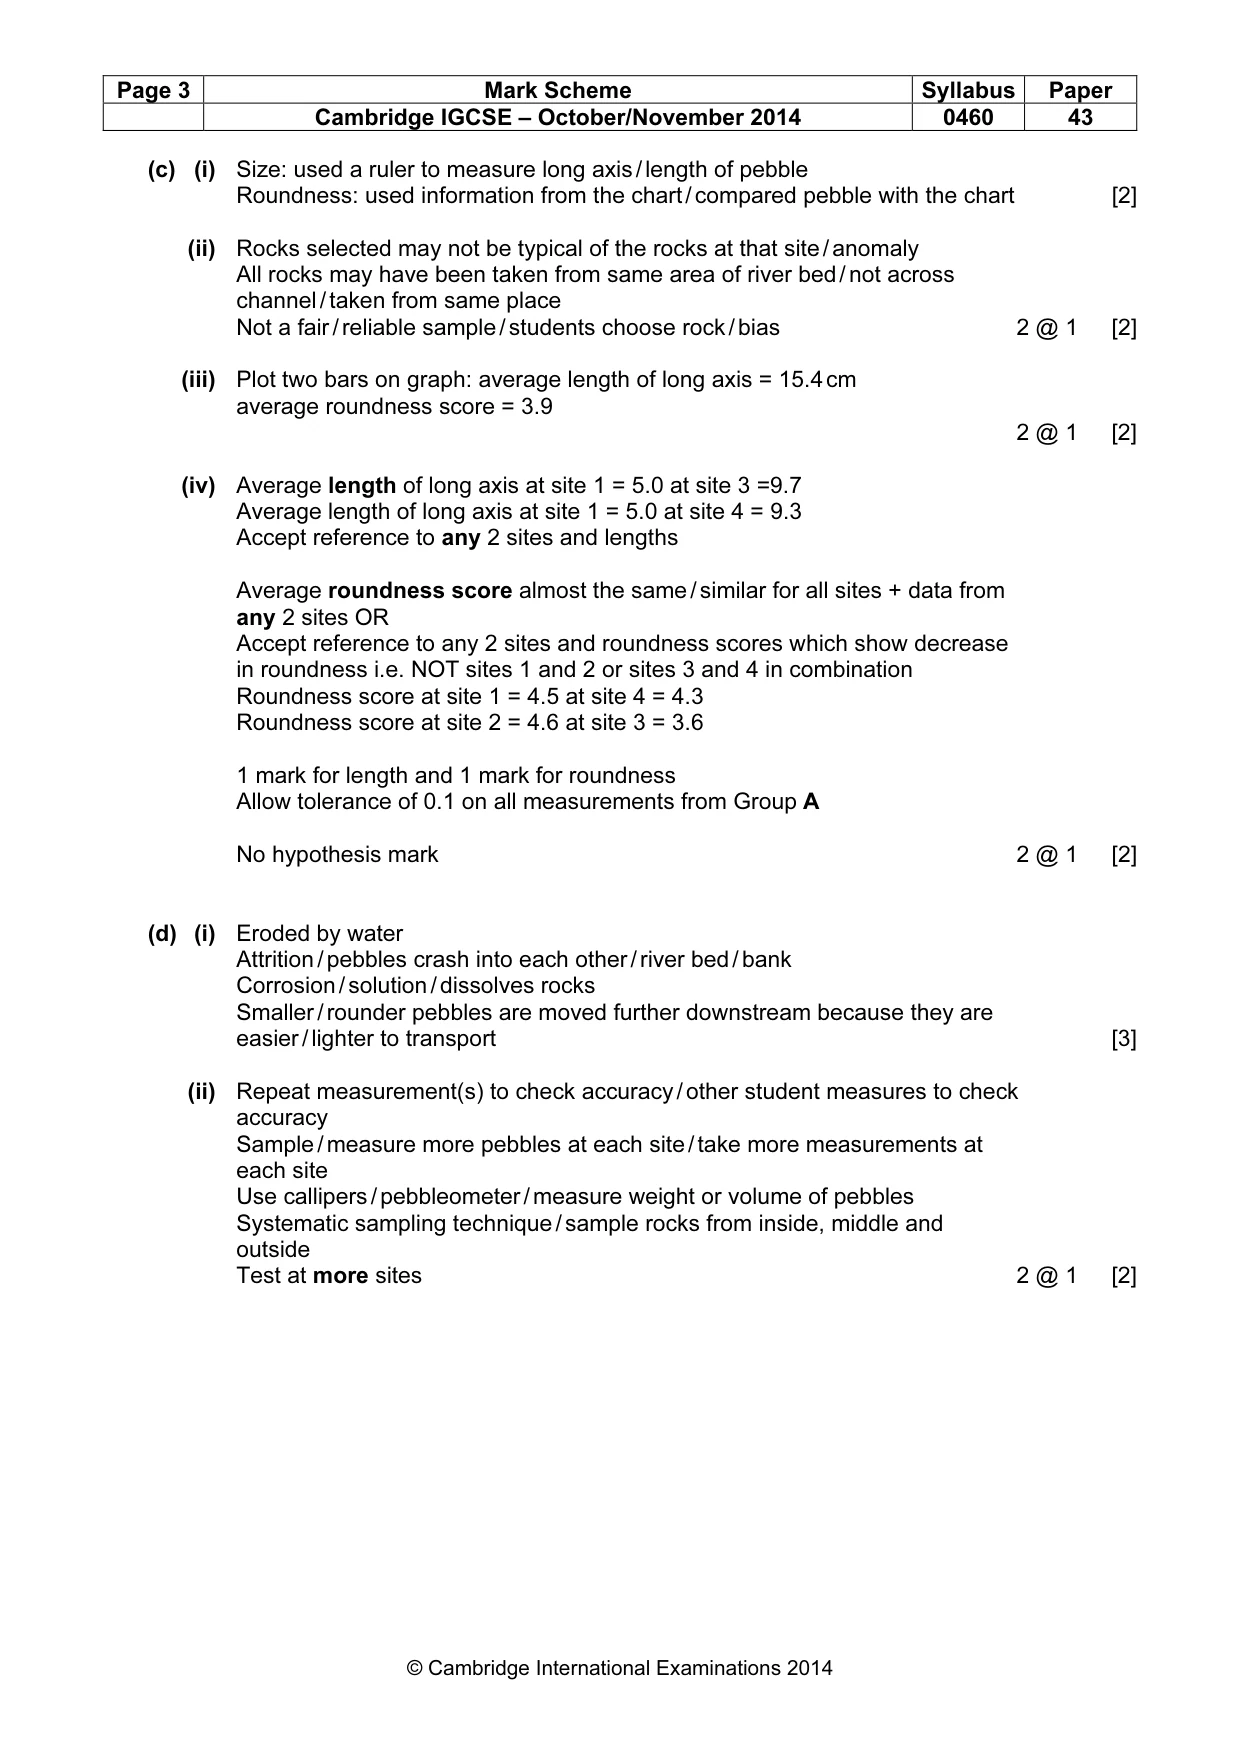
Page 3 Mark Scheme Syllabus Paper Cambridge IGCSE – October/November 2014 0460 43 © Cambridge International Examinations 2014 (c) (i) Size: used a ruler to measure long axis / length of pebble Roundness: used information from the chart / compared pebble with the chart [2] (ii) Rocks selected may not be typical of the rocks at that site / anomaly All rocks may have been taken from same area of river bed / not across channel / taken from same place Not a fair / reliable sample / students choose rock / bias 2 @ 1 [2] (iii) Plot two bars on graph: average length of long axis = 15.4 cm average roundness score = 3.9 2 @ 1 [2] (iv) Average length of long axis at site 1 = 5.0 at site 3 =9.7 Average length of long axis at site 1 = 5.0 at site 4 = 9.3 Accept reference to any 2 sites and lengths Average roundness score almost the same / similar for all sites + data from any 2 sites OR Accept reference to any 2 sites and roundness scores which show decrease in roundness i.e. NOT sites 1 and 2 or sites 3 and 4 in combination Roundness score at site 1 = 4.5 at site 4 = 4.3 Roundness score at site 2 = 4.6 at site 3 = 3.6 1 mark for length and 1 mark for roundness Allow tolerance of 0.1 on all measurements from Group A No hypothesis mark 2 @ 1 [2] (d) (i) Eroded by water Attrition / pebbles crash into each other / river bed / bank Corrosion / solution / dissolves rocks Smaller / rounder pebbles are moved further downstream because they are easier / lighter to transport [3] (ii) Repeat measurement(s) to check accuracy / other student measures to check accuracy Sample / measure more pebbles at each site / take more measurements at each site Use callipers / pebbleometer / measure weight or volume of pebbles Systematic sampling technique / sample rocks from inside, middle and outside Test at more sites 2 @ 1 [2]
Mark scheme, page 4
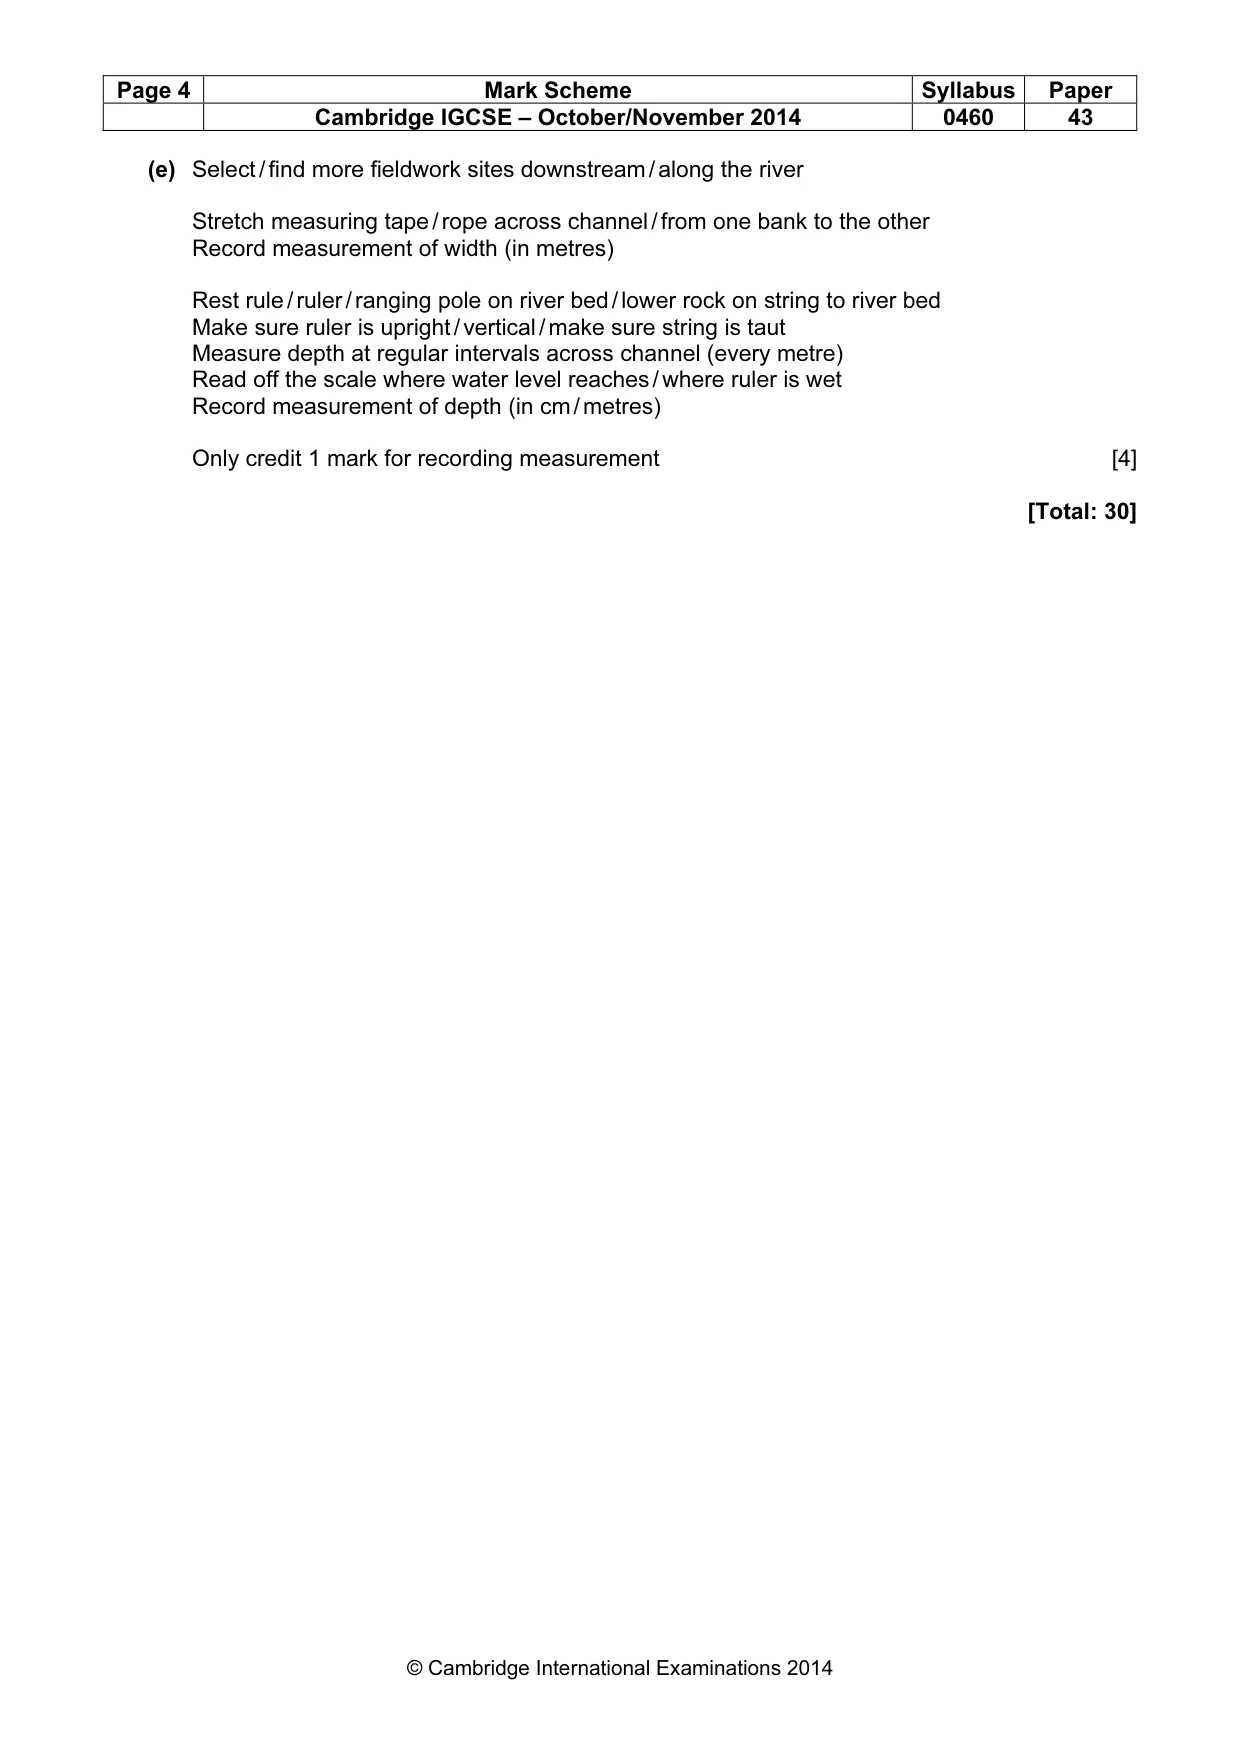
Page 4 Mark Scheme Syllabus Paper Cambridge IGCSE – October/November 2014 0460 43 © Cambridge International Examinations 2014 (e) Select / find more fieldwork sites downstream / along the river Stretch measuring tape / rope across channel / from one bank to the other Record measurement of width (in metres) Rest rule / ruler / ranging pole on river bed / lower rock on string to river bed Make sure ruler is upright / vertical / make sure string is taut Measure depth at regular intervals across channel (every metre) Read off the scale where water level reaches / where ruler is wet Record measurement of depth (in cm / metres) Only credit 1 mark for recording measurement [4] [Total: 30]
Mark scheme, page 5
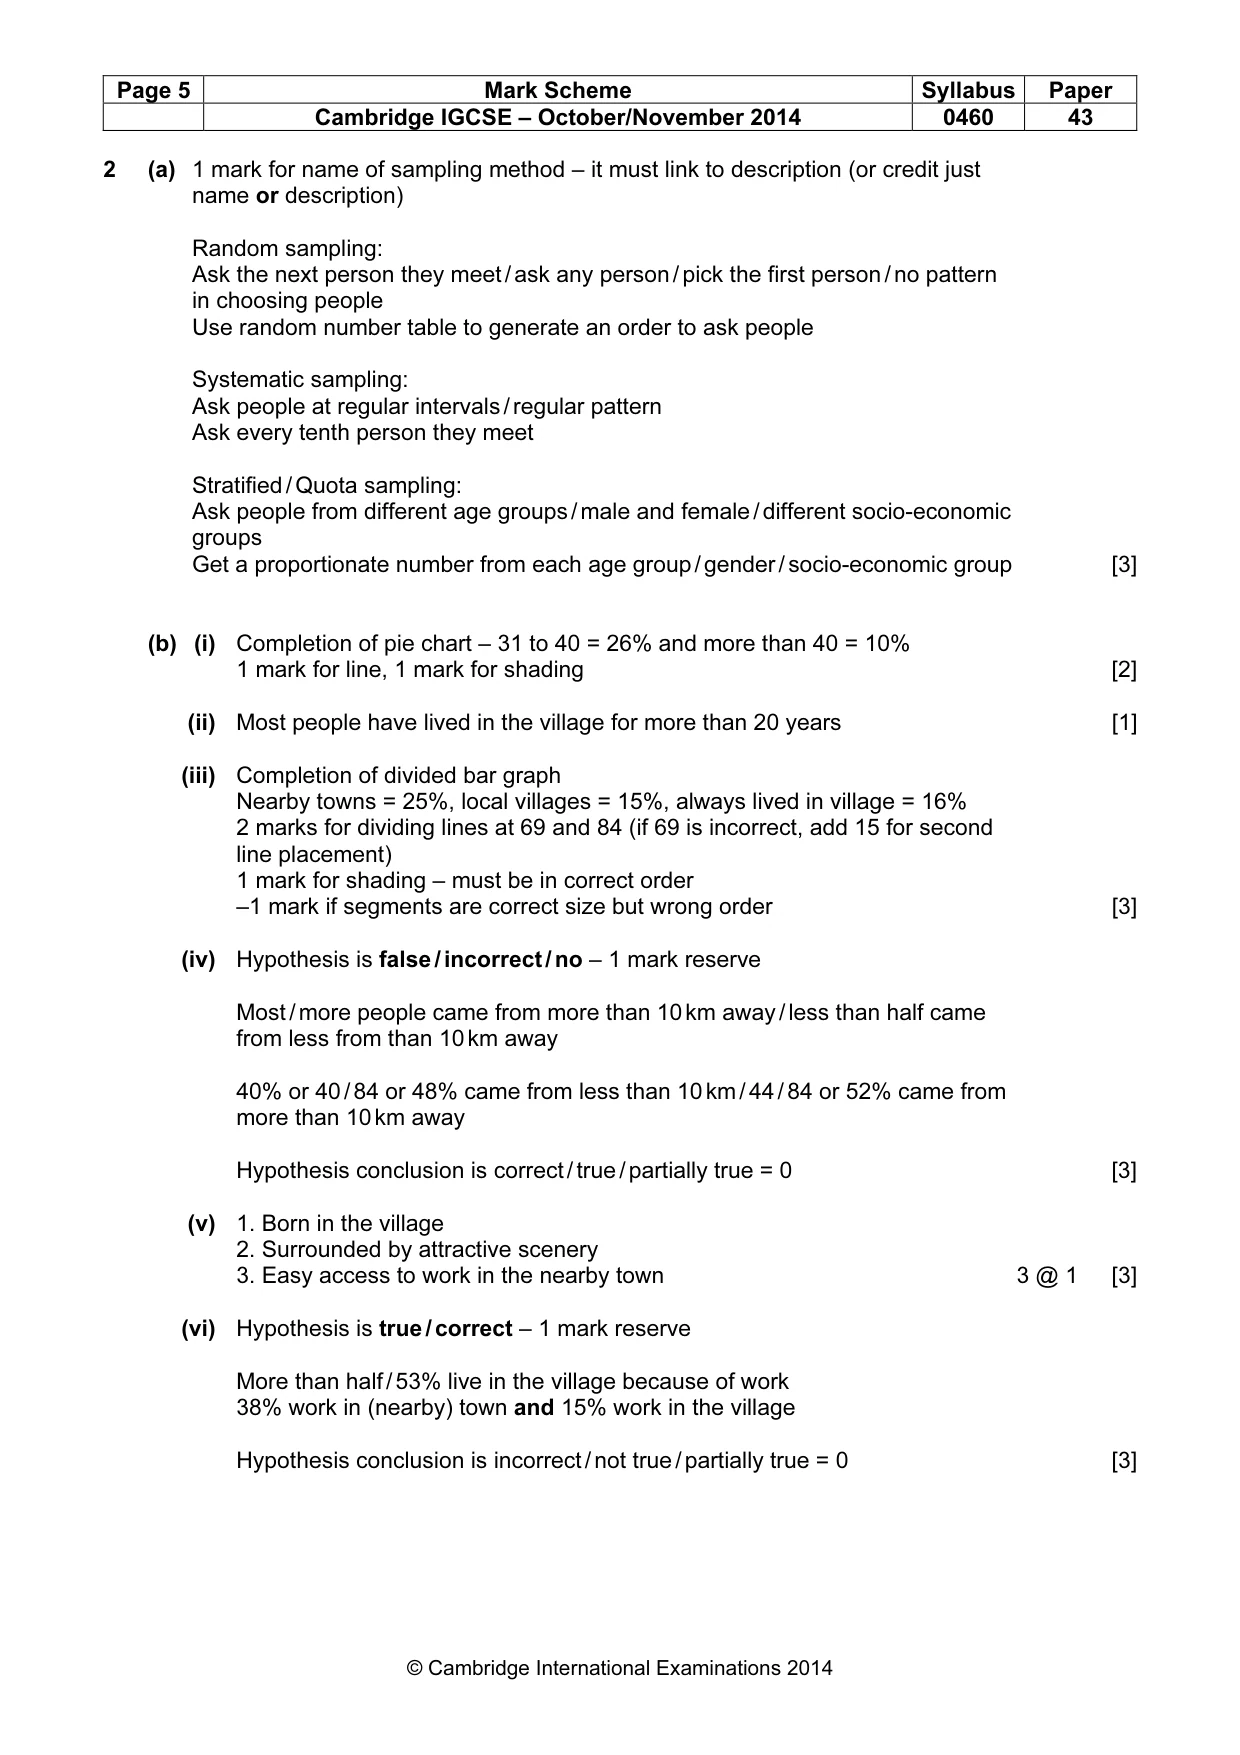
Page 5 Mark Scheme Syllabus Paper Cambridge IGCSE – October/November 2014 0460 43 © Cambridge International Examinations 2014 2 (a) 1 mark for name of sampling method – it must link to description (or credit just name or description) Random sampling: Ask the next person they meet / ask any person / pick the first person / no pattern in choosing people Use random number table to generate an order to ask people Systematic sampling: Ask people at regular intervals / regular pattern Ask every tenth person they meet Stratified / Quota sampling: Ask people from different age groups / male and female / different socio-economic groups Get a proportionate number from each age group / gender / socio-economic group [3] (b) (i) Completion of pie chart – 31 to 40 = 26% and more than 40 = 10% 1 mark for line, 1 mark for shading [2] (ii) Most people have lived in the village for more than 20 years [1] (iii) Completion of divided bar graph Nearby towns = 25%, local villages = 15%, always lived in village = 16% 2 marks for dividing lines at 69 and 84 (if 69 is incorrect, add 15 for second line placement) 1 mark for shading – must be in correct order –1 mark if segments are correct size but wrong order [3] (iv) Hypothesis is false / incorrect / no – 1 mark reserve Most / more people came from more than 10 km away / less than half came from less from than 10 km away 40% or 40 / 84 or 48% came from less than 10 km / 44 / 84 or 52% came from more than 10 km away Hypothesis conclusion is correct / true / partially true = 0 [3] (v) 1. Born in the village 2. Surrounded by attractive scenery 3. Easy access to work in the nearby town 3 @ 1 [3] (vi) Hypothesis is true / correct – 1 mark reserve More than half / 53% live in the village because of work 38% work in (nearby) town and 15% work in the village Hypothesis conclusion is incorrect / not true / partially true = 0 [3]
Mark scheme, page 6
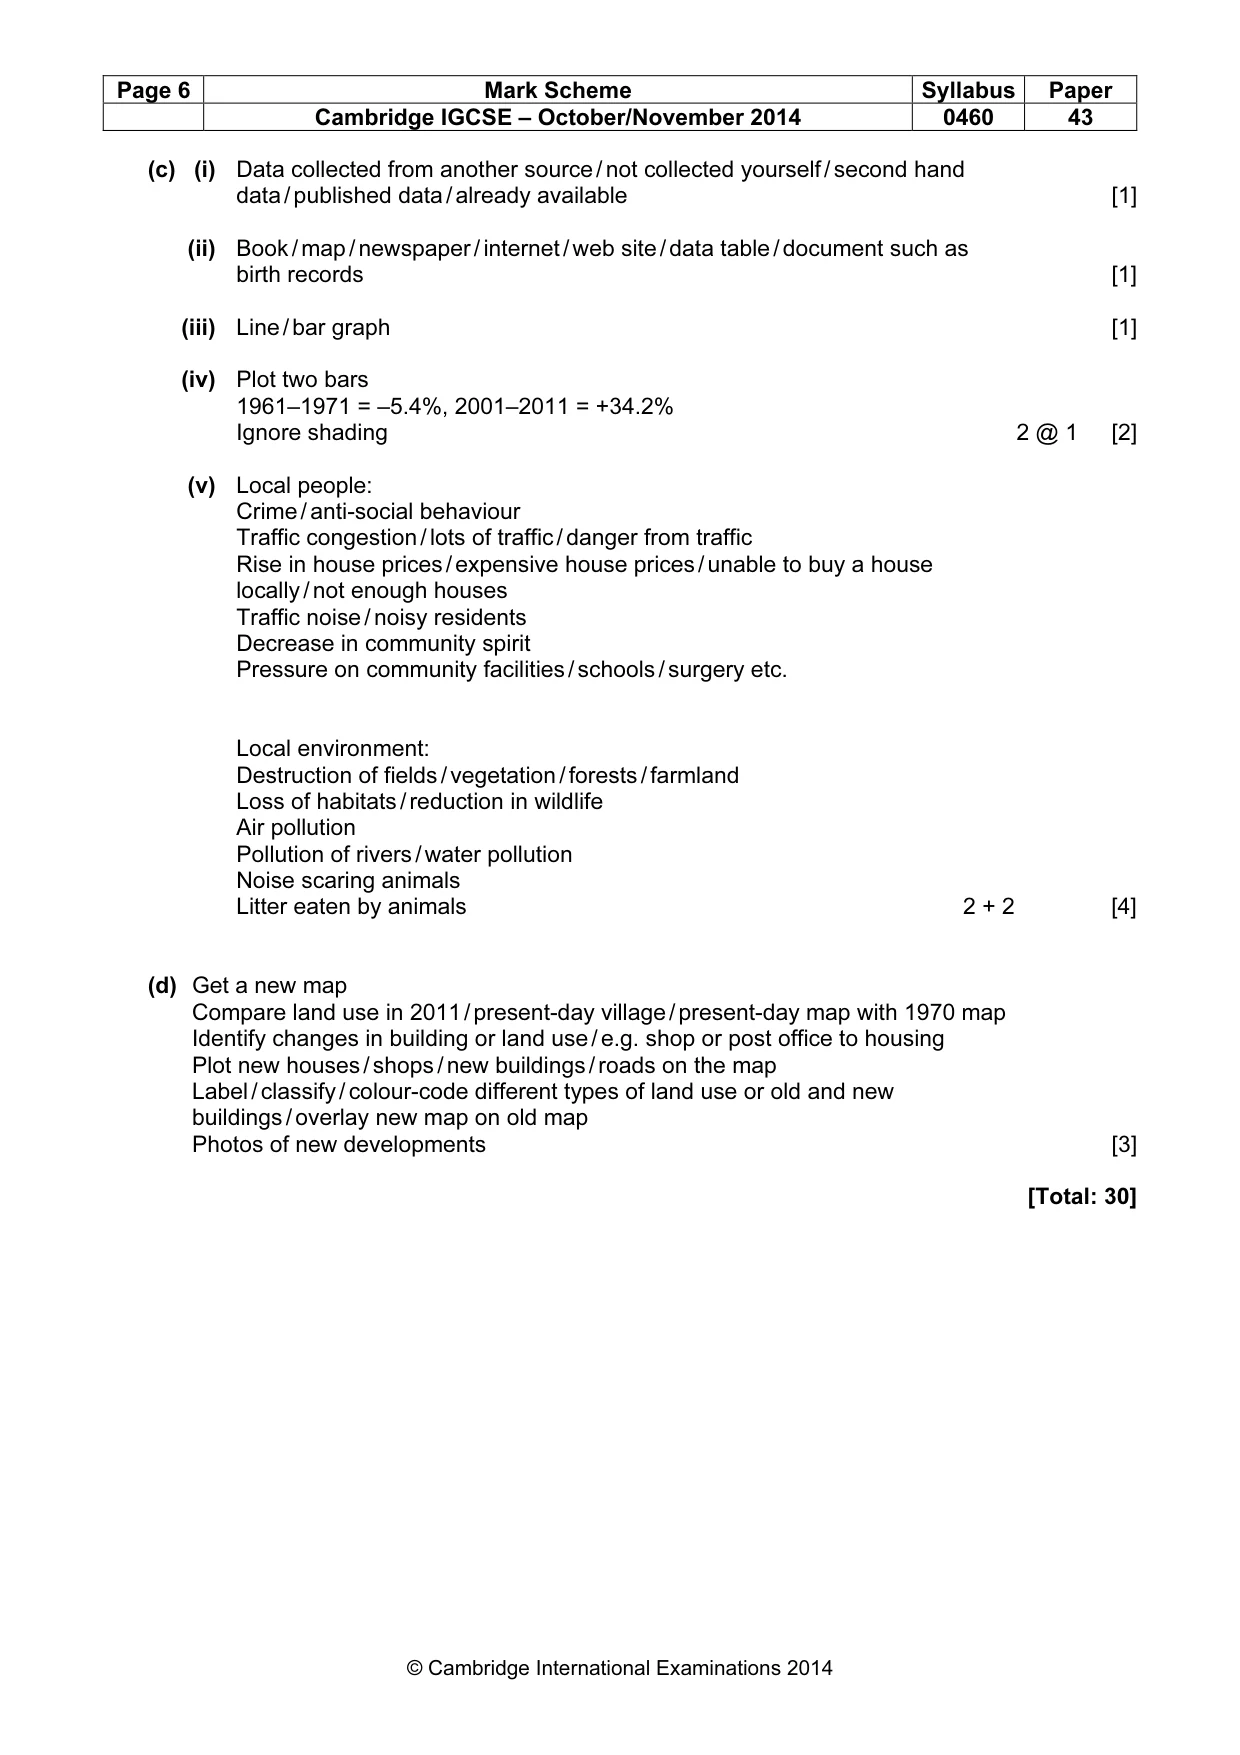
Page 6 Mark Scheme Syllabus Paper Cambridge IGCSE – October/November 2014 0460 43 © Cambridge International Examinations 2014 (c) (i) Data collected from another source / not collected yourself / second hand data / published data / already available [1] (ii) Book / map / newspaper / internet / web site / data table / document such as birth records [1] (iii) Line / bar graph [1] (iv) Plot two bars 1961–1971 = –5.4%, 2001–2011 = +34.2% Ignore shading 2 @ 1 [2] (v) Local people: Crime / anti-social behaviour Traffic congestion / lots of traffic / danger from traffic Rise in house prices / expensive house prices / unable to buy a house locally / not enough houses Traffic noise / noisy residents Decrease in community spirit Pressure on community facilities / schools / surgery etc. Local environment: Destruction of fields / vegetation / forests / farmland Loss of habitats / reduction in wildlife Air pollution Pollution of rivers / water pollution Noise scaring animals Litter eaten by animals 2 + 2 [4] (d) Get a new map Compare land use in 2011 / present-day village / present-day map with 1970 map Identify changes in building or land use / e.g. shop or post office to housing Plot new houses / shops / new buildings / roads on the map Label / classify / colour-code different types of land use or old and new buildings / overlay new map on old map Photos of new developments [3] [Total: 30]
What you needed in this session
Cambridge’s own grade thresholds for 2014 Oct/Nov, Paper 4 · Variant 3. A higher threshold means an easier paper — the bar moves with how the cohort did.