Cambridge IGCSE Geography 0460 — 2014 Oct/Nov Paper 4 · Variant 2
0460/42/O/N/14 · 60 marks · ≈68 min
The question paper and its mark scheme, free to read here and free to download. This is Cambridge’s own paper, exactly as it was sat.
Question paper12 pages
Mark scheme8 pages
Answers below. Sit the paper first if you are practising.
Paper as text
Question paper, page 1
This document consists of 12 printed pages and 1 Insert. DC (NH/CGW) 80398/6 © UCLES 2014 [Turn over * 5 6 3 6 9 0 8 7 0 9 * GEOGRAPHY 0460/42 Paper 4 Alternative to Coursework October/November 2014 1 hour 30 minutes Candidates answer on the Question Paper. Additional Materials: Ruler Calculator Protractor READ THESE INSTRUCTIONS FIRST Write your Centre number, candidate number and name in the spaces provided. Write in dark blue or black pen. You may use an HB pencil for any diagrams or graphs. Do not use staples, paper clips, glue or correction fluid. DO NOT WRITE IN ANY BARCODES. Answer all questions. The Insert contains Figs 1 and 2 and Table 1 for Question 1, and Fig. 6 and Tables 3 and 5 for Question 2. The Insert is not required by the Examiner. Sketch maps and diagrams should be drawn whenever they serve to illustrate an answer. At the end of the examination, fasten all your work securely together. The number of marks is given in brackets [ ] at the end of each question or part question. Cambridge International Examinations Cambridge International General Certificate of Secondary Education The syllabus is approved for use in England, Wales and Northern Ireland as a Cambridge International Level 1/Level 2 Certificate.
Question paper, page 2
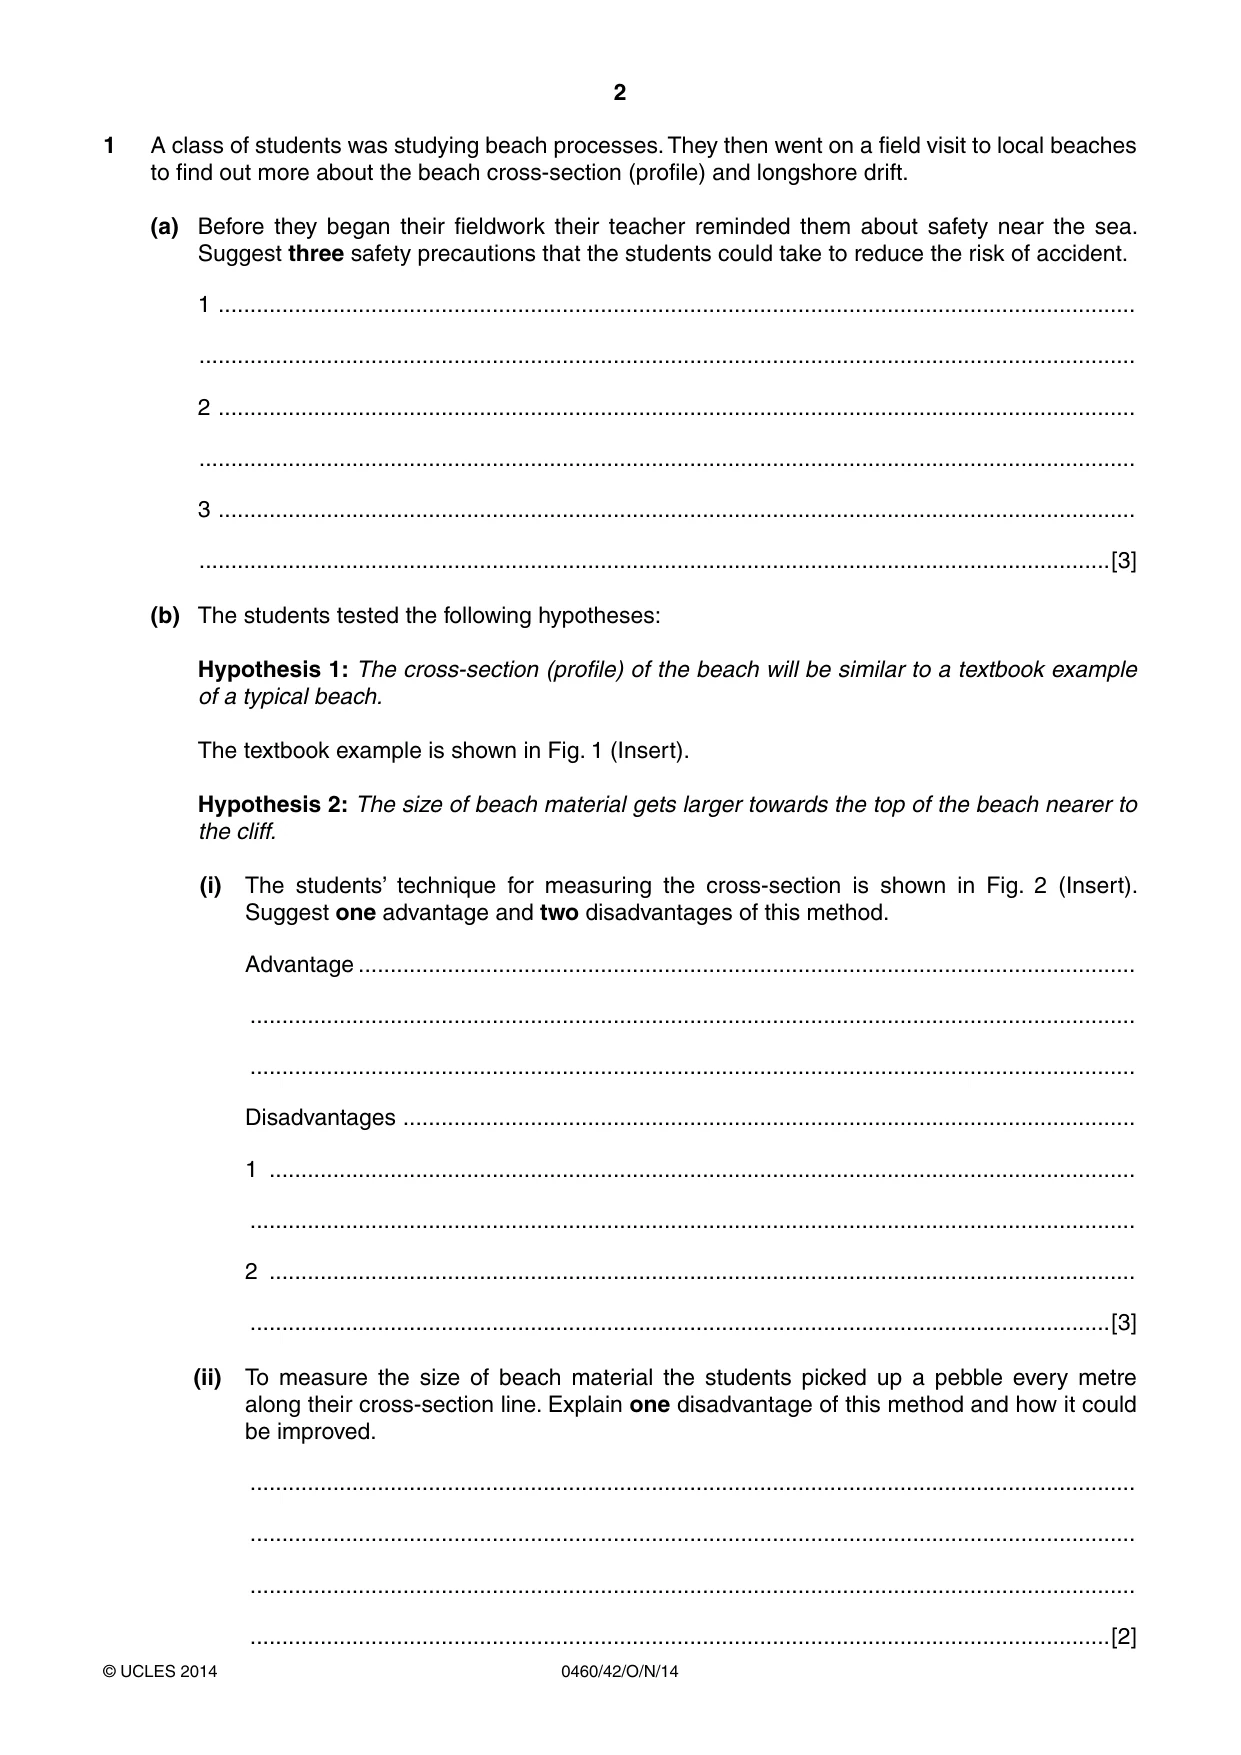
2 0460/42/O/N/14 © UCLES 2014 1 A class of students was studying beach processes. They then went on a field visit to local beaches to find out more about the beach cross-section (profile) and longshore drift. (a) Before they began their fieldwork their teacher reminded them about safety near the sea. Suggest three safety precautions that the students could take to reduce the risk of accident. 1 … … 2 … … 3 … …[3] (b) The students tested the following hypotheses: Hypothesis 1: The cross-section (profile) of the beach will be similar to a textbook example of a typical beach. The textbook example is shown in Fig. 1 (Insert). Hypothesis 2: The size of beach material gets larger towards the top of the beach nearer to the cliff. (i) The students’ technique for measuring the cross-section is shown in Fig. 2 (Insert). Suggest one advantage and two disadvantages of this method. Advantage … … … Disadvantages … 1 … … 2 … …[3] (ii) To measure the size of beach material the students picked up a pebble every metre along their cross-section line. Explain one disadvantage of this method and how it could be improved. … … … …[2]
Question paper, page 3
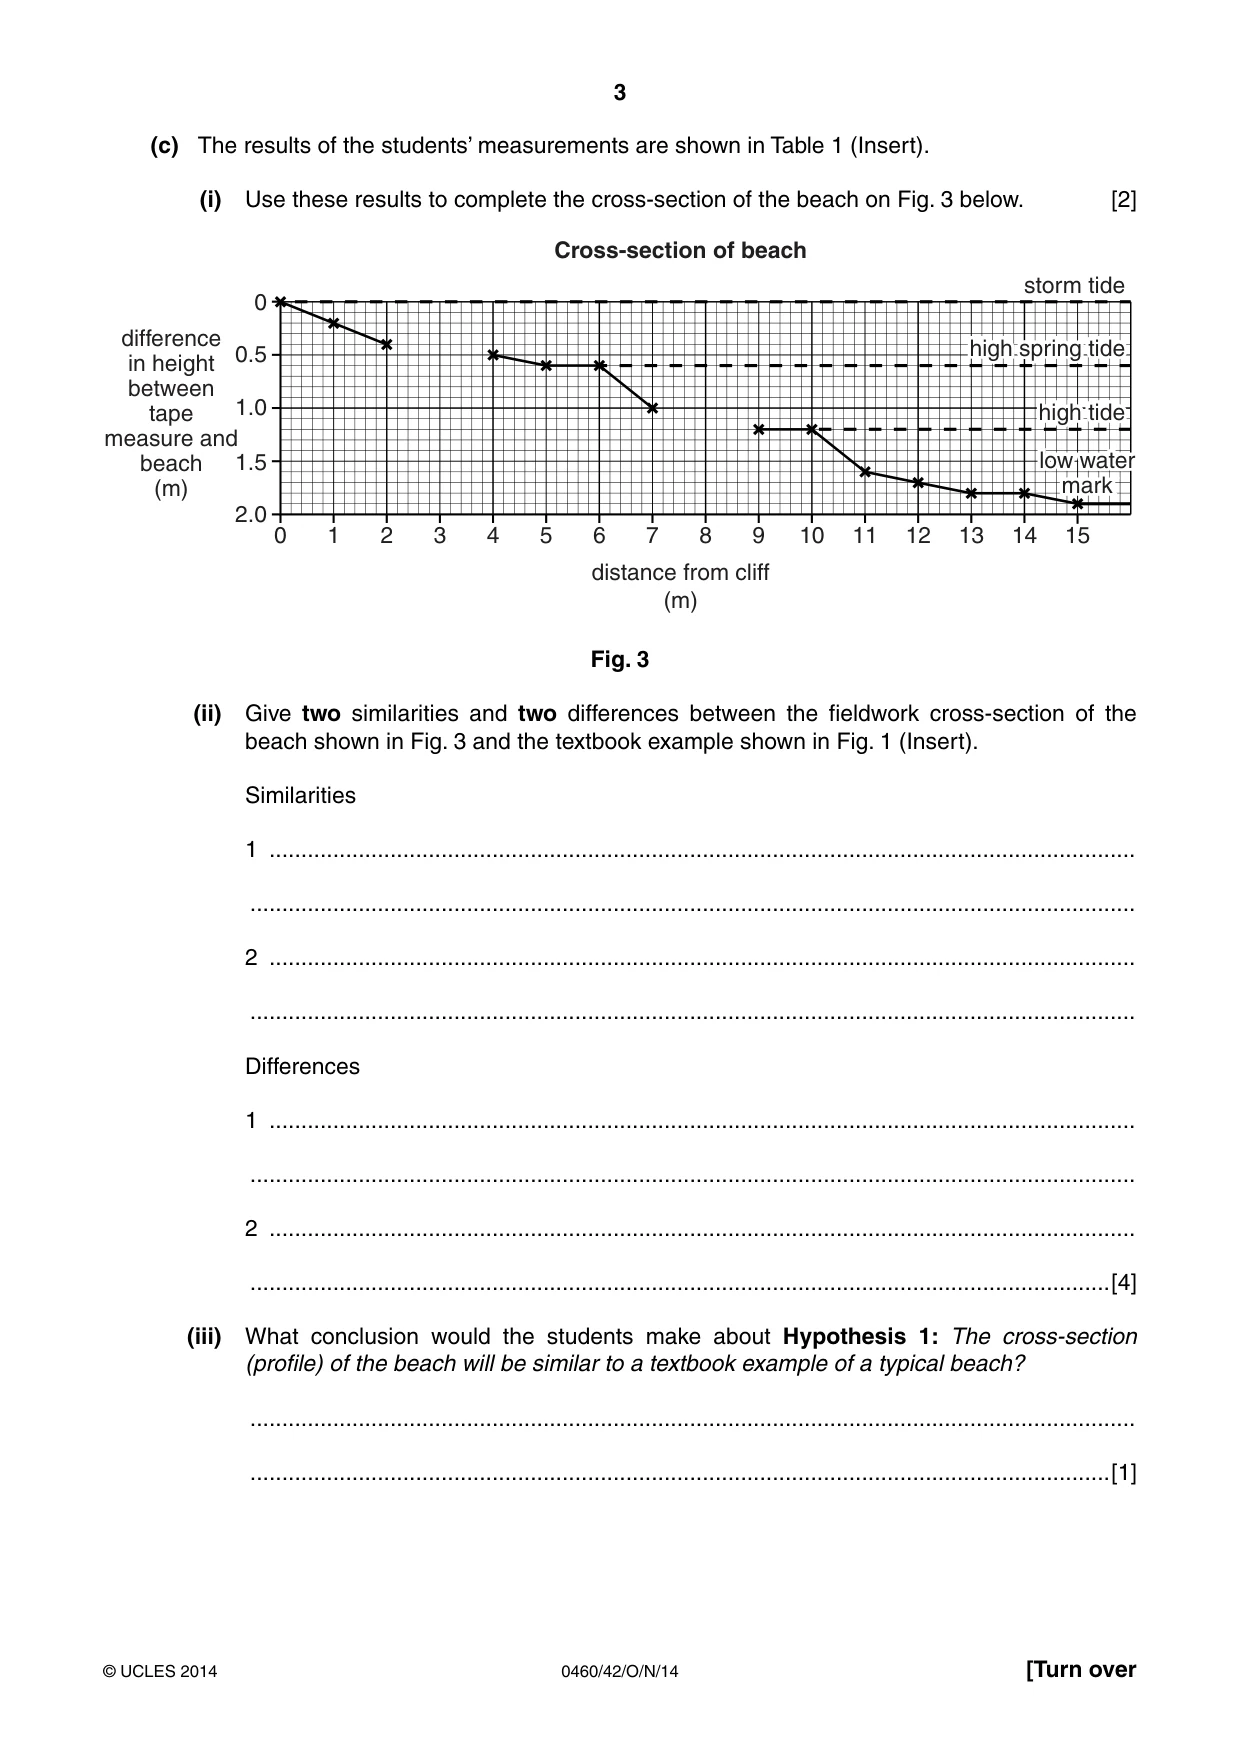
3 0460/42/O/N/14 © UCLES 2014 [Turn over (c) The results of the students’ measurements are shown in Table 1 (Insert). (i) Use these results to complete the cross-section of the beach on Fig. 3 below. [2] 2.0 0 1 2 3 4 5 6 7 8 distance from cliff (m) Cross-section of beach 9 10 11 12 13 14 15 1.5 1.0 difference in height between tape measure and beach (m) 0.5 storm tide high tide high tide low water mark high spring tide high spring tide 0 low water mark Fig. 3 (ii) Give two similarities and two differences between the fieldwork cross-section of the beach shown in Fig. 3 and the textbook example shown in Fig. 1 (Insert). Similarities 1 … … 2 … … Differences 1 … … 2 … …[4] (iii) What conclusion would the students make about Hypothesis 1: The cross-section (profile) of the beach will be similar to a textbook example of a typical beach? … …[1]
Question paper, page 4
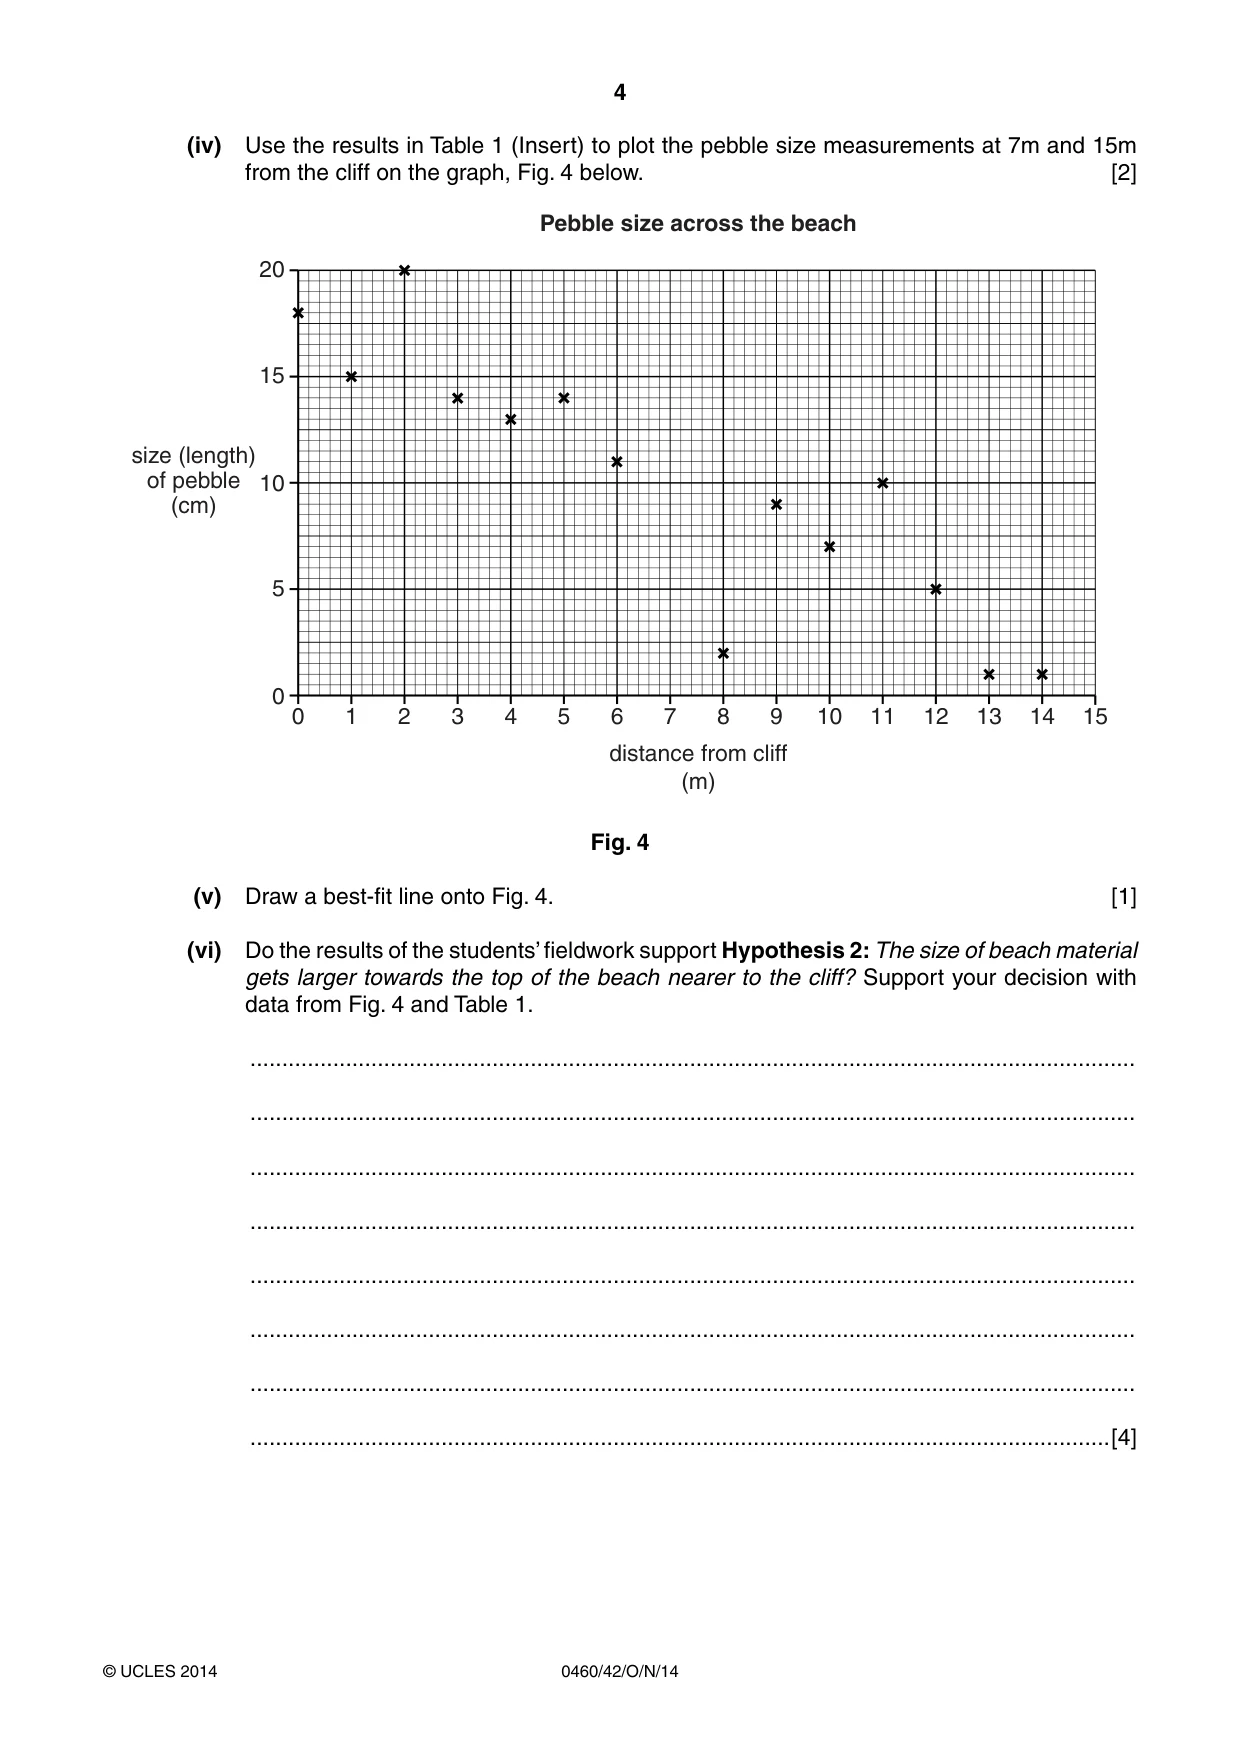
4 0460/42/O/N/14 © UCLES 2014 (iv) Use the results in Table 1 (Insert) to plot the pebble size measurements at 7m and 15m from the cliff on the graph, Fig. 4 below. [2] 0 0 1 2 3 4 5 6 7 8 distance from cliff (m) Pebble size across the beach 9 10 11 12 13 14 15 5 15 20 size (length) of pebble (cm) 10 Fig. 4 (v) Draw a best-fit line onto Fig. 4. [1] (vi) Do the results of the students’ fieldwork support Hypothesis 2: The size of beach material gets larger towards the top of the beach nearer to the cliff? Support your decision with data from Fig. 4 and Table 1. … … … … … … … …[4]
Question paper, page 5
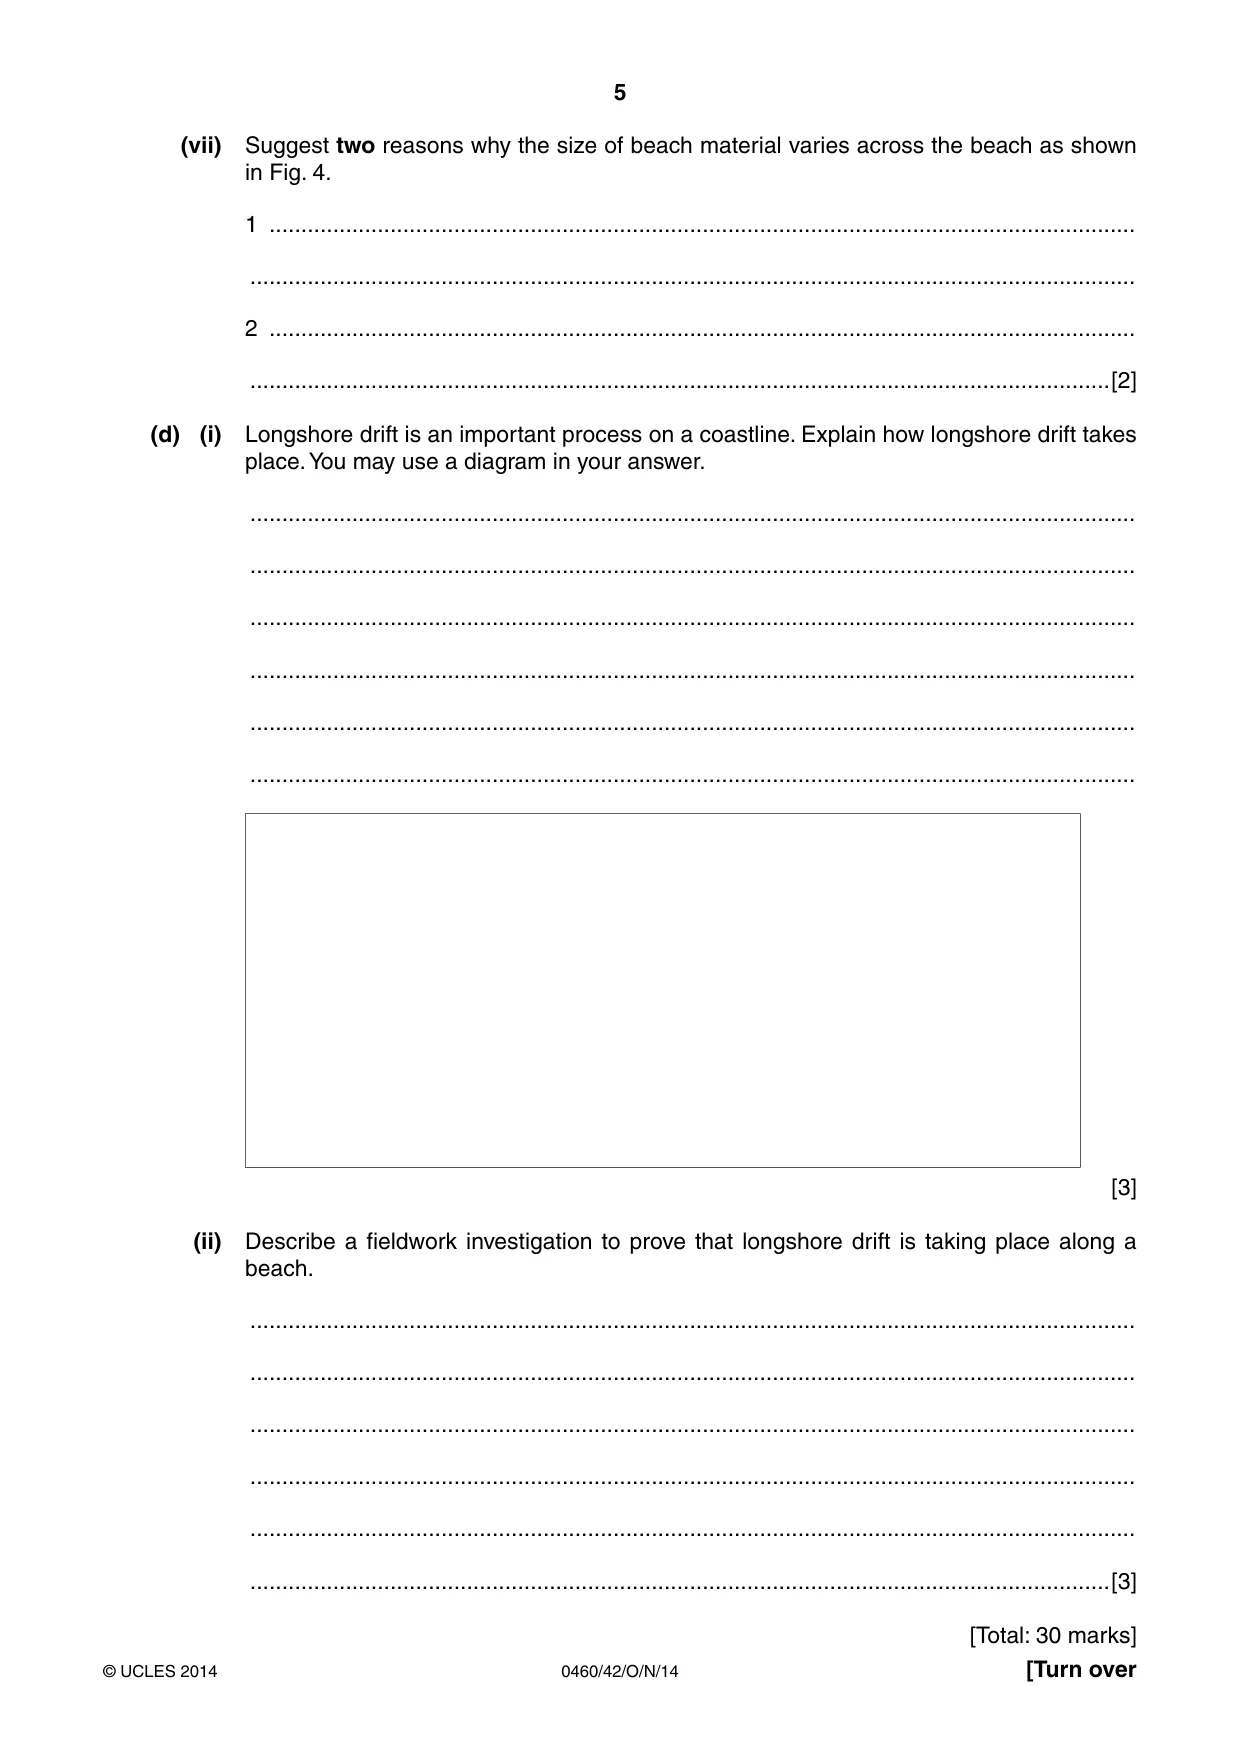
5 0460/42/O/N/14 © UCLES 2014 [Turn over (vii) Suggest two reasons why the size of beach material varies across the beach as shown in Fig. 4. 1 … … 2 … …[2] (d) (i) Longshore drift is an important process on a coastline. Explain how longshore drift takes place. You may use a diagram in your answer. … … … … … … [3] (ii) Describe a fieldwork investigation to prove that longshore drift is taking place along a beach. … … … … … …[3] [Total: 30 marks]
Question paper, page 6
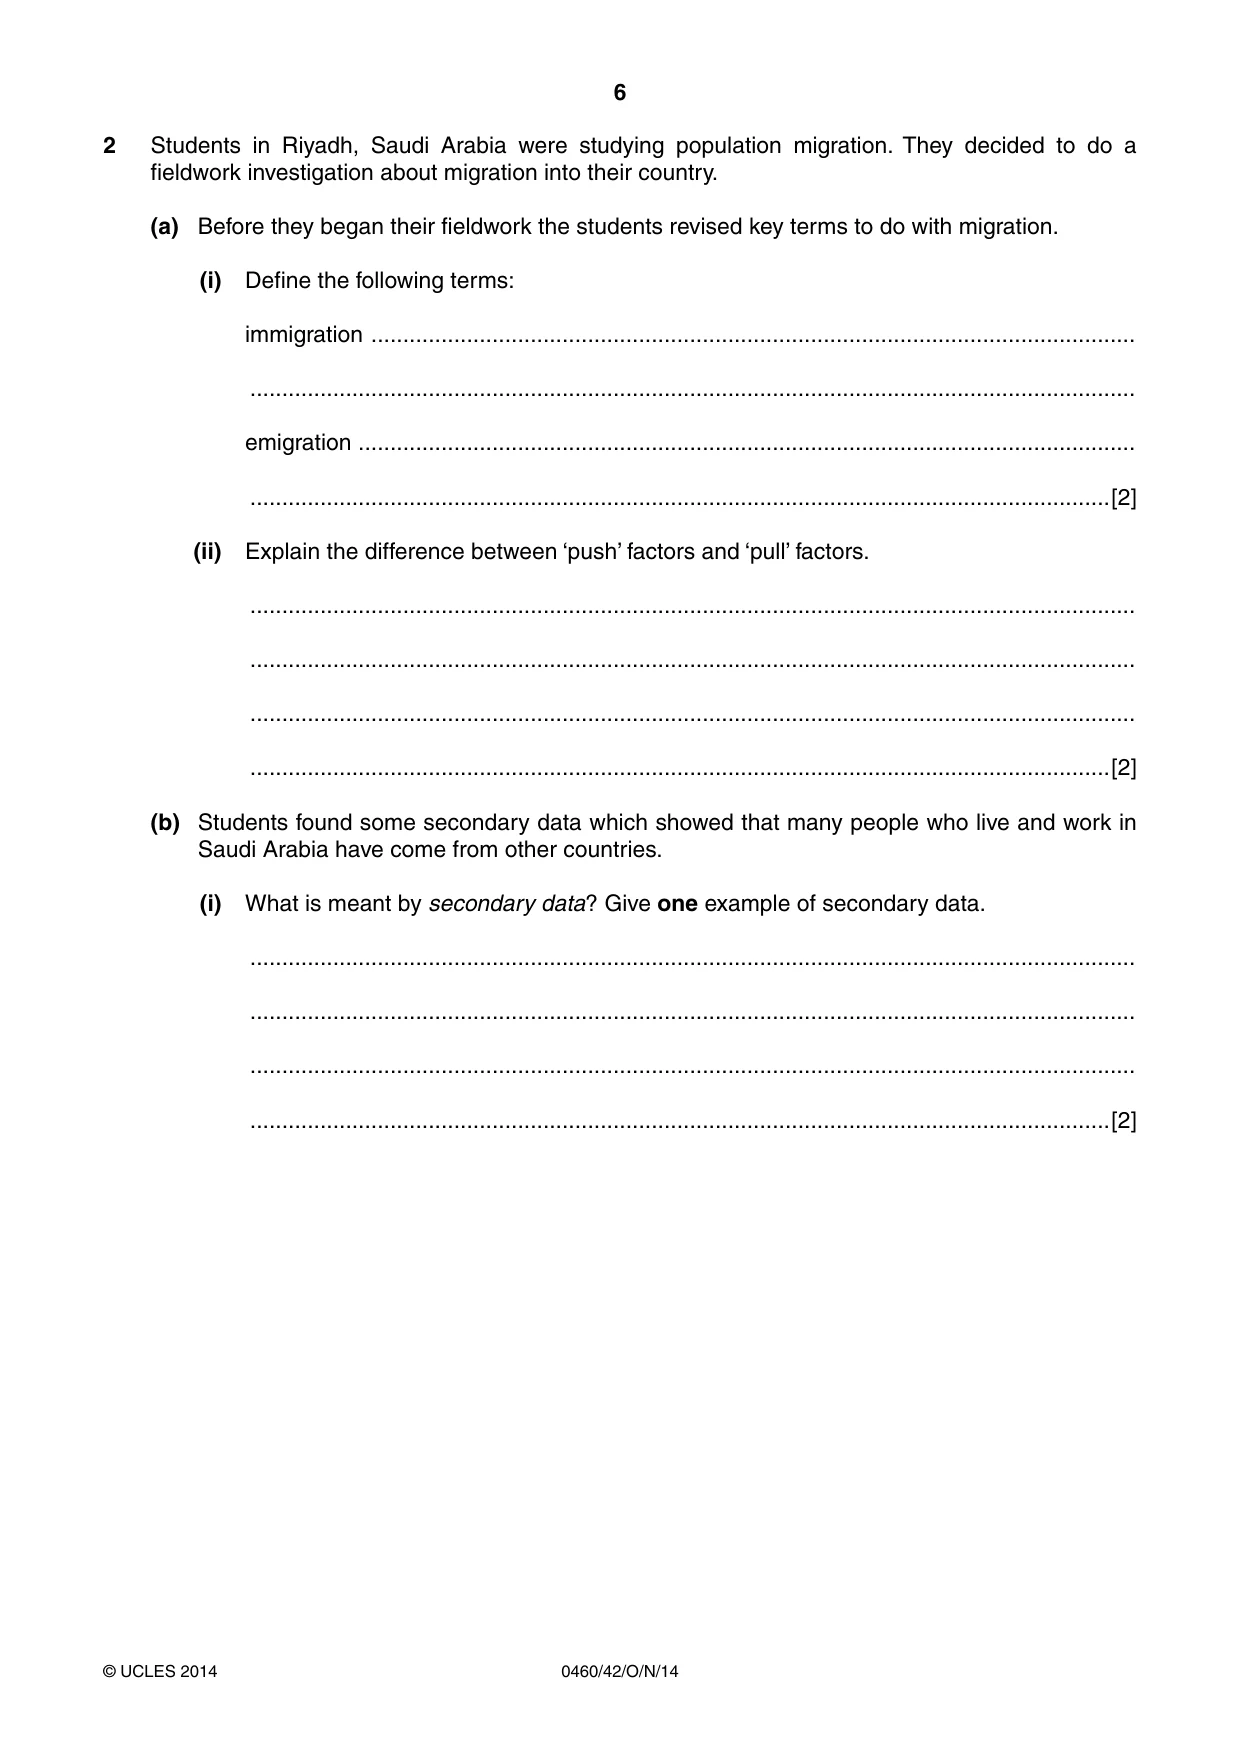
6 0460/42/O/N/14 © UCLES 2014 2 Students in Riyadh, Saudi Arabia were studying population migration. They decided to do a fieldwork investigation about migration into their country. (a) Before they began their fieldwork the students revised key terms to do with migration. (i) Define the following terms: immigration … … emigration … …[2] (ii) Explain the difference between ‘push’ factors and ‘pull’ factors. … … … …[2] (b) Students found some secondary data which showed that many people who live and work in Saudi Arabia have come from other countries. (i) What is meant by secondary data? Give one example of secondary data. … … … …[2]
Question paper, page 7
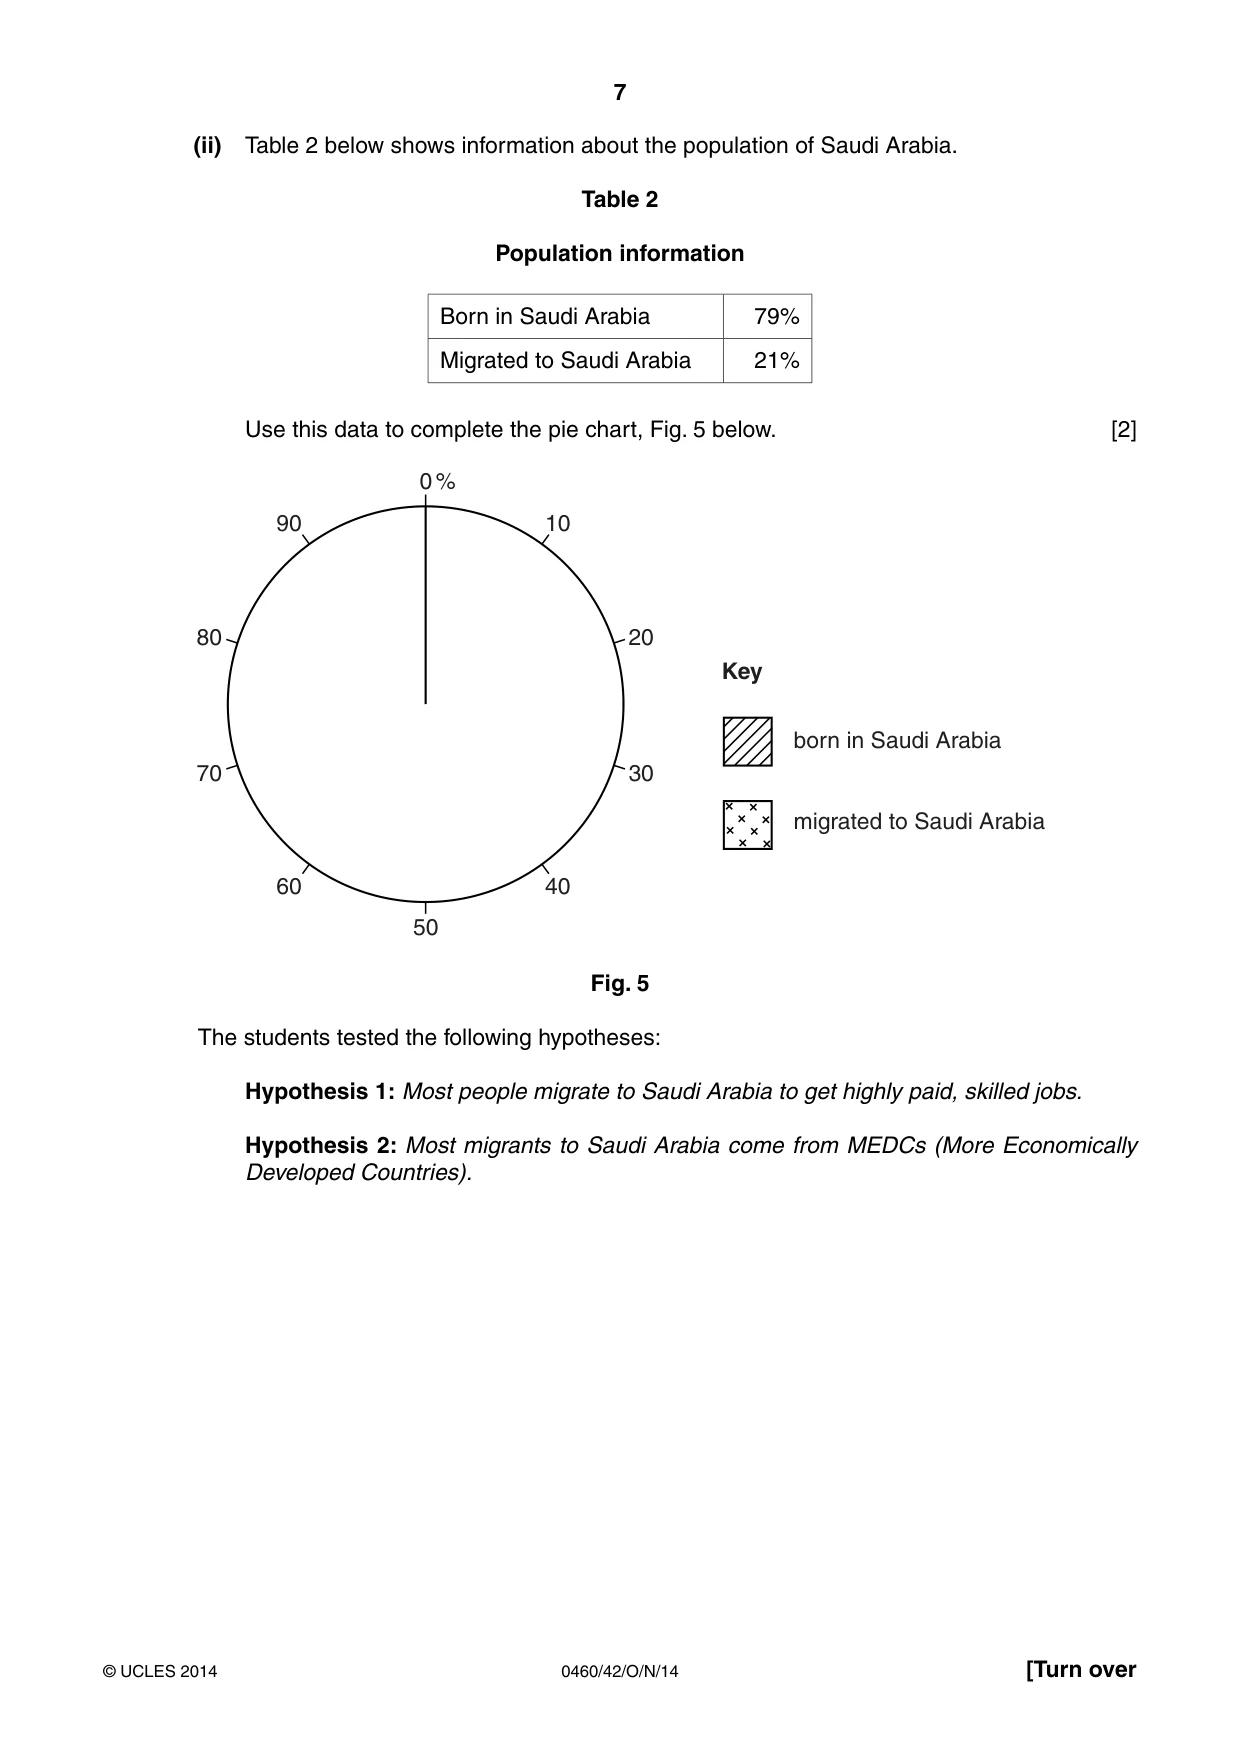
7 0460/42/O/N/14 © UCLES 2014 [Turn over (ii) Table 2 below shows information about the population of Saudi Arabia. Table 2 Population information Born in Saudi Arabia 79% Migrated to Saudi Arabia 21% Use this data to complete the pie chart, Fig. 5 below. [2] 10 40 90 60 50 0 % 30 20 Key born in Saudi Arabia migrated to Saudi Arabia 70 80 Fig. 5 The students tested the following hypotheses: Hypothesis 1: Most people migrate to Saudi Arabia to get highly paid, skilled jobs. Hypothesis 2: Most migrants to Saudi Arabia come from MEDCs (More Economically Developed Countries).
Question paper, page 8
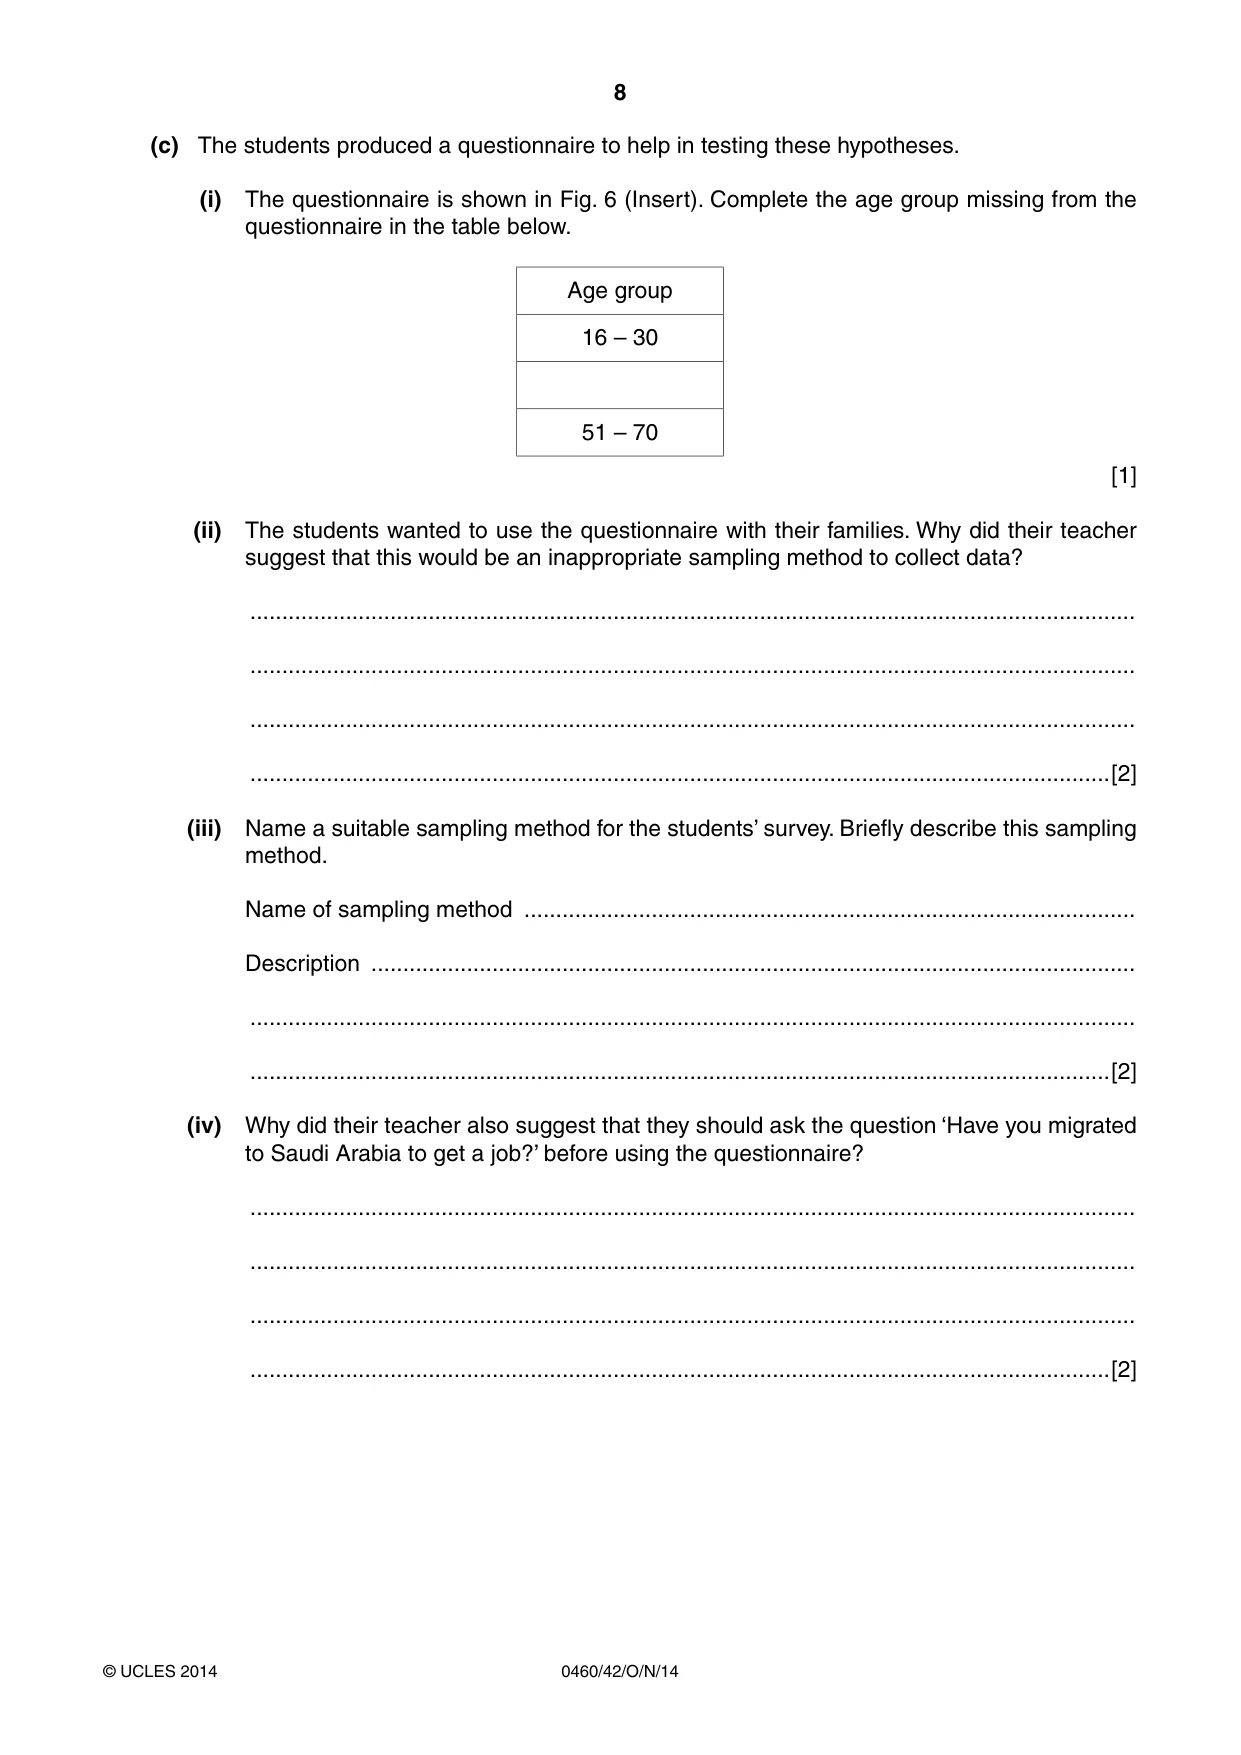
8 0460/42/O/N/14 © UCLES 2014 (c) The students produced a questionnaire to help in testing these hypotheses. (i) The questionnaire is shown in Fig. 6 (Insert). Complete the age group missing from the questionnaire in the table below. Age group 16 – 30 51 – 70 [1] (ii) The students wanted to use the questionnaire with their families. Why did their teacher suggest that this would be an inappropriate sampling method to collect data? … … … …[2] (iii) Name a suitable sampling method for the students’ survey. Briefly describe this sampling method. Name of sampling method … Description … … …[2] (iv) Why did their teacher also suggest that they should ask the question ‘Have you migrated to Saudi Arabia to get a job?’ before using the questionnaire? … … … …[2]
Question paper, page 9
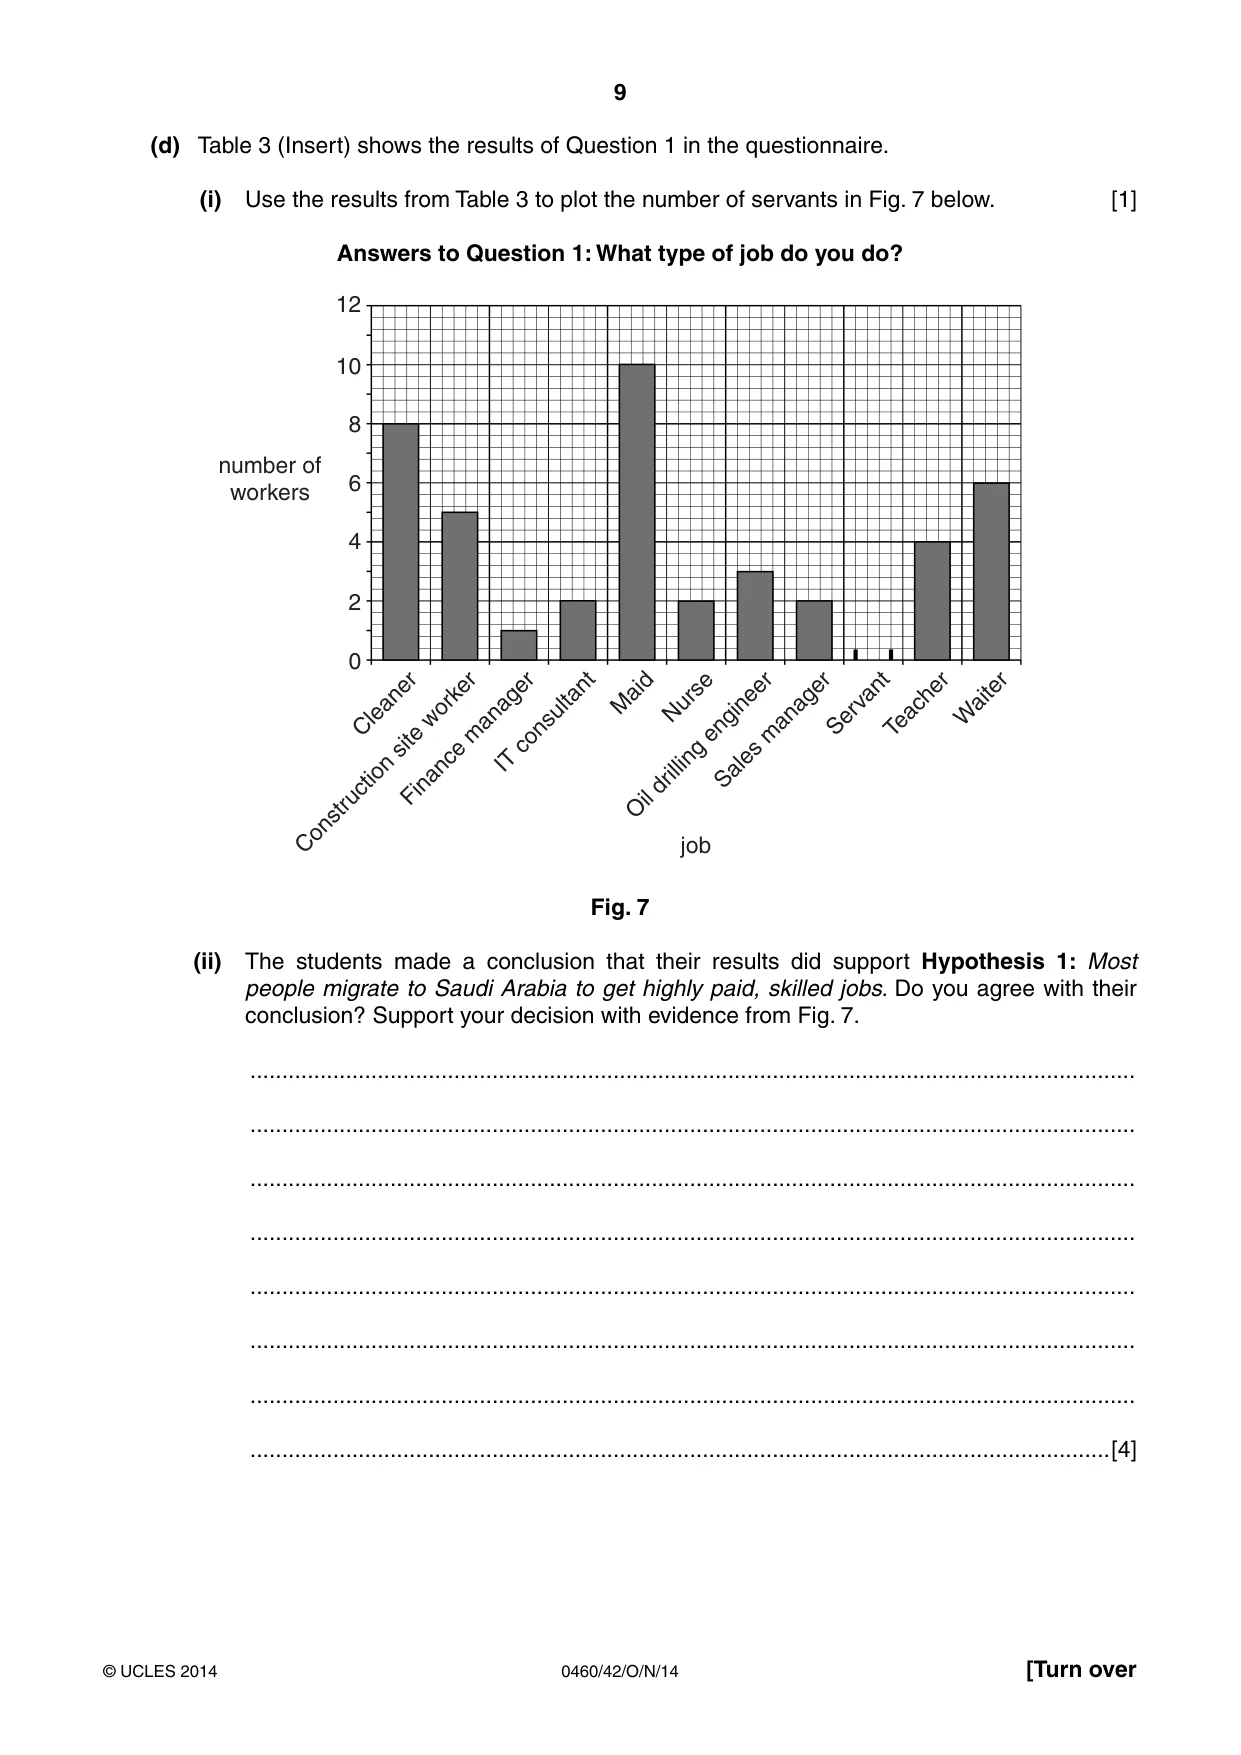
9 0460/42/O/N/14 © UCLES 2014 [Turn over (d) Table 3 (Insert) shows the results of Question 1 in the questionnaire. (i) Use the results from Table 3 to plot the number of servants in Fig. 7 below. [1] Answers to Question 1: What type of job do you do? Cleaner Construction site worker Finance manager IT consultant Maid Nurse Oil drilling engineer Sales manager Servant Teacher Waiter job 0 2 4 6 number of workers 8 10 12 Fig. 7 (ii) The students made a conclusion that their results did support Hypothesis 1: Most people migrate to Saudi Arabia to get highly paid, skilled jobs. Do you agree with their conclusion? Support your decision with evidence from Fig. 7. … … … … … … … …[4]
Question paper, page 10
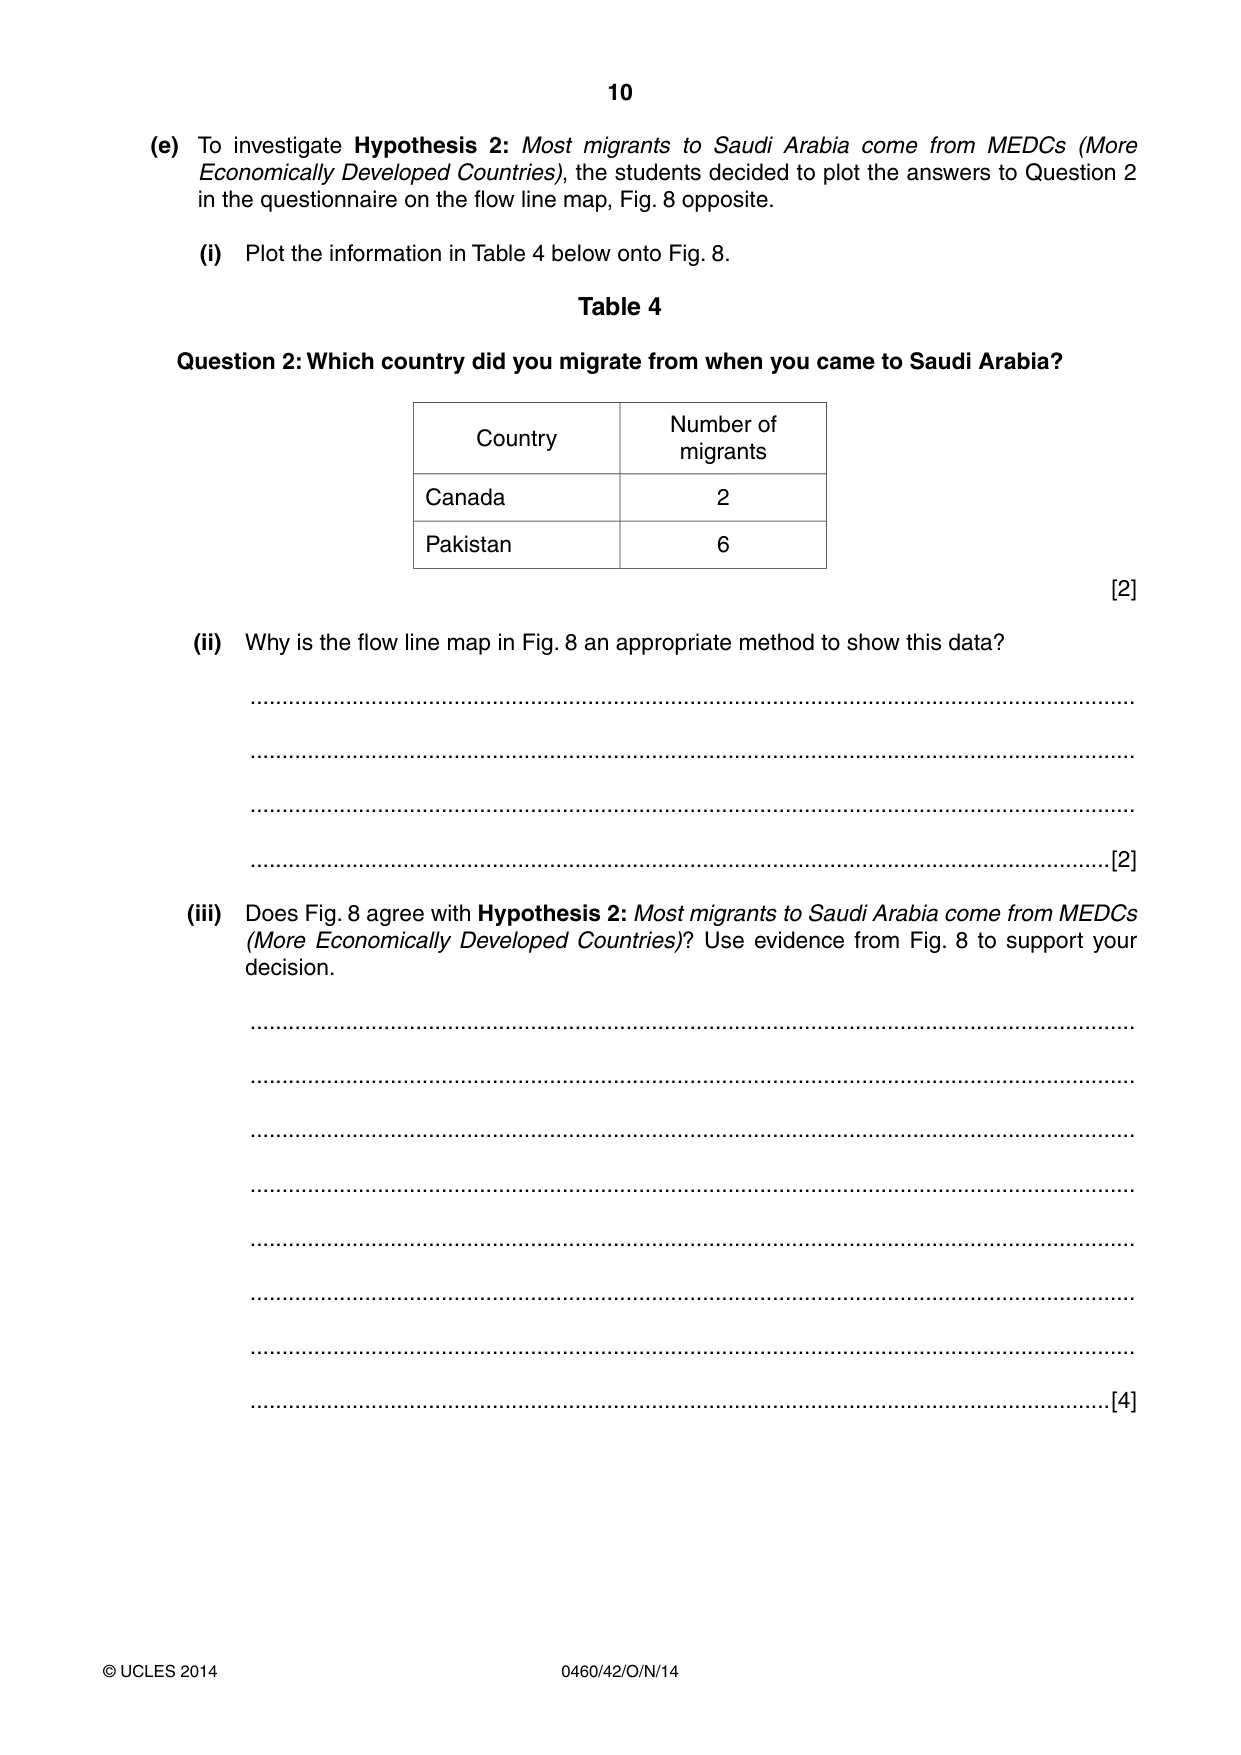
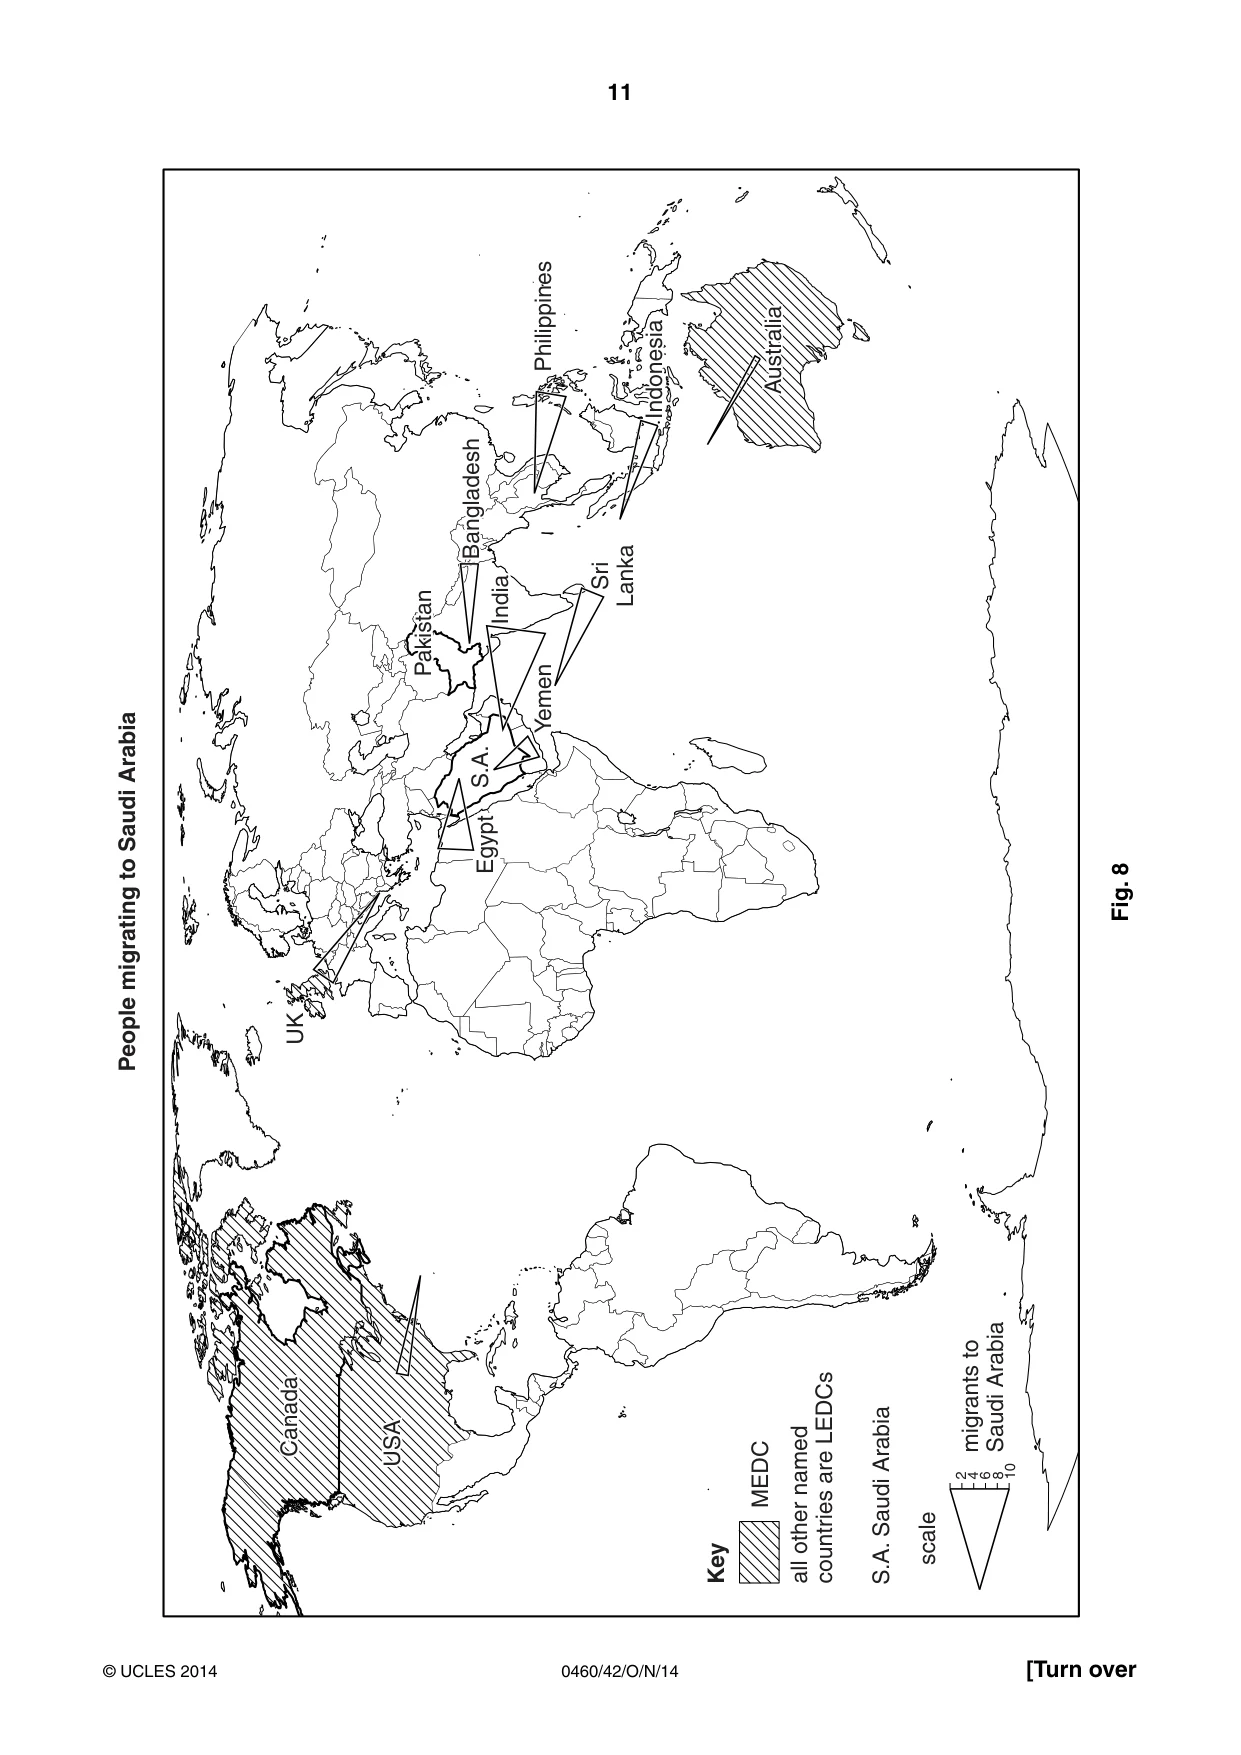
10 0460/42/O/N/14 © UCLES 2014 (e) To investigate Hypothesis 2: Most migrants to Saudi Arabia come from MEDCs (More Economically Developed Countries), the students decided to plot the answers to Question 2 in the questionnaire on the flow line map, Fig. 8 opposite. (i) Plot the information in Table 4 below onto Fig. 8. Table 4 Question 2: Which country did you migrate from when you came to Saudi Arabia? Country Number of migrants Canada 2 Pakistan 6 [2] (ii) Why is the flow line map in Fig. 8 an appropriate method to show this data? … … … …[2] (iii) Does Fig. 8 agree with Hypothesis 2: Most migrants to Saudi Arabia come from MEDCs (More Economically Developed Countries)? Use evidence from Fig. 8 to support your decision. … … … … … … … …[4]
Question paper, page 11
11 0460/42/O/N/14 © UCLES 2014 [Turn over People migrating to Saudi Arabia Key MEDC UK Philippines Canada Australia Indonesia India Bangladesh Sri Lanka scale migrants to Saudi Arabia 2 4 6 8 10 Yemen S.A. S.A. Saudi Arabia all other named countries are LEDCs Canada Australia India Bangladesh Pakistan Pakistan Eygpt Egypt Indonesia USA USA Fig. 8
Question paper, page 12
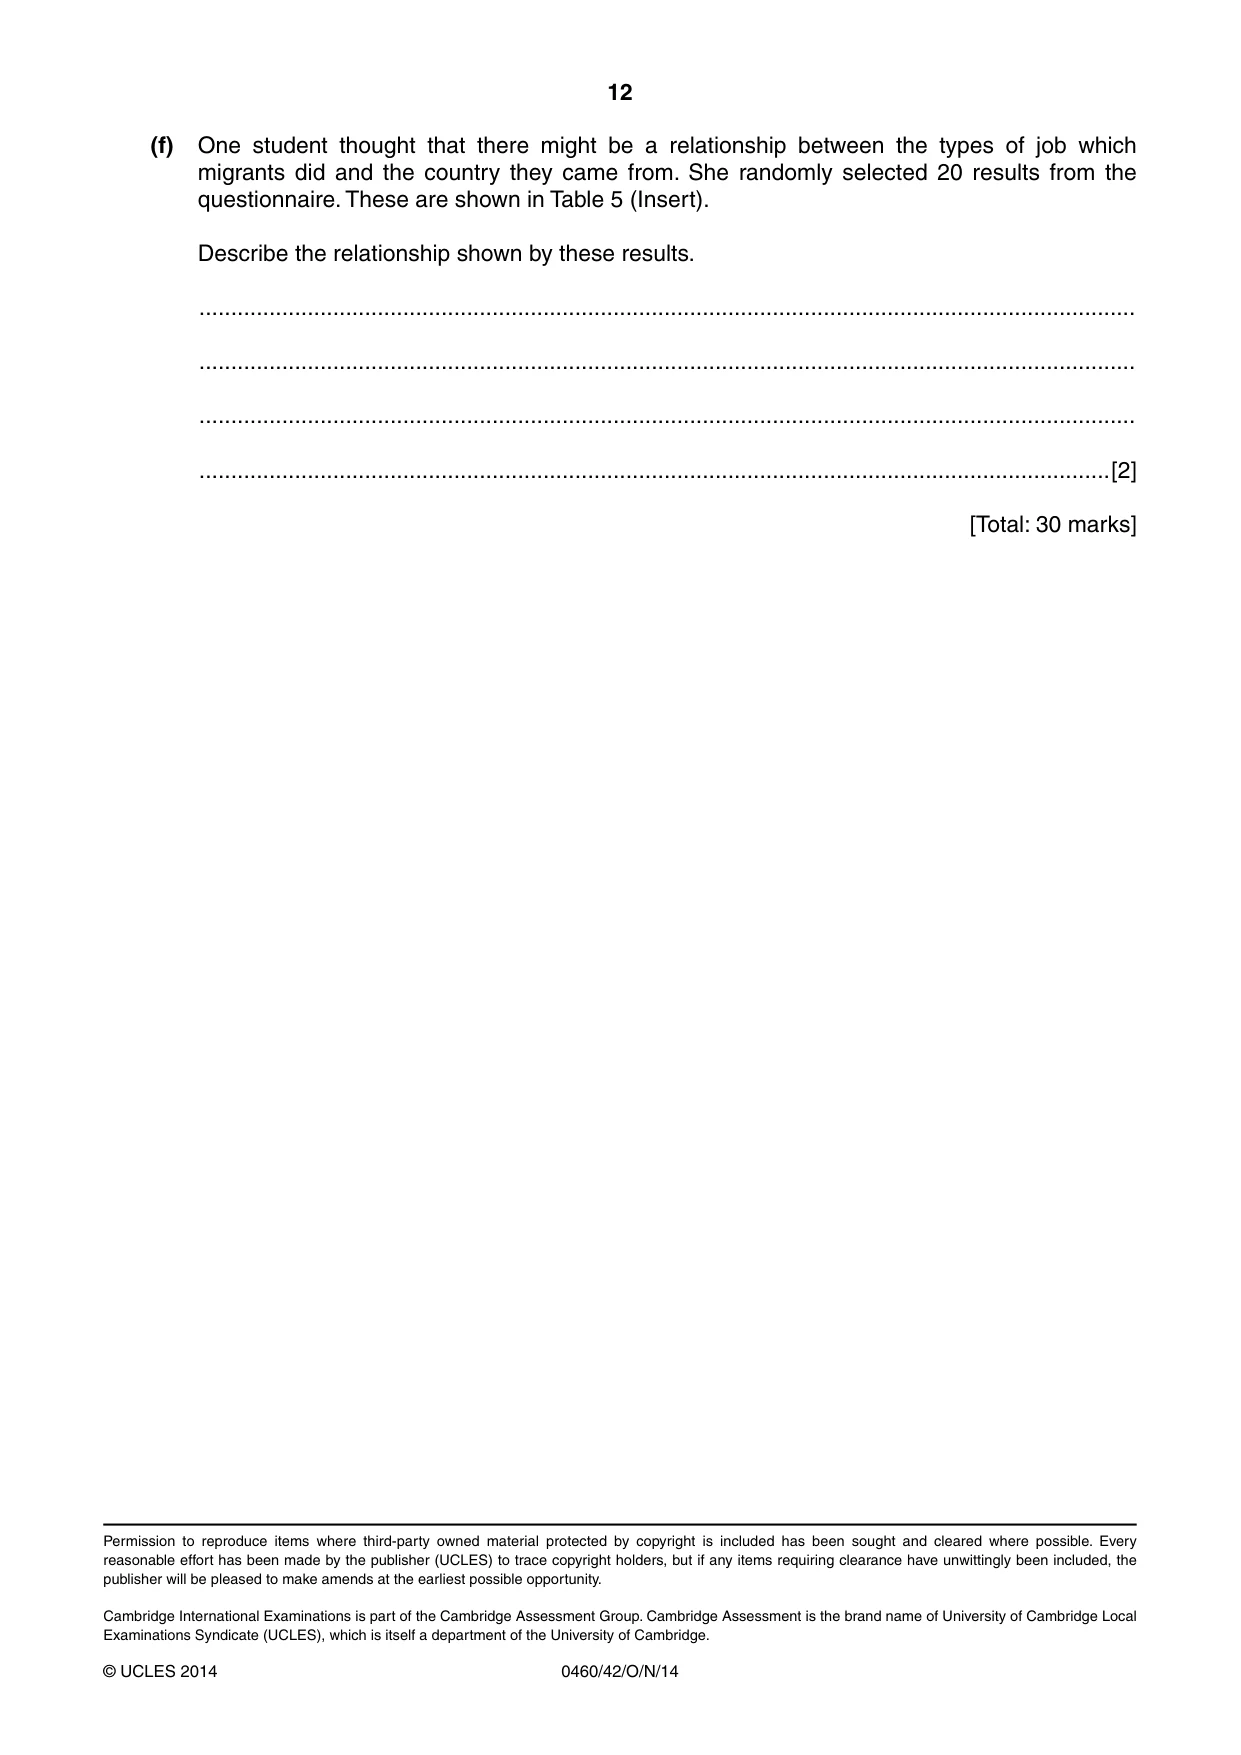
12 0460/42/O/N/14 © UCLES 2014 (f) One student thought that there might be a relationship between the types of job which migrants did and the country they came from. She randomly selected 20 results from the questionnaire. These are shown in Table 5 (Insert). Describe the relationship shown by these results. … … … …[2] [Total: 30 marks] Permission to reproduce items where third-party owned material protected by copyright is included has been sought and cleared where possible. Every reasonable effort has been made by the publisher (UCLES) to trace copyright holders, but if any items requiring clearance have unwittingly been included, the publisher will be pleased to make amends at the earliest possible opportunity. Cambridge International Examinations is part of the Cambridge Assessment Group. Cambridge Assessment is the brand name of University of Cambridge Local Examinations Syndicate (UCLES), which is itself a department of the University of Cambridge.
Mark scheme, page 1
® IGCSE is the registered trademark of Cambridge International Examinations. CAMBRIDGE INTERNATIONAL EXAMINATIONS Cambridge International General Certificate of Secondary Education MARK SCHEME for the October/November 2014 series 0460 GEOGRAPHY 0460/42 Paper 4 (Alternative to Coursework), maximum raw mark 60 This mark scheme is published as an aid to teachers and candidates, to indicate the requirements of the examination. It shows the basis on which Examiners were instructed to award marks. It does not indicate the details of the discussions that took place at an Examiners’ meeting before marking began, which would have considered the acceptability of alternative answers. Mark schemes should be read in conjunction with the question paper and the Principal Examiner Report for Teachers. Cambridge will not enter into discussions about these mark schemes. Cambridge is publishing the mark schemes for the October/November 2014 series for most Cambridge IGCSE®, Cambridge International A and AS Level components and some Cambridge O Level components.
Mark scheme, page 2
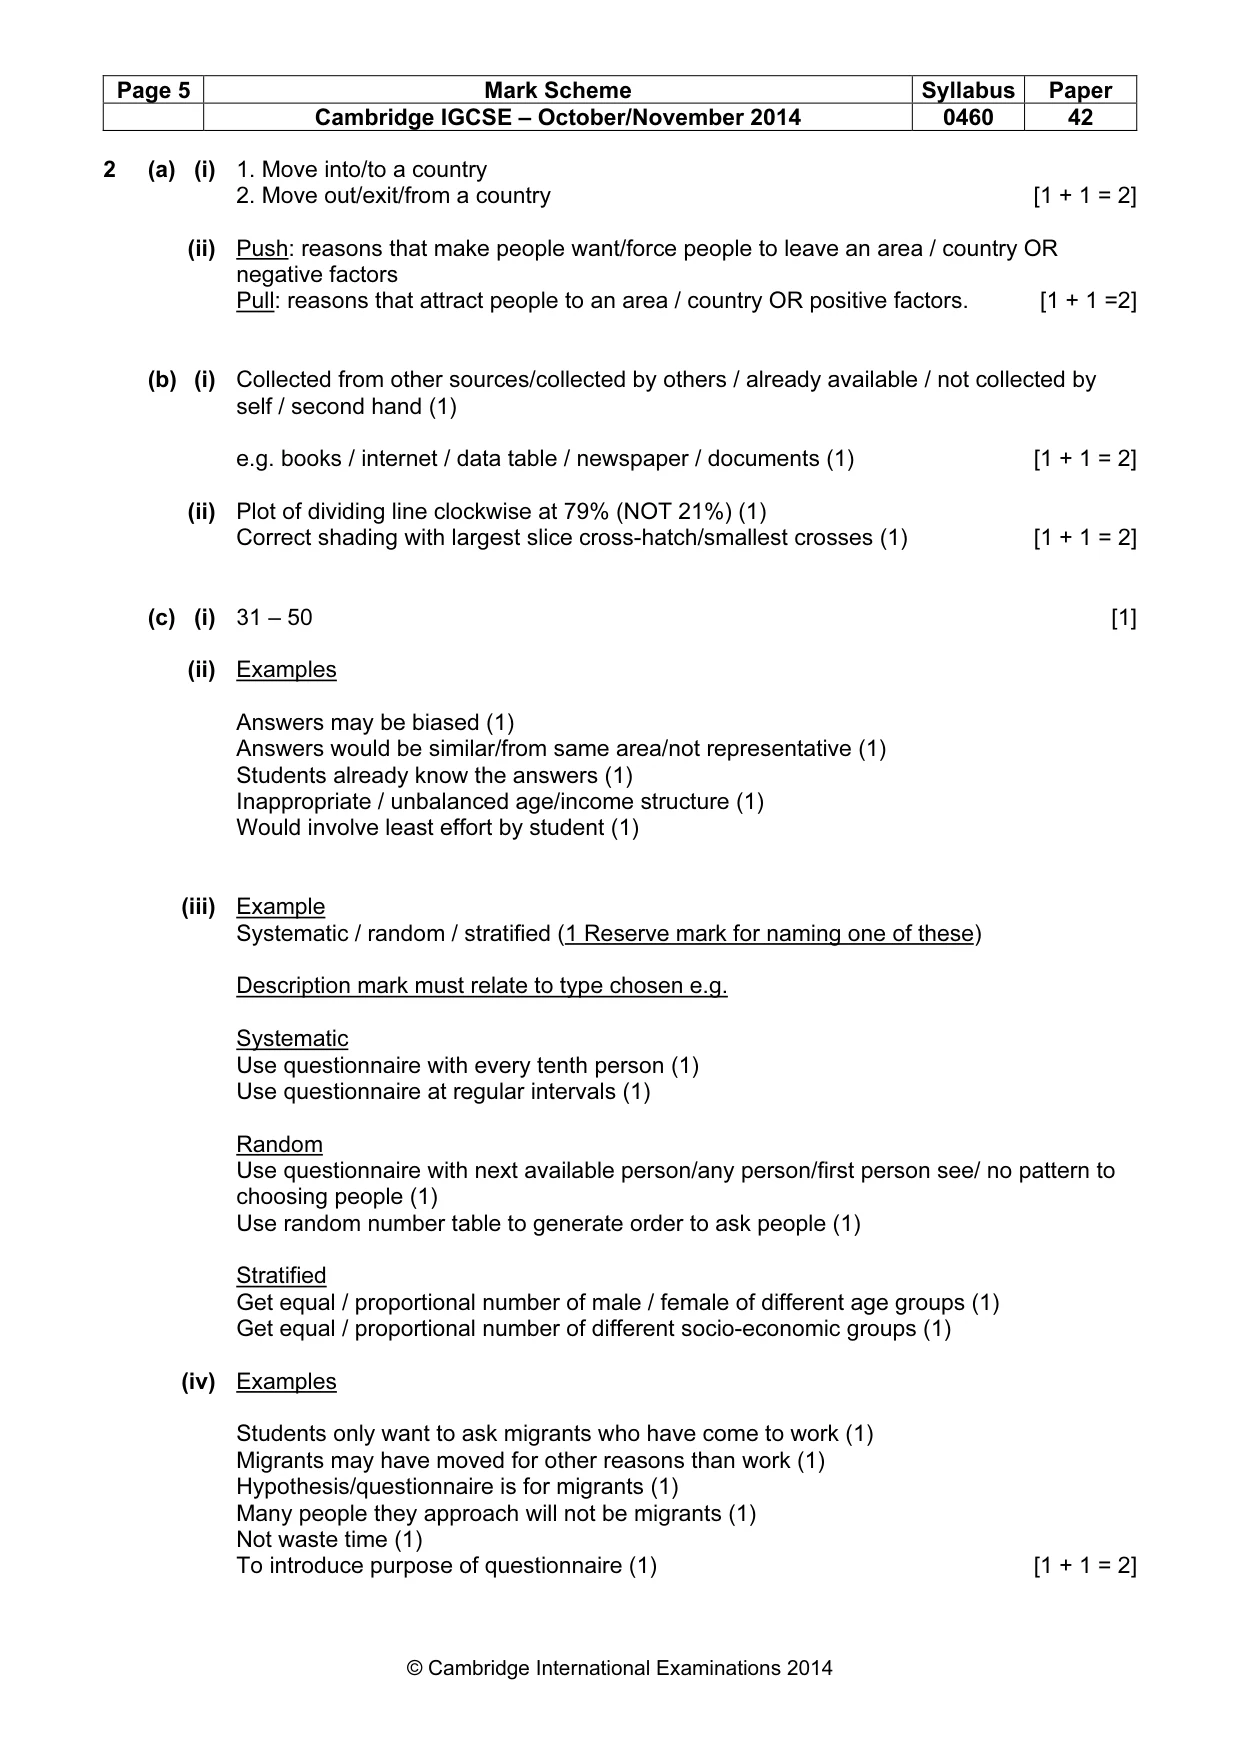
Page 2 Mark Scheme Syllabus Paper Cambridge IGCSE – October/November 2014 0460 42 © Cambridge International Examinations 2014 1 (a) Examples to do with avoiding risk of accident Stay in designated area (1) Keep away from base of cliff / overhang (1) Check tide times before setting off (1) Do fieldwork at low tide/not high tide (1) Avoid slippery rocks (1) Work in pairs / groups / take phones / whistle (1) Wear suitable shoes/clothing/waterproofs/helmets (1) Don’t go in the sea (1) [1 + 1 + 1 = 3] (b) (i) Examples: 1 mark for Advantage; 2 marks for Disadvantage. Advantage: (1) Easy to do / no need to measure angle Needs little equipment / only needs measuring tape / ruler / clinometers Easier to draw / construct profile Gives a lot of information/data Disadvantages: (2) Measuring error/ inaccurate reading/effects of weather on measuring Hard to measure vertical distance Measurements taken every metre may miss change in slope Complication of having to add height difference to readings/measurements Tape might not be long enough [1 + 2 = 3] (ii) Examples Disadvantage: Only selecting 1 pebble every metre / sample is too small (1) Selected pebble may be an anomaly / not representative (1) May select pebble/involve bias (1) Improvements: Measure > one pebble/larger sample at each site and average results (1) Use a quadrat and measure all pebbles within frame (1) Choose pebbles at shorter distance to get bigger sample (1) [1 + 1 = 2] (c) (i) Completion of cross-section at 3m (0.5m) and 8m (1.1m) [1 + 1 =2]
Mark scheme, page 3
Page 3 Mark Scheme Syllabus Paper Cambridge IGCSE – October/November 2014 0460 42 © Cambridge International Examinations 2014 (ii) Examples: Similarities: (1 + 1) Beach has three levels Both sloping/slope up/down Change in gradient / steep slope at each tide level Each section is concave Differences (seen on fieldwork cross-section) (1 + 1) Flatter section above low water mark Flatter section above high tide Less steep above high spring tide No flat section at top of beach / above storm tide Flatter overall/steeper in textbook More curved between HT/LWM (May be from textbook example i.e. opposite of differences above) [2 × (1 + 1) = 4] (iii) Hypothesis is TRUE/CORRECT/GENERALLY/PARTIALLY TRUE If say incorrect/false/not true = 0 (iv) Plotting two results on scatter graph: 7m = 10cm, 15m = 2cm [1 + 1 = 2] (v) Draw best-fit line; must have at least 4 plots each side (There are 16 in all) and line must be straight, go from top left to bottom right and touch two axes at each end [1] (vi) YES / hypothesis is generally/mostly/partially correct / there is larger material towards top of beach (1 Reserve mark) Evidence/data Credit two examples to show the change – need pebble size and distance from cliff. Credit 2 marks max for two examples of paired data/evidence e.g. Length 18 cm next to (0m from) cliff but only 1 cm at 14 m from cliff (1) 12m from cliff length is 5cm but at 5m from cliff length increases to 14cm (1) Largest pebble is only 2 m from cliff but smallest is 13/14 m away (1) Reference to anomalies at 2/8/11/15m – 1 mark MAX for anomaly. [1HA + 3 = 4]
Mark scheme, page 4
Page 4 Mark Scheme Syllabus Paper Cambridge IGCSE – October/November 2014 0460 42 © Cambridge International Examinations 2014 (vii) Examples More powerful swash/strong waves/ big waves/storm waves take all material up the beach (1) Less powerful backwash/ water going back carries smaller material down the beach (1) Erosion more rapid close to sea where more frequent water (1) Rockfalls from cliff provide larger material at back of beach (1) [1 + 1 = 2] (d) (i) Examples: credit same labels/annotation on diagram if drawn Incoming waves at an angle/oblique to the coast (1) Waves are driven by on-shore/prevailing/most common winds (1) Waves/swash carries pebbles up beach at an angle (1) Backwash/waves going back take pebbles straight down beach/ 90 degrees under gravity (1) Process is repeated with each wave (1) Pebbles take zig-zag route up the beach (if in text) (1) Pebbles go up beach at angle and down at 90 degrees (if in text or diagram) (1) [1 + 1 + 1 = 3] (ii) Examples of expected ideas – Three alternatives below Paint pebbles (1) Group them close to water’s edge (1) Leave them for period of time (1) Put ranging pole where pebbles start and another at fixed distance along beach (1) Find the pebbles/see how many moved from starting point (1) Do test several times to get an average (1) OR Drop orange/float in to sea/at water’s edge (1) Mark starting position with ranging pole (1) Allow orange/float to move for a period of time (1) Measure distance orange/float has moved (1) Do test several times to get an average (1) OR Find an area with groynes (1) Measure the height to the beach each side of the groyne (1) If different height longshore drift is taking place (1) [1 + 1 + 1 = 3] [Total: 30 marks]
Mark scheme, page 5
Page 5 Mark Scheme Syllabus Paper Cambridge IGCSE – October/November 2014 0460 42 © Cambridge International Examinations 2014 2 (a) (i) 1. Move into/to a country 2. Move out/exit/from a country [1 + 1 = 2] (ii) Push: reasons that make people want/force people to leave an area / country OR negative factors Pull: reasons that attract people to an area / country OR positive factors. [1 + 1 =2] (b) (i) Collected from other sources/collected by others / already available / not collected by self / second hand (1) e.g. books / internet / data table / newspaper / documents (1) [1 + 1 = 2] (ii) Plot of dividing line clockwise at 79% (NOT 21%) (1) Correct shading with largest slice cross-hatch/smallest crosses (1) [1 + 1 = 2] (c) (i) 31 – 50 [1] (ii) Examples Answers may be biased (1) Answers would be similar/from same area/not representative (1) Students already know the answers (1) Inappropriate / unbalanced age/income structure (1) Would involve least effort by student (1) (iii) Example Systematic / random / stratified (1 Reserve mark for naming one of these) Description mark must relate to type chosen e.g. Systematic Use questionnaire with every tenth person (1) Use questionnaire at regular intervals (1) Random Use questionnaire with next available person/any person/first person see/ no pattern to choosing people (1) Use random number table to generate order to ask people (1) Stratified Get equal / proportional number of male / female of different age groups (1) Get equal / proportional number of different socio-economic groups (1) (iv) Examples Students only want to ask migrants who have come to work (1) Migrants may have moved for other reasons than work (1) Hypothesis/questionnaire is for migrants (1) Many people they approach will not be migrants (1) Not waste time (1) To introduce purpose of questionnaire (1) [1 + 1 = 2]
Mark scheme, page 6
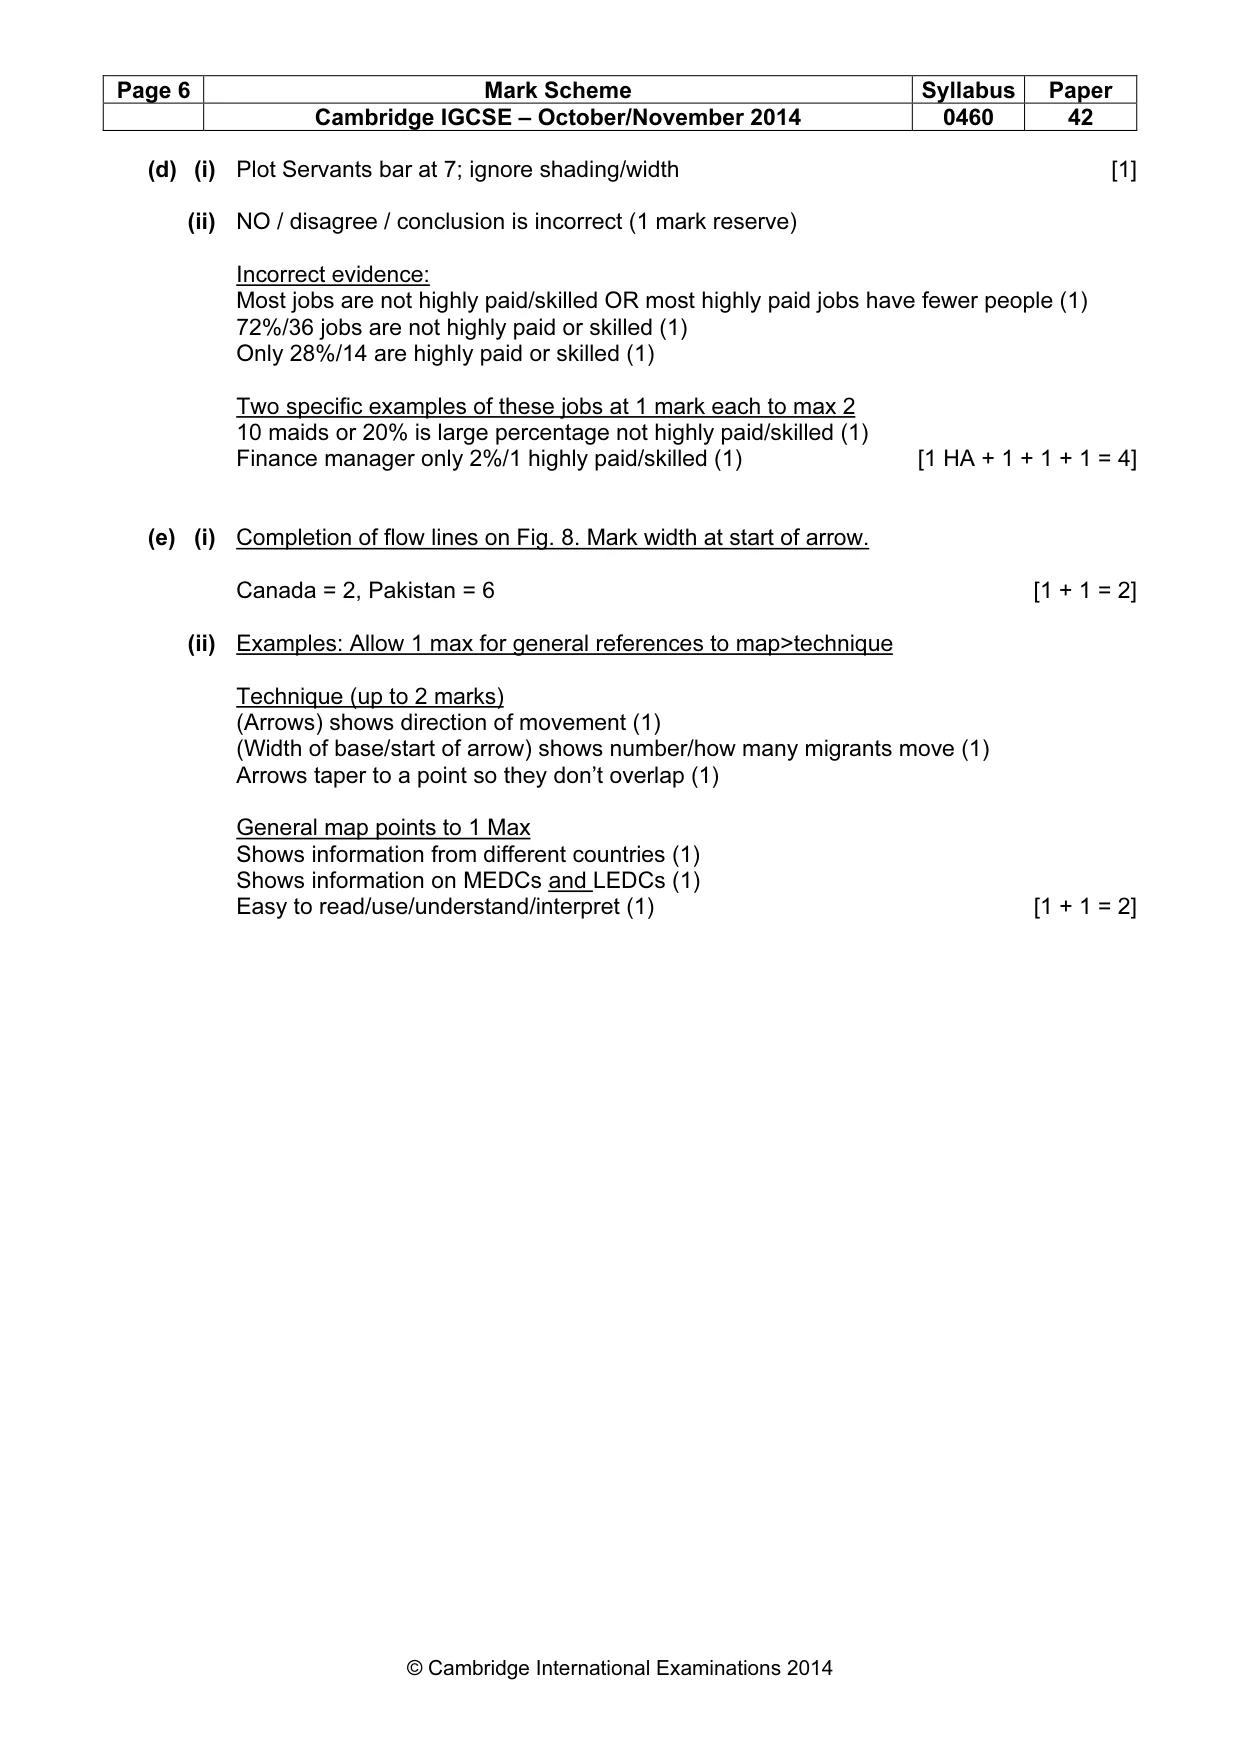
Page 6 Mark Scheme Syllabus Paper Cambridge IGCSE – October/November 2014 0460 42 © Cambridge International Examinations 2014 (d) (i) Plot Servants bar at 7; ignore shading/width [1] (ii) NO / disagree / conclusion is incorrect (1 mark reserve) Incorrect evidence: Most jobs are not highly paid/skilled OR most highly paid jobs have fewer people (1) 72%/36 jobs are not highly paid or skilled (1) Only 28%/14 are highly paid or skilled (1) Two specific examples of these jobs at 1 mark each to max 2 10 maids or 20% is large percentage not highly paid/skilled (1) Finance manager only 2%/1 highly paid/skilled (1) [1 HA + 1 + 1 + 1 = 4] (e) (i) Completion of flow lines on Fig. 8. Mark width at start of arrow. Canada = 2, Pakistan = 6 [1 + 1 = 2] (ii) Examples: Allow 1 max for general references to map>technique Technique (up to 2 marks) (Arrows) shows direction of movement (1) (Width of base/start of arrow) shows number/how many migrants move (1) Arrows taper to a point so they don’t overlap (1) General map points to 1 Max Shows information from different countries (1) Shows information on MEDCs and LEDCs (1) Easy to read/use/understand/interpret (1) [1 + 1 = 2]
Mark scheme, page 7
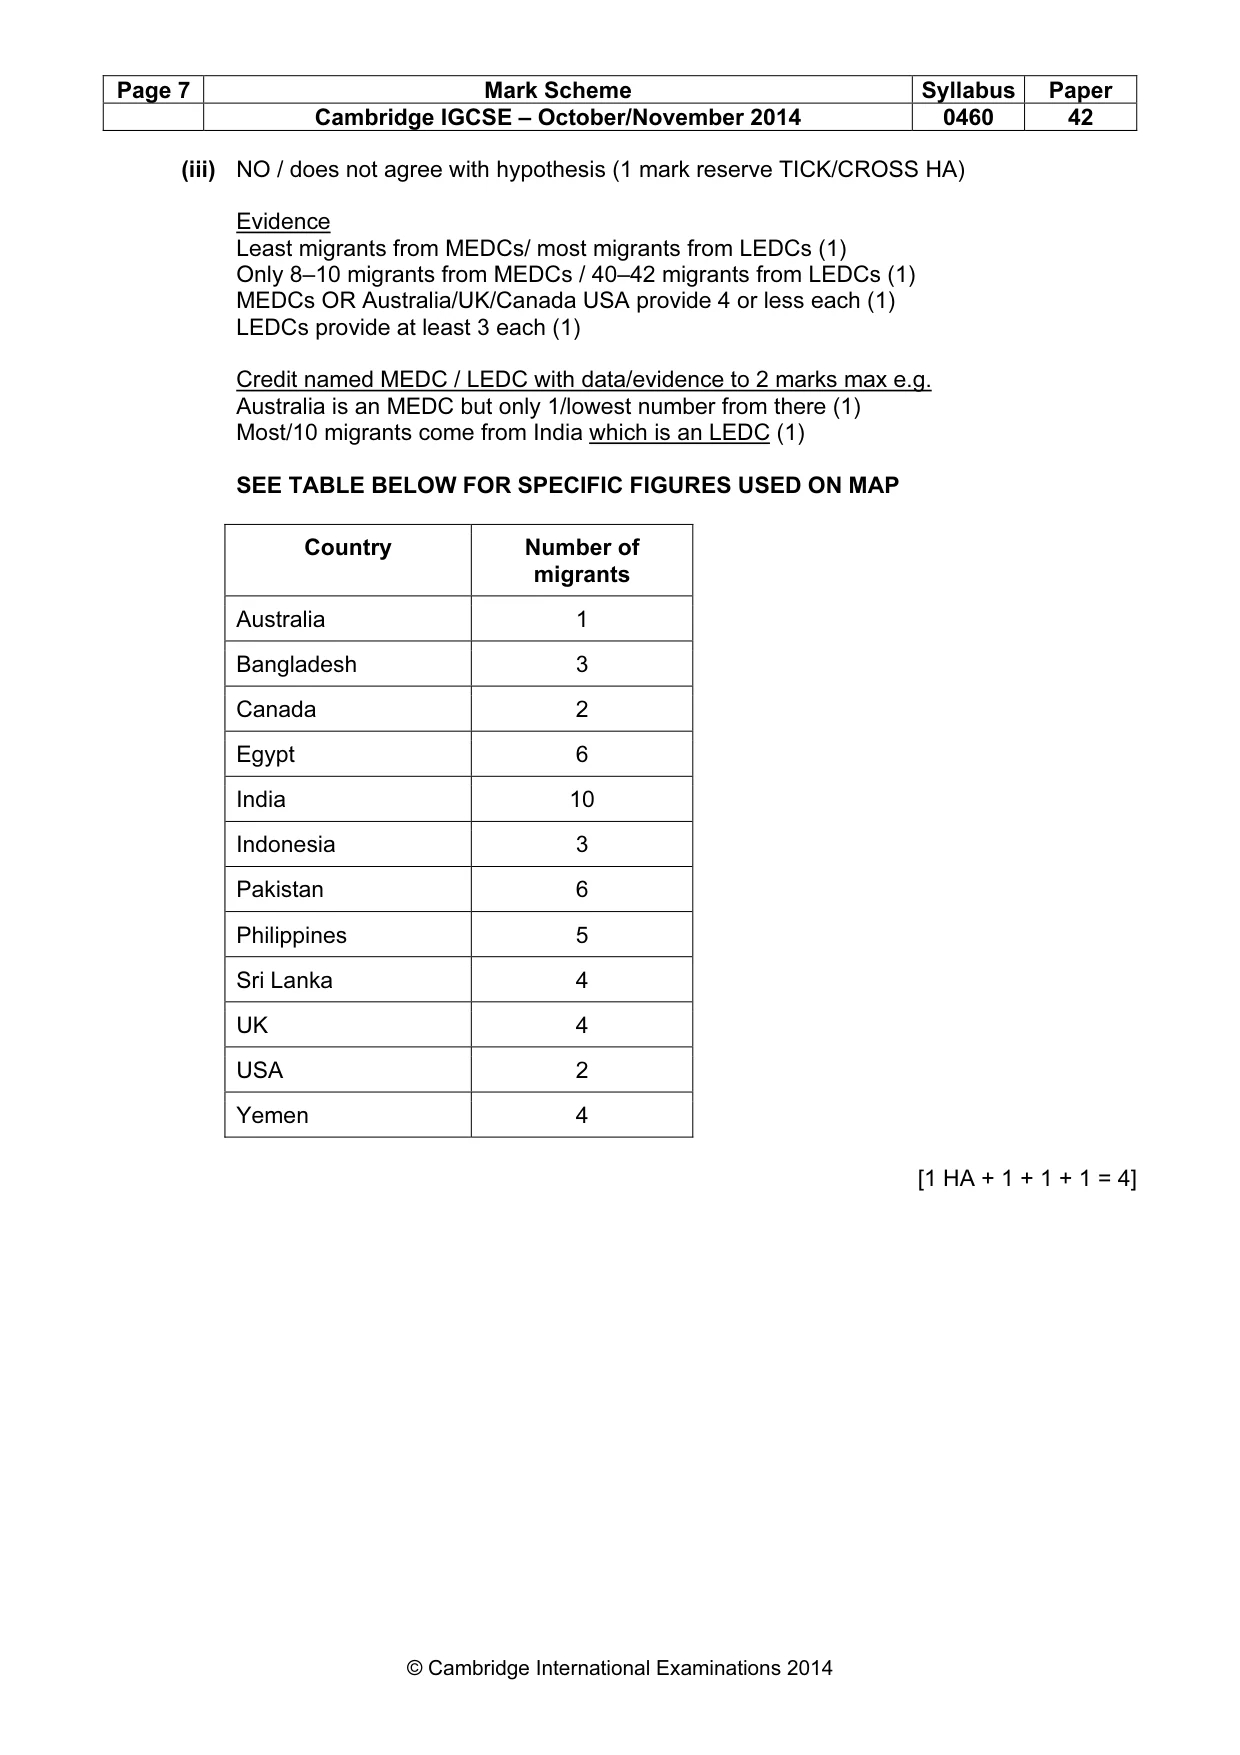
Page 7 Mark Scheme Syllabus Paper Cambridge IGCSE – October/November 2014 0460 42 © Cambridge International Examinations 2014 (iii) NO / does not agree with hypothesis (1 mark reserve TICK/CROSS HA) Evidence Least migrants from MEDCs/ most migrants from LEDCs (1) Only 8–10 migrants from MEDCs / 40–42 migrants from LEDCs (1) MEDCs OR Australia/UK/Canada USA provide 4 or less each (1) LEDCs provide at least 3 each (1) Credit named MEDC / LEDC with data/evidence to 2 marks max e.g. Australia is an MEDC but only 1/lowest number from there (1) Most/10 migrants come from India which is an LEDC (1) SEE TABLE BELOW FOR SPECIFIC FIGURES USED ON MAP Country Number of migrants Australia 1 Bangladesh 3 Canada 2 Egypt 6 India 10 Indonesia 3 Pakistan 6 Philippines 5 Sri Lanka 4 UK 4 USA 2 Yemen 4 [1 HA + 1 + 1 + 1 = 4]
Mark scheme, page 8
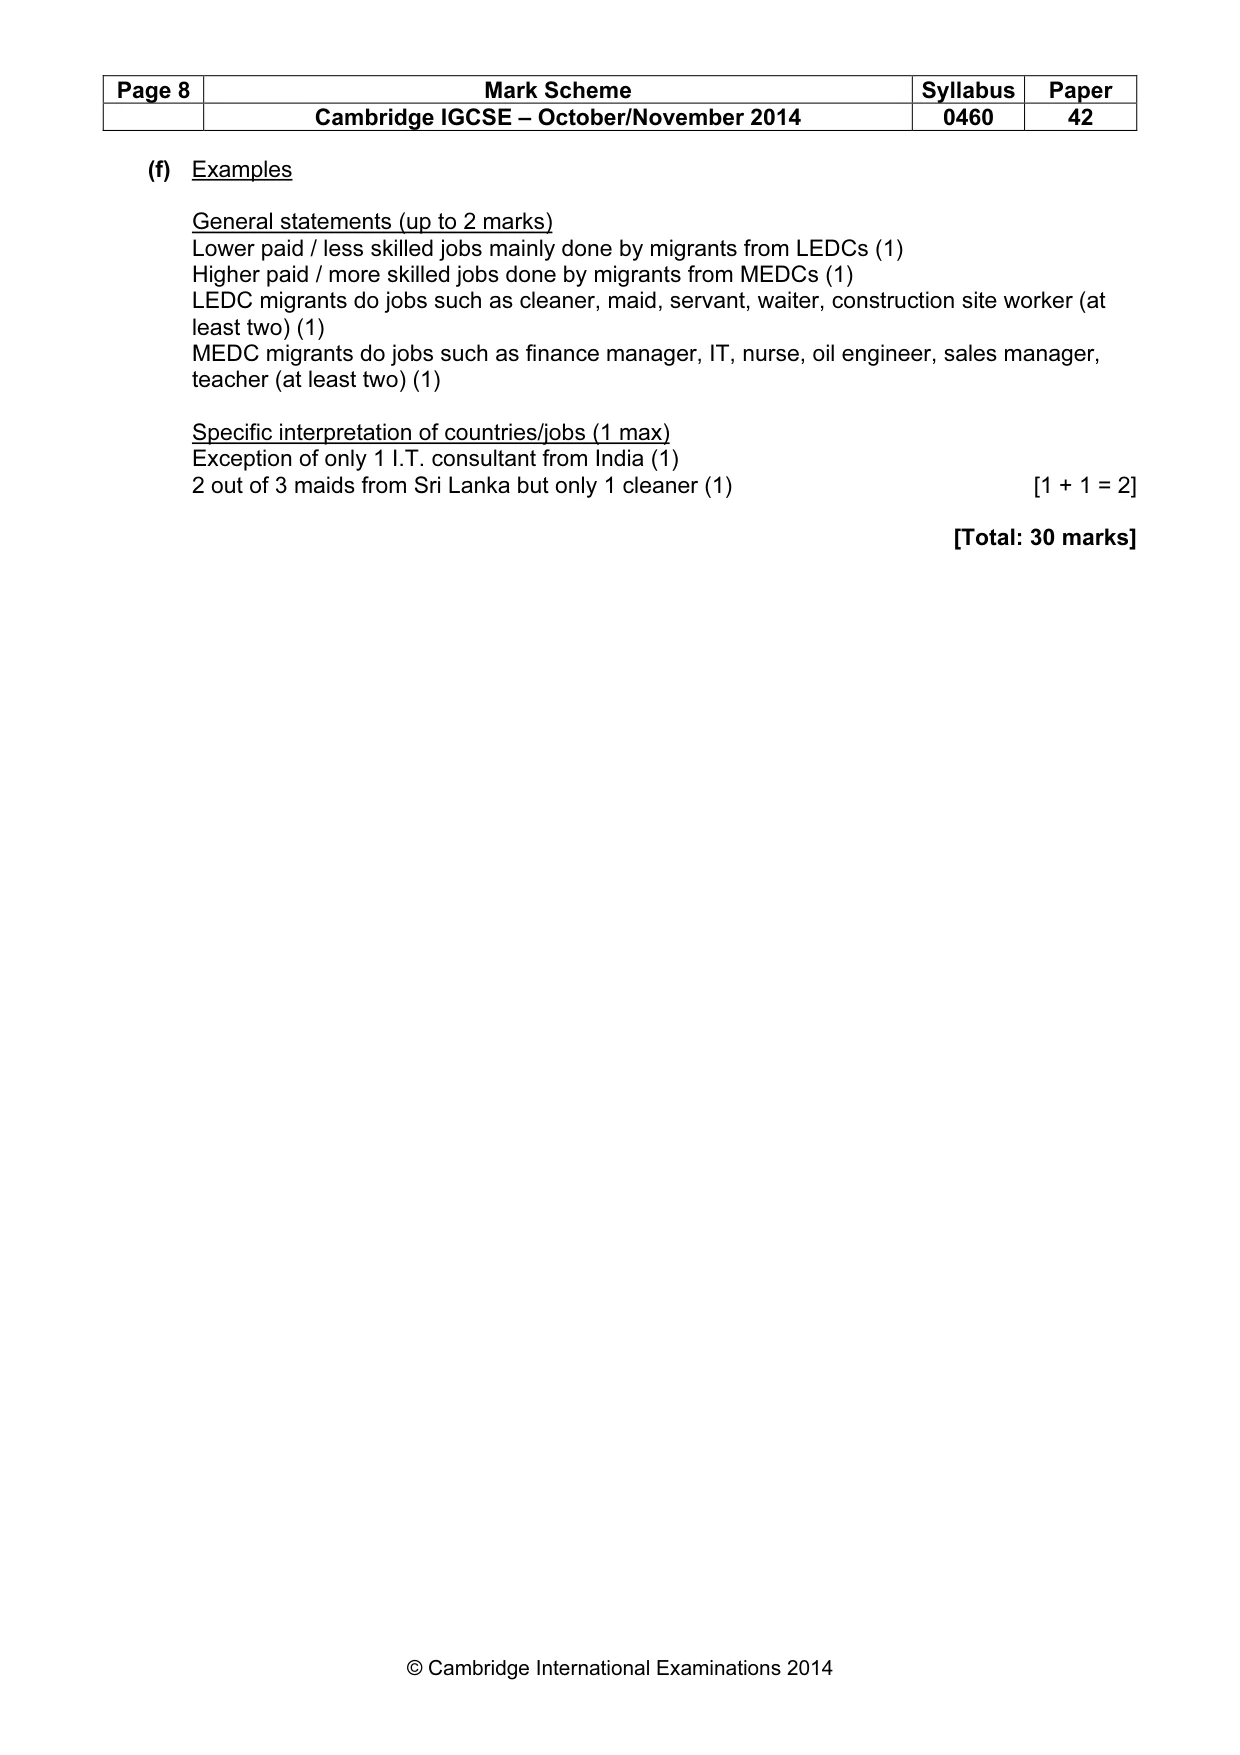
Page 8 Mark Scheme Syllabus Paper Cambridge IGCSE – October/November 2014 0460 42 © Cambridge International Examinations 2014 (f) Examples General statements (up to 2 marks) Lower paid / less skilled jobs mainly done by migrants from LEDCs (1) Higher paid / more skilled jobs done by migrants from MEDCs (1) LEDC migrants do jobs such as cleaner, maid, servant, waiter, construction site worker (at least two) (1) MEDC migrants do jobs such as finance manager, IT, nurse, oil engineer, sales manager, teacher (at least two) (1) Specific interpretation of countries/jobs (1 max) Exception of only 1 I.T. consultant from India (1) 2 out of 3 maids from Sri Lanka but only 1 cleaner (1) [1 + 1 = 2] [Total: 30 marks]
What you needed in this session
Cambridge’s own grade thresholds for 2014 Oct/Nov, Paper 4 · Variant 2. A higher threshold means an easier paper — the bar moves with how the cohort did.