Cambridge IGCSE Geography 0460 — 2014 Oct/Nov Paper 4 · Variant 1
0460/41/O/N/14 · 60 marks · ≈68 min
The question paper and its mark scheme, free to read here and free to download. This is Cambridge’s own paper, exactly as it was sat.
Question paper16 pages
Mark scheme5 pages
Answers below. Sit the paper first if you are practising.
Paper as text
Question paper, page 1
This document consists of 16 printed pages and 1 Insert. DC (SJF/KN) 81514/6 © UCLES 2014 [Turn over Cambridge International Examinations Cambridge International General Certificate of Secondary Education * 4 2 7 5 6 7 6 9 4 6 * GEOGRAPHY 0460/41 Paper 4 Alternative to Coursework October/November 2014 1 hour 30 minutes Candidates answer on the Question Paper. Additional Materials: Calculator Ruler READ THESE INSTRUCTIONS FIRST Write your Centre number, candidate number and name in the spaces provided. Write in dark blue or black pen. You may use an HB pencil for any diagrams or graphs. Do not use staples, paper clips, glue or correction fluid. DO NOT WRITE IN ANY BARCODES. Answer all questions. The Insert contains Fig. 3 for Question 1. The Insert is not required by the Examiner. Sketch maps and diagrams should be drawn whenever they serve to illustrate an answer. At the end of the examination, fasten all your work securely together. The number of marks is given in brackets [ ] at the end of each question or part question. The syllabus is approved for use in England, Wales and Northern Ireland as a Cambridge International Level 1/Level 2 Certificate.
Question paper, page 2
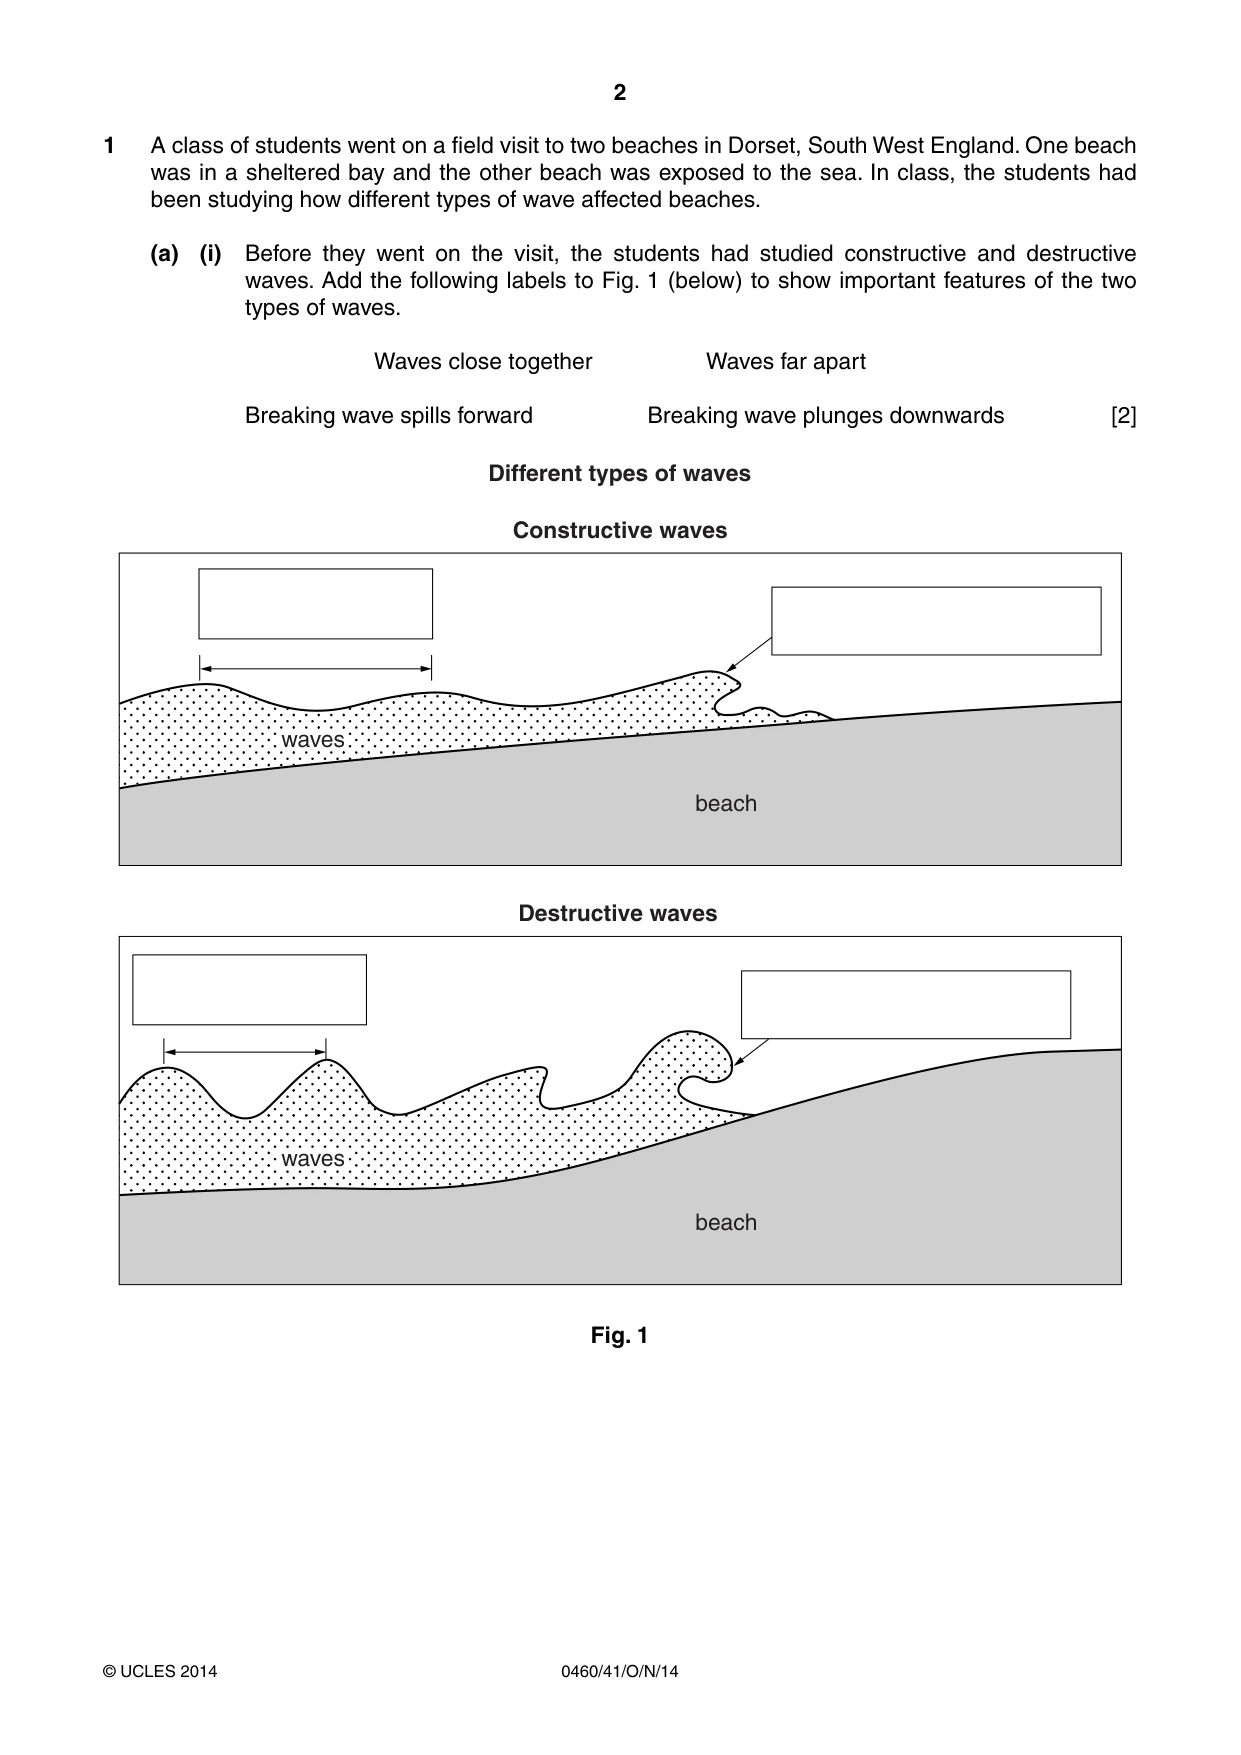
2 0460/41/O/N/14 © UCLES 2014 1 A class of students went on a field visit to two beaches in Dorset, South West England. One beach was in a sheltered bay and the other beach was exposed to the sea. In class, the students had been studying how different types of wave affected beaches. (a) (i) Before they went on the visit, the students had studied constructive and destructive waves. Add the following labels to Fig. 1 (below) to show important features of the two types of waves. Waves close together Waves far apart Breaking wave spills forward Breaking wave plunges downwards [2] Constructive waves beach waves Destructive waves beach waves Different types of waves Fig. 1
Question paper, page 3
3 0460/41/O/N/14 © UCLES 2014 [Turn over (ii) Wave frequency is the number of waves per minute. The students had learned that destructive waves have a higher frequency than constructive waves. Describe a method they could use to measure wave frequency on the field visit. … … … … … …[3]
Question paper, page 4
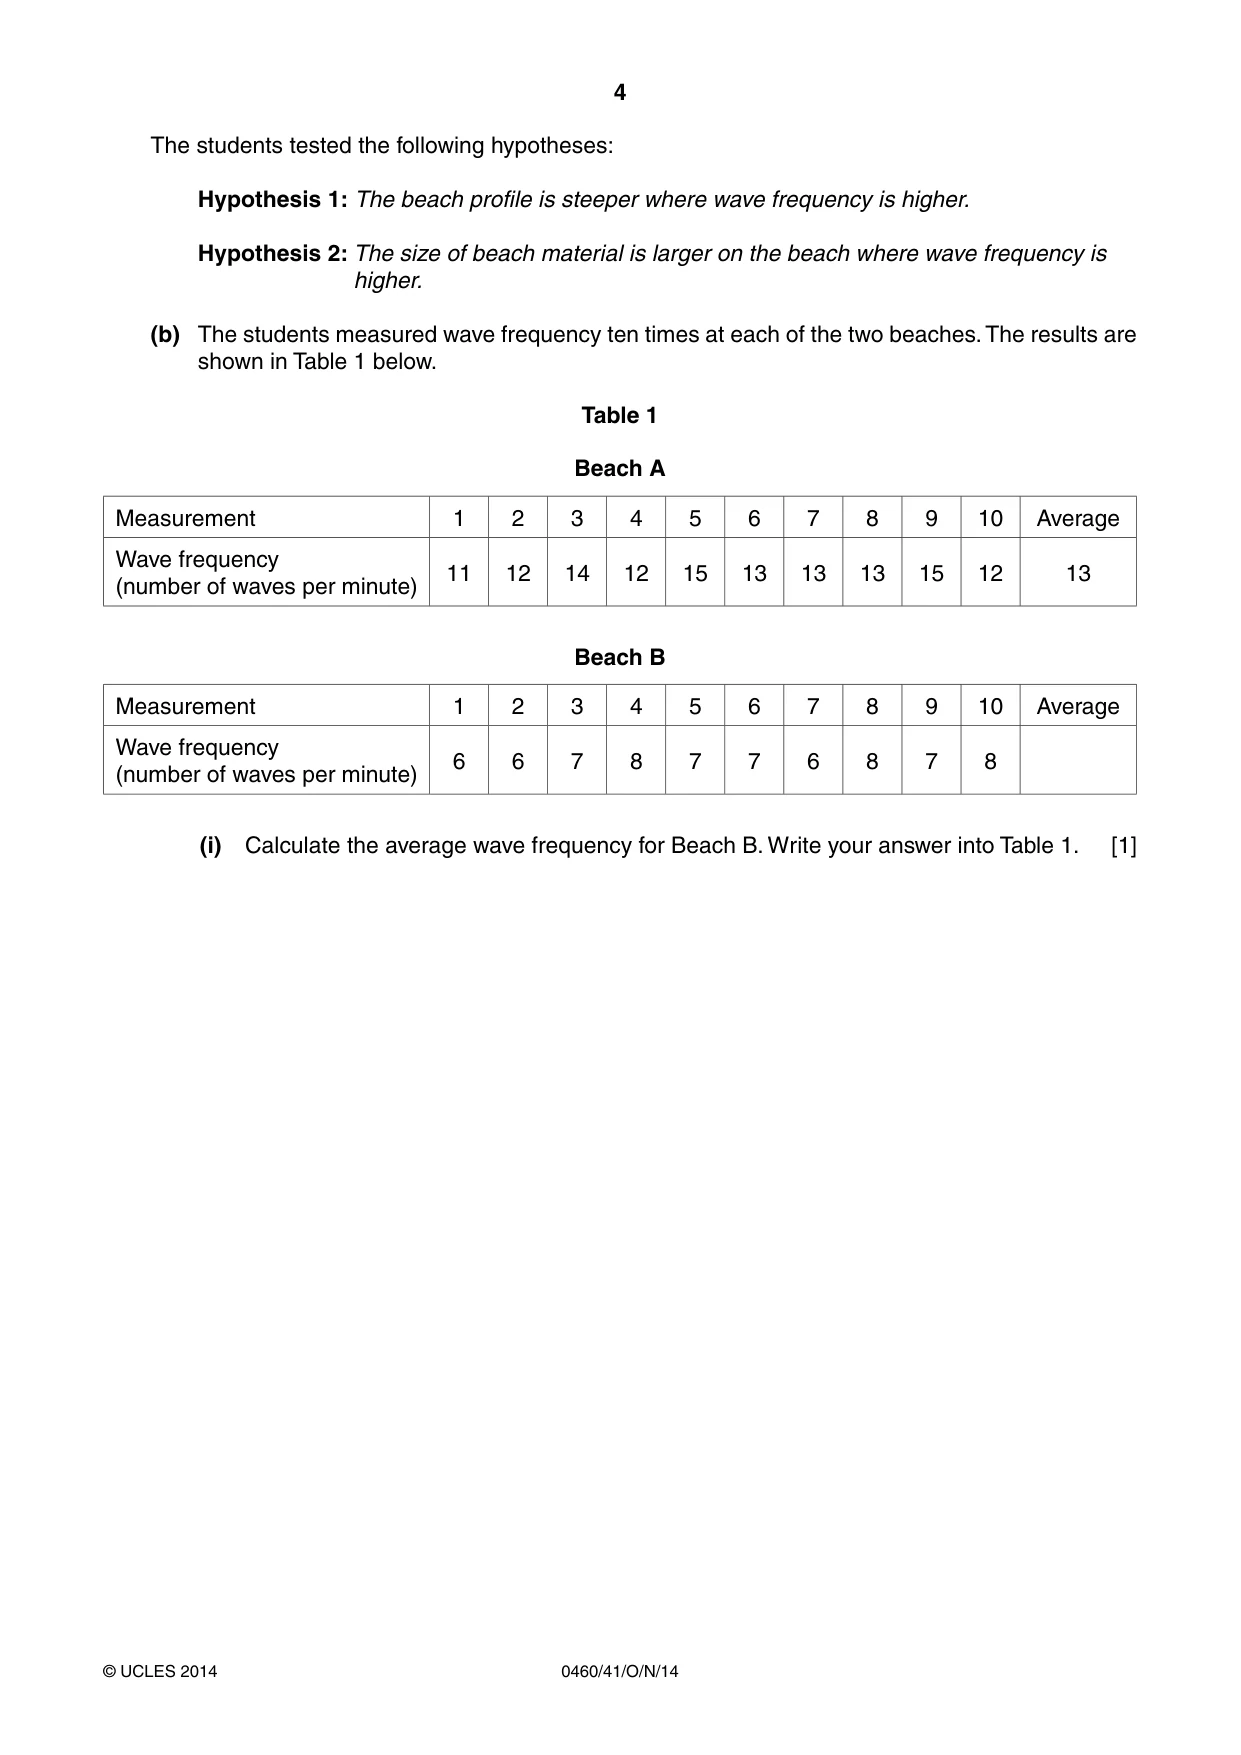
4 0460/41/O/N/14 © UCLES 2014 The students tested the following hypotheses: Hypothesis 1: The beach profile is steeper where wave frequency is higher. Hypothesis 2: The size of beach material is larger on the beach where wave frequency is higher. (b) The students measured wave frequency ten times at each of the two beaches. The results are shown in Table 1 below. Table 1 Beach A Measurement 1 2 3 4 5 6 7 8 9 10 Average Wave frequency (number of waves per minute) 11 12 14 12 15 13 13 13 15 12 13 Beach B Measurement 1 2 3 4 5 6 7 8 9 10 Average Wave frequency (number of waves per minute) 6 6 7 8 7 7 6 8 7 8 (i) Calculate the average wave frequency for Beach B. Write your answer into Table 1. [1]
Question paper, page 5
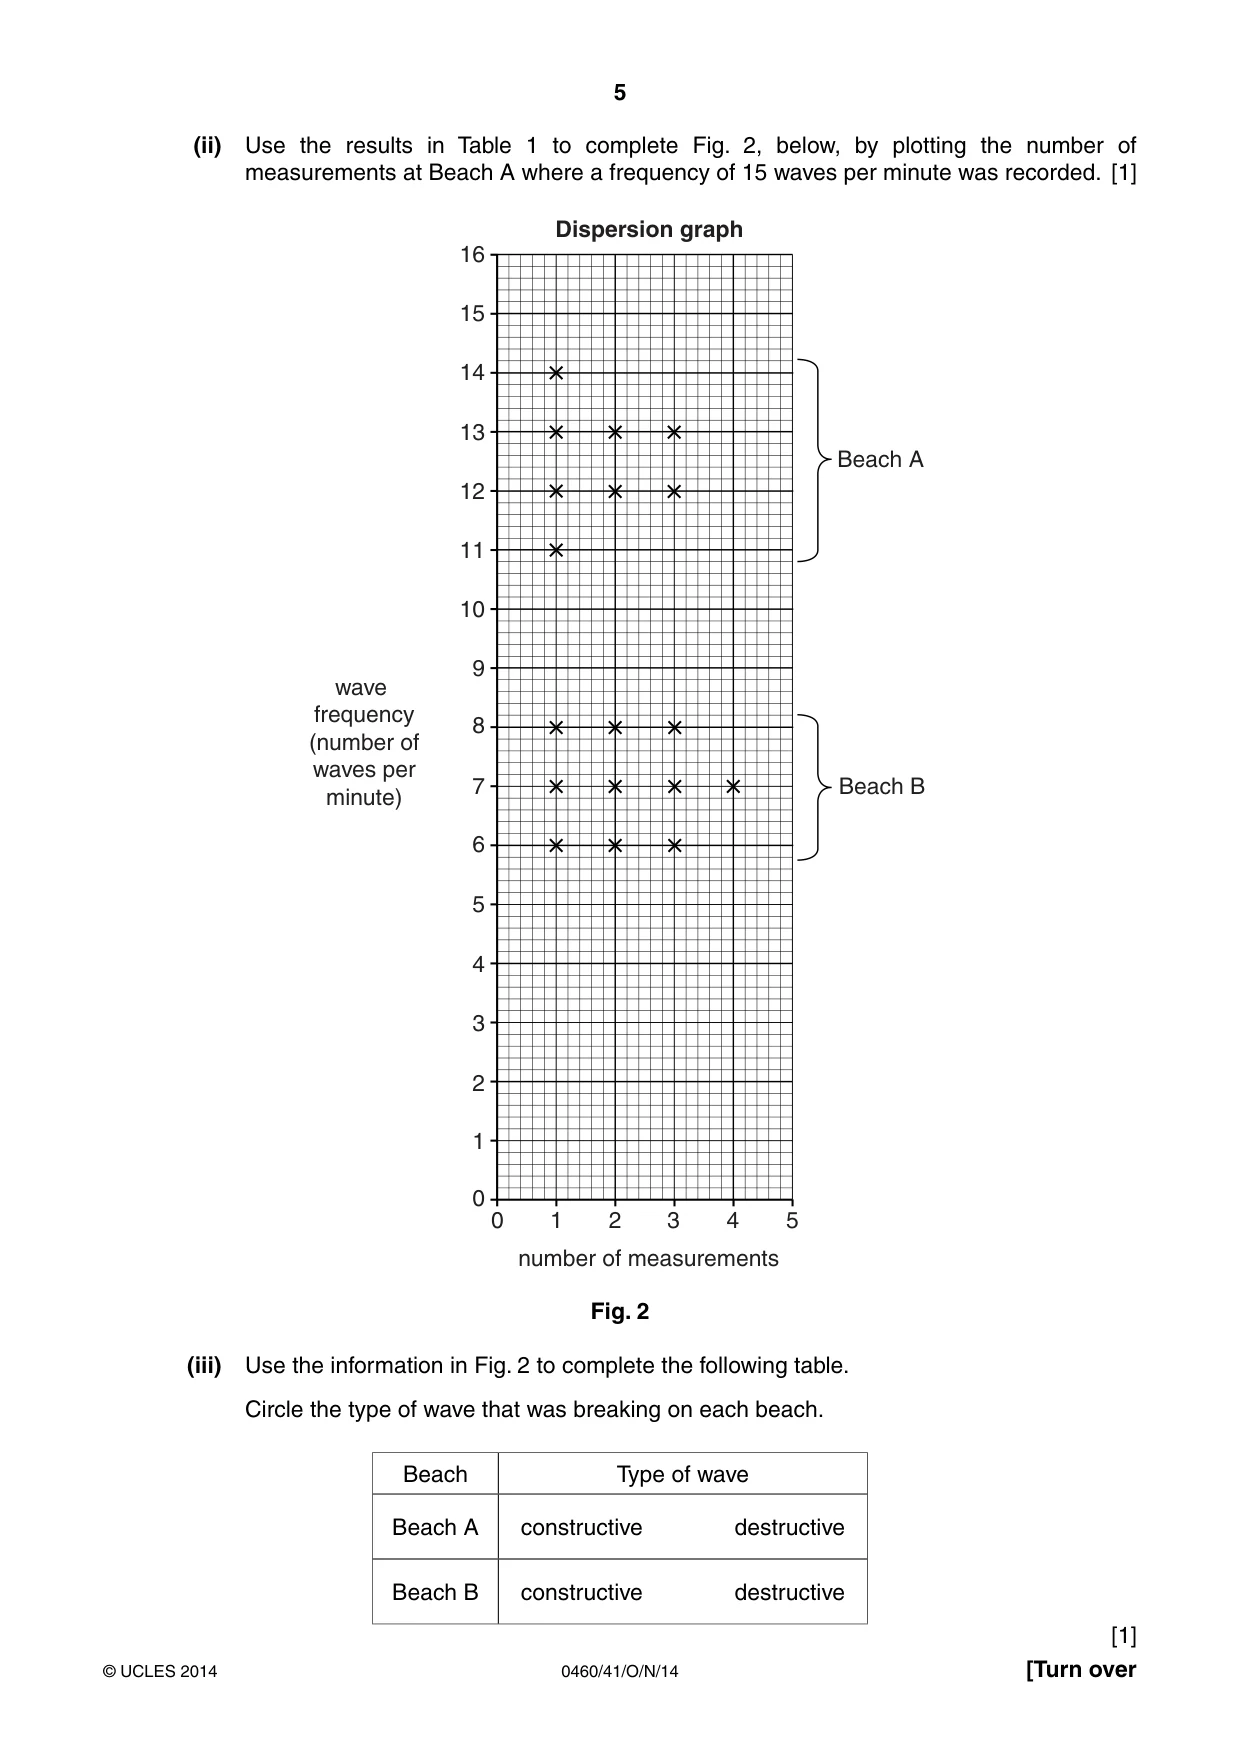
5 0460/41/O/N/14 © UCLES 2014 [Turn over (ii) Use the results in Table 1 to complete Fig. 2, below, by plotting the number of measurements at Beach A where a frequency of 15 waves per minute was recorded. [1] 9 10 11 12 13 14 15 16 8 7 6 5 4 3 2 1 0 0 1 2 3 4 5 wave frequency (number of waves per minute) number of measurements Beach A Dispersion graph Beach B Fig. 2 (iii) Use the information in Fig. 2 to complete the following table. Circle the type of wave that was breaking on each beach. Beach Type of wave Beach A constructive destructive Beach B constructive destructive [1]
Question paper, page 6
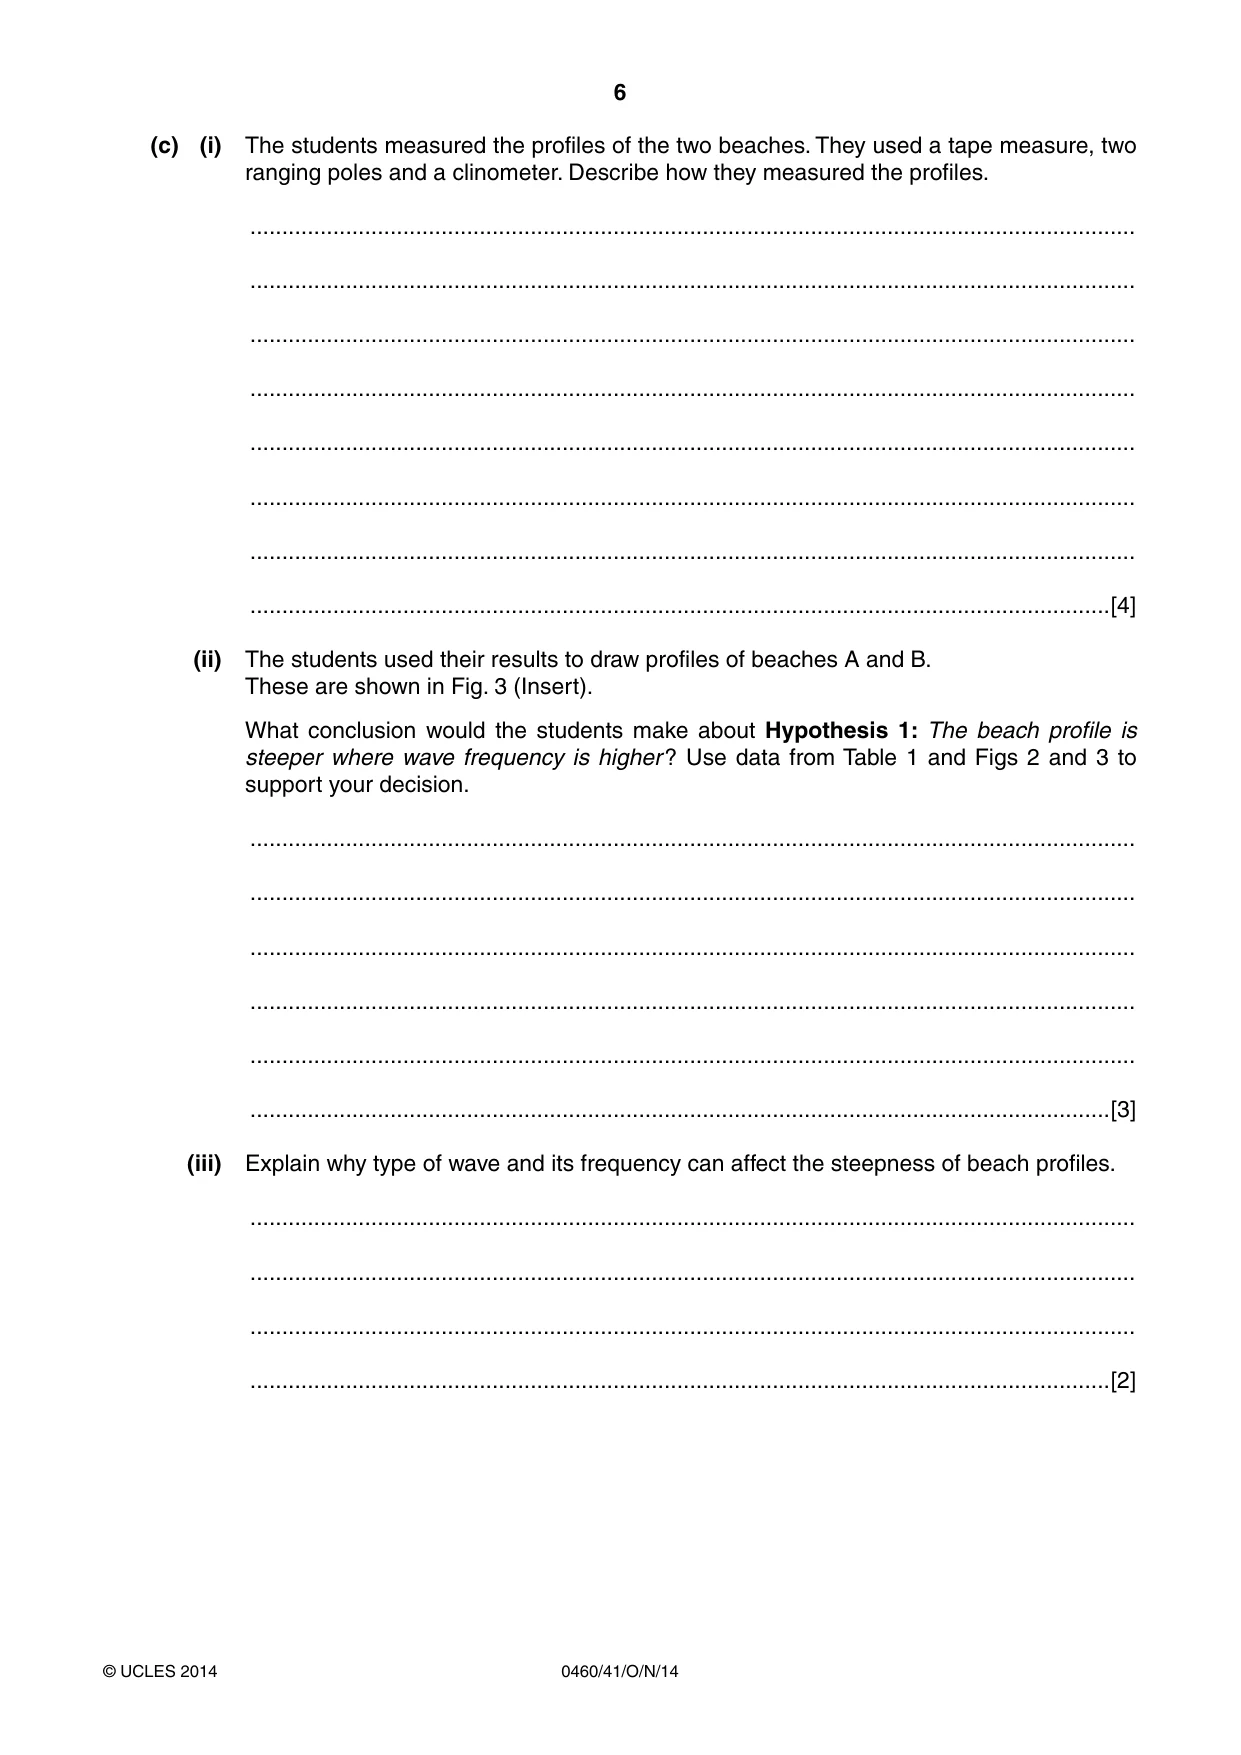
6 0460/41/O/N/14 © UCLES 2014 (c) (i) The students measured the profiles of the two beaches. They used a tape measure, two ranging poles and a clinometer. Describe how they measured the profiles. … … … … … … … …[4] (ii) The students used their results to draw profiles of beaches A and B. These are shown in Fig. 3 (Insert). What conclusion would the students make about Hypothesis 1: The beach profile is steeper where wave frequency is higher ? Use data from Table 1 and Figs 2 and 3 to support your decision. … … … … … …[3] (iii) Explain why type of wave and its frequency can affect the steepness of beach profiles. … … … …[2]
Question paper, page 7
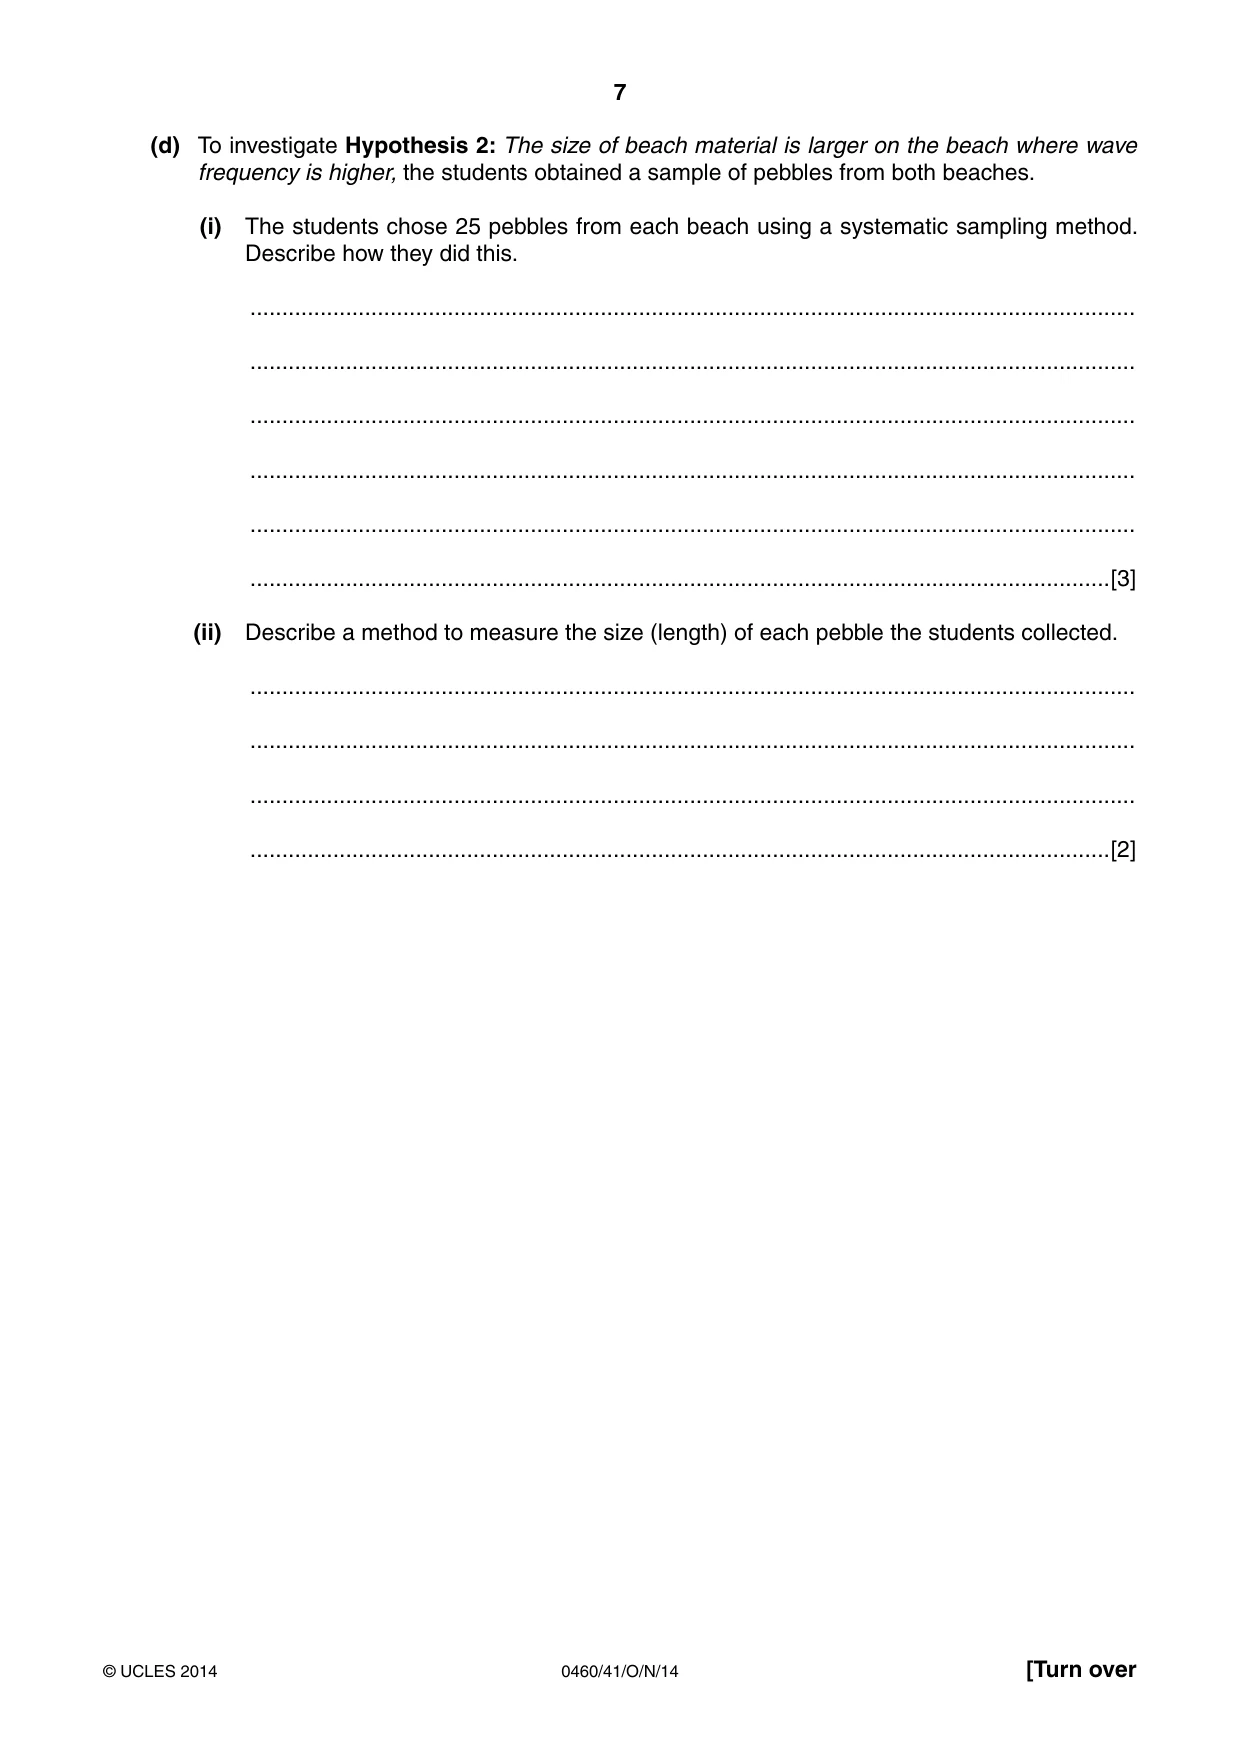
7 0460/41/O/N/14 © UCLES 2014 [Turn over (d) To investigate Hypothesis 2: The size of beach material is larger on the beach where wave frequency is higher, the students obtained a sample of pebbles from both beaches. (i) The students chose 25 pebbles from each beach using a systematic sampling method. Describe how they did this. … … … … … …[3] (ii) Describe a method to measure the size (length) of each pebble the students collected. … … … …[2]
Question paper, page 8
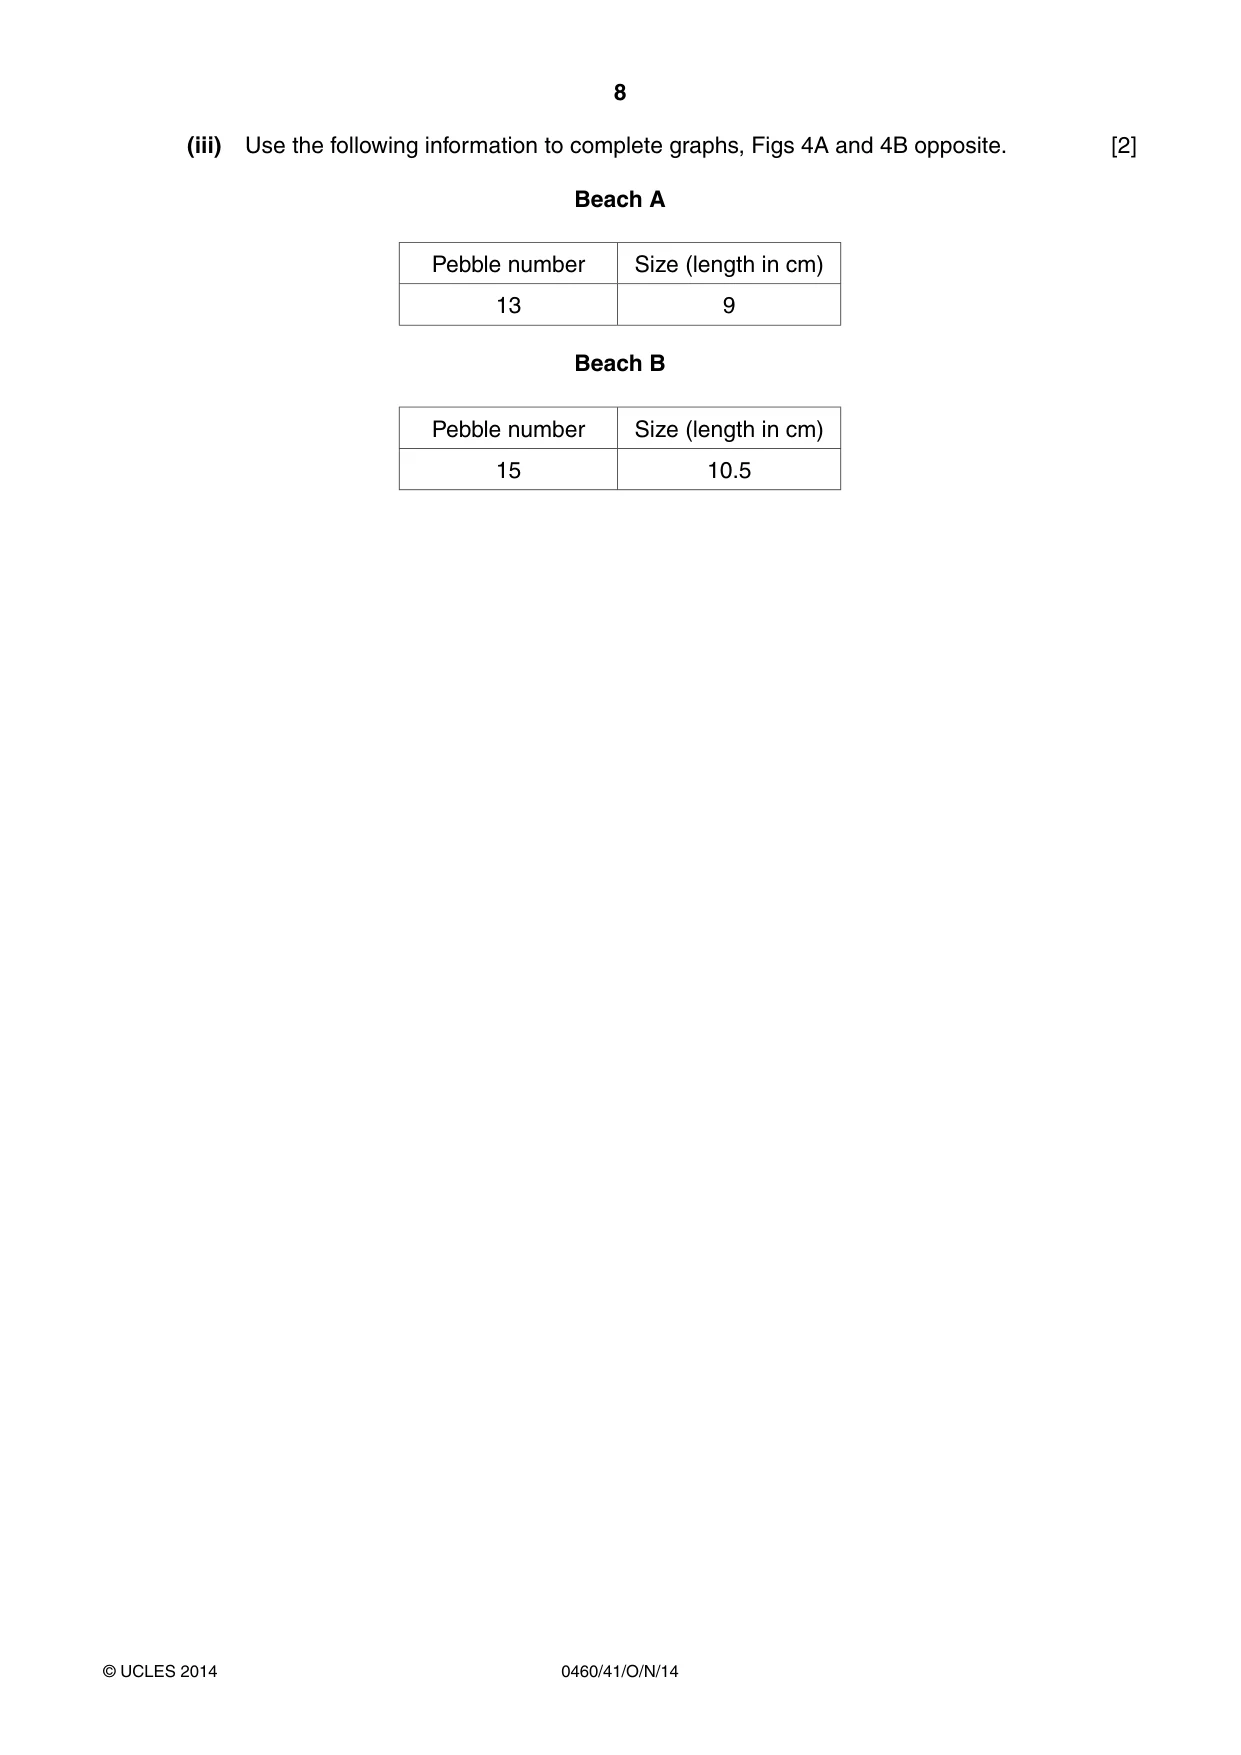
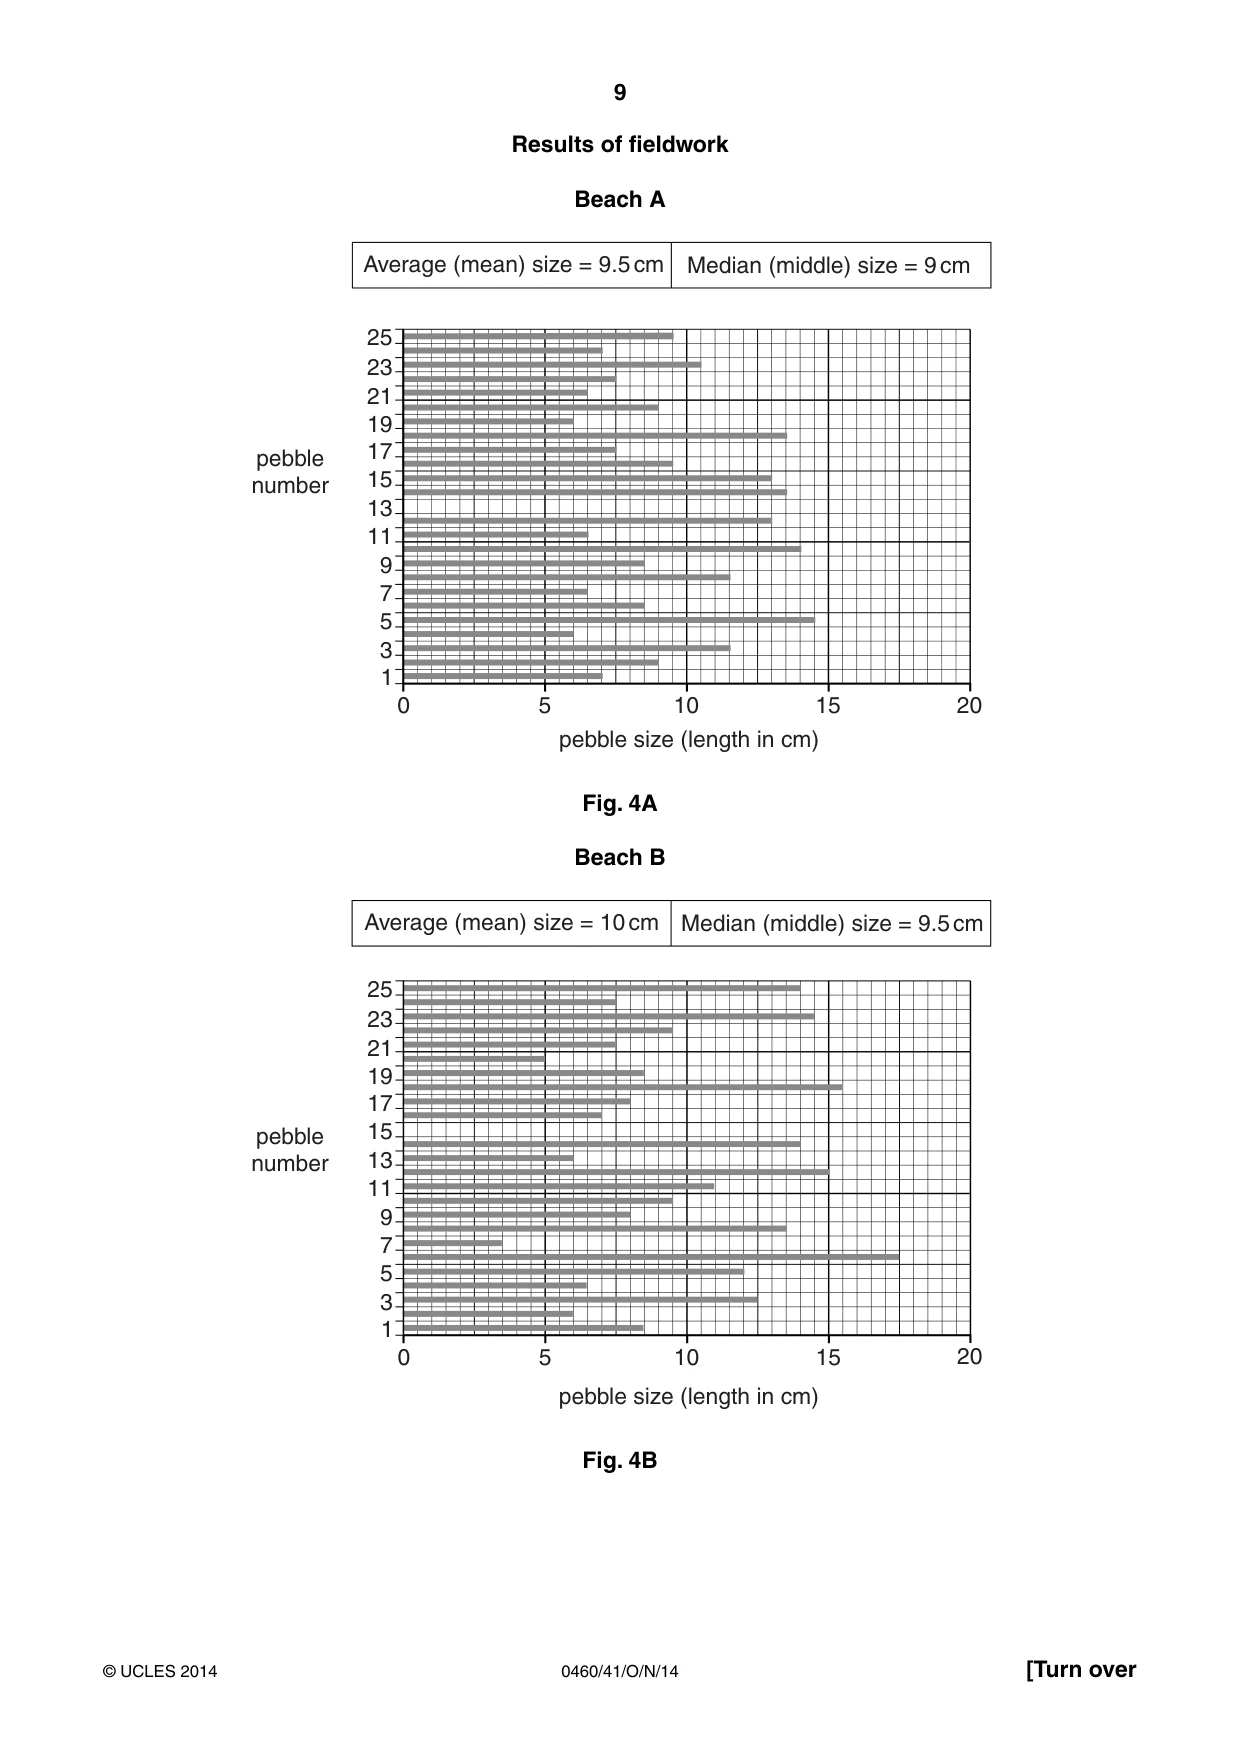
8 0460/41/O/N/14 © UCLES 2014 (iii) Use the following information to complete graphs, Figs 4A and 4B opposite. [2] Beach A Pebble number Size (length in cm) 13 9 Beach B Pebble number Size (length in cm) 15 10.5
Question paper, page 9
9 0460/41/O/N/14 © UCLES 2014 [Turn over Results of fieldwork Beach A 3 5 7 9 11 13 15 17 19 21 23 25 1 0 5 10 15 20 pebble number pebble size (length in cm) Average (mean) size = 9.5 cm Median (middle) size = 9 cm Fig. 4A Beach B 3 5 7 9 11 13 15 17 19 21 23 25 1 0 5 10 15 20 pebble number pebble size (length in cm) Average (mean) size = 10 cm Median (middle) size = 9.5 cm Fig. 4B
Question paper, page 10
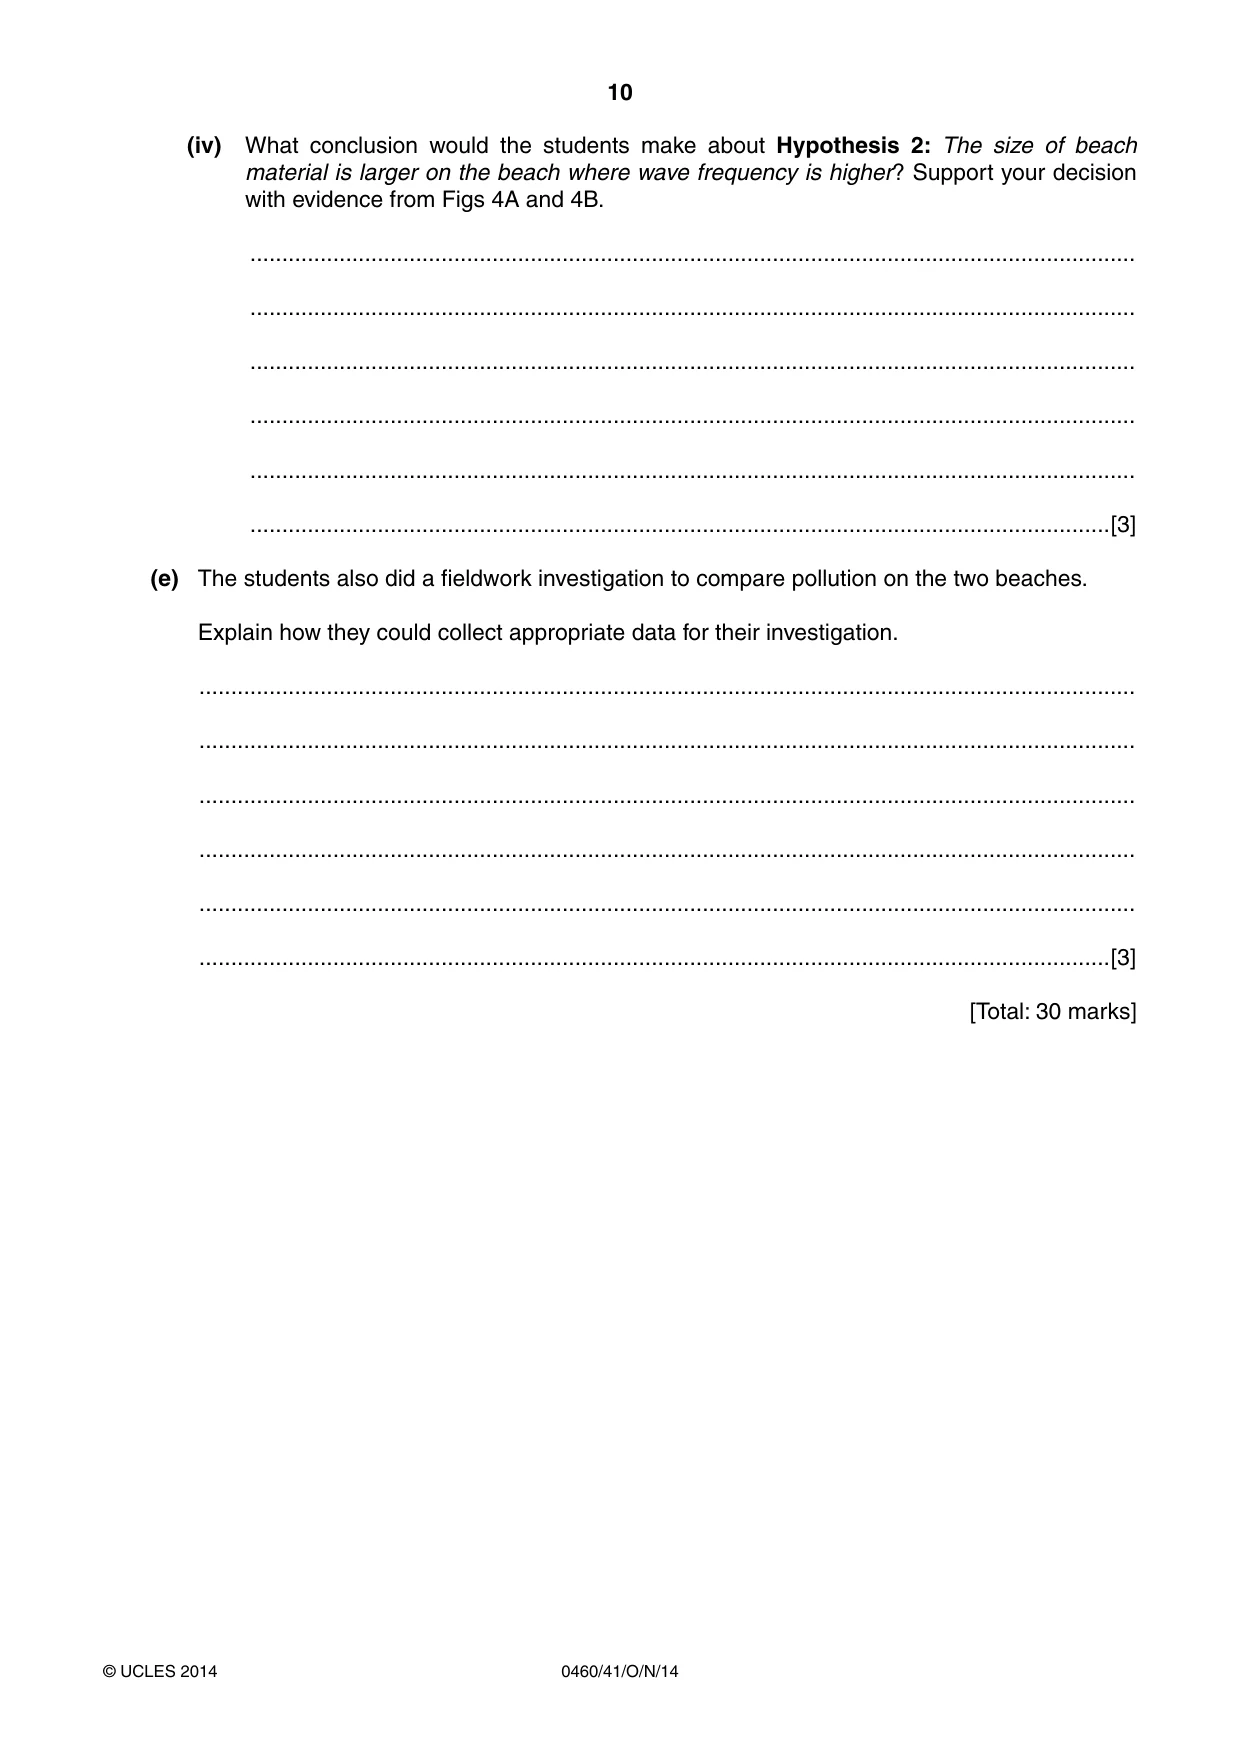
10 0460/41/O/N/14 © UCLES 2014 (iv) What conclusion would the students make about Hypothesis 2: The size of beach material is larger on the beach where wave frequency is higher? Support your decision with evidence from Figs 4A and 4B. … … … … … …[3] (e) The students also did a fieldwork investigation to compare pollution on the two beaches. Explain how they could collect appropriate data for their investigation. … … … … … …[3] [Total: 30 marks]
Question paper, page 11
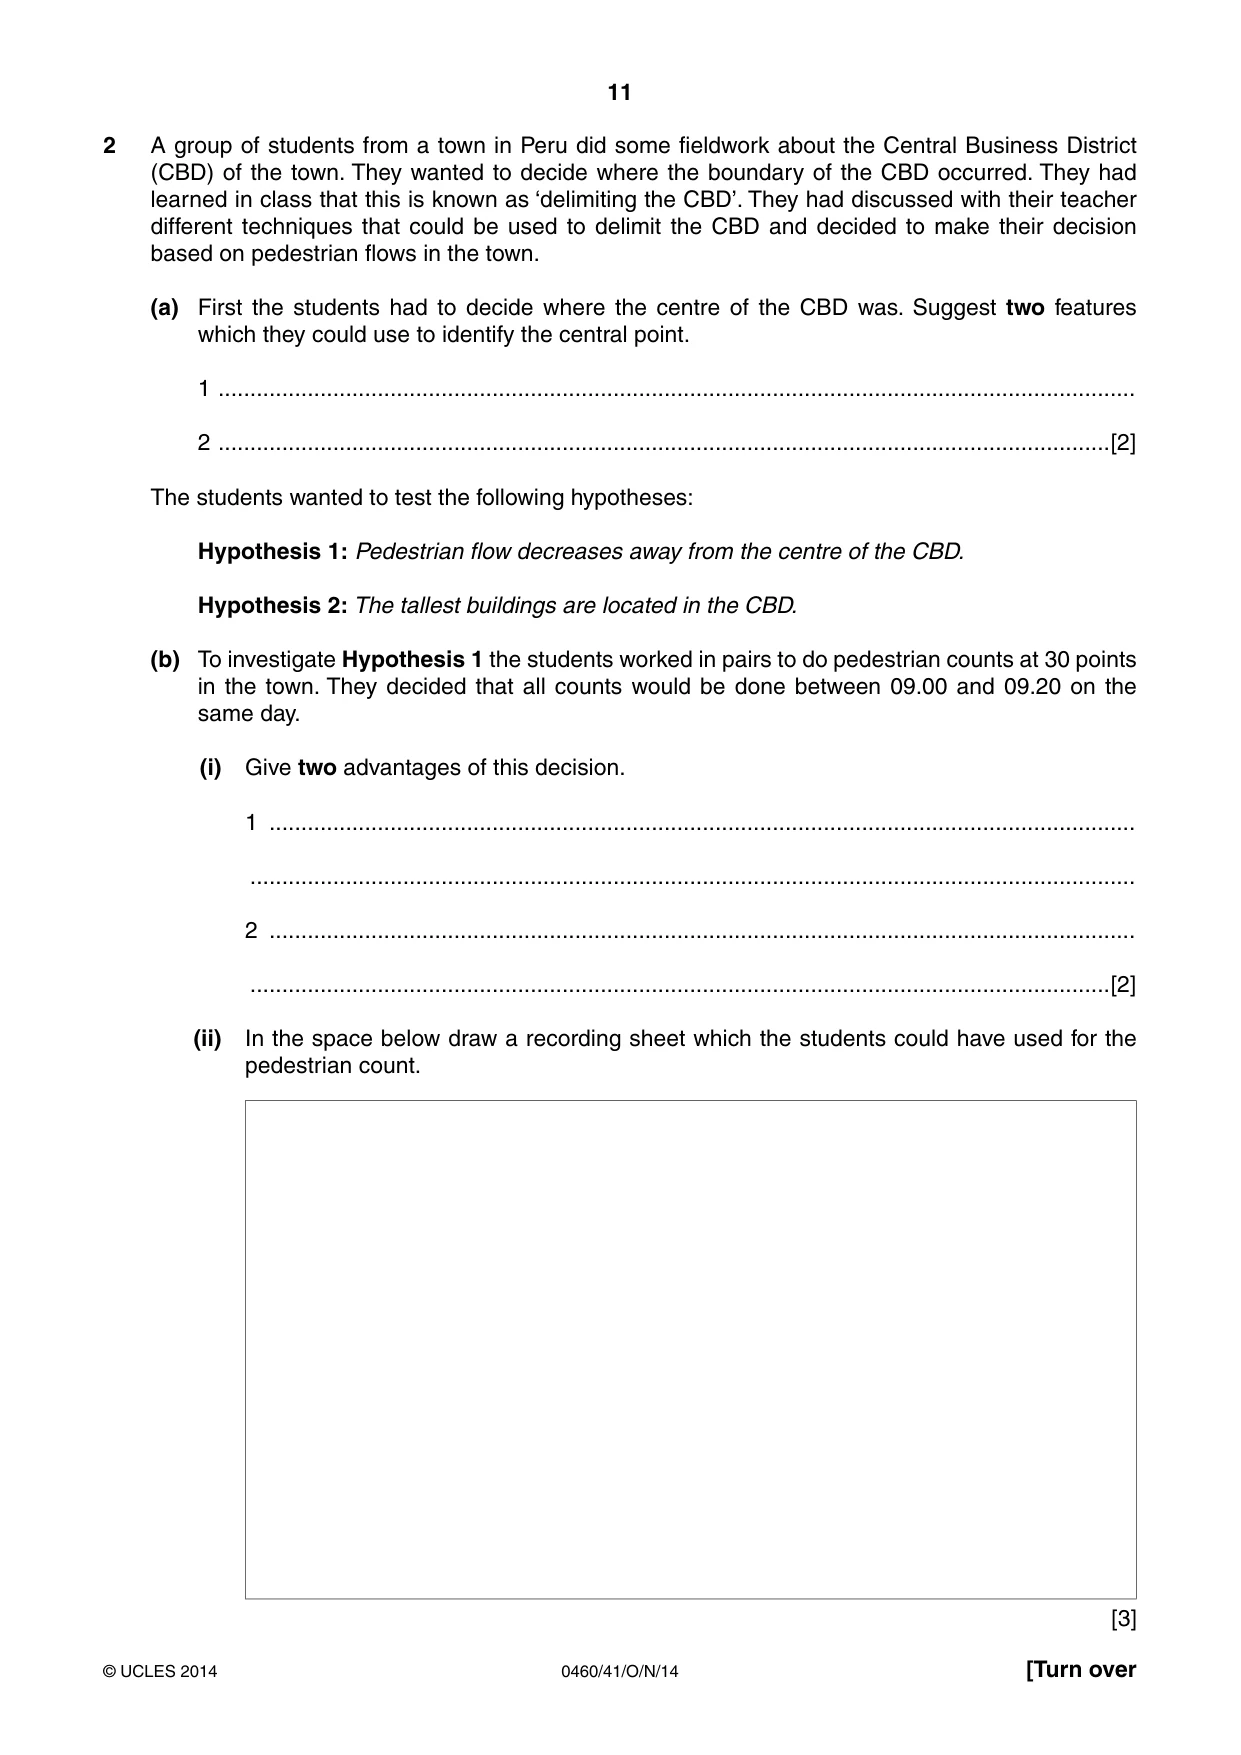
11 0460/41/O/N/14 © UCLES 2014 [Turn over 2 A group of students from a town in Peru did some fieldwork about the Central Business District (CBD) of the town. They wanted to decide where the boundary of the CBD occurred. They had learned in class that this is known as ‘delimiting the CBD’. They had discussed with their teacher different techniques that could be used to delimit the CBD and decided to make their decision based on pedestrian flows in the town. (a) First the students had to decide where the centre of the CBD was. Suggest two features which they could use to identify the central point. 1 … 2 …[2] The students wanted to test the following hypotheses: Hypothesis 1: Pedestrian flow decreases away from the centre of the CBD. Hypothesis 2: The tallest buildings are located in the CBD. (b) To investigate Hypothesis 1 the students worked in pairs to do pedestrian counts at 30 points in the town. They decided that all counts would be done between 09.00 and 09.20 on the same day. (i) Give two advantages of this decision. 1 … … 2 … …[2] (ii) In the space below draw a recording sheet which the students could have used for the pedestrian count. [3]
Question paper, page 12
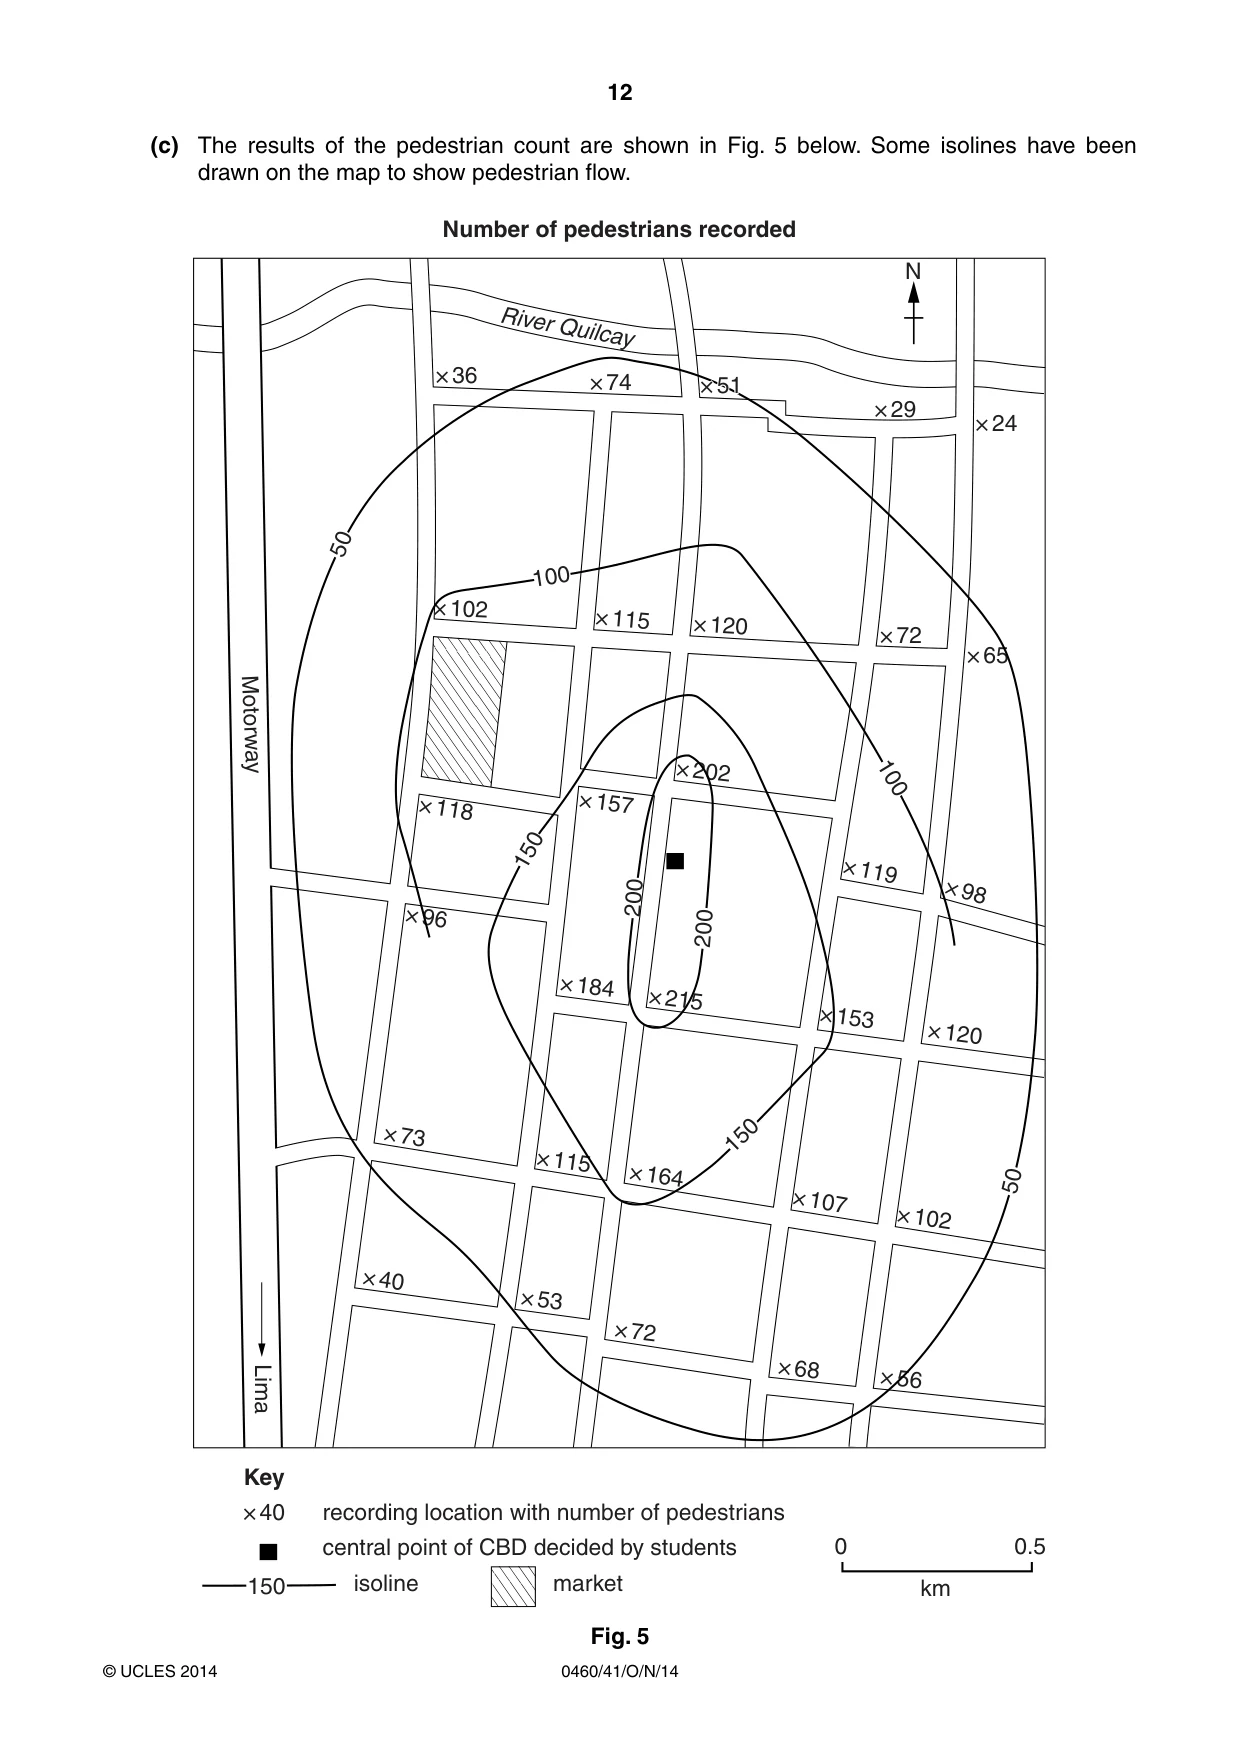
12 0460/41/O/N/14 © UCLES 2014 (c) The results of the pedestrian count are shown in Fig. 5 below. Some isolines have been drawn on the map to show pedestrian flow. Number of pedestrians recorded River Quilcay × 36 × 74 × 29 × 24 × 72 × 65 × 120 × 157 × 119 × 98 × 153 × 120 × 215 × 184 × 73 × 115 × 164 × 107 × 102 × 40 × 53 × 72 × 68 × 96 × 115 × 118 × 102 Motorway N × 202 × 202 × 56 × 56 Key × 40 recording location with number of pedestrians central point of CBD decided by students isoline market 150 0 0.5 km 50 × 51 × 51 50 100 100 150 150 200 200 Lima Fig. 5
Question paper, page 13
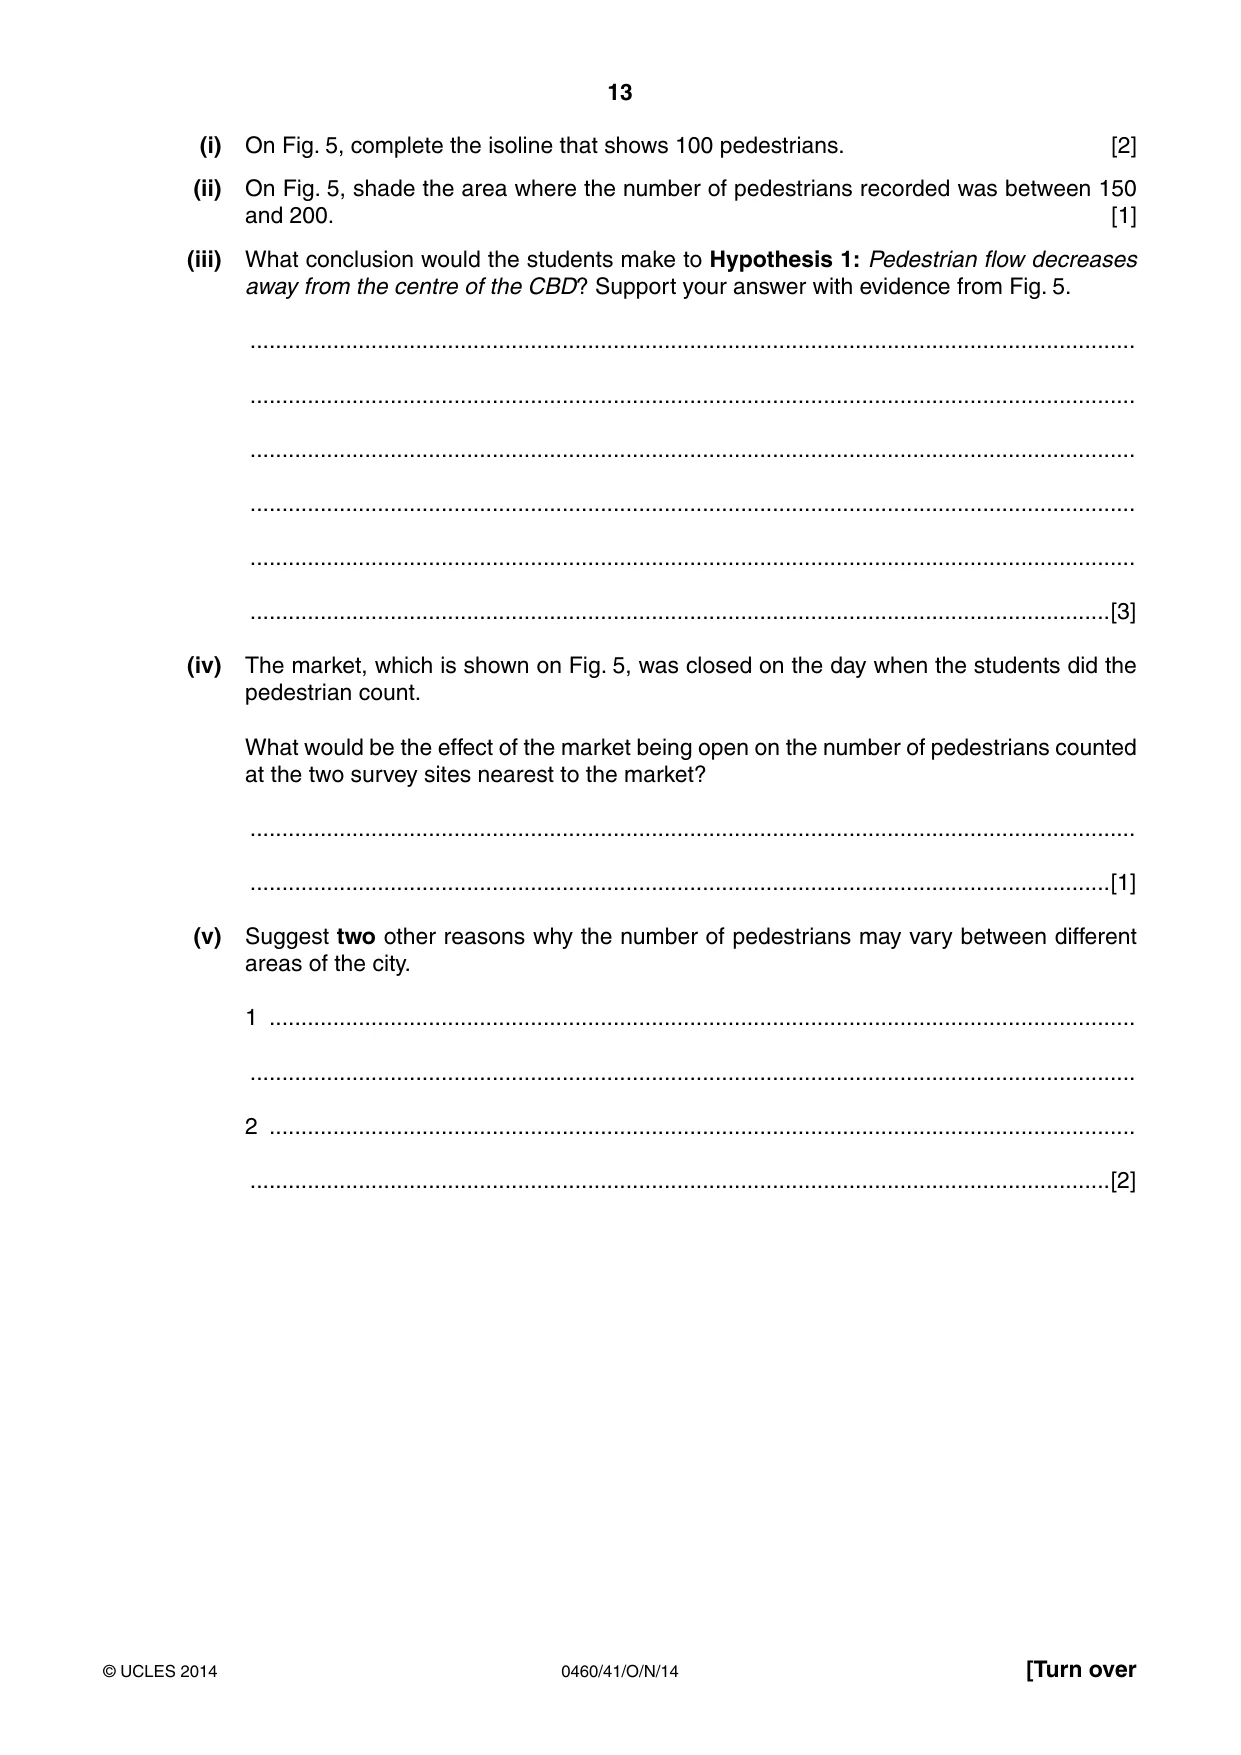
13 0460/41/O/N/14 © UCLES 2014 [Turn over (i) On Fig. 5, complete the isoline that shows 100 pedestrians. [2] (ii) On Fig. 5, shade the area where the number of pedestrians recorded was between 150 and 200. [1] (iii) What conclusion would the students make to Hypothesis 1: Pedestrian flow decreases away from the centre of the CBD? Support your answer with evidence from Fig. 5. … … … … … …[3] (iv) The market, which is shown on Fig. 5, was closed on the day when the students did the pedestrian count. What would be the effect of the market being open on the number of pedestrians counted at the two survey sites nearest to the market? … …[1] (v) Suggest two other reasons why the number of pedestrians may vary between different areas of the city. 1 … … 2 … …[2]
Question paper, page 14
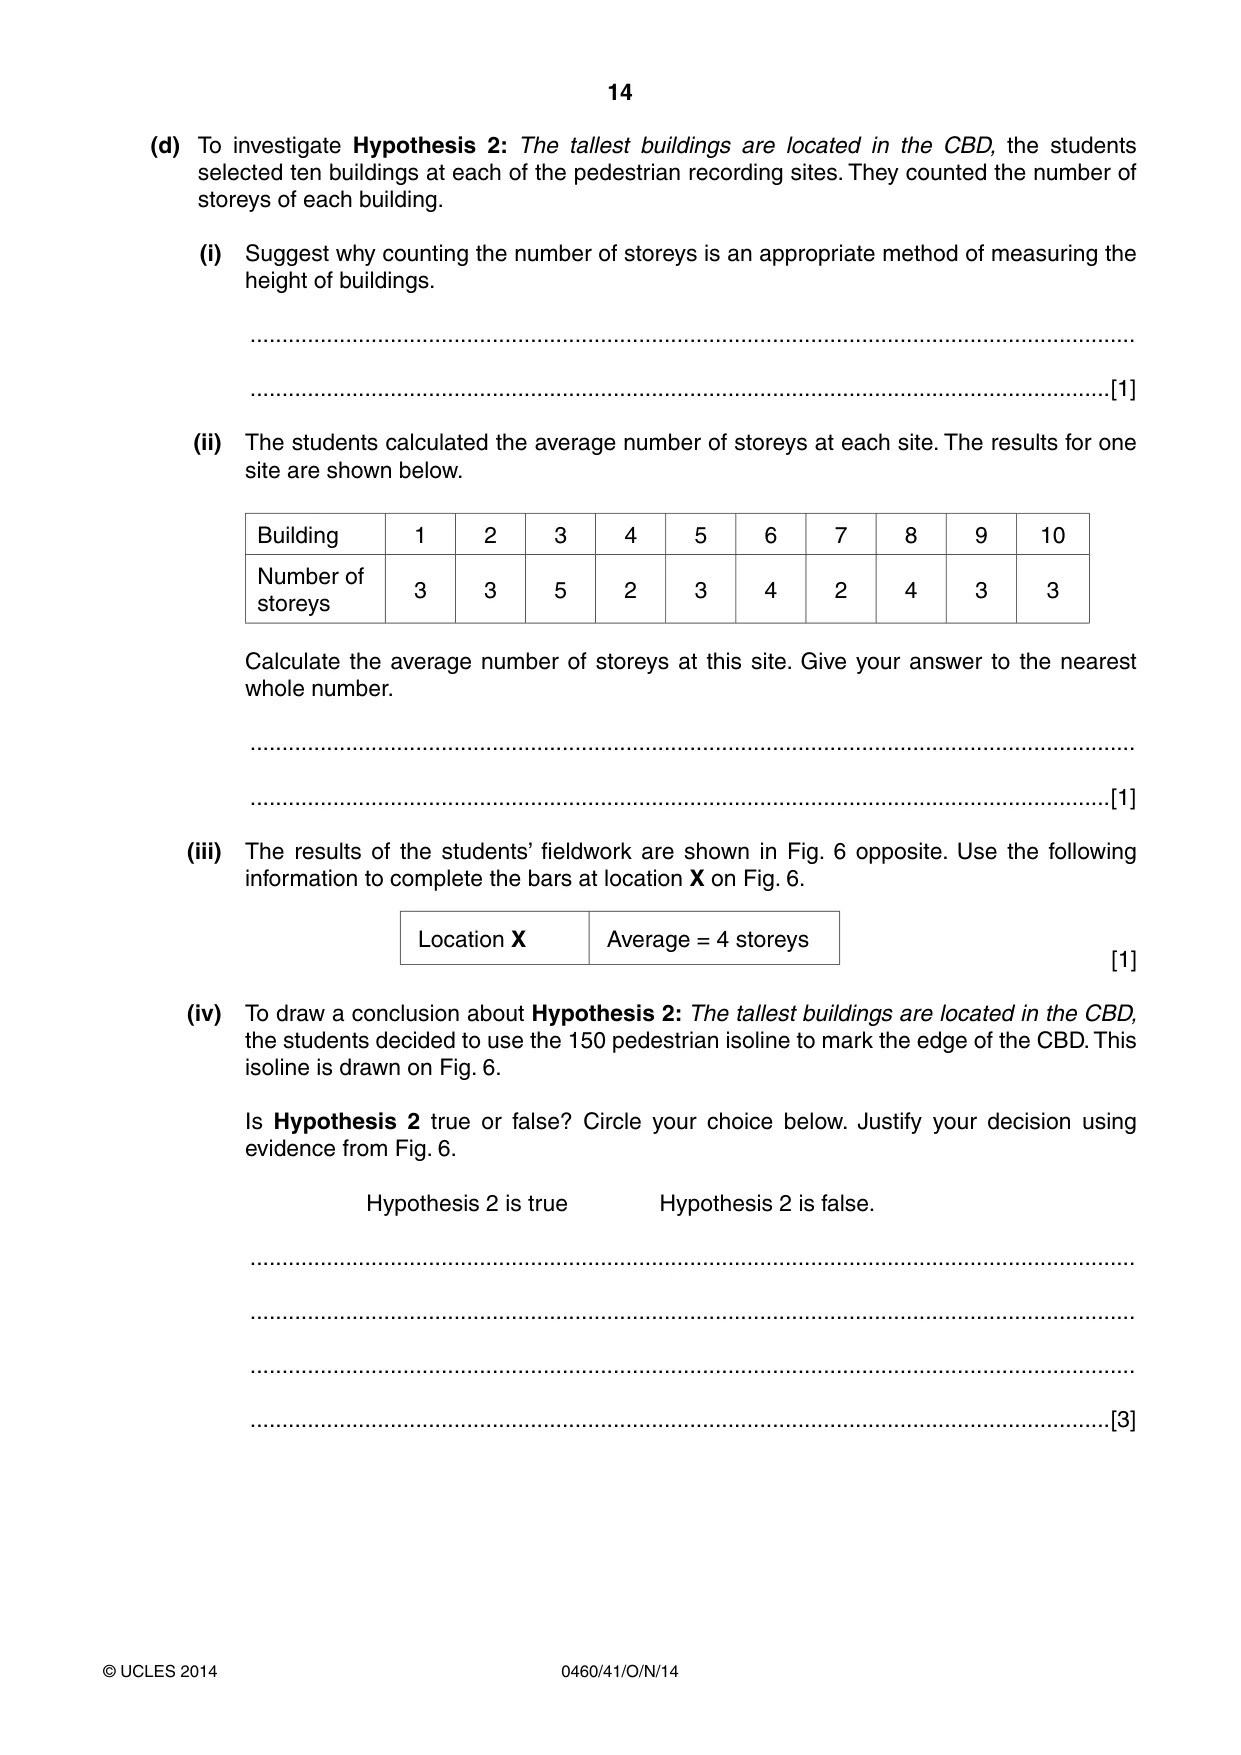
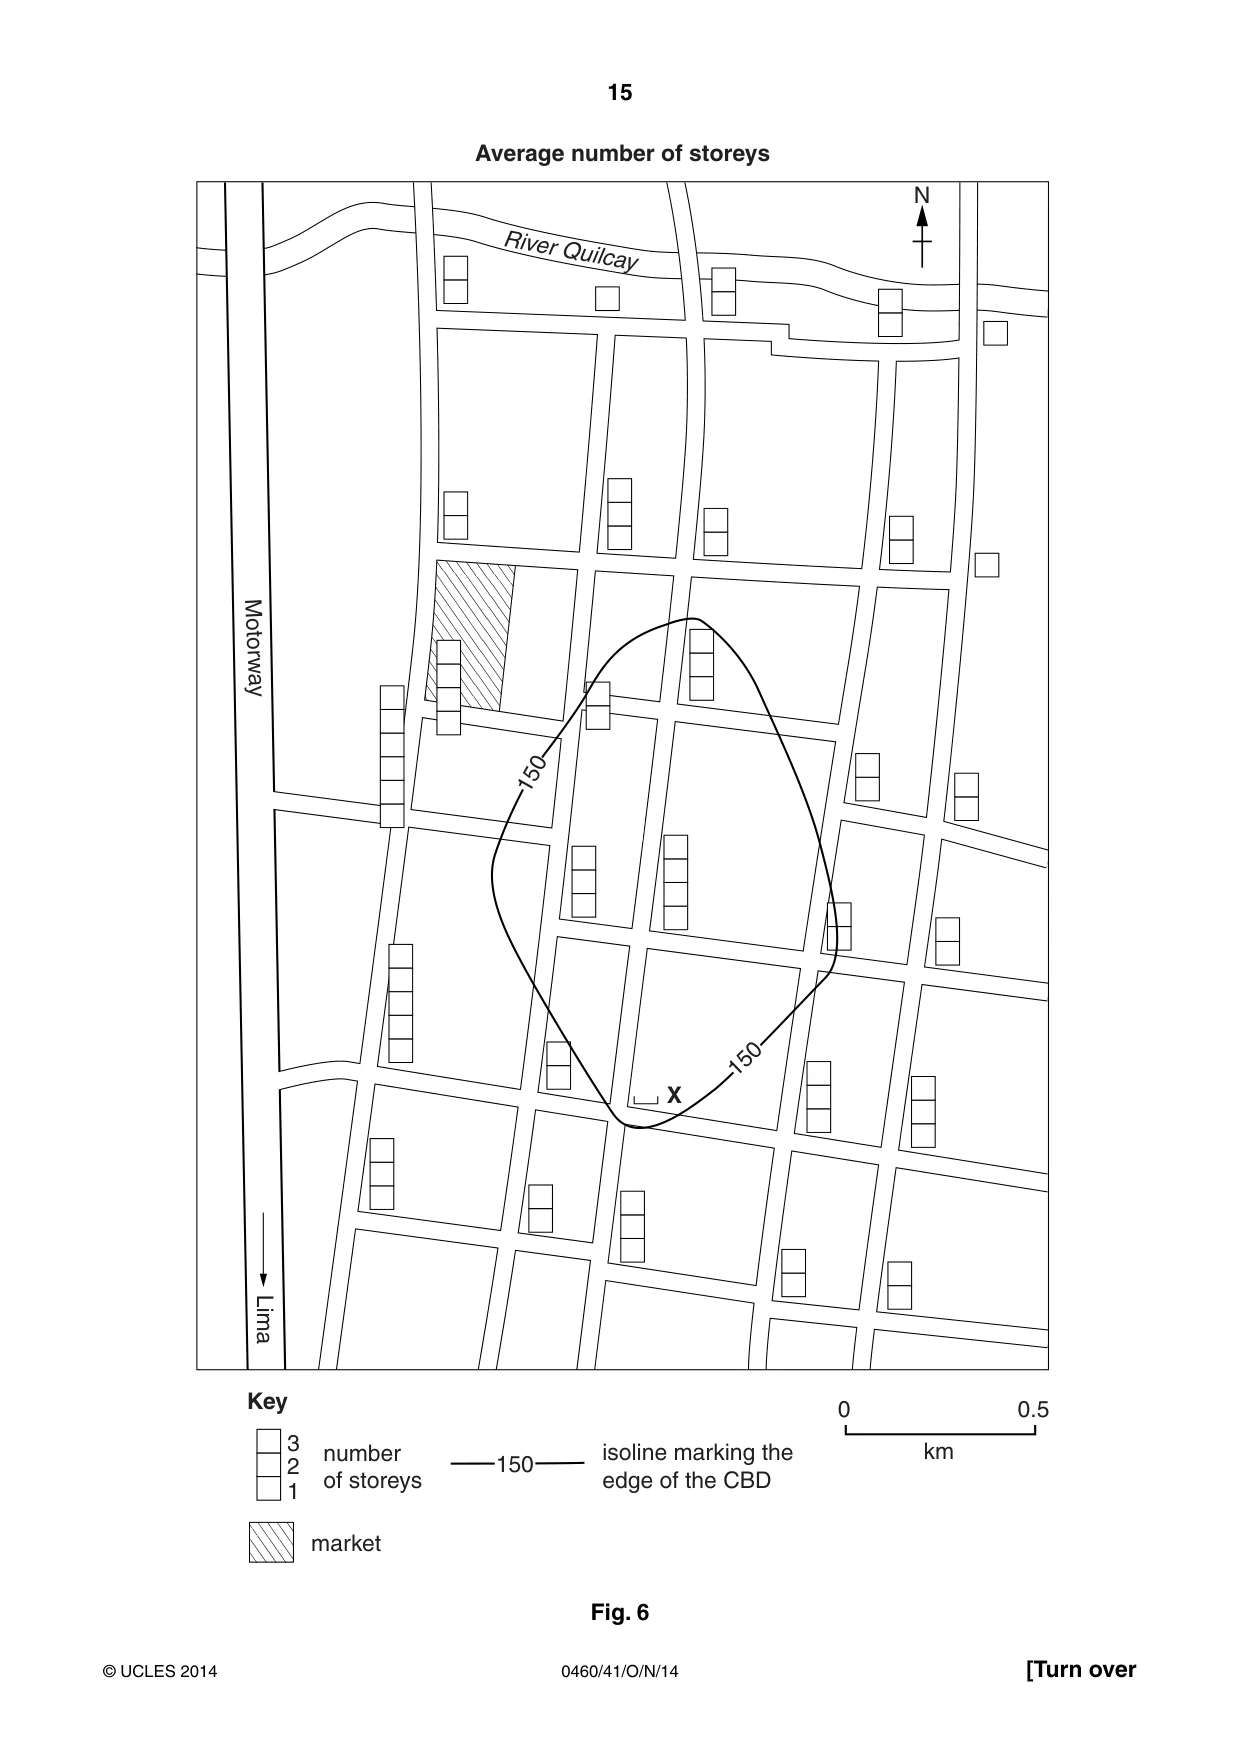
14 0460/41/O/N/14 © UCLES 2014 (d) To investigate Hypothesis 2: The tallest buildings are located in the CBD, the students selected ten buildings at each of the pedestrian recording sites. They counted the number of storeys of each building. (i) Suggest why counting the number of storeys is an appropriate method of measuring the height of buildings. … …[1] (ii) The students calculated the average number of storeys at each site. The results for one site are shown below. Building 1 2 3 4 5 6 7 8 9 10 Number of storeys 3 3 5 2 3 4 2 4 3 3 Calculate the average number of storeys at this site. Give your answer to the nearest whole number. … …[1] (iii) The results of the students’ fieldwork are shown in Fig. 6 opposite. Use the following information to complete the bars at location X on Fig. 6. Location X Average = 4 storeys [1] (iv) To draw a conclusion about Hypothesis 2: The tallest buildings are located in the CBD, the students decided to use the 150 pedestrian isoline to mark the edge of the CBD. This isoline is drawn on Fig. 6. Is Hypothesis 2 true or false? Circle your choice below. Justify your decision using evidence from Fig. 6. Hypothesis 2 is true Hypothesis 2 is false. … … … …[3]
Question paper, page 15
15 0460/41/O/N/14 © UCLES 2014 [Turn over Average number of storeys River Quilcay Motorway N × 51 × 56 Key number of storeys isoline marking the edge of the CBD 150 0 0.5 km 150 150 X Lima 3 2 1 market Fig. 6
Question paper, page 16
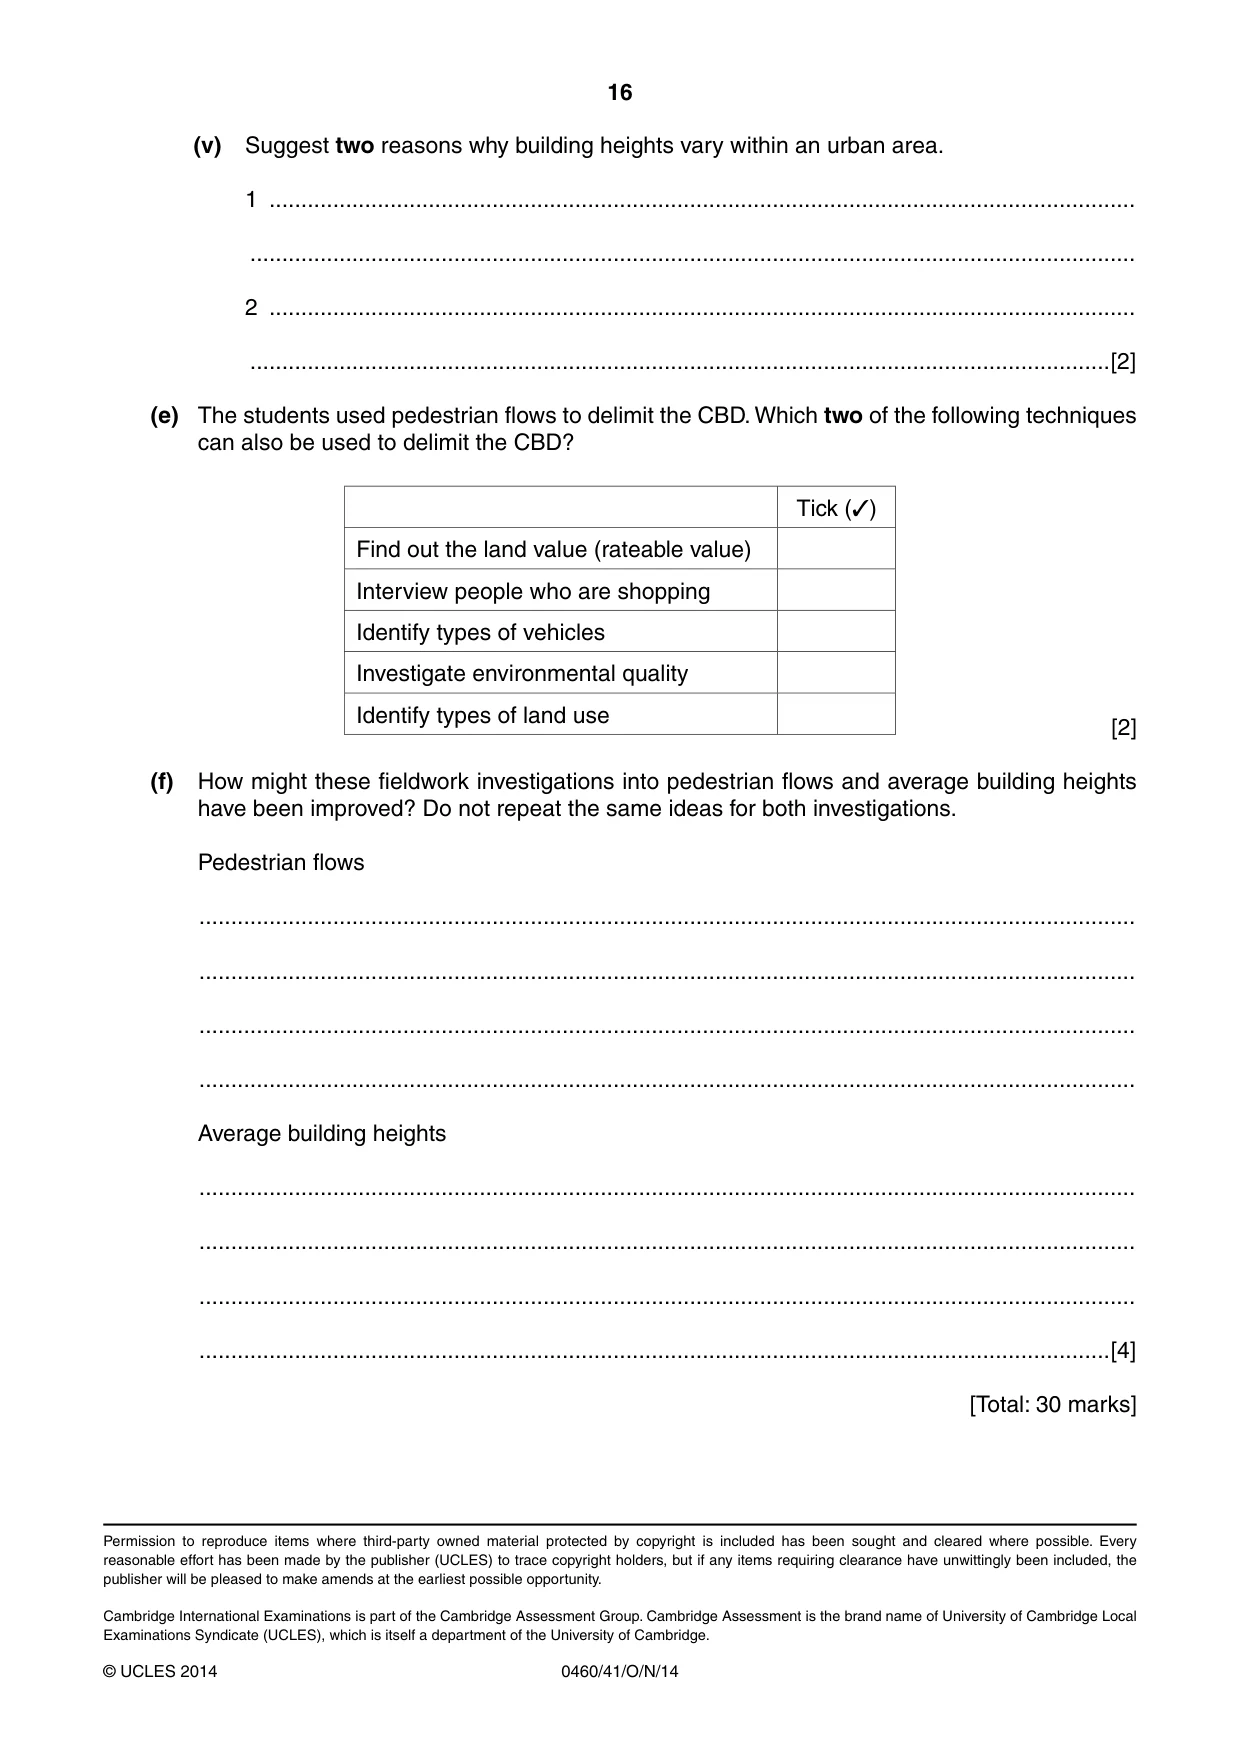
16 0460/41/O/N/14 © UCLES 2014 Permission to reproduce items where third-party owned material protected by copyright is included has been sought and cleared where possible. Every reasonable effort has been made by the publisher (UCLES) to trace copyright holders, but if any items requiring clearance have unwittingly been included, the publisher will be pleased to make amends at the earliest possible opportunity. Cambridge International Examinations is part of the Cambridge Assessment Group. Cambridge Assessment is the brand name of University of Cambridge Local Examinations Syndicate (UCLES), which is itself a department of the University of Cambridge. (v) Suggest two reasons why building heights vary within an urban area. 1 … … 2 … …[2] (e) The students used pedestrian flows to delimit the CBD. Which two of the following techniques can also be used to delimit the CBD? Tick (✓) Find out the land value (rateable value) Interview people who are shopping Identify types of vehicles Investigate environmental quality Identify types of land use [2] (f) How might these fieldwork investigations into pedestrian flows and average building heights have been improved? Do not repeat the same ideas for both investigations. Pedestrian flows … … … … Average building heights … … … …[4] [Total: 30 marks]
Mark scheme, page 1
® IGCSE is the registered trademark of Cambridge International Examinations. CAMBRIDGE INTERNATIONAL EXAMINATIONS Cambridge International General Certificate of Secondary Education MARK SCHEME for the October/November 2014 series 0460 GEOGRAPHY 0460/41 Paper 4 (Alternative to Coursework), maximum raw mark 60 This mark scheme is published as an aid to teachers and candidates, to indicate the requirements of the examination. It shows the basis on which Examiners were instructed to award marks. It does not indicate the details of the discussions that took place at an Examiners’ meeting before marking began, which would have considered the acceptability of alternative answers. Mark schemes should be read in conjunction with the question paper and the Principal Examiner Report for Teachers. Cambridge will not enter into discussions about these mark schemes. Cambridge is publishing the mark schemes for the October/November 2014 series for most Cambridge IGCSE®, Cambridge International A and AS Level components and some Cambridge O Level components.
Mark scheme, page 2
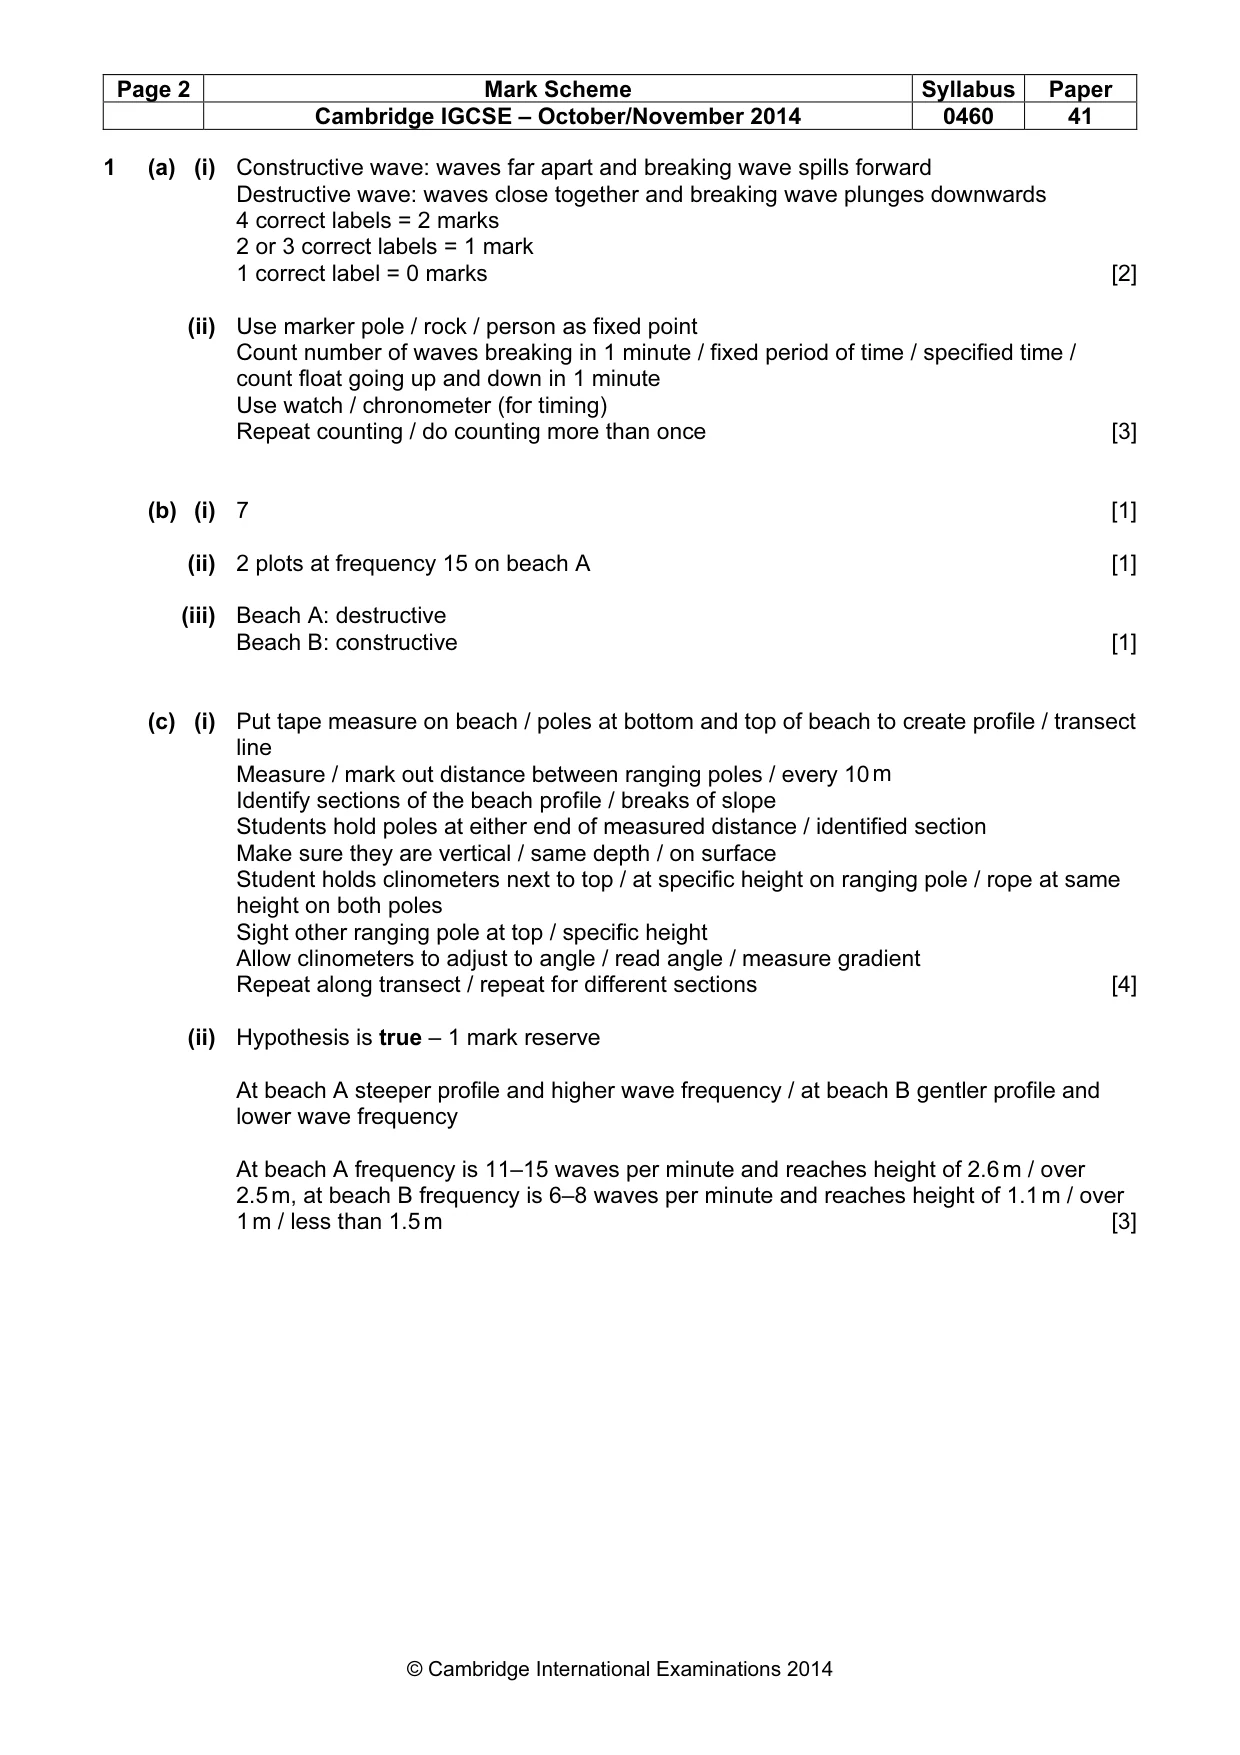
Page 2 Mark Scheme Syllabus Paper Cambridge IGCSE – October/November 2014 0460 41 © Cambridge International Examinations 2014 1 (a) (i) Constructive wave: waves far apart and breaking wave spills forward Destructive wave: waves close together and breaking wave plunges downwards 4 correct labels = 2 marks 2 or 3 correct labels = 1 mark 1 correct label = 0 marks [2] (ii) Use marker pole / rock / person as fixed point Count number of waves breaking in 1 minute / fixed period of time / specified time / count float going up and down in 1 minute Use watch / chronometer (for timing) Repeat counting / do counting more than once [3] (b) (i) 7 [1] (ii) 2 plots at frequency 15 on beach A [1] (iii) Beach A: destructive Beach B: constructive [1] (c) (i) Put tape measure on beach / poles at bottom and top of beach to create profile / transect line Measure / mark out distance between ranging poles / every 10 m Identify sections of the beach profile / breaks of slope Students hold poles at either end of measured distance / identified section Make sure they are vertical / same depth / on surface Student holds clinometers next to top / at specific height on ranging pole / rope at same height on both poles Sight other ranging pole at top / specific height Allow clinometers to adjust to angle / read angle / measure gradient Repeat along transect / repeat for different sections [4] (ii) Hypothesis is true – 1 mark reserve At beach A steeper profile and higher wave frequency / at beach B gentler profile and lower wave frequency At beach A frequency is 11–15 waves per minute and reaches height of 2.6 m / over 2.5 m, at beach B frequency is 6–8 waves per minute and reaches height of 1.1 m / over 1 m / less than 1.5 m [3]
Mark scheme, page 3
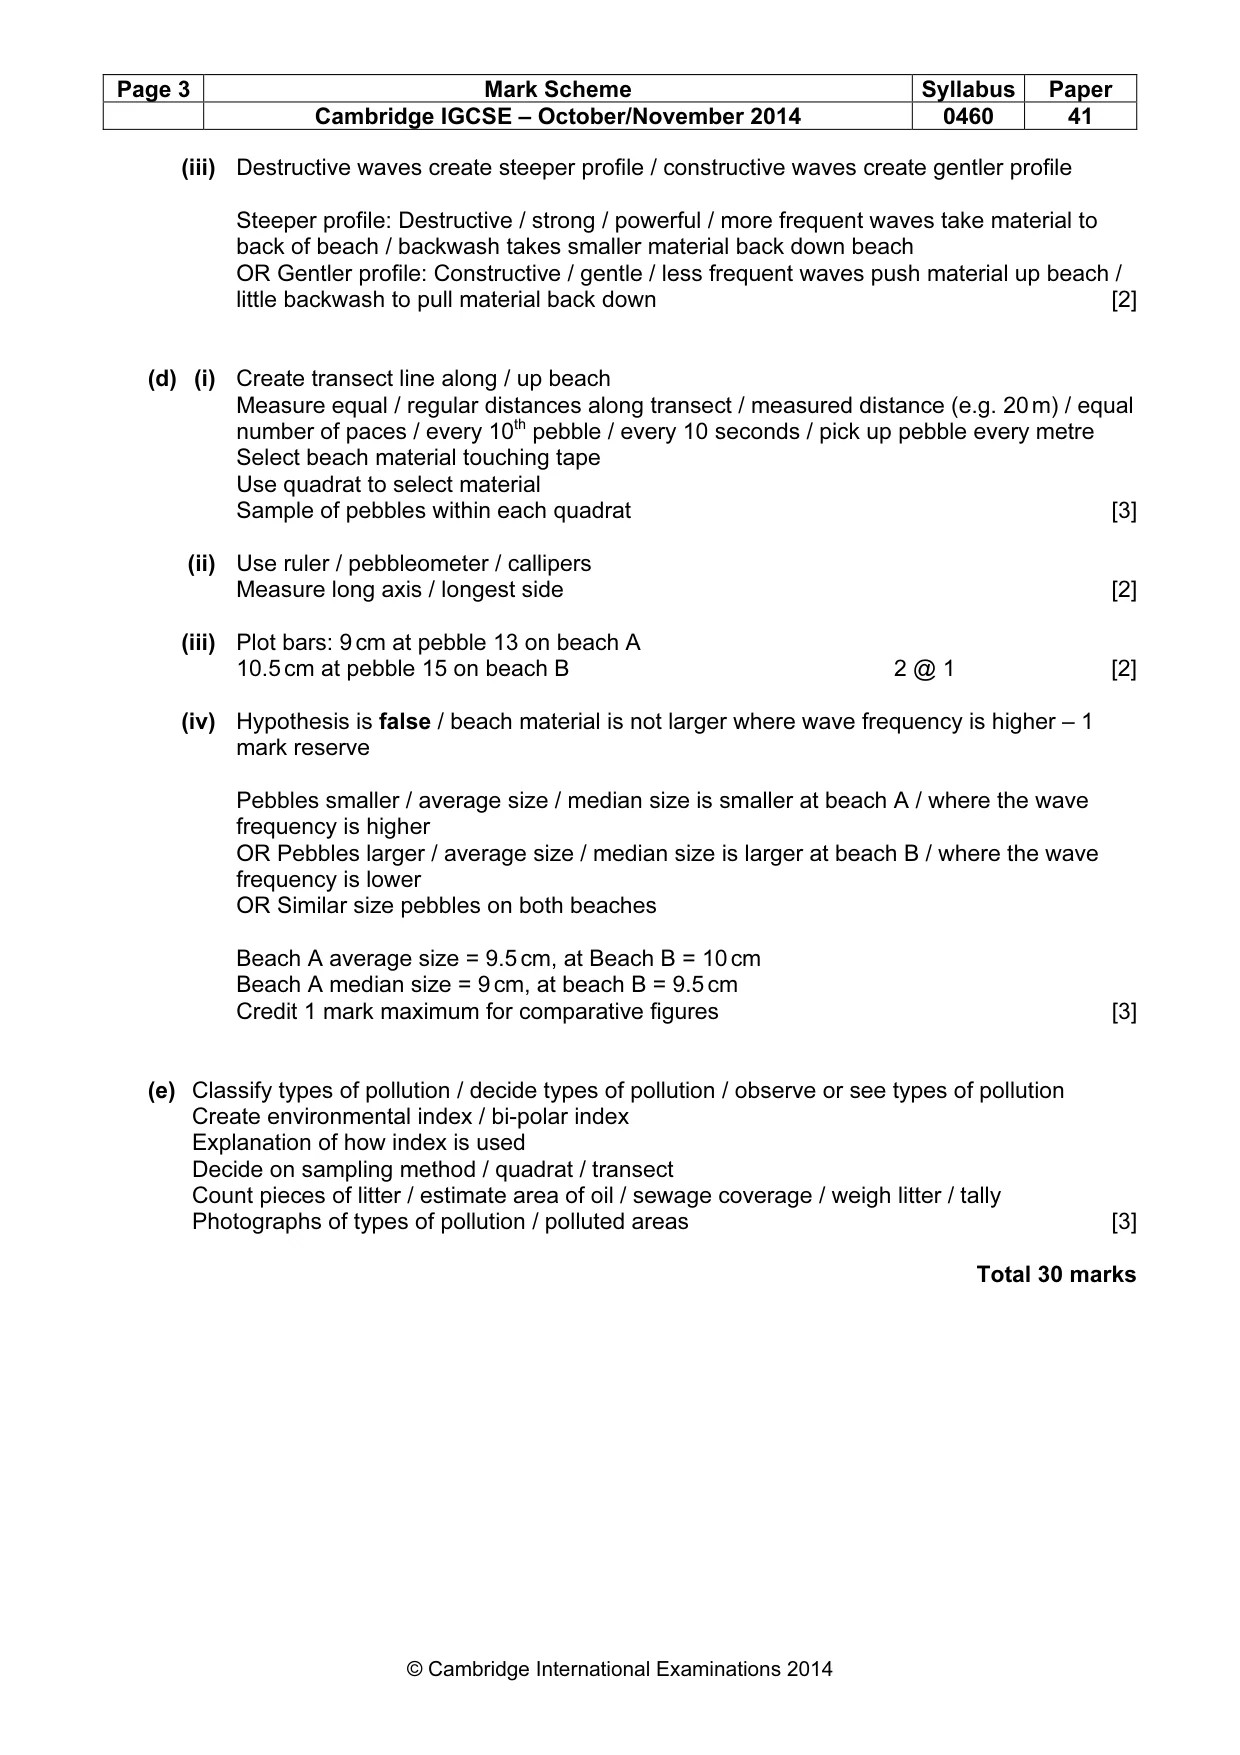
Page 3 Mark Scheme Syllabus Paper Cambridge IGCSE – October/November 2014 0460 41 © Cambridge International Examinations 2014 (iii) Destructive waves create steeper profile / constructive waves create gentler profile Steeper profile: Destructive / strong / powerful / more frequent waves take material to back of beach / backwash takes smaller material back down beach OR Gentler profile: Constructive / gentle / less frequent waves push material up beach / little backwash to pull material back down [2] (d) (i) Create transect line along / up beach Measure equal / regular distances along transect / measured distance (e.g. 20 m) / equal number of paces / every 10th pebble / every 10 seconds / pick up pebble every metre Select beach material touching tape Use quadrat to select material Sample of pebbles within each quadrat [3] (ii) Use ruler / pebbleometer / callipers Measure long axis / longest side [2] (iii) Plot bars: 9 cm at pebble 13 on beach A 10.5 cm at pebble 15 on beach B 2 @ 1 [2] (iv) Hypothesis is false / beach material is not larger where wave frequency is higher – 1 mark reserve Pebbles smaller / average size / median size is smaller at beach A / where the wave frequency is higher OR Pebbles larger / average size / median size is larger at beach B / where the wave frequency is lower OR Similar size pebbles on both beaches Beach A average size = 9.5 cm, at Beach B = 10 cm Beach A median size = 9 cm, at beach B = 9.5 cm Credit 1 mark maximum for comparative figures [3] (e) Classify types of pollution / decide types of pollution / observe or see types of pollution Create environmental index / bi-polar index Explanation of how index is used Decide on sampling method / quadrat / transect Count pieces of litter / estimate area of oil / sewage coverage / weigh litter / tally Photographs of types of pollution / polluted areas [3] Total 30 marks
Mark scheme, page 4
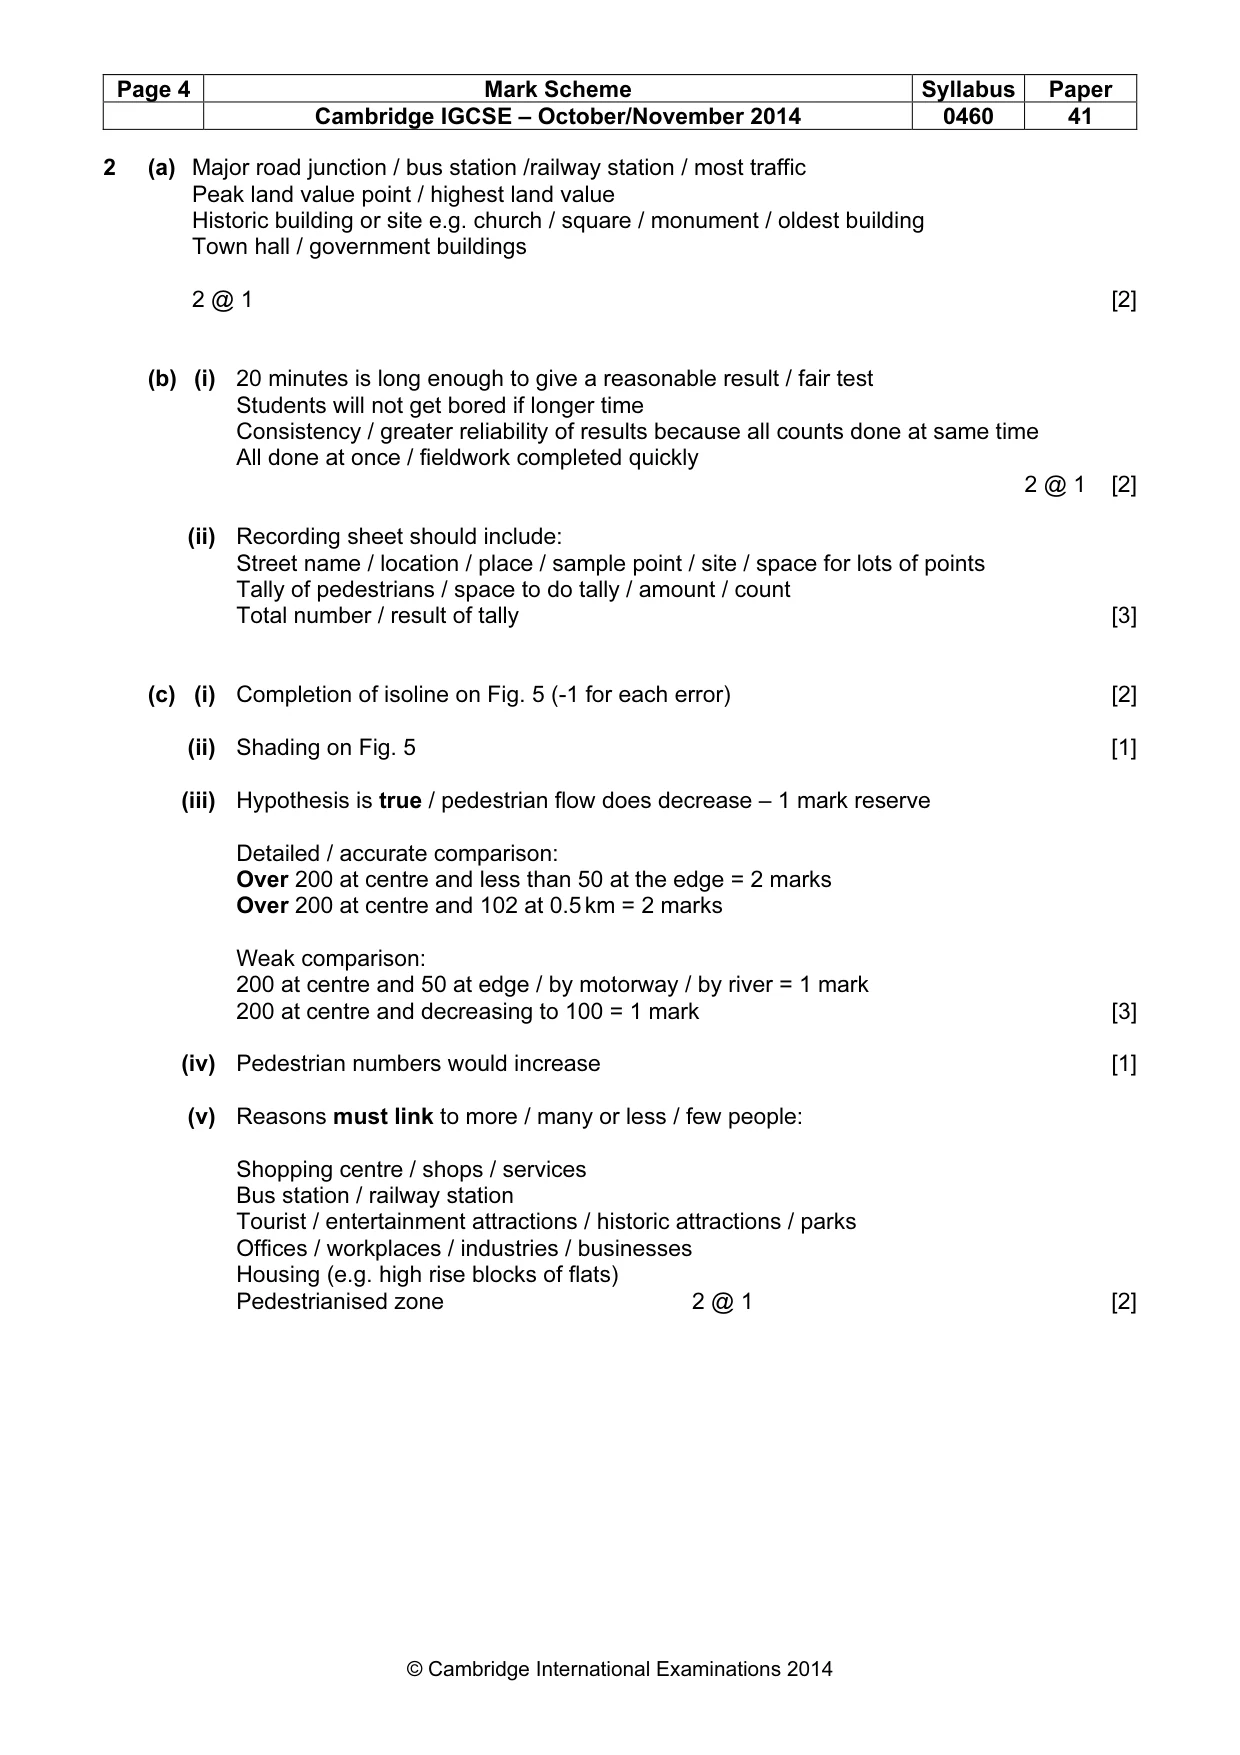
Page 4 Mark Scheme Syllabus Paper Cambridge IGCSE – October/November 2014 0460 41 © Cambridge International Examinations 2014 2 (a) Major road junction / bus station /railway station / most traffic Peak land value point / highest land value Historic building or site e.g. church / square / monument / oldest building Town hall / government buildings 2 @ 1 [2] (b) (i) 20 minutes is long enough to give a reasonable result / fair test Students will not get bored if longer time Consistency / greater reliability of results because all counts done at same time All done at once / fieldwork completed quickly 2 @ 1 [2] (ii) Recording sheet should include: Street name / location / place / sample point / site / space for lots of points Tally of pedestrians / space to do tally / amount / count Total number / result of tally [3] (c) (i) Completion of isoline on Fig. 5 (-1 for each error) [2] (ii) Shading on Fig. 5 [1] (iii) Hypothesis is true / pedestrian flow does decrease – 1 mark reserve Detailed / accurate comparison: Over 200 at centre and less than 50 at the edge = 2 marks Over 200 at centre and 102 at 0.5 km = 2 marks Weak comparison: 200 at centre and 50 at edge / by motorway / by river = 1 mark 200 at centre and decreasing to 100 = 1 mark [3] (iv) Pedestrian numbers would increase [1] (v) Reasons must link to more / many or less / few people: Shopping centre / shops / services Bus station / railway station Tourist / entertainment attractions / historic attractions / parks Offices / workplaces / industries / businesses Housing (e.g. high rise blocks of flats) Pedestrianised zone 2 @ 1 [2]
Mark scheme, page 5
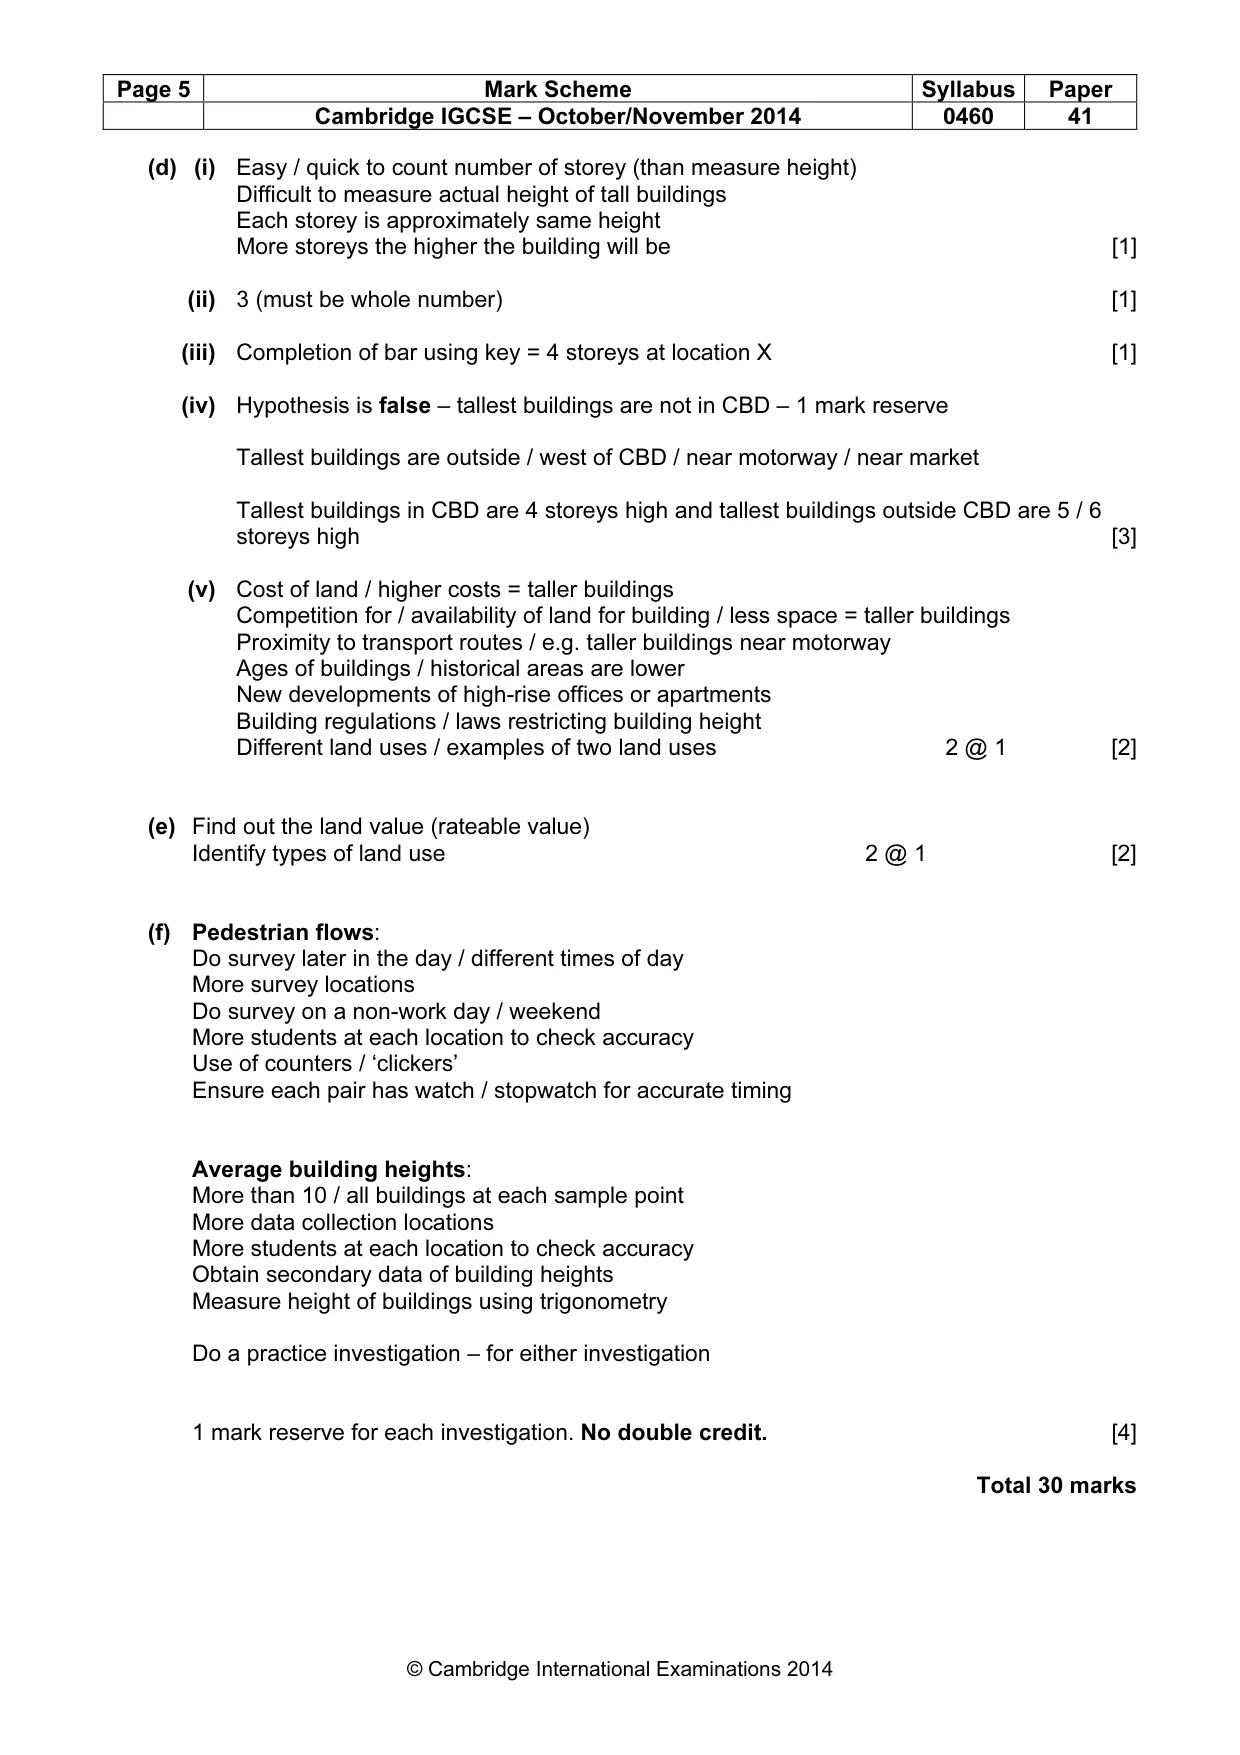
Page 5 Mark Scheme Syllabus Paper Cambridge IGCSE – October/November 2014 0460 41 © Cambridge International Examinations 2014 (d) (i) Easy / quick to count number of storey (than measure height) Difficult to measure actual height of tall buildings Each storey is approximately same height More storeys the higher the building will be [1] (ii) 3 (must be whole number) [1] (iii) Completion of bar using key = 4 storeys at location X [1] (iv) Hypothesis is false – tallest buildings are not in CBD – 1 mark reserve Tallest buildings are outside / west of CBD / near motorway / near market Tallest buildings in CBD are 4 storeys high and tallest buildings outside CBD are 5 / 6 storeys high [3] (v) Cost of land / higher costs = taller buildings Competition for / availability of land for building / less space = taller buildings Proximity to transport routes / e.g. taller buildings near motorway Ages of buildings / historical areas are lower New developments of high-rise offices or apartments Building regulations / laws restricting building height Different land uses / examples of two land uses 2 @ 1 [2] (e) Find out the land value (rateable value) Identify types of land use 2 @ 1 [2] (f) Pedestrian flows: Do survey later in the day / different times of day More survey locations Do survey on a non-work day / weekend More students at each location to check accuracy Use of counters / ‘clickers’ Ensure each pair has watch / stopwatch for accurate timing Average building heights: More than 10 / all buildings at each sample point More data collection locations More students at each location to check accuracy Obtain secondary data of building heights Measure height of buildings using trigonometry Do a practice investigation – for either investigation 1 mark reserve for each investigation. No double credit. [4] Total 30 marks
What you needed in this session
Cambridge’s own grade thresholds for 2014 Oct/Nov, Paper 4 · Variant 1. A higher threshold means an easier paper — the bar moves with how the cohort did.