Cambridge IGCSE Geography 0460 — 2014 Oct/Nov Paper 2 · Variant 3
0460/23/O/N/14 · 60 marks · ≈68 min
The question paper and its mark scheme, free to read here and free to download. This is Cambridge’s own paper, exactly as it was sat.
Question paper16 pages
Mark scheme5 pages
Answers below. Sit the paper first if you are practising.
Paper as text
Question paper, page 1
This document consists of 15 printed pages, 1 blank page and 1 Insert. DC (NF/CGW) 80122/6 © UCLES 2014 [Turn over Cambridge International Examinations Cambridge International General Certificate of Secondary Education * 3 1 3 6 6 4 5 3 0 9 * GEOGRAPHY 0460/23 Paper 2 October/November 2014 1 hour 30 minutes Candidates answer on the Question Paper. Additional Materials: Ruler Protractor Plain paper Calculator 1:50 000 Survey Map Extract is enclosed with this question paper. READ THESE INSTRUCTIONS FIRST Write your Centre number, candidate number and name in the spaces provided. Write in dark blue or black pen. You may use an HB pencil for any diagrams or graphs. Do not use staples, paper clips, glue or correction fluid. DO NOT WRITE IN ANY BARCODES. Answer all questions. The Insert contains Photograph A for Question 2. The Survey Map Extract and the Insert are not required by the Examiner. Sketch maps and diagrams should be drawn whenever they serve to illustrate an answer. At the end of the examination, fasten all your work securely together. The number of marks is given in brackets [ ] at the end of each question or part question.
Question paper, page 2
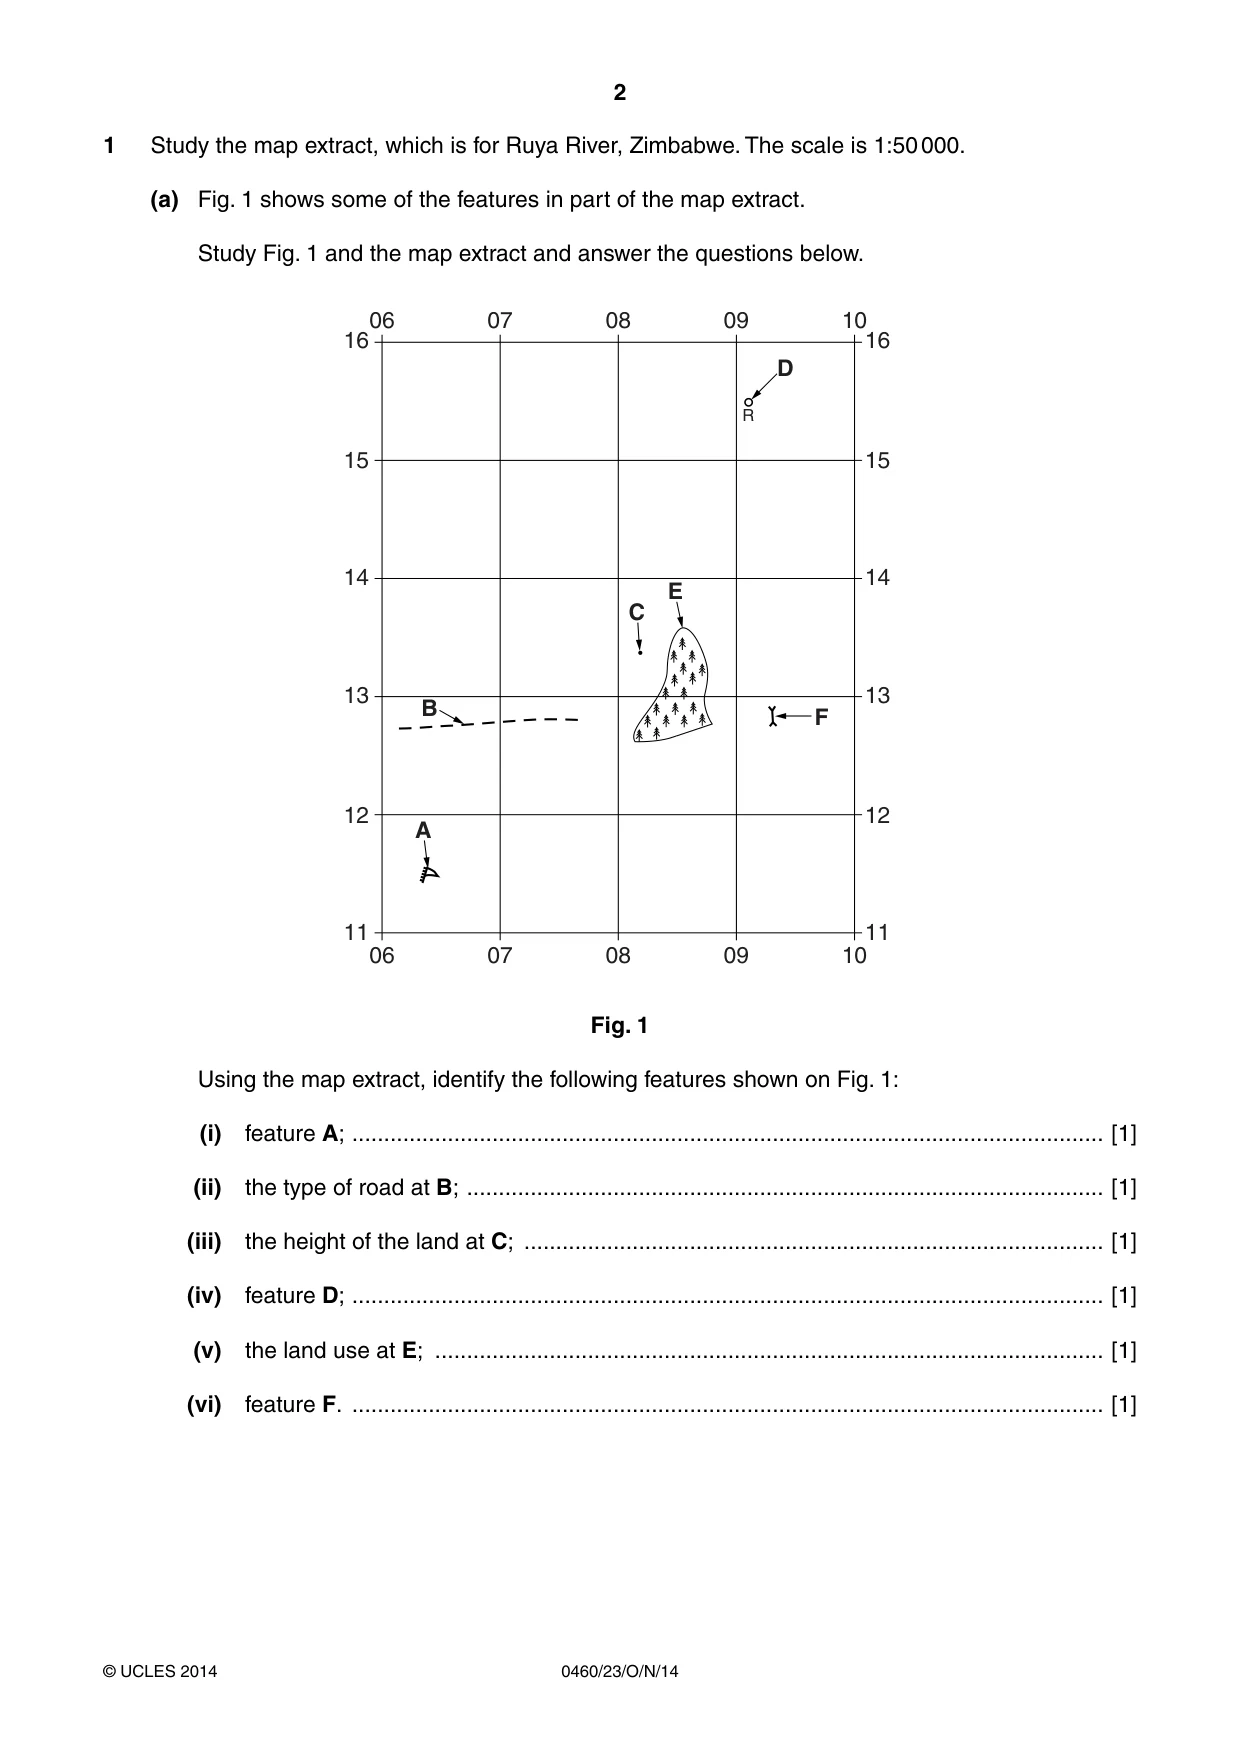
2 0460/23/O/N/14 © UCLES 2014 1 Study the map extract, which is for Ruya River, Zimbabwe. The scale is 1:50 000. (a) Fig. 1 shows some of the features in part of the map extract. Study Fig. 1 and the map extract and answer the questions below. 13 12 11 16 10 09 08 07 06 10 09 08 A B C E F 07 06 15 14 13 12 11 16 15 14 D R Fig. 1 Using the map extract, identify the following features shown on Fig. 1: (i) feature A; … [1] (ii) the type of road at B; … [1] (iii) the height of the land at C; … [1] (iv) feature D; … [1] (v) the land use at E; … [1] (vi) feature F. … [1]
Question paper, page 3
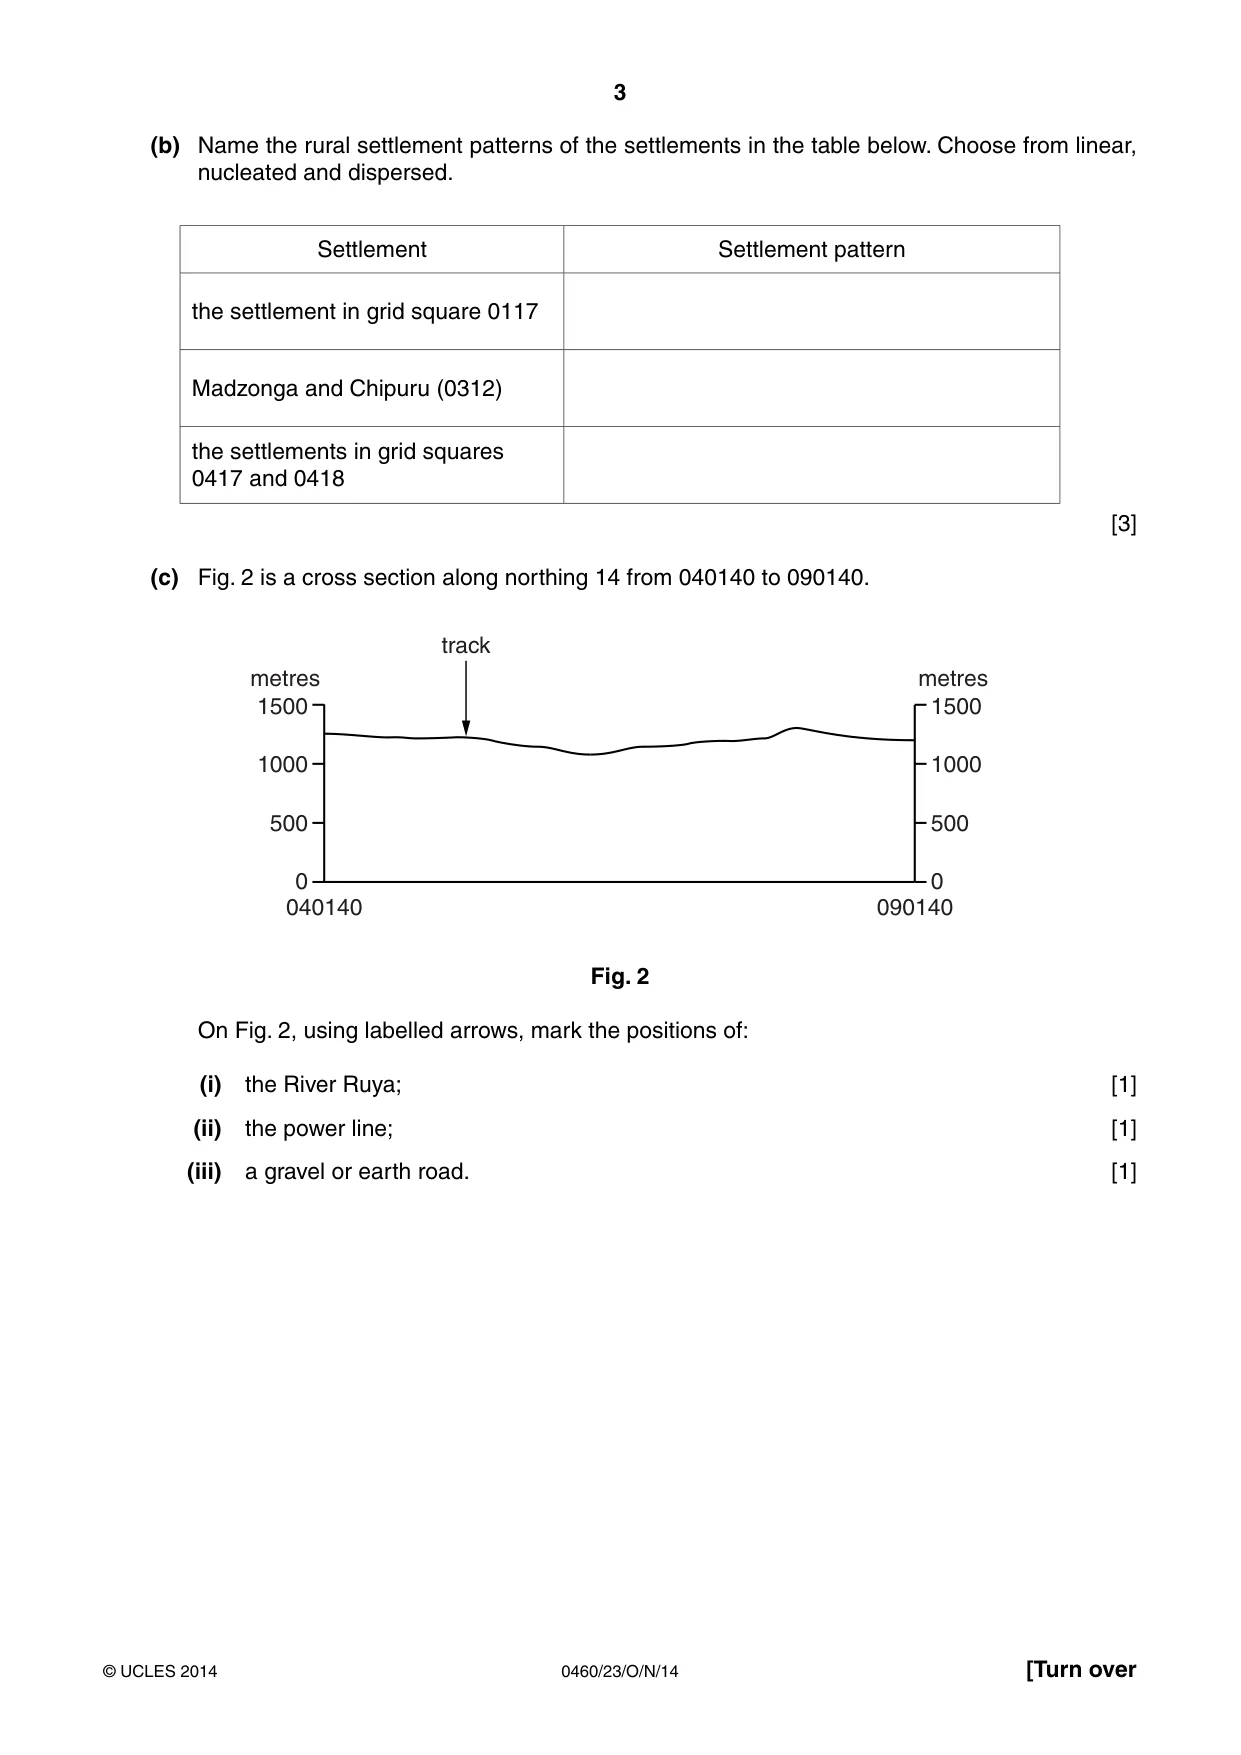
3 0460/23/O/N/14 © UCLES 2014 [Turn over (b) Name the rural settlement patterns of the settlements in the table below. Choose from linear, nucleated and dispersed. Settlement Settlement pattern the settlement in grid square 0117 Madzonga and Chipuru (0312) the settlements in grid squares 0417 and 0418 [3] (c) Fig. 2 is a cross section along northing 14 from 040140 to 090140. 1500 metres track 1000 500 0 1500 metres 1000 500 0 090140 040140 Fig. 2 On Fig. 2, using labelled arrows, mark the positions of: (i) the River Ruya; [1] (ii) the power line; [1] (iii) a gravel or earth road. [1]
Question paper, page 4
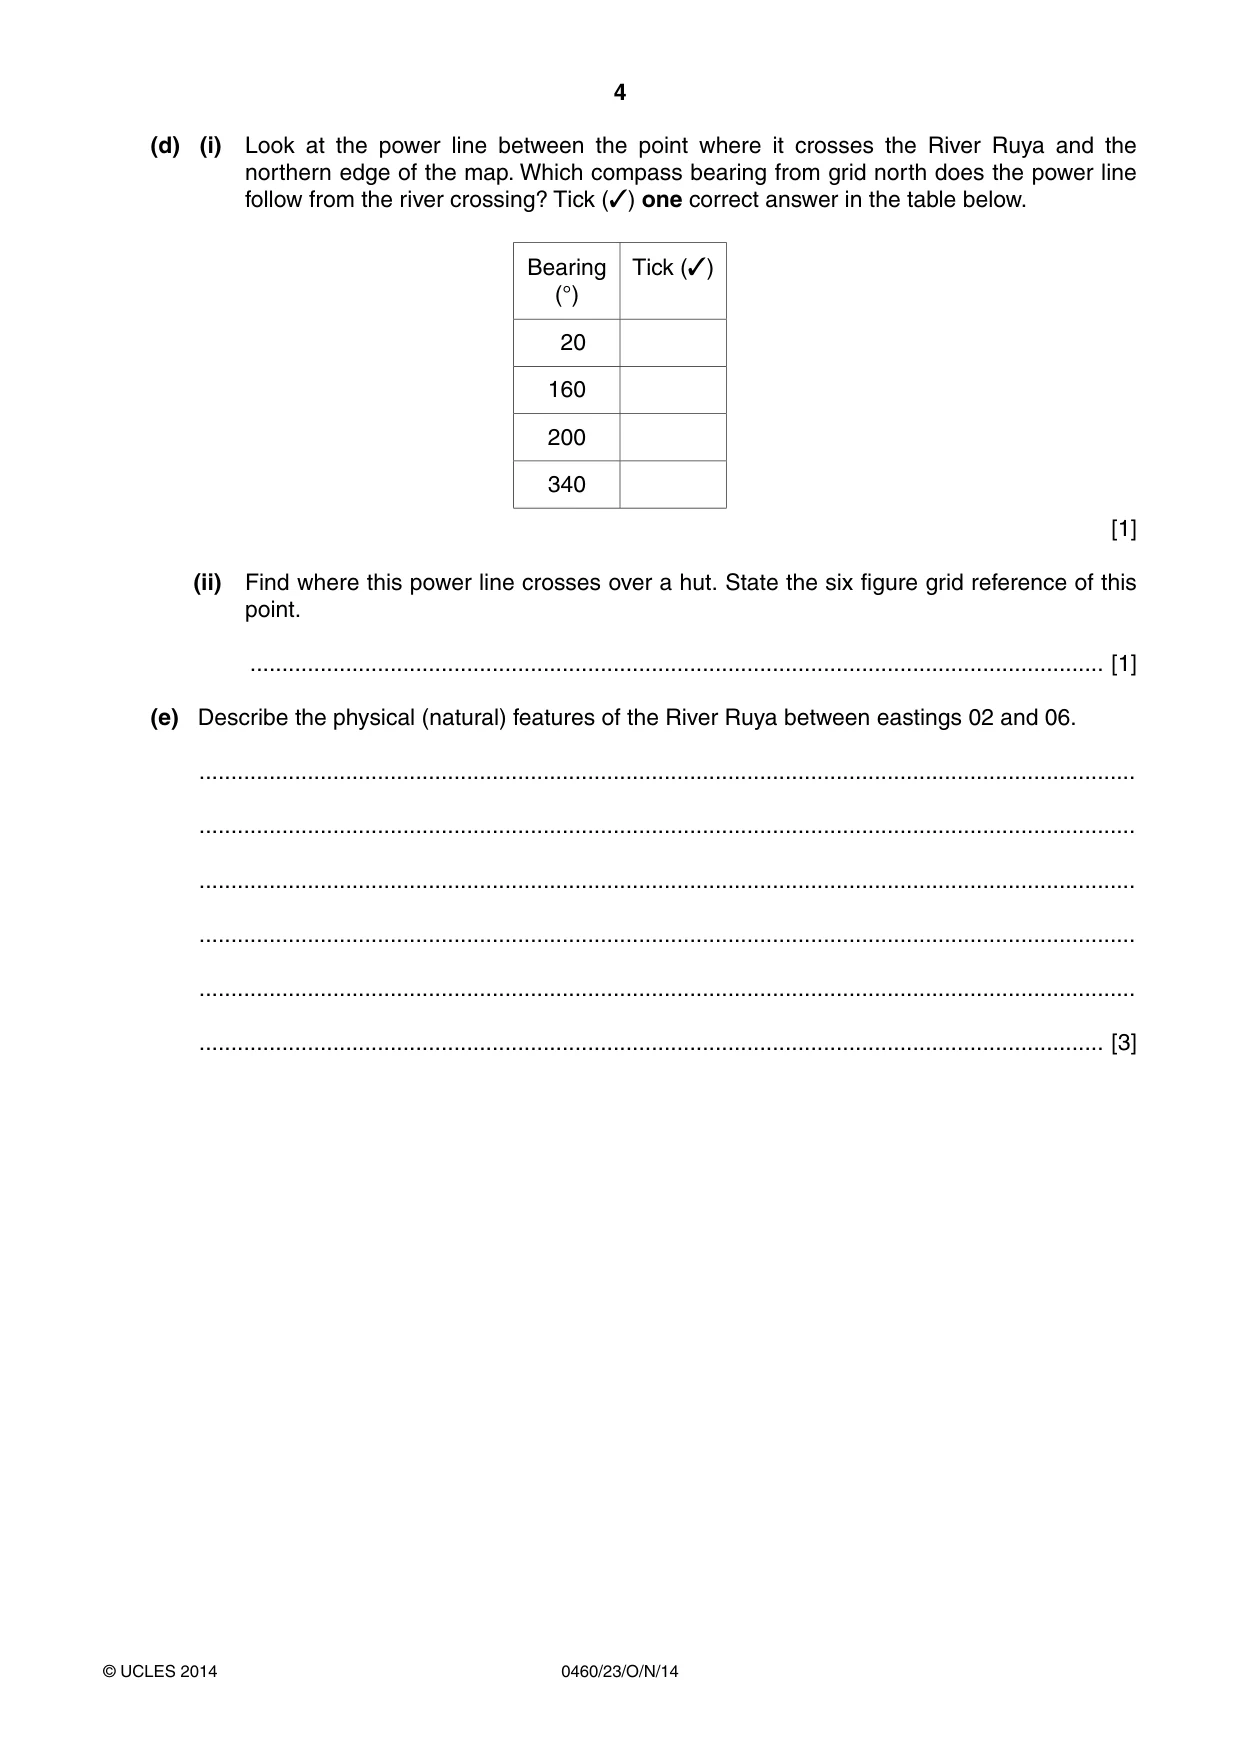
4 0460/23/O/N/14 © UCLES 2014 (d) (i) Look at the power line between the point where it crosses the River Ruya and the northern edge of the map. Which compass bearing from grid north does the power line follow from the river crossing? Tick (✓) one correct answer in the table below. Bearing (°) Tick (✓) 20 160 200 340 [1] (ii) Find where this power line crosses over a hut. State the six figure grid reference of this point. … [1] (e) Describe the physical (natural) features of the River Ruya between eastings 02 and 06. … … … … … … [3]
Question paper, page 5
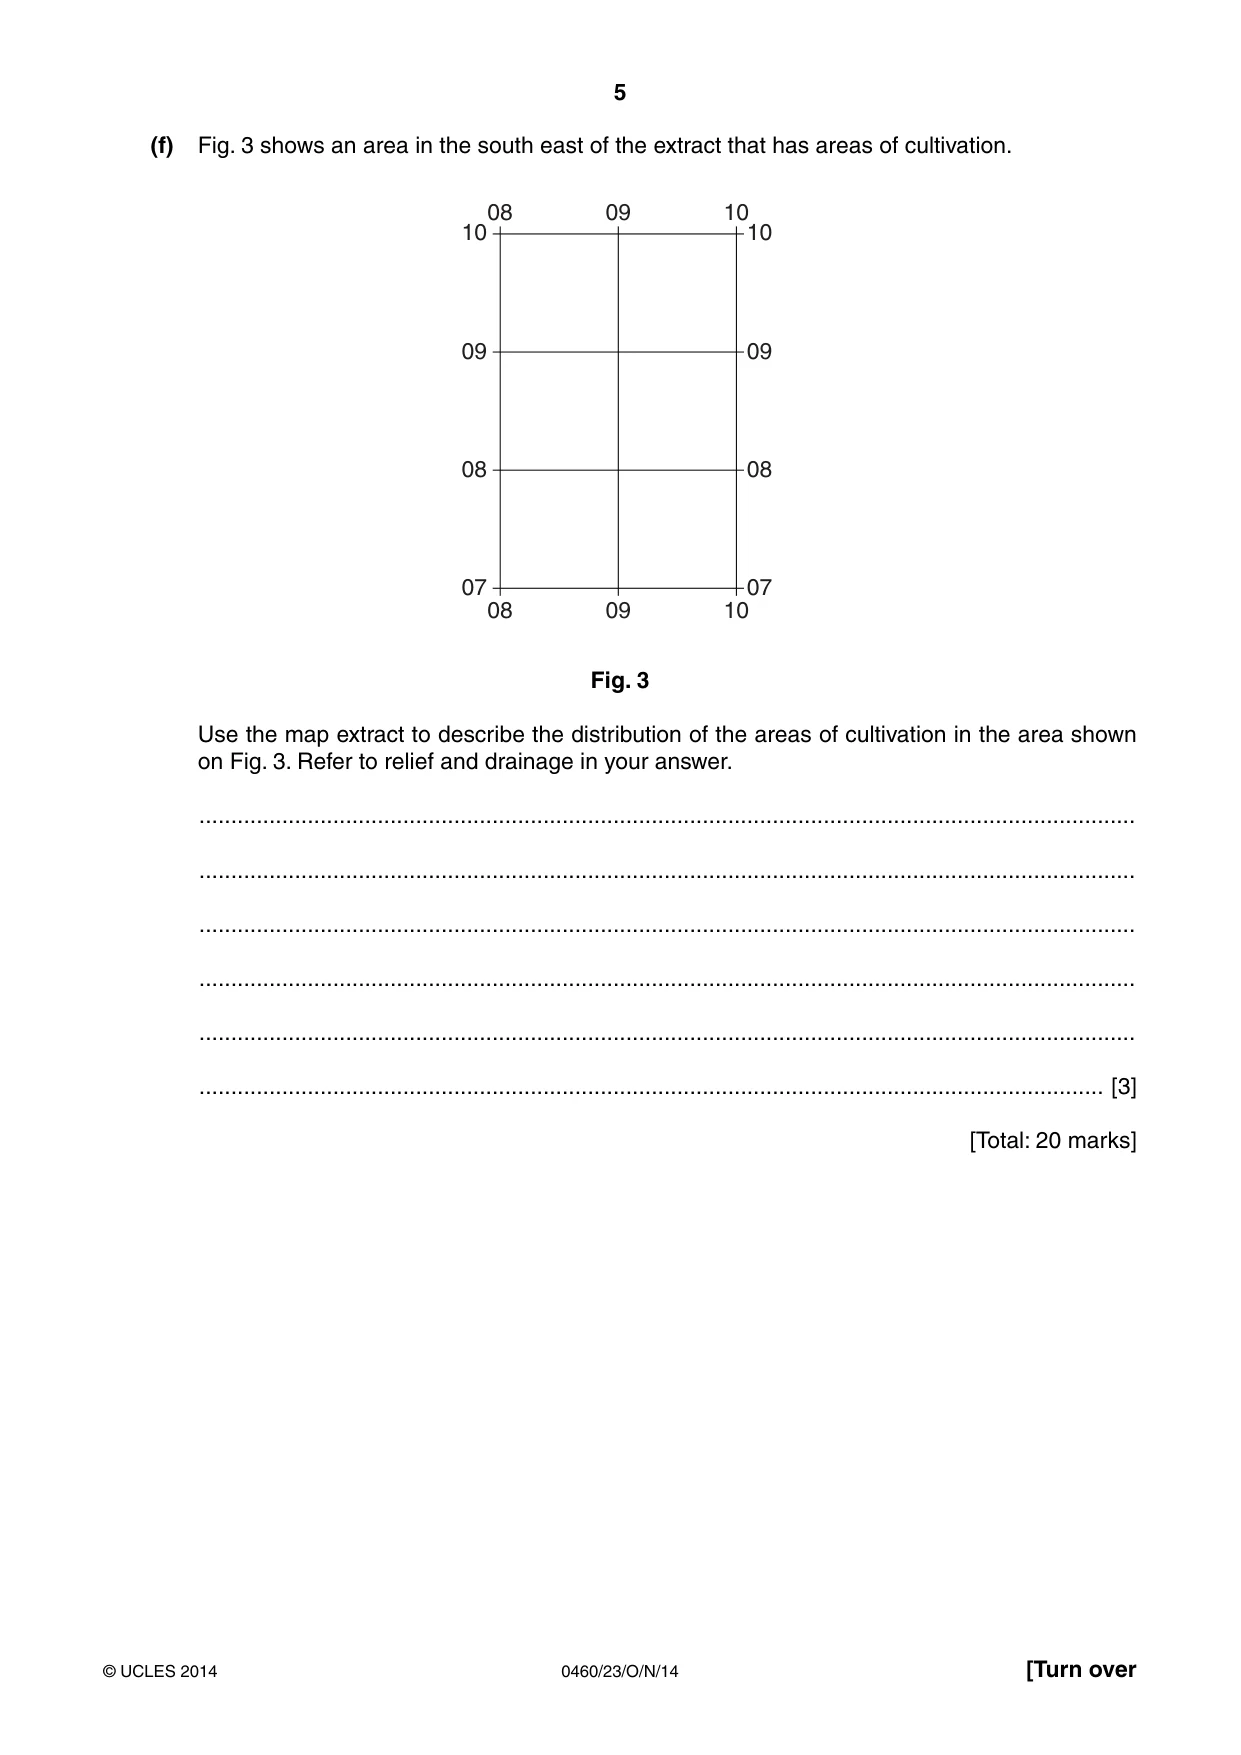
5 0460/23/O/N/14 © UCLES 2014 [Turn over (f) Fig. 3 shows an area in the south east of the extract that has areas of cultivation. 07 10 10 09 08 10 09 08 09 08 07 10 09 08 Fig. 3 Use the map extract to describe the distribution of the areas of cultivation in the area shown on Fig. 3. Refer to relief and drainage in your answer. … … … … … … [3] [Total: 20 marks]
Question paper, page 6
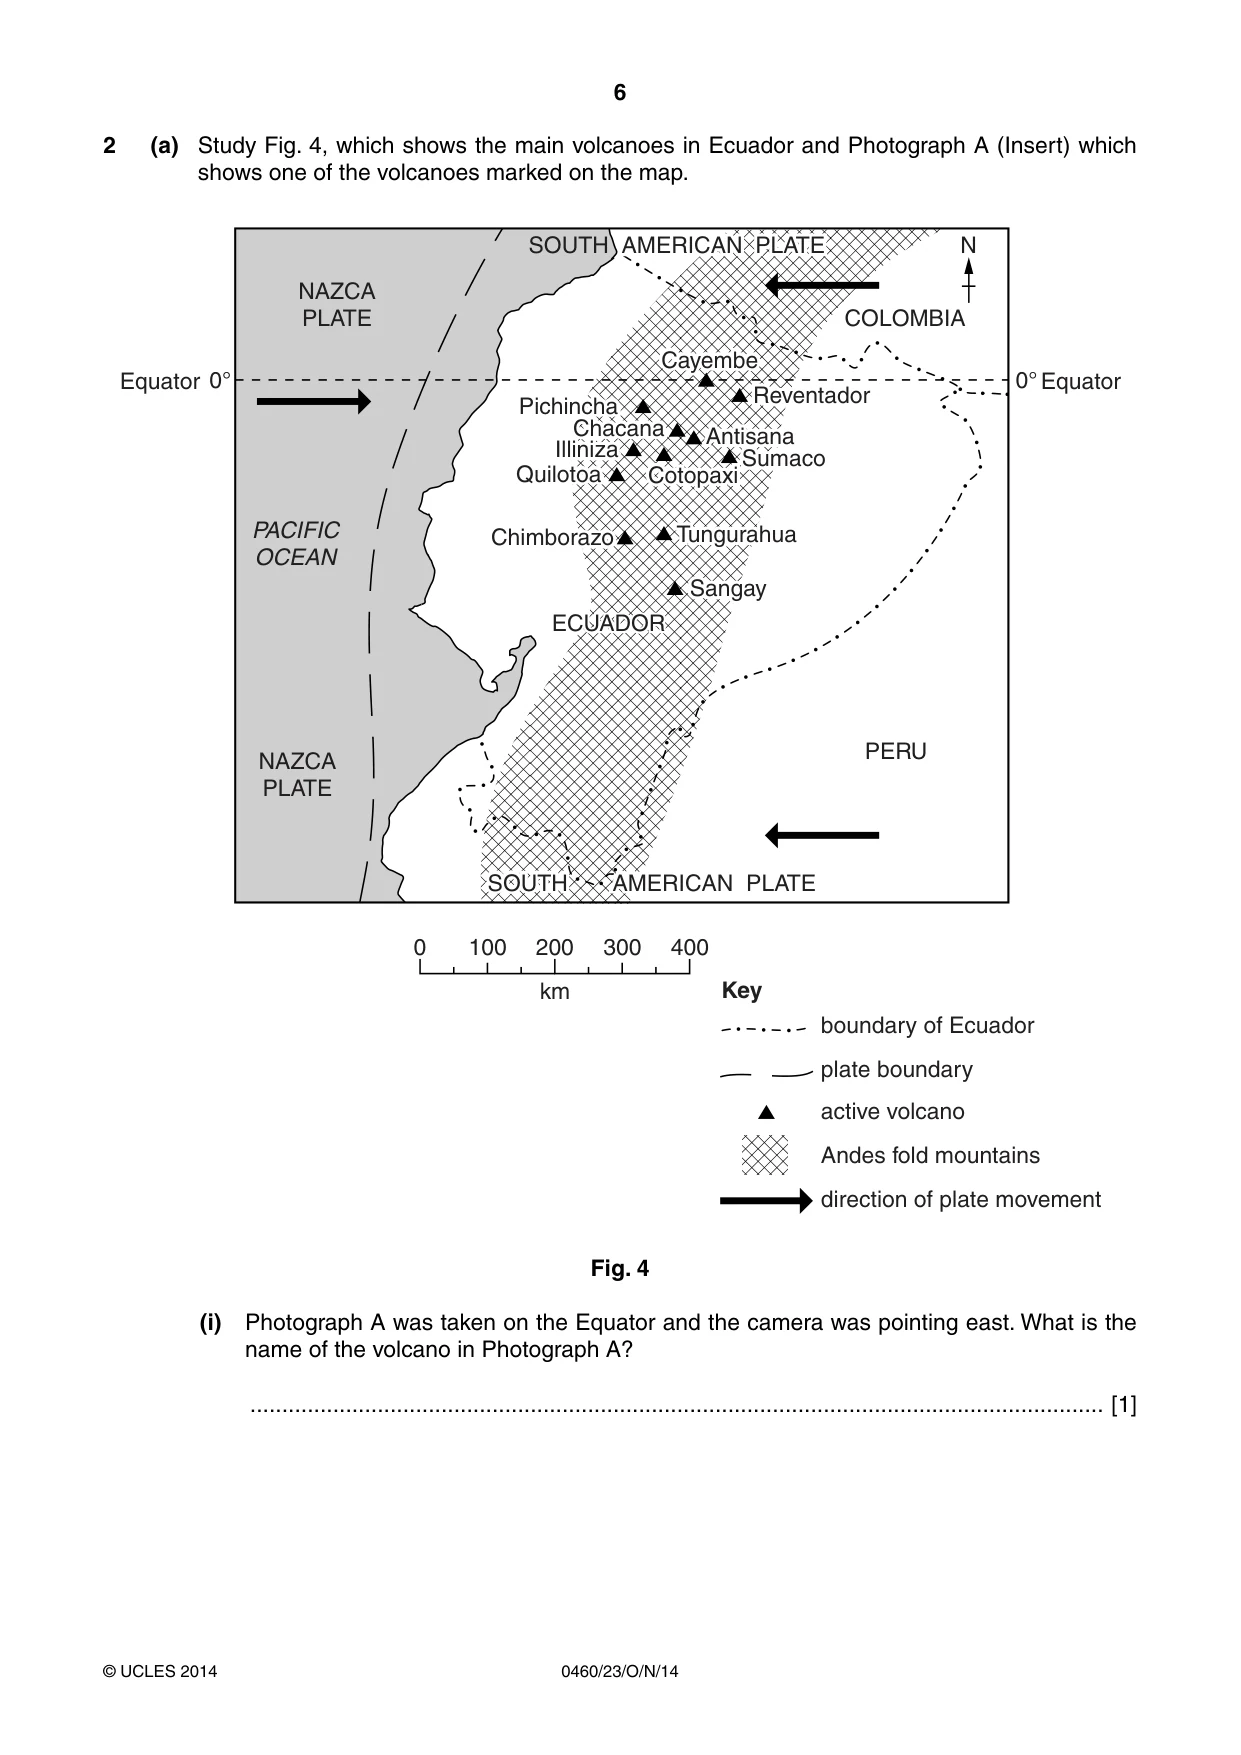
6 0460/23/O/N/14 © UCLES 2014 2 (a) Study Fig. 4, which shows the main volcanoes in Ecuador and Photograph A (Insert) which shows one of the volcanoes marked on the map. 0° 0° NAZCA PLATE NAZCA PLATE PERU COLOMBIA PACIFIC OCEAN 200 300 km Key 400 0 100 boundary of Ecuador Equator Equator plate boundary active volcano Andes fold mountains direction of plate movement Pichincha Illiniza Quilotoa Chacana Tungurahua Cotopaxi Chimborazo Sangay Antisana Sumaco Reventador N Cayembe SOUTH AMERICAN PLATE SOUTH AMERICAN PLATE AMERICAN PLATE SOUTH AMERICAN PLATE ECUADOR Fig. 4 (i) Photograph A was taken on the Equator and the camera was pointing east. What is the name of the volcano in Photograph A? … [1]
Question paper, page 7
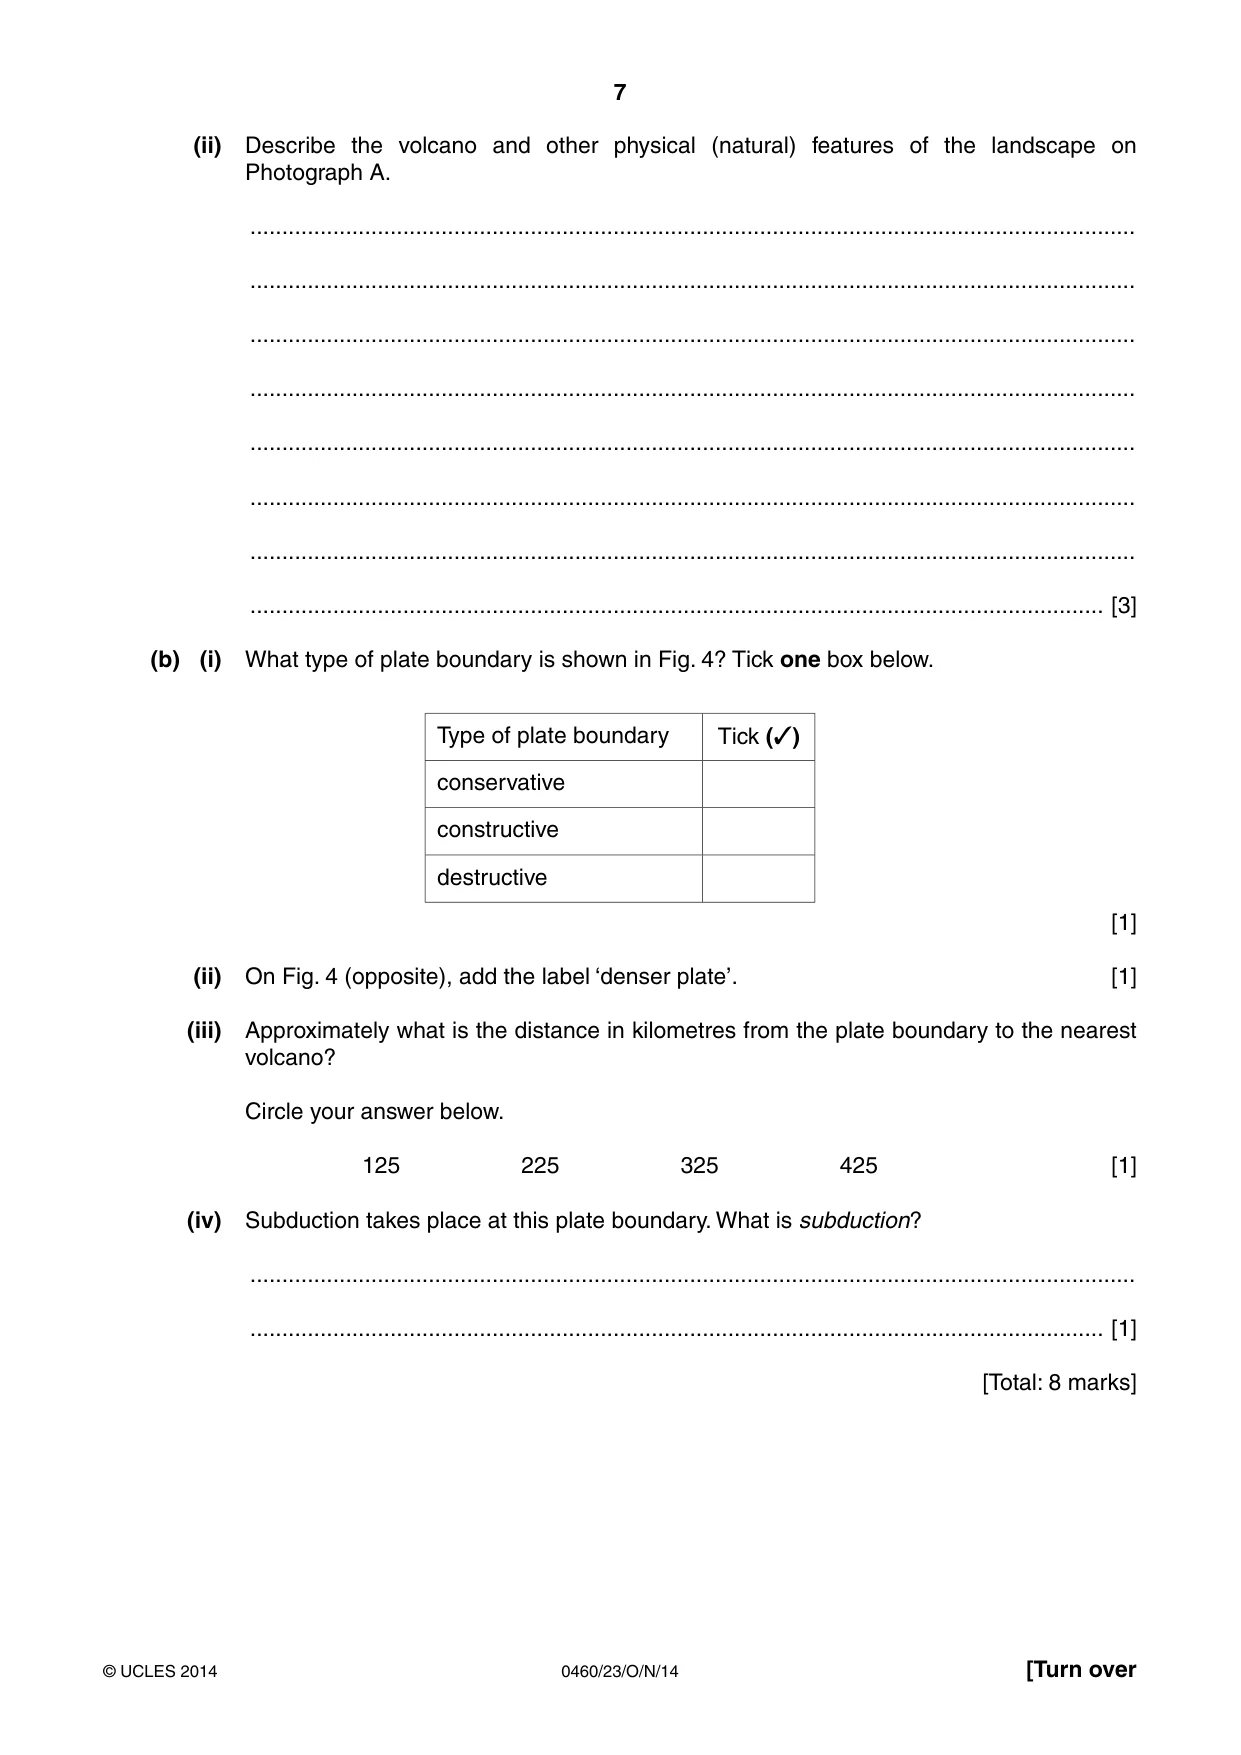
7 0460/23/O/N/14 © UCLES 2014 [Turn over (ii) Describe the volcano and other physical (natural) features of the landscape on Photograph A. … … … … … … … … [3] (b) (i) What type of plate boundary is shown in Fig. 4? Tick one box below. Type of plate boundary Tick (✓) conservative constructive destructive [1] (ii) On Fig. 4 (opposite), add the label ‘denser plate’. [1] (iii) Approximately what is the distance in kilometres from the plate boundary to the nearest volcano? Circle your answer below. 125 225 325 425 [1] (iv) Subduction takes place at this plate boundary. What is subduction? … … [1] [Total: 8 marks]
Question paper, page 8
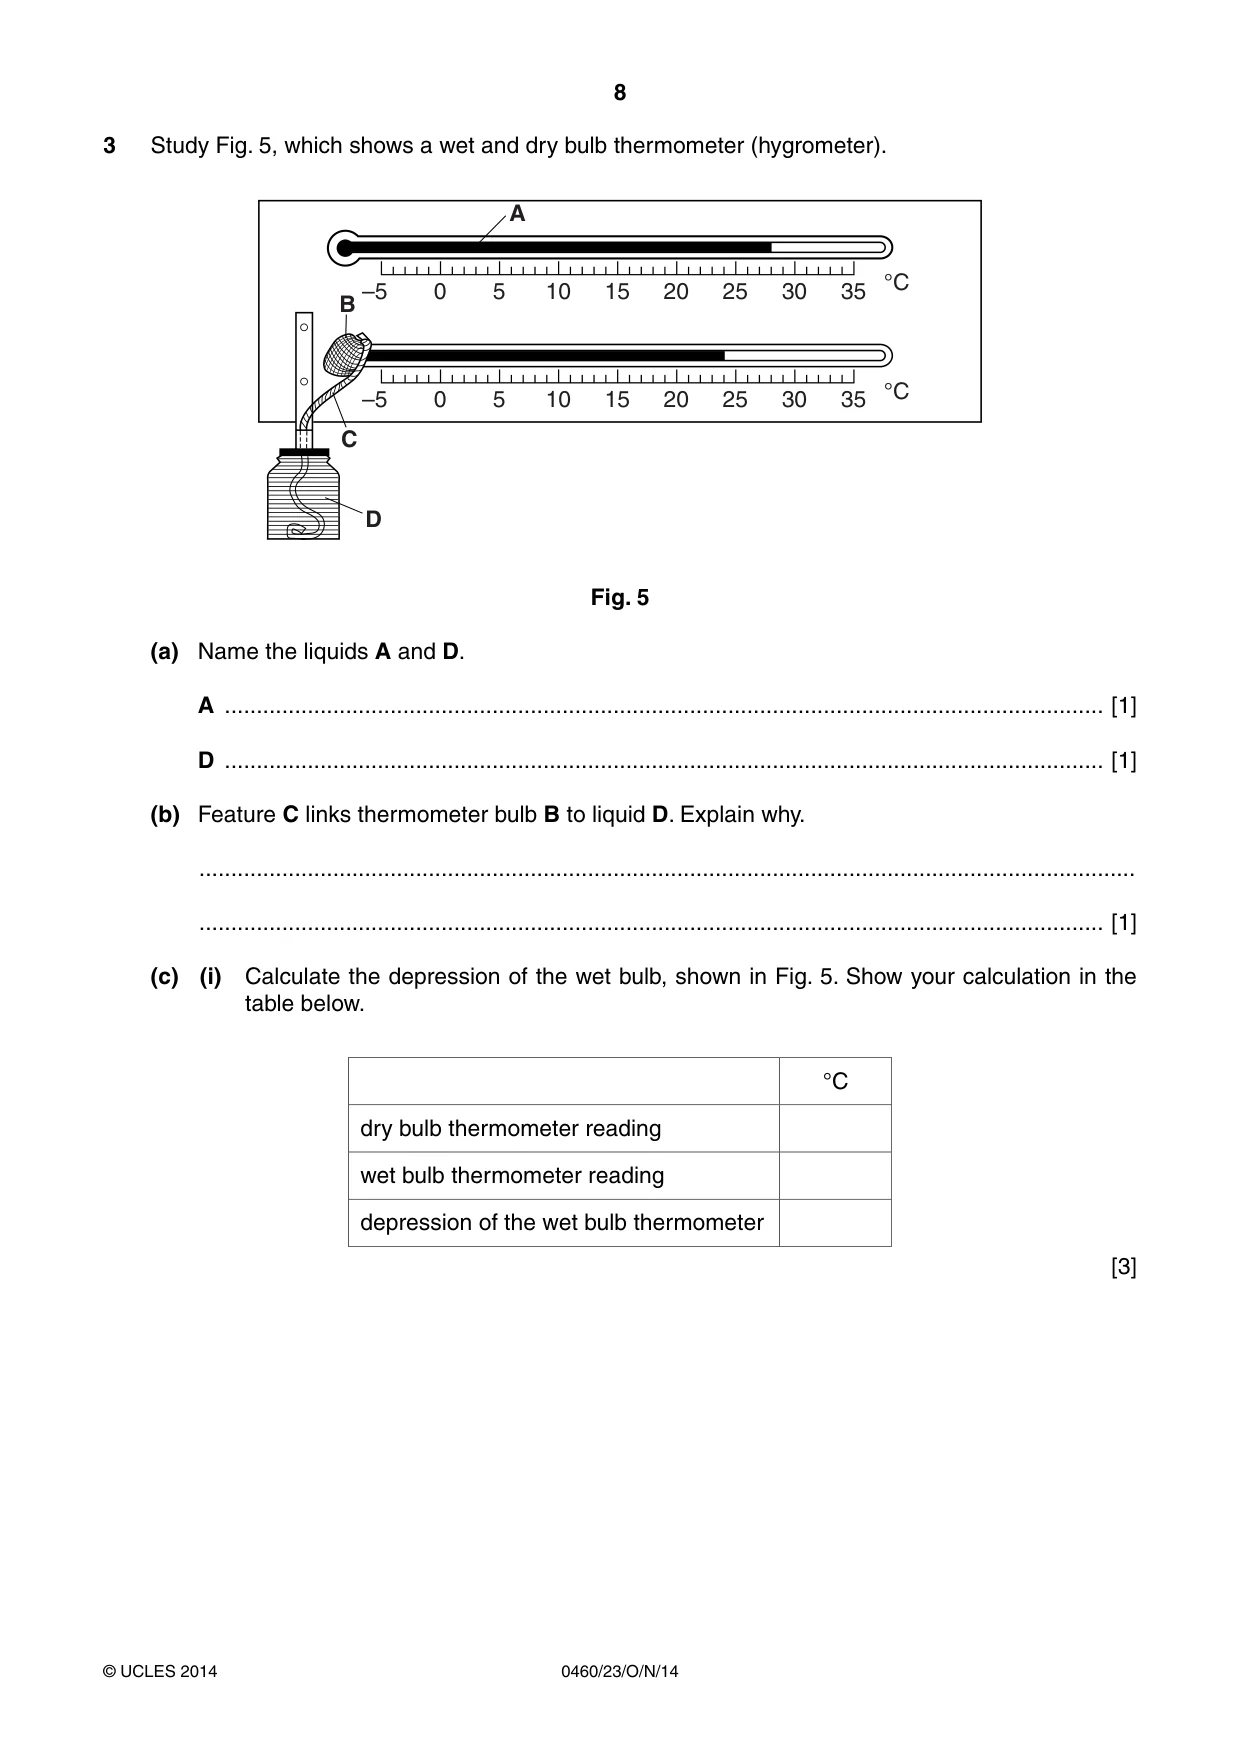
8 0460/23/O/N/14 © UCLES 2014 3 Study Fig. 5, which shows a wet and dry bulb thermometer (hygrometer). –5 0 5 10 15 20 25 30 35 °C –5 0 5 10 15 20 25 30 35 °C D C A B Fig. 5 (a) Name the liquids A and D. A … [1] D … [1] (b) Feature C links thermometer bulb B to liquid D. Explain why. … … [1] (c) (i) Calculate the depression of the wet bulb, shown in Fig. 5. Show your calculation in the table below. °C dry bulb thermometer reading wet bulb thermometer reading depression of the wet bulb thermometer [3]
Question paper, page 9
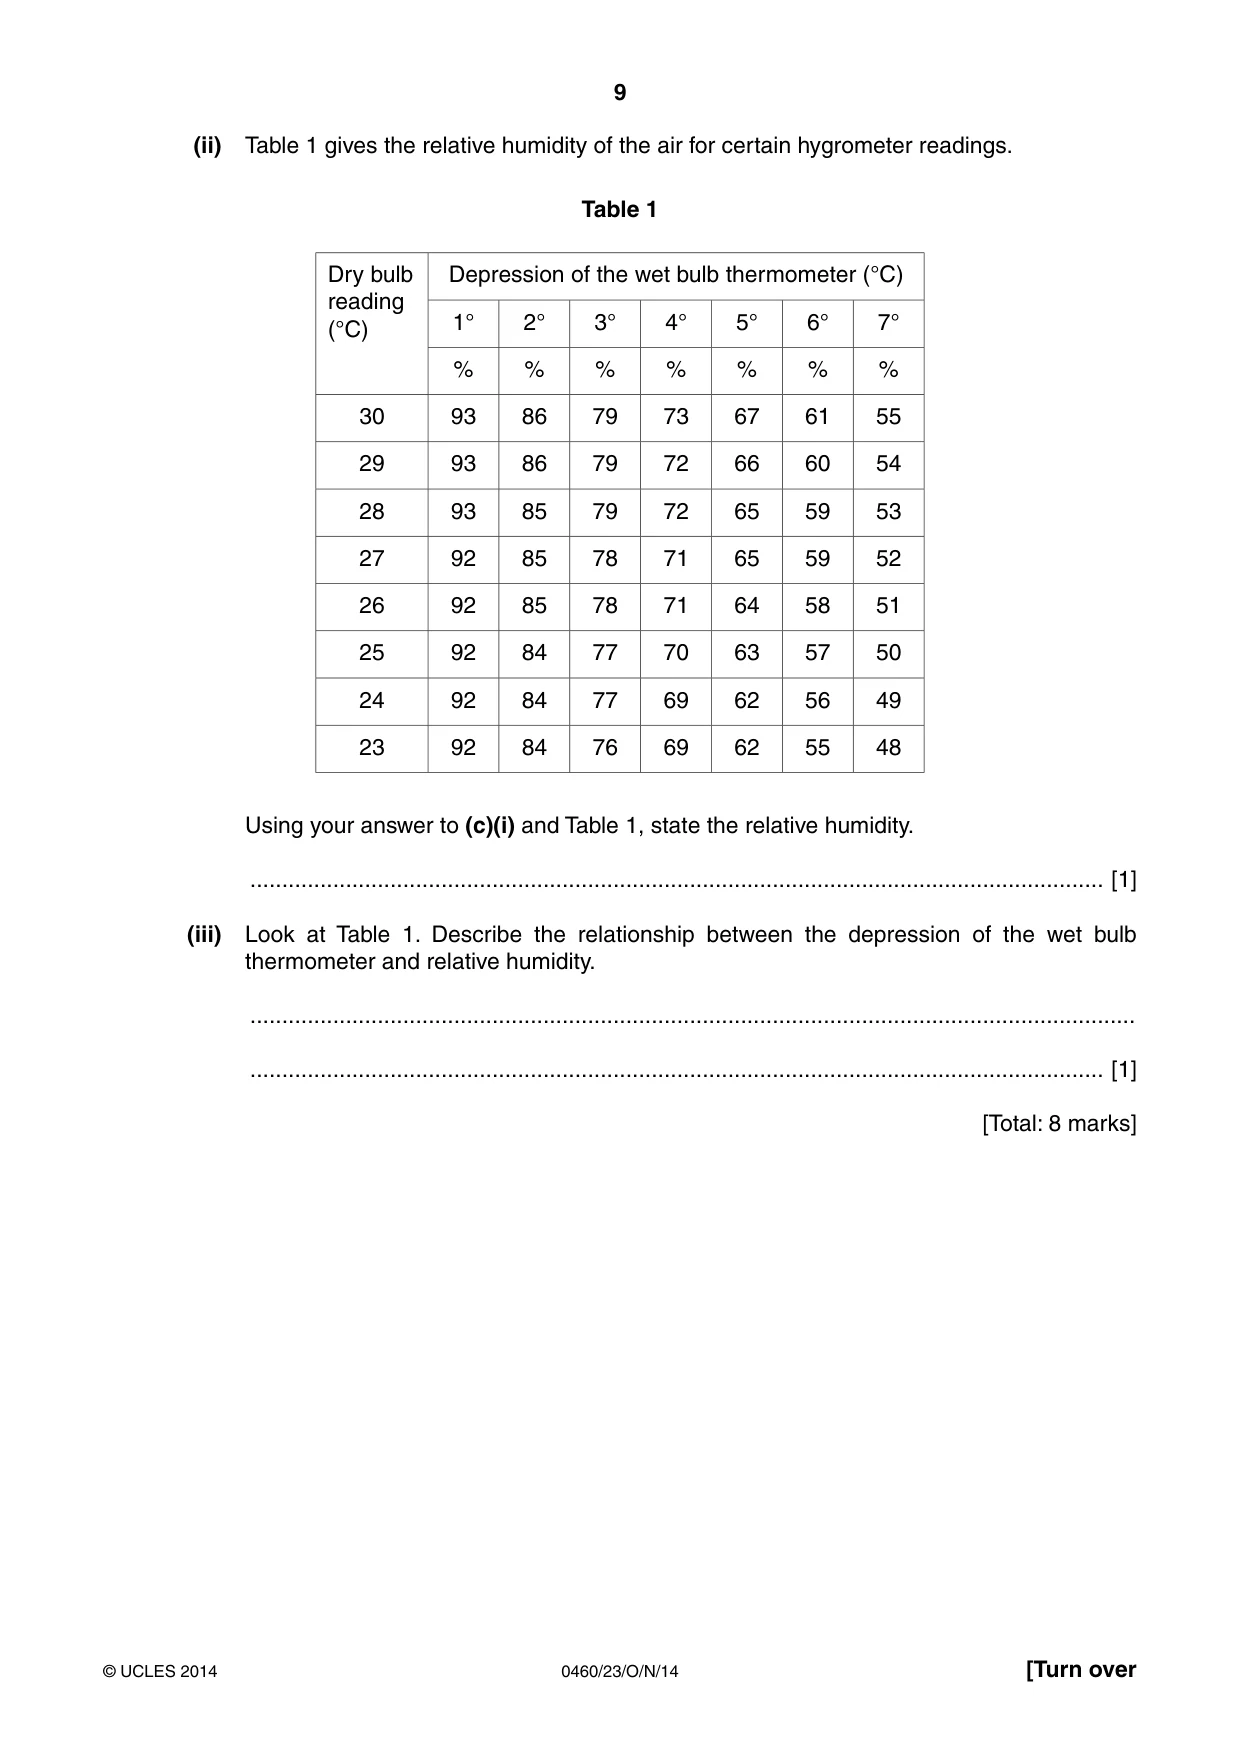
9 0460/23/O/N/14 © UCLES 2014 [Turn over (ii) Table 1 gives the relative humidity of the air for certain hygrometer readings. Table 1 Dry bulb reading (°C) Depression of the wet bulb thermometer (°C) 1° 2° 3° 4° 5° 6° 7° % % % % % % % 30 93 86 79 73 67 61 55 29 93 86 79 72 66 60 54 28 93 85 79 72 65 59 53 27 92 85 78 71 65 59 52 26 92 85 78 71 64 58 51 25 92 84 77 70 63 57 50 24 92 84 77 69 62 56 49 23 92 84 76 69 62 55 48 Using your answer to (c)(i) and Table 1, state the relative humidity. … [1] (iii) Look at Table 1. Describe the relationship between the depression of the wet bulb thermometer and relative humidity. … … [1] [Total: 8 marks]
Question paper, page 10
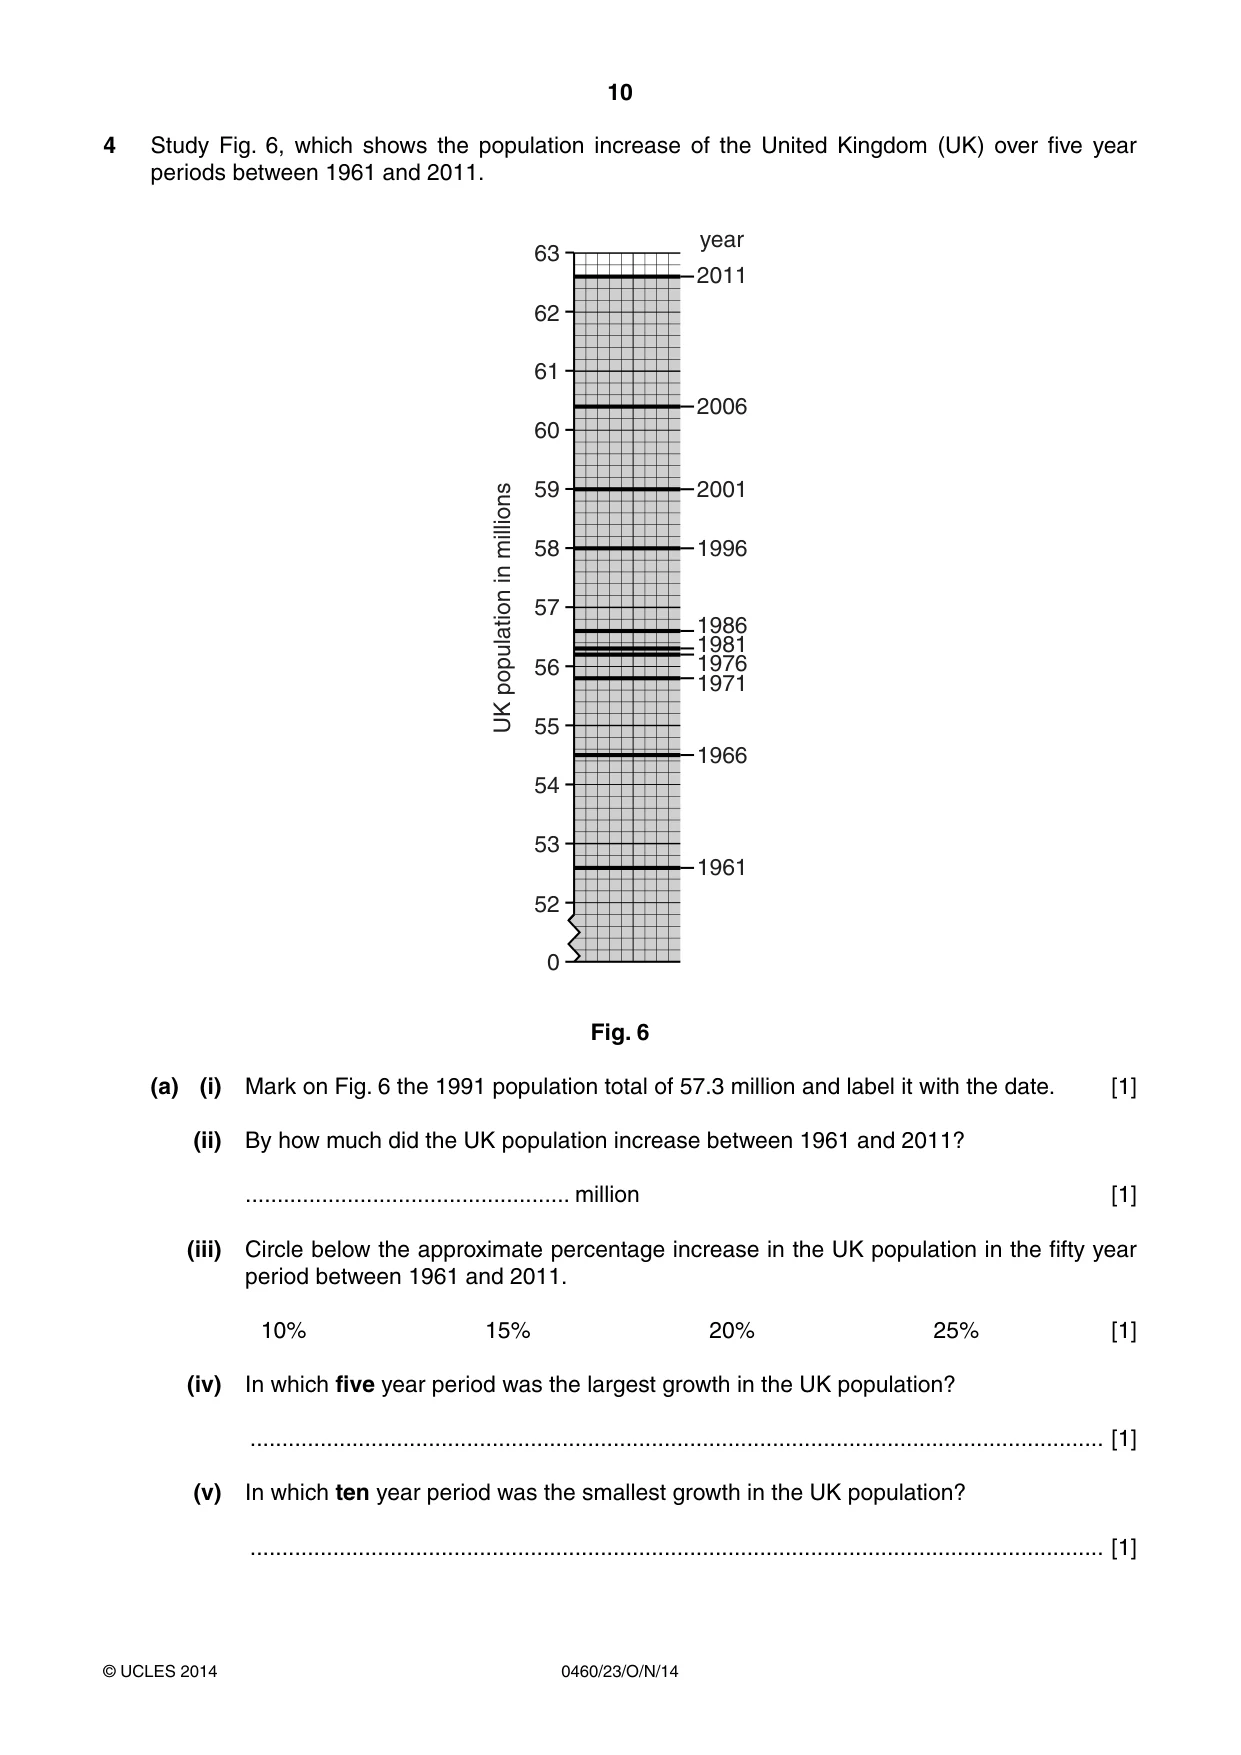
10 0460/23/O/N/14 © UCLES 2014 4 Study Fig. 6, which shows the population increase of the United Kingdom (UK) over five year periods between 1961 and 2011. 0 52 53 54 55 56 57 1961 1966 1971 1986 1996 2001 2006 2011 year 1976 1981 UK population in millions 58 59 60 61 62 63 Fig. 6 (a) (i) Mark on Fig. 6 the 1991 population total of 57.3 million and label it with the date. [1] (ii) By how much did the UK population increase between 1961 and 2011? … million [1] (iii) Circle below the approximate percentage increase in the UK population in the fifty year period between 1961 and 2011. 10% 15% 20% 25% [1] (iv) In which five year period was the largest growth in the UK population? … [1] (v) In which ten year period was the smallest growth in the UK population? … [1]
Question paper, page 11
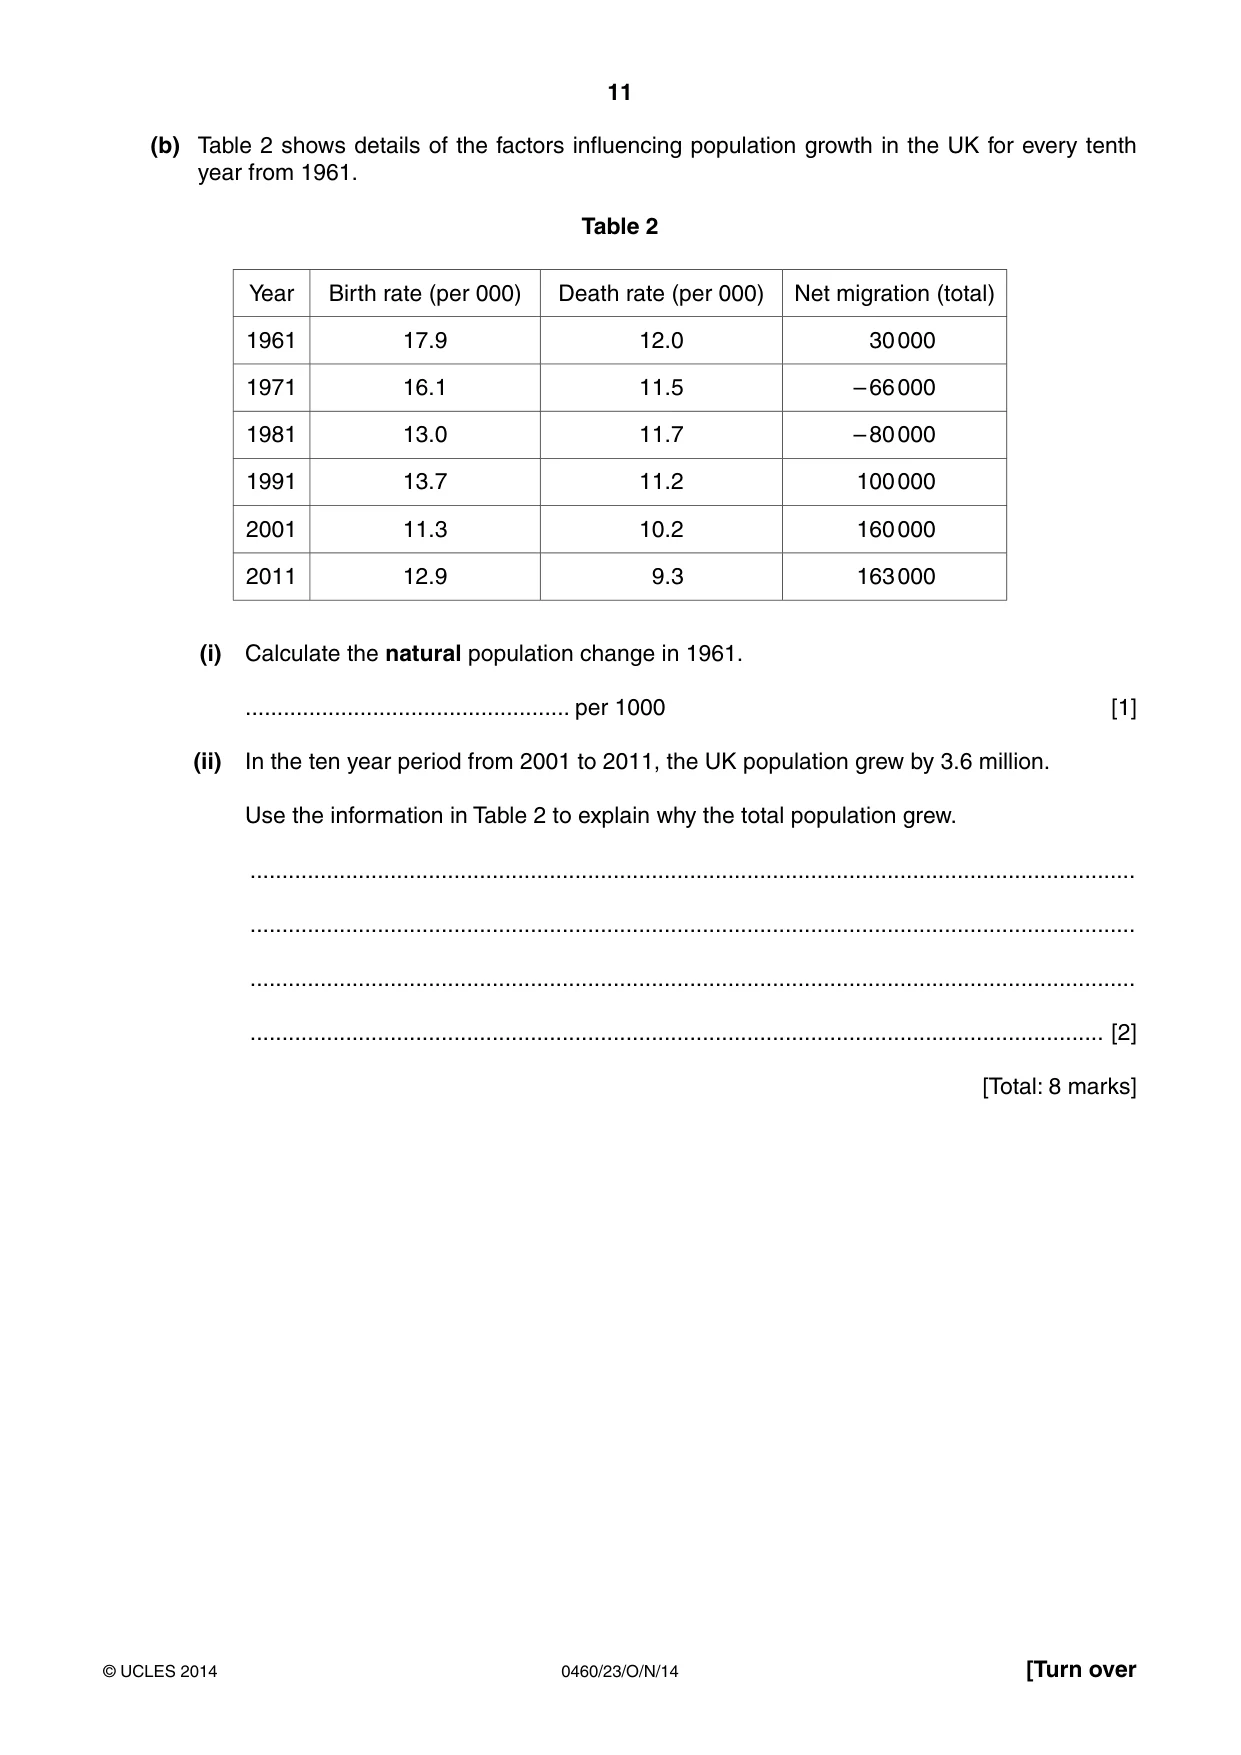
11 0460/23/O/N/14 © UCLES 2014 [Turn over (b) Table 2 shows details of the factors influencing population growth in the UK for every tenth year from 1961. Table 2 Year Birth rate (per 000) Death rate (per 000) Net migration (total) 1961 17.9 12.0 30 000 1971 16.1 11.5 – 66 000 1981 13.0 11.7 – 80 000 1991 13.7 11.2 100 000 2001 11.3 10.2 160 000 2011 12.9 9.3 163 000 (i) Calculate the natural population change in 1961. … per 1000 [1] (ii) In the ten year period from 2001 to 2011, the UK population grew by 3.6 million. Use the information in Table 2 to explain why the total population grew. … … … … [2] [Total: 8 marks]
Question paper, page 12
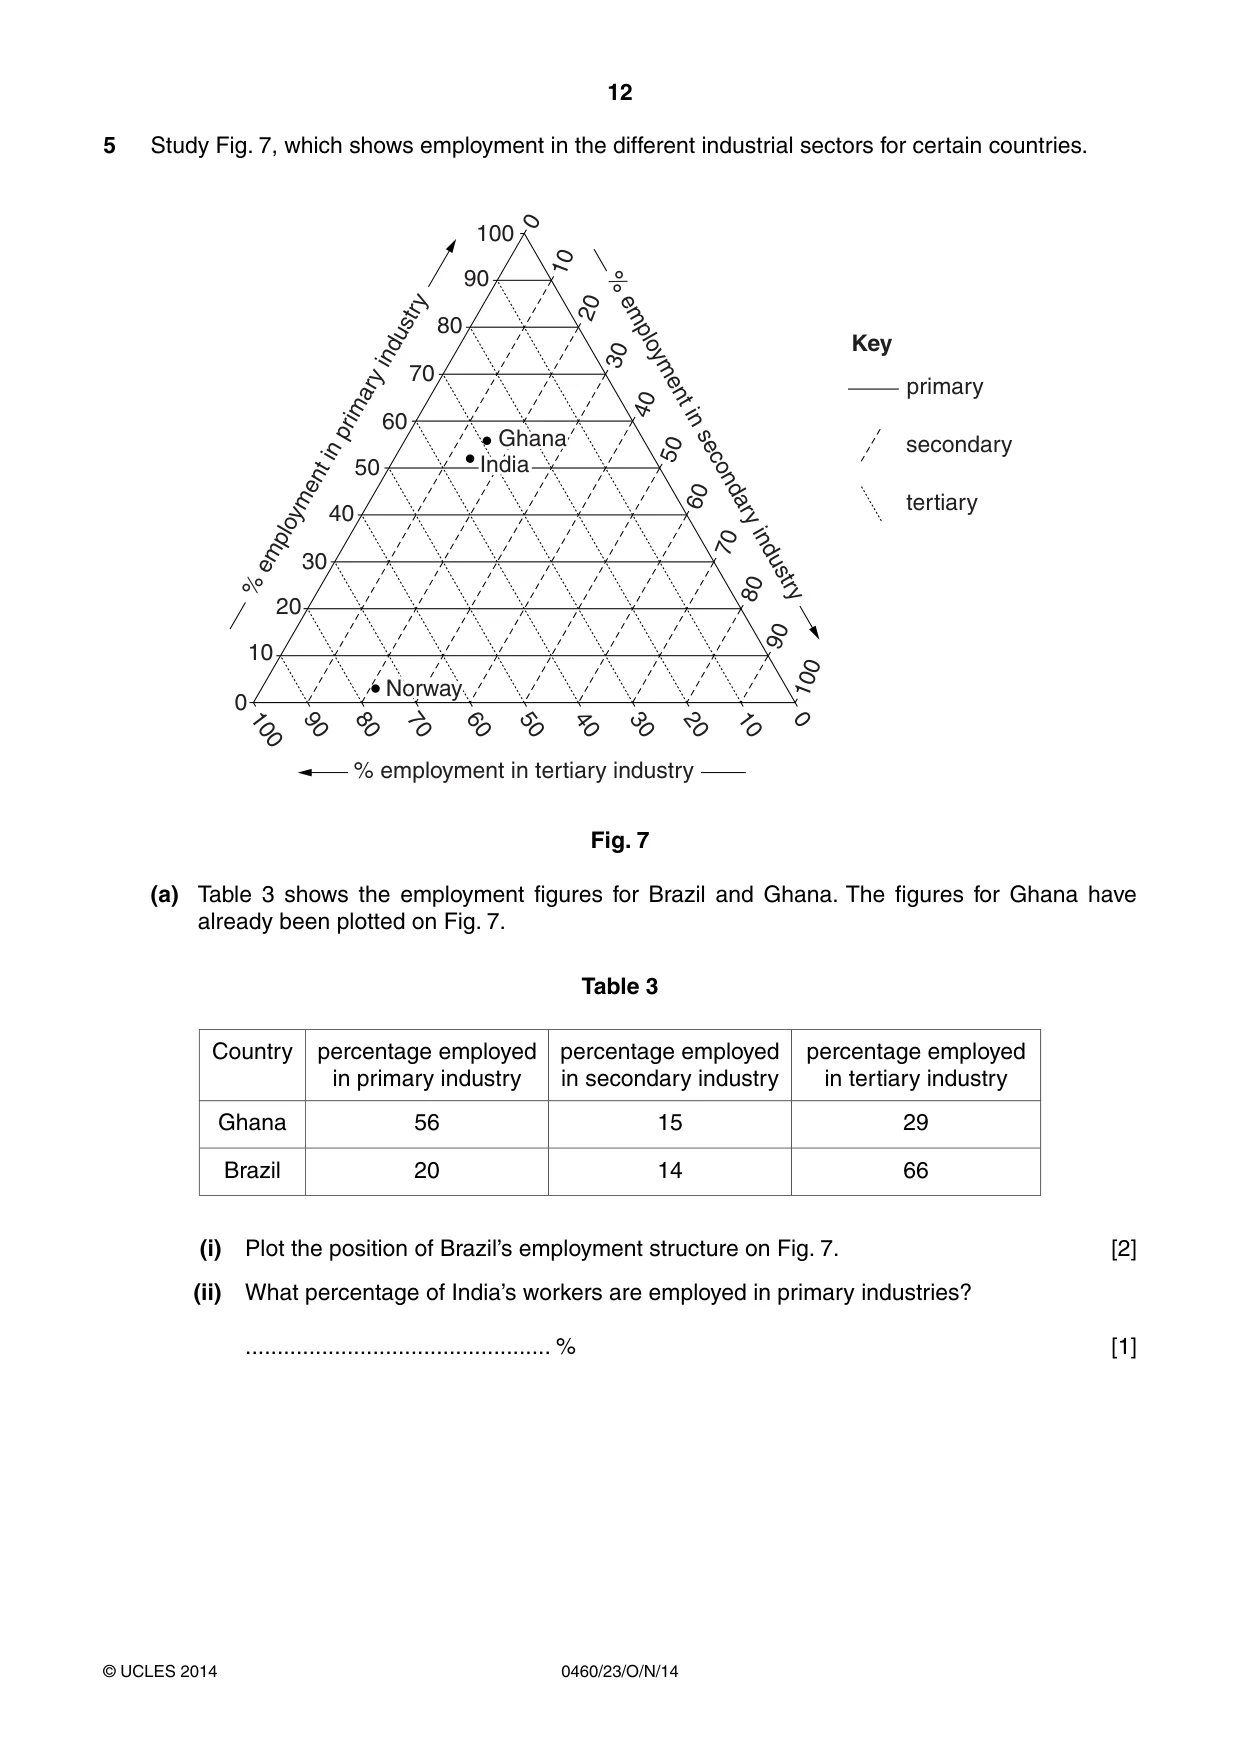
12 0460/23/O/N/14 © UCLES 2014 5 Study Fig. 7, which shows employment in the different industrial sectors for certain countries. 100 90 80 70 60 50 40 30 20 10 Norway 0 100 90 80 70 60 50 40 30 20 10 0 0 10 20 30 40 50 60 70 80 90 100 primary tertiary secondary Key % employment in primary industry % employment in secondary industry % employment in tertiary industry Norway Ghana Ghana India India Fig. 7 (a) Table 3 shows the employment figures for Brazil and Ghana. The figures for Ghana have already been plotted on Fig. 7. Table 3 Country percentage employed in primary industry percentage employed in secondary industry percentage employed in tertiary industry Ghana 56 15 29 Brazil 20 14 66 (i) Plot the position of Brazil’s employment structure on Fig. 7. [2] (ii) What percentage of India’s workers are employed in primary industries? … % [1]
Question paper, page 13
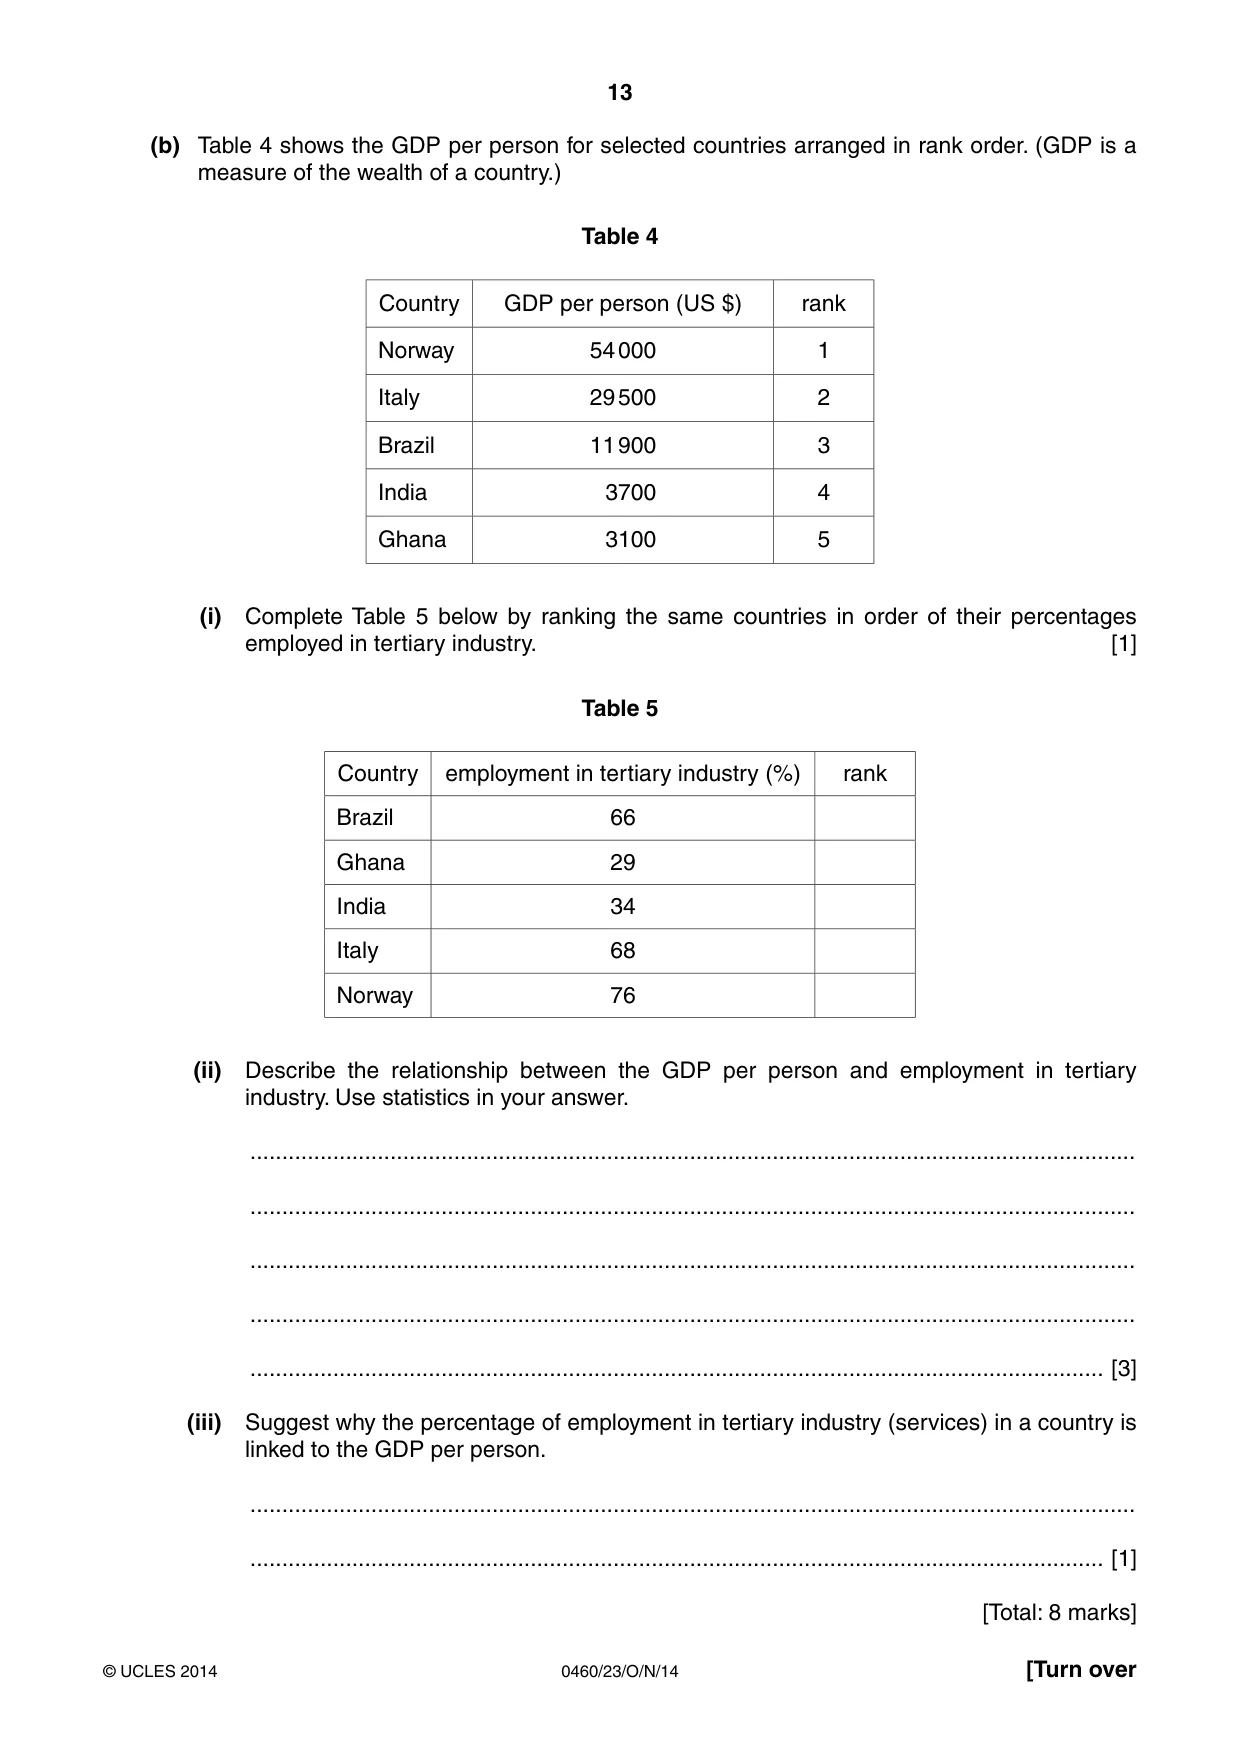
13 0460/23/O/N/14 © UCLES 2014 [Turn over (b) Table 4 shows the GDP per person for selected countries arranged in rank order. (GDP is a measure of the wealth of a country.) Table 4 Country GDP per person (US $) rank Norway 54 000 1 Italy 29 500 2 Brazil 11 900 3 India 3700 4 Ghana 3100 5 (i) Complete Table 5 below by ranking the same countries in order of their percentages employed in tertiary industry. [1] Table 5 Country employment in tertiary industry (%) rank Brazil 66 Ghana 29 India 34 Italy 68 Norway 76 (ii) Describe the relationship between the GDP per person and employment in tertiary industry. Use statistics in your answer. … … … … … [3] (iii) Suggest why the percentage of employment in tertiary industry (services) in a country is linked to the GDP per person. … … [1] [Total: 8 marks]
Question paper, page 14
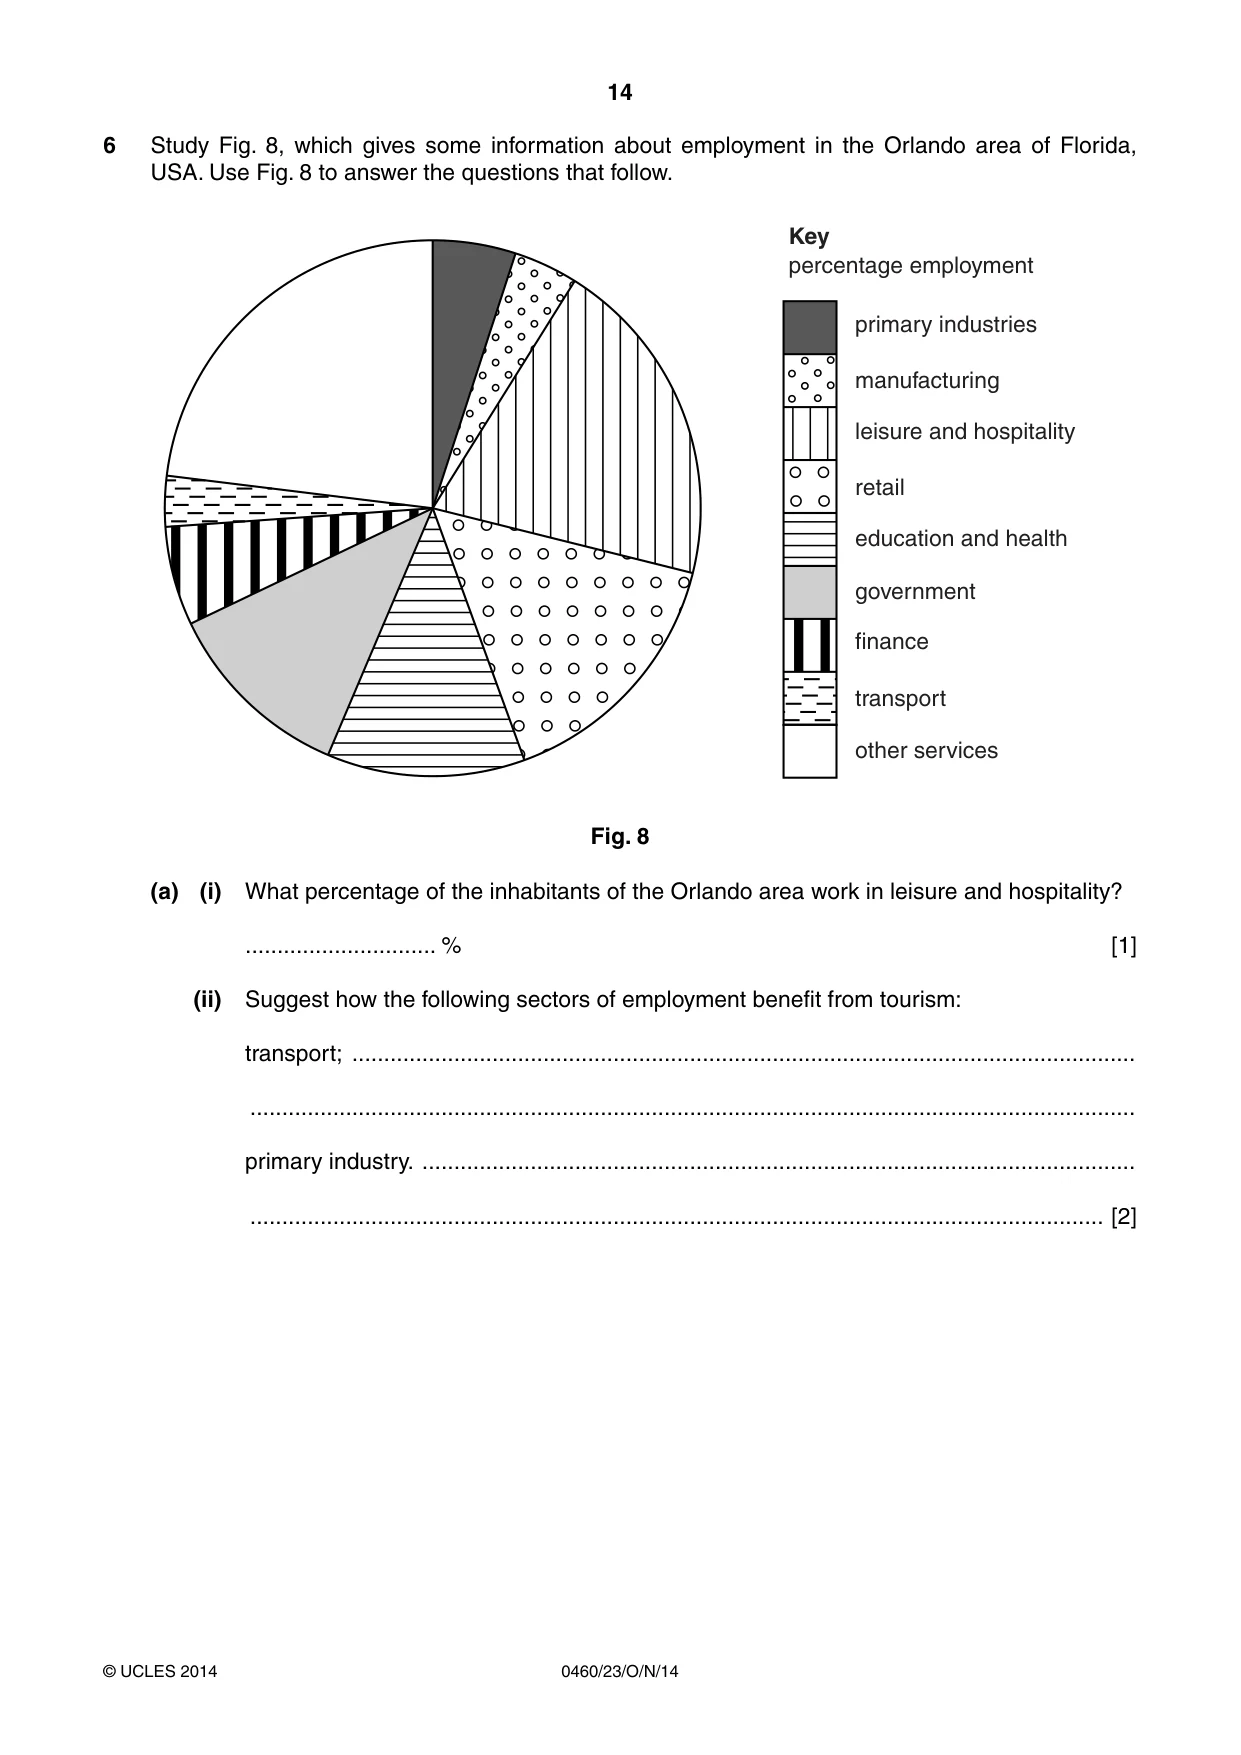
14 0460/23/O/N/14 © UCLES 2014 6 Study Fig. 8, which gives some information about employment in the Orlando area of Florida, USA. Use Fig. 8 to answer the questions that follow. primary industries Key percentage employment manufacturing leisure and hospitality retail education and health government finance transport other services Fig. 8 (a) (i) What percentage of the inhabitants of the Orlando area work in leisure and hospitality? … % [1] (ii) Suggest how the following sectors of employment benefit from tourism: transport; … … primary industry. … … [2]
Question paper, page 15
15 0460/23/O/N/14 © UCLES 2014 (b) Suggest reasons why large numbers of tourists visit urban areas. … … … … … … … … … … [5] [Total: 8 marks]
Question paper, page 16
16 0460/23/O/N/14 © UCLES 2014 BLANK PAGE Copyright Acknowledgements: Question 2 Photograph A M. Fretwell © UCLES. Question 6 Fig. 8 Adapted from: © U.S. Bureau of Labor Statistics. Permission to reproduce items where third-party owned material protected by copyright is included has been sought and cleared where possible. Every reasonable effort has been made by the publisher (UCLES) to trace copyright holders, but if any items requiring clearance have unwittingly been included, the publisher will be pleased to make amends at the earliest possible opportunity. Cambridge International Examinations is part of the Cambridge Assessment Group. Cambridge Assessment is the brand name of University of Cambridge Local Examinations Syndicate (UCLES), which is itself a department of the University of Cambridge.
Mark scheme, page 1
® IGCSE is the registered trademark of Cambridge International Examinations. CAMBRIDGE INTERNATIONAL EXAMINATIONS Cambridge International General Certificate of Secondary Education MARK SCHEME for the October/November 2014 series 0460 GEOGRAPHY 0460/23 Paper 2, maximum raw mark 60 This mark scheme is published as an aid to teachers and candidates, to indicate the requirements of the examination. It shows the basis on which Examiners were instructed to award marks. It does not indicate the details of the discussions that took place at an Examiners’ meeting before marking began, which would have considered the acceptability of alternative answers. Mark schemes should be read in conjunction with the question paper and the Principal Examiner Report for Teachers. Cambridge will not enter into discussions about these mark schemes. Cambridge is publishing the mark schemes for the October/November 2014 series for most Cambridge IGCSE®, Cambridge International A and AS Level components and some Cambridge O Level components.
Mark scheme, page 2
Page 2 Mark Scheme Syllabus Paper Cambridge IGCSE – October/November 2014 0460 23 © Cambridge International Examinations 2014 1 (a) (i) dam [1] (ii) other [1] (iii) 1205 metres [1] (iv) reservoir [1] (v) orchard/plantation [1] (vi) dip tank [1] (b) nucleated linear dispersed [3] (c) (i) River Ruya: 44–47 mm from the left hand side of the section [1] (ii) power line: 59–62 mm from the left hand side of the section [1] (iii) gravel or earth road: 75–78 mm from the left hand side of the section/within 2 mm of the eastern edge [1] Use the ruler device to measure the answers. Arrows should end within about 1 cm of the profile. Measure to the point that the arrow projects to. (d) (i) 340 [1] (ii) 058169 [1] (e) meander rapid(s) island(s)/braided gentle gradient variable width flows east tributaries [3]
Mark scheme, page 3
Page 3 Mark Scheme Syllabus Paper Cambridge IGCSE – October/November 2014 0460 23 © Cambridge International Examinations 2014 (f) avoids high(er/est)/hill/ridge/on lower slopes/heights between 1200 m and 1400 m/at base of hill/around the hill avoids valley floor/ flood plain/flooding on gentle slope/avoids steep slope away from river/stream in east [3] 2 (a) (i) Cayembe [1] (ii) peak conical steep slopes ridge(s)/valley snow/ice bushes/trees/grass/dense vegetation [3] (b) (i) destructive [1] (ii) denser plate label on Nazca Plate [1] (iii) 325 [1] (iv) one plate moving beneath another plate [1] 3 (a) A mercury/alcohol/spirit D water [2] (b) to keep the bulb moist/wet to cool the bulb to allow evaporation from the bulb to supply water to B B requires water from D [1] (c) (i) 28 24 If reversed = 1 4 (ECF) [3] (ii) 72% (ECF) [1] (iii) inverse negative as the depression of the wet bulb temperature increases the relative humidity decreases (or converse) as one increases the other decreases [1]
Mark scheme, page 4
Page 4 Mark Scheme Syllabus Paper Cambridge IGCSE – October/November 2014 0460 23 © Cambridge International Examinations 2014 4 (a) (i) line at 57.3 million with date 1991 [1] (ii) 9.9 – 10.1 million or between [1] (iii) 20% [1] (iv) 2006 – 2011 [1] (v) 1976 – 1986 [1] (b) (i) 5.9 [1] (ii) net positive migration/immigration exceeds emigration increased birth rate and reduced death rate /birth rate higher than death rate/natural increase [2] 5 (a) (i) on the 20% primary line = 1 14% secondary and 66% tertiary = 1 If primary wrong credit one other correct axis [2] (ii) 51/52/53 [1] (b) (i) 3 5 4 2 1 [1] (ii) positive relationship/as G.D.P. increases percentage employed in tertiary industry increases same rank order for both factors pairs of data for a single country max 2 Pairs of data must include both factors with at least one factor expressed in raw data and not rank e.g. Norway’s G.D.P. is US$ 54 000 pp and it has 76% employed in tertiary industry e.g. Ghana’s G.D.P. is US$ 3100 pp and it is 5th ranked in tertiary industry Allow without units expressed correctly [3] (iii) tertiary industry has higher wages/profits (therefore G.D.P. is higher) higher G.D.P. means people can afford to pay for (more) services (or expressed conversely) [1]
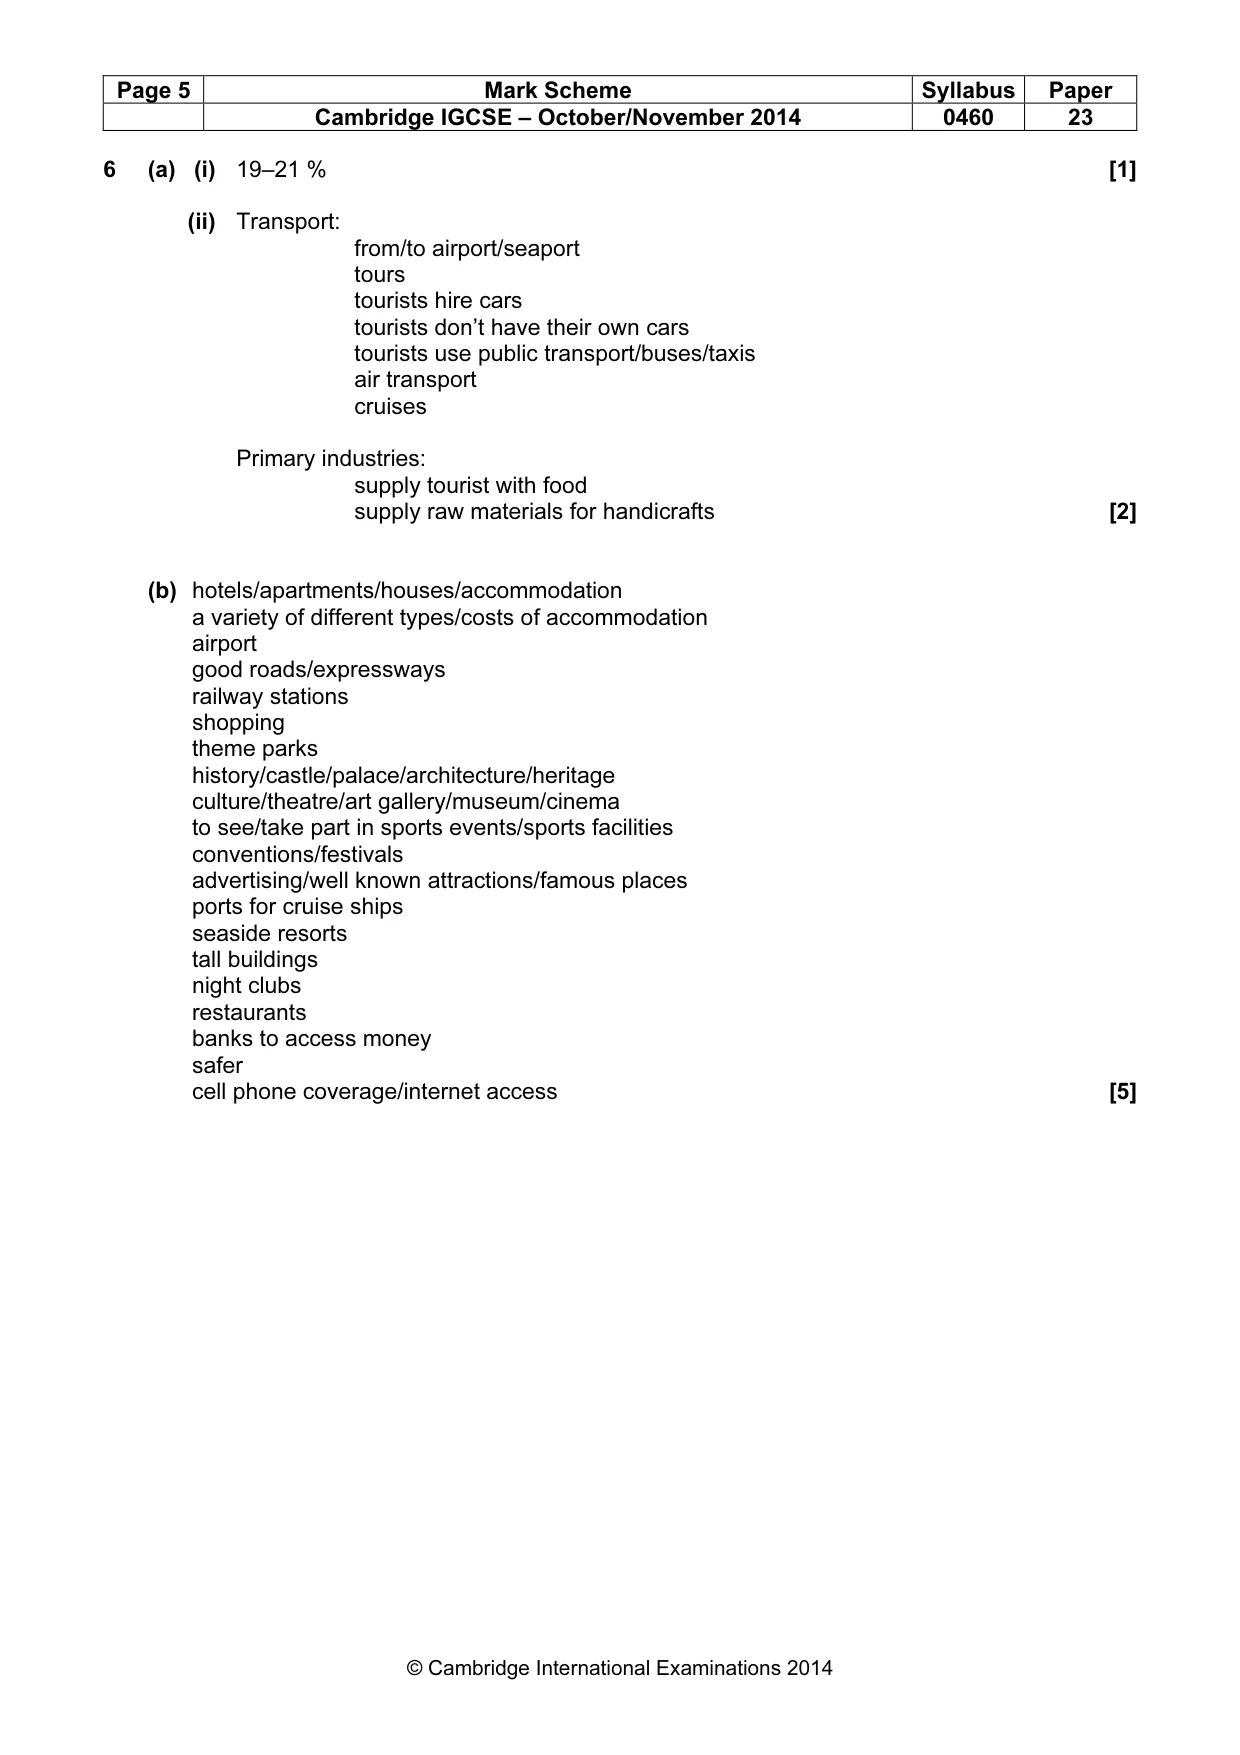
Mark scheme, page 5
Page 5 Mark Scheme Syllabus Paper Cambridge IGCSE – October/November 2014 0460 23 © Cambridge International Examinations 2014 6 (a) (i) 19–21 % [1] (ii) Transport: from/to airport/seaport tours tourists hire cars tourists don’t have their own cars tourists use public transport/buses/taxis air transport cruises Primary industries: supply tourist with food supply raw materials for handicrafts [2] (b) hotels/apartments/houses/accommodation a variety of different types/costs of accommodation airport good roads/expressways railway stations shopping theme parks history/castle/palace/architecture/heritage culture/theatre/art gallery/museum/cinema to see/take part in sports events/sports facilities conventions/festivals advertising/well known attractions/famous places ports for cruise ships seaside resorts tall buildings night clubs restaurants banks to access money safer cell phone coverage/internet access [5]
What you needed in this session
Cambridge’s own grade thresholds for 2014 Oct/Nov, Paper 2 · Variant 3. A higher threshold means an easier paper — the bar moves with how the cohort did.