Cambridge IGCSE Geography 0460 — 2013 Oct/Nov Paper 4 · Variant 3
0460/43/O/N/13 · 60 marks · ≈68 min
The question paper and its mark scheme, free to read here and free to download. This is Cambridge’s own paper, exactly as it was sat.
Question paper20 pages





Mark scheme5 pages
Answers below. Sit the paper first if you are practising.
Paper as text
Question paper, page 1
This document consists of 18 printed pages, 2 blank pages and 1 Insert. DC (NH/CGW) 65685/6 © UCLES 2013 [Turn over UNIVERSITY OF CAMBRIDGE INTERNATIONAL EXAMINATIONS International General Certificate of Secondary Education * 4 1 7 9 5 9 6 0 2 3 * CANDIDATE NAME CENTRE NUMBER CANDIDATE NUMBER GEOGRAPHY 0460/43 Paper 4 Alternative to Coursework October/November 2013 1 hour 30 minutes Candidates answer on the Question Paper. Additional Materials: Ruler Calculator Protractor READ THESE INSTRUCTIONS FIRST Write your Centre number, candidate number and name in the spaces provided. Write in dark blue or black pen. You may use a soft pencil for any diagrams, graphs or rough working. Do not use staples, paper clips, highlighters, glue or correction fluid. DO NOT WRITE ON ANY BARCODES. Answer all questions. The Insert contains Tables 1 and 2 and Fig. 1 for Question 1, and Fig. 4 for Question 2. The Insert is not required by the Examiner. Sketch maps and diagrams should be drawn whenever they serve to illustrate an answer. At the end of the examination, fasten all your work securely together. The number of marks is given in brackets [ ] at the end of each question or part question. For Examiner’s Use Q1 Q2 Total www.theallpapers.com
Question paper, page 2
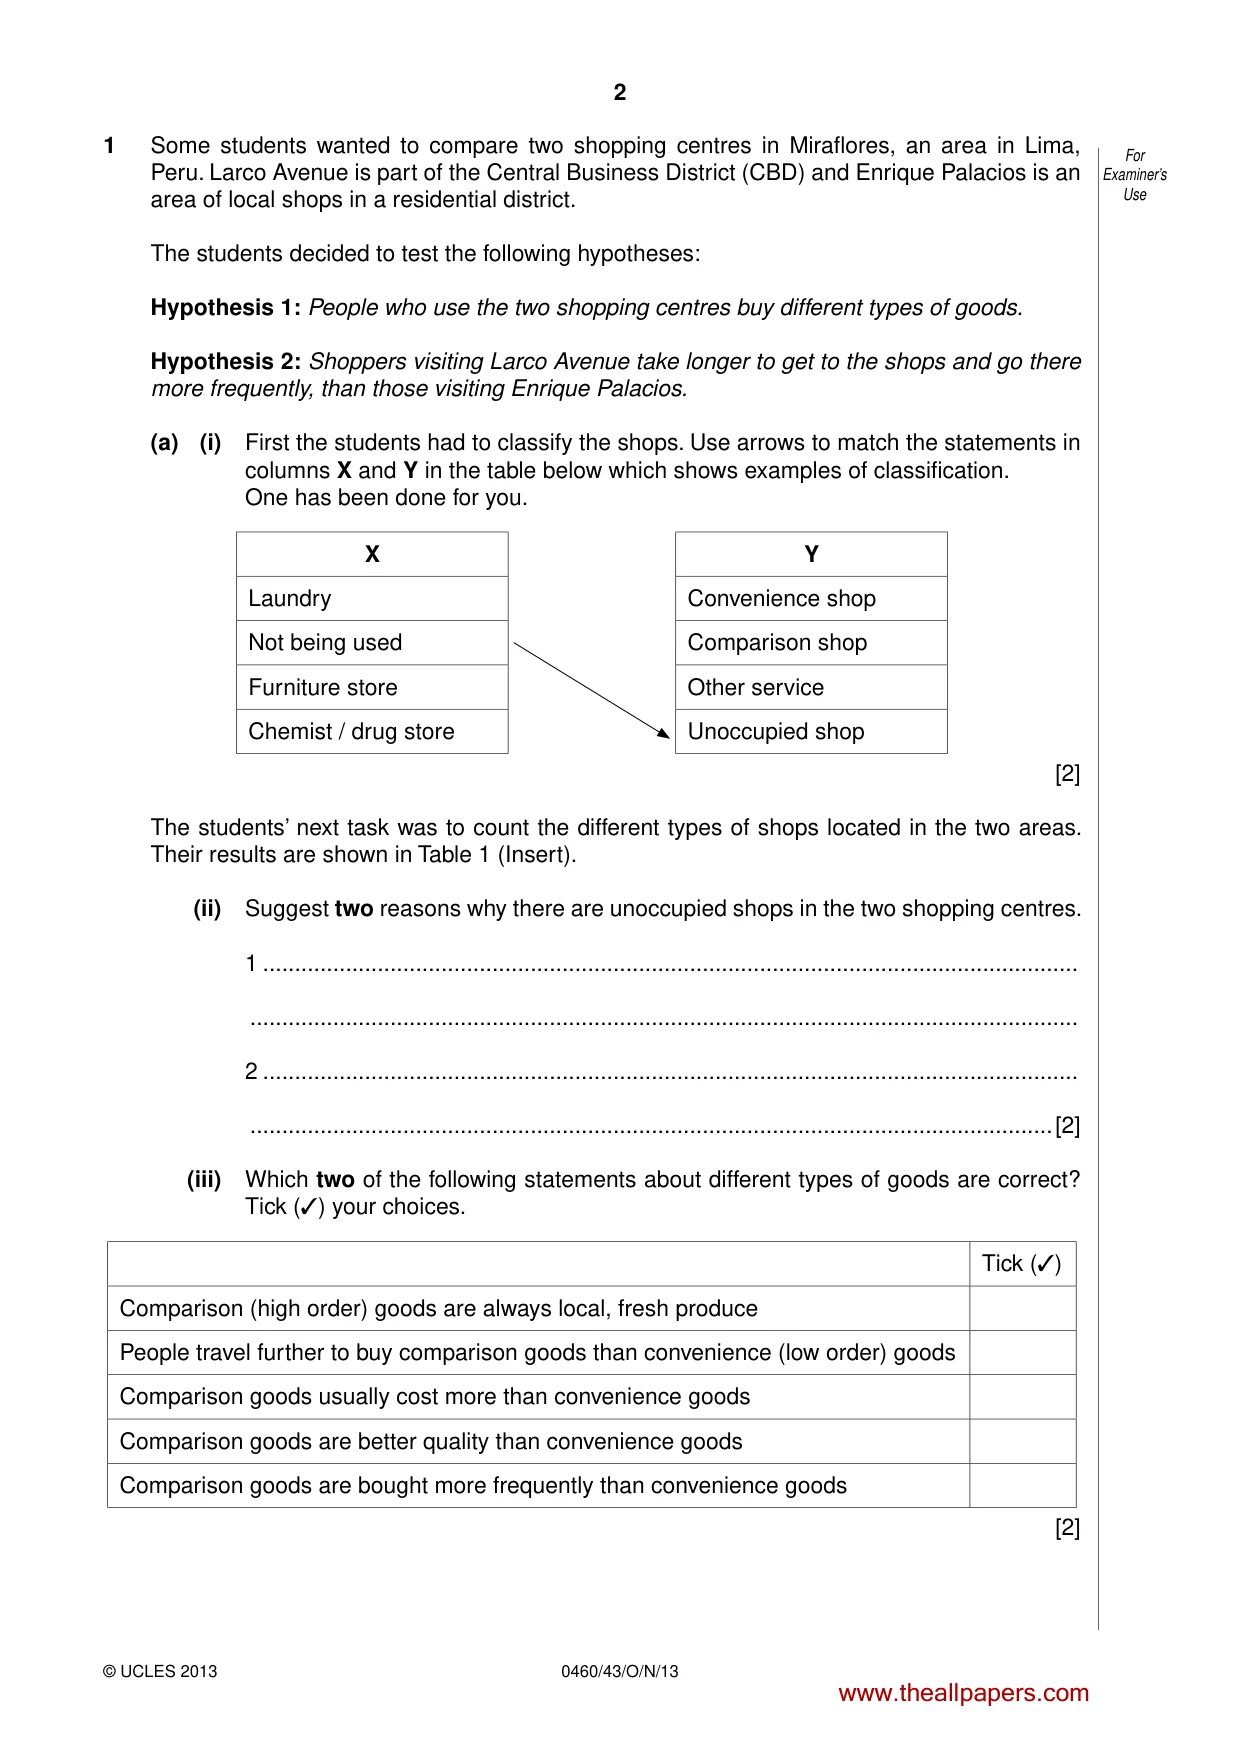
2 0460/43/O/N/13 © UCLES 2013 For Examiner’s Use 1 Some students wanted to compare two shopping centres in Miraflores, an area in Lima, Peru. Larco Avenue is part of the Central Business District (CBD) and Enrique Palacios is an area of local shops in a residential district. The students decided to test the following hypotheses: Hypothesis 1: People who use the two shopping centres buy different types of goods. Hypothesis 2: Shoppers visiting Larco Avenue take longer to get to the shops and go there more frequently, than those visiting Enrique Palacios. (a) (i) First the students had to classify the shops. Use arrows to match the statements in columns X and Y in the table below which shows examples of classification. One has been done for you. X Y Laundry Convenience shop Not being used Comparison shop Furniture store Other service Chemist / drug store Unoccupied shop [2] The students’ next task was to count the different types of shops located in the two areas. Their results are shown in Table 1 (Insert). (ii) Suggest two reasons why there are unoccupied shops in the two shopping centres. 1 … … 2 … …[2] (iii) Which two of the following statements about different types of goods are correct? Tick (✓) your choices. Tick (✓) Comparison (high order) goods are always local, fresh produce People travel further to buy comparison goods than convenience (low order) goods Comparison goods usually cost more than convenience goods Comparison goods are better quality than convenience goods Comparison goods are bought more frequently than convenience goods [2] www.theallpapers.com
Question paper, page 3
3 0460/43/O/N/13 © UCLES 2013 [Turn over For Examiner’s Use (b) Next the students used a questionnaire with some people in the shopping centres. This questionnaire is shown in Fig. 1 (Insert). (i) Suggest two pieces of advice their teacher gave them about using a questionnaire with people who are shopping. 1 … … 2 … …[2] (ii) Table 2 (Insert) shows the results of Question 1 in the questionnaire. Do the results shown in Tables 1 and 2 support Hypothesis 1: People who use the two shopping centres buy different types of goods? Use evidence from Tables 1 and 2 to support your answer. … … … … … … … …[4] www.theallpapers.com
Question paper, page 4
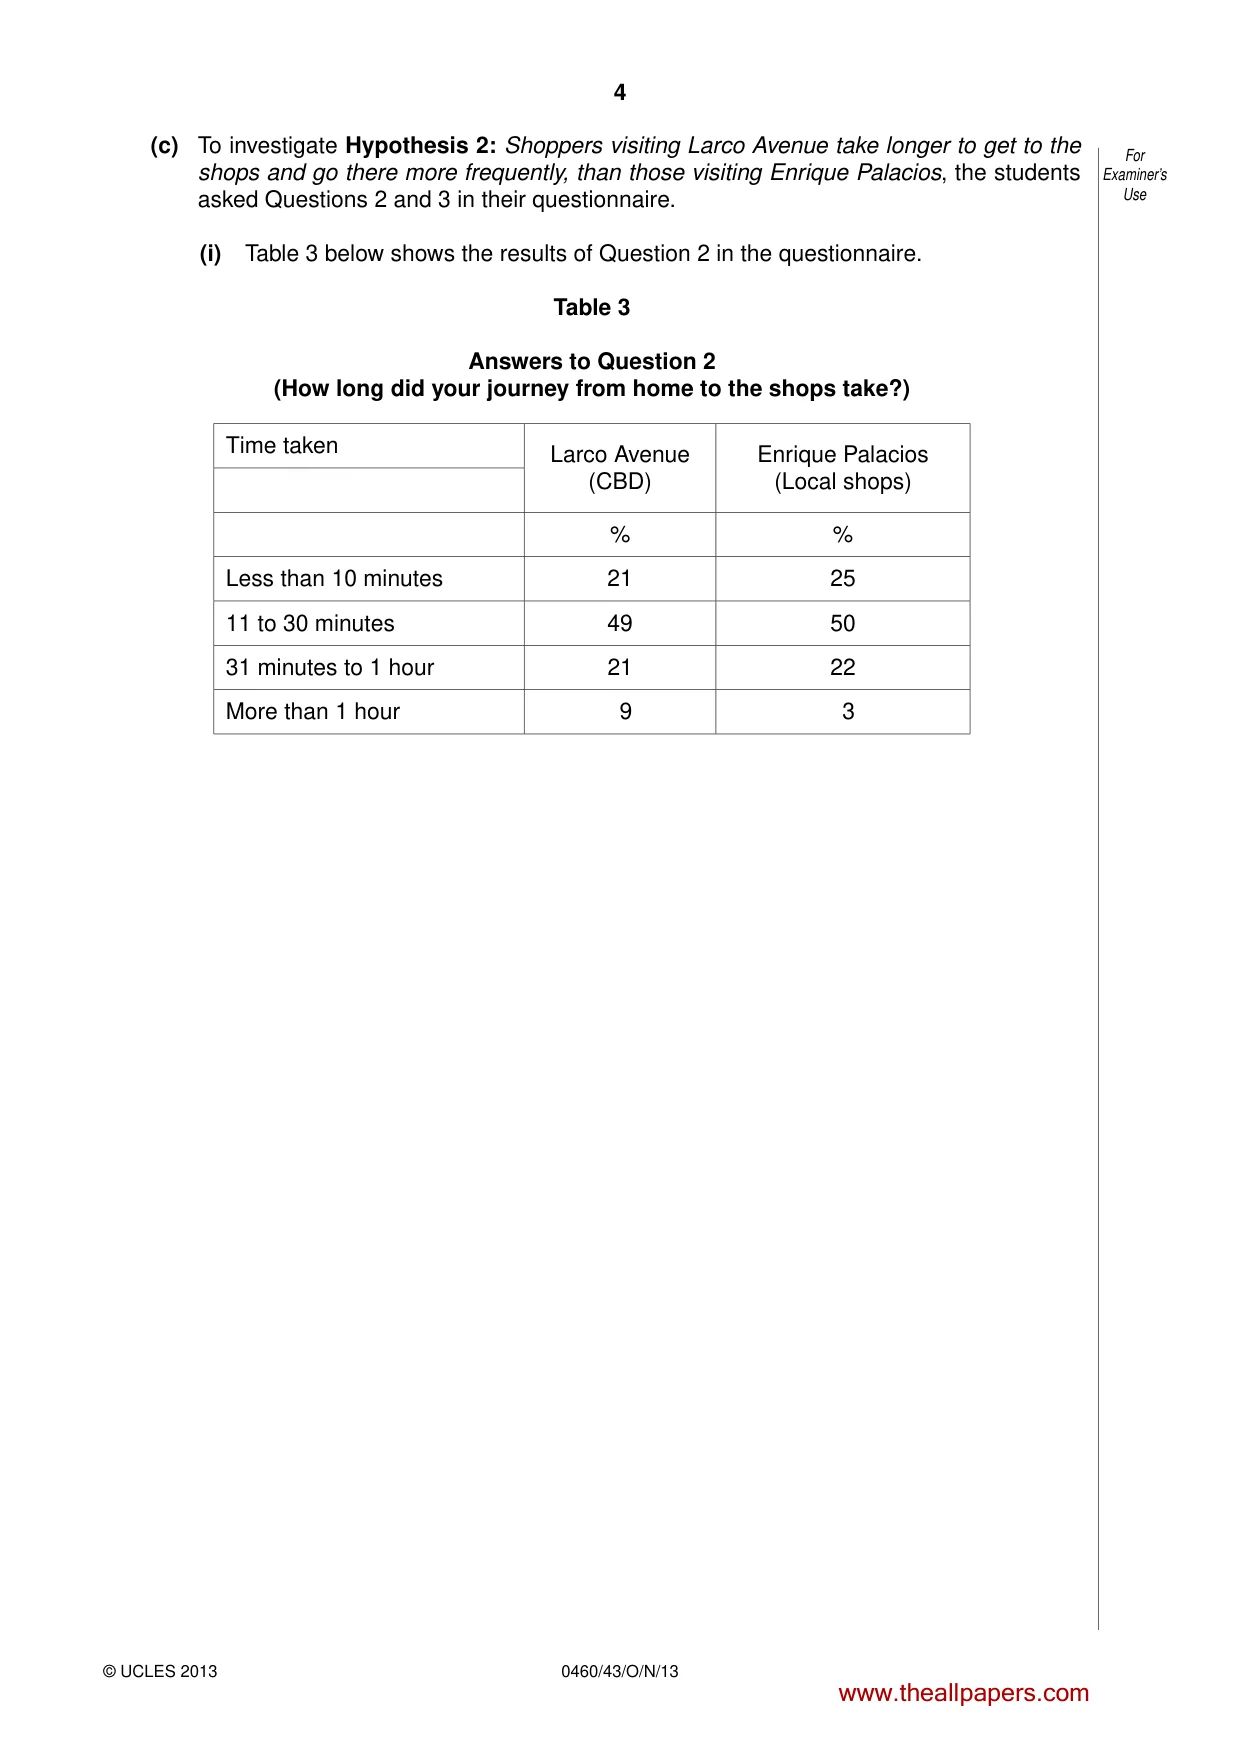
4 0460/43/O/N/13 © UCLES 2013 For Examiner’s Use (c) To investigate Hypothesis 2: Shoppers visiting Larco Avenue take longer to get to the shops and go there more frequently, than those visiting Enrique Palacios, the students asked Questions 2 and 3 in their questionnaire. (i) Table 3 below shows the results of Question 2 in the questionnaire. Table 3 Answers to Question 2 (How long did your journey from home to the shops take?) Time taken Larco Avenue (CBD) Enrique Palacios (Local shops) % % Less than 10 minutes 21 25 11 to 30 minutes 49 50 31 minutes to 1 hour 21 22 More than 1 hour 9 3 www.theallpapers.com
Question paper, page 5
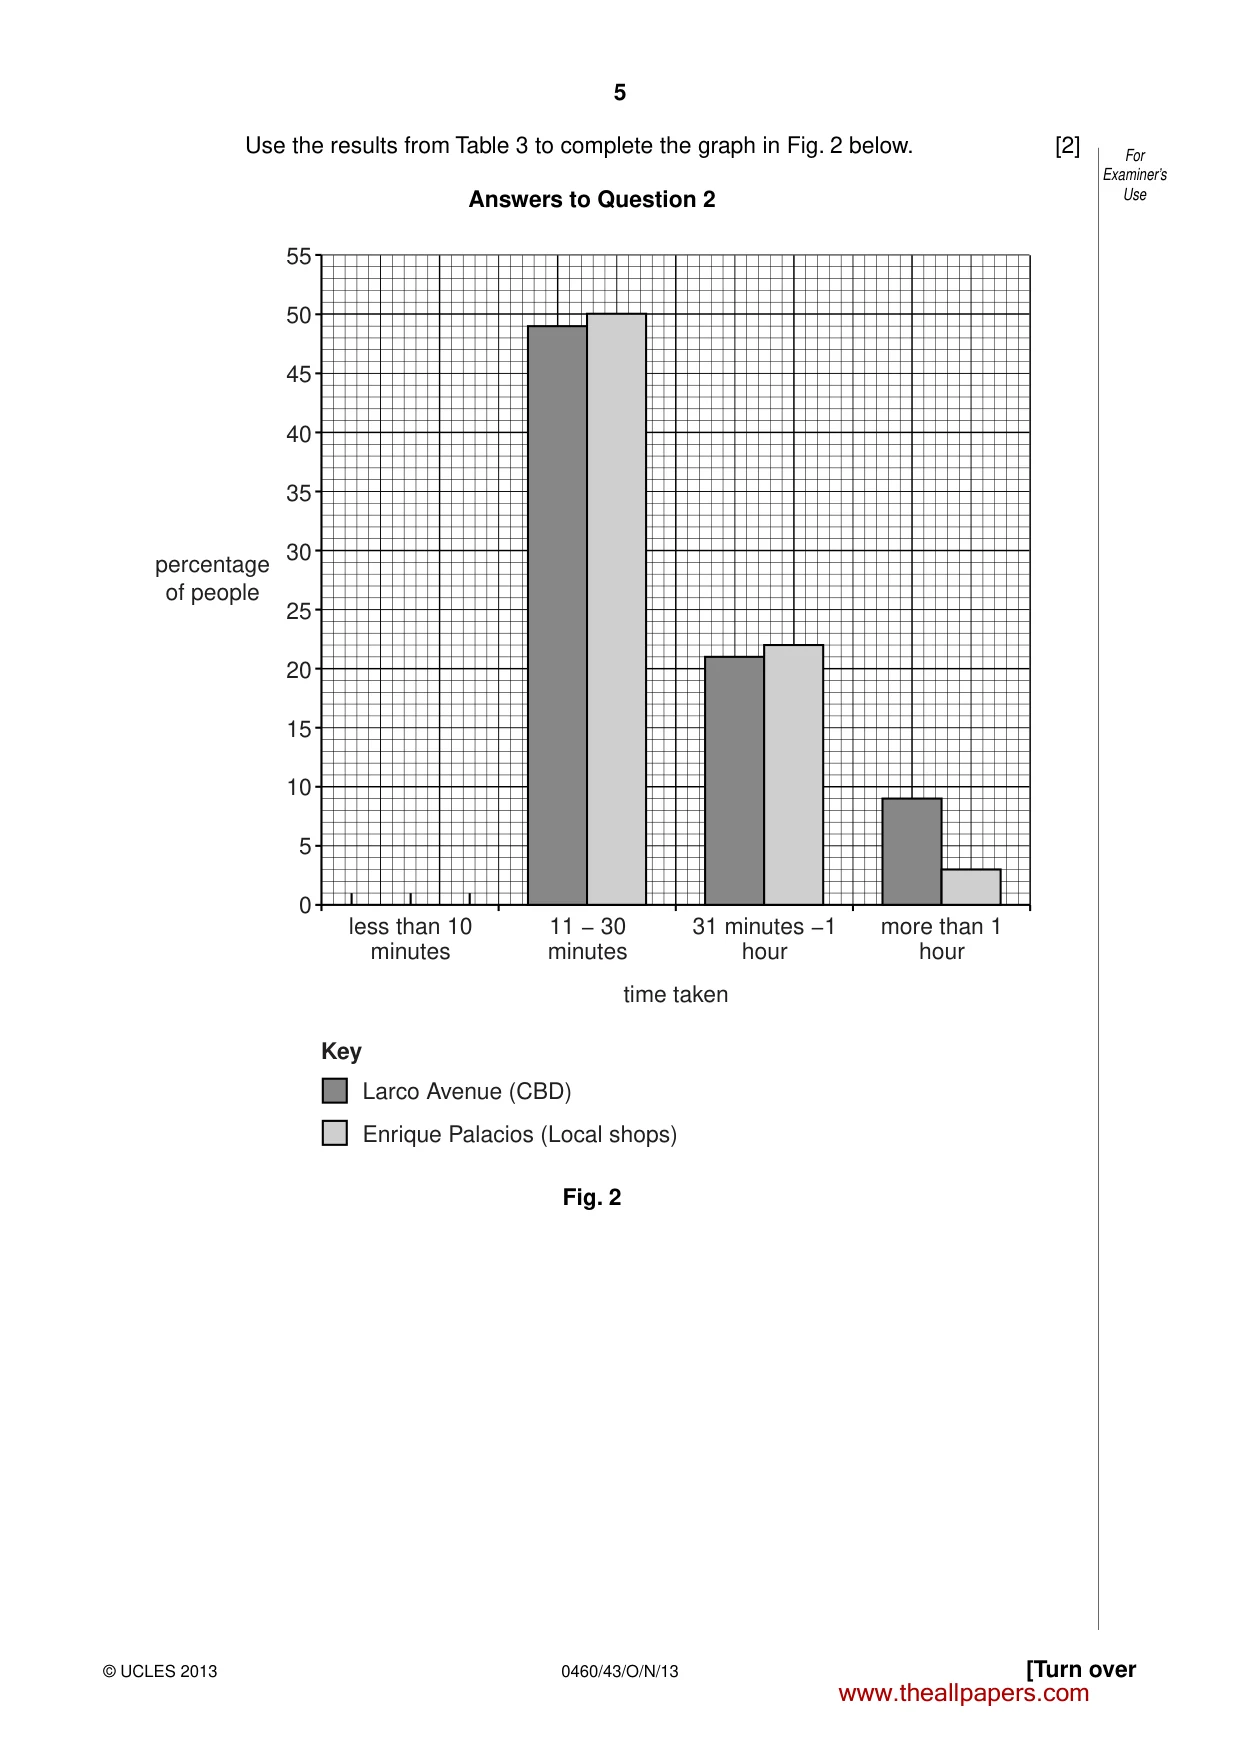
5 0460/43/O/N/13 © UCLES 2013 [Turn over For Examiner’s Use Use the results from Table 3 to complete the graph in Fig. 2 below. [2] Answers to Question 2 50 55 45 40 35 30 25 percentage of people time taken Larco Avenue (CBD) Key Enrique Palacios (Local shops) less than 10 minutes 11 − 30 minutes 31 minutes −1 hour more than 1 hour 20 15 10 5 0 Fig. 2 www.theallpapers.com
Question paper, page 6
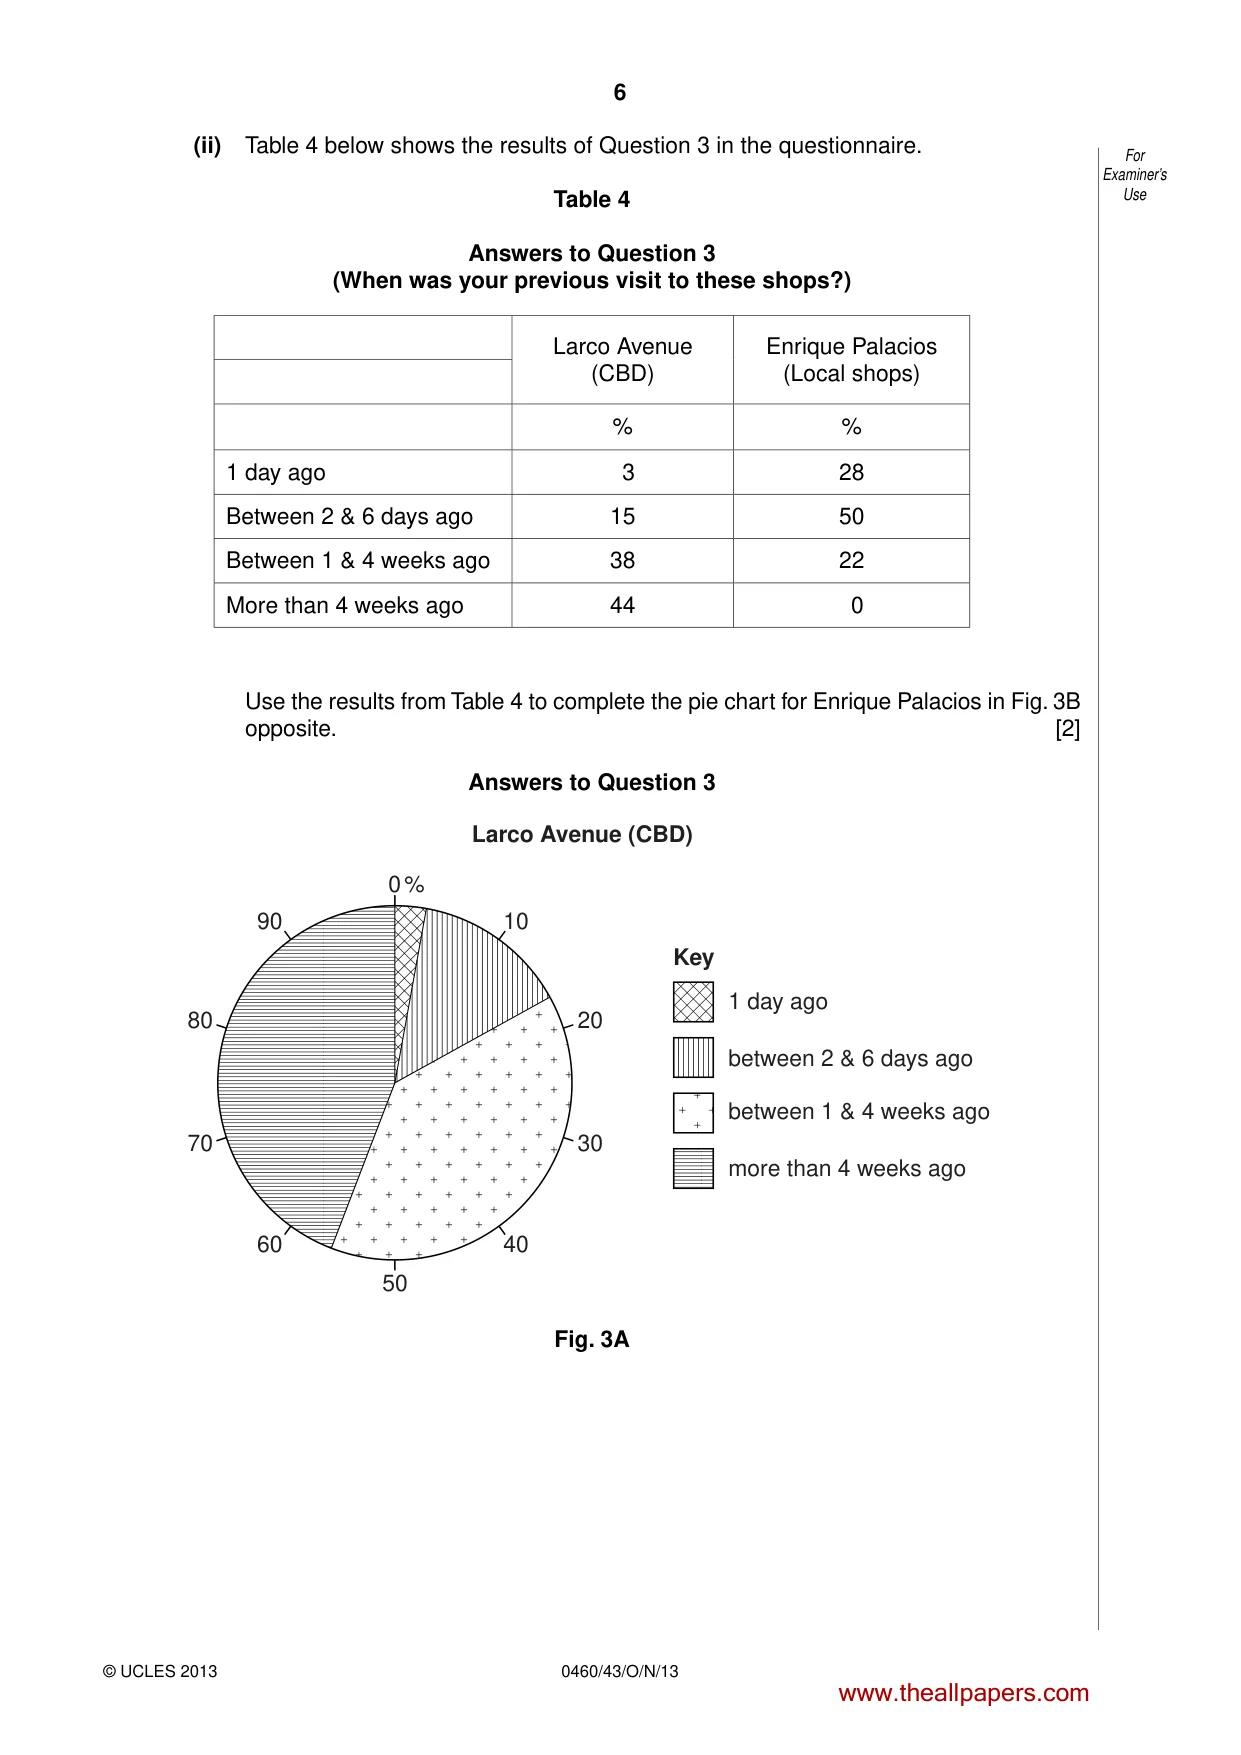
6 0460/43/O/N/13 © UCLES 2013 For Examiner’s Use (ii) Table 4 below shows the results of Question 3 in the questionnaire. Table 4 Answers to Question 3 (When was your previous visit to these shops?) Larco Avenue (CBD) Enrique Palacios (Local shops) % % 1 day ago 3 28 Between 2 & 6 days ago 15 50 Between 1 & 4 weeks ago 38 22 More than 4 weeks ago 44 0 Use the results from Table 4 to complete the pie chart for Enrique Palacios in Fig. 3B opposite. [2] Answers to Question 3 1 day ago between 2 & 6 days ago between 1 & 4 weeks ago more than 4 weeks ago 50 0 % 10 40 90 60 20 Key 30 80 70 Larco Avenue (CBD) Fig. 3A www.theallpapers.com
Question paper, page 7
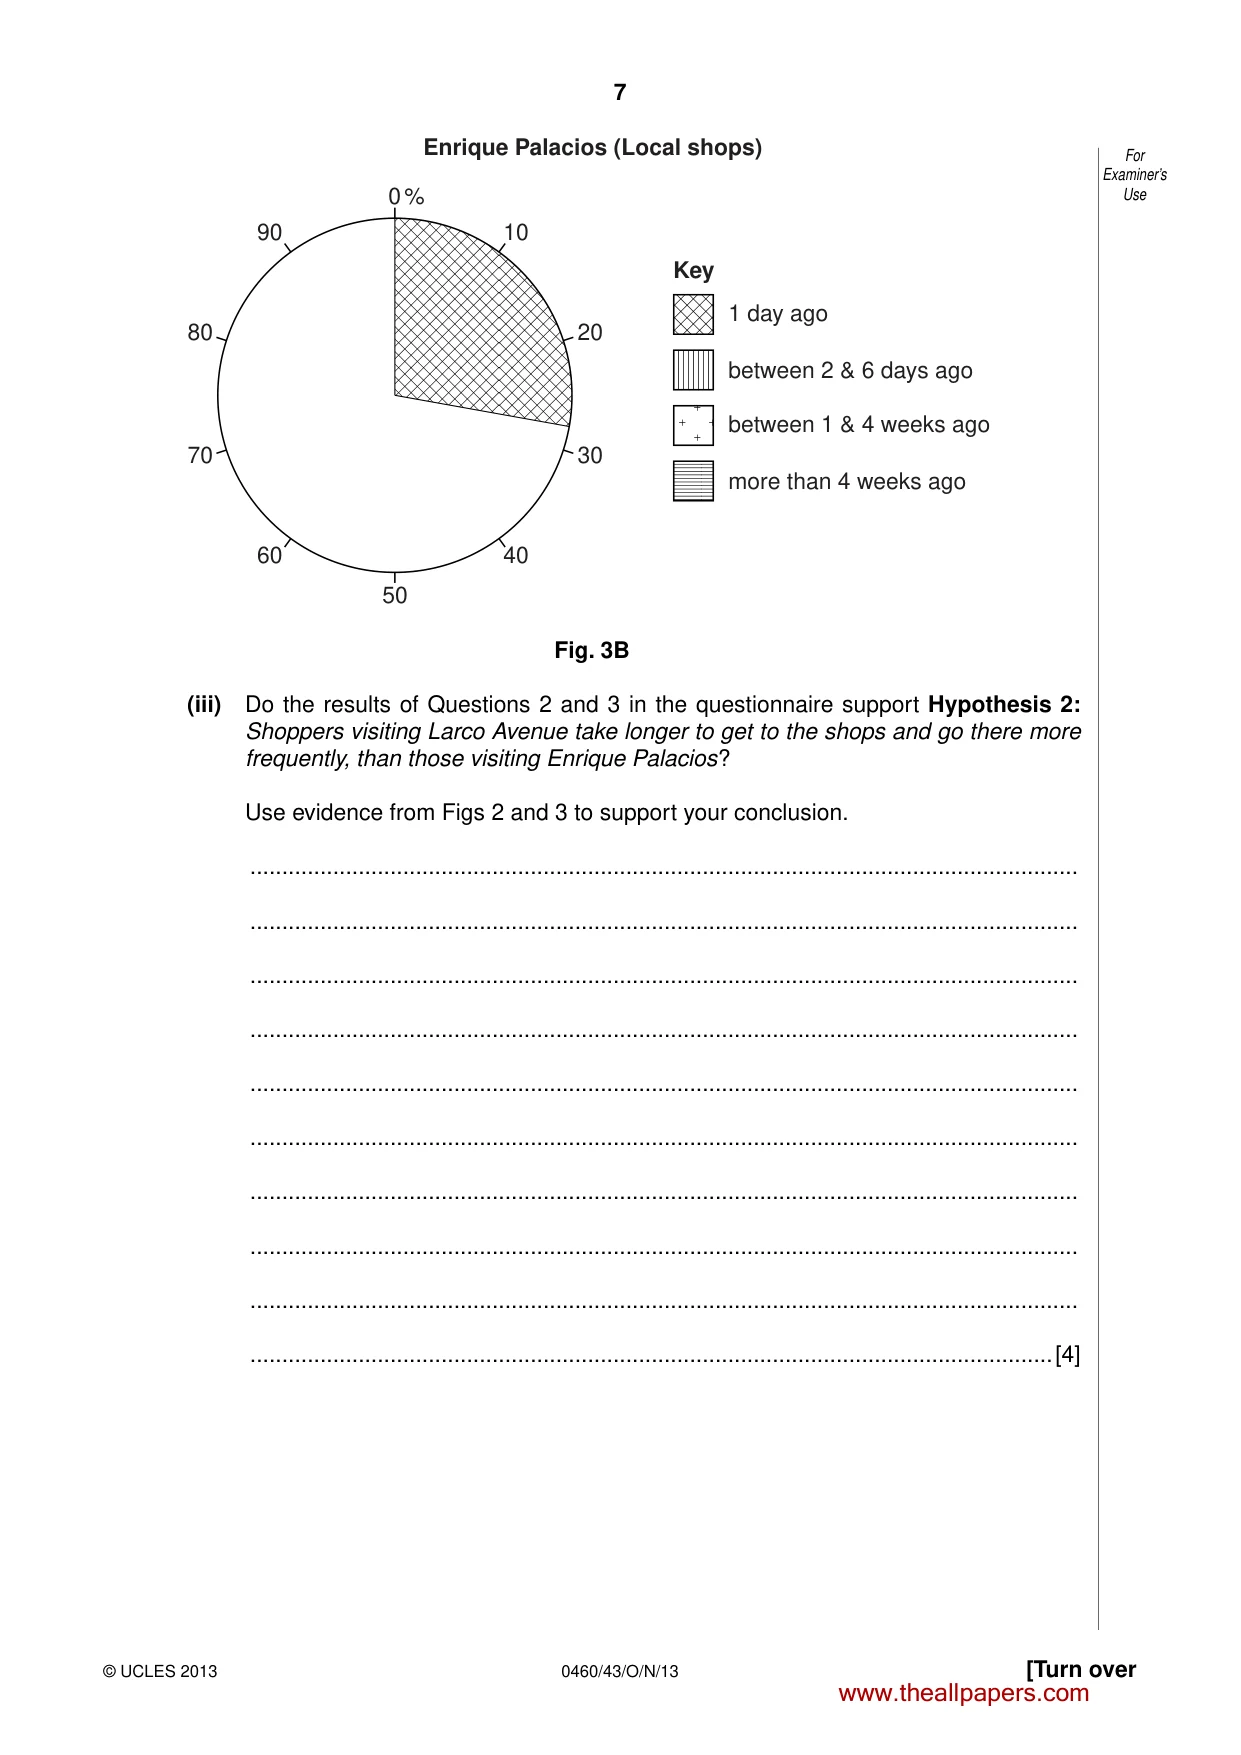
7 0460/43/O/N/13 © UCLES 2013 [Turn over For Examiner’s Use Enrique Palacios (Local shops) 1 day ago between 2 & 6 days ago between 1 & 4 weeks ago more than 4 weeks ago Key 50 0 % 10 40 90 60 20 30 80 70 Fig. 3B (iii) Do the results of Questions 2 and 3 in the questionnaire support Hypothesis 2: Shoppers visiting Larco Avenue take longer to get to the shops and go there more frequently, than those visiting Enrique Palacios? Use evidence from Figs 2 and 3 to support your conclusion. … … … … … … … … … …[4] www.theallpapers.com
Question paper, page 8
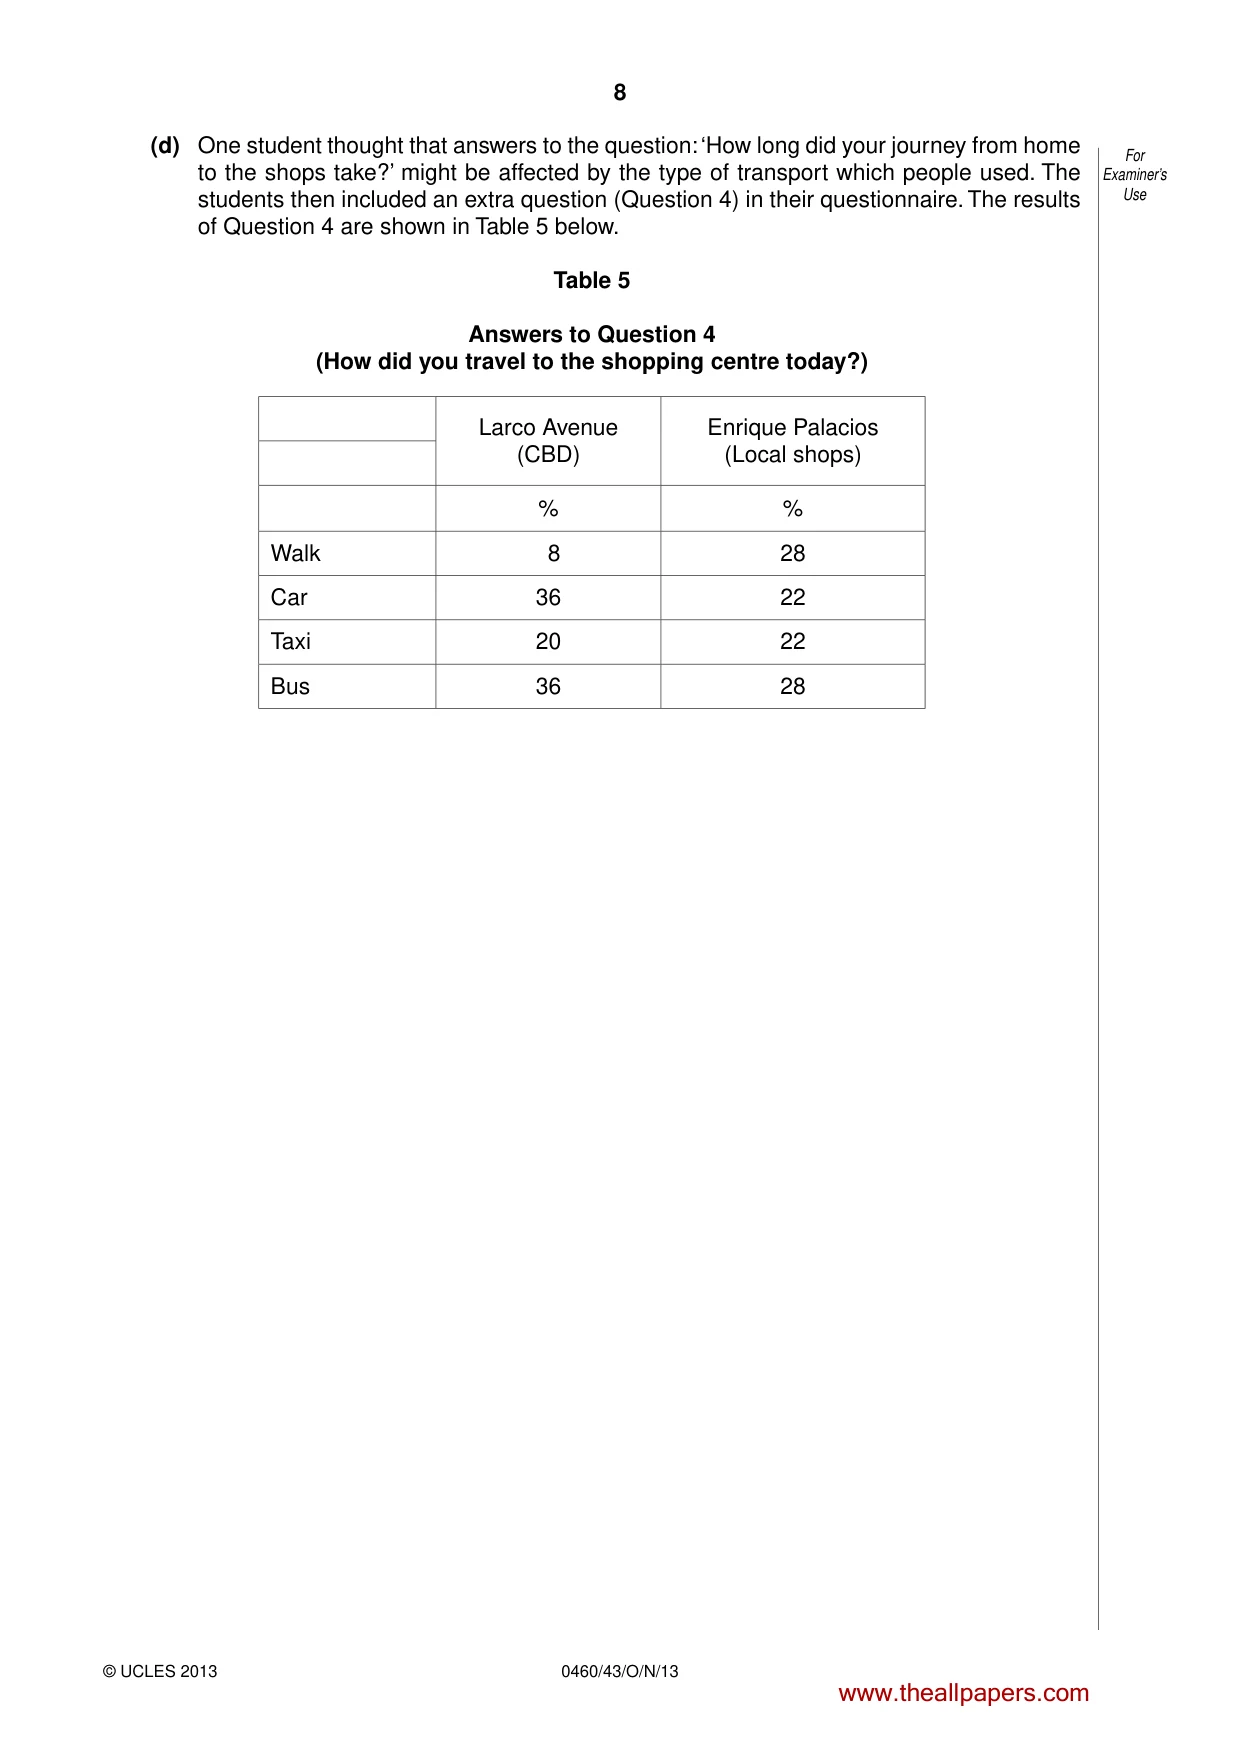
8 0460/43/O/N/13 © UCLES 2013 For Examiner’s Use (d) One student thought that answers to the question: ‘How long did your journey from home to the shops take?’ might be affected by the type of transport which people used. The students then included an extra question (Question 4) in their questionnaire. The results of Question 4 are shown in Table 5 below. Table 5 Answers to Question 4 (How did you travel to the shopping centre today?) Larco Avenue (CBD) Enrique Palacios (Local shops) % % Walk 8 28 Car 36 22 Taxi 20 22 Bus 36 28 www.theallpapers.com
Question paper, page 9
9 0460/43/O/N/13 © UCLES 2013 [Turn over For Examiner’s Use (i) Use the answers to Question 4 to compare the percentage of people who walked and travelled by car to the two shopping centres. … … … …[2] (ii) How might the answers to Question 4 change the students’ conclusion to Hypothesis 2: Shoppers visiting Larco Avenue take longer to get to the shops and go there more frequently, than those visiting Enrique Palacios? … … … …[2] (iii) Suggest three factors which may affect people’s method of travel to shopping centres. 1 … … 2 … … 3 … …[3] www.theallpapers.com
Question paper, page 10
10 0460/43/O/N/13 © UCLES 2013 For Examiner’s Use (e) To extend the investigation one student included the following question in her questionnaire: ‘In which district of the city do you live?’ Suggest a suitable map to show the results of this question and describe how you would draw this map. You may use a diagram in your answer. … … … … … … [3] [Total: 30 marks] www.theallpapers.com
Question paper, page 11
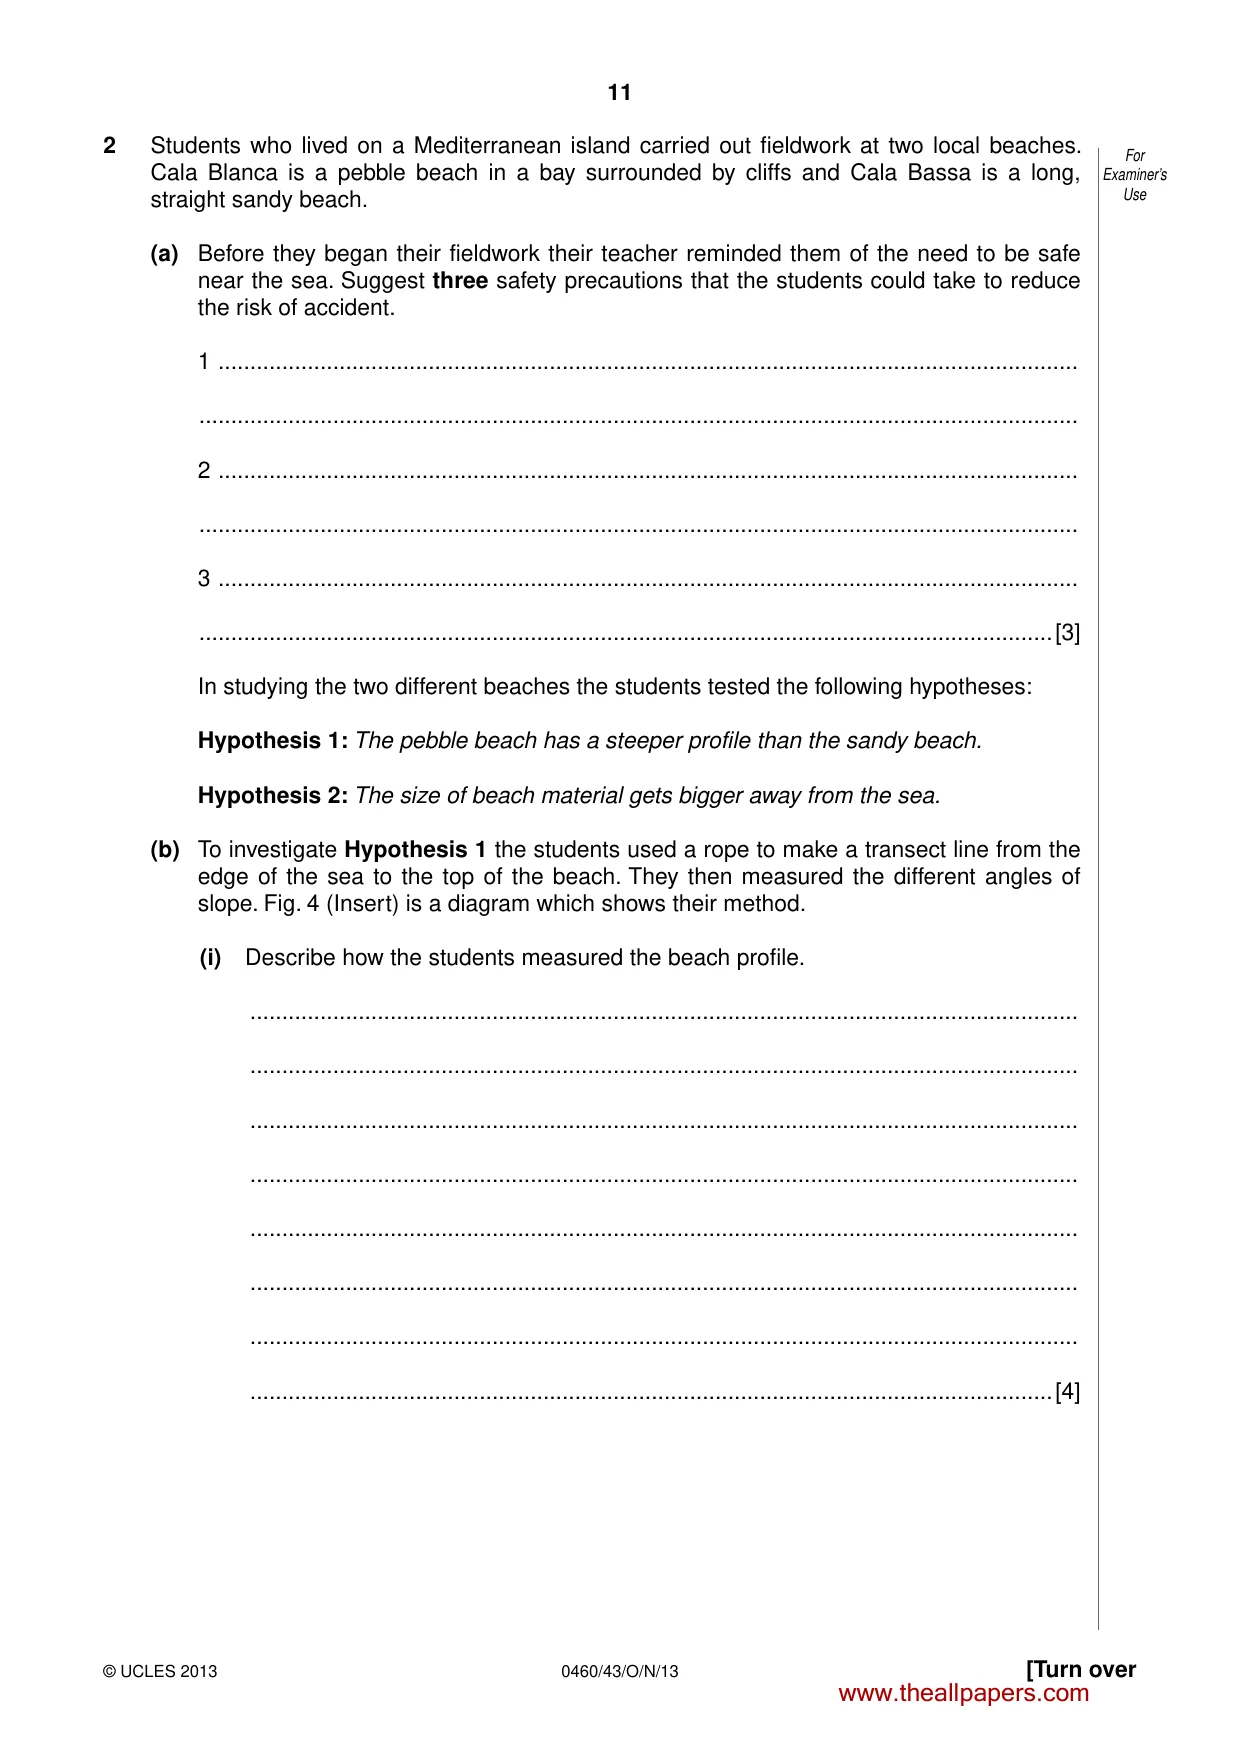
11 0460/43/O/N/13 © UCLES 2013 [Turn over For Examiner’s Use 2 Students who lived on a Mediterranean island carried out fieldwork at two local beaches. Cala Blanca is a pebble beach in a bay surrounded by cliffs and Cala Bassa is a long, straight sandy beach. (a) Before they began their fieldwork their teacher reminded them of the need to be safe near the sea. Suggest three safety precautions that the students could take to reduce the risk of accident. 1 … … 2 … … 3 … …[3] In studying the two different beaches the students tested the following hypotheses: Hypothesis 1: The pebble beach has a steeper profile than the sandy beach. Hypothesis 2: The size of beach material gets bigger away from the sea. (b) To investigate Hypothesis 1 the students used a rope to make a transect line from the edge of the sea to the top of the beach. They then measured the different angles of slope. Fig. 4 (Insert) is a diagram which shows their method. (i) Describe how the students measured the beach profile. … … … … … … … …[4] www.theallpapers.com
Question paper, page 12
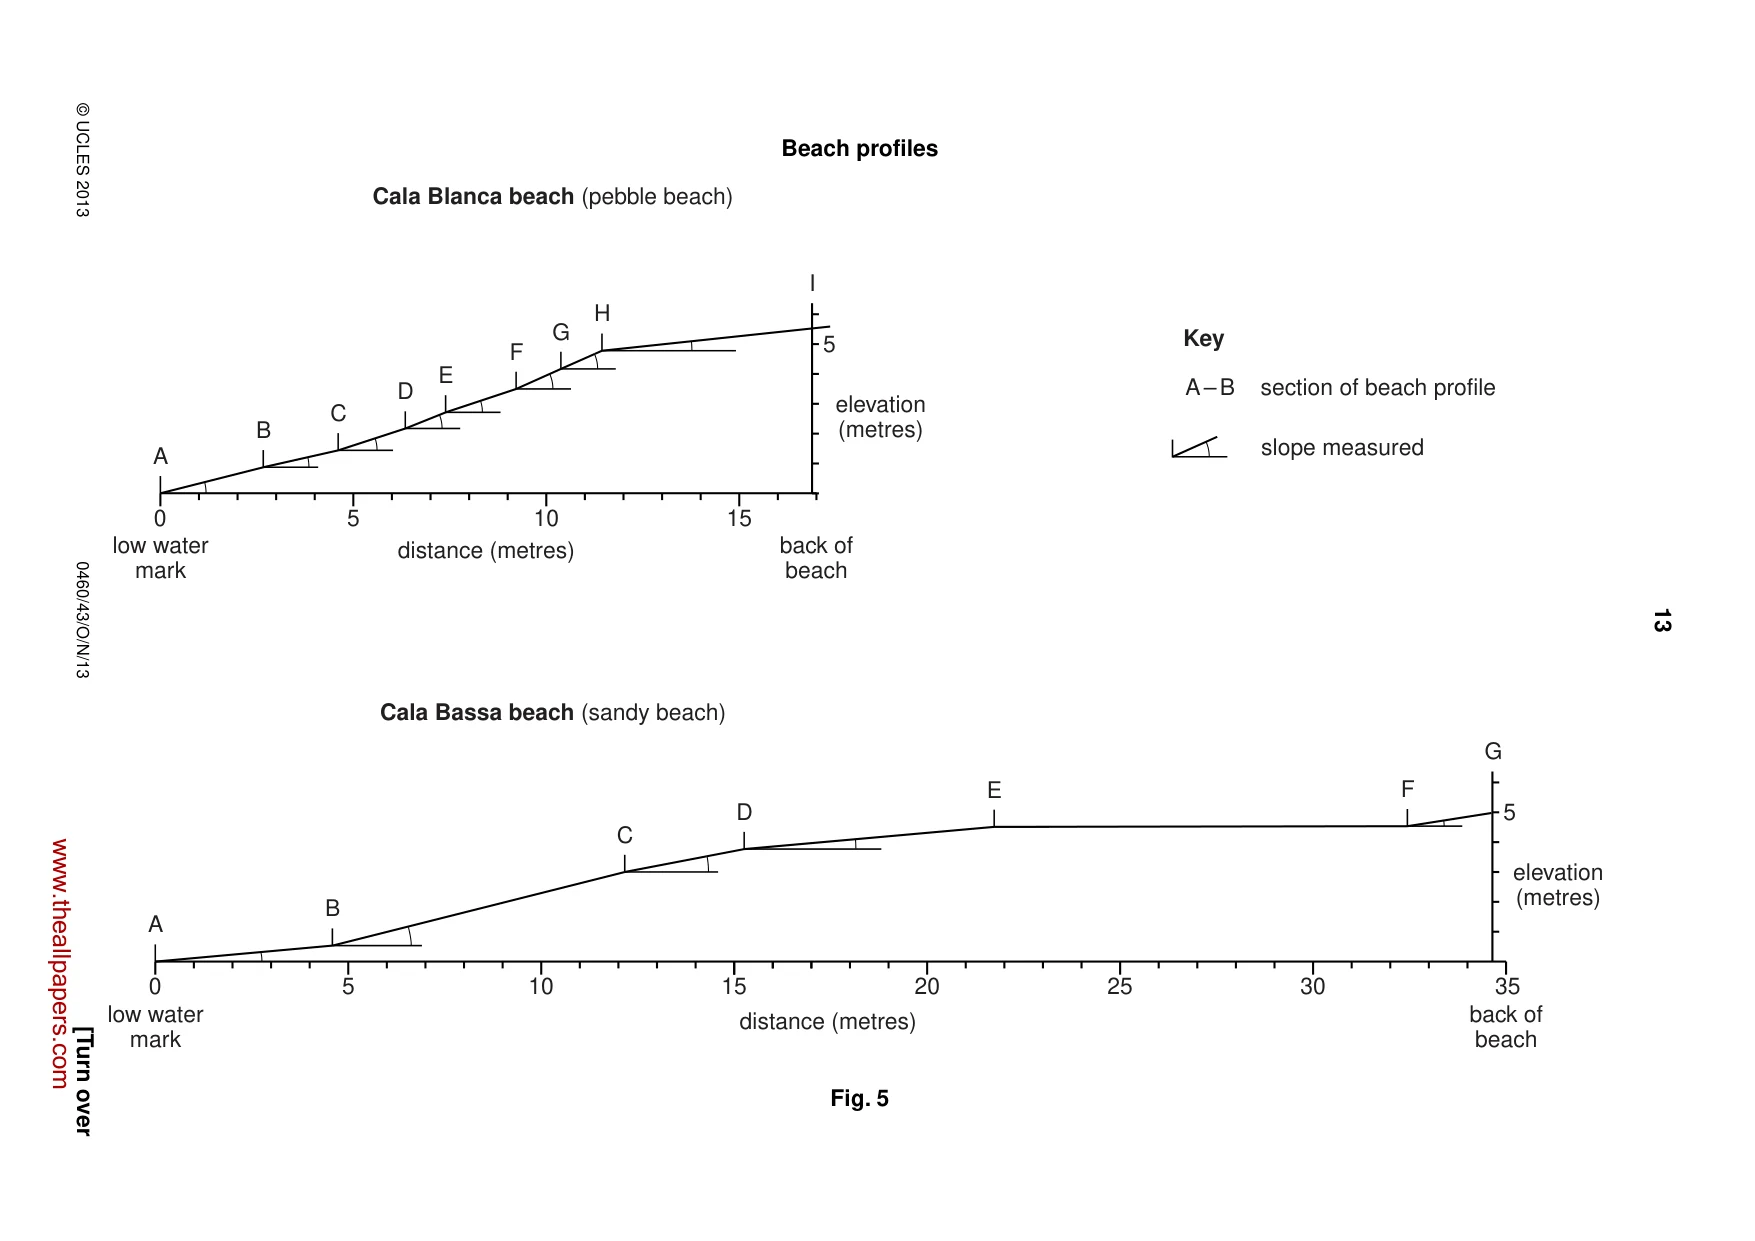
12 0460/43/O/N/13 © UCLES 2013 For Examiner’s Use (ii) The results of the measurements on both beaches are shown in Fig. 5, opposite. Use these results to compare the width of the two beaches. … …[1] (iii) What conclusion could the students reach about Hypothesis 1: The pebble beach has a steeper profile than the sandy beach? Support your answer with evidence from Fig. 5. … … … … … … … …[4] www.theallpapers.com
Question paper, page 13
13 0460/43/O/N/13 © UCLES 2013 [Turn over A A – B section of beach profile A slope measured B 0 5 low water mark back of beach Key distance (metres) elevation (metres) elevation (metres) Cala Blanca beach (pebble beach) Cala Bassa beach (sandy beach) 10 15 5 5 C D E F G H I A B 0 5 low water mark back of beach distance (metres) 10 15 20 25 30 35 C D E F G Beach profiles Fig. 5 www.theallpapers.com
Question paper, page 14
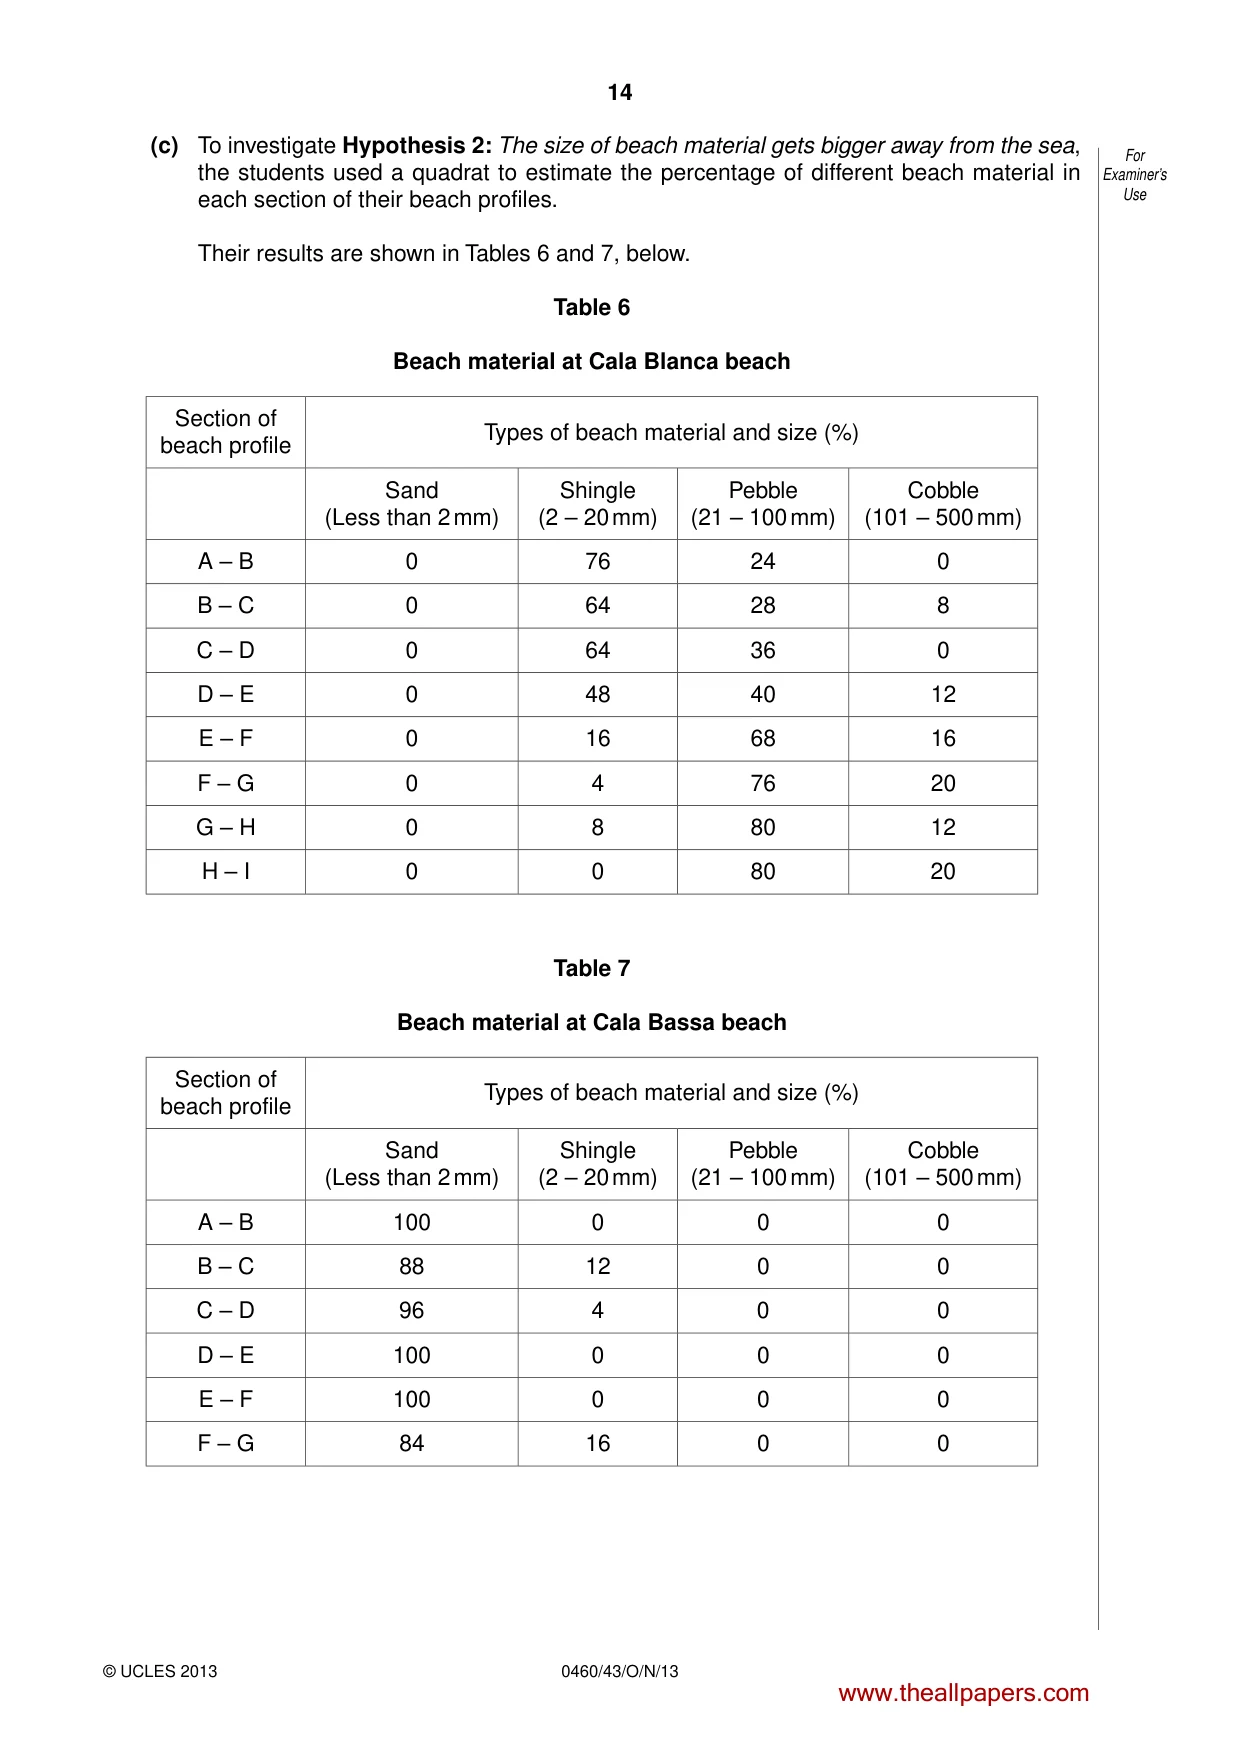
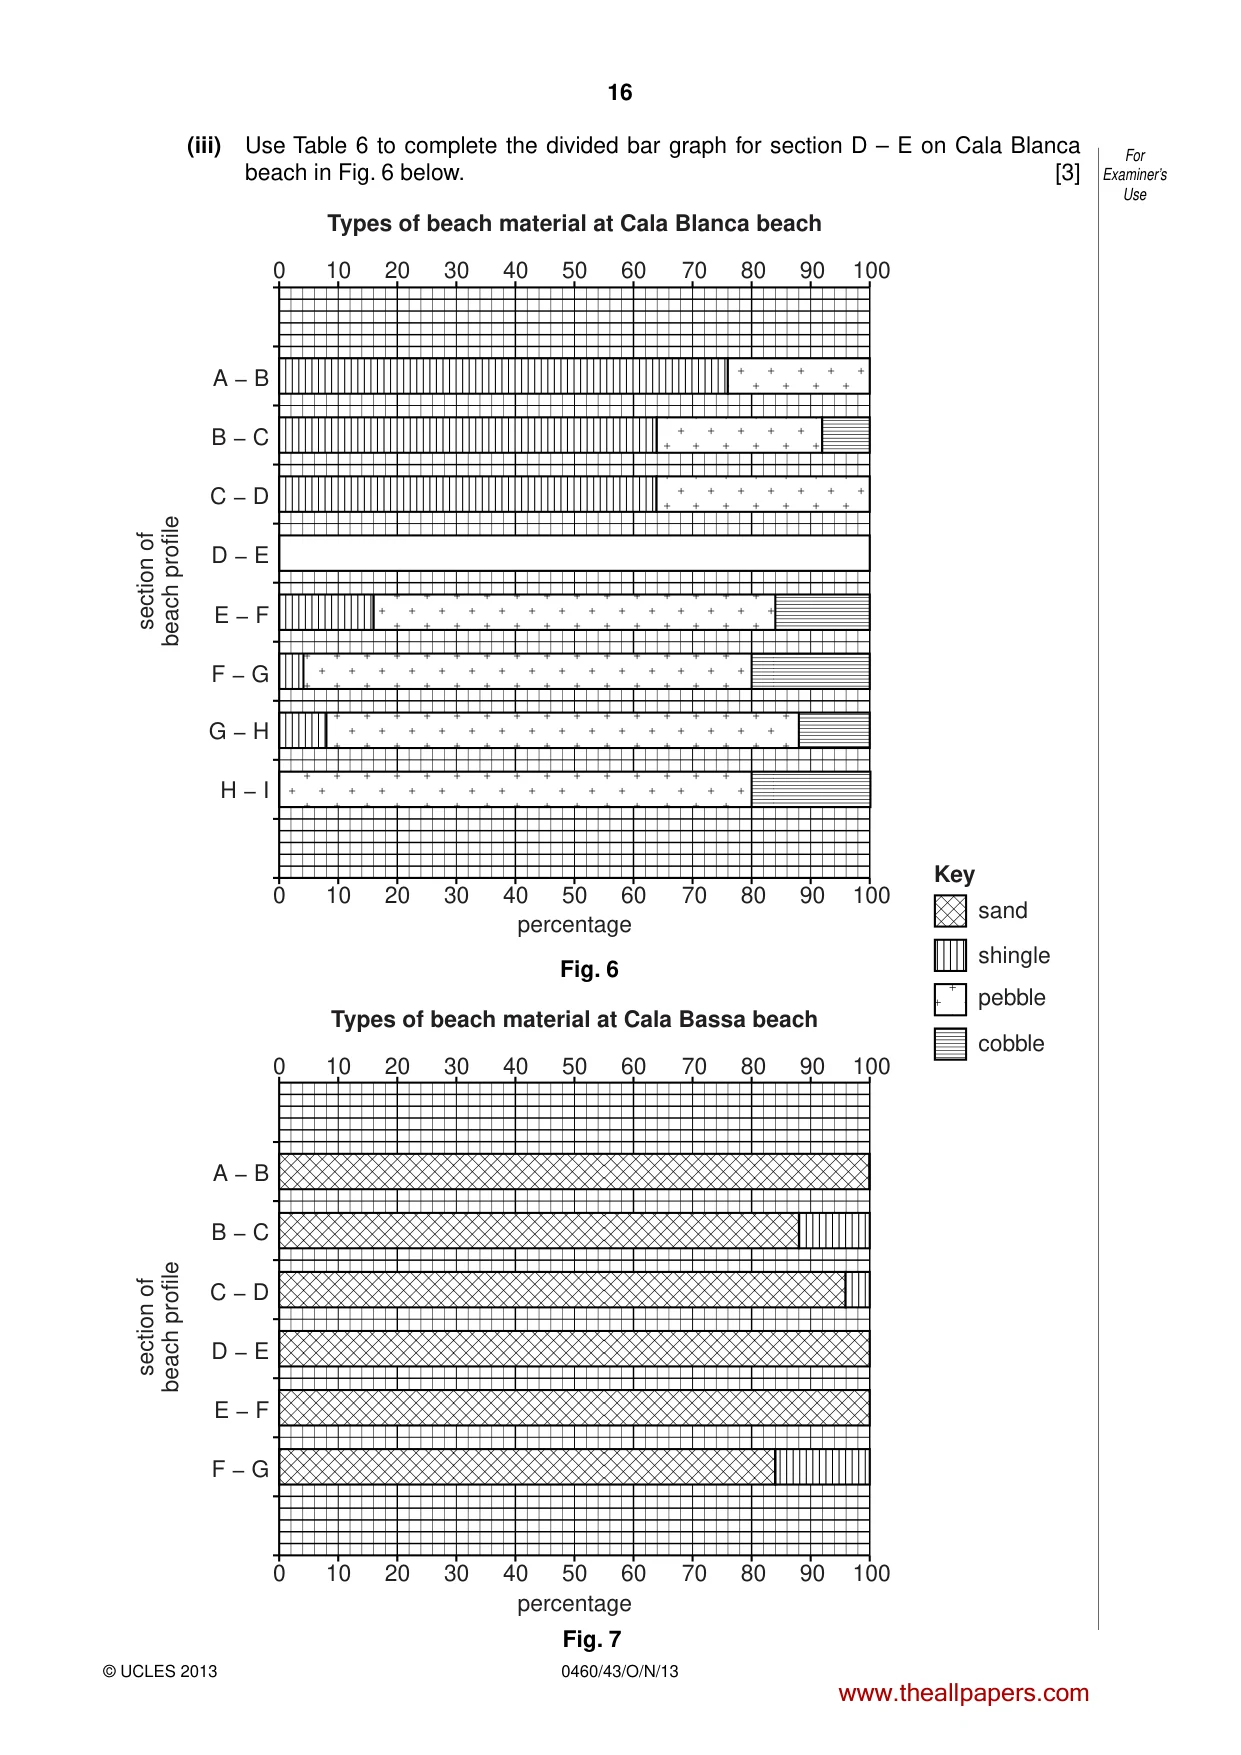
14 0460/43/O/N/13 © UCLES 2013 For Examiner’s Use (c) To investigate Hypothesis 2: The size of beach material gets bigger away from the sea, the students used a quadrat to estimate the percentage of different beach material in each section of their beach profiles. Their results are shown in Tables 6 and 7, below. Table 6 Beach material at Cala Blanca beach Section of beach profile Types of beach material and size (%) Sand (Less than 2 mm) Shingle (2 – 20 mm) Pebble (21 – 100 mm) Cobble (101 – 500 mm) A – B 0 76 24 0 B – C 0 64 28 8 C – D 0 64 36 0 D – E 0 48 40 12 E – F 0 16 68 16 F – G 0 4 76 20 G – H 0 8 80 12 H – I 0 0 80 20 Table 7 Beach material at Cala Bassa beach Section of beach profile Types of beach material and size (%) Sand (Less than 2 mm) Shingle (2 – 20 mm) Pebble (21 – 100 mm) Cobble (101 – 500 mm) A – B 100 0 0 0 B – C 88 12 0 0 C – D 96 4 0 0 D – E 100 0 0 0 E – F 100 0 0 0 F – G 84 16 0 0 www.theallpapers.com
Question paper, page 15
15 0460/43/O/N/13 © UCLES 2013 [Turn over For Examiner’s Use (i) Describe how the students used the quadrat to collect this data. … … … … … …[3] (ii) Suggest one problem of classifying beach material into sand, shingle, pebble or cobble. … …[1] www.theallpapers.com
Question paper, page 16
16 0460/43/O/N/13 © UCLES 2013 For Examiner’s Use (iii) Use Table 6 to complete the divided bar graph for section D – E on Cala Blanca beach in Fig. 6 below. [3] A − B B − C C − D D − E sand Key shingle 0 10 20 30 40 50 percentage section of beach profile section of beach profile percentage 60 70 80 90 100 E − F F − G G − H H − I pebble cobble A − B B − C C − D D − E 0 10 20 30 40 50 Types of beach material at Cala Bassa beach Types of beach material at Cala Blanca beach 60 70 80 90 100 0 10 20 30 40 50 60 70 80 90 100 0 10 20 30 40 50 60 70 80 90 100 E − F F − G Fig. 7 Fig. 6 www.theallpapers.com
Question paper, page 17
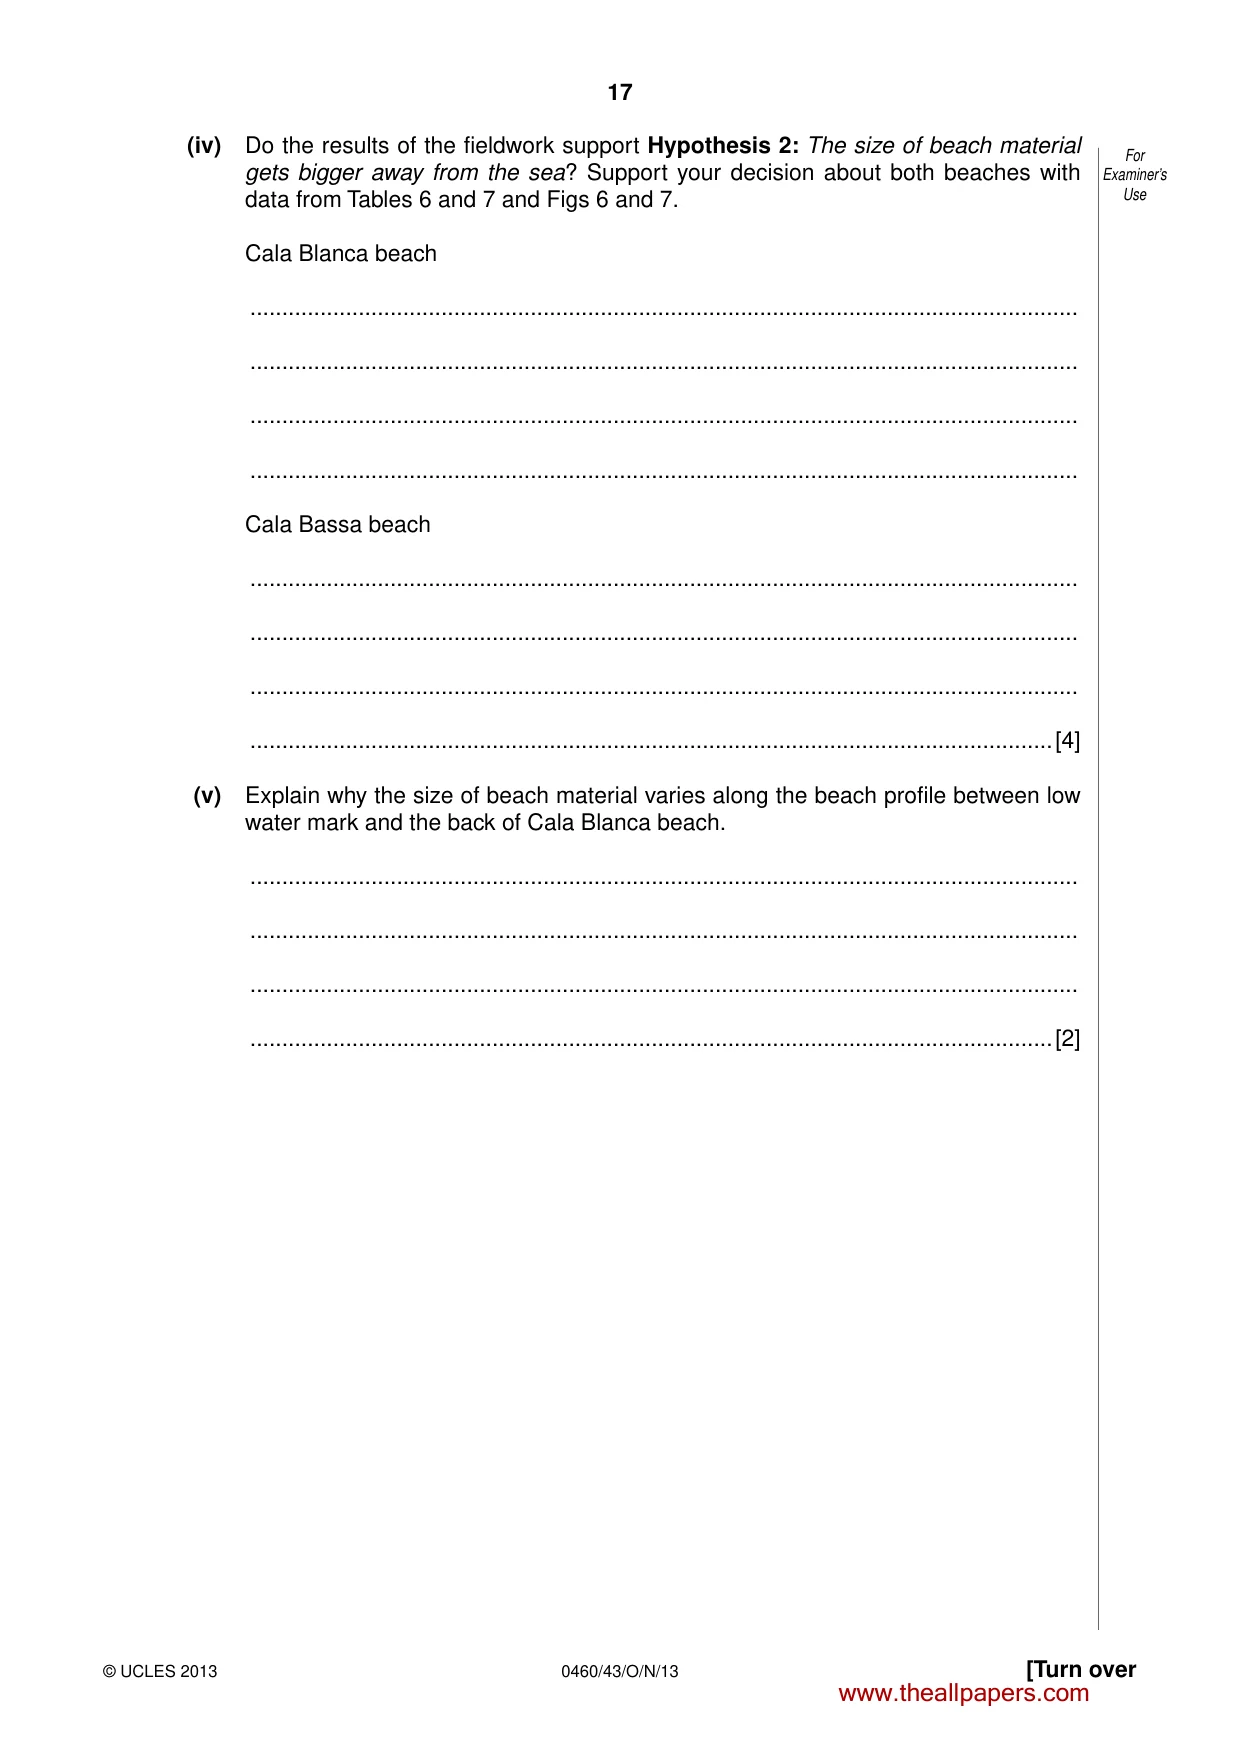
17 0460/43/O/N/13 © UCLES 2013 [Turn over For Examiner’s Use (iv) Do the results of the fieldwork support Hypothesis 2: The size of beach material gets bigger away from the sea? Support your decision about both beaches with data from Tables 6 and 7 and Figs 6 and 7. Cala Blanca beach … … … … Cala Bassa beach … … … …[4] (v) Explain why the size of beach material varies along the beach profile between low water mark and the back of Cala Blanca beach. … … … …[2] www.theallpapers.com
Question paper, page 18
18 0460/43/O/N/13 © UCLES 2013 For Examiner’s Use (d) (i) Suggest a hypothesis to investigate longshore drift. … …[1] (ii) Describe how the students could investigate this hypothesis. … … … … … … … …[4] [Total: 30 marks] www.theallpapers.com
Question paper, page 19
19 0460/43/O/N/13 © UCLES 2013 BLANK PAGE www.theallpapers.com
Question paper, page 20
20 0460/43/O/N/13 © UCLES 2013 BLANK PAGE Permission to reproduce items where third-party owned material protected by copyright is included has been sought and cleared where possible. Every reasonable effort has been made by the publisher (UCLES) to trace copyright holders, but if any items requiring clearance have unwittingly been included, the publisher will be pleased to make amends at the earliest possible opportunity. University of Cambridge International Examinations is part of the Cambridge Assessment Group. Cambridge Assessment is the brand name of University of Cambridge Local Examinations Syndicate (UCLES), which is itself a department of the University of Cambridge. www.theallpapers.com
Mark scheme, page 1
CAMBRIDGE INTERNATIONAL EXAMINATIONS International General Certificate of Secondary Education MARK SCHEME for the October/November 2013 series 0460 GEOGRAPHY 0460/43 Paper 4 (Alternative to Coursework), maximum raw mark 60 This mark scheme is published as an aid to teachers and candidates, to indicate the requirements of the examination. It shows the basis on which Examiners were instructed to award marks. It does not indicate the details of the discussions that took place at an Examiners’ meeting before marking began, which would have considered the acceptability of alternative answers. Mark schemes should be read in conjunction with the question paper and the Principal Examiner Report for Teachers. Cambridge will not enter into discussions about these mark schemes. Cambridge is publishing the mark schemes for the October/November 2013 series for most IGCSE, GCE Advanced Level and Advanced Subsidiary Level components and some Ordinary Level components. . www.theallpapers.com
Mark scheme, page 2
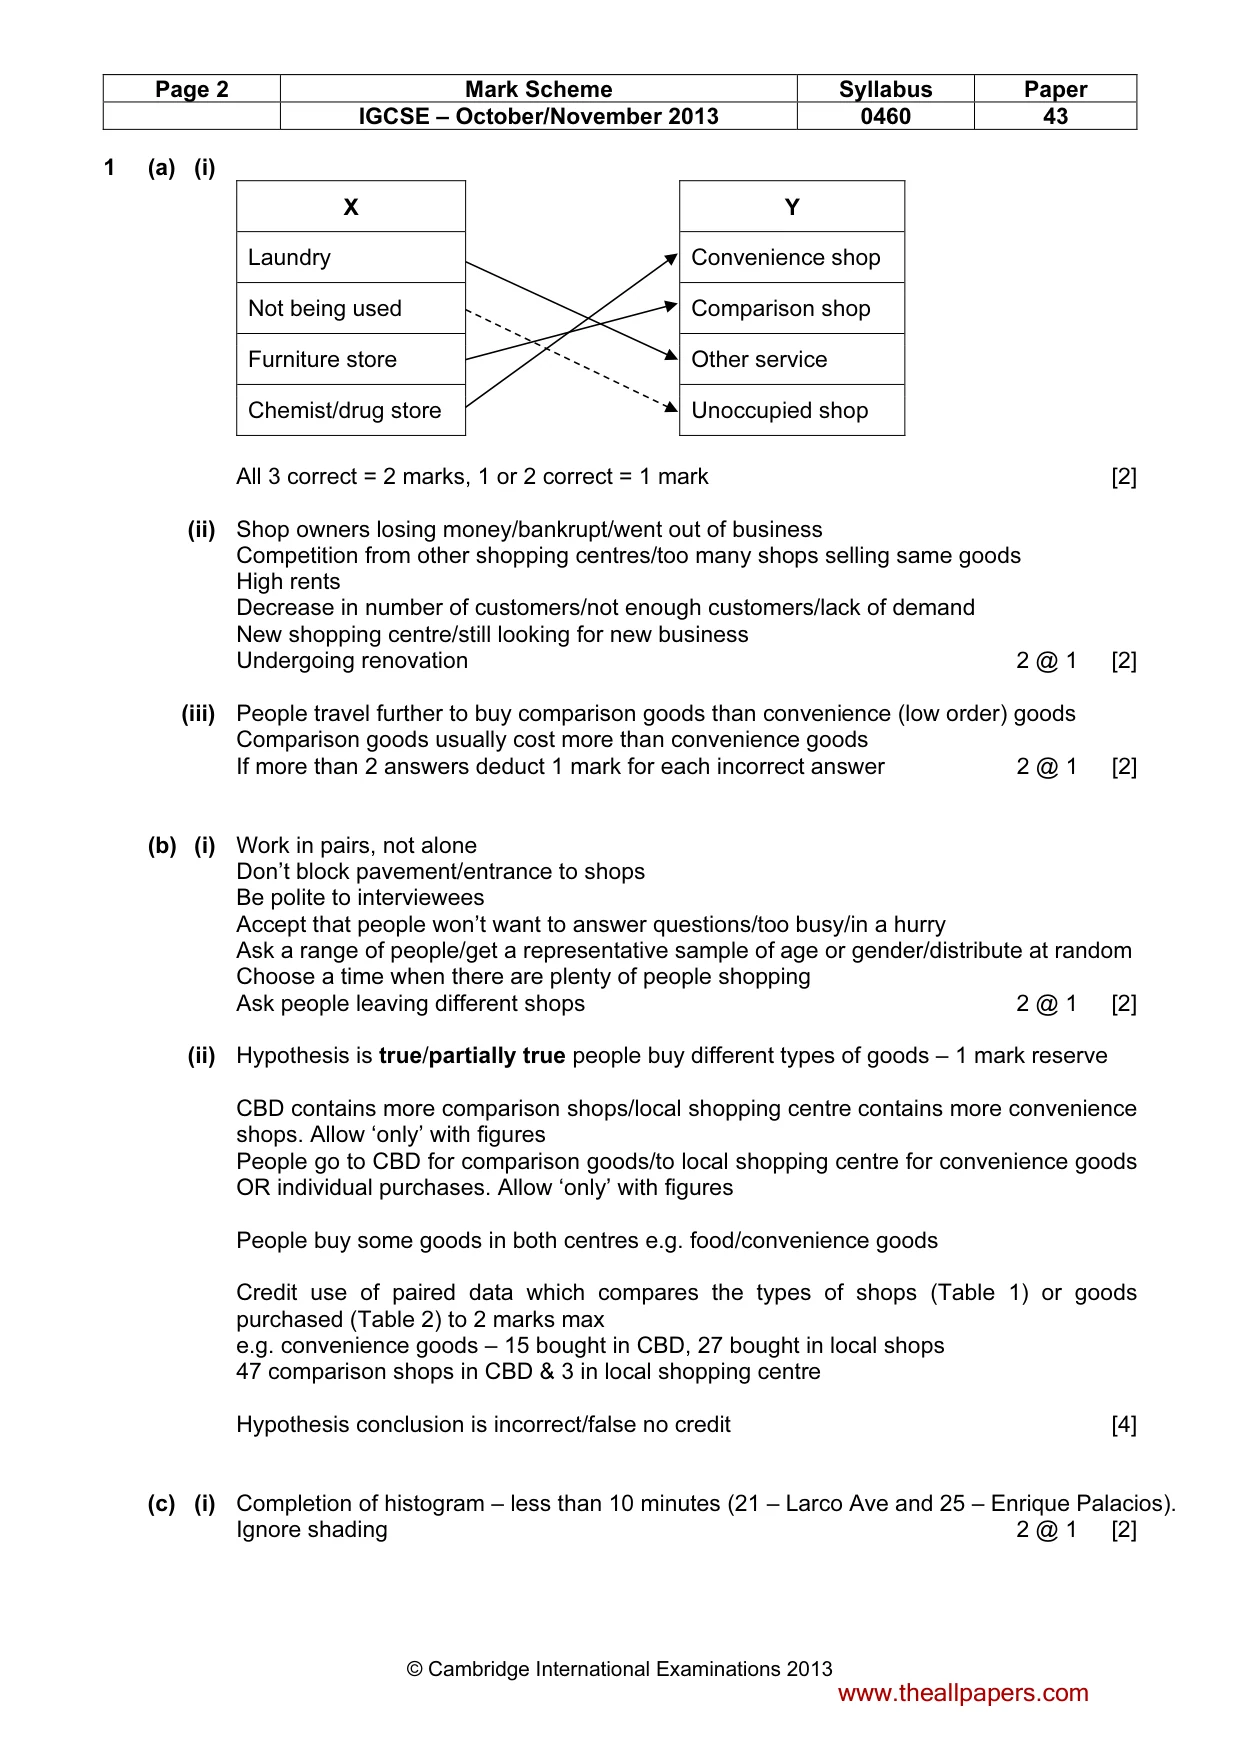
Page 2 Mark Scheme Syllabus Paper IGCSE – October/November 2013 0460 43 © Cambridge International Examinations 2013 1 (a) (i) X Y Laundry Convenience shop Not being used Comparison shop Furniture store Other service Chemist/drug store Unoccupied shop All 3 correct = 2 marks, 1 or 2 correct = 1 mark [2] (ii) Shop owners losing money/bankrupt/went out of business Competition from other shopping centres/too many shops selling same goods High rents Decrease in number of customers/not enough customers/lack of demand New shopping centre/still looking for new business Undergoing renovation 2 @ 1 [2] (iii) People travel further to buy comparison goods than convenience (low order) goods Comparison goods usually cost more than convenience goods If more than 2 answers deduct 1 mark for each incorrect answer 2 @ 1 [2] (b) (i) Work in pairs, not alone Don’t block pavement/entrance to shops Be polite to interviewees Accept that people won’t want to answer questions/too busy/in a hurry Ask a range of people/get a representative sample of age or gender/distribute at random Choose a time when there are plenty of people shopping Ask people leaving different shops 2 @ 1 [2] (ii) Hypothesis is true/partially true people buy different types of goods – 1 mark reserve CBD contains more comparison shops/local shopping centre contains more convenience shops. Allow ‘only’ with figures People go to CBD for comparison goods/to local shopping centre for convenience goods OR individual purchases. Allow ‘only’ with figures People buy some goods in both centres e.g. food/convenience goods Credit use of paired data which compares the types of shops (Table 1) or goods purchased (Table 2) to 2 marks max e.g. convenience goods – 15 bought in CBD, 27 bought in local shops 47 comparison shops in CBD & 3 in local shopping centre Hypothesis conclusion is incorrect/false no credit [4] (c) (i) Completion of histogram – less than 10 minutes (21 – Larco Ave and 25 – Enrique Palacios). Ignore shading 2 @ 1 [2] www.theallpapers.com
Mark scheme, page 3
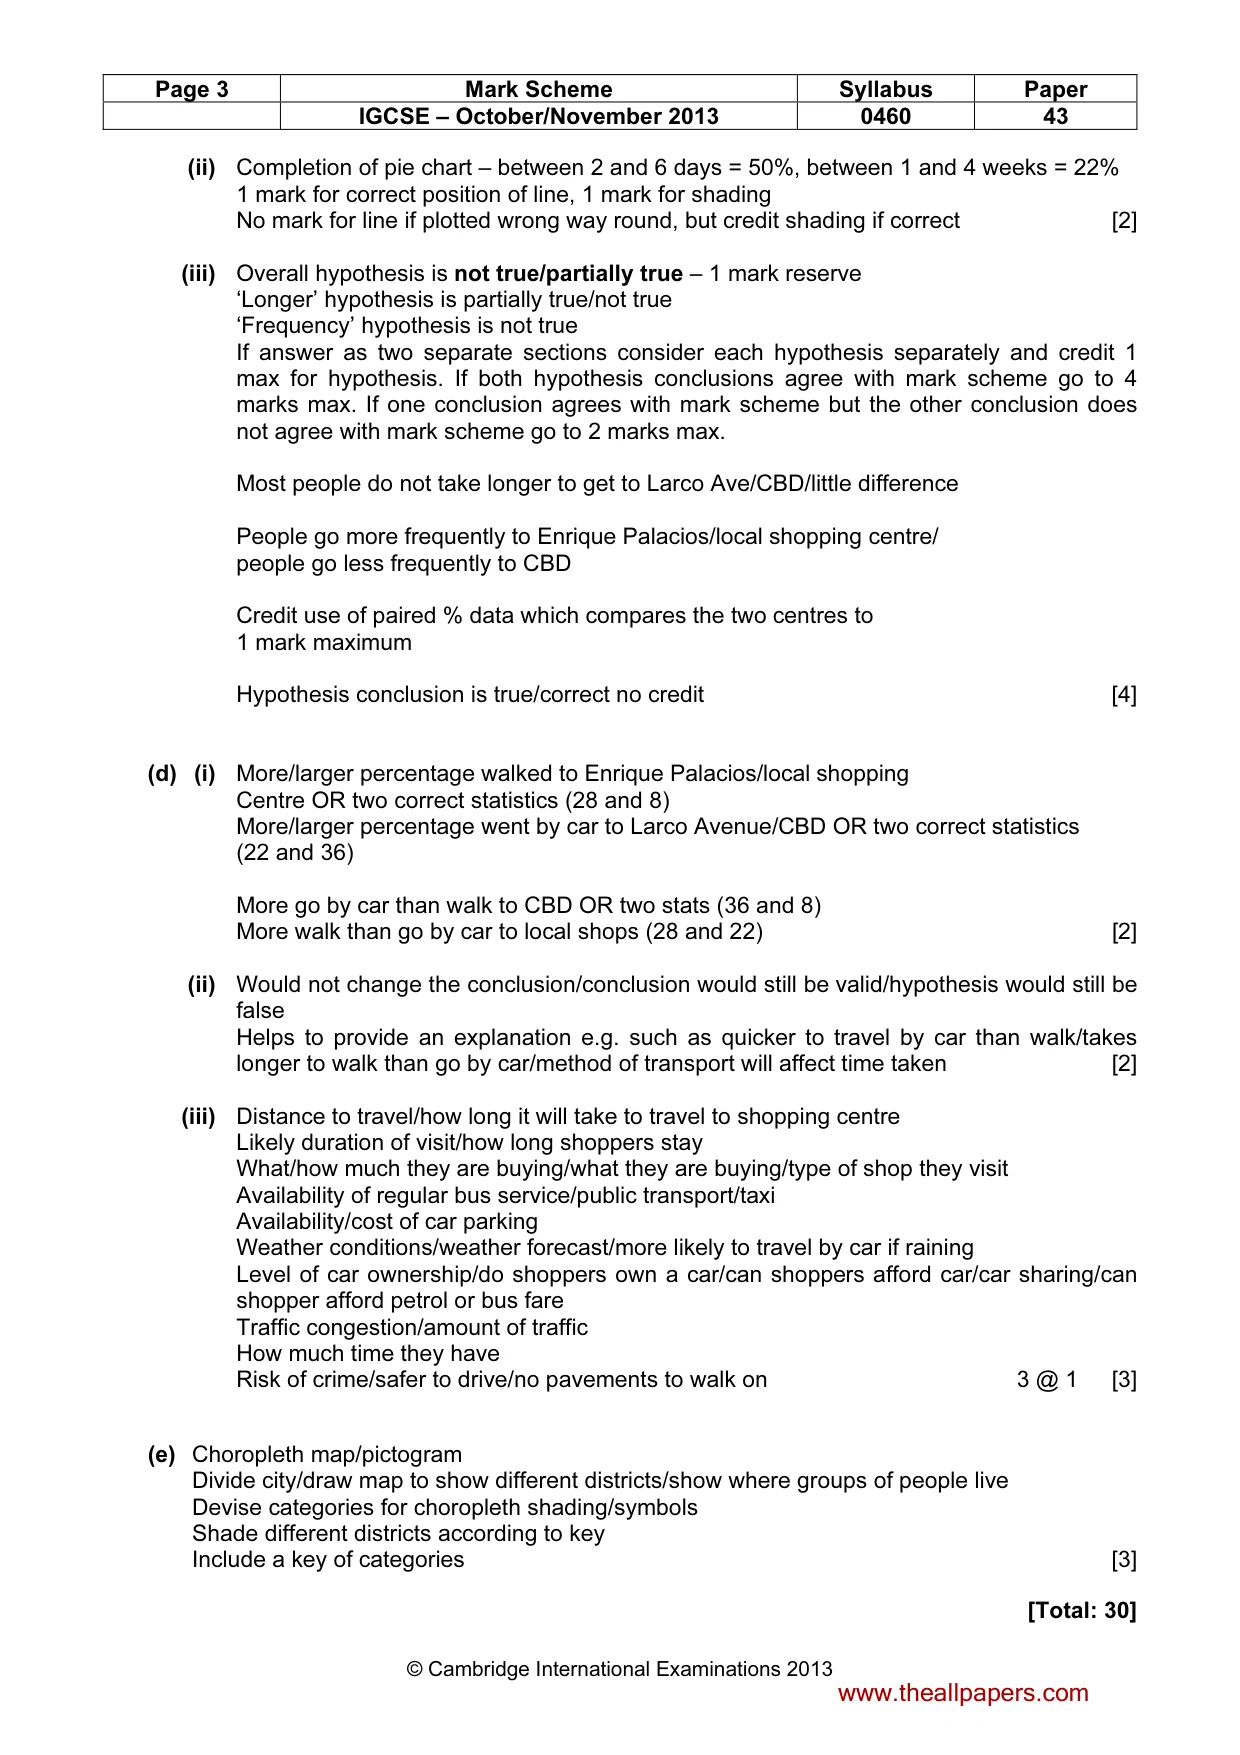
Page 3 Mark Scheme Syllabus Paper IGCSE – October/November 2013 0460 43 © Cambridge International Examinations 2013 (ii) Completion of pie chart – between 2 and 6 days = 50%, between 1 and 4 weeks = 22% 1 mark for correct position of line, 1 mark for shading No mark for line if plotted wrong way round, but credit shading if correct [2] (iii) Overall hypothesis is not true/partially true – 1 mark reserve ‘Longer’ hypothesis is partially true/not true ‘Frequency’ hypothesis is not true If answer as two separate sections consider each hypothesis separately and credit 1 max for hypothesis. If both hypothesis conclusions agree with mark scheme go to 4 marks max. If one conclusion agrees with mark scheme but the other conclusion does not agree with mark scheme go to 2 marks max. Most people do not take longer to get to Larco Ave/CBD/little difference People go more frequently to Enrique Palacios/local shopping centre/ people go less frequently to CBD Credit use of paired % data which compares the two centres to 1 mark maximum Hypothesis conclusion is true/correct no credit [4] (d) (i) More/larger percentage walked to Enrique Palacios/local shopping Centre OR two correct statistics (28 and 8) More/larger percentage went by car to Larco Avenue/CBD OR two correct statistics (22 and 36) More go by car than walk to CBD OR two stats (36 and 8) More walk than go by car to local shops (28 and 22) [2] (ii) Would not change the conclusion/conclusion would still be valid/hypothesis would still be false Helps to provide an explanation e.g. such as quicker to travel by car than walk/takes longer to walk than go by car/method of transport will affect time taken [2] (iii) Distance to travel/how long it will take to travel to shopping centre Likely duration of visit/how long shoppers stay What/how much they are buying/what they are buying/type of shop they visit Availability of regular bus service/public transport/taxi Availability/cost of car parking Weather conditions/weather forecast/more likely to travel by car if raining Level of car ownership/do shoppers own a car/can shoppers afford car/car sharing/can shopper afford petrol or bus fare Traffic congestion/amount of traffic How much time they have Risk of crime/safer to drive/no pavements to walk on 3 @ 1 [3] (e) Choropleth map/pictogram Divide city/draw map to show different districts/show where groups of people live Devise categories for choropleth shading/symbols Shade different districts according to key Include a key of categories [3] [Total: 30] www.theallpapers.com
Mark scheme, page 4
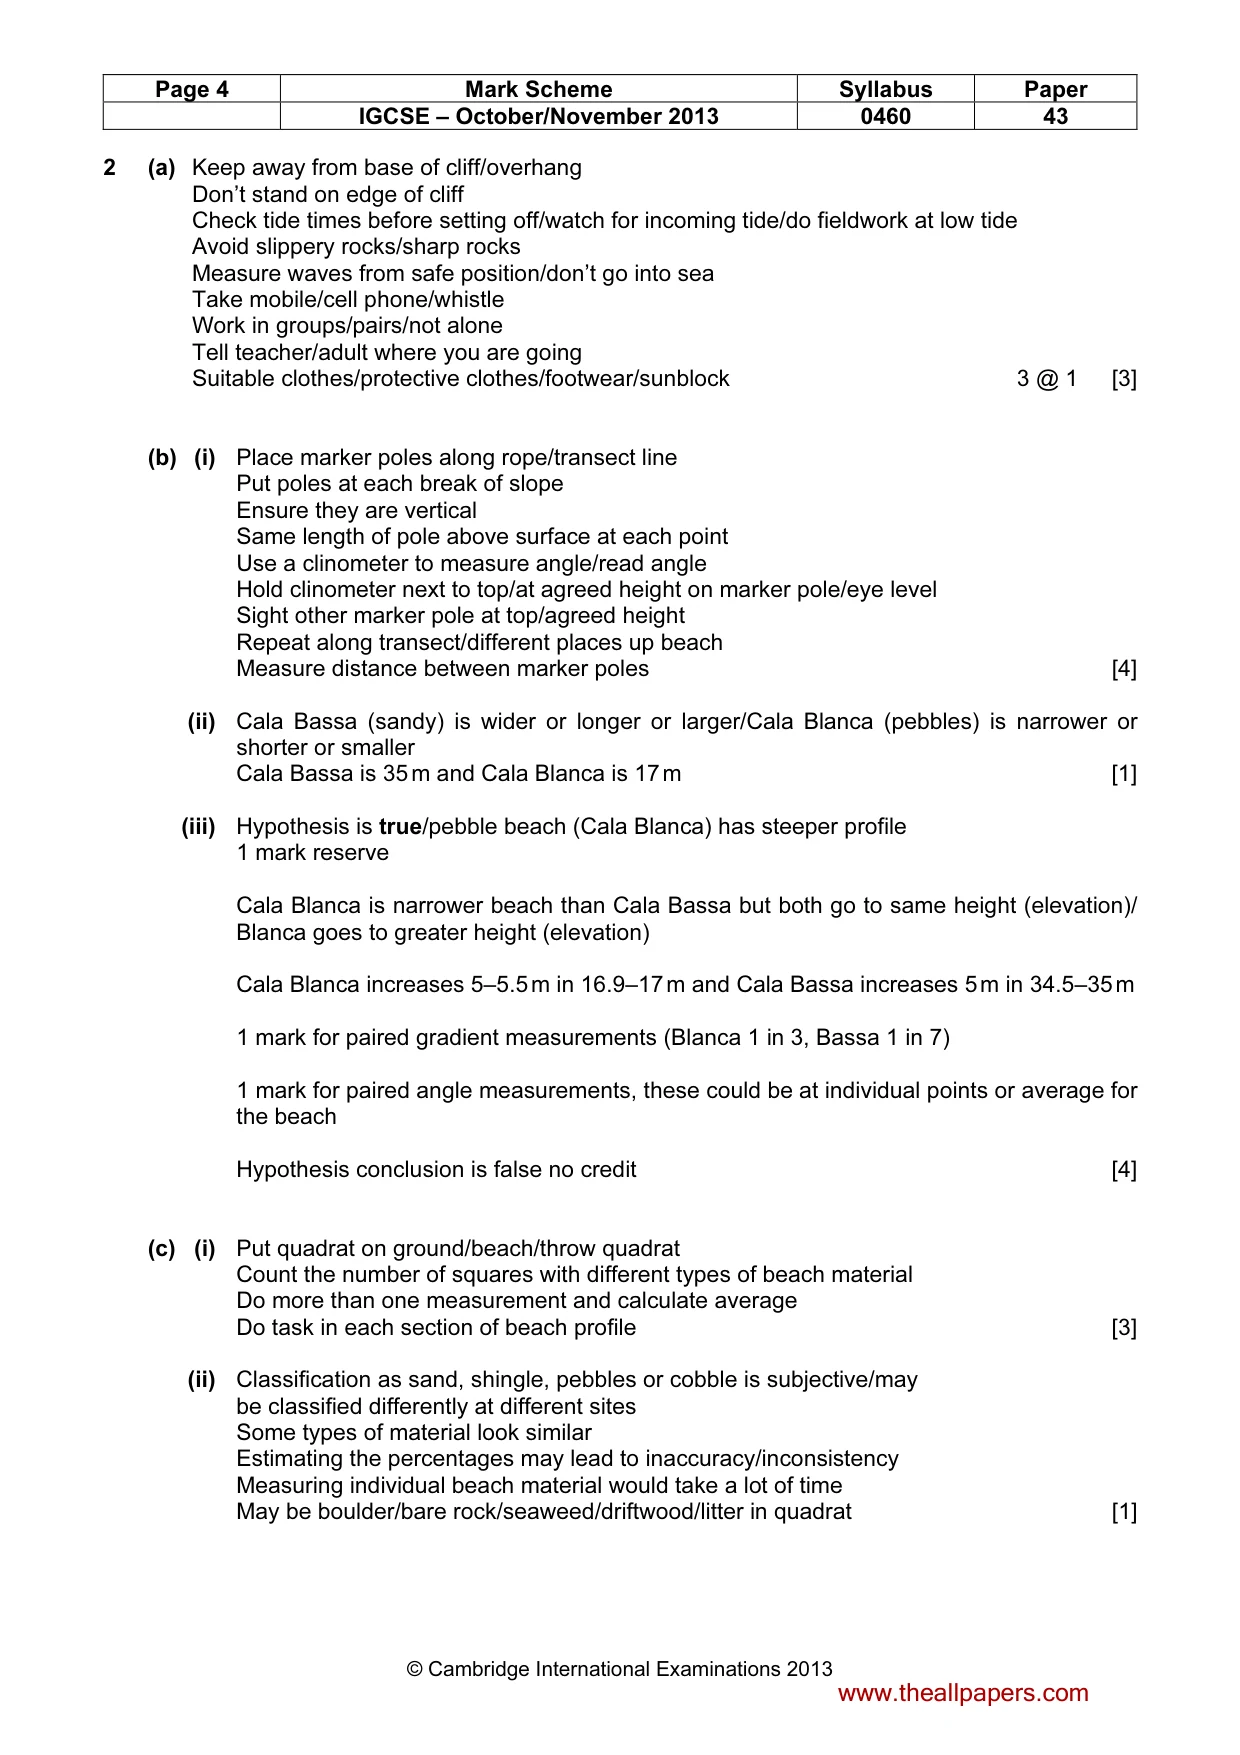
Page 4 Mark Scheme Syllabus Paper IGCSE – October/November 2013 0460 43 © Cambridge International Examinations 2013 2 (a) Keep away from base of cliff/overhang Don’t stand on edge of cliff Check tide times before setting off/watch for incoming tide/do fieldwork at low tide Avoid slippery rocks/sharp rocks Measure waves from safe position/don’t go into sea Take mobile/cell phone/whistle Work in groups/pairs/not alone Tell teacher/adult where you are going Suitable clothes/protective clothes/footwear/sunblock 3 @ 1 [3] (b) (i) Place marker poles along rope/transect line Put poles at each break of slope Ensure they are vertical Same length of pole above surface at each point Use a clinometer to measure angle/read angle Hold clinometer next to top/at agreed height on marker pole/eye level Sight other marker pole at top/agreed height Repeat along transect/different places up beach Measure distance between marker poles [4] (ii) Cala Bassa (sandy) is wider or longer or larger/Cala Blanca (pebbles) is narrower or shorter or smaller Cala Bassa is 35 m and Cala Blanca is 17 m [1] (iii) Hypothesis is true/pebble beach (Cala Blanca) has steeper profile 1 mark reserve Cala Blanca is narrower beach than Cala Bassa but both go to same height (elevation)/ Blanca goes to greater height (elevation) Cala Blanca increases 5–5.5 m in 16.9–17 m and Cala Bassa increases 5 m in 34.5–35 m 1 mark for paired gradient measurements (Blanca 1 in 3, Bassa 1 in 7) 1 mark for paired angle measurements, these could be at individual points or average for the beach Hypothesis conclusion is false no credit [4] (c) (i) Put quadrat on ground/beach/throw quadrat Count the number of squares with different types of beach material Do more than one measurement and calculate average Do task in each section of beach profile [3] (ii) Classification as sand, shingle, pebbles or cobble is subjective/may be classified differently at different sites Some types of material look similar Estimating the percentages may lead to inaccuracy/inconsistency Measuring individual beach material would take a lot of time May be boulder/bare rock/seaweed/driftwood/litter in quadrat [1] www.theallpapers.com
Mark scheme, page 5
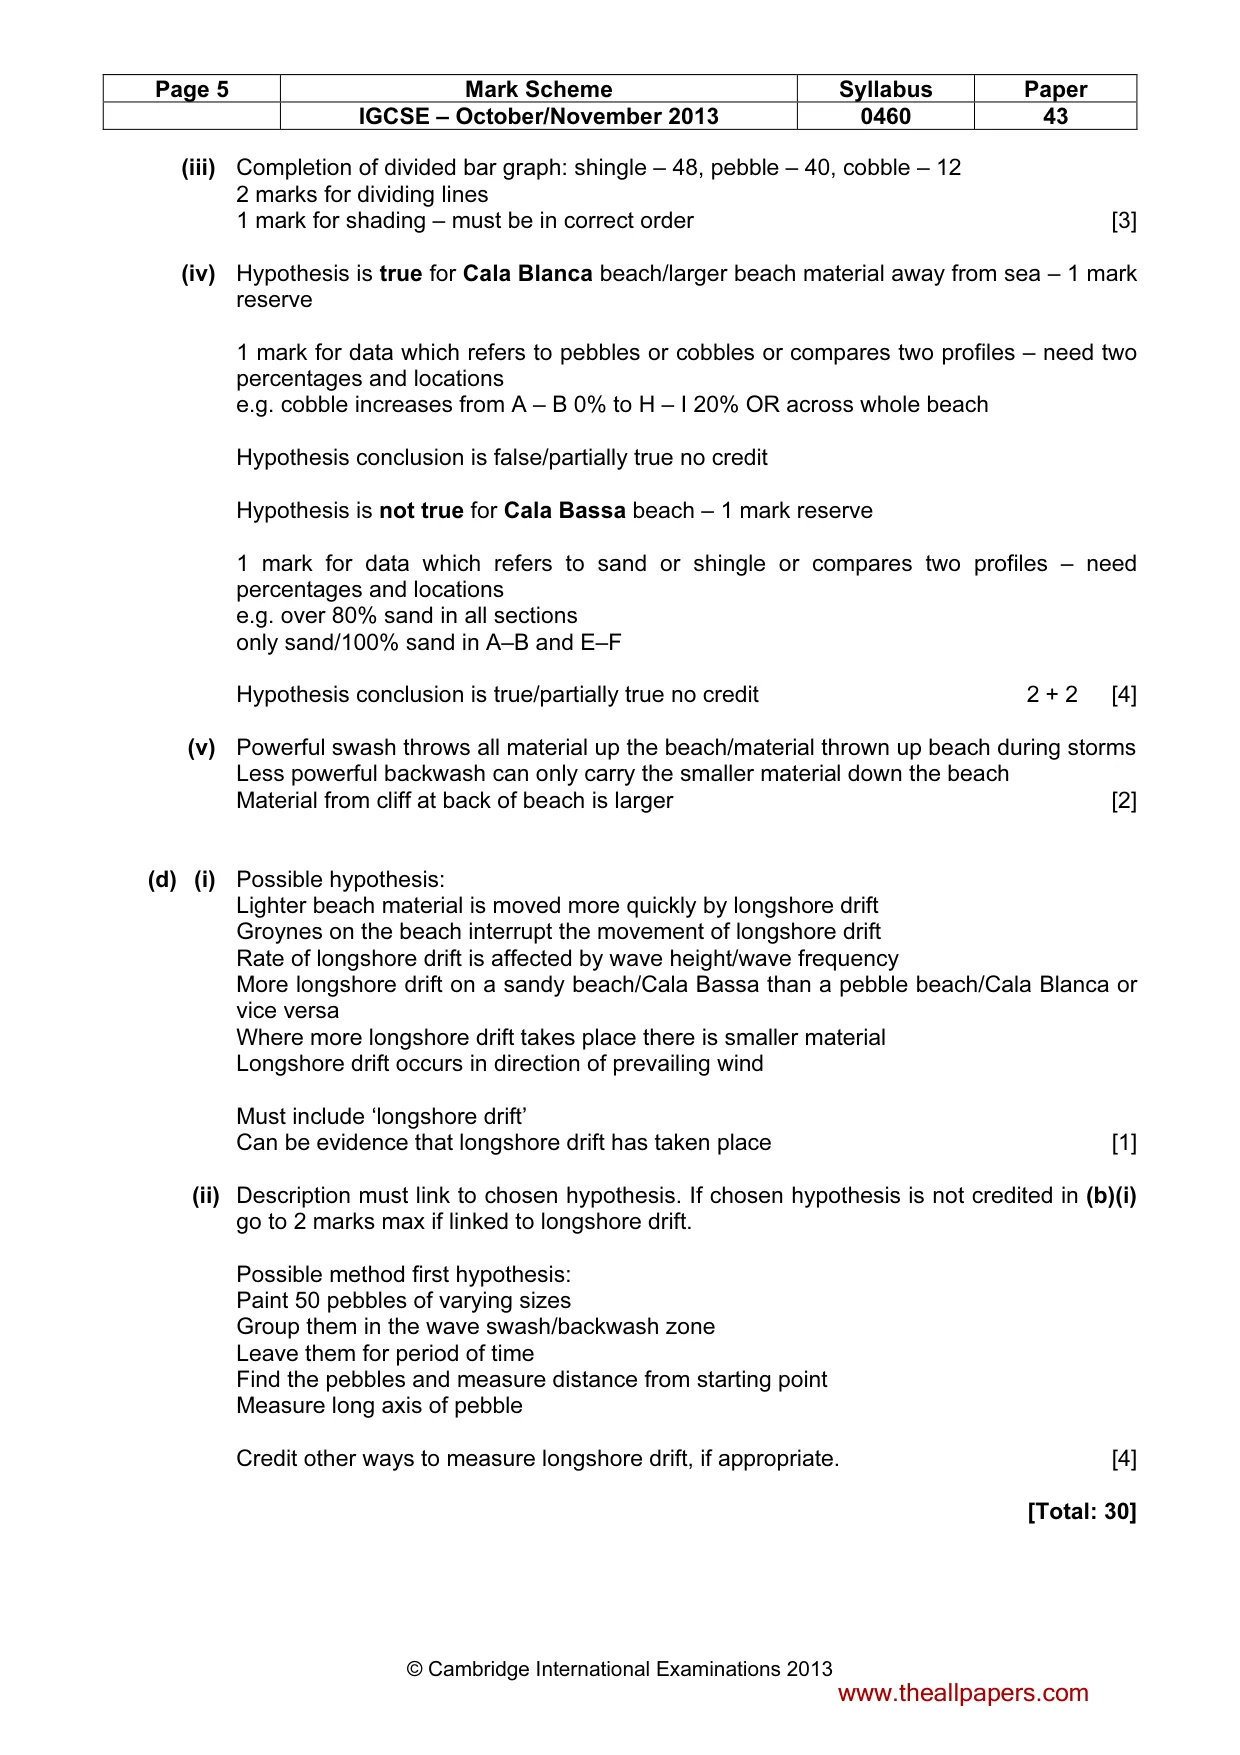
Page 5 Mark Scheme Syllabus Paper IGCSE – October/November 2013 0460 43 © Cambridge International Examinations 2013 (iii) Completion of divided bar graph: shingle – 48, pebble – 40, cobble – 12 2 marks for dividing lines 1 mark for shading – must be in correct order [3] (iv) Hypothesis is true for Cala Blanca beach/larger beach material away from sea – 1 mark reserve 1 mark for data which refers to pebbles or cobbles or compares two profiles – need two percentages and locations e.g. cobble increases from A – B 0% to H – I 20% OR across whole beach Hypothesis conclusion is false/partially true no credit Hypothesis is not true for Cala Bassa beach – 1 mark reserve 1 mark for data which refers to sand or shingle or compares two profiles – need percentages and locations e.g. over 80% sand in all sections only sand/100% sand in A–B and E–F Hypothesis conclusion is true/partially true no credit 2 + 2 [4] (v) Powerful swash throws all material up the beach/material thrown up beach during storms Less powerful backwash can only carry the smaller material down the beach Material from cliff at back of beach is larger [2] (d) (i) Possible hypothesis: Lighter beach material is moved more quickly by longshore drift Groynes on the beach interrupt the movement of longshore drift Rate of longshore drift is affected by wave height/wave frequency More longshore drift on a sandy beach/Cala Bassa than a pebble beach/Cala Blanca or vice versa Where more longshore drift takes place there is smaller material Longshore drift occurs in direction of prevailing wind Must include ‘longshore drift’ Can be evidence that longshore drift has taken place [1] (ii) Description must link to chosen hypothesis. If chosen hypothesis is not credited in (b)(i) go to 2 marks max if linked to longshore drift. Possible method first hypothesis: Paint 50 pebbles of varying sizes Group them in the wave swash/backwash zone Leave them for period of time Find the pebbles and measure distance from starting point Measure long axis of pebble Credit other ways to measure longshore drift, if appropriate. [4] [Total: 30] www.theallpapers.com
What you needed in this session
Cambridge’s own grade thresholds for 2013 Oct/Nov, Paper 4 · Variant 3. A higher threshold means an easier paper — the bar moves with how the cohort did.