Cambridge IGCSE Geography 0460 — 2013 Oct/Nov Paper 4 · Variant 1
0460/41/O/N/13 · 60 marks · ≈68 min
The question paper and its mark scheme, free to read here and free to download. This is Cambridge’s own paper, exactly as it was sat.
Question paper16 pages



Mark scheme6 pages
Answers below. Sit the paper first if you are practising.
Paper as text
Question paper, page 1
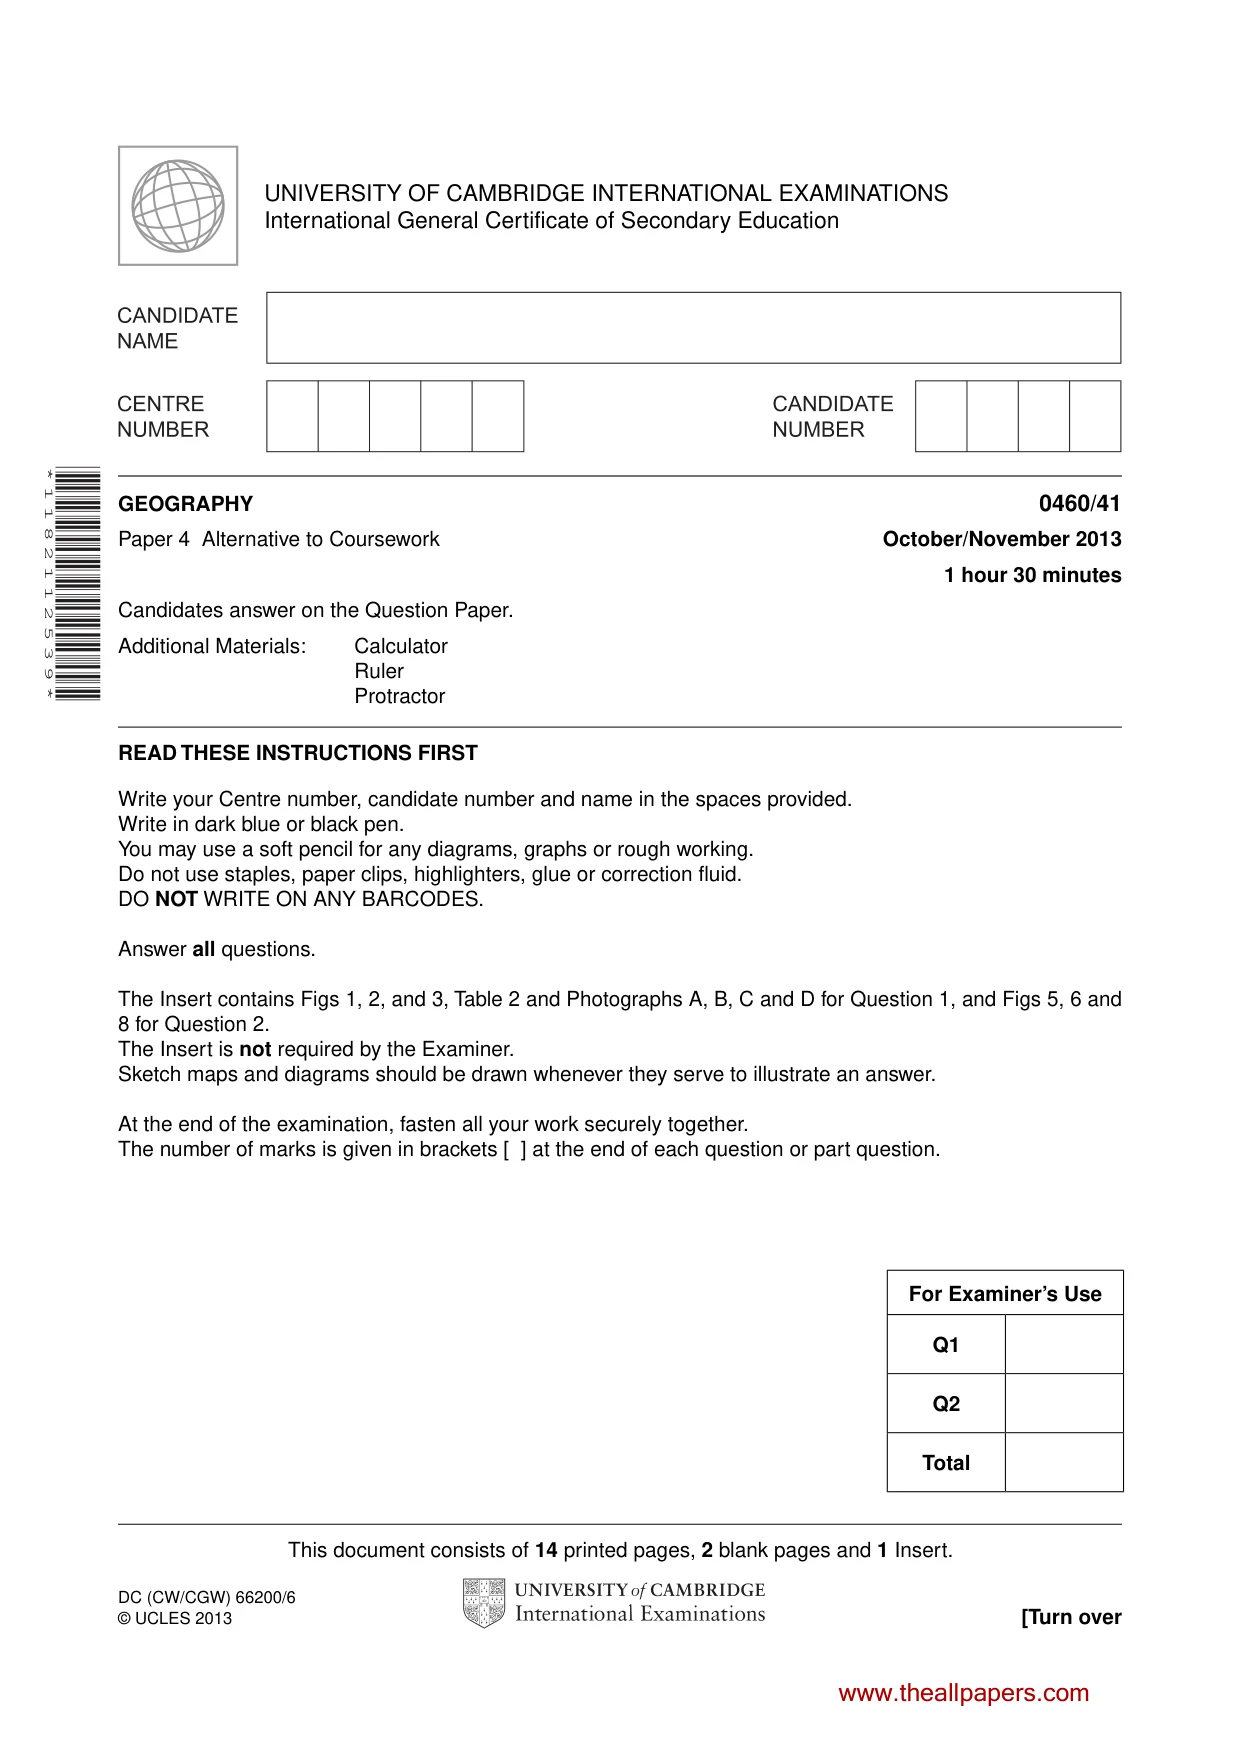
This document consists of 14 printed pages, 2 blank pages and 1 Insert. DC (CW/CGW) 66200/6 © UCLES 2013 [Turn over UNIVERSITY OF CAMBRIDGE INTERNATIONAL EXAMINATIONS International General Certificate of Secondary Education * 1 1 8 2 1 1 2 5 3 9 * GEOGRAPHY 0460/41 Paper 4 Alternative to Coursework October/November 2013 1 hour 30 minutes Candidates answer on the Question Paper. Additional Materials: Calculator Ruler Protractor READ THESE INSTRUCTIONS FIRST Write your Centre number, candidate number and name in the spaces provided. Write in dark blue or black pen. You may use a soft pencil for any diagrams, graphs or rough working. Do not use staples, paper clips, highlighters, glue or correction fluid. DO NOT WRITE ON ANY BARCODES. Answer all questions. The Insert contains Figs 1, 2, and 3, Table 2 and Photographs A, B, C and D for Question 1, and Figs 5, 6 and 8 for Question 2. The Insert is not required by the Examiner. Sketch maps and diagrams should be drawn whenever they serve to illustrate an answer. At the end of the examination, fasten all your work securely together. The number of marks is given in brackets [ ] at the end of each question or part question. For Examiner’s Use Q1 Q2 Total www.theallpapers.com
Question paper, page 2
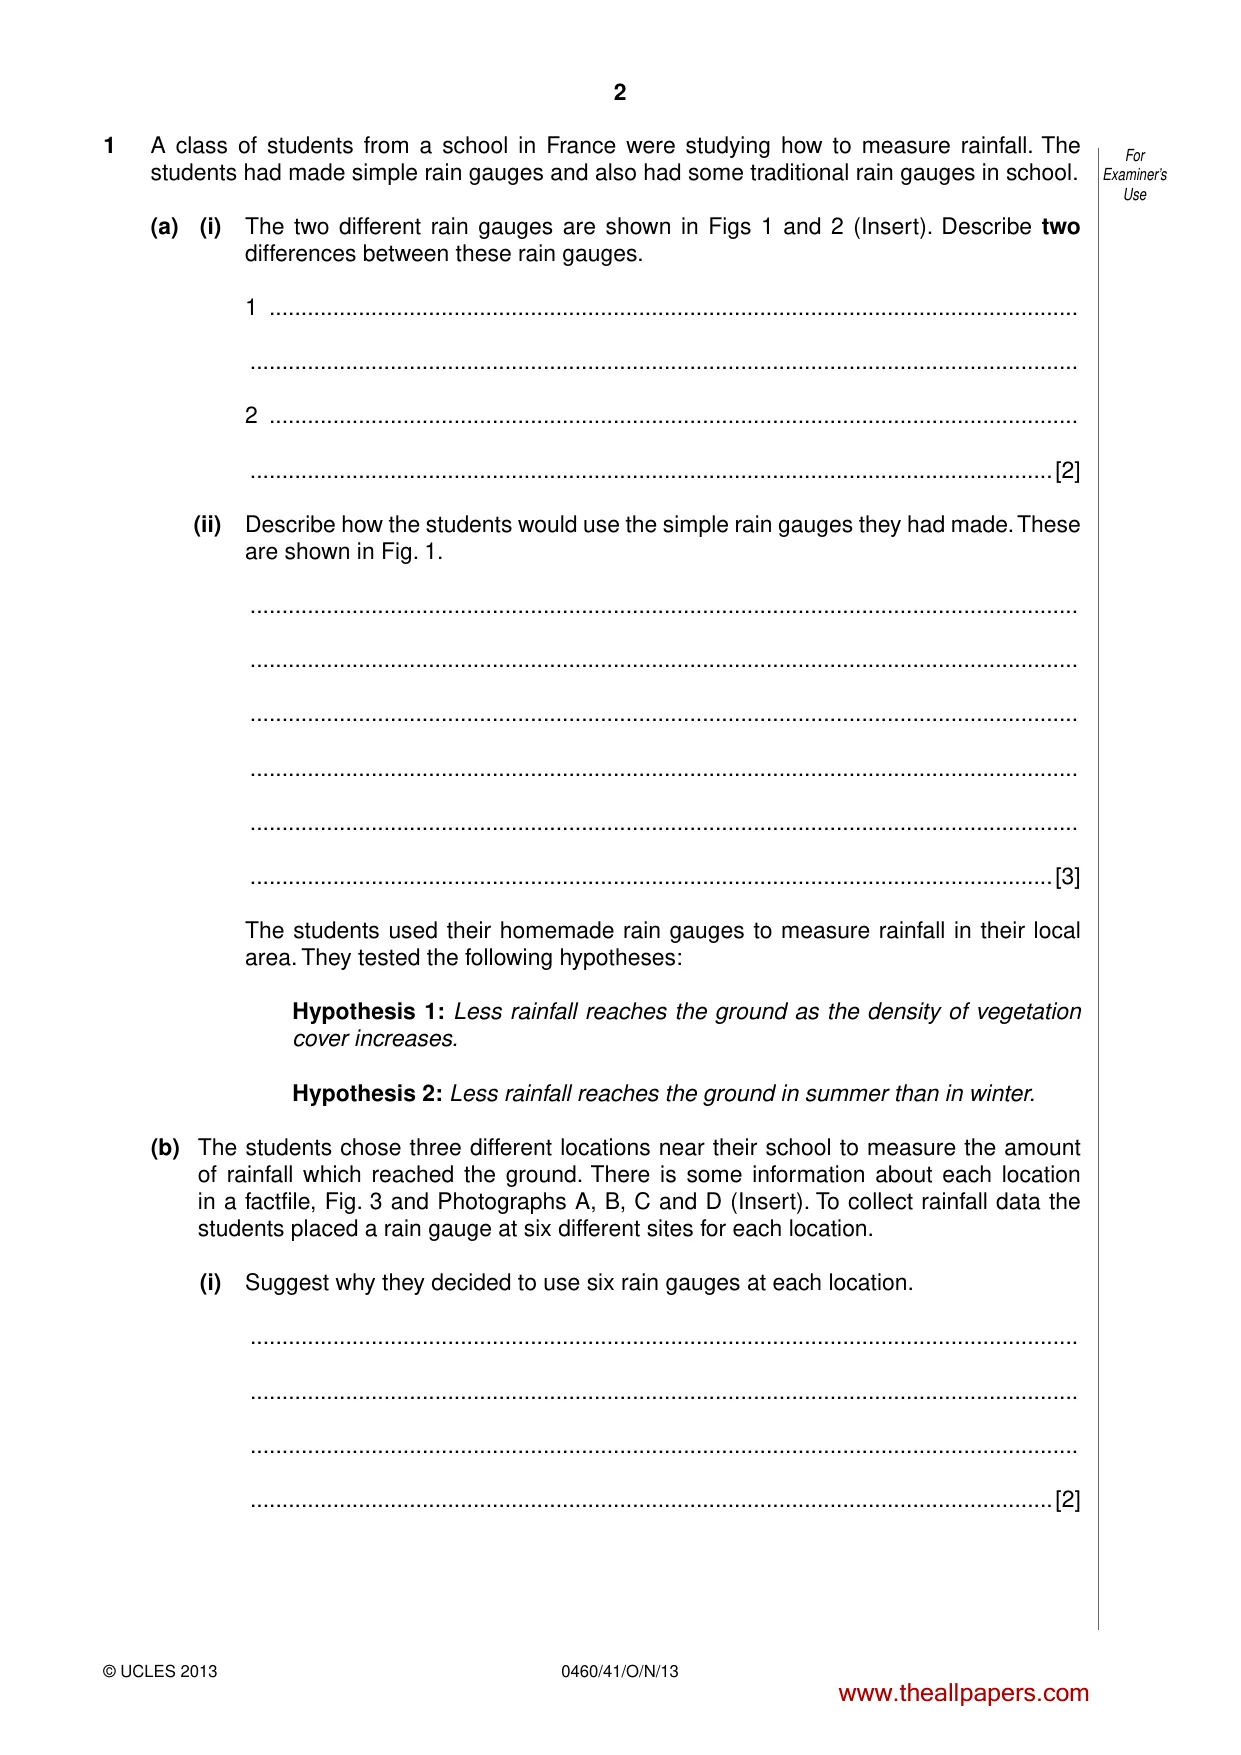
2 0460/41/O/N/13 © UCLES 2013 For Examiner’s Use 1 A class of students from a school in France were studying how to measure rainfall. The students had made simple rain gauges and also had some traditional rain gauges in school. (a) (i) The two different rain gauges are shown in Figs 1 and 2 (Insert). Describe two differences between these rain gauges. 1 … … 2 … …[2] (ii) Describe how the students would use the simple rain gauges they had made. These are shown in Fig. 1. … … … … … …[3] The students used their homemade rain gauges to measure rainfall in their local area. They tested the following hypotheses: Hypothesis 1: Less rainfall reaches the ground as the density of vegetation cover increases. Hypothesis 2: Less rainfall reaches the ground in summer than in winter. (b) The students chose three different locations near their school to measure the amount of rainfall which reached the ground. There is some information about each location in a factfile, Fig. 3 and Photographs A, B, C and D (Insert). To collect rainfall data the students placed a rain gauge at six different sites for each location. (i) Suggest why they decided to use six rain gauges at each location. … … … …[2] www.theallpapers.com
Question paper, page 3
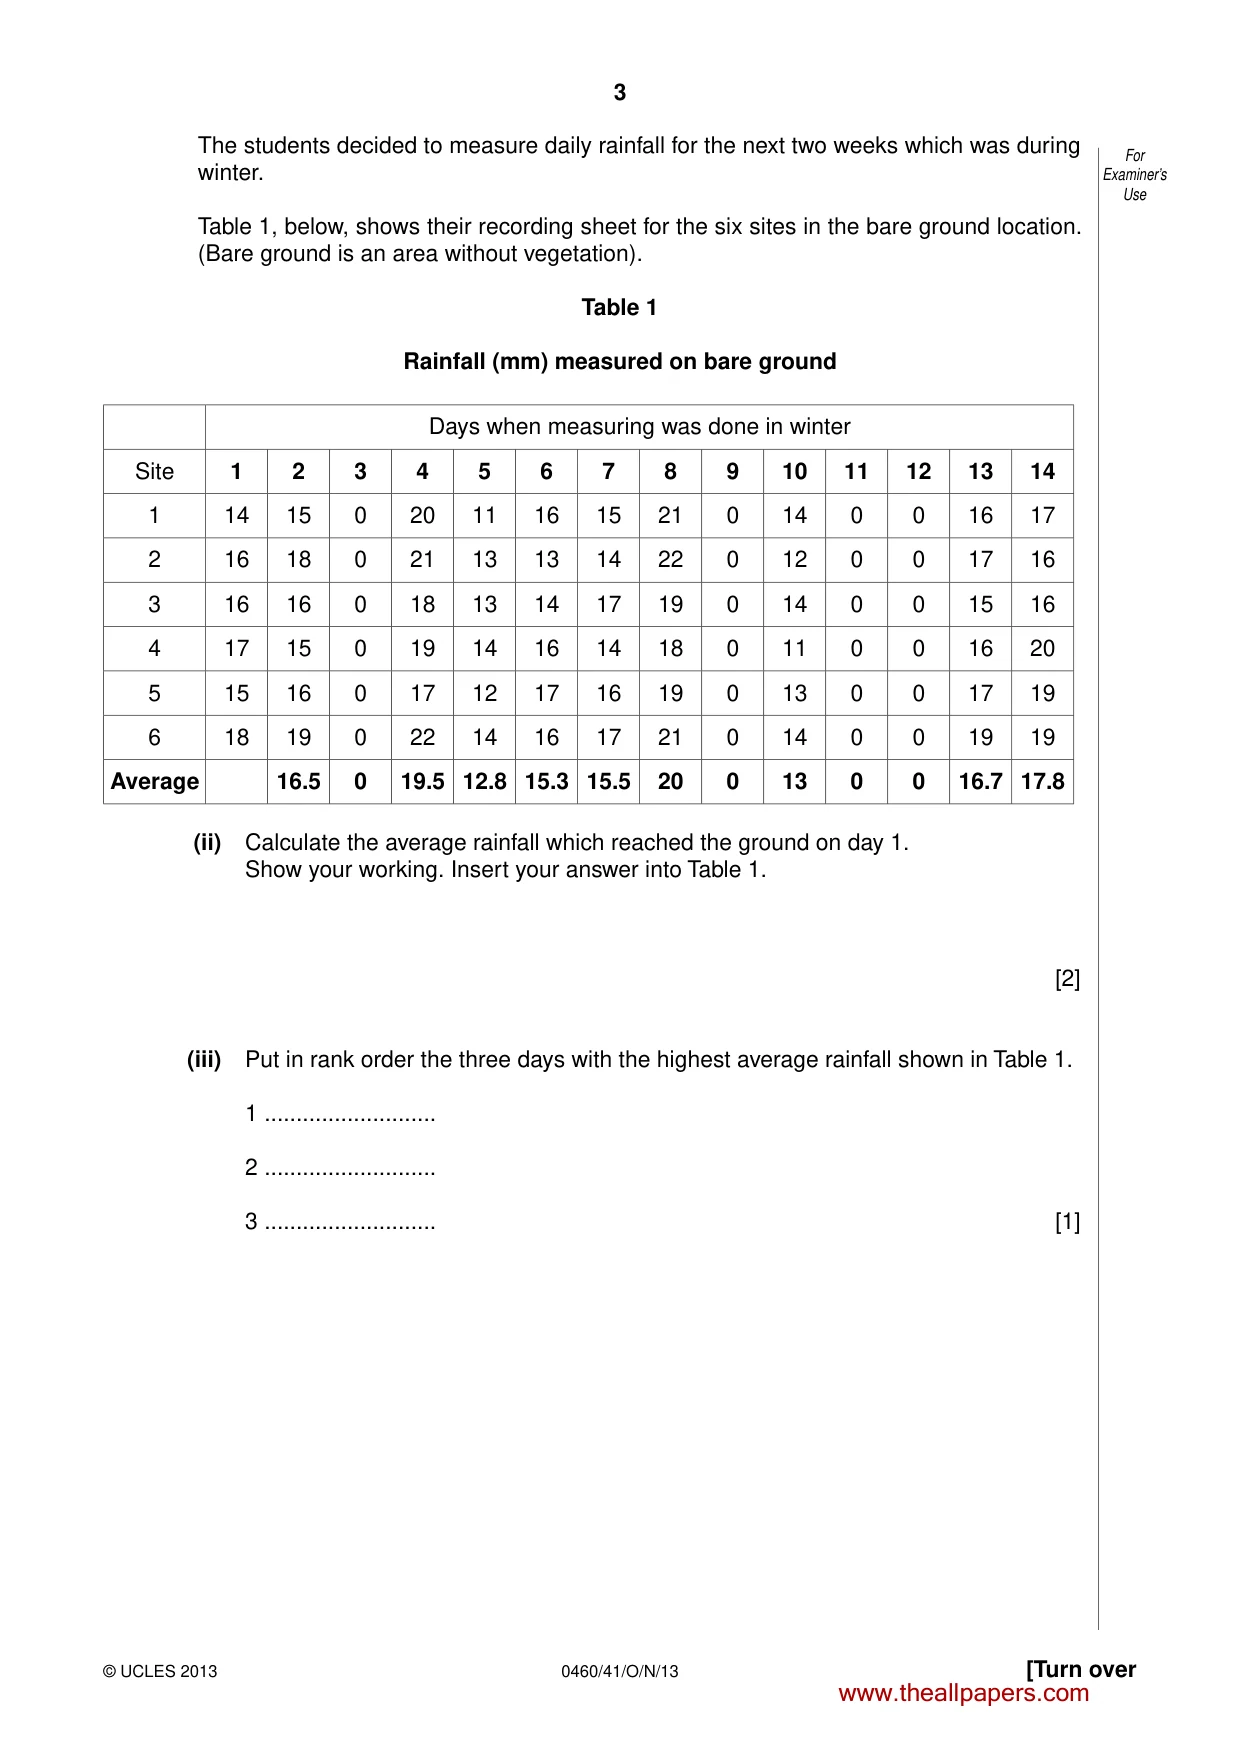
3 0460/41/O/N/13 © UCLES 2013 [Turn over For Examiner’s Use The students decided to measure daily rainfall for the next two weeks which was during winter. Table 1, below, shows their recording sheet for the six sites in the bare ground location. (Bare ground is an area without vegetation). Table 1 Rainfall (mm) measured on bare ground Days when measuring was done in winter Site 1 2 3 4 5 6 7 8 9 10 11 12 13 14 1 14 15 0 20 11 16 15 21 0 14 0 0 16 17 2 16 18 0 21 13 13 14 22 0 12 0 0 17 16 3 16 16 0 18 13 14 17 19 0 14 0 0 15 16 4 17 15 0 19 14 16 14 18 0 11 0 0 16 20 5 15 16 0 17 12 17 16 19 0 13 0 0 17 19 6 18 19 0 22 14 16 17 21 0 14 0 0 19 19 Average 16.5 0 19.5 12.8 15.3 15.5 20 0 13 0 0 16.7 17.8 (ii) Calculate the average rainfall which reached the ground on day 1. Show your working. Insert your answer into Table 1. [2] (iii) Put in rank order the three days with the highest average rainfall shown in Table 1. 1 … 2 … 3 … [1] www.theallpapers.com
Question paper, page 4
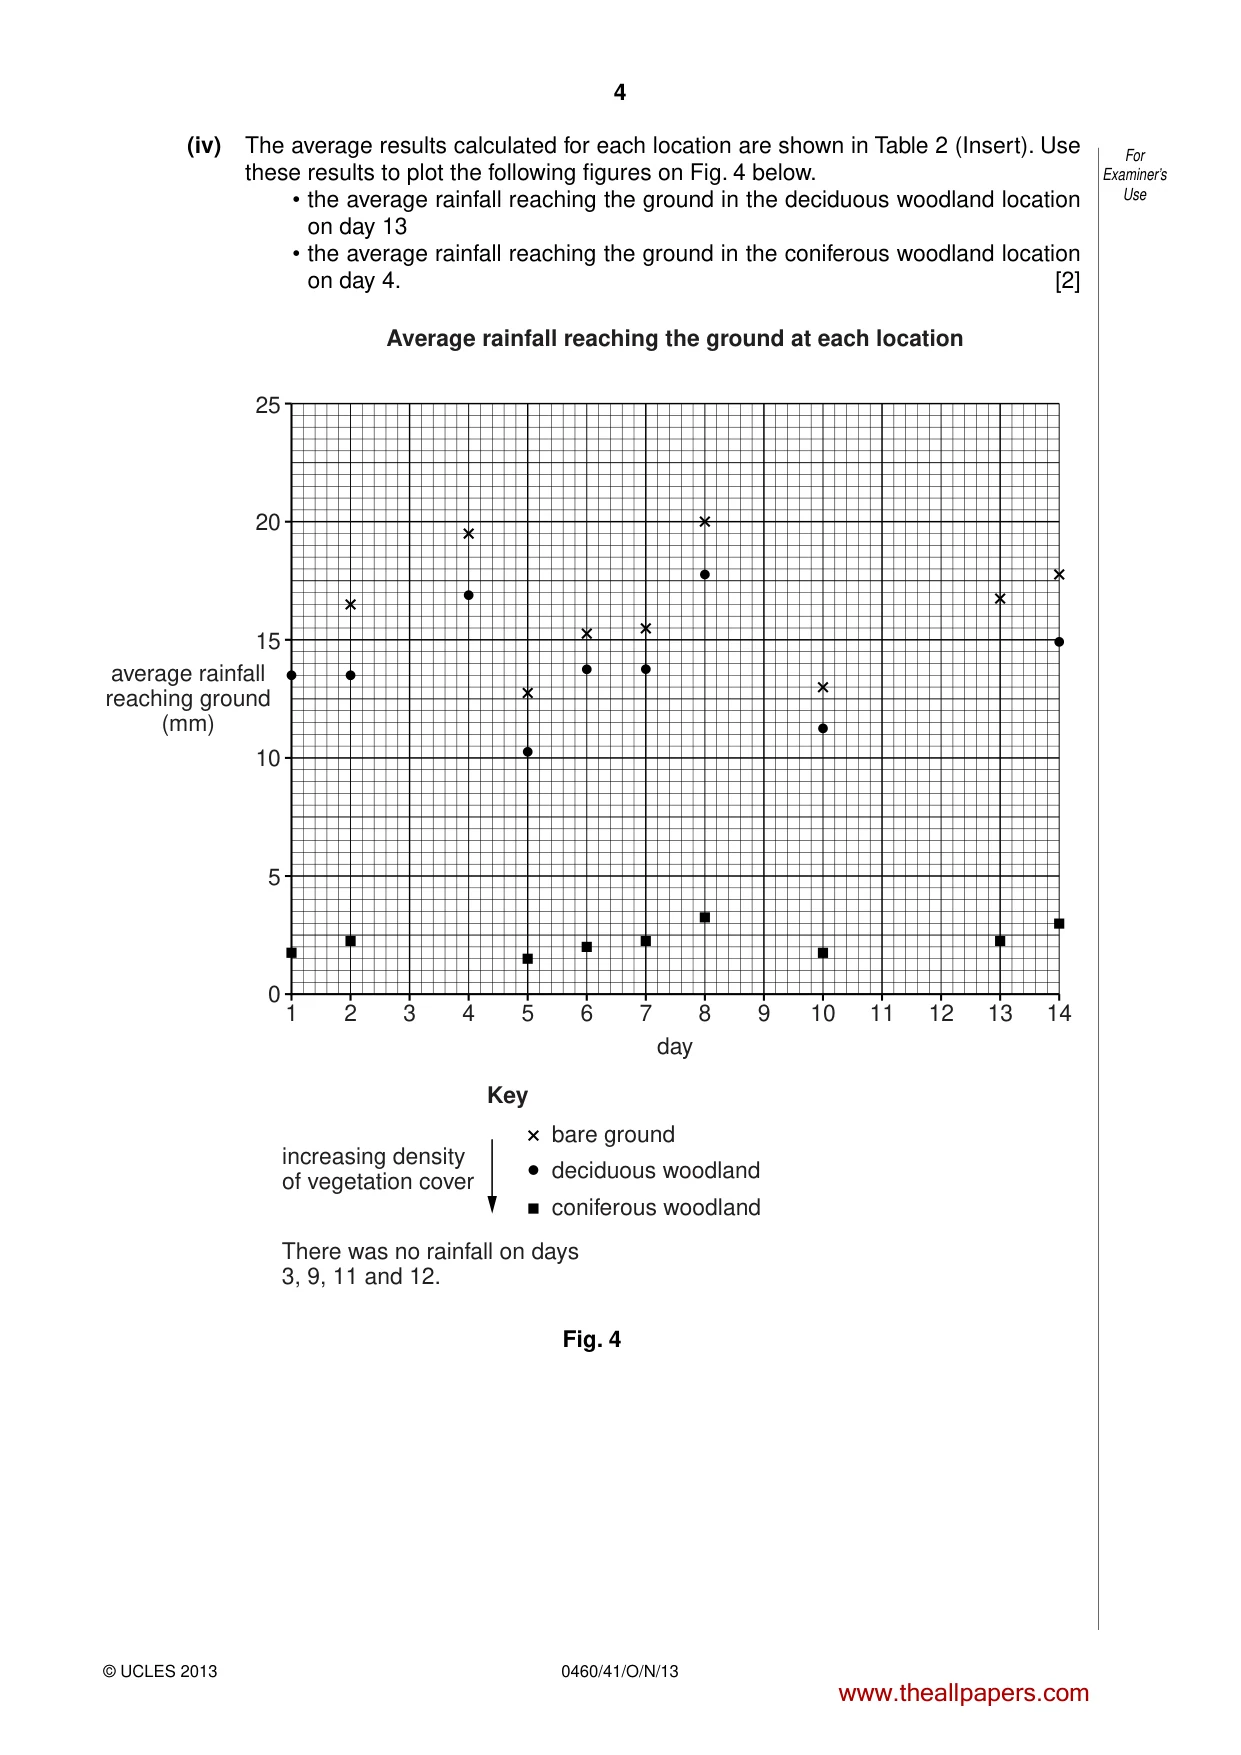
4 0460/41/O/N/13 © UCLES 2013 For Examiner’s Use (iv) The average results calculated for each location are shown in Table 2 (Insert). Use these results to plot the following figures on Fig. 4 below. • the average rainfall reaching the ground in the deciduous woodland location on day 13 • the average rainfall reaching the ground in the coniferous woodland location on day 4. [2] 25 20 15 average rainfall reaching ground (mm) 10 5 1 2 increasing density of vegetation cover bare ground deciduous woodland coniferous woodland There was no rainfall on days 3, 9, 11 and 12. 3 4 5 6 7 day Key Average rainfall reaching the ground at each location 8 9 10 11 12 13 14 0 Fig. 4 www.theallpapers.com
Question paper, page 5
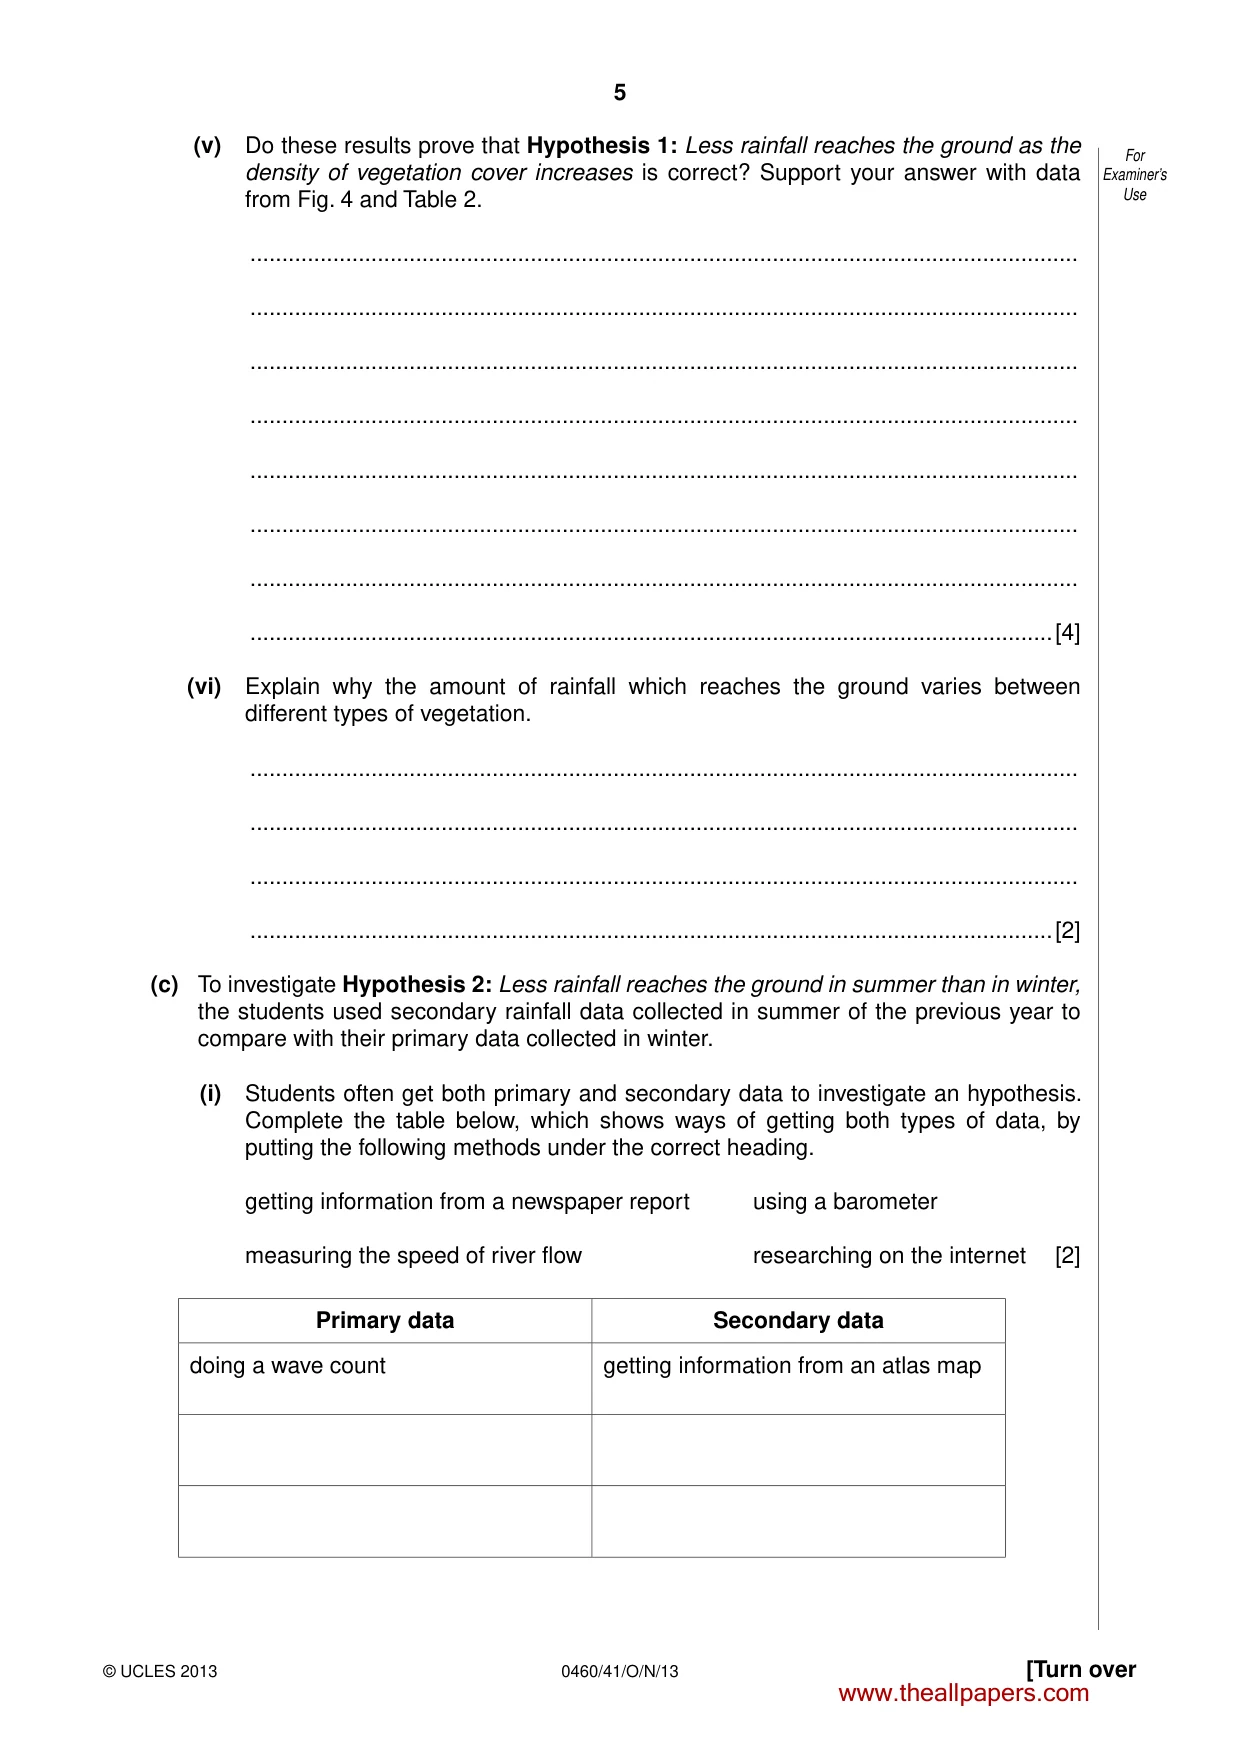
5 0460/41/O/N/13 © UCLES 2013 [Turn over For Examiner’s Use (v) Do these results prove that Hypothesis 1: Less rainfall reaches the ground as the density of vegetation cover increases is correct? Support your answer with data from Fig. 4 and Table 2. … … … … … … … …[4] (vi) Explain why the amount of rainfall which reaches the ground varies between different types of vegetation. … … … …[2] (c) To investigate Hypothesis 2: Less rainfall reaches the ground in summer than in winter, the students used secondary rainfall data collected in summer of the previous year to compare with their primary data collected in winter. (i) Students often get both primary and secondary data to investigate an hypothesis. Complete the table below, which shows ways of getting both types of data, by putting the following methods under the correct heading. getting information from a newspaper report using a barometer measuring the speed of river flow researching on the internet [2] Primary data Secondary data doing a wave count getting information from an atlas map www.theallpapers.com
Question paper, page 6
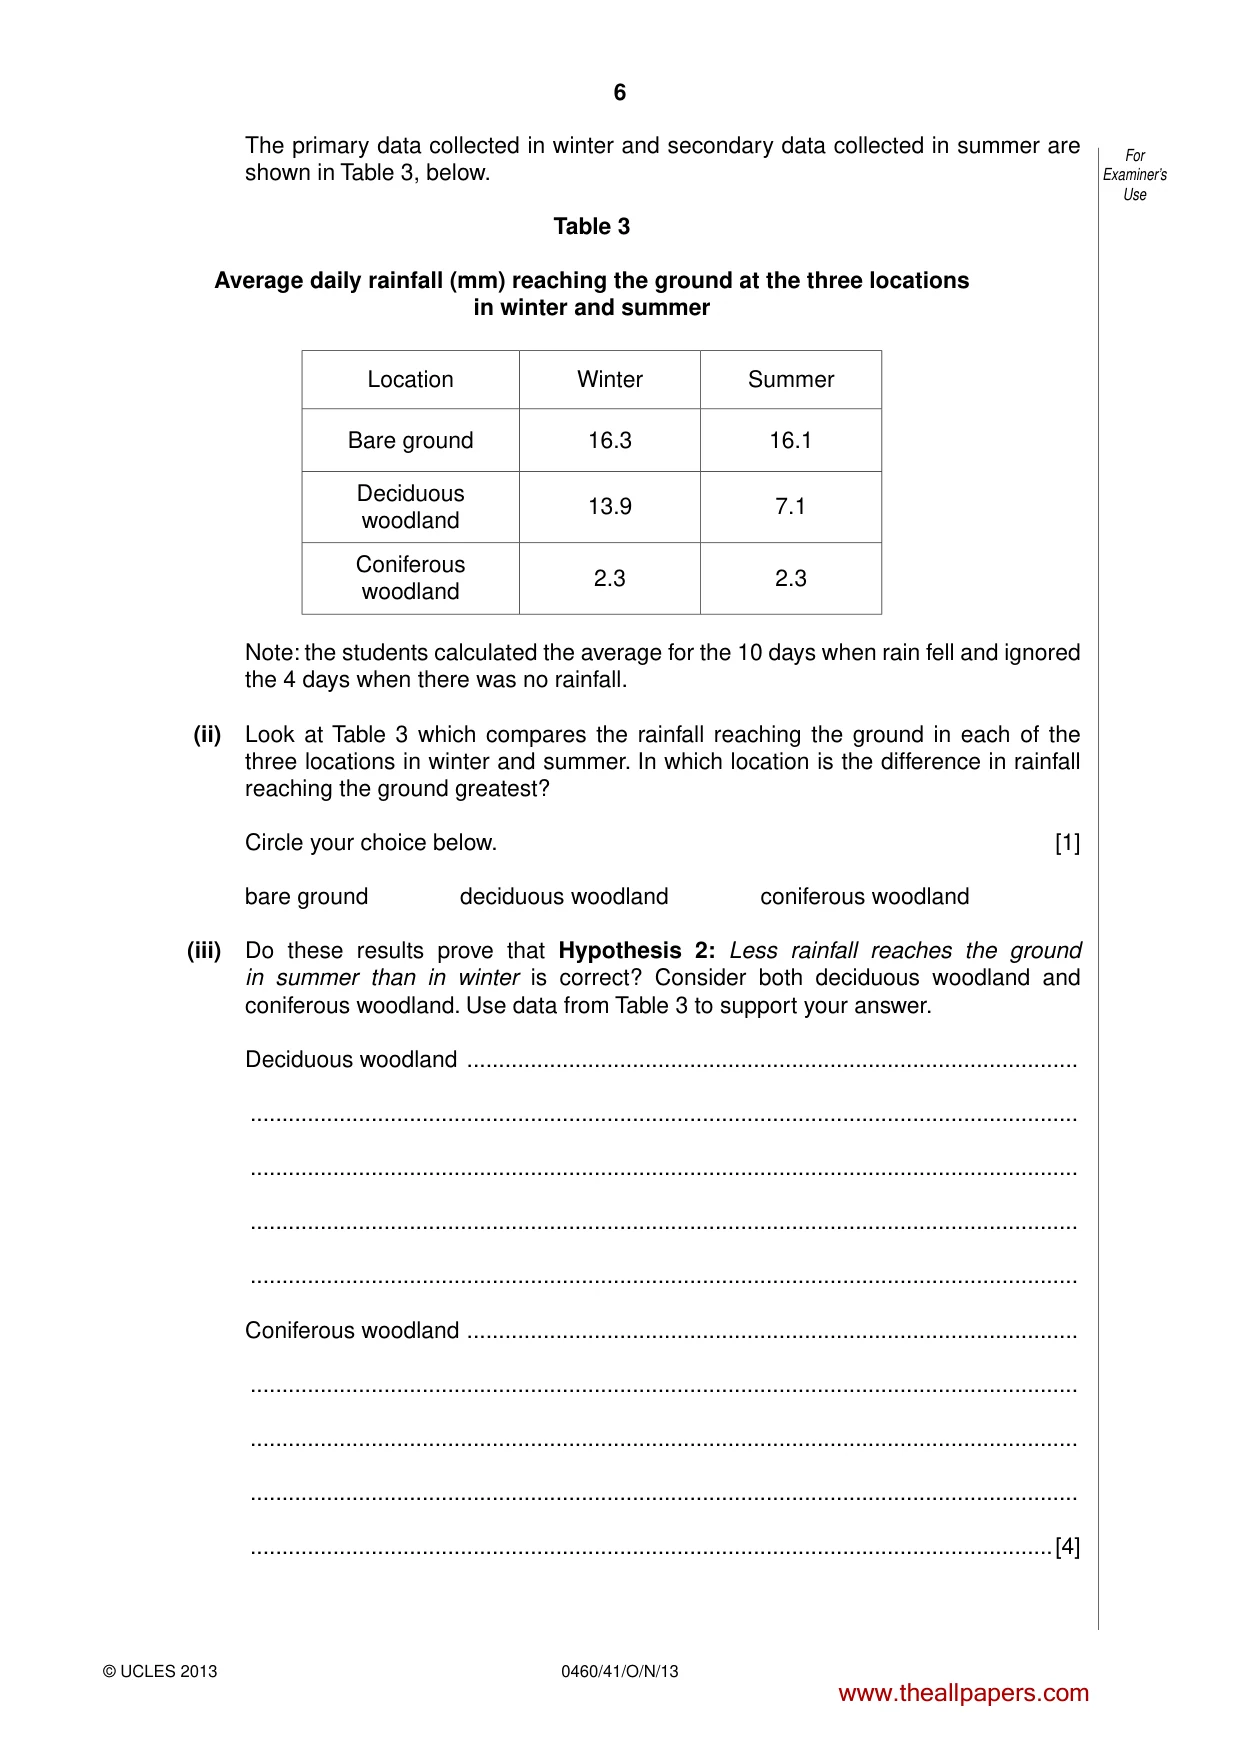
6 0460/41/O/N/13 © UCLES 2013 For Examiner’s Use The primary data collected in winter and secondary data collected in summer are shown in Table 3, below. Table 3 Average daily rainfall (mm) reaching the ground at the three locations in winter and summer Location Winter Summer Bare ground 16.3 16.1 Deciduous woodland 13.9 7.1 Coniferous woodland 2.3 2.3 Note: the students calculated the average for the 10 days when rain fell and ignored the 4 days when there was no rainfall. (ii) Look at Table 3 which compares the rainfall reaching the ground in each of the three locations in winter and summer. In which location is the difference in rainfall reaching the ground greatest? Circle your choice below. [1] bare ground deciduous woodland coniferous woodland (iii) Do these results prove that Hypothesis 2: Less rainfall reaches the ground in summer than in winter is correct? Consider both deciduous woodland and coniferous woodland. Use data from Table 3 to support your answer. Deciduous woodland … … … … … Coniferous woodland … … … … …[4] www.theallpapers.com
Question paper, page 7
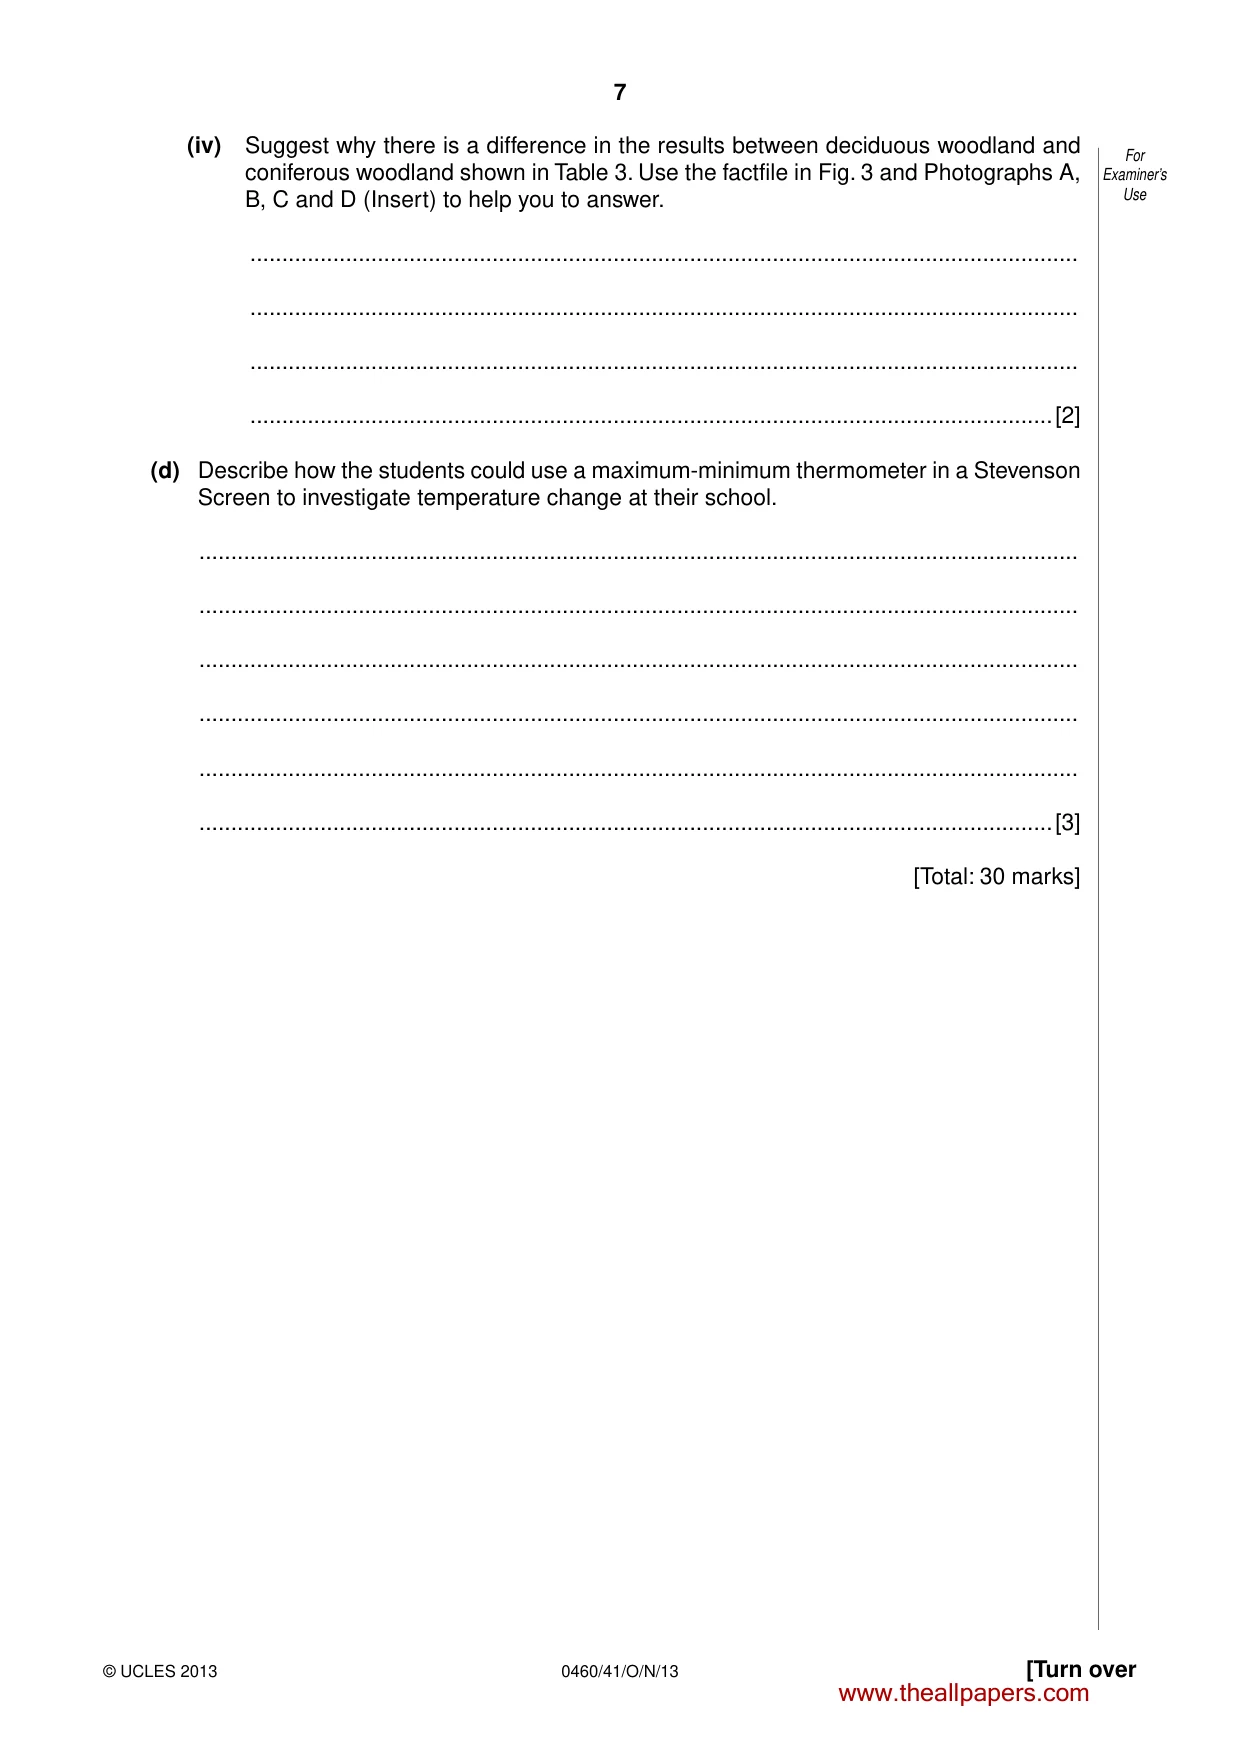
7 0460/41/O/N/13 © UCLES 2013 [Turn over For Examiner’s Use (iv) Suggest why there is a difference in the results between deciduous woodland and coniferous woodland shown in Table 3. Use the factfile in Fig. 3 and Photographs A, B, C and D (Insert) to help you to answer. … … … …[2] (d) Describe how the students could use a maximum-minimum thermometer in a Stevenson Screen to investigate temperature change at their school. … … … … … …[3] [Total: 30 marks] www.theallpapers.com
Question paper, page 8
8 0460/41/O/N/13 © UCLES 2013 For Examiner’s Use 2 Four students decided to do an investigation into tourism in a village in a national park. They agreed to test the following hypotheses: Hypothesis 1: People of different ages have different reasons for visiting the area. Hypothesis 2: Local residents believe that tourism has a negative impact on the area. (a) (i) To begin their investigation the students divided into two pairs to think of some questions to include in a questionnaire. The two questionnaires are shown in Figs 5 and 6 (Insert). Give three ways that Questionnaire 2 (Fig. 6) is better than Questionnaire 1 (Fig. 5). 1 … … 2 … … 3 … …[3] (ii) Before using the questionnaire shown in Fig. 6, the four students thought about the best way to make use of it. They decided to ask the opinion of 100 people. Name and describe a suitable sampling method for the students to select 100 people. Name of sampling method … Description of method … … … … …[3] (iii) The students decided to put their questions to visitors returning to their cars before leaving the car park. Suggest why they made this decision and one possible disadvantage of their decision. Why they made the decision … … Disadvantage … … …[2] www.theallpapers.com
Question paper, page 9
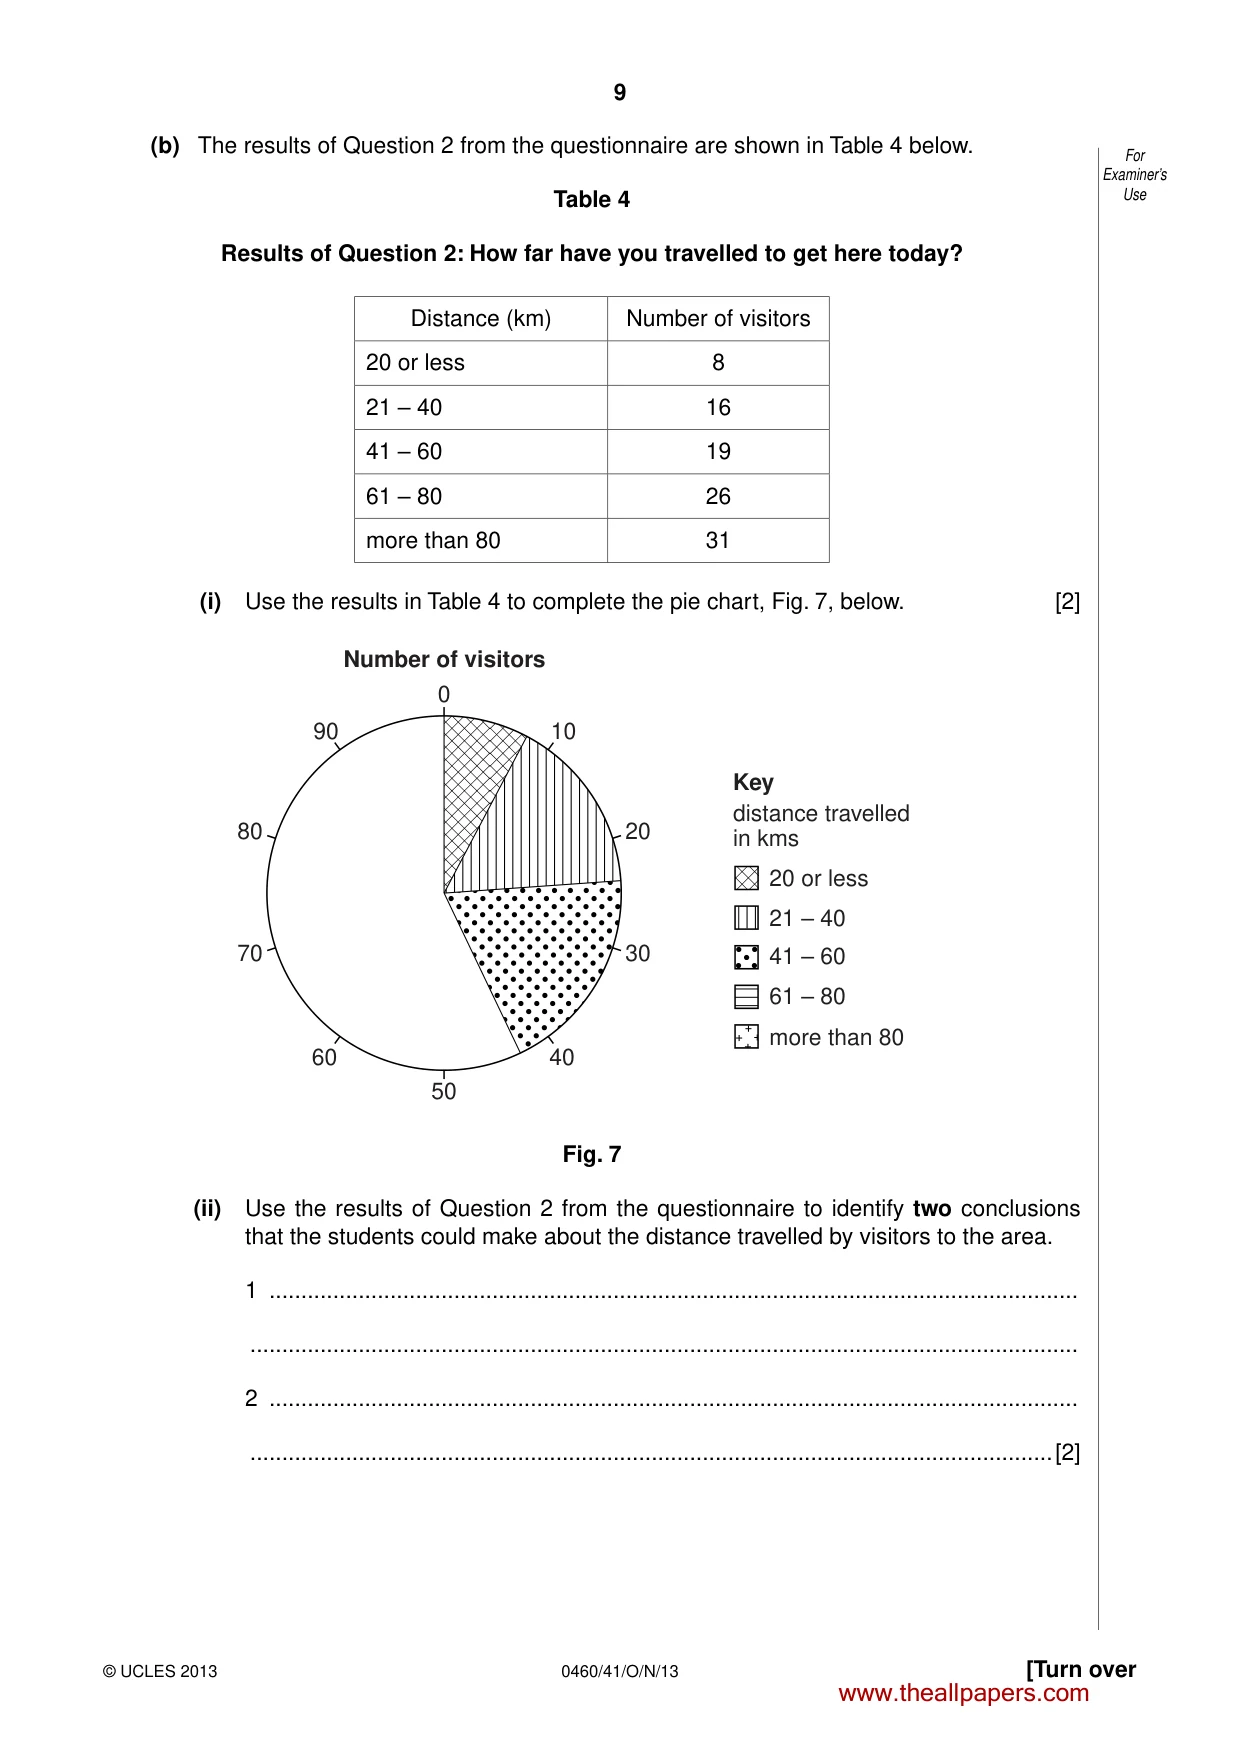
9 0460/41/O/N/13 © UCLES 2013 [Turn over For Examiner’s Use (b) The results of Question 2 from the questionnaire are shown in Table 4 below. Table 4 Results of Question 2: How far have you travelled to get here today? Distance (km) Number of visitors 20 or less 8 21 – 40 16 41 – 60 19 61 – 80 26 more than 80 31 (i) Use the results in Table 4 to complete the pie chart, Fig. 7, below. [2] 20 or less Key Number of visitors distance travelled in kms 21 – 40 10 90 20 30 40 60 50 0 80 70 41 – 60 61 – 80 more than 80 Fig. 7 (ii) Use the results of Question 2 from the questionnaire to identify two conclusions that the students could make about the distance travelled by visitors to the area. 1 … … 2 … …[2] www.theallpapers.com
Question paper, page 10
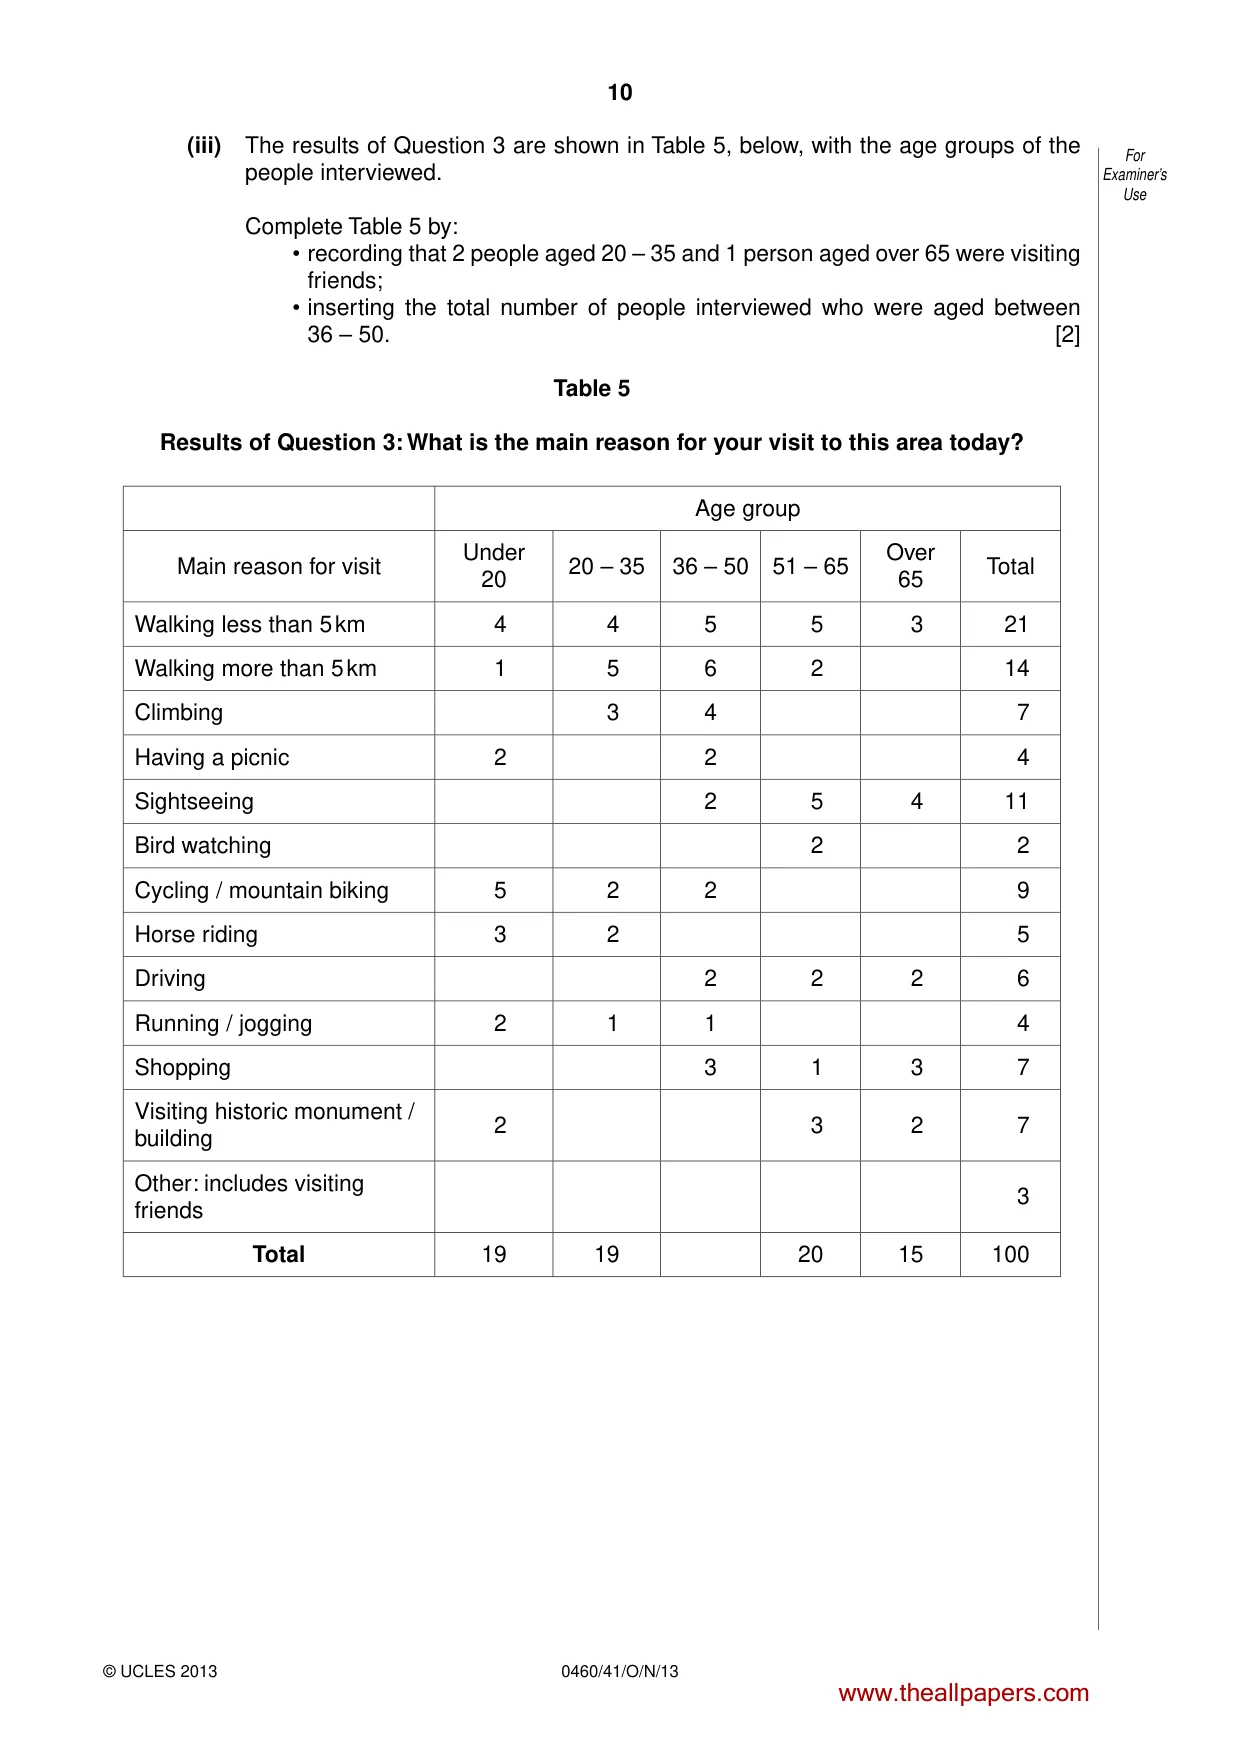
10 0460/41/O/N/13 © UCLES 2013 For Examiner’s Use (iii) The results of Question 3 are shown in Table 5, below, with the age groups of the people interviewed. Complete Table 5 by: • recording that 2 people aged 20 – 35 and 1 person aged over 65 were visiting friends; • inserting the total number of people interviewed who were aged between 36 – 50. [2] Table 5 Results of Question 3: What is the main reason for your visit to this area today? Age group Main reason for visit Under 20 20 – 35 36 – 50 51 – 65 Over 65 Total Walking less than 5 km 4 4 5 5 3 21 Walking more than 5 km 1 5 6 2 14 Climbing 3 4 7 Having a picnic 2 2 4 Sightseeing 2 5 4 11 Bird watching 2 2 Cycling / mountain biking 5 2 2 9 Horse riding 3 2 5 Driving 2 2 2 6 Running / jogging 2 1 1 4 Shopping 3 1 3 7 Visiting historic monument / building 2 3 2 7 Other: includes visiting friends 3 Total 19 19 20 15 100 www.theallpapers.com
Question paper, page 11
11 0460/41/O/N/13 © UCLES 2013 [Turn over For Examiner’s Use (iv) The students used the information in Table 5 to work out a conclusion about Hypothesis 1: People of different ages have different reasons for visiting the area. Do you think the hypothesis is correct? Support your conclusion with evidence from Table 5. … … … … … … … …[4] (c) To investigate Hypothesis 2: Local residents believe that tourism has a negative impact on the area, the students interviewed 50 residents to get their opinions about tourism. The questions which they asked in the interview are shown in Fig. 8 (Insert). (i) Suggest why the students asked Do you live in the village? at the beginning of the interview. … …[1] www.theallpapers.com
Question paper, page 12
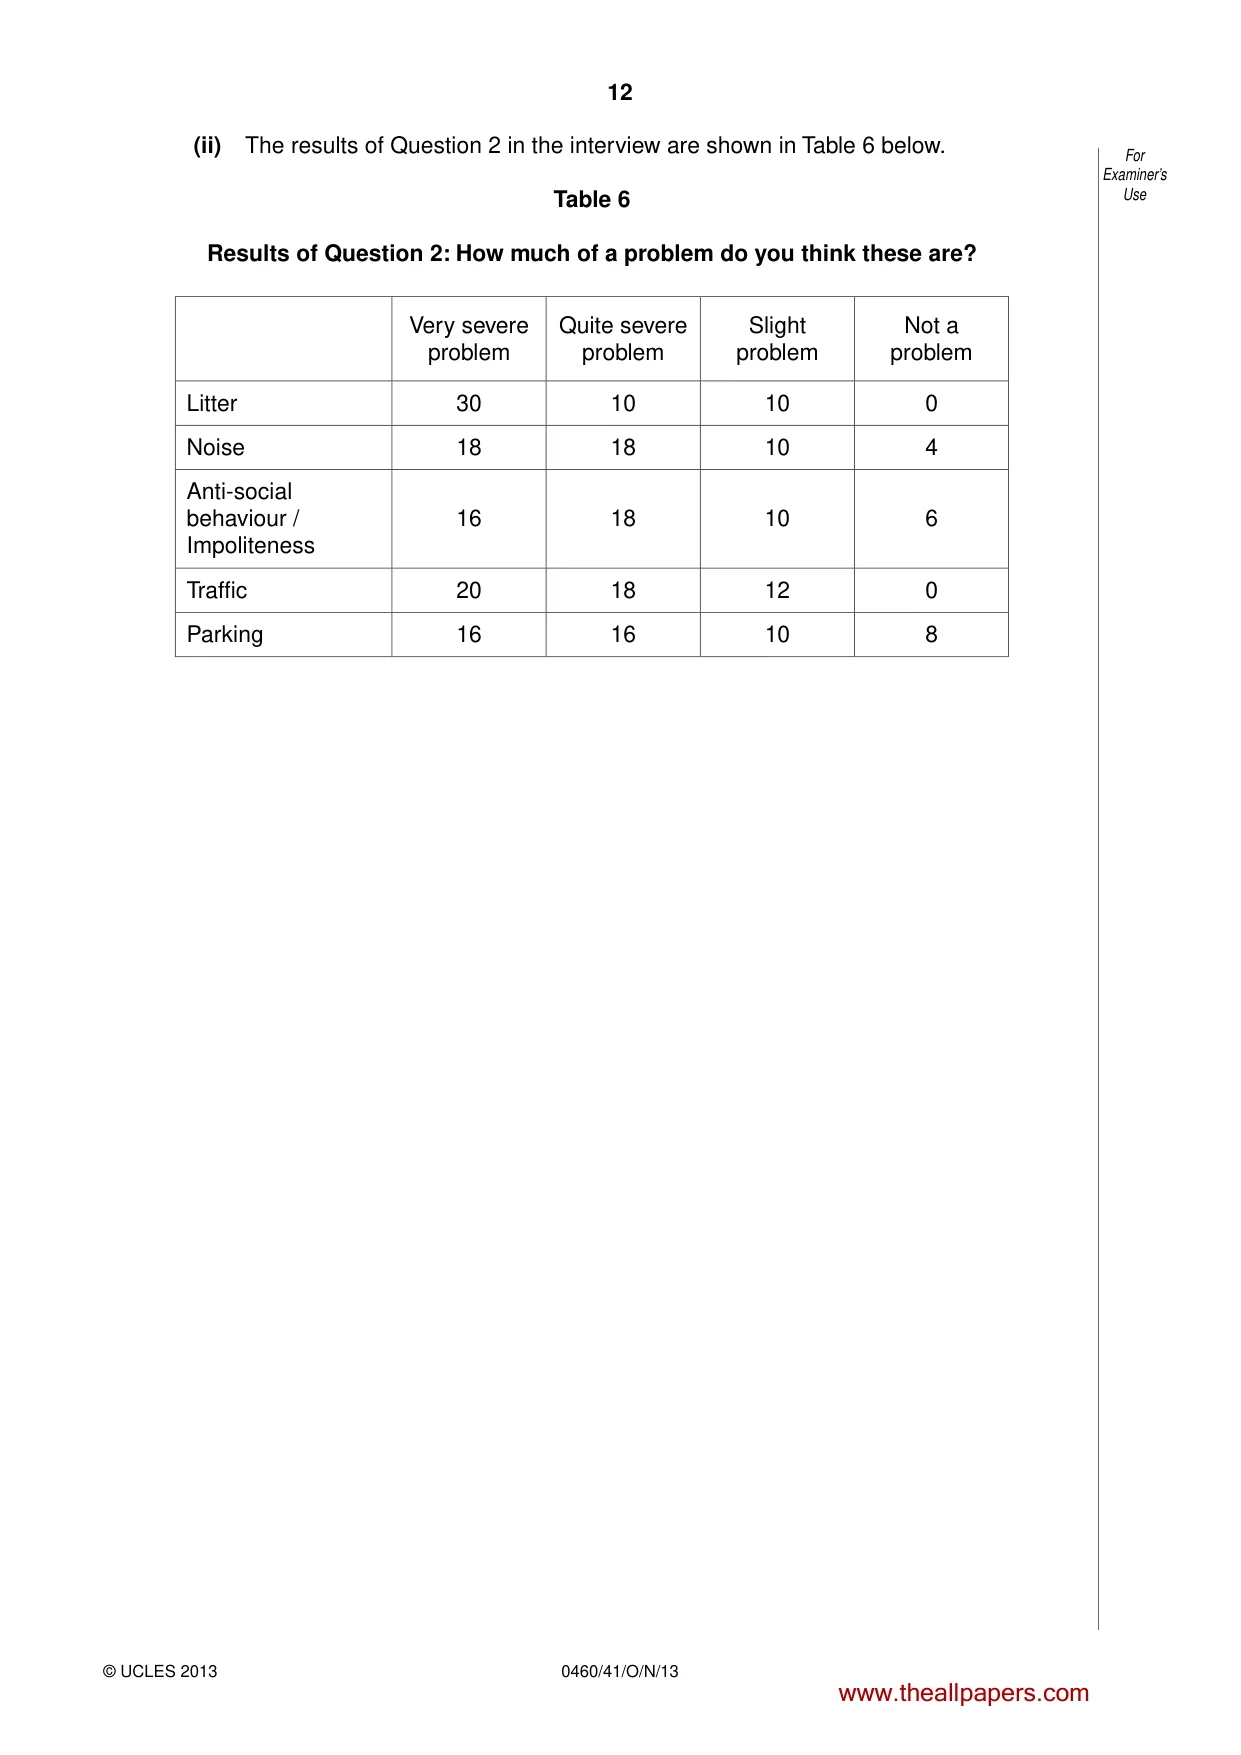
12 0460/41/O/N/13 © UCLES 2013 For Examiner’s Use (ii) The results of Question 2 in the interview are shown in Table 6 below. Table 6 Results of Question 2: How much of a problem do you think these are? Very severe problem Quite severe problem Slight problem Not a problem Litter 30 10 10 0 Noise 18 18 10 4 Anti-social behaviour / Impoliteness 16 18 10 6 Traffic 20 18 12 0 Parking 16 16 10 8 www.theallpapers.com
Question paper, page 13
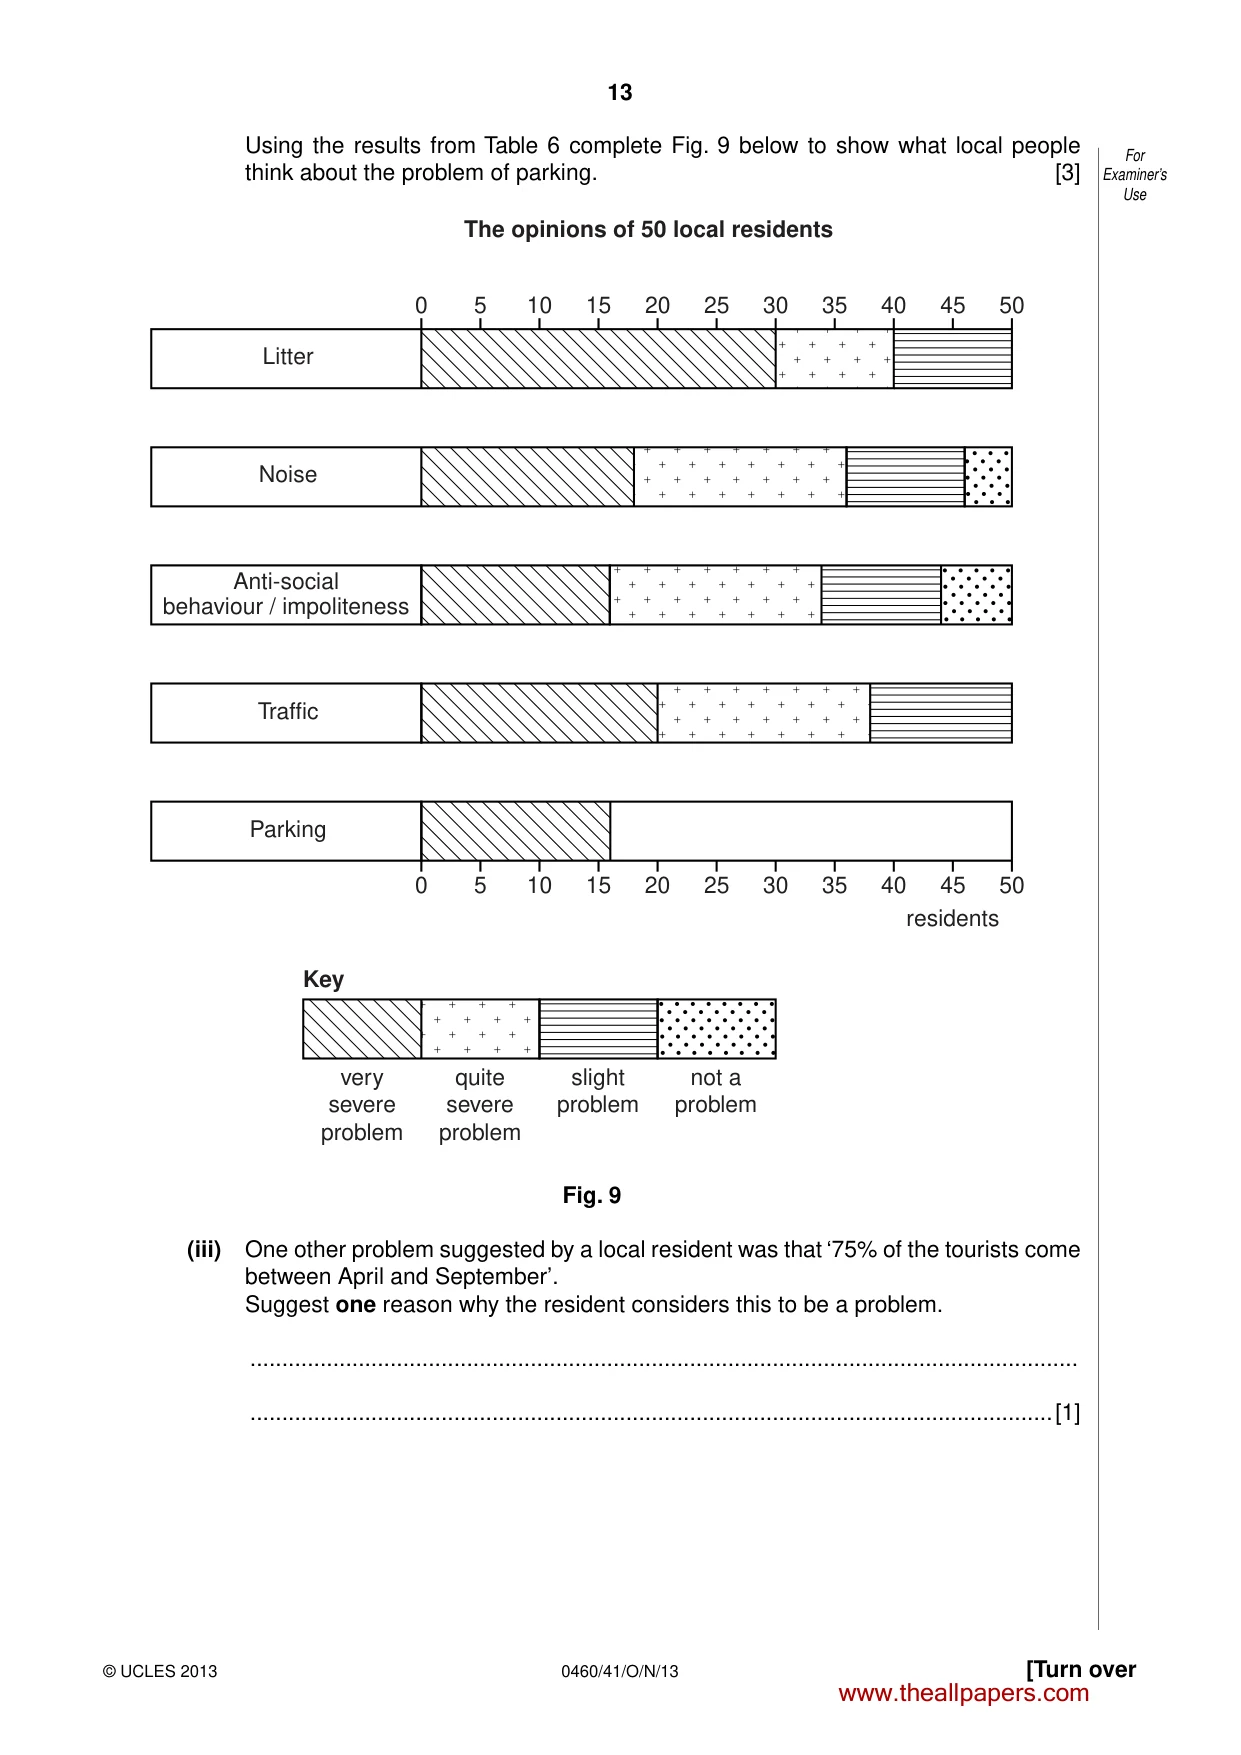
13 0460/41/O/N/13 © UCLES 2013 [Turn over For Examiner’s Use Using the results from Table 6 complete Fig. 9 below to show what local people think about the problem of parking. [3] 0 5 Litter Noise Anti-social behaviour / impoliteness Traffic Parking very severe problem quite severe problem slight problem not a problem 10 15 20 25 30 35 40 45 50 0 5 10 15 20 25 30 35 40 residents Key The opinions of 50 local residents 45 50 Fig. 9 (iii) One other problem suggested by a local resident was that ‘75% of the tourists come between April and September’. Suggest one reason why the resident considers this to be a problem. … …[1] www.theallpapers.com
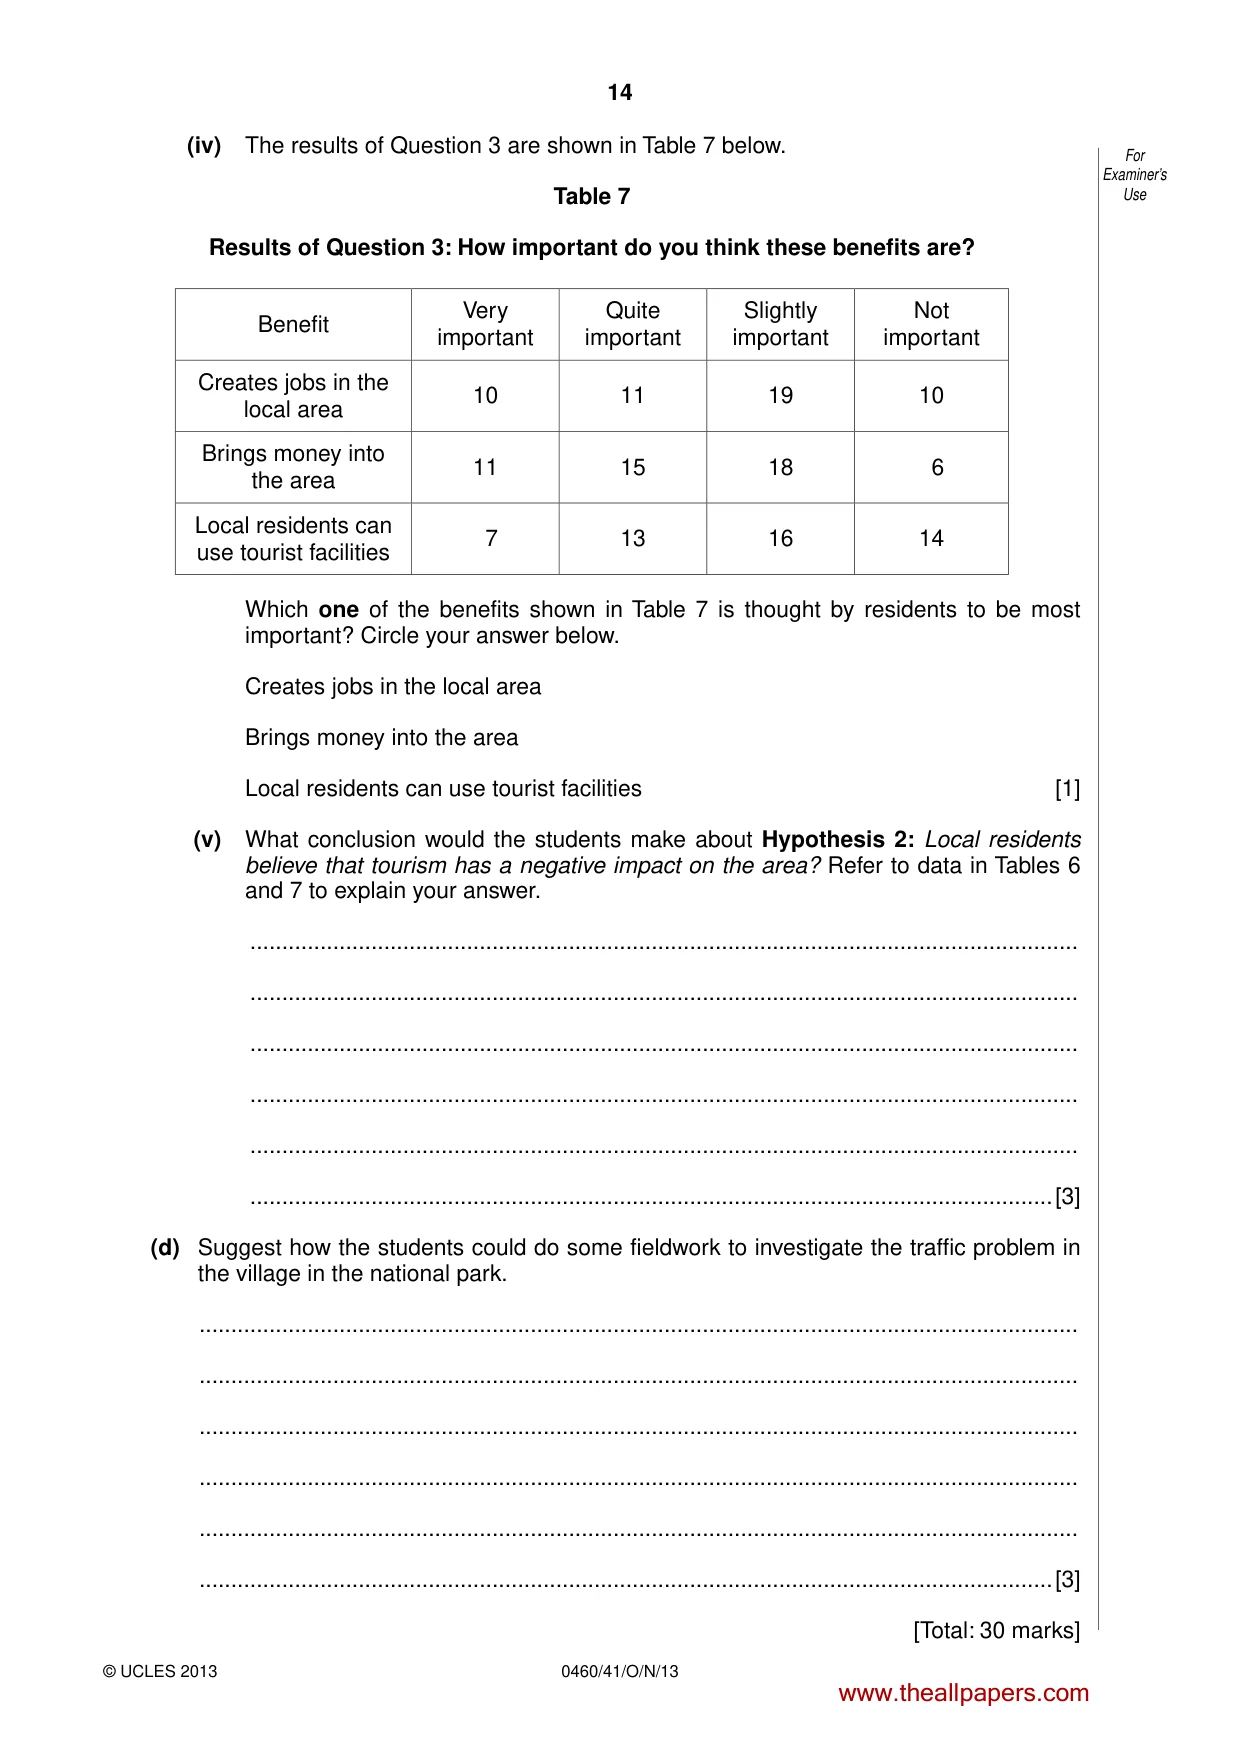
Question paper, page 14
14 0460/41/O/N/13 © UCLES 2013 For Examiner’s Use (iv) The results of Question 3 are shown in Table 7 below. Table 7 Results of Question 3: How important do you think these benefits are? Benefit Very important Quite important Slightly important Not important Creates jobs in the local area 10 11 19 10 Brings money into the area 11 15 18 6 Local residents can use tourist facilities 7 13 16 14 Which one of the benefits shown in Table 7 is thought by residents to be most important? Circle your answer below. Creates jobs in the local area Brings money into the area Local residents can use tourist facilities [1] (v) What conclusion would the students make about Hypothesis 2: Local residents believe that tourism has a negative impact on the area? Refer to data in Tables 6 and 7 to explain your answer. … … … … … …[3] (d) Suggest how the students could do some fieldwork to investigate the traffic problem in the village in the national park. … … … … … …[3] [Total: 30 marks] www.theallpapers.com
Question paper, page 15
15 0460/41/O/N/13 © UCLES 2013 BLANK PAGE www.theallpapers.com
Question paper, page 16
16 0460/41/O/N/13 © UCLES 2013 BLANK PAGE Copyright Acknowledgements: Question 1 Photograph A © http://www.geograph.org.uk/photo/186033 Question 1 Photograph B © http://www.countrysideinfo.co.uk/maps_website/wetwland.htm Question 1 Photograph C © http://en.wikipedia.org/wiki/File:Peckforton_Woods_wiki.jpg Question 1 Photograph D © http://www.offwell.free-online.co.uk/maps_website/coniferouswoodland.htm Permission to reproduce items where third-party owned material protected by copyright is included has been sought and cleared where possible. Every reasonable effort has been made by the publisher (UCLES) to trace copyright holders, but if any items requiring clearance have unwittingly been included, the publisher will be pleased to make amends at the earliest possible opportunity. University of Cambridge International Examinations is part of the Cambridge Assessment Group. Cambridge Assessment is the brand name of University of Cambridge Local Examinations Syndicate (UCLES), which is itself a department of the University of Cambridge. www.theallpapers.com
Mark scheme, page 1
CAMBRIDGE INTERNATIONAL EXAMINATIONS International General Certificate of Secondary Education MARK SCHEME for the October/November 2013 series 0460 GEOGRAPHY 0460/41 Paper 4 (Alternative to Coursework), maximum raw mark 60 This mark scheme is published as an aid to teachers and candidates, to indicate the requirements of the examination. It shows the basis on which Examiners were instructed to award marks. It does not indicate the details of the discussions that took place at an Examiners’ meeting before marking began, which would have considered the acceptability of alternative answers. Mark schemes should be read in conjunction with the question paper and the Principal Examiner Report for Teachers. Cambridge will not enter into discussions about these mark schemes. Cambridge is publishing the mark schemes for the October/November 2013 series for most IGCSE, GCE Advanced Level and Advanced Subsidiary Level components and some Ordinary Level components. www.theallpapers.com
Mark scheme, page 2
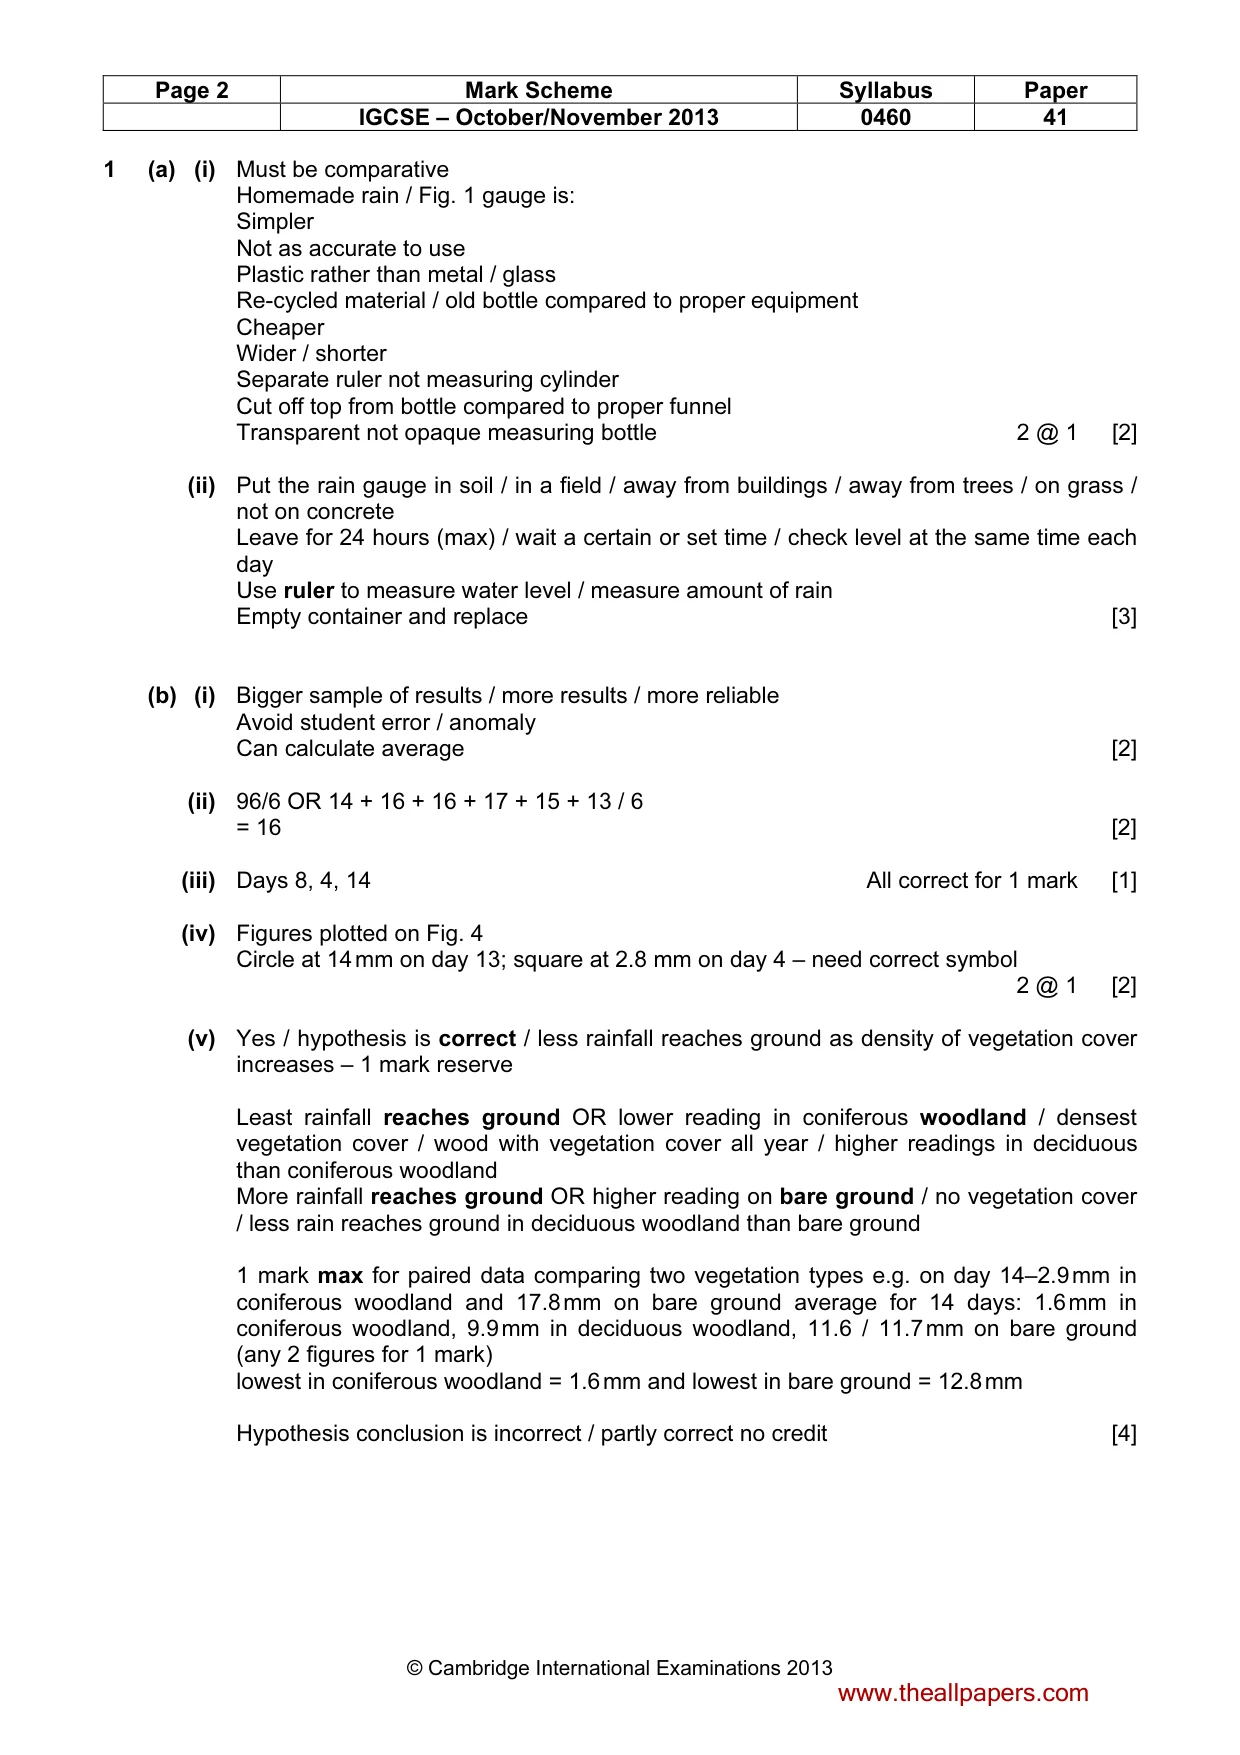
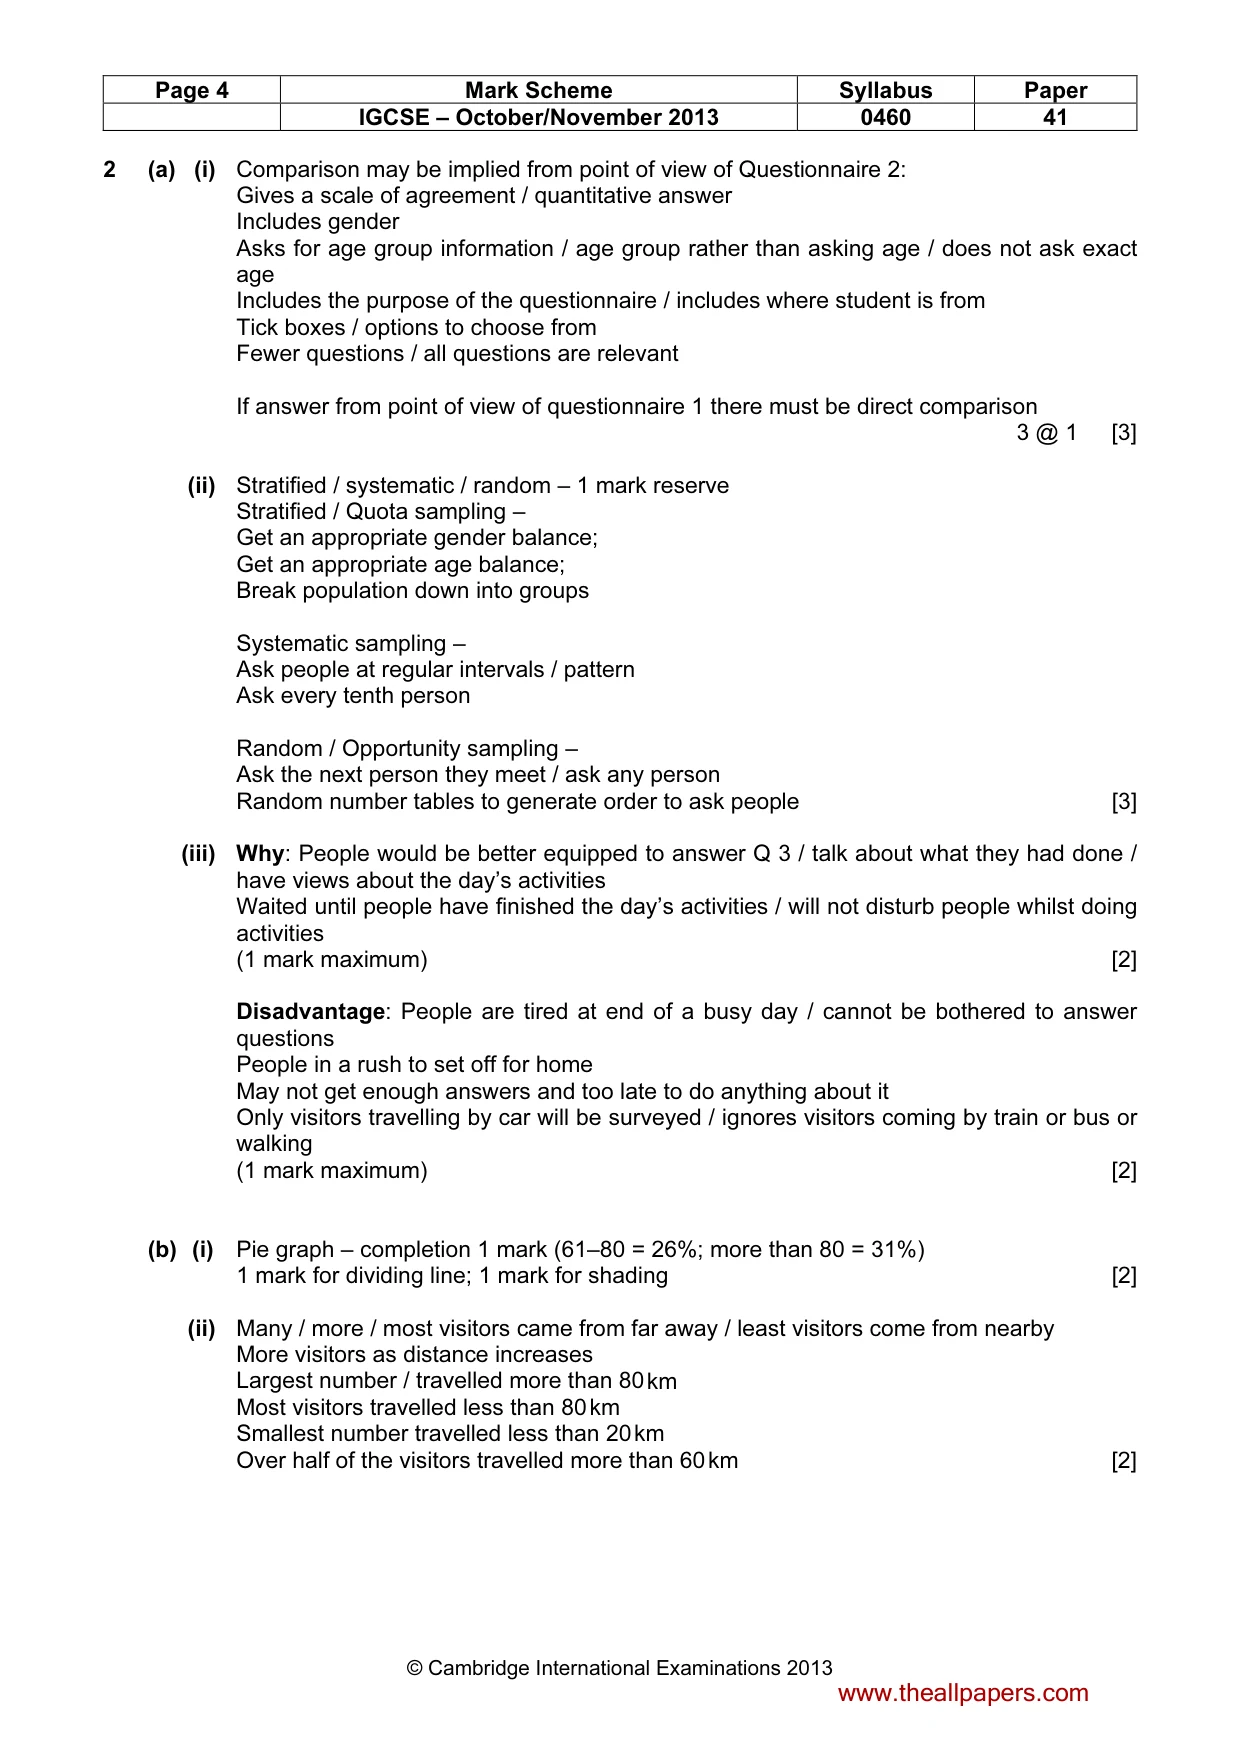
Page 2 Mark Scheme Syllabus Paper IGCSE – October/November 2013 0460 41 © Cambridge International Examinations 2013 1 (a) (i) Must be comparative Homemade rain / Fig. 1 gauge is: Simpler Not as accurate to use Plastic rather than metal / glass Re-cycled material / old bottle compared to proper equipment Cheaper Wider / shorter Separate ruler not measuring cylinder Cut off top from bottle compared to proper funnel Transparent not opaque measuring bottle 2 @ 1 [2] (ii) Put the rain gauge in soil / in a field / away from buildings / away from trees / on grass / not on concrete Leave for 24 hours (max) / wait a certain or set time / check level at the same time each day Use ruler to measure water level / measure amount of rain Empty container and replace [3] (b) (i) Bigger sample of results / more results / more reliable Avoid student error / anomaly Can calculate average [2] (ii) 96/6 OR 14 + 16 + 16 + 17 + 15 + 13 / 6 = 16 [2] (iii) Days 8, 4, 14 All correct for 1 mark [1] (iv) Figures plotted on Fig. 4 Circle at 14 mm on day 13; square at 2.8 mm on day 4 – need correct symbol 2 @ 1 [2] (v) Yes / hypothesis is correct / less rainfall reaches ground as density of vegetation cover increases – 1 mark reserve Least rainfall reaches ground OR lower reading in coniferous woodland / densest vegetation cover / wood with vegetation cover all year / higher readings in deciduous than coniferous woodland More rainfall reaches ground OR higher reading on bare ground / no vegetation cover / less rain reaches ground in deciduous woodland than bare ground 1 mark max for paired data comparing two vegetation types e.g. on day 14–2.9 mm in coniferous woodland and 17.8 mm on bare ground average for 14 days: 1.6 mm in coniferous woodland, 9.9 mm in deciduous woodland, 11.6 / 11.7 mm on bare ground (any 2 figures for 1 mark) lowest in coniferous woodland = 1.6 mm and lowest in bare ground = 12.8 mm Hypothesis conclusion is incorrect / partly correct no credit [4] www.theallpapers.com
Mark scheme, page 3
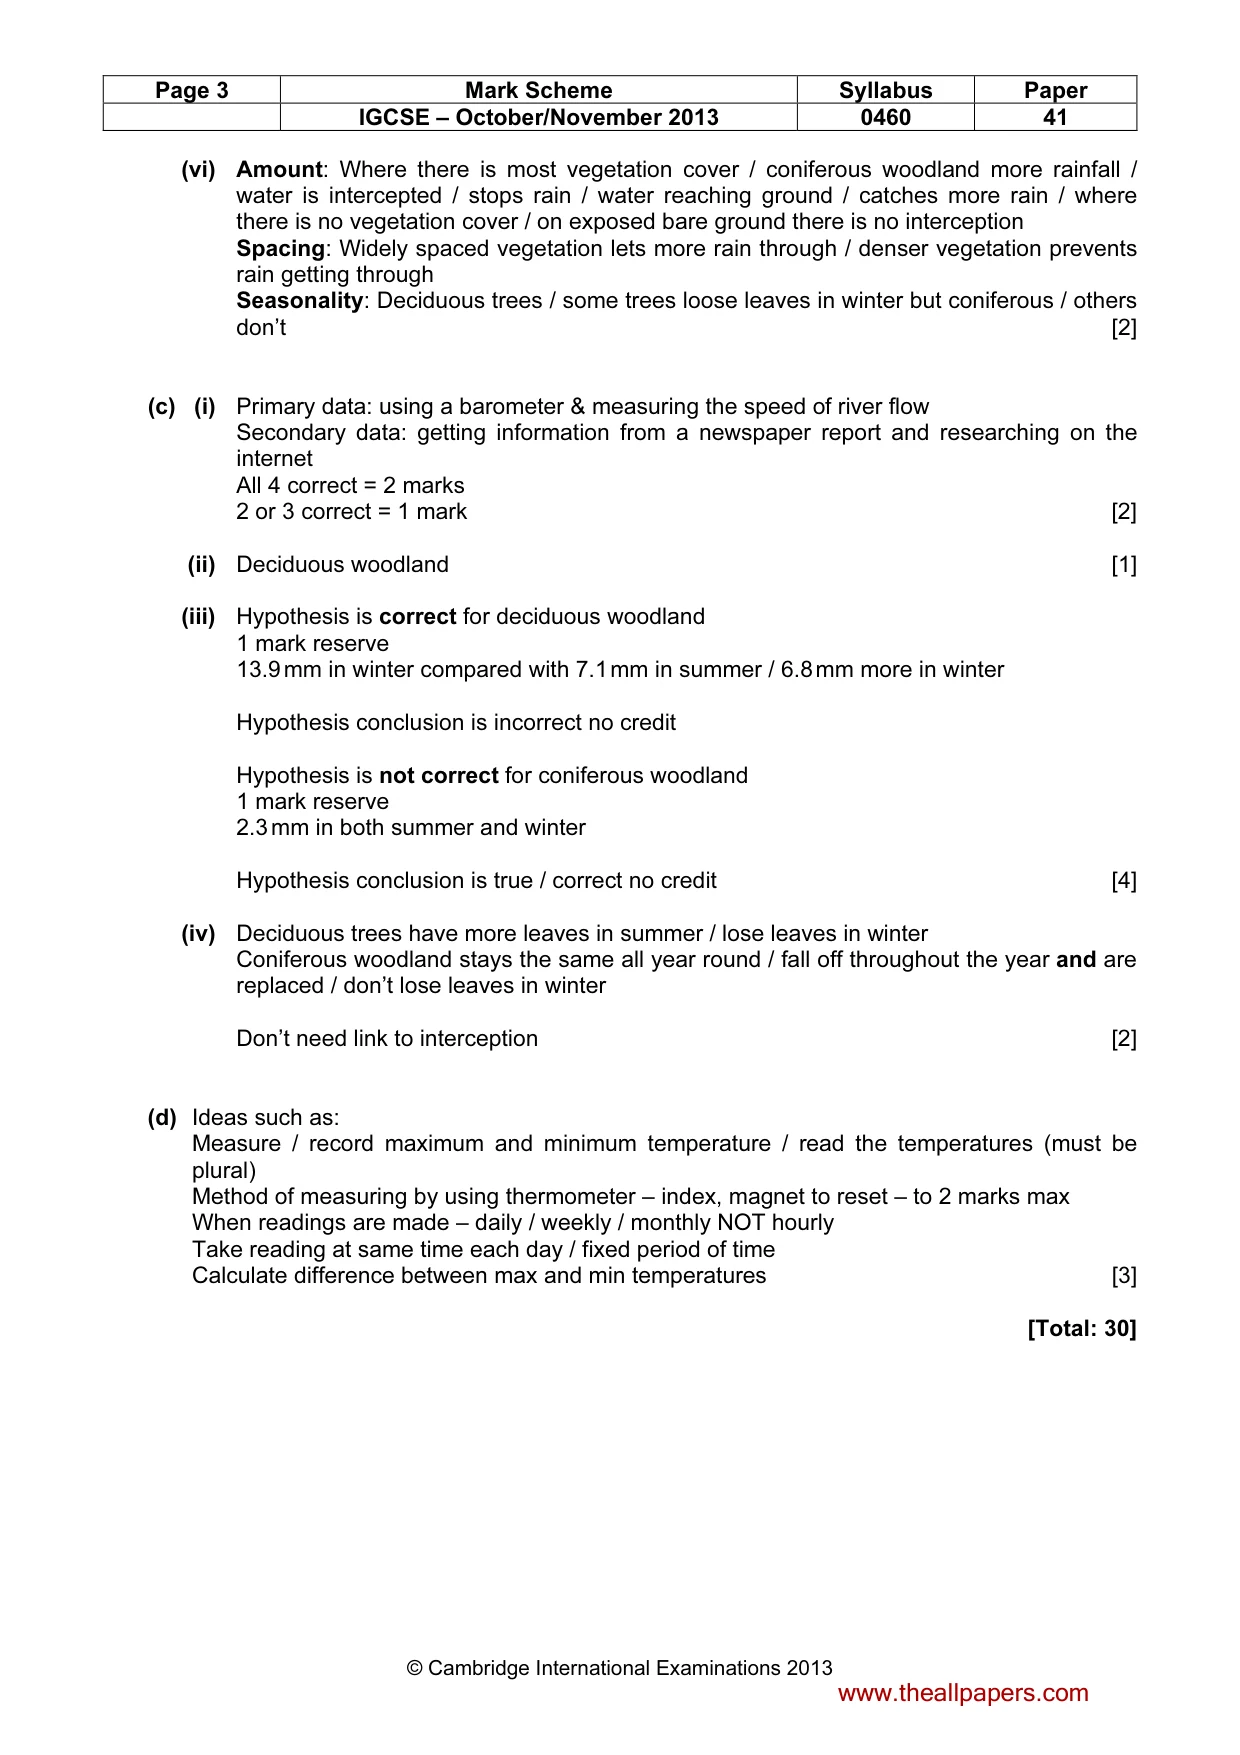
Page 3 Mark Scheme Syllabus Paper IGCSE – October/November 2013 0460 41 © Cambridge International Examinations 2013 (vi) Amount: Where there is most vegetation cover / coniferous woodland more rainfall / water is intercepted / stops rain / water reaching ground / catches more rain / where there is no vegetation cover / on exposed bare ground there is no interception Spacing: Widely spaced vegetation lets more rain through / denser vegetation prevents rain getting through Seasonality: Deciduous trees / some trees loose leaves in winter but coniferous / others don’t [2] (c) (i) Primary data: using a barometer & measuring the speed of river flow Secondary data: getting information from a newspaper report and researching on the internet All 4 correct = 2 marks 2 or 3 correct = 1 mark [2] (ii) Deciduous woodland [1] (iii) Hypothesis is correct for deciduous woodland 1 mark reserve 13.9 mm in winter compared with 7.1 mm in summer / 6.8 mm more in winter Hypothesis conclusion is incorrect no credit Hypothesis is not correct for coniferous woodland 1 mark reserve 2.3 mm in both summer and winter Hypothesis conclusion is true / correct no credit [4] (iv) Deciduous trees have more leaves in summer / lose leaves in winter Coniferous woodland stays the same all year round / fall off throughout the year and are replaced / don’t lose leaves in winter Don’t need link to interception [2] (d) Ideas such as: Measure / record maximum and minimum temperature / read the temperatures (must be plural) Method of measuring by using thermometer – index, magnet to reset – to 2 marks max When readings are made – daily / weekly / monthly NOT hourly Take reading at same time each day / fixed period of time Calculate difference between max and min temperatures [3] [Total: 30] www.theallpapers.com
Mark scheme, page 4
Page 4 Mark Scheme Syllabus Paper IGCSE – October/November 2013 0460 41 © Cambridge International Examinations 2013 2 (a) (i) Comparison may be implied from point of view of Questionnaire 2: Gives a scale of agreement / quantitative answer Includes gender Asks for age group information / age group rather than asking age / does not ask exact age Includes the purpose of the questionnaire / includes where student is from Tick boxes / options to choose from Fewer questions / all questions are relevant If answer from point of view of questionnaire 1 there must be direct comparison 3 @ 1 [3] (ii) Stratified / systematic / random – 1 mark reserve Stratified / Quota sampling – Get an appropriate gender balance; Get an appropriate age balance; Break population down into groups Systematic sampling – Ask people at regular intervals / pattern Ask every tenth person Random / Opportunity sampling – Ask the next person they meet / ask any person Random number tables to generate order to ask people [3] (iii) Why: People would be better equipped to answer Q 3 / talk about what they had done / have views about the day’s activities Waited until people have finished the day’s activities / will not disturb people whilst doing activities (1 mark maximum) [2] Disadvantage: People are tired at end of a busy day / cannot be bothered to answer questions People in a rush to set off for home May not get enough answers and too late to do anything about it Only visitors travelling by car will be surveyed / ignores visitors coming by train or bus or walking (1 mark maximum) [2] (b) (i) Pie graph – completion 1 mark (61–80 = 26%; more than 80 = 31%) 1 mark for dividing line; 1 mark for shading [2] (ii) Many / more / most visitors came from far away / least visitors come from nearby More visitors as distance increases Largest number / travelled more than 80 km Most visitors travelled less than 80 km Smallest number travelled less than 20 km Over half of the visitors travelled more than 60 km [2] www.theallpapers.com
Mark scheme, page 5
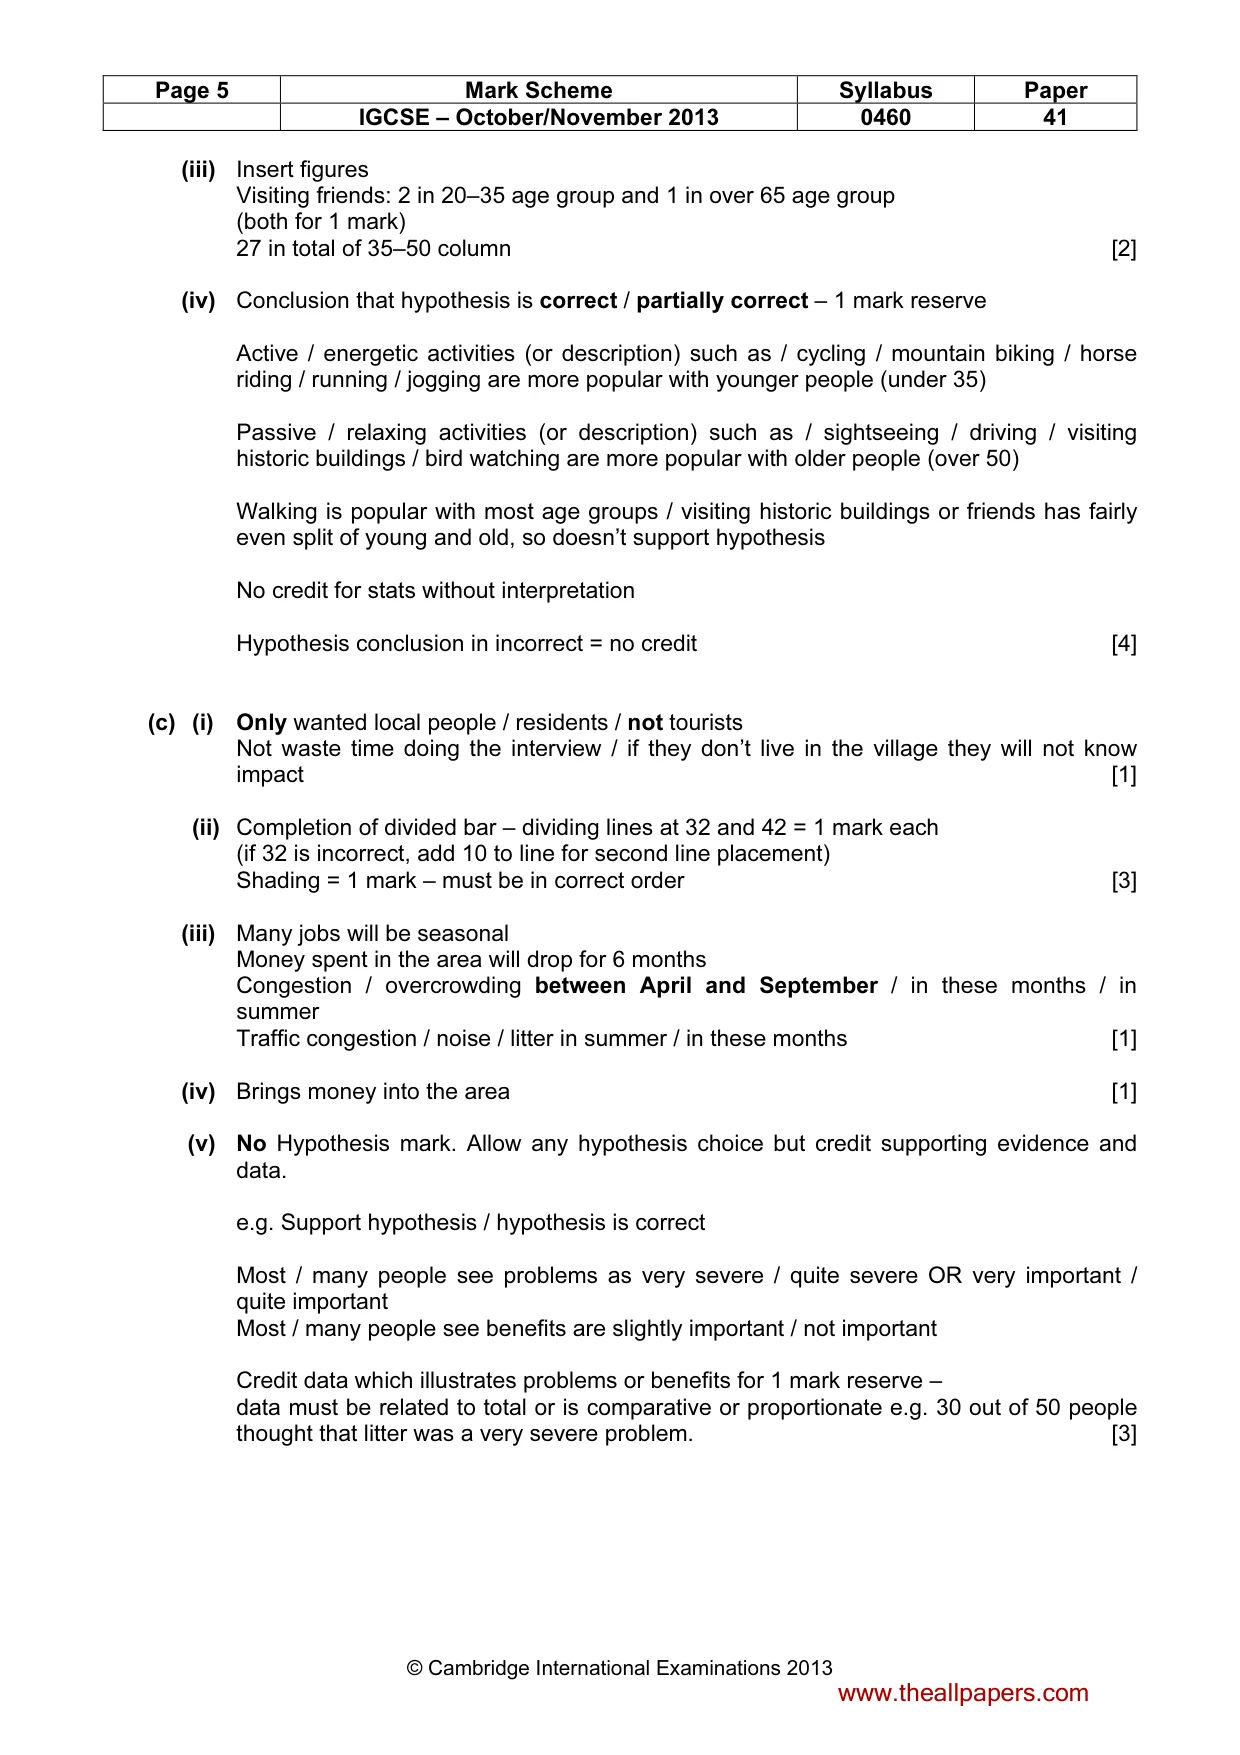
Page 5 Mark Scheme Syllabus Paper IGCSE – October/November 2013 0460 41 © Cambridge International Examinations 2013 (iii) Insert figures Visiting friends: 2 in 20–35 age group and 1 in over 65 age group (both for 1 mark) 27 in total of 35–50 column [2] (iv) Conclusion that hypothesis is correct / partially correct – 1 mark reserve Active / energetic activities (or description) such as / cycling / mountain biking / horse riding / running / jogging are more popular with younger people (under 35) Passive / relaxing activities (or description) such as / sightseeing / driving / visiting historic buildings / bird watching are more popular with older people (over 50) Walking is popular with most age groups / visiting historic buildings or friends has fairly even split of young and old, so doesn’t support hypothesis No credit for stats without interpretation Hypothesis conclusion in incorrect = no credit [4] (c) (i) Only wanted local people / residents / not tourists Not waste time doing the interview / if they don’t live in the village they will not know impact [1] (ii) Completion of divided bar – dividing lines at 32 and 42 = 1 mark each (if 32 is incorrect, add 10 to line for second line placement) Shading = 1 mark – must be in correct order [3] (iii) Many jobs will be seasonal Money spent in the area will drop for 6 months Congestion / overcrowding between April and September / in these months / in summer Traffic congestion / noise / litter in summer / in these months [1] (iv) Brings money into the area [1] (v) No Hypothesis mark. Allow any hypothesis choice but credit supporting evidence and data. e.g. Support hypothesis / hypothesis is correct Most / many people see problems as very severe / quite severe OR very important / quite important Most / many people see benefits are slightly important / not important Credit data which illustrates problems or benefits for 1 mark reserve – data must be related to total or is comparative or proportionate e.g. 30 out of 50 people thought that litter was a very severe problem. [3] www.theallpapers.com
Mark scheme, page 6
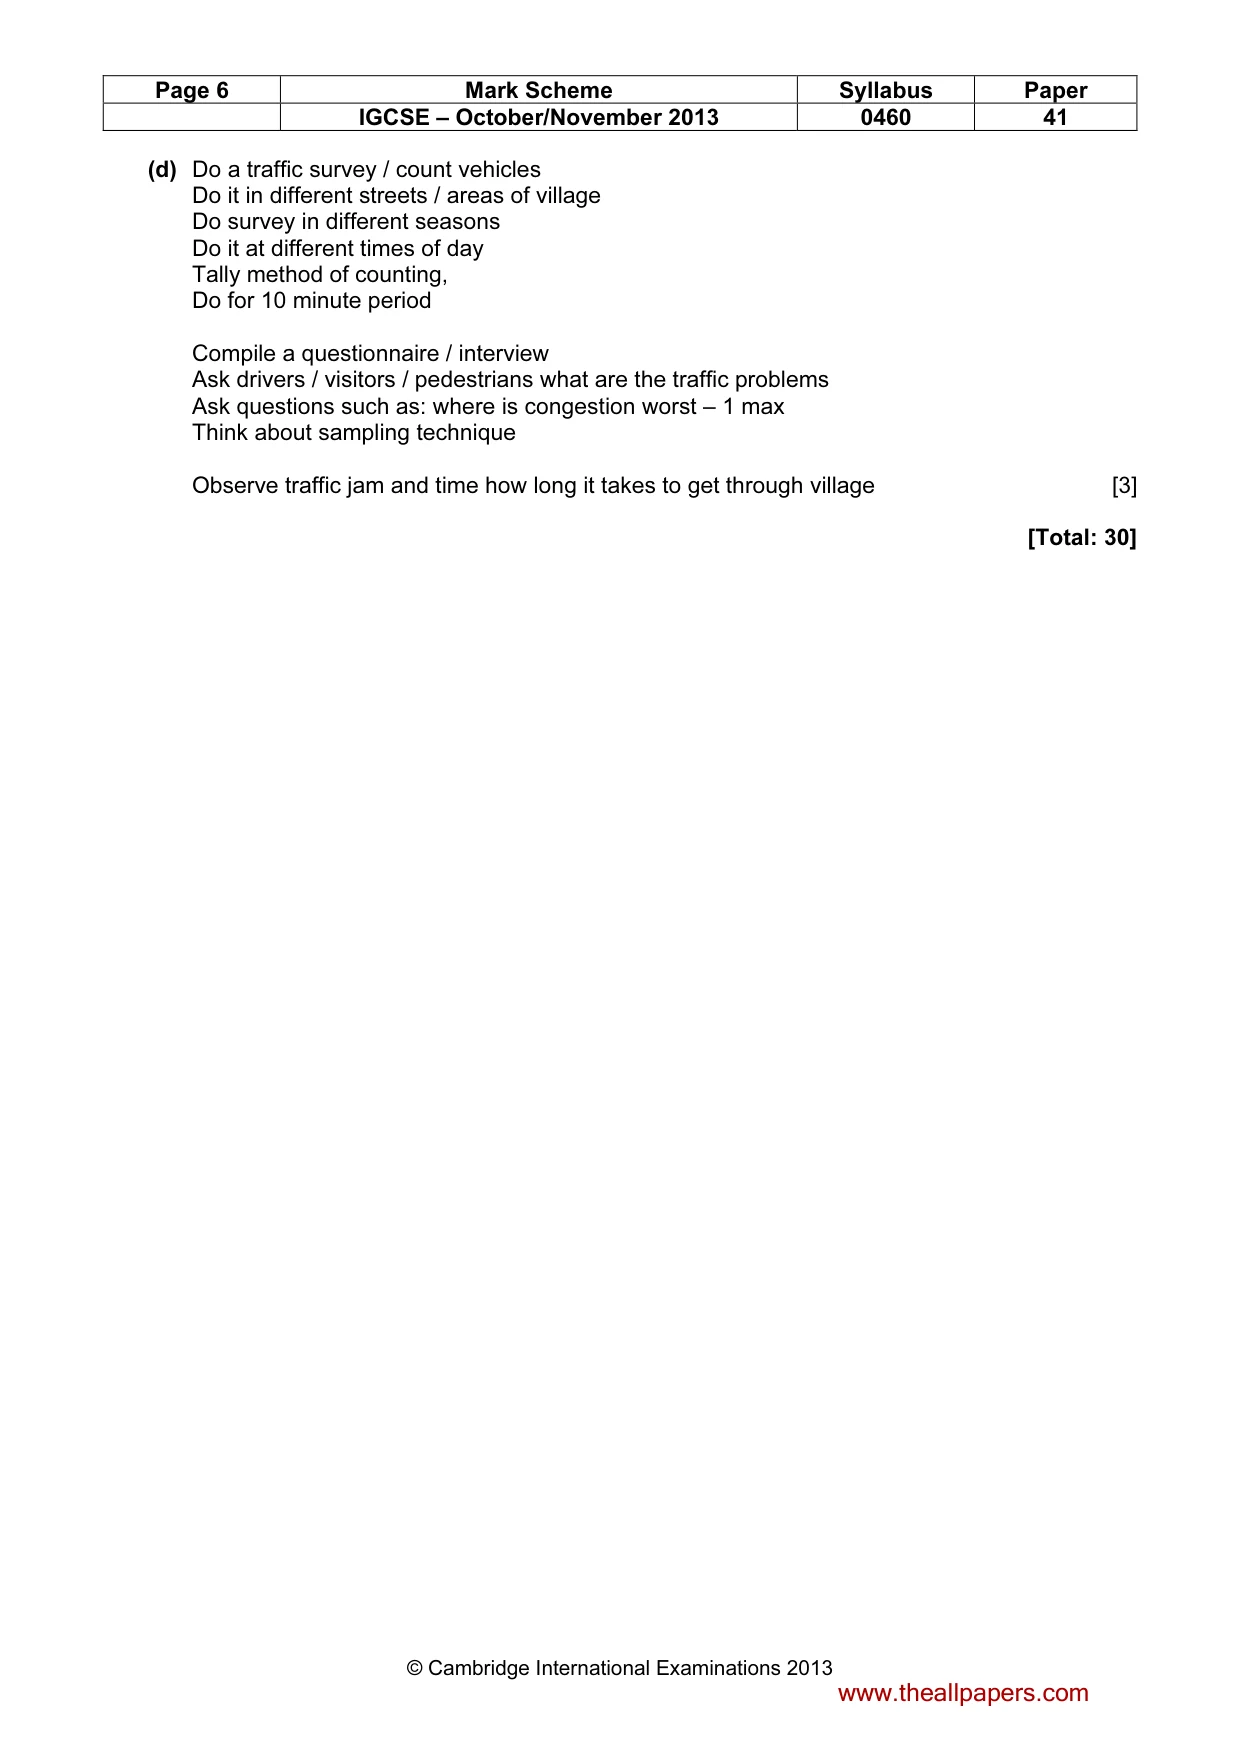
Page 6 Mark Scheme Syllabus Paper IGCSE – October/November 2013 0460 41 © Cambridge International Examinations 2013 (d) Do a traffic survey / count vehicles Do it in different streets / areas of village Do survey in different seasons Do it at different times of day Tally method of counting, Do for 10 minute period Compile a questionnaire / interview Ask drivers / visitors / pedestrians what are the traffic problems Ask questions such as: where is congestion worst – 1 max Think about sampling technique Observe traffic jam and time how long it takes to get through village [3] [Total: 30] www.theallpapers.com
What you needed in this session
Cambridge’s own grade thresholds for 2013 Oct/Nov, Paper 4 · Variant 1. A higher threshold means an easier paper — the bar moves with how the cohort did.