Cambridge IGCSE Geography 0460 — 2013 Oct/Nov Paper 4 · Variant 2
0460/42/O/N/13 · 60 marks · ≈68 min
The question paper and its mark scheme, free to read here and free to download. This is Cambridge’s own paper, exactly as it was sat.
Question paper16 pages


Mark scheme5 pages
Answers below. Sit the paper first if you are practising.
Paper as text
Question paper, page 1
This document consists of 14 printed pages, 2 blank pages and 1 Insert. DC (NF/JG) 66195/4 © UCLES 2013 [Turn over UNIVERSITY OF CAMBRIDGE INTERNATIONAL EXAMINATIONS International General Certificate of Secondary Education * 5 8 0 1 3 1 1 2 1 6 * GEOGRAPHY 0460/42 Paper 4 Alternative to Coursework October/November 2013 1 hour 30 minutes Candidates answer on the Question Paper. Additional Materials: Ruler Calculator READ THESE INSTRUCTIONS FIRST Write your Centre number, candidate number and name in the spaces provided. Write in dark blue or black pen. You may use a soft pencil for any diagrams, graphs or rough working. Do not use staples, paper clips, highlighters, glue or correction fluid. DO NOT WRITE ON ANY BARCODES. Answer all questions. The Insert contains Fig. 1, Table 1 and Photograph A for Question 1, and Figs 5 and 6 and Table 3 for Question 2. The Insert is not required by the Examiner. Sketch maps and diagrams should be drawn whenever they serve to illustrate an answer. At the end of the examination, fasten all your work securely together. The number of marks is given in brackets [ ] at the end of each question or part question. For Examiner’s Use Q1 Q2 Total www.theallpapers.com
Question paper, page 2
2 0460/42/O/N/13 © UCLES 2013 BLANK PAGE www.theallpapers.com
Question paper, page 3
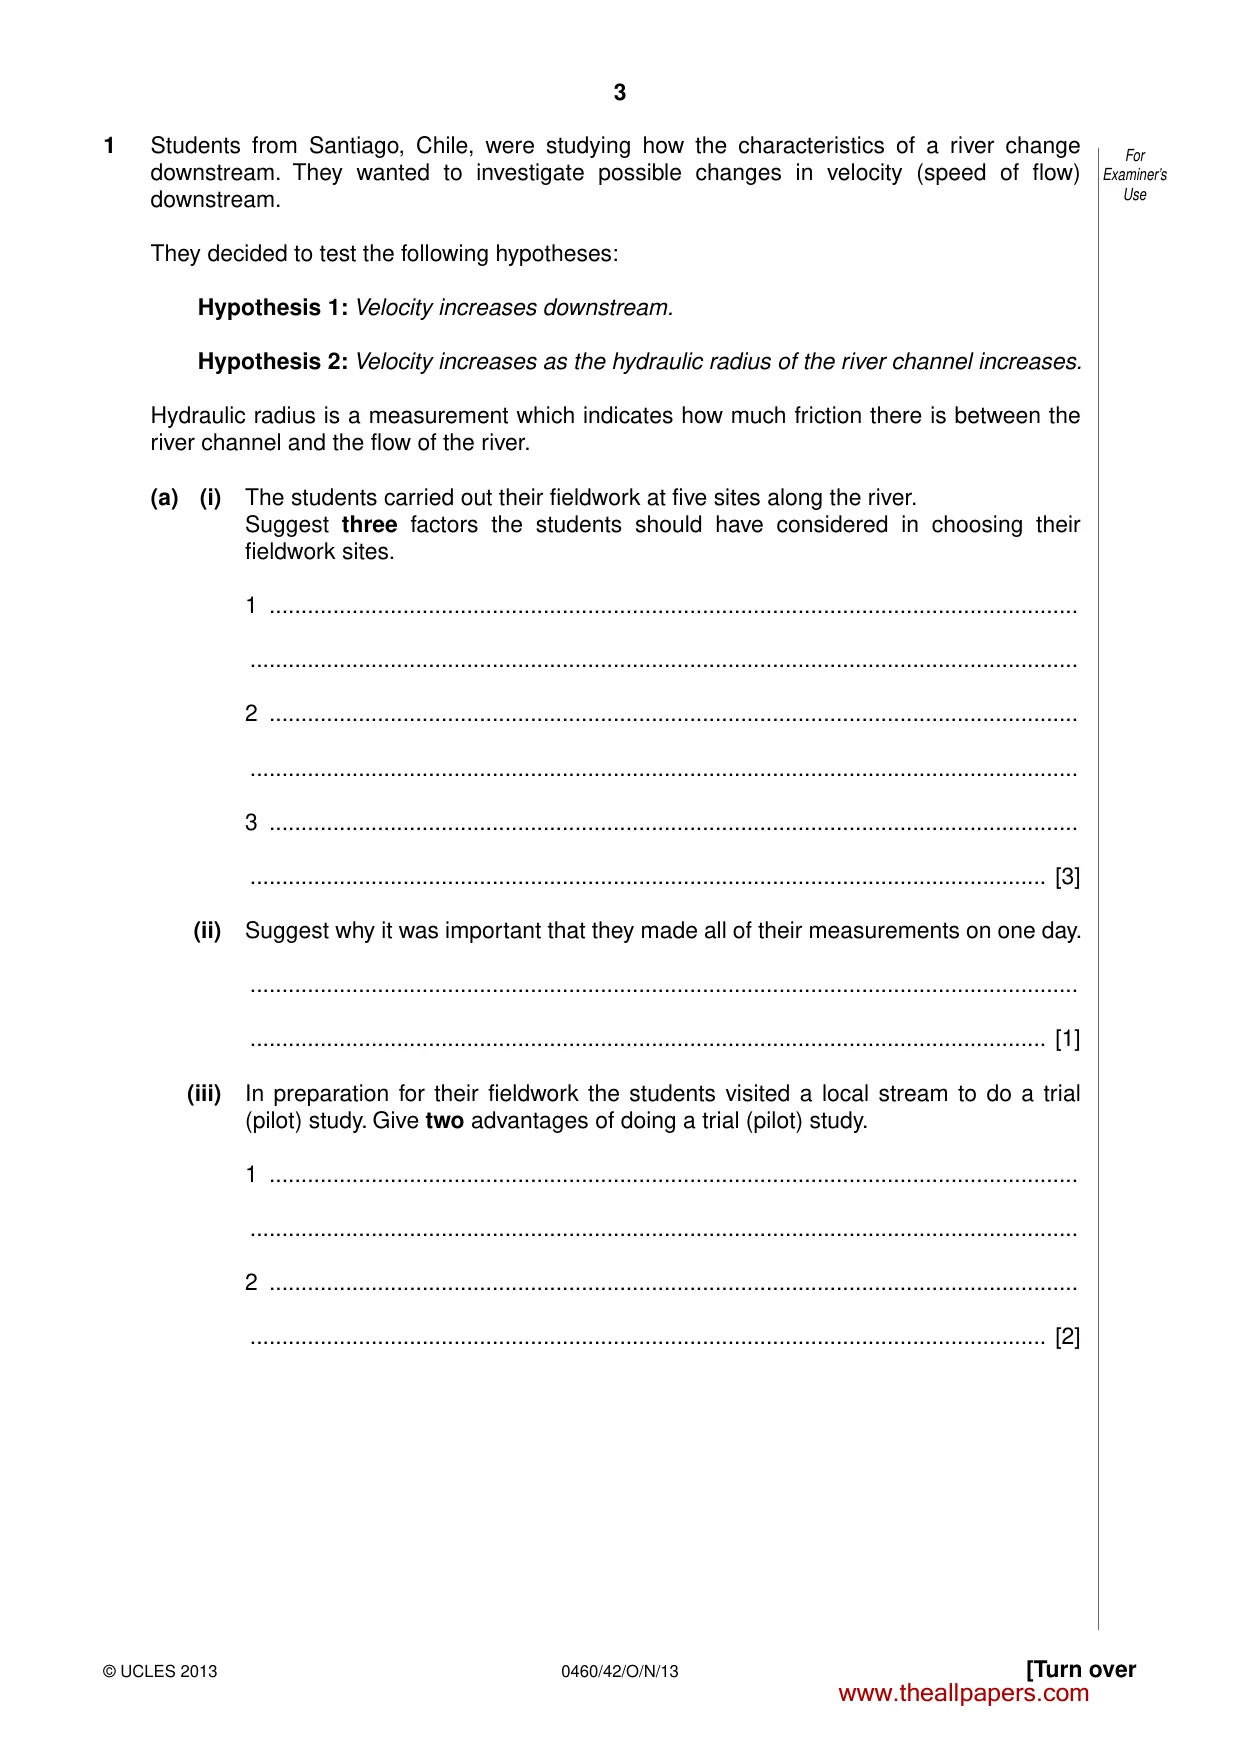
3 0460/42/O/N/13 © UCLES 2013 [Turn over For Examiner’s Use 1 Students from Santiago, Chile, were studying how the characteristics of a river change downstream. They wanted to investigate possible changes in velocity (speed of flow) downstream. They decided to test the following hypotheses: Hypothesis 1: Velocity increases downstream. Hypothesis 2: Velocity increases as the hydraulic radius of the river channel increases. Hydraulic radius is a measurement which indicates how much friction there is between the river channel and the flow of the river. (a) (i) The students carried out their fieldwork at five sites along the river. Suggest three factors the students should have considered in choosing their fieldwork sites. 1 … … 2 … … 3 … … [3] (ii) Suggest why it was important that they made all of their measurements on one day. … … [1] (iii) In preparation for their fieldwork the students visited a local stream to do a trial (pilot) study. Give two advantages of doing a trial (pilot) study. 1 … … 2 … … [2] www.theallpapers.com
Question paper, page 4
4 0460/42/O/N/13 © UCLES 2013 For Examiner’s Use (b) (i) Fig. 1 (Insert) is a student sketch which shows their method of measuring velocity. Describe the method shown. … … … … … … [3] (ii) Another way to measure velocity is by using a flowmeter. Describe how this is done. … … … … … … [3] www.theallpapers.com
Question paper, page 5
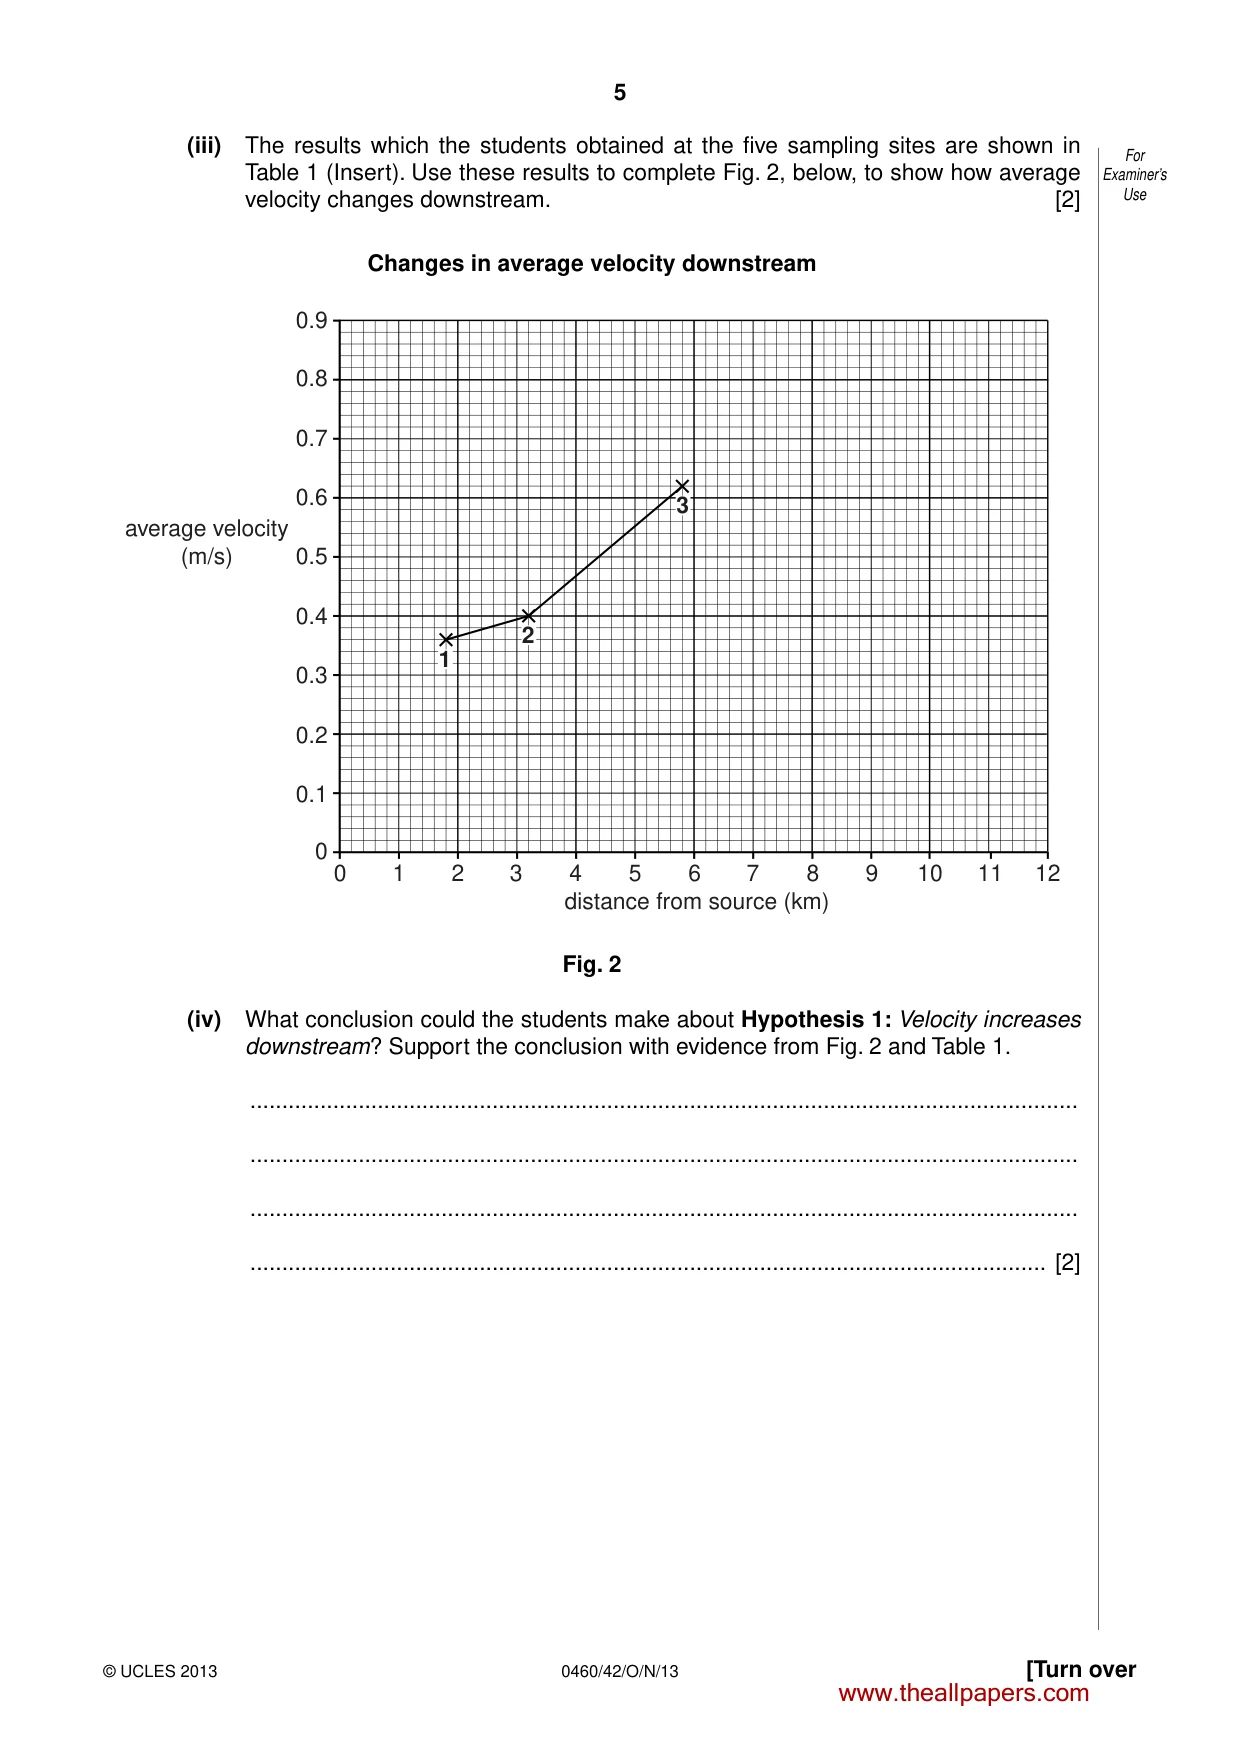
5 0460/42/O/N/13 © UCLES 2013 [Turn over For Examiner’s Use (iii) The results which the students obtained at the five sampling sites are shown in Table 1 (Insert). Use these results to complete Fig. 2, below, to show how average velocity changes downstream. [2] Changes in average velocity downstream 0.9 0.8 0.7 0.6 0.5 0.4 0.3 0.2 0.1 0 0 1 2 3 4 5 6 7 8 9 10 11 12 average velocity (m/s) distance from source (km) 3 2 1 Fig. 2 (iv) What conclusion could the students make about Hypothesis 1: Velocity increases downstream? Support the conclusion with evidence from Fig. 2 and Table 1. … … … … [2] www.theallpapers.com
Question paper, page 6
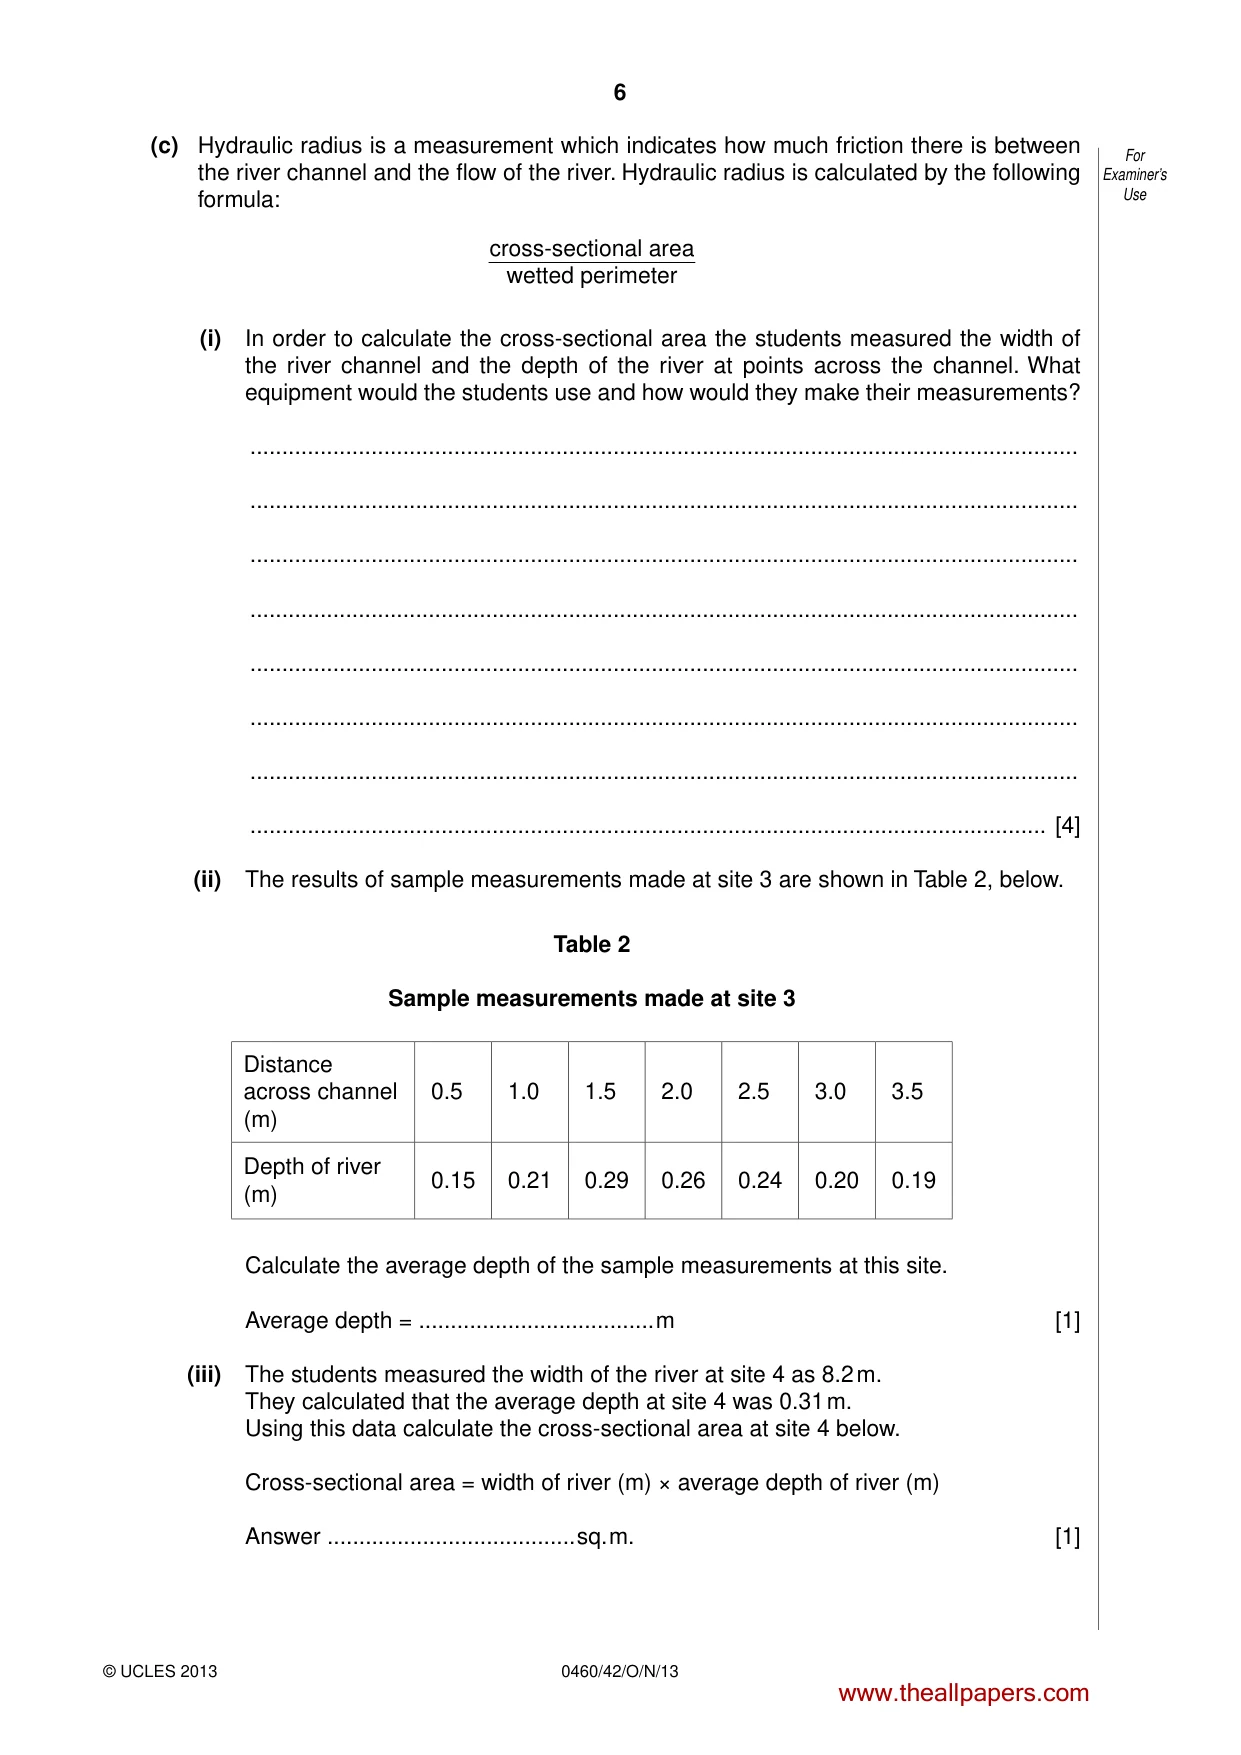
6 0460/42/O/N/13 © UCLES 2013 For Examiner’s Use (c) Hydraulic radius is a measurement which indicates how much friction there is between the river channel and the flow of the river. Hydraulic radius is calculated by the following formula: cross-sectional area wetted perimeter (i) In order to calculate the cross-sectional area the students measured the width of the river channel and the depth of the river at points across the channel. What equipment would the students use and how would they make their measurements? … … … … … … … … [4] (ii) The results of sample measurements made at site 3 are shown in Table 2, below. Table 2 Sample measurements made at site 3 Distance across channel (m) 0.51 1.01 1.51 2.01 2.51 3.01 3.51 Depth of river (m) 0.15 0.21 0.29 0.26 0.24 0.20 0.19 Calculate the average depth of the sample measurements at this site. Average depth = … m [1] (iii) The students measured the width of the river at site 4 as 8.2 m. They calculated that the average depth at site 4 was 0.31 m. Using this data calculate the cross-sectional area at site 4 below. Cross-sectional area = width of river (m) × average depth of river (m) Answer … sq. m. [1] www.theallpapers.com
Question paper, page 7
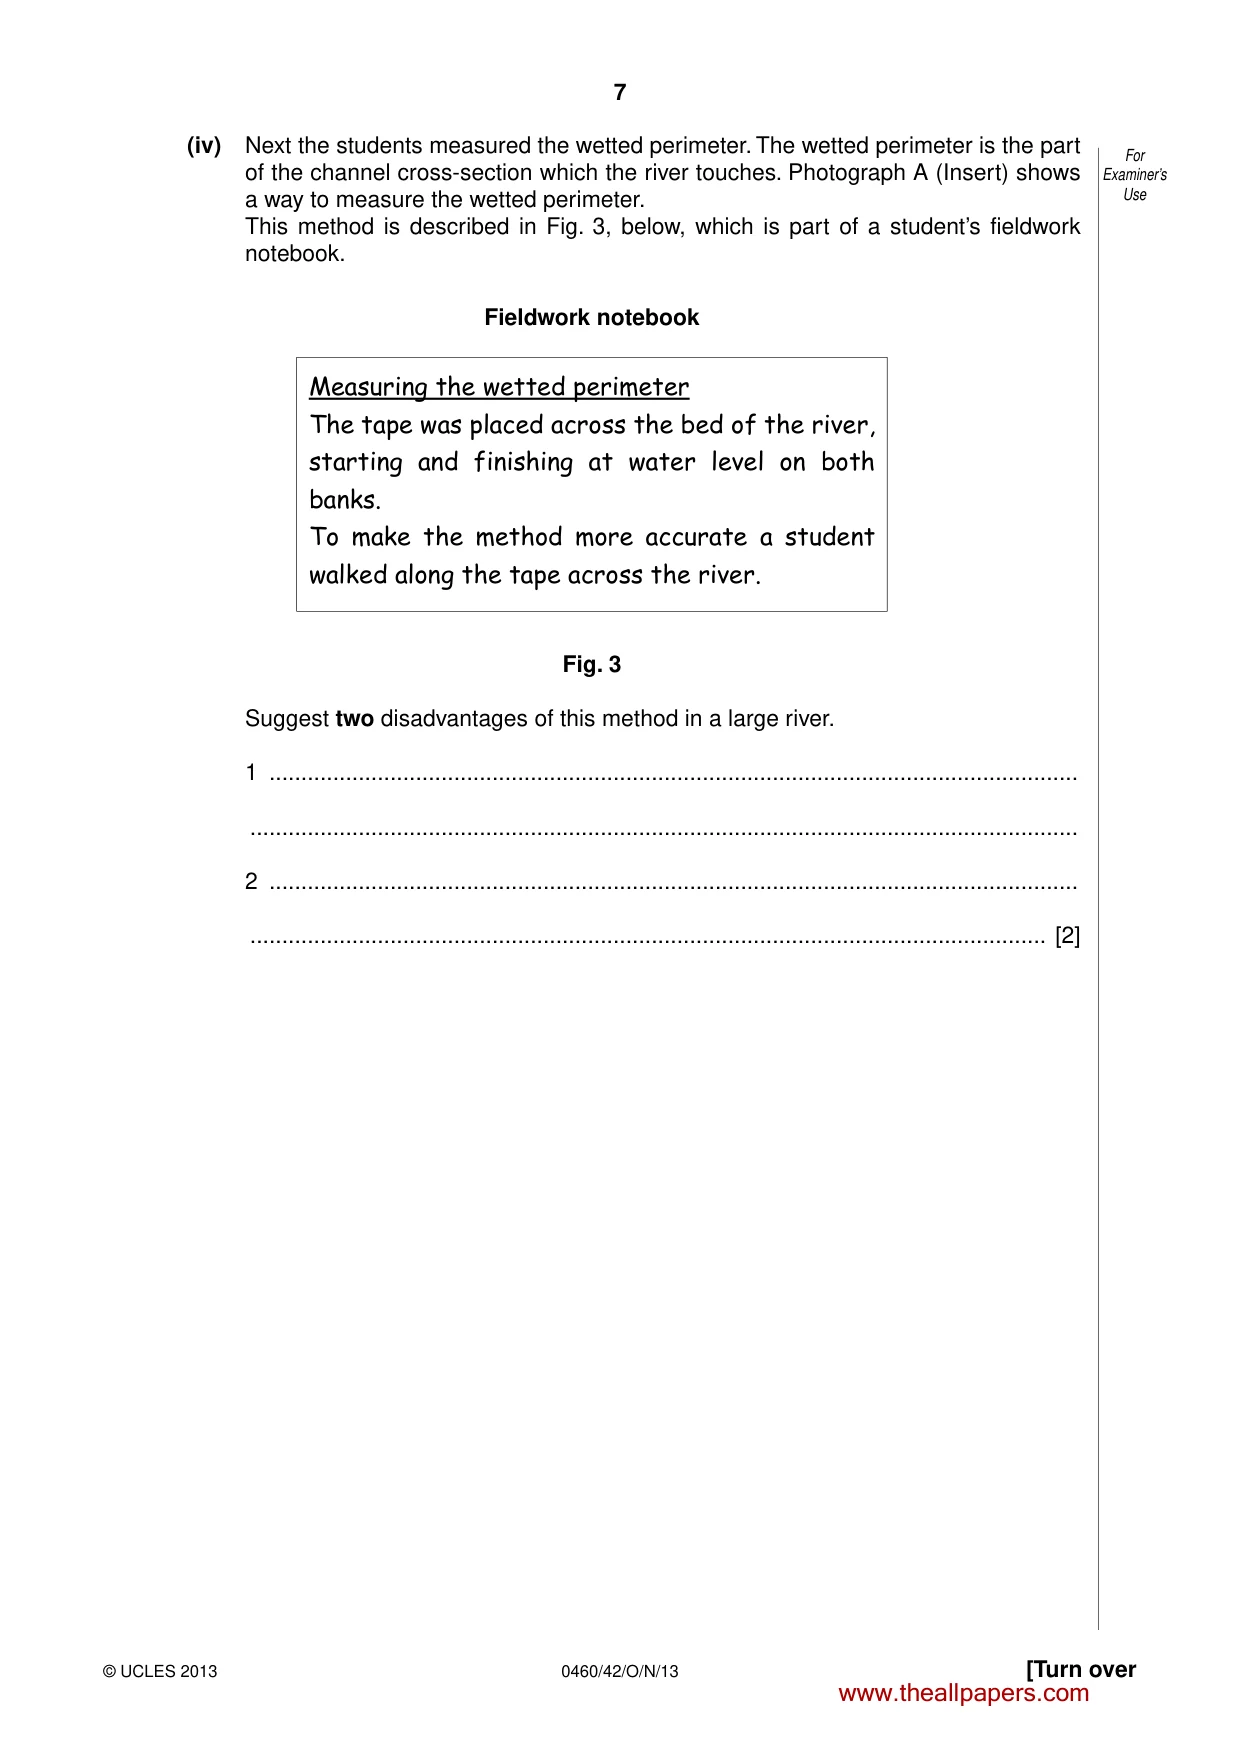
7 0460/42/O/N/13 © UCLES 2013 [Turn over For Examiner’s Use (iv) Next the students measured the wetted perimeter. The wetted perimeter is the part of the channel cross-section which the river touches. Photograph A (Insert) shows a way to measure the wetted perimeter. This method is described in Fig. 3, below, which is part of a student’s fieldwork notebook. Fieldwork notebook Measuring the wetted perimeter The tape was placed across the bed of the river, starting and finishing at water level on both banks. To make the method more accurate a student walked along the tape across the river. Fig. 3 Suggest two disadvantages of this method in a large river. 1 … … 2 … … [2] www.theallpapers.com
Question paper, page 8
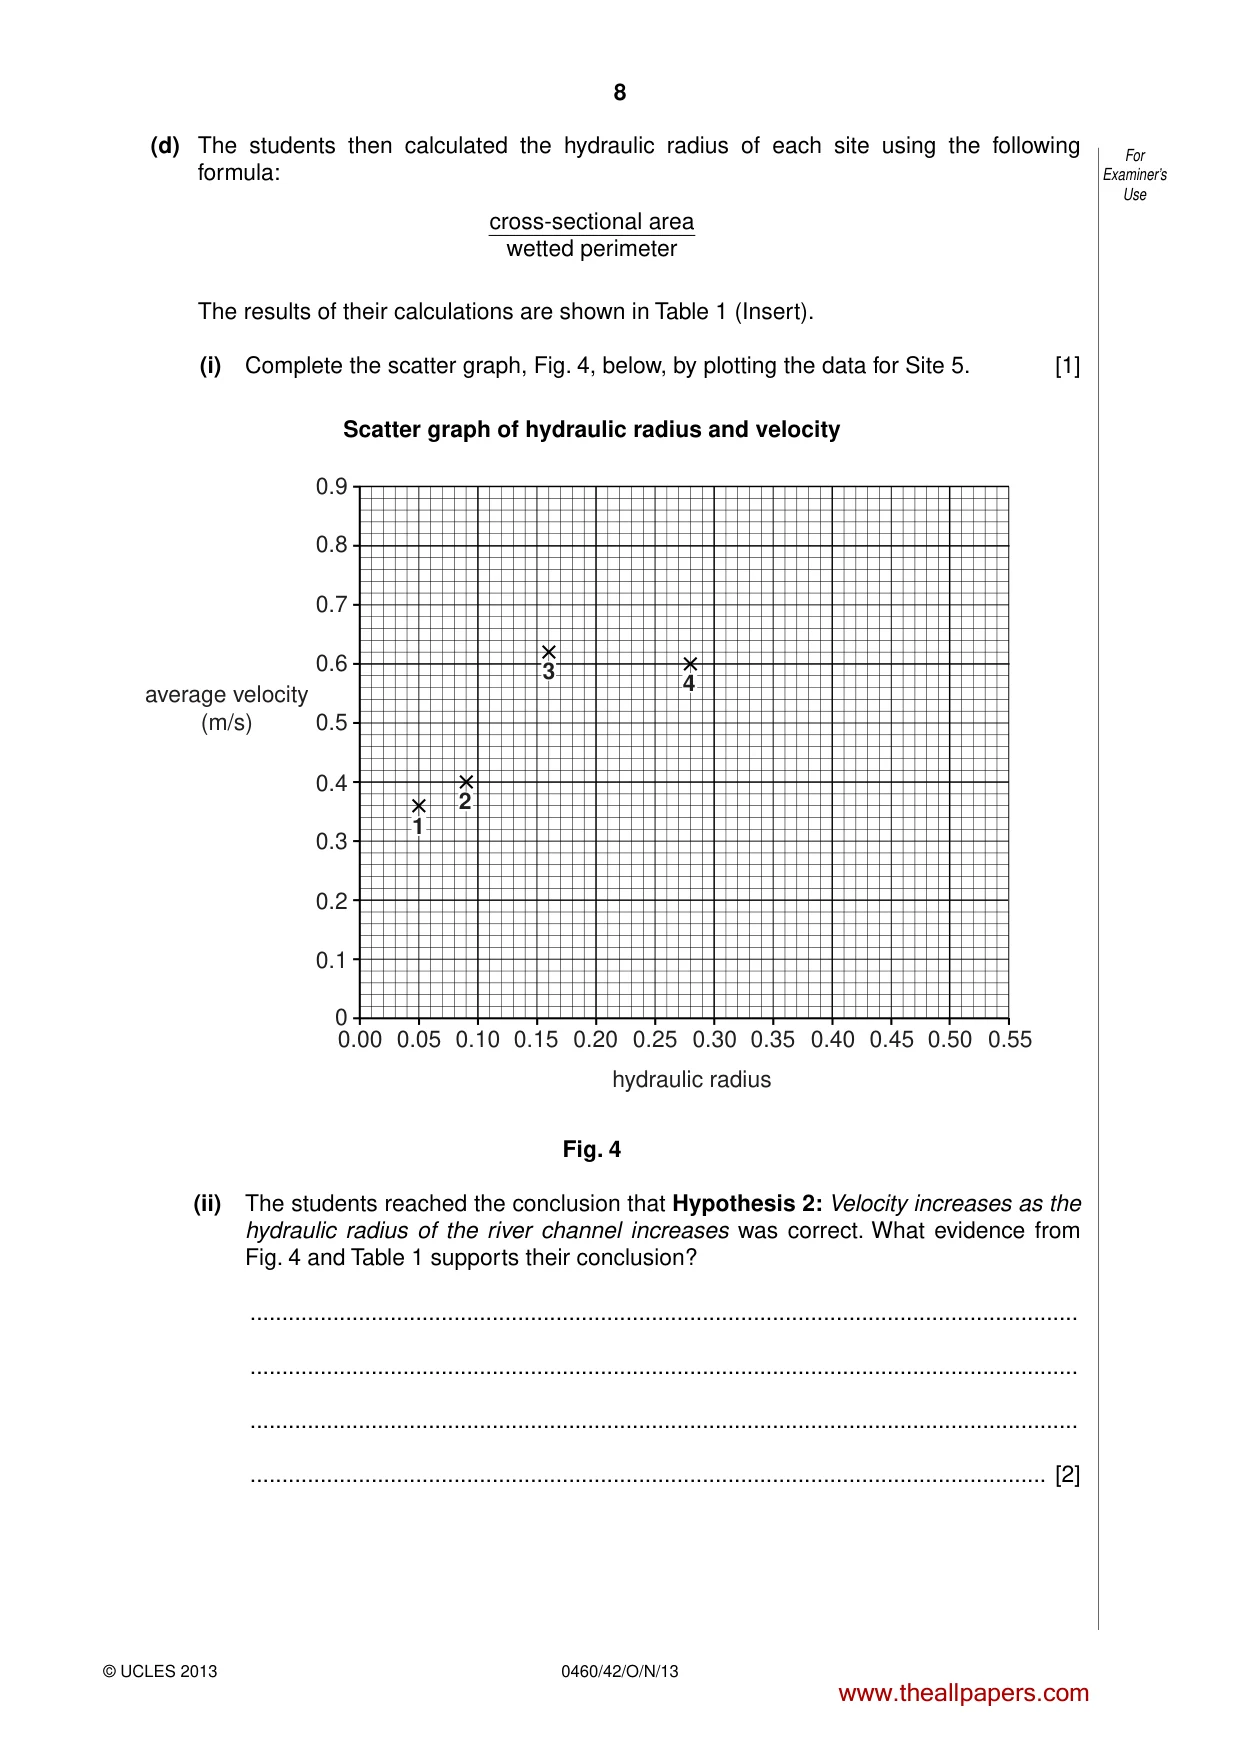
8 0460/42/O/N/13 © UCLES 2013 For Examiner’s Use (d) The students then calculated the hydraulic radius of each site using the following formula: cross-sectional area wetted perimeter The results of their calculations are shown in Table 1 (Insert). (i) Complete the scatter graph, Fig. 4, below, by plotting the data for Site 5. [1] Scatter graph of hydraulic radius and velocity 0.9 0.8 0.7 0.6 0.5 0.4 0.3 0.2 0.1 0 0.00 0.05 0.10 0.15 0.20 0.25 0.30 0.35 0.40 0.45 0.50 0.55 average velocity (m/s) hydraulic radius 3 4 2 1 Fig. 4 (ii) The students reached the conclusion that Hypothesis 2: Velocity increases as the hydraulic radius of the river channel increases was correct. What evidence from Fig. 4 and Table 1 supports their conclusion? … … … … [2] www.theallpapers.com
Question paper, page 9
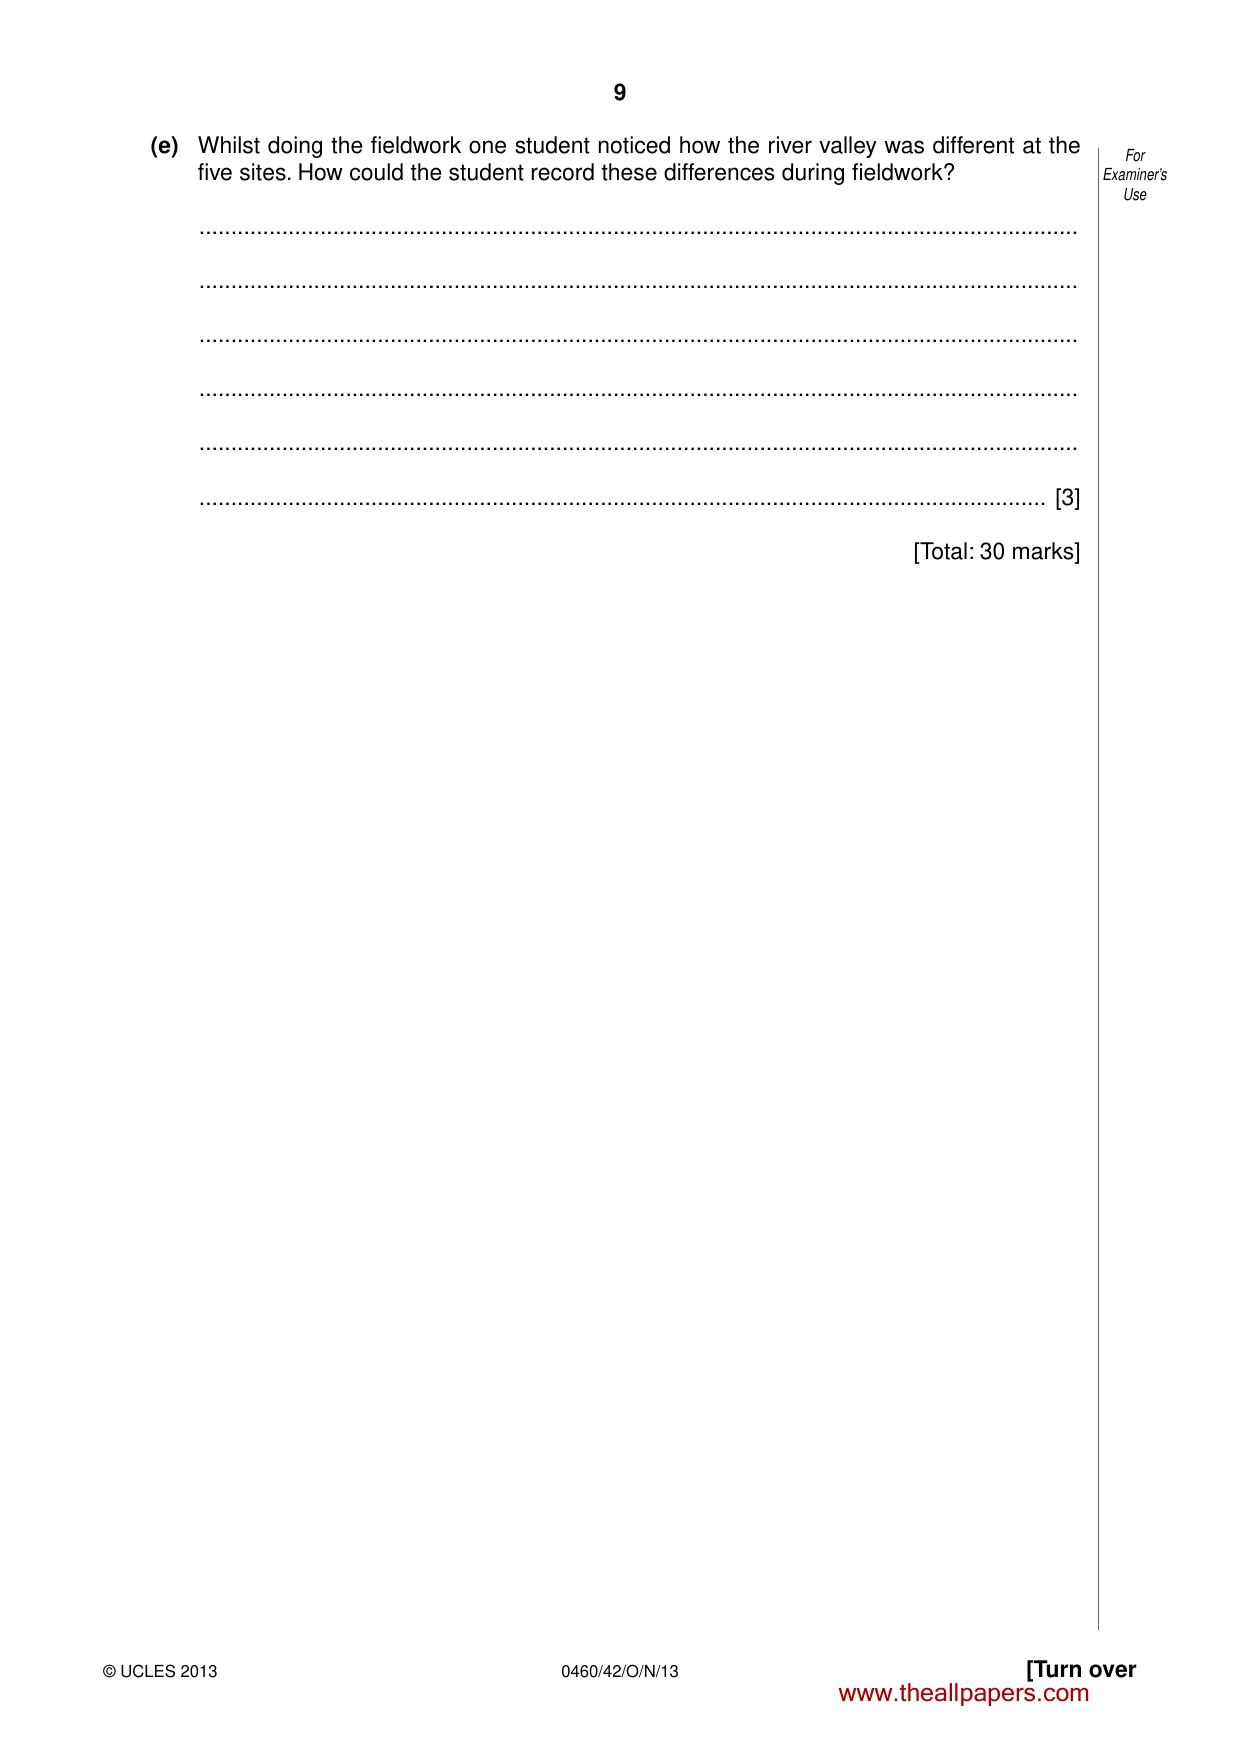
9 0460/42/O/N/13 © UCLES 2013 [Turn over For Examiner’s Use (e) Whilst doing the fieldwork one student noticed how the river valley was different at the five sites. How could the student record these differences during fieldwork? … … … … … … [3] [Total: 30 marks] www.theallpapers.com
Question paper, page 10
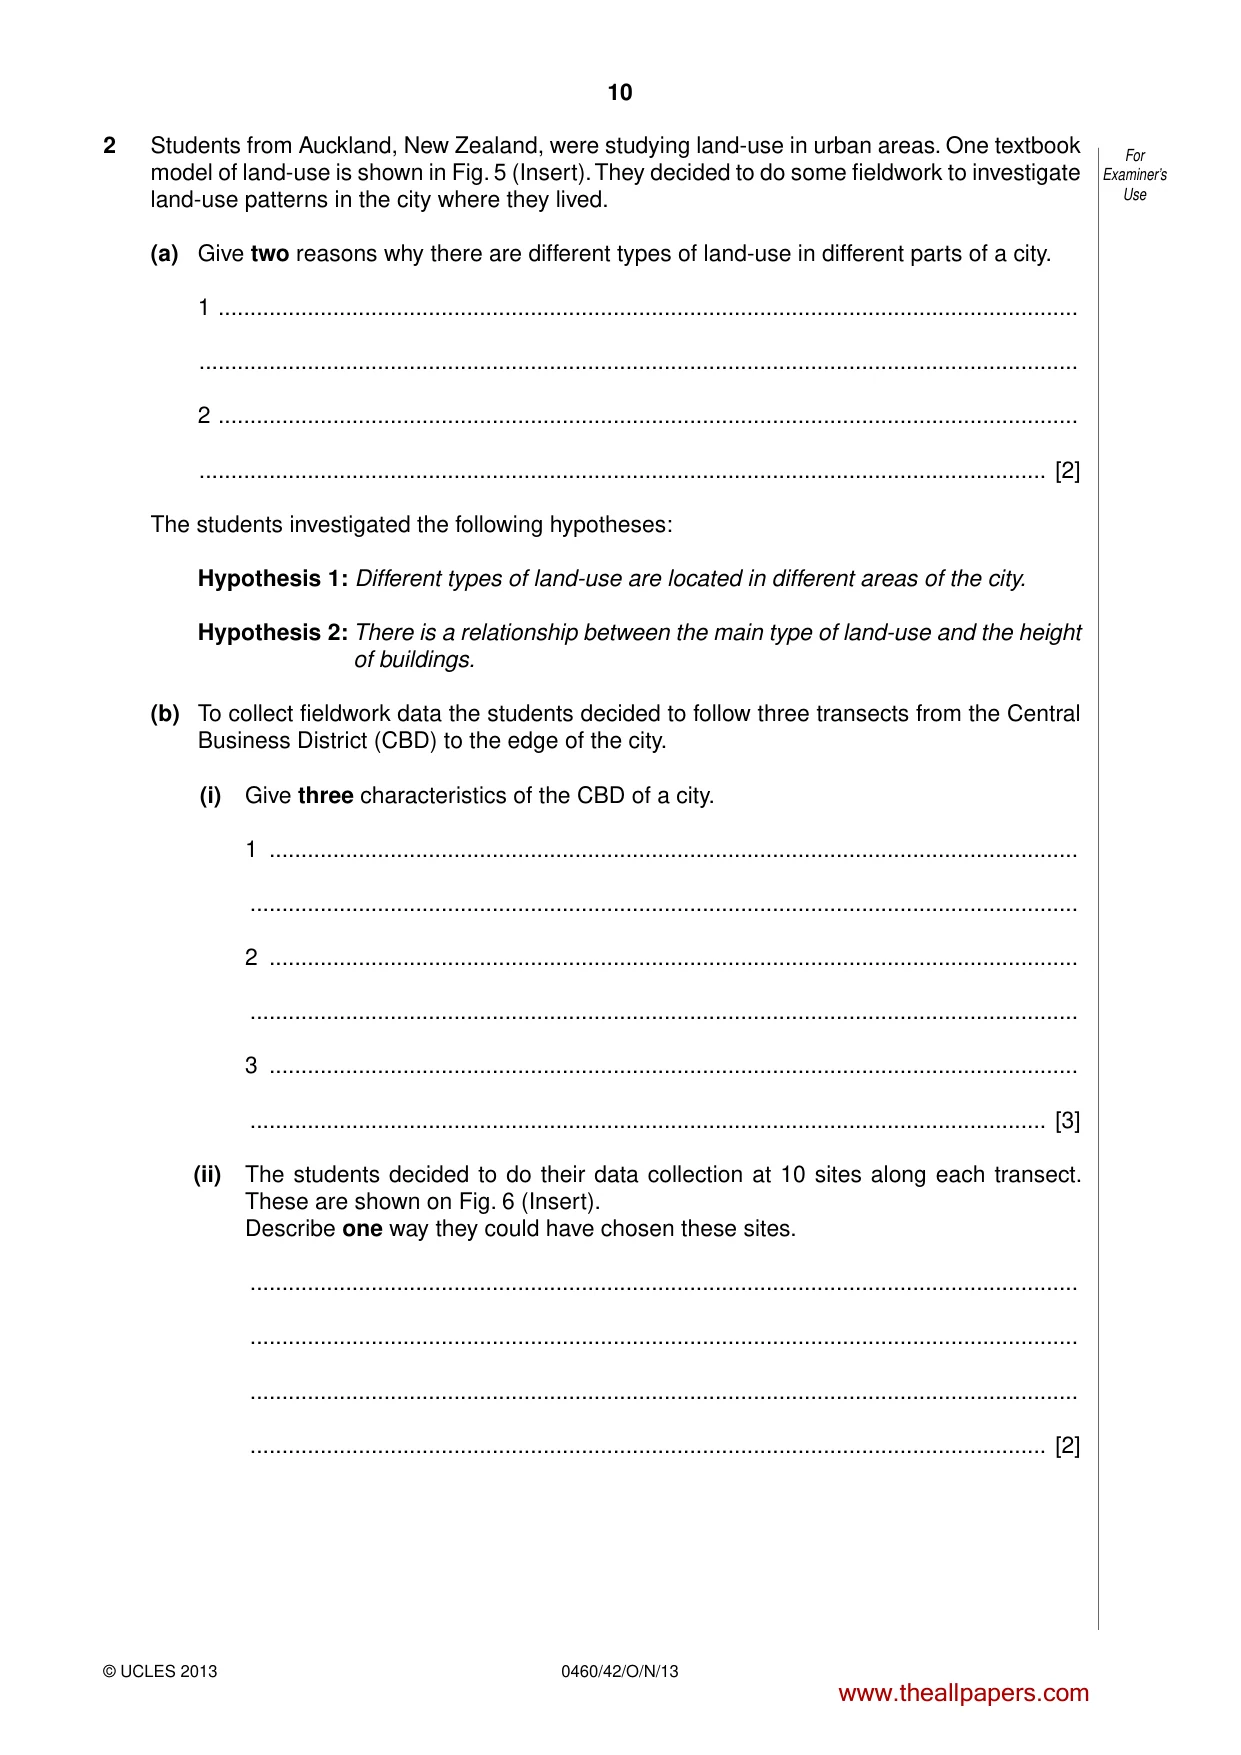
10 0460/42/O/N/13 © UCLES 2013 For Examiner’s Use 2 Students from Auckland, New Zealand, were studying land-use in urban areas. One textbook model of land-use is shown in Fig. 5 (Insert). They decided to do some fieldwork to investigate land-use patterns in the city where they lived. (a) Give two reasons why there are different types of land-use in different parts of a city. 1 … … 2 … … [2] The students investigated the following hypotheses: Hypothesis 1: Different types of land-use are located in different areas of the city. Hypothesis 2: There is a relationship between the main type of land-use and the height of buildings. (b) To collect fieldwork data the students decided to follow three transects from the Central Business District (CBD) to the edge of the city. (i) Give three characteristics of the CBD of a city. 1 … … 2 … … 3 … … [3] (ii) The students decided to do their data collection at 10 sites along each transect. These are shown on Fig. 6 (Insert). Describe one way they could have chosen these sites. … … … … [2] www.theallpapers.com
Question paper, page 11
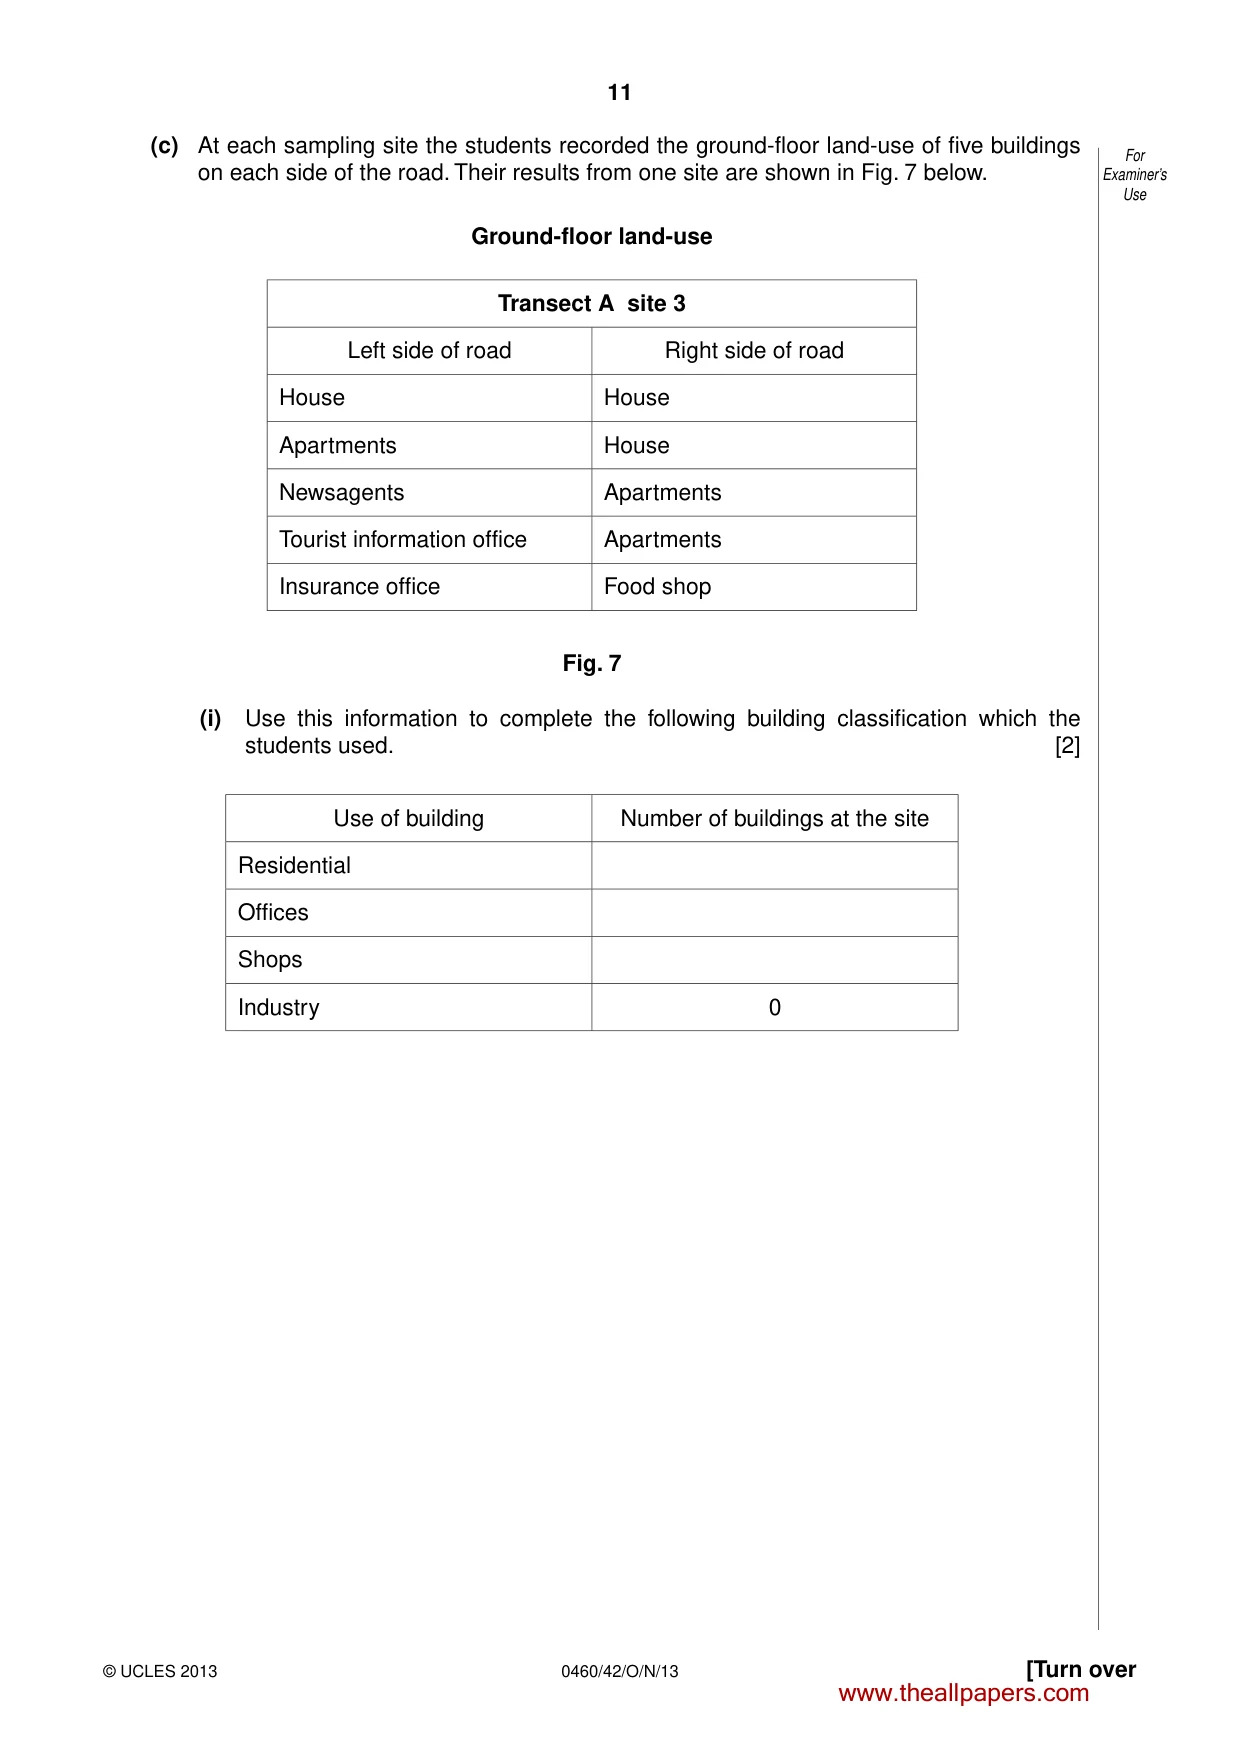
11 0460/42/O/N/13 © UCLES 2013 [Turn over For Examiner’s Use (c) At each sampling site the students recorded the ground-floor land-use of five buildings on each side of the road. Their results from one site are shown in Fig. 7 below. Ground-floor land-use Transect A site 3 Left side of road Right side of road House House Apartments House Newsagents Apartments Tourist information office Apartments Insurance office Food shop Fig. 7 (i) Use this information to complete the following building classification which the students used. [2] Use of building Number of buildings at the site Residential Offices Shops Industry 0 www.theallpapers.com
Question paper, page 12
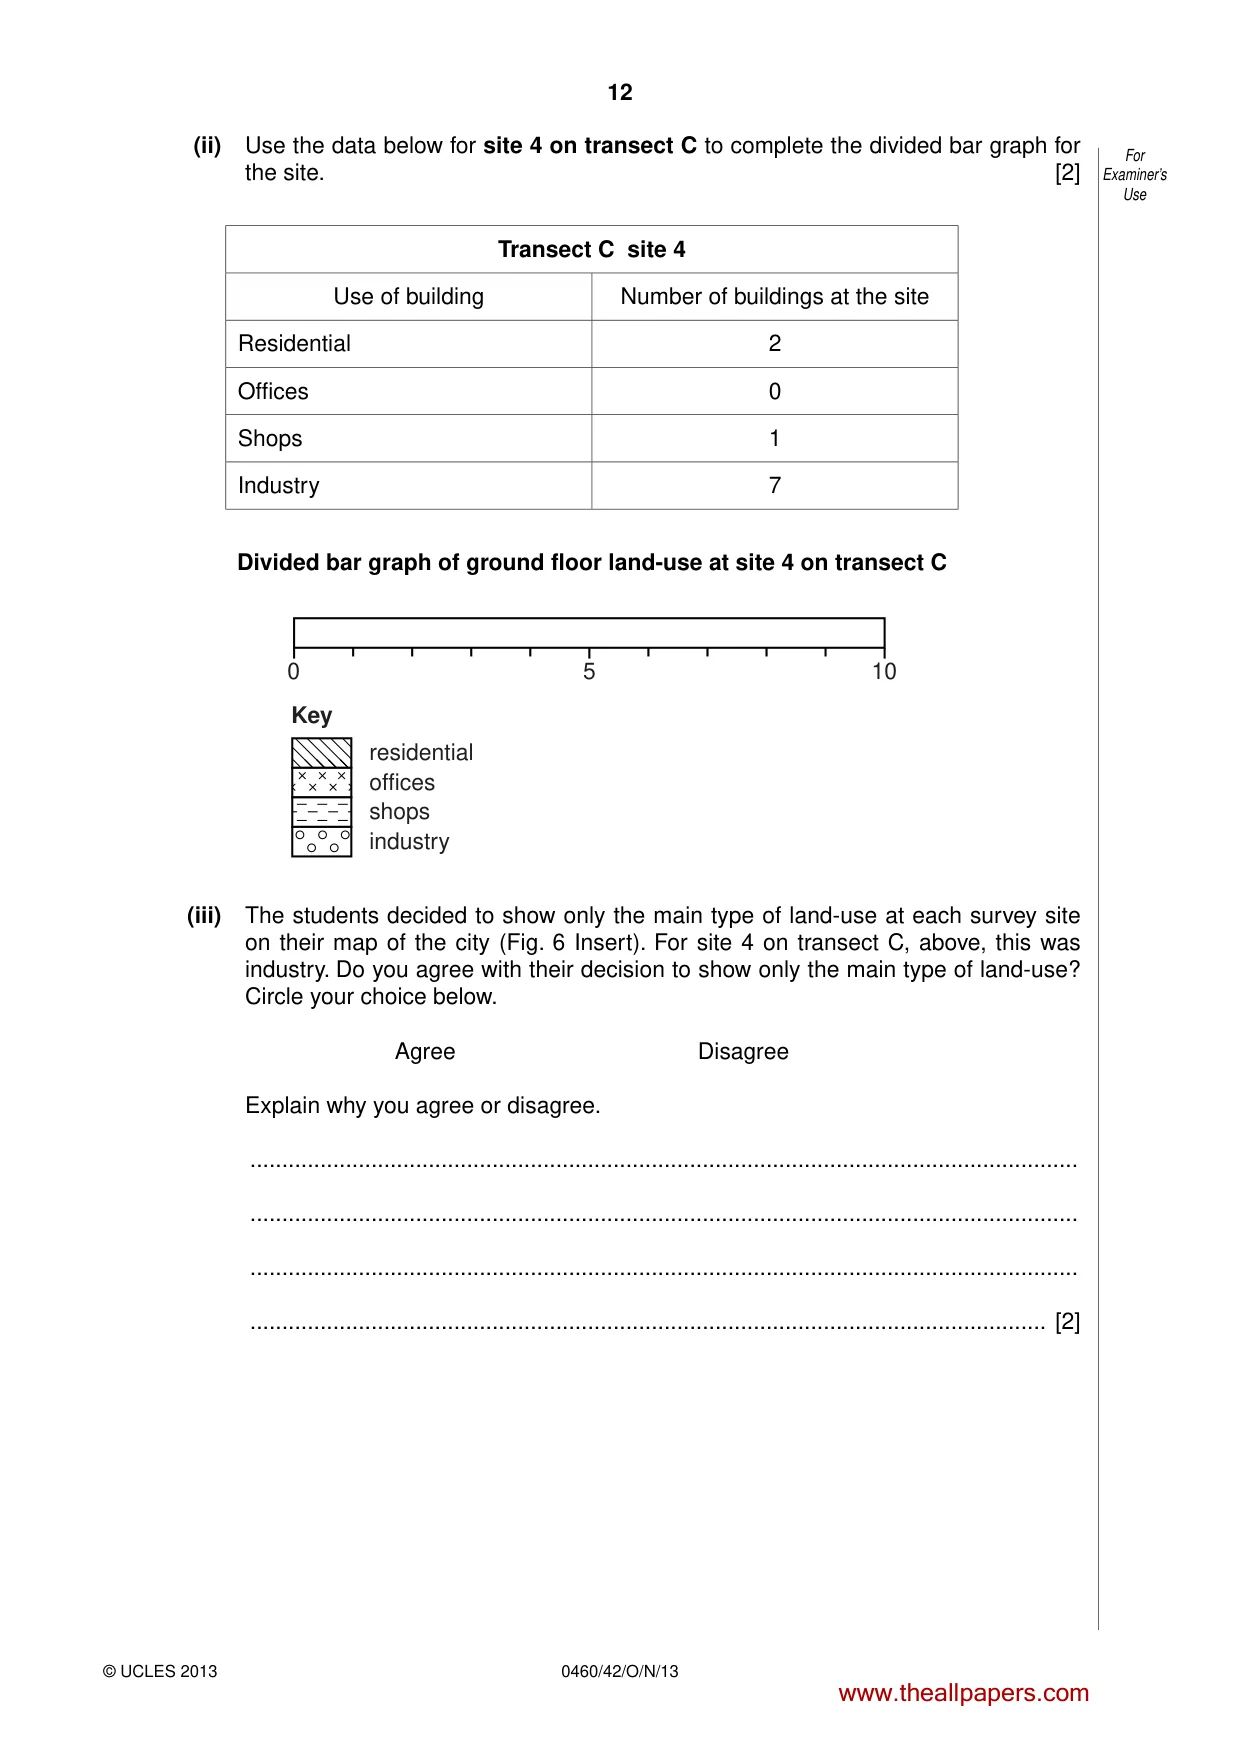
12 0460/42/O/N/13 © UCLES 2013 For Examiner’s Use (ii) Use the data below for site 4 on transect C to complete the divided bar graph for the site. [2] Transect C site 4 Use of building Number of buildings at the site Residential 2 Offices 0 Shops 1 Industry 7 Divided bar graph of ground floor land-use at site 4 on transect C 0 5 10 residential offices shops industry Key (iii) The students decided to show only the main type of land-use at each survey site on their map of the city (Fig. 6 Insert). For site 4 on transect C, above, this was industry. Do you agree with their decision to show only the main type of land-use? Circle your choice below. Agree Disagree Explain why you agree or disagree. … … … … [2] www.theallpapers.com
Question paper, page 13
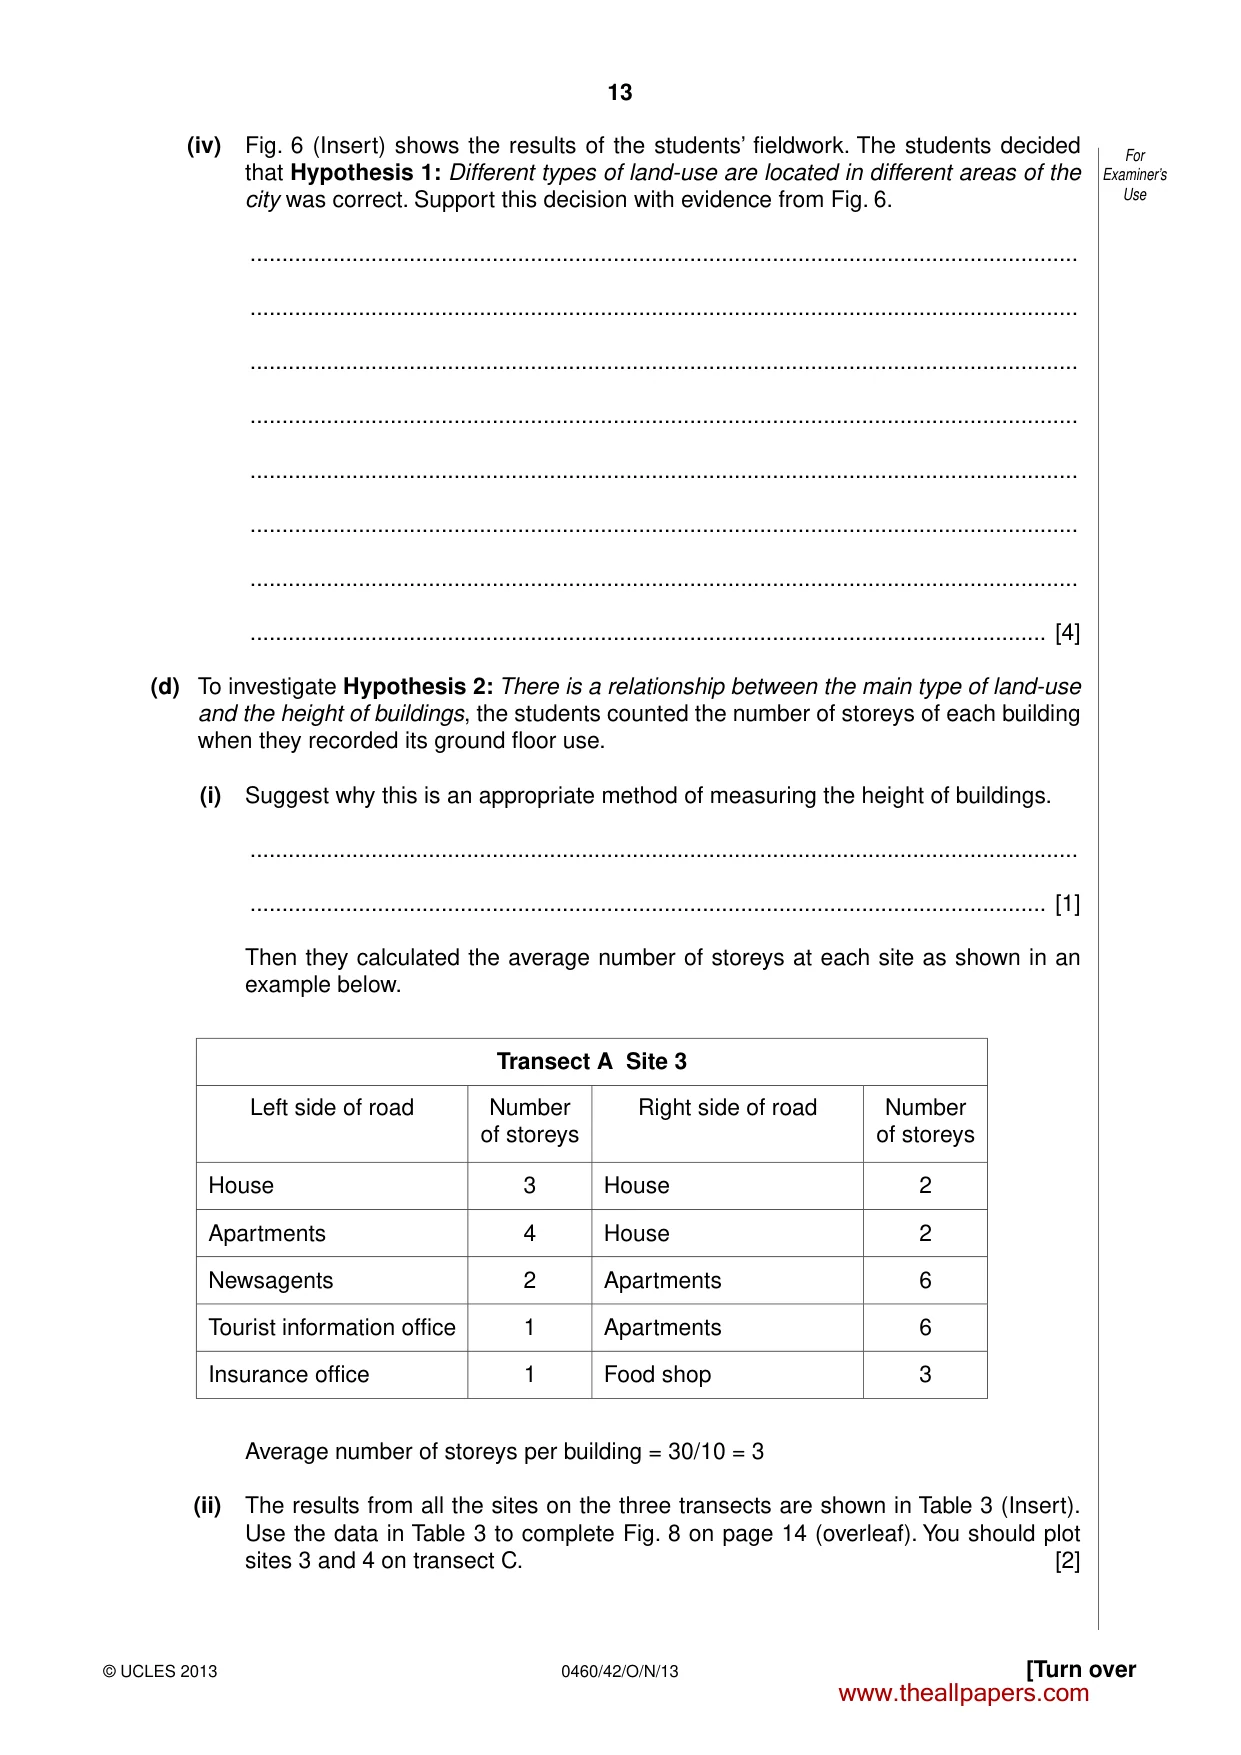
13 0460/42/O/N/13 © UCLES 2013 [Turn over For Examiner’s Use (iv) Fig. 6 (Insert) shows the results of the students’ fieldwork. The students decided that Hypothesis 1: Different types of land-use are located in different areas of the city was correct. Support this decision with evidence from Fig. 6. … … … … … … … … [4] (d) To investigate Hypothesis 2: There is a relationship between the main type of land-use and the height of buildings, the students counted the number of storeys of each building when they recorded its ground floor use. (i) Suggest why this is an appropriate method of measuring the height of buildings. … … [1] Then they calculated the average number of storeys at each site as shown in an example below. Transect A Site 3 Left side of road Number of storeys Right side of road Number of storeys House 3 House 2 Apartments 4 House 2 Newsagents 2 Apartments 6 Tourist information office 1 Apartments 6 Insurance office 1 Food shop 3 Average number of storeys per building = 30/10 = 3 (ii) The results from all the sites on the three transects are shown in Table 3 (Insert). Use the data in Table 3 to complete Fig. 8 on page 14 (overleaf). You should plot sites 3 and 4 on transect C. [2] www.theallpapers.com
Question paper, page 14
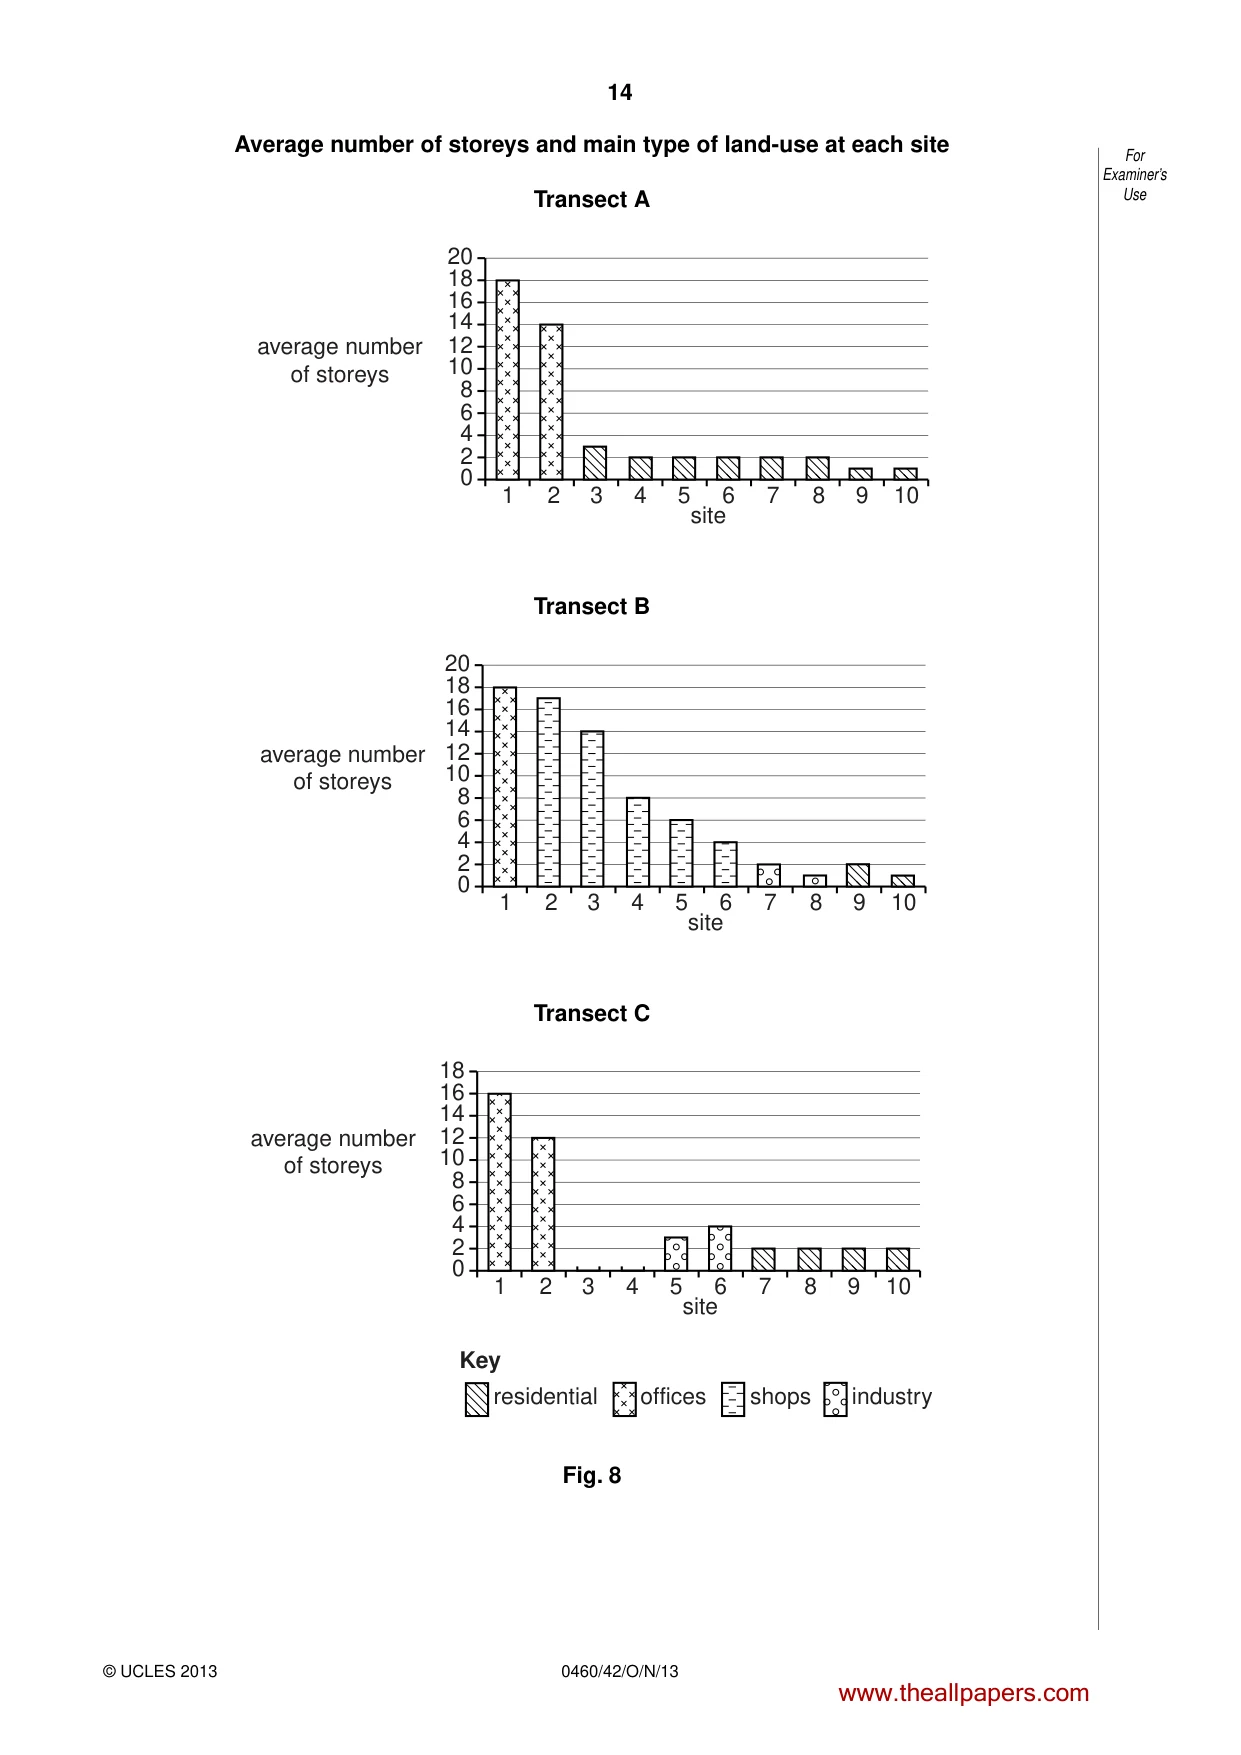
14 0460/42/O/N/13 © UCLES 2013 For Examiner’s Use Average number of storeys and main type of land-use at each site Transect A 0 2 4 6 8 10 12 14 16 18 20 1 2 3 4 5 6 7 8 9 10 average number of storeys site Transect B 0 2 4 6 8 10 12 14 16 18 20 1 2 3 4 5 6 7 8 9 10 average number of storeys site Transect C 0 2 4 6 8 10 12 14 16 18 1 2 3 4 5 6 7 8 9 10 average number of storeys site Key residential offices shops industry Fig. 8 www.theallpapers.com
Question paper, page 15
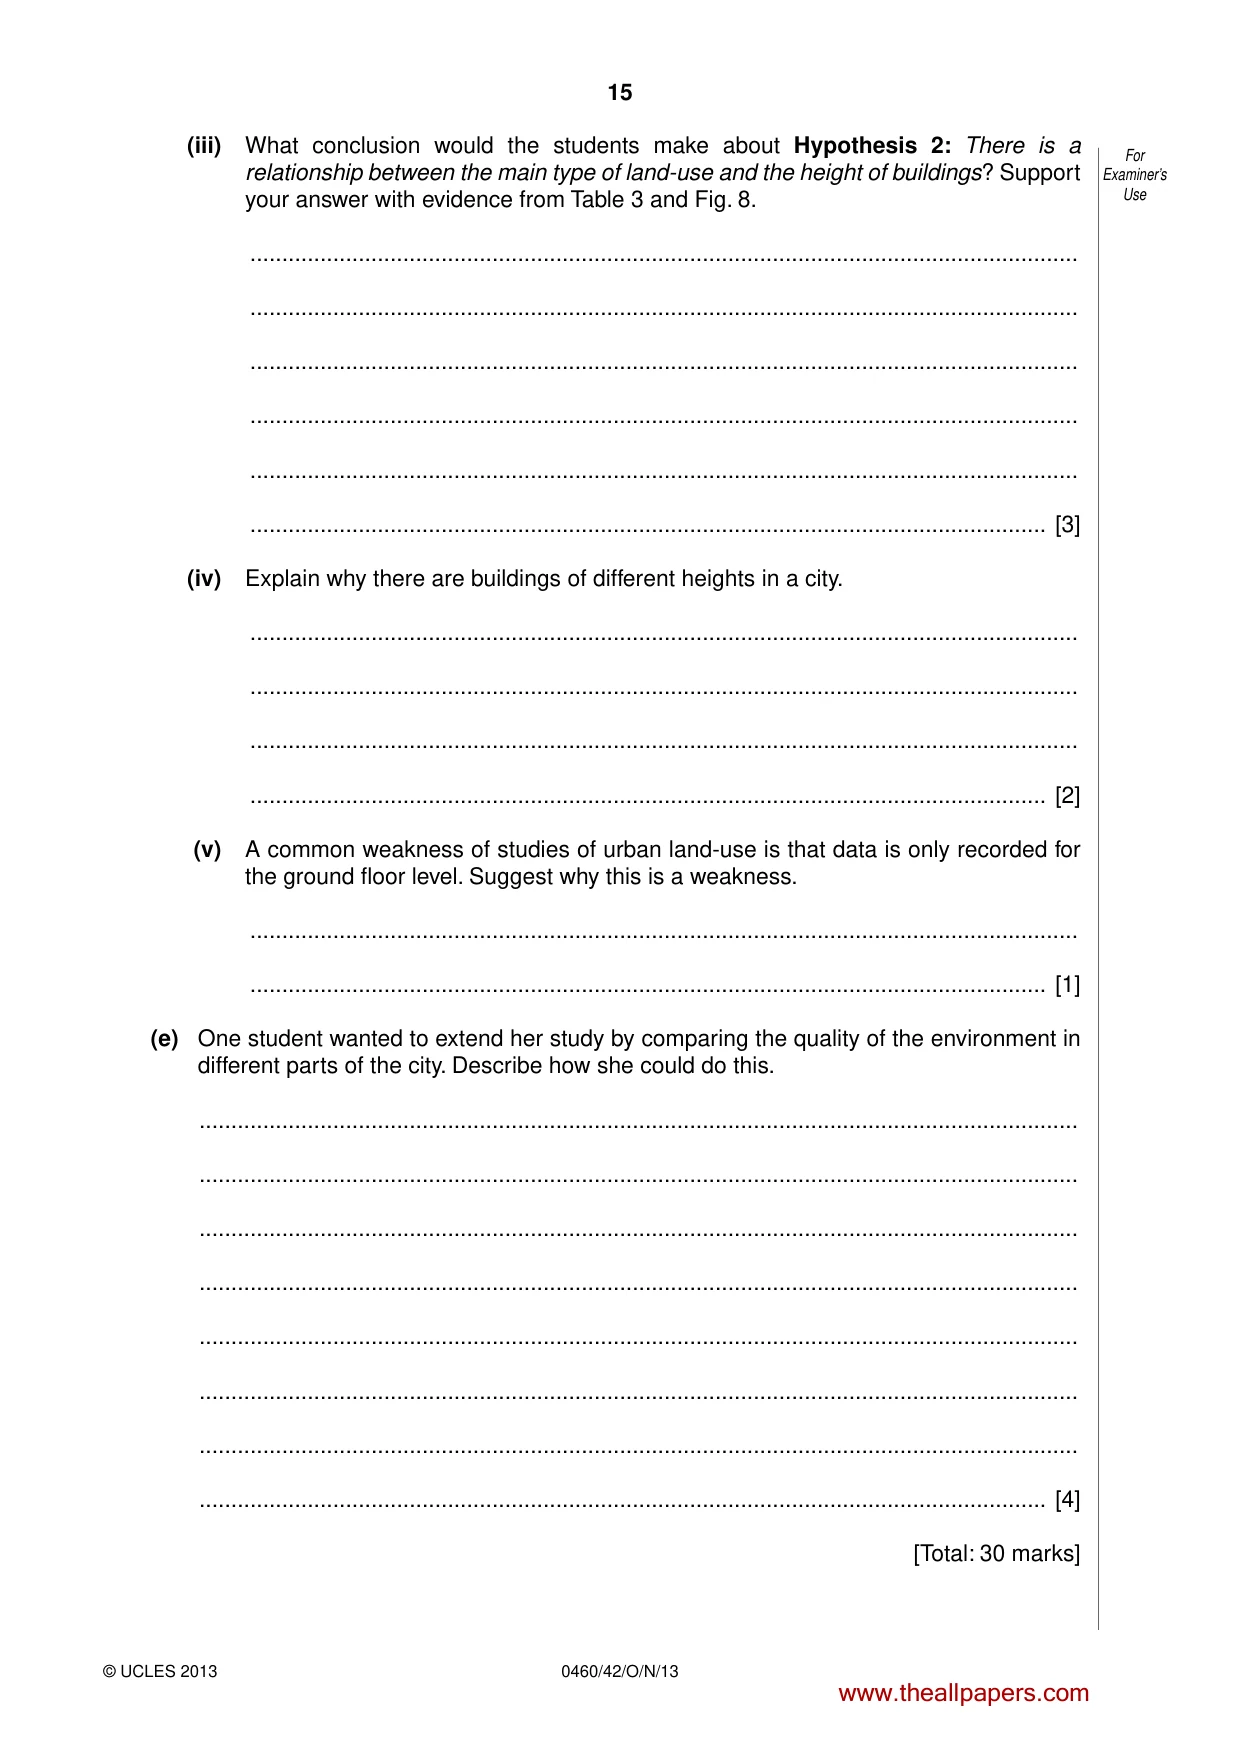
15 0460/42/O/N/13 © UCLES 2013 For Examiner’s Use (iii) What conclusion would the students make about Hypothesis 2: There is a relationship between the main type of land-use and the height of buildings? Support your answer with evidence from Table 3 and Fig. 8. … … … … … … [3] (iv) Explain why there are buildings of different heights in a city. … … … … [2] (v) A common weakness of studies of urban land-use is that data is only recorded for the ground floor level. Suggest why this is a weakness. … … [1] (e) One student wanted to extend her study by comparing the quality of the environment in different parts of the city. Describe how she could do this. … … … … … … … … [4] [Total: 30 marks] www.theallpapers.com
Question paper, page 16
16 0460/42/O/N/13 © UCLES 2013 Permission to reproduce items where third-party owned material protected by copyright is included has been sought and cleared where possible. Every reasonable effort has been made by the publisher (UCLES) to trace copyright holders, but if any items requiring clearance have unwittingly been included, the publisher will be pleased to make amends at the earliest possible opportunity. University of Cambridge International Examinations is part of the Cambridge Assessment Group. Cambridge Assessment is the brand name of University of Cambridge Local Examinations Syndicate (UCLES), which is itself a department of the University of Cambridge. BLANK PAGE www.theallpapers.com
Mark scheme, page 1
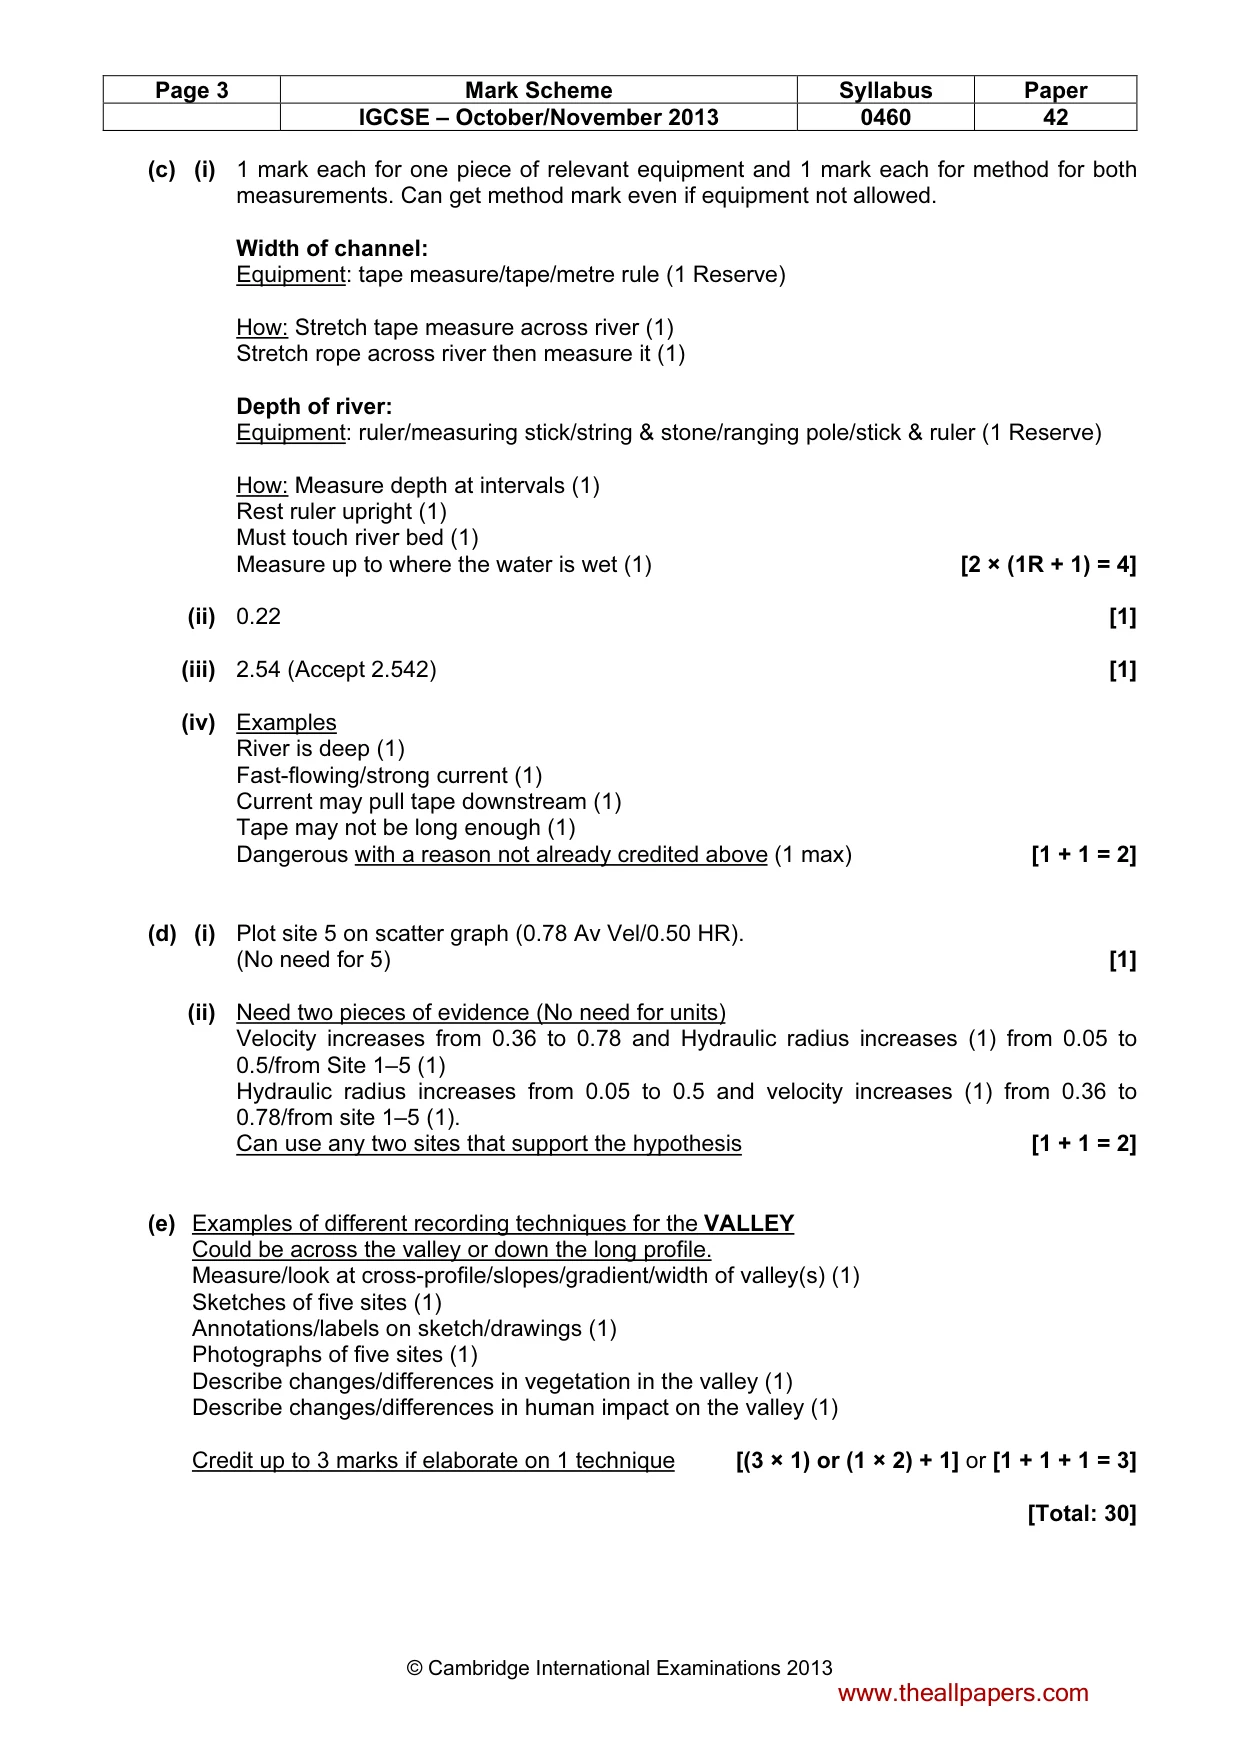
CAMBRIDGE INTERNATIONAL EXAMINATIONS International General Certificate of Secondary Education MARK SCHEME for the October/November 2013 series 0460 GEOGRAPHY 0460/42 Paper 4 (Alternative to Coursework), maximum raw mark 60 This mark scheme is published as an aid to teachers and candidates, to indicate the requirements of the examination. It shows the basis on which Examiners were instructed to award marks. It does not indicate the details of the discussions that took place at an Examiners’ meeting before marking began, which would have considered the acceptability of alternative answers. Mark schemes should be read in conjunction with the question paper and the Principal Examiner Report for Teachers. Cambridge will not enter into discussions about these mark schemes. Cambridge is publishing the mark schemes for the October/November 2013 series for most IGCSE, GCE Advanced Level and Advanced Subsidiary Level components and some Ordinary Level components. www.theallpapers.com
Mark scheme, page 2
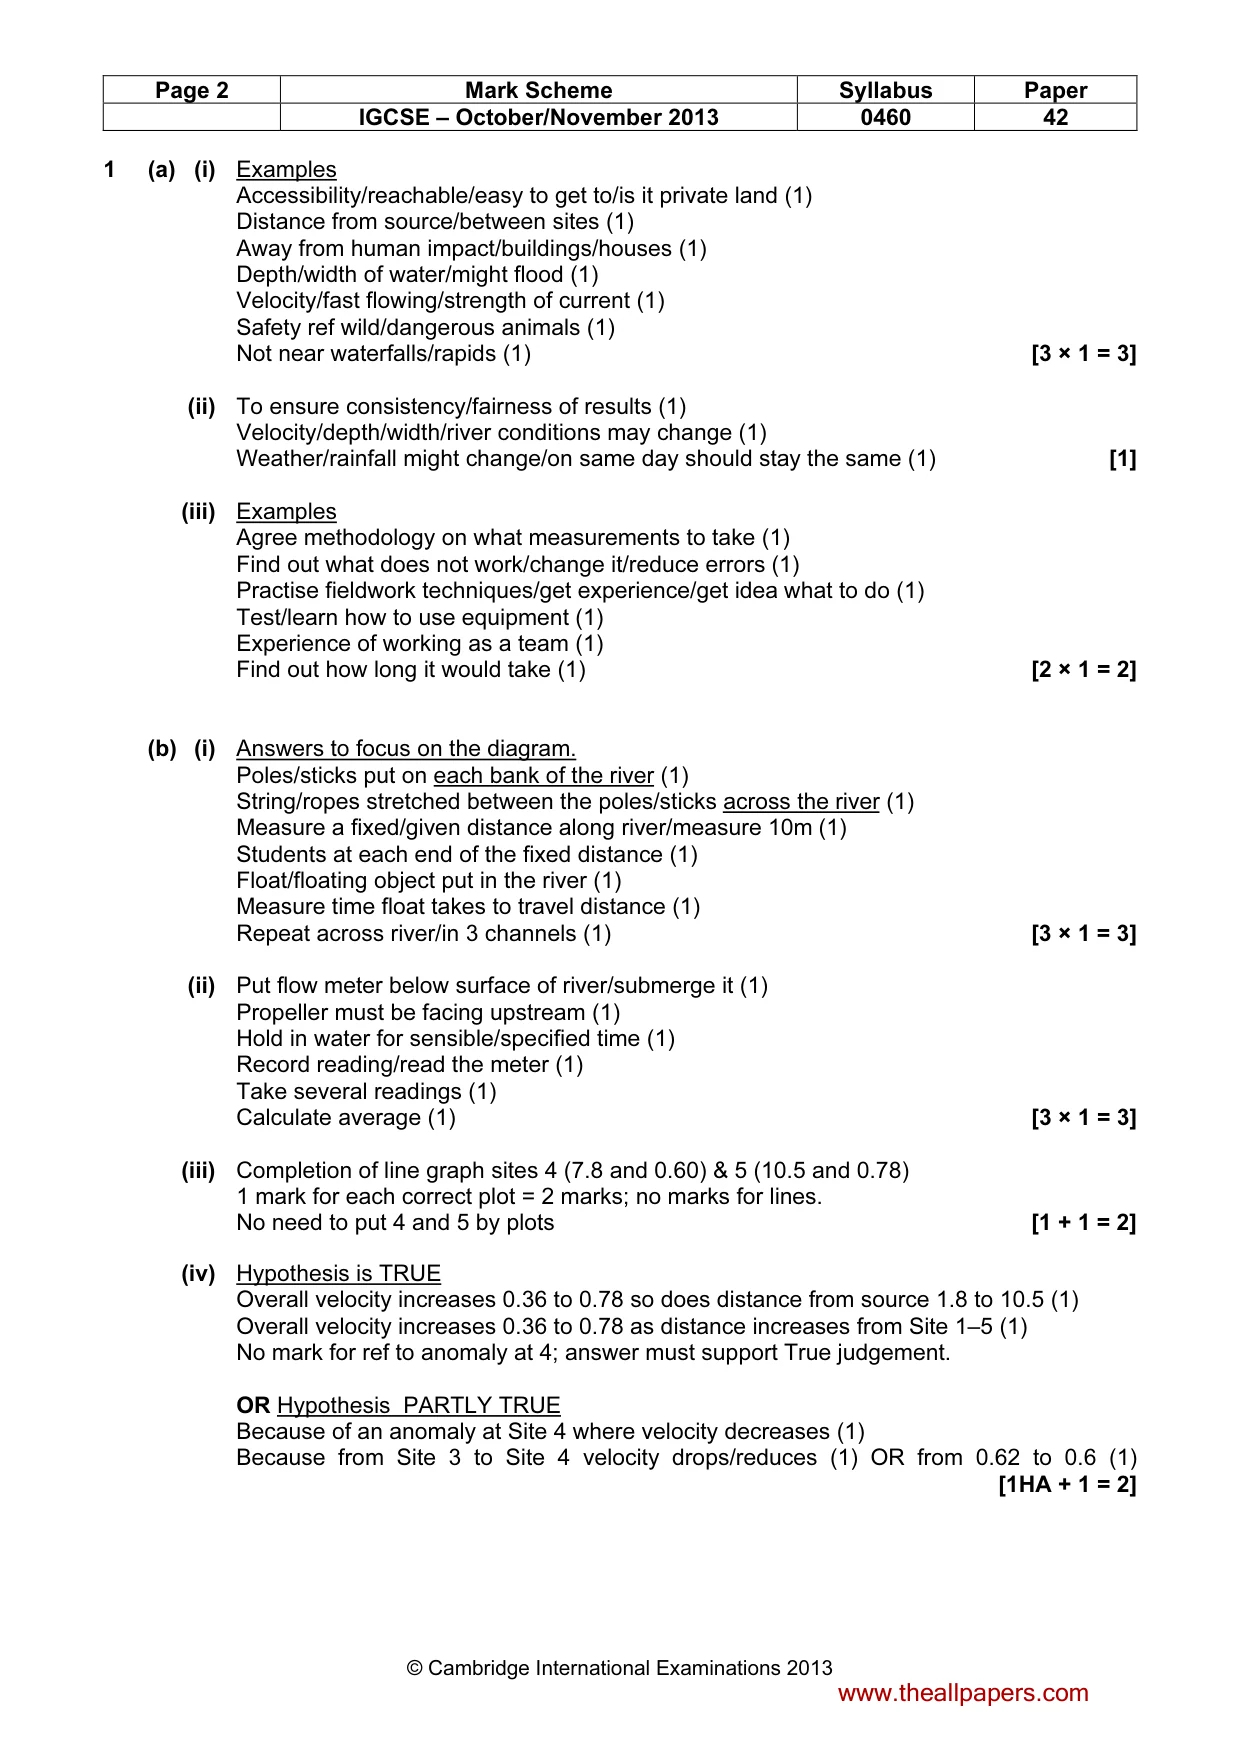
Page 2 Mark Scheme Syllabus Paper IGCSE – October/November 2013 0460 42 © Cambridge International Examinations 2013 1 (a) (i) Examples Accessibility/reachable/easy to get to/is it private land (1) Distance from source/between sites (1) Away from human impact/buildings/houses (1) Depth/width of water/might flood (1) Velocity/fast flowing/strength of current (1) Safety ref wild/dangerous animals (1) Not near waterfalls/rapids (1) [3 × 1 = 3] (ii) To ensure consistency/fairness of results (1) Velocity/depth/width/river conditions may change (1) Weather/rainfall might change/on same day should stay the same (1) [1] (iii) Examples Agree methodology on what measurements to take (1) Find out what does not work/change it/reduce errors (1) Practise fieldwork techniques/get experience/get idea what to do (1) Test/learn how to use equipment (1) Experience of working as a team (1) Find out how long it would take (1) [2 × 1 = 2] (b) (i) Answers to focus on the diagram. Poles/sticks put on each bank of the river (1) String/ropes stretched between the poles/sticks across the river (1) Measure a fixed/given distance along river/measure 10m (1) Students at each end of the fixed distance (1) Float/floating object put in the river (1) Measure time float takes to travel distance (1) Repeat across river/in 3 channels (1) [3 × 1 = 3] (ii) Put flow meter below surface of river/submerge it (1) Propeller must be facing upstream (1) Hold in water for sensible/specified time (1) Record reading/read the meter (1) Take several readings (1) Calculate average (1) [3 × 1 = 3] (iii) Completion of line graph sites 4 (7.8 and 0.60) & 5 (10.5 and 0.78) 1 mark for each correct plot = 2 marks; no marks for lines. No need to put 4 and 5 by plots [1 + 1 = 2] (iv) Hypothesis is TRUE Overall velocity increases 0.36 to 0.78 so does distance from source 1.8 to 10.5 (1) Overall velocity increases 0.36 to 0.78 as distance increases from Site 1–5 (1) No mark for ref to anomaly at 4; answer must support True judgement. OR Hypothesis PARTLY TRUE Because of an anomaly at Site 4 where velocity decreases (1) Because from Site 3 to Site 4 velocity drops/reduces (1) OR from 0.62 to 0.6 (1) [1HA + 1 = 2] www.theallpapers.com
Mark scheme, page 3
Page 3 Mark Scheme Syllabus Paper IGCSE – October/November 2013 0460 42 © Cambridge International Examinations 2013 (c) (i) 1 mark each for one piece of relevant equipment and 1 mark each for method for both measurements. Can get method mark even if equipment not allowed. Width of channel: Equipment: tape measure/tape/metre rule (1 Reserve) How: Stretch tape measure across river (1) Stretch rope across river then measure it (1) Depth of river: Equipment: ruler/measuring stick/string & stone/ranging pole/stick & ruler (1 Reserve) How: Measure depth at intervals (1) Rest ruler upright (1) Must touch river bed (1) Measure up to where the water is wet (1) [2 × (1R + 1) = 4] (ii) 0.22 [1] (iii) 2.54 (Accept 2.542) [1] (iv) Examples River is deep (1) Fast-flowing/strong current (1) Current may pull tape downstream (1) Tape may not be long enough (1) Dangerous with a reason not already credited above (1 max) [1 + 1 = 2] (d) (i) Plot site 5 on scatter graph (0.78 Av Vel/0.50 HR). (No need for 5) [1] (ii) Need two pieces of evidence (No need for units) Velocity increases from 0.36 to 0.78 and Hydraulic radius increases (1) from 0.05 to 0.5/from Site 1–5 (1) Hydraulic radius increases from 0.05 to 0.5 and velocity increases (1) from 0.36 to 0.78/from site 1–5 (1). Can use any two sites that support the hypothesis [1 + 1 = 2] (e) Examples of different recording techniques for the VALLEY Could be across the valley or down the long profile. Measure/look at cross-profile/slopes/gradient/width of valley(s) (1) Sketches of five sites (1) Annotations/labels on sketch/drawings (1) Photographs of five sites (1) Describe changes/differences in vegetation in the valley (1) Describe changes/differences in human impact on the valley (1) Credit up to 3 marks if elaborate on 1 technique [(3 × 1) or (1 × 2) + 1] or [1 + 1 + 1 = 3] [Total: 30] www.theallpapers.com
Mark scheme, page 4
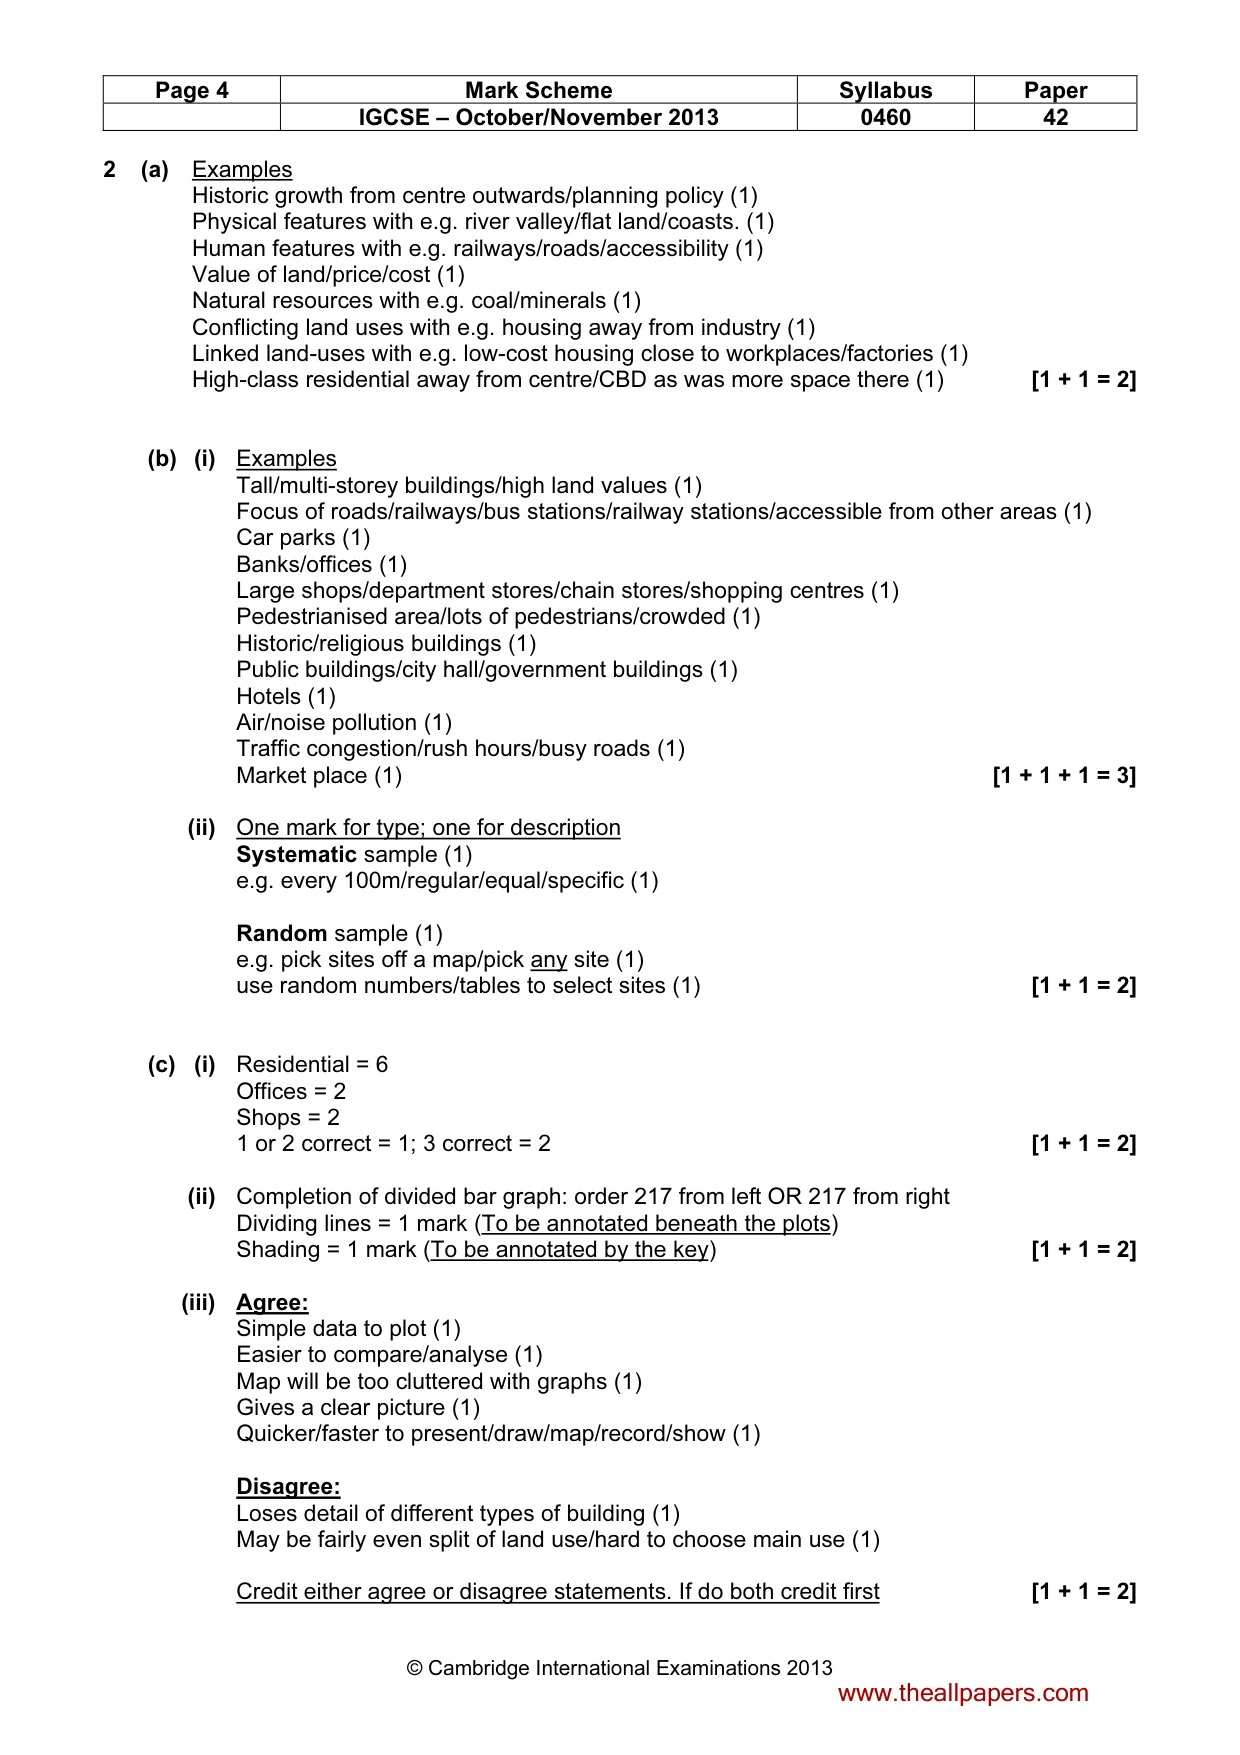
Page 4 Mark Scheme Syllabus Paper IGCSE – October/November 2013 0460 42 © Cambridge International Examinations 2013 2 (a) Examples Historic growth from centre outwards/planning policy (1) Physical features with e.g. river valley/flat land/coasts. (1) Human features with e.g. railways/roads/accessibility (1) Value of land/price/cost (1) Natural resources with e.g. coal/minerals (1) Conflicting land uses with e.g. housing away from industry (1) Linked land-uses with e.g. low-cost housing close to workplaces/factories (1) High-class residential away from centre/CBD as was more space there (1) [1 + 1 = 2] (b) (i) Examples Tall/multi-storey buildings/high land values (1) Focus of roads/railways/bus stations/railway stations/accessible from other areas (1) Car parks (1) Banks/offices (1) Large shops/department stores/chain stores/shopping centres (1) Pedestrianised area/lots of pedestrians/crowded (1) Historic/religious buildings (1) Public buildings/city hall/government buildings (1) Hotels (1) Air/noise pollution (1) Traffic congestion/rush hours/busy roads (1) Market place (1) [1 + 1 + 1 = 3] (ii) One mark for type; one for description Systematic sample (1) e.g. every 100m/regular/equal/specific (1) Random sample (1) e.g. pick sites off a map/pick any site (1) use random numbers/tables to select sites (1) [1 + 1 = 2] (c) (i) Residential = 6 Offices = 2 Shops = 2 1 or 2 correct = 1; 3 correct = 2 [1 + 1 = 2] (ii) Completion of divided bar graph: order 217 from left OR 217 from right Dividing lines = 1 mark (To be annotated beneath the plots) Shading = 1 mark (To be annotated by the key) [1 + 1 = 2] (iii) Agree: Simple data to plot (1) Easier to compare/analyse (1) Map will be too cluttered with graphs (1) Gives a clear picture (1) Quicker/faster to present/draw/map/record/show (1) Disagree: Loses detail of different types of building (1) May be fairly even split of land use/hard to choose main use (1) Credit either agree or disagree statements. If do both credit first [1 + 1 = 2] www.theallpapers.com
Mark scheme, page 5
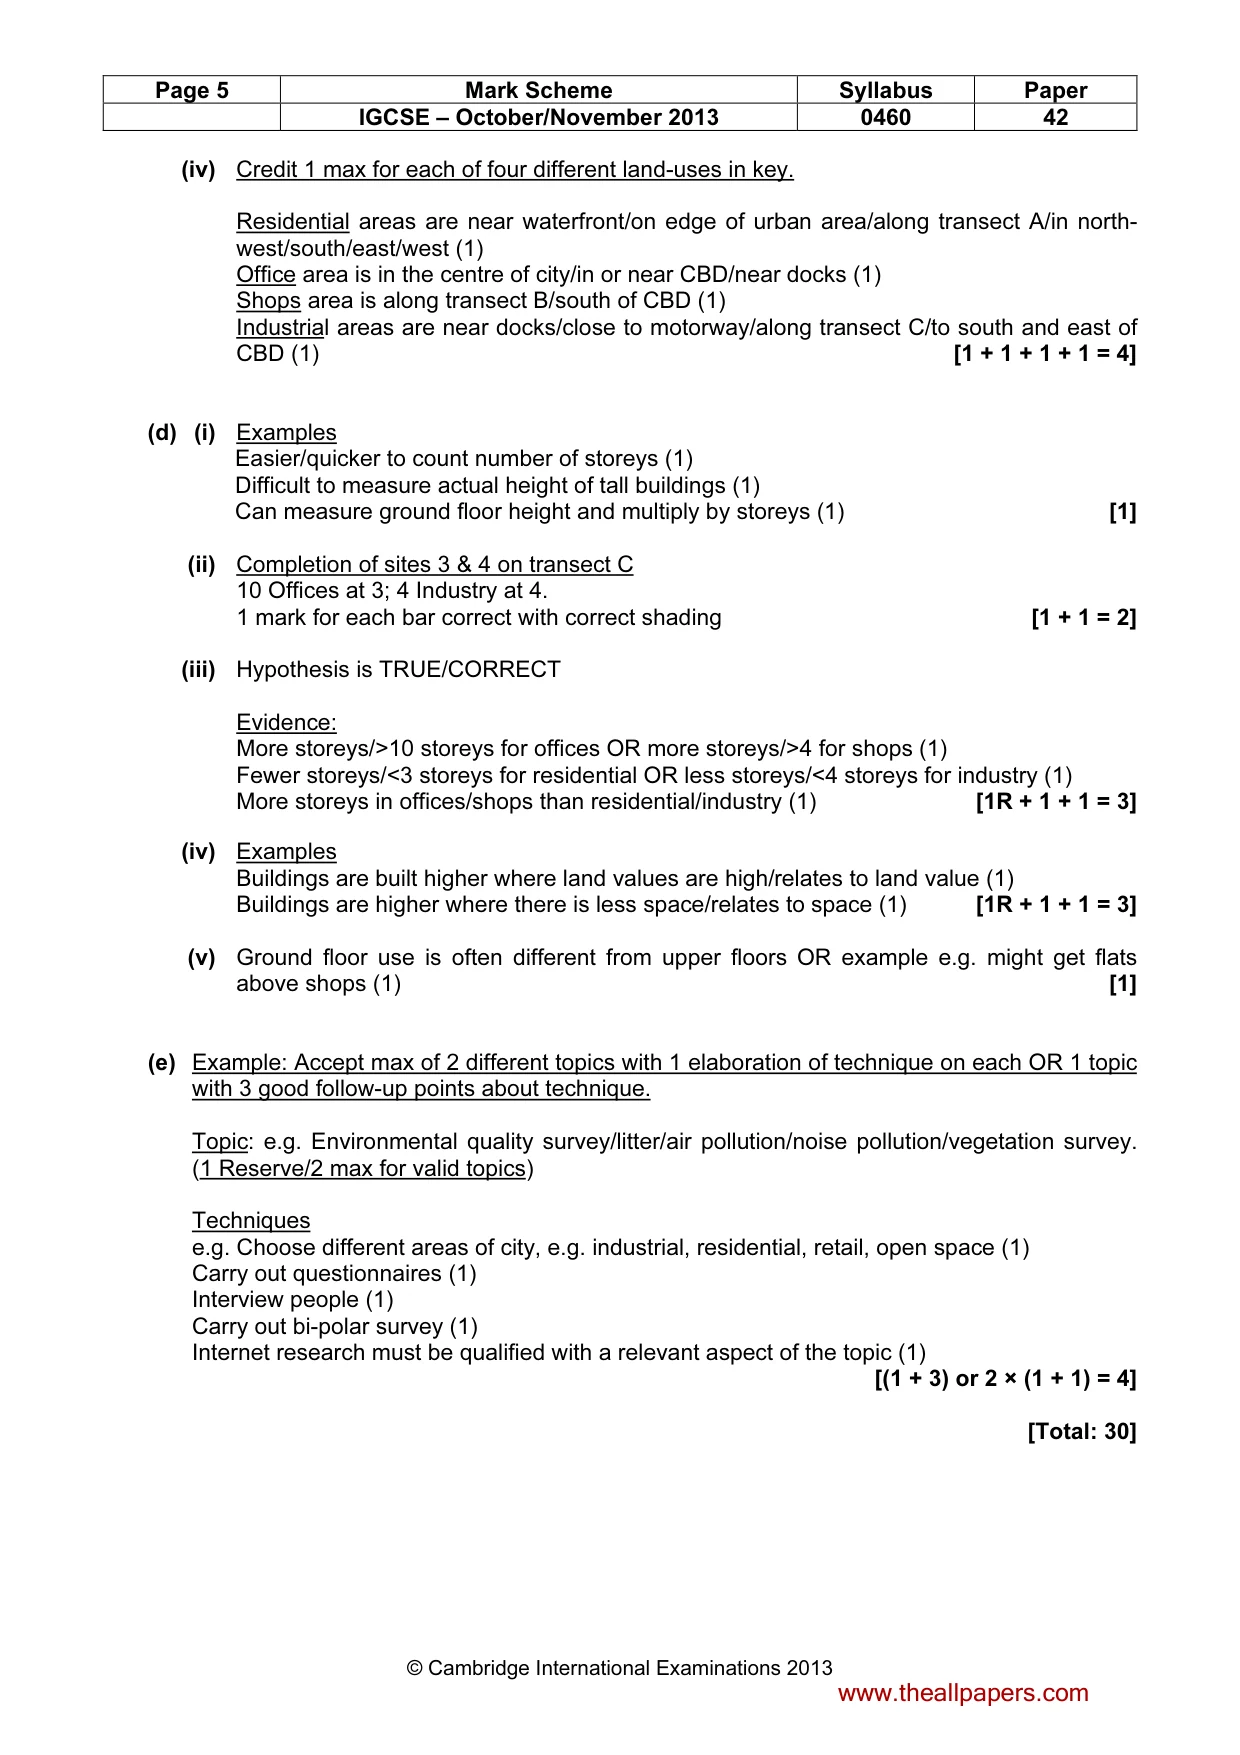
Page 5 Mark Scheme Syllabus Paper IGCSE – October/November 2013 0460 42 © Cambridge International Examinations 2013 (iv) Credit 1 max for each of four different land-uses in key. Residential areas are near waterfront/on edge of urban area/along transect A/in north- west/south/east/west (1) Office area is in the centre of city/in or near CBD/near docks (1) Shops area is along transect B/south of CBD (1) Industrial areas are near docks/close to motorway/along transect C/to south and east of CBD (1) [1 + 1 + 1 + 1 = 4] (d) (i) Examples Easier/quicker to count number of storeys (1) Difficult to measure actual height of tall buildings (1) Can measure ground floor height and multiply by storeys (1) [1] (ii) Completion of sites 3 & 4 on transect C 10 Offices at 3; 4 Industry at 4. 1 mark for each bar correct with correct shading [1 + 1 = 2] (iii) Hypothesis is TRUE/CORRECT Evidence: More storeys/>10 storeys for offices OR more storeys/>4 for shops (1) Fewer storeys/<3 storeys for residential OR less storeys/<4 storeys for industry (1) More storeys in offices/shops than residential/industry (1) [1R + 1 + 1 = 3] (iv) Examples Buildings are built higher where land values are high/relates to land value (1) Buildings are higher where there is less space/relates to space (1) [1R + 1 + 1 = 3] (v) Ground floor use is often different from upper floors OR example e.g. might get flats above shops (1) [1] (e) Example: Accept max of 2 different topics with 1 elaboration of technique on each OR 1 topic with 3 good follow-up points about technique. Topic: e.g. Environmental quality survey/litter/air pollution/noise pollution/vegetation survey. (1 Reserve/2 max for valid topics) Techniques e.g. Choose different areas of city, e.g. industrial, residential, retail, open space (1) Carry out questionnaires (1) Interview people (1) Carry out bi-polar survey (1) Internet research must be qualified with a relevant aspect of the topic (1) [(1 + 3) or 2 × (1 + 1) = 4] [Total: 30] www.theallpapers.com
What you needed in this session
Cambridge’s own grade thresholds for 2013 Oct/Nov, Paper 4 · Variant 2. A higher threshold means an easier paper — the bar moves with how the cohort did.