Cambridge IGCSE Geography 0460 — 2013 May/June Paper 4 · Variant 3
0460/43/M/J/13 · 60 marks · ≈68 min
The question paper and its mark scheme, free to read here and free to download. This is Cambridge’s own paper, exactly as it was sat.
Question paper16 pages



Mark scheme5 pages
Answers below. Sit the paper first if you are practising.
Paper as text
Question paper, page 1
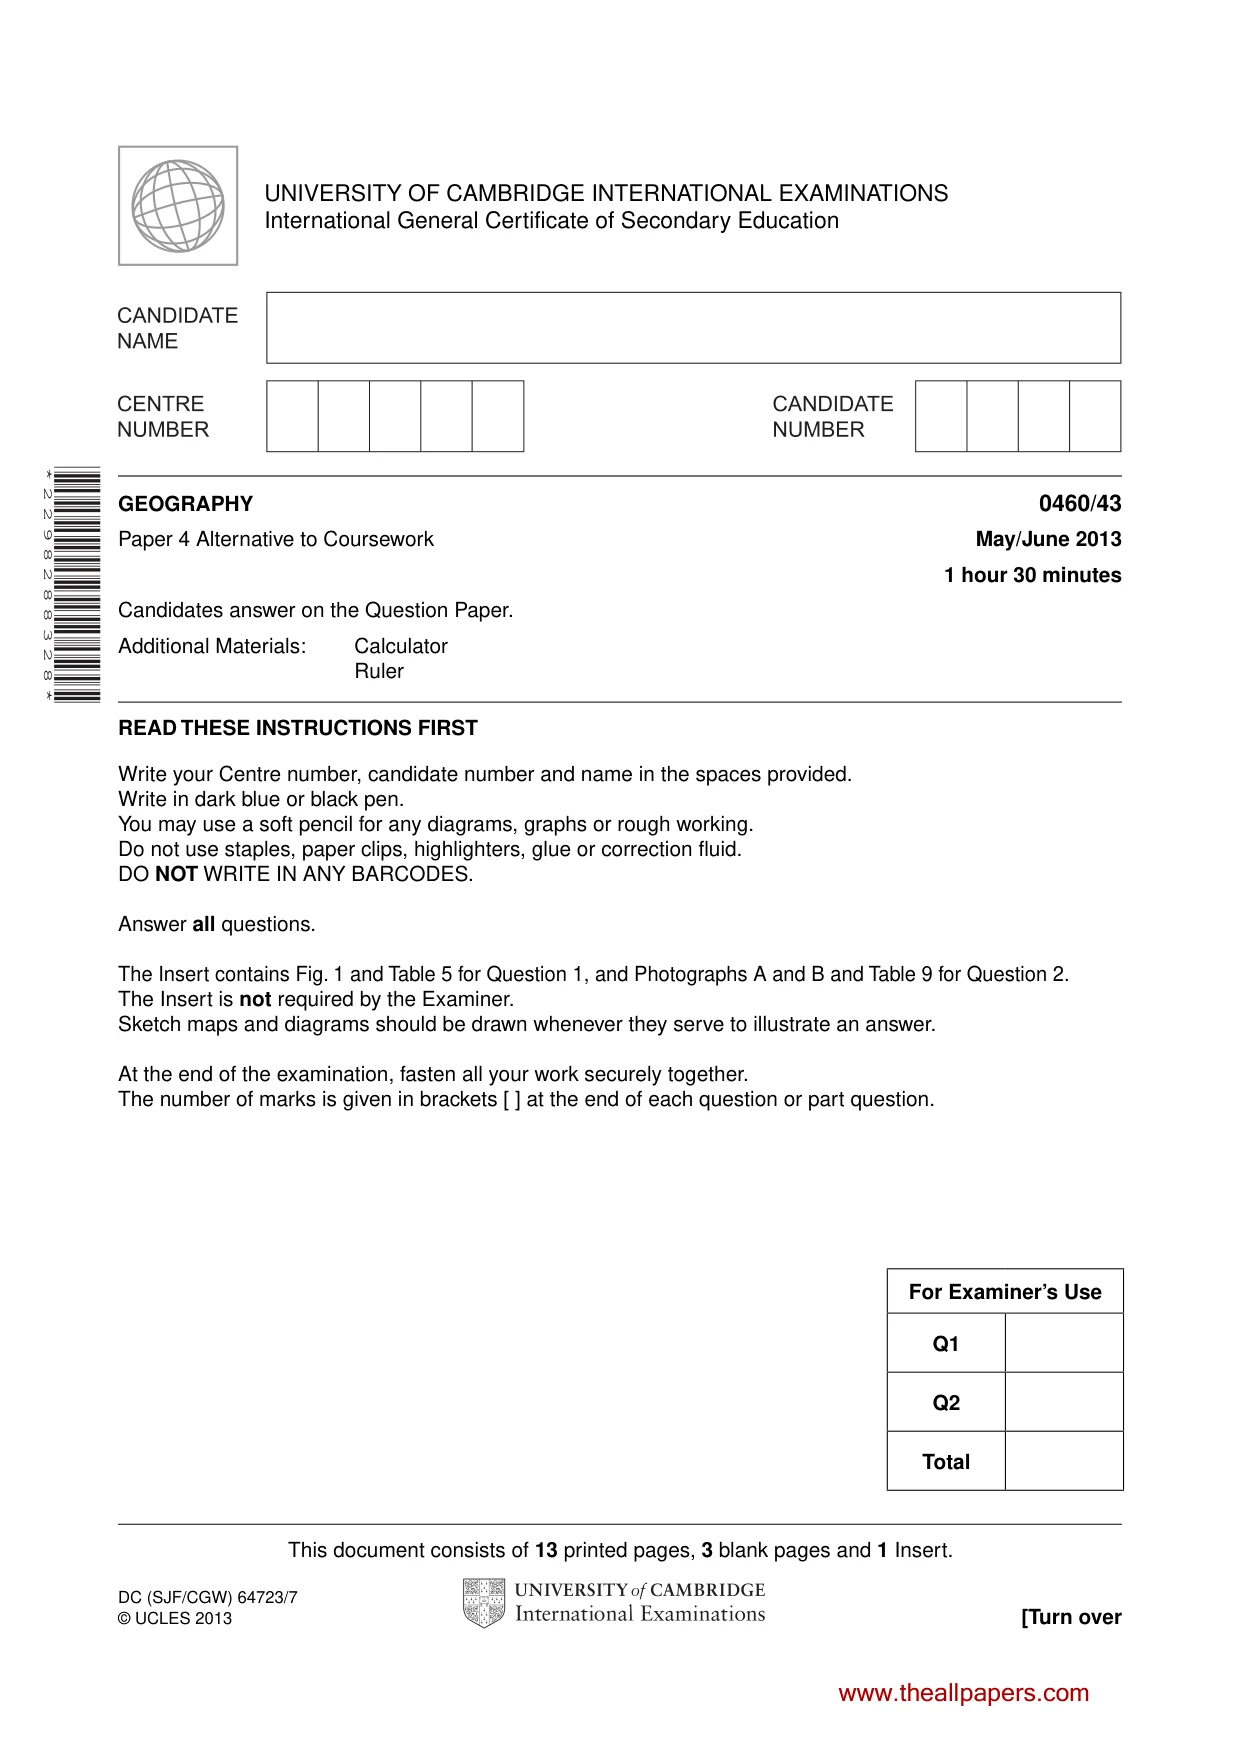
This document consists of 13 printed pages, 3 blank pages and 1 Insert. DC (SJF/CGW) 64723/7 © UCLES 2013 [Turn over UNIVERSITY OF CAMBRIDGE INTERNATIONAL EXAMINATIONS International General Certificate of Secondary Education * 2 2 9 8 2 8 8 3 2 8 * GEOGRAPHY 0460/43 Paper 4 Alternative to Coursework May/June 2013 1 hour 30 minutes Candidates answer on the Question Paper. Additional Materials: Calculator Ruler READ THESE INSTRUCTIONS FIRST Write your Centre number, candidate number and name in the spaces provided. Write in dark blue or black pen. You may use a soft pencil for any diagrams, graphs or rough working. Do not use staples, paper clips, highlighters, glue or correction fluid. DO NOT WRITE IN ANY BARCODES. Answer all questions. The Insert contains Fig. 1 and Table 5 for Question 1, and Photographs A and B and Table 9 for Question 2. The Insert is not required by the Examiner. Sketch maps and diagrams should be drawn whenever they serve to illustrate an answer. At the end of the examination, fasten all your work securely together. The number of marks is given in brackets [ ] at the end of each question or part question. For Examiner’s Use Q1 Q2 Total www.theallpapers.com
Question paper, page 2
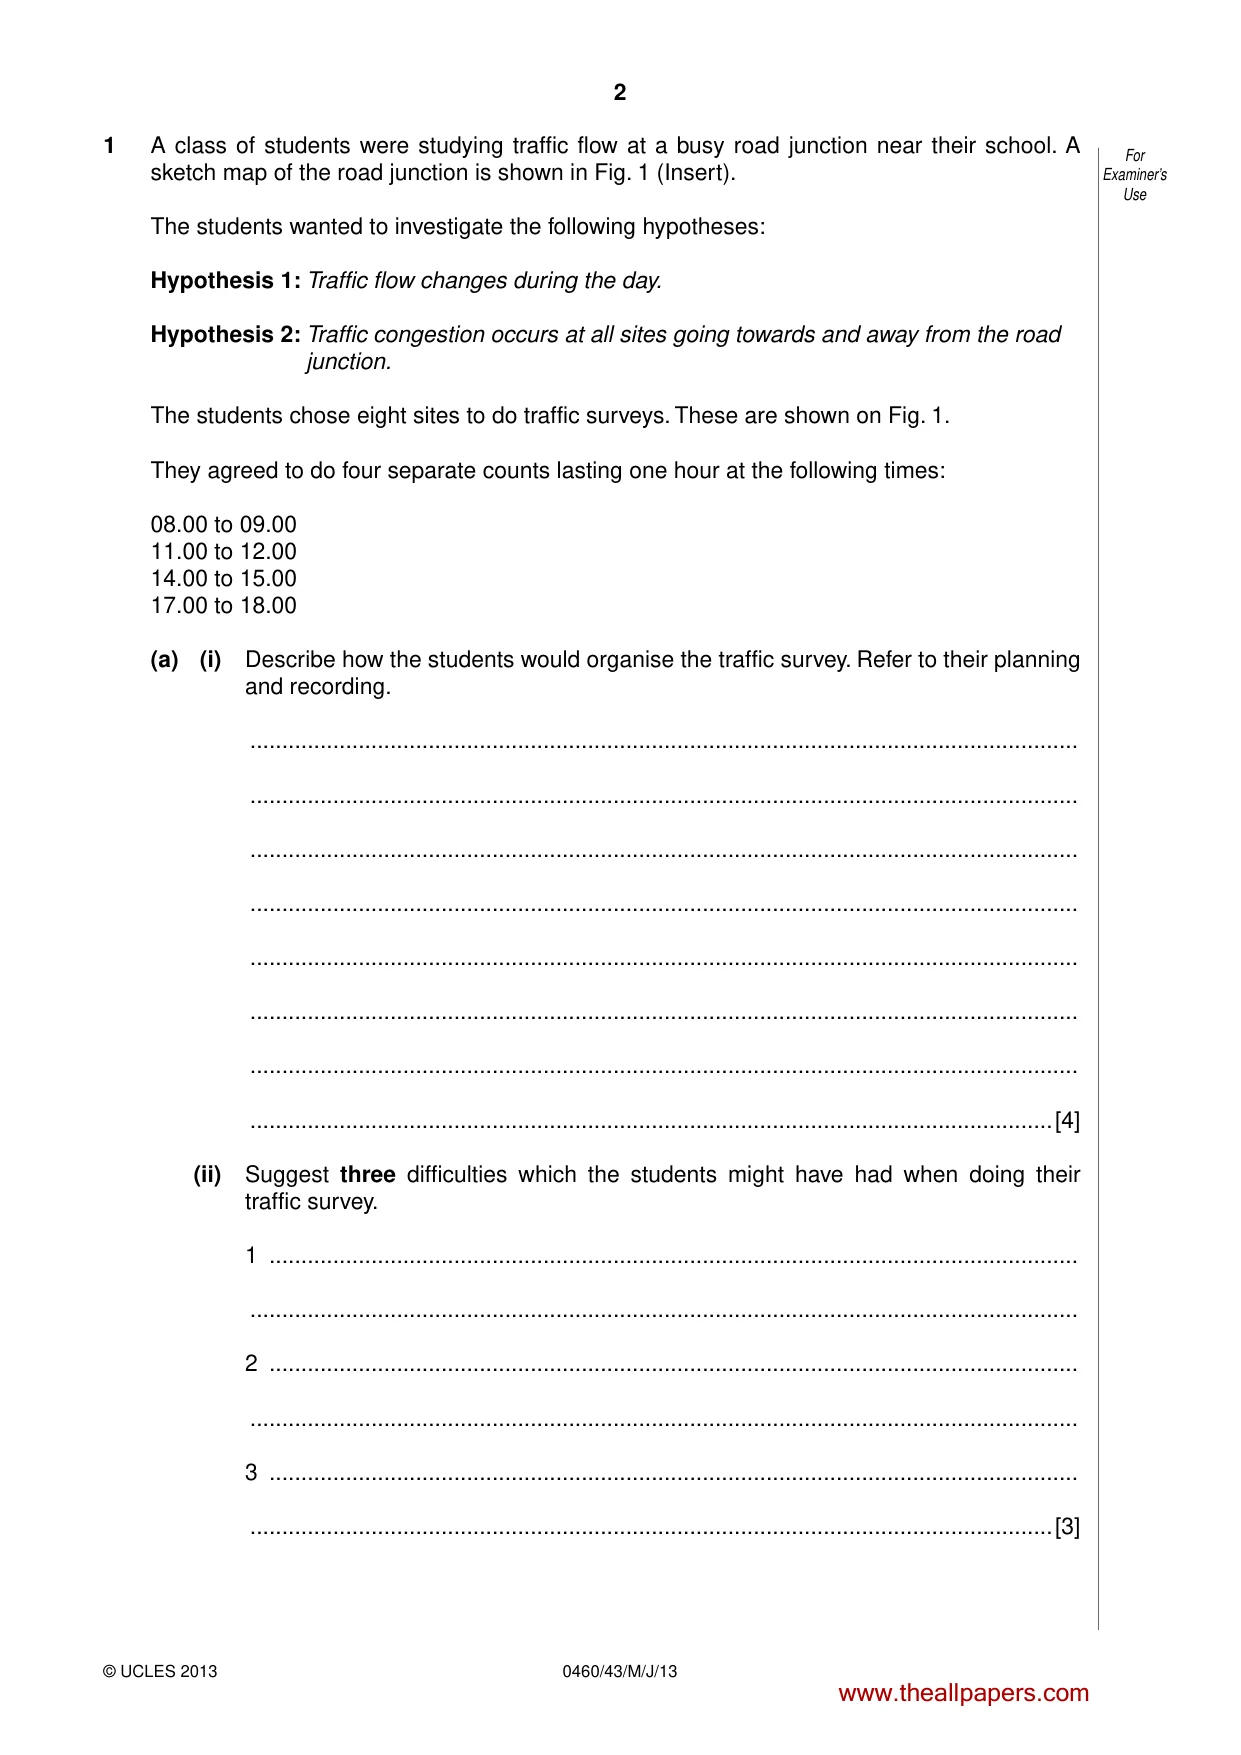
2 0460/43/M/J/13 © UCLES 2013 For Examiner’s Use 1 A class of students were studying traffic flow at a busy road junction near their school. A sketch map of the road junction is shown in Fig. 1 (Insert). The students wanted to investigate the following hypotheses: Hypothesis 1: Traffic flow changes during the day. Hypothesis 2: Traffic congestion occurs at all sites going towards and away from the road junction. The students chose eight sites to do traffic surveys. These are shown on Fig. 1. They agreed to do four separate counts lasting one hour at the following times: 08.00 to 09.00 11.00 to 12.00 14.00 to 15.00 17.00 to 18.00 (a) (i) Describe how the students would organise the traffic survey. Refer to their planning and recording. … … … … … … … …[4] (ii) Suggest three difficulties which the students might have had when doing their traffic survey. 1 … … 2 … … 3 … …[3] www.theallpapers.com
Question paper, page 3
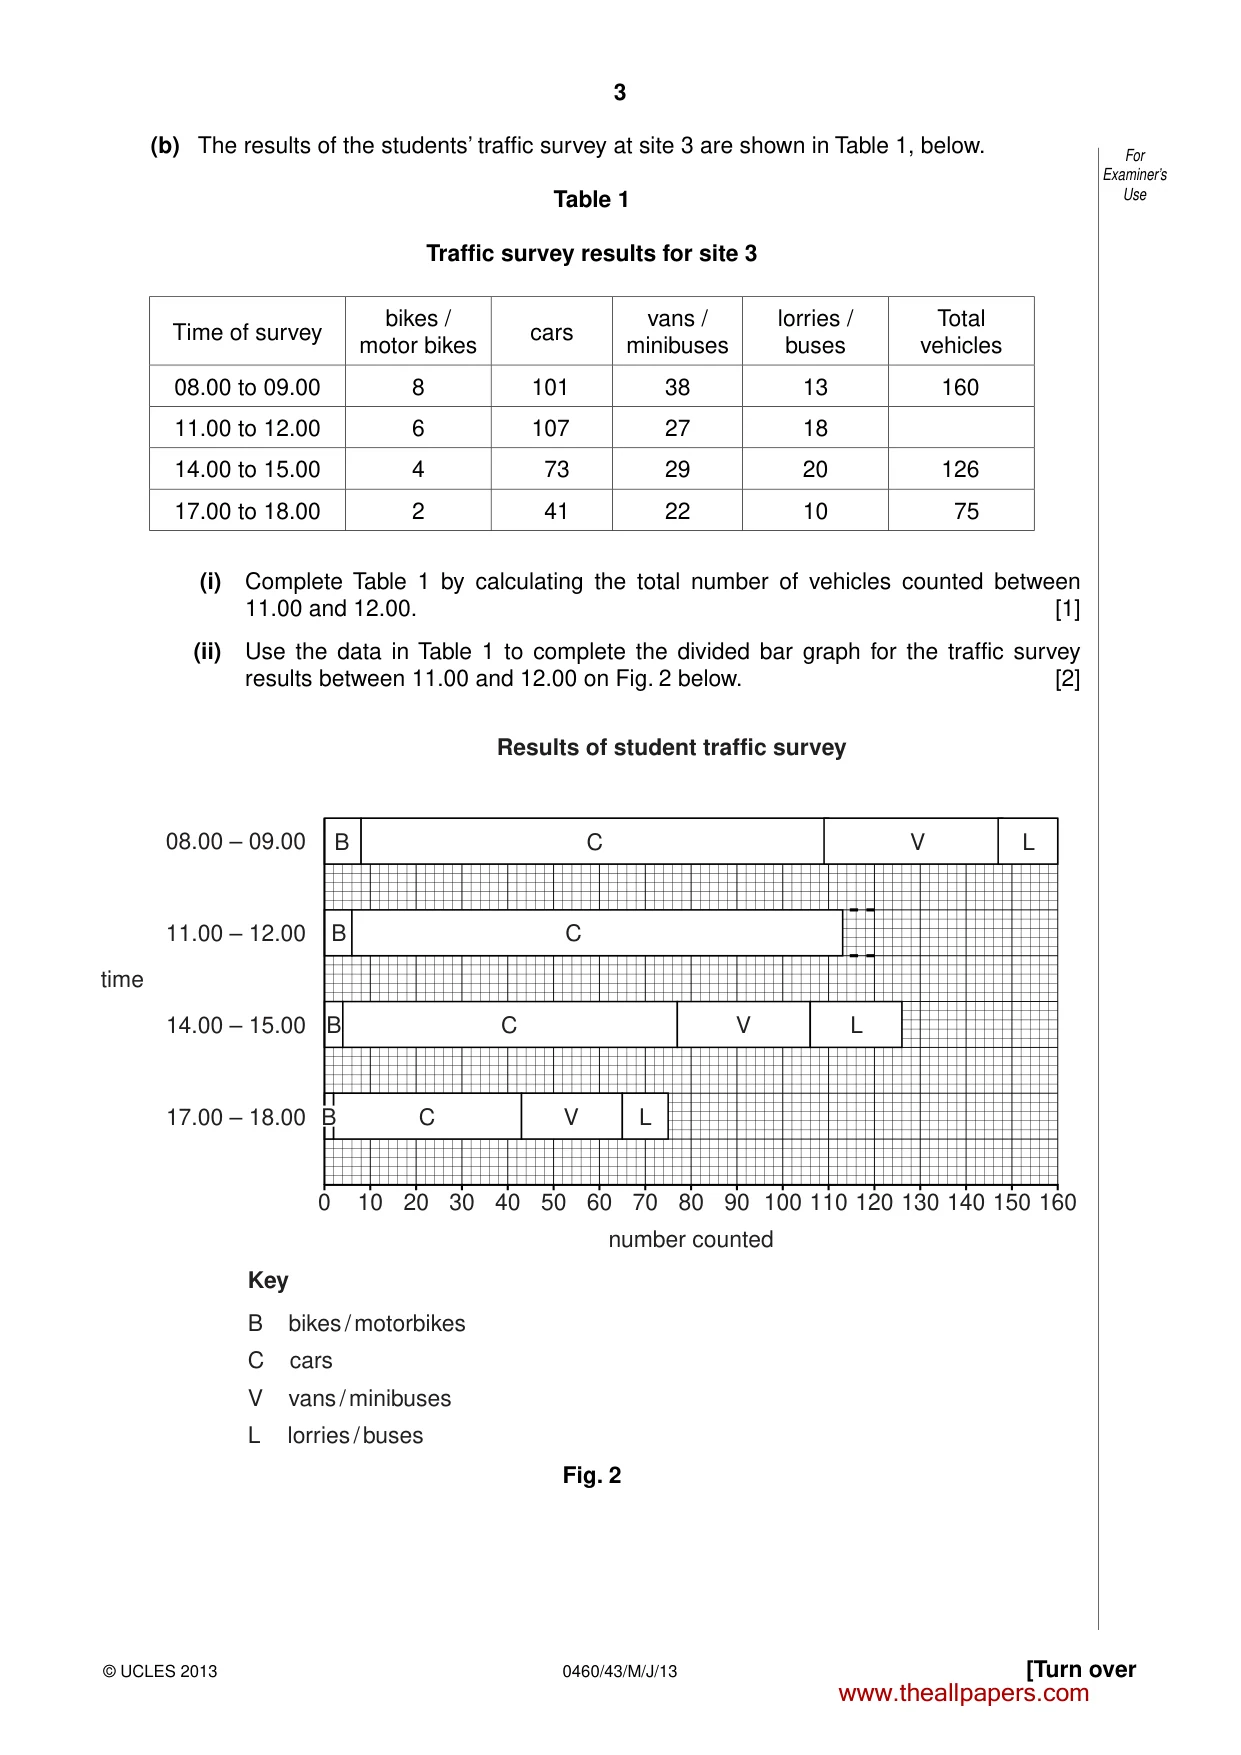
3 [Turn over © UCLES 2013 0460/43/M/J/13 For Examiner’s Use (b) The results of the students’ traffic survey at site 3 are shown in Table 1, below. Table 1 Traffic survey results for site 3 Time of survey bikes / motor bikes cars vans / minibuses lorries / buses Total vehicles 08.00 to 09.00 8 101 38 13 160 11.00 to 12.00 6 107 27 18 14.00 to 15.00 4 73 29 20 126 17.00 to 18.00 2 41 22 10 75 (i) Complete Table 1 by calculating the total number of vehicles counted between 11.00 and 12.00. [1] (ii) Use the data in Table 1 to complete the divided bar graph for the traffic survey results between 11.00 and 12.00 on Fig. 2 below. [2] 08.00 – 09.00 time 11.00 – 12.00 0 10 20 30 40 50 60 70 80 Results of student traffic survey Key B bikes / motorbikes C cars V vans / minibuses L lorries / buses number counted 90 100 110 120 130 140 150 160 14.00 – 15.00 B C V L C V L B C V L B C 17.00 – 18.00 B Fig. 2 www.theallpapers.com
Question paper, page 4
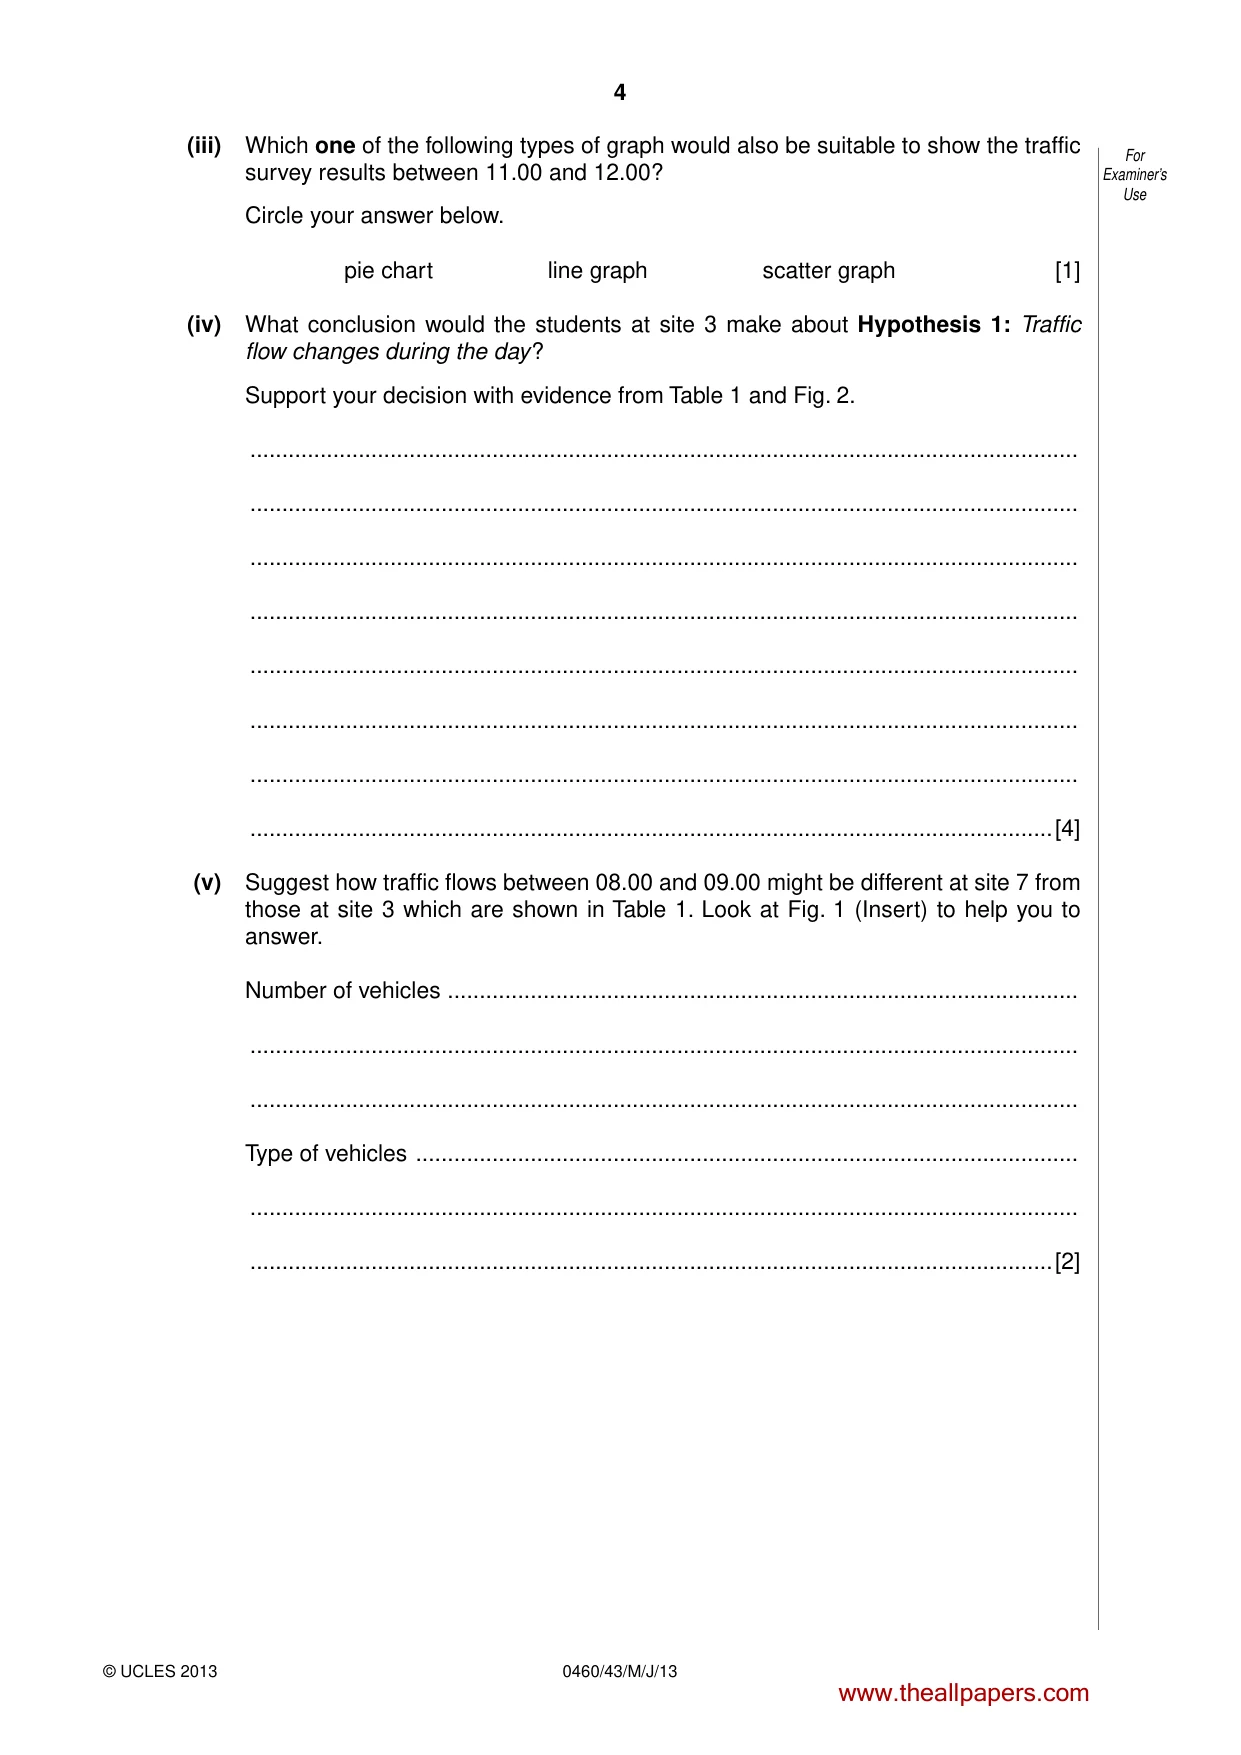
4 0460/43/M/J/13 © UCLES 2013 For Examiner’s Use (iii) Which one of the following types of graph would also be suitable to show the traffic survey results between 11.00 and 12.00? Circle your answer below. pie chart line graph scatter graph [1] (iv) What conclusion would the students at site 3 make about Hypothesis 1: Traffic flow changes during the day ? Support your decision with evidence from Table 1 and Fig. 2. … … … … … … … …[4] (v) Suggest how traffic flows between 08.00 and 09.00 might be different at site 7 from those at site 3 which are shown in Table 1. Look at Fig. 1 (Insert) to help you to answer. Number of vehicles … … … Type of vehicles … … …[2] www.theallpapers.com
Question paper, page 5
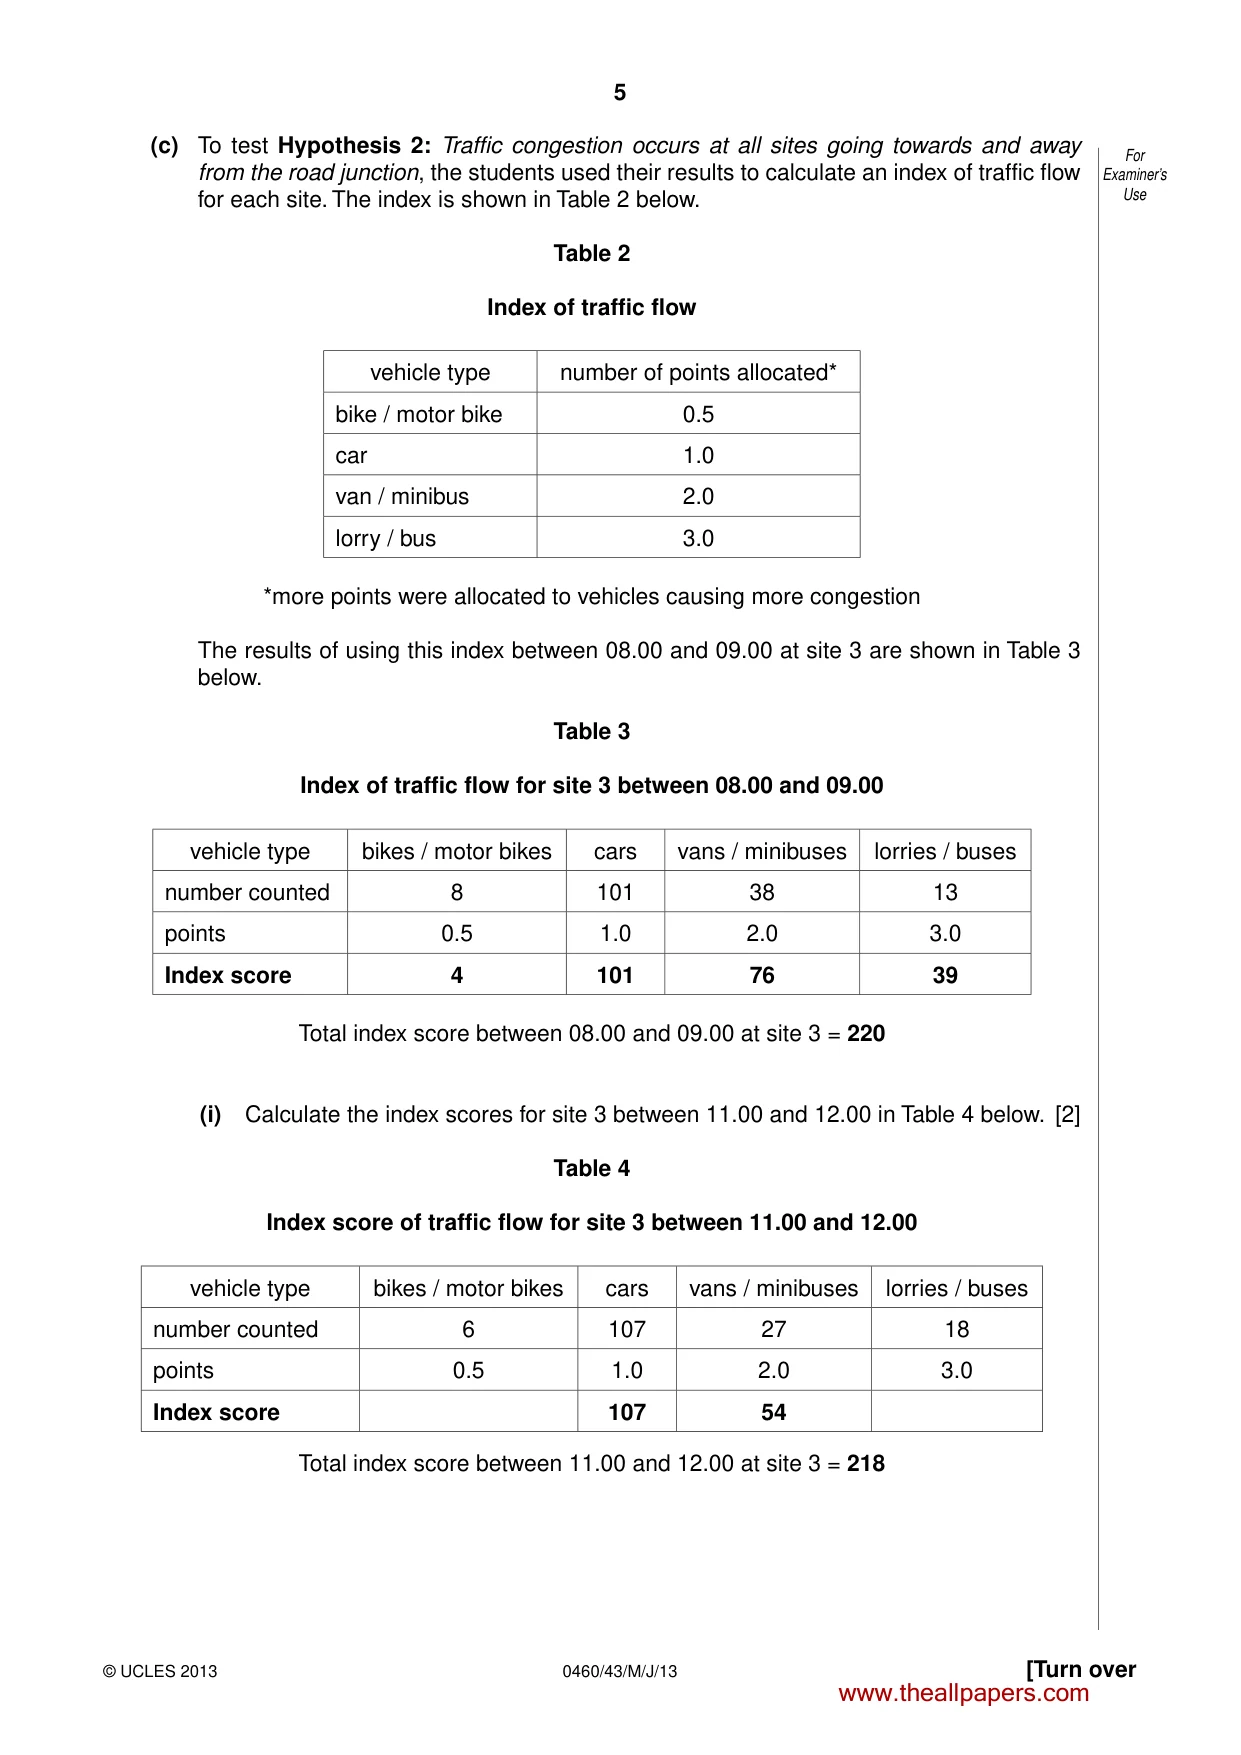
5 [Turn over © UCLES 2013 0460/43/M/J/13 For Examiner’s Use (c) To test Hypothesis 2: Traffic congestion occurs at all sites going towards and away from the road junction, the students used their results to calculate an index of traffic flow for each site. The index is shown in Table 2 below. Table 2 Index of traffic flow vehicle type number of points allocated* bike / motor bike 0.5 car 1.0 van / minibus 2.0 lorry / bus 3.0 *more points were allocated to vehicles causing more congestion The results of using this index between 08.00 and 09.00 at site 3 are shown in Table 3 below. Table 3 Index of traffic flow for site 3 between 08.00 and 09.00 vehicle type bikes / motor bikes cars vans / minibuses lorries / buses number counted 8 101 38 13 points 0.5 1.0 2.0 3.0 Index score 4 101 76 39 Total index score between 08.00 and 09.00 at site 3 = 220 (i) Calculate the index scores for site 3 between 11.00 and 12.00 in Table 4 below. [2] Table 4 Index score of traffic flow for site 3 between 11.00 and 12.00 vehicle type bikes / motor bikes cars vans / minibuses lorries / buses number counted 6 107 27 18 points 0.5 1.0 2.0 3.0 Index score 107 54 Total index score between 11.00 and 12.00 at site 3 = 218 www.theallpapers.com
Question paper, page 6
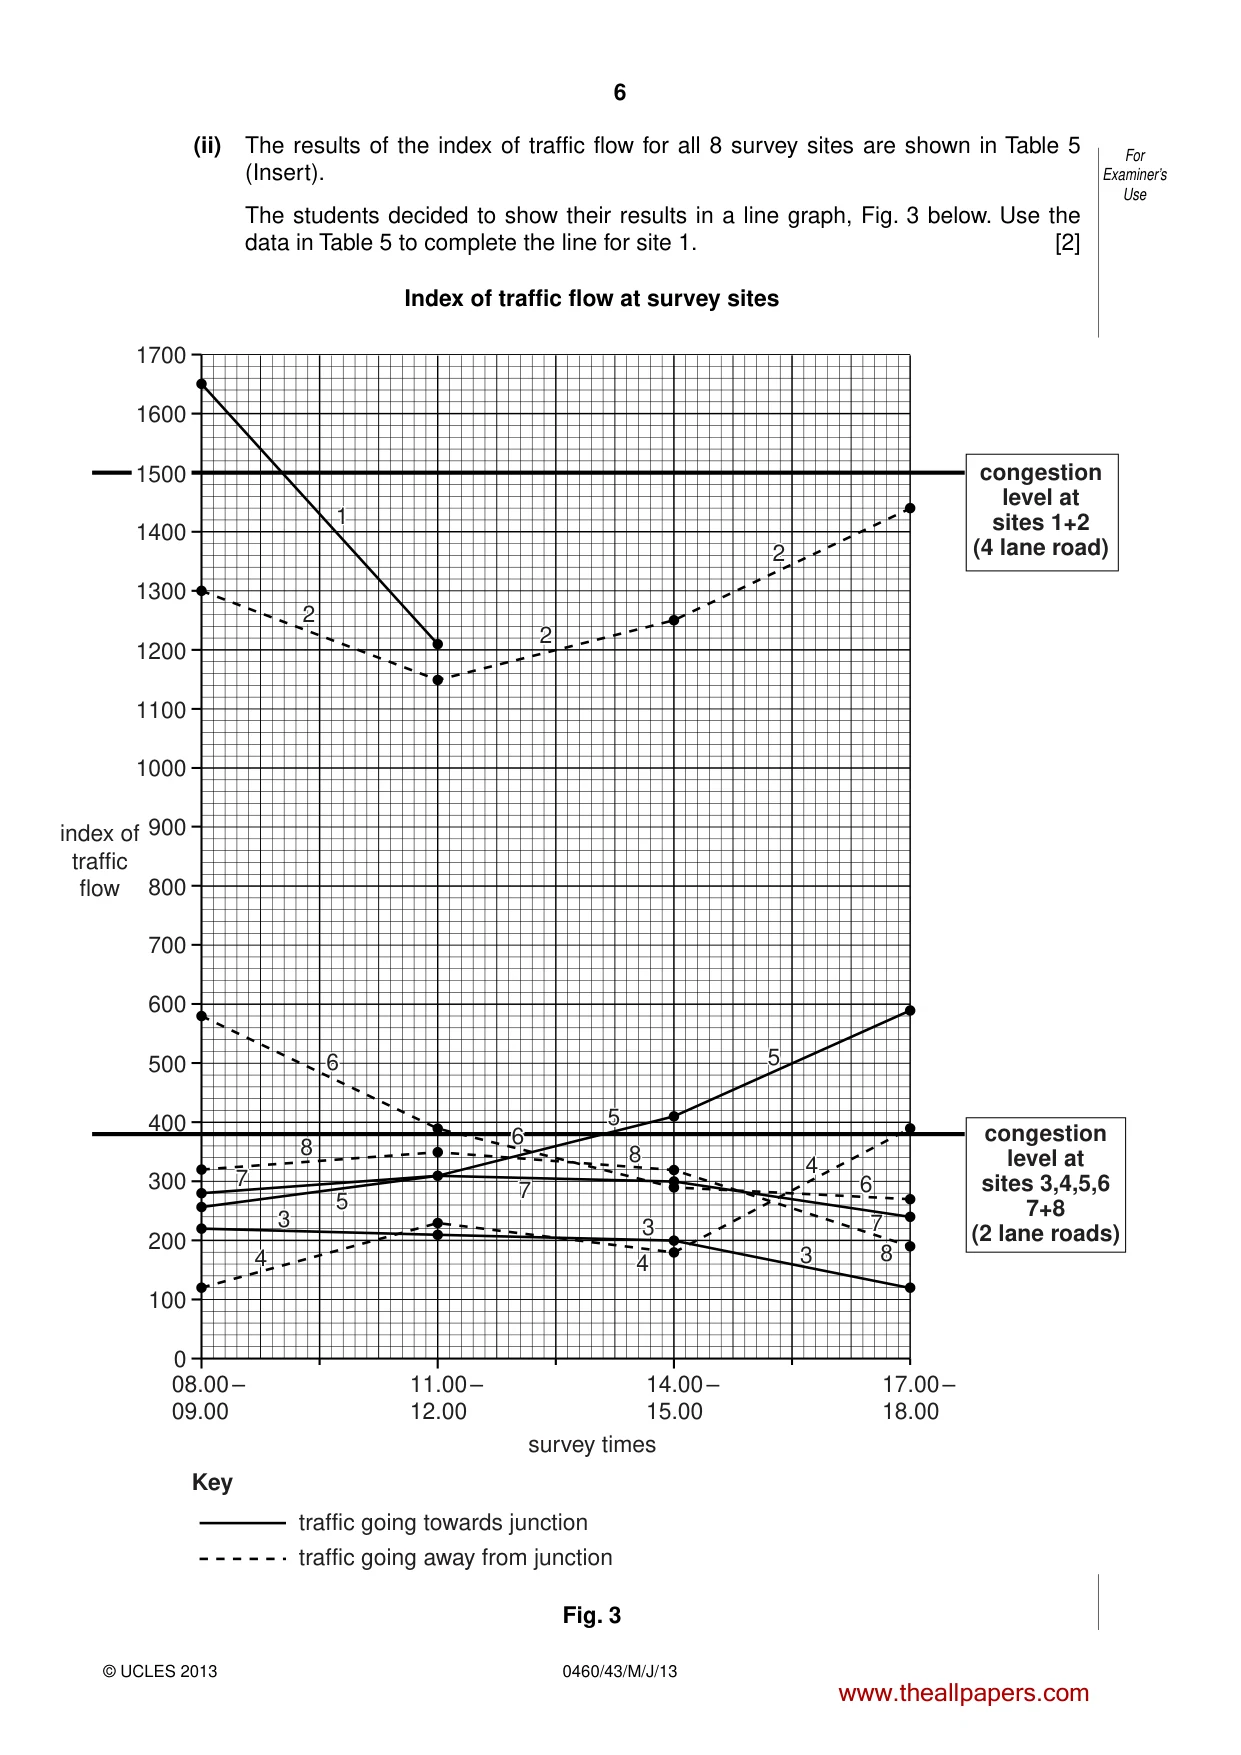
6 0460/43/M/J/13 © UCLES 2013 For Examiner’s Use (ii) The results of the index of traffic flow for all 8 survey sites are shown in Table 5 (Insert). The students decided to show their results in a line graph, Fig. 3 below. Use the data in Table 5 to complete the line for site 1. [2] Index of traffic flow at survey sites 08.00 – 09.00 11.00 – 12.00 14.00 – 15.00 survey times traffic going towards junction traffic going away from junction Key 0 100 200 300 400 500 600 700 index of traffic flow 800 900 1000 1100 1200 1300 1400 congestion level at sites 1+2 (4 lane road) congestion level at sites 3,4,5,6 7+8 (2 lane roads) 1600 1700 17.00 – 18.00 1500 1 2 6 6 6 8 7 7 7 8 8 3 5 5 5 3 3 4 4 4 2 2 Fig. 3 www.theallpapers.com
Question paper, page 7
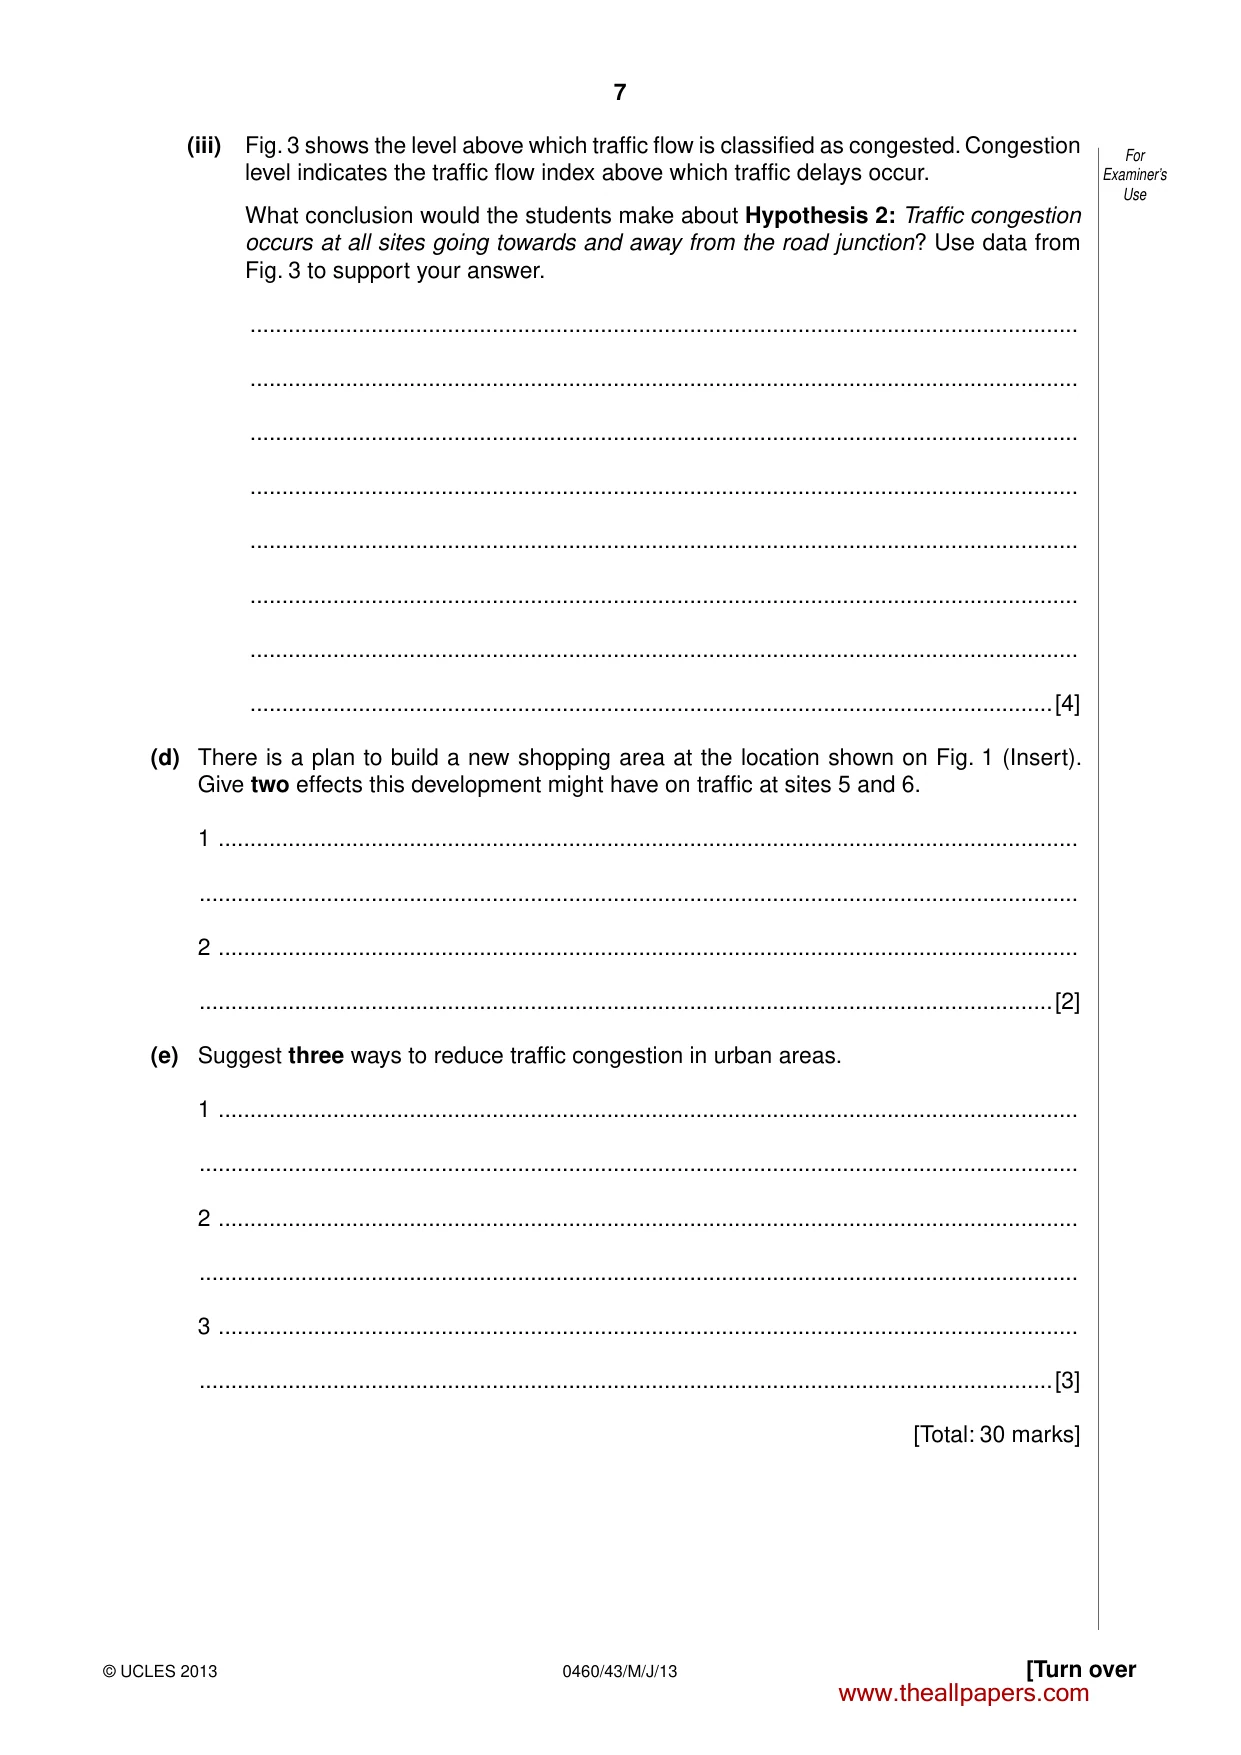
7 [Turn over © UCLES 2013 0460/43/M/J/13 For Examiner’s Use (iii) Fig. 3 shows the level above which traffic flow is classified as congested. Congestion level indicates the traffic flow index above which traffic delays occur. What conclusion would the students make about Hypothesis 2: Traffic congestion occurs at all sites going towards and away from the road junction? Use data from Fig. 3 to support your answer. … … … … … … … …[4] (d) There is a plan to build a new shopping area at the location shown on Fig. 1 (Insert). Give two effects this development might have on traffic at sites 5 and 6. 1 … … 2 … …[2] (e) Suggest three ways to reduce traffic congestion in urban areas. 1 … … 2 … … 3 … …[3] [Total: 30 marks] www.theallpapers.com
Question paper, page 8
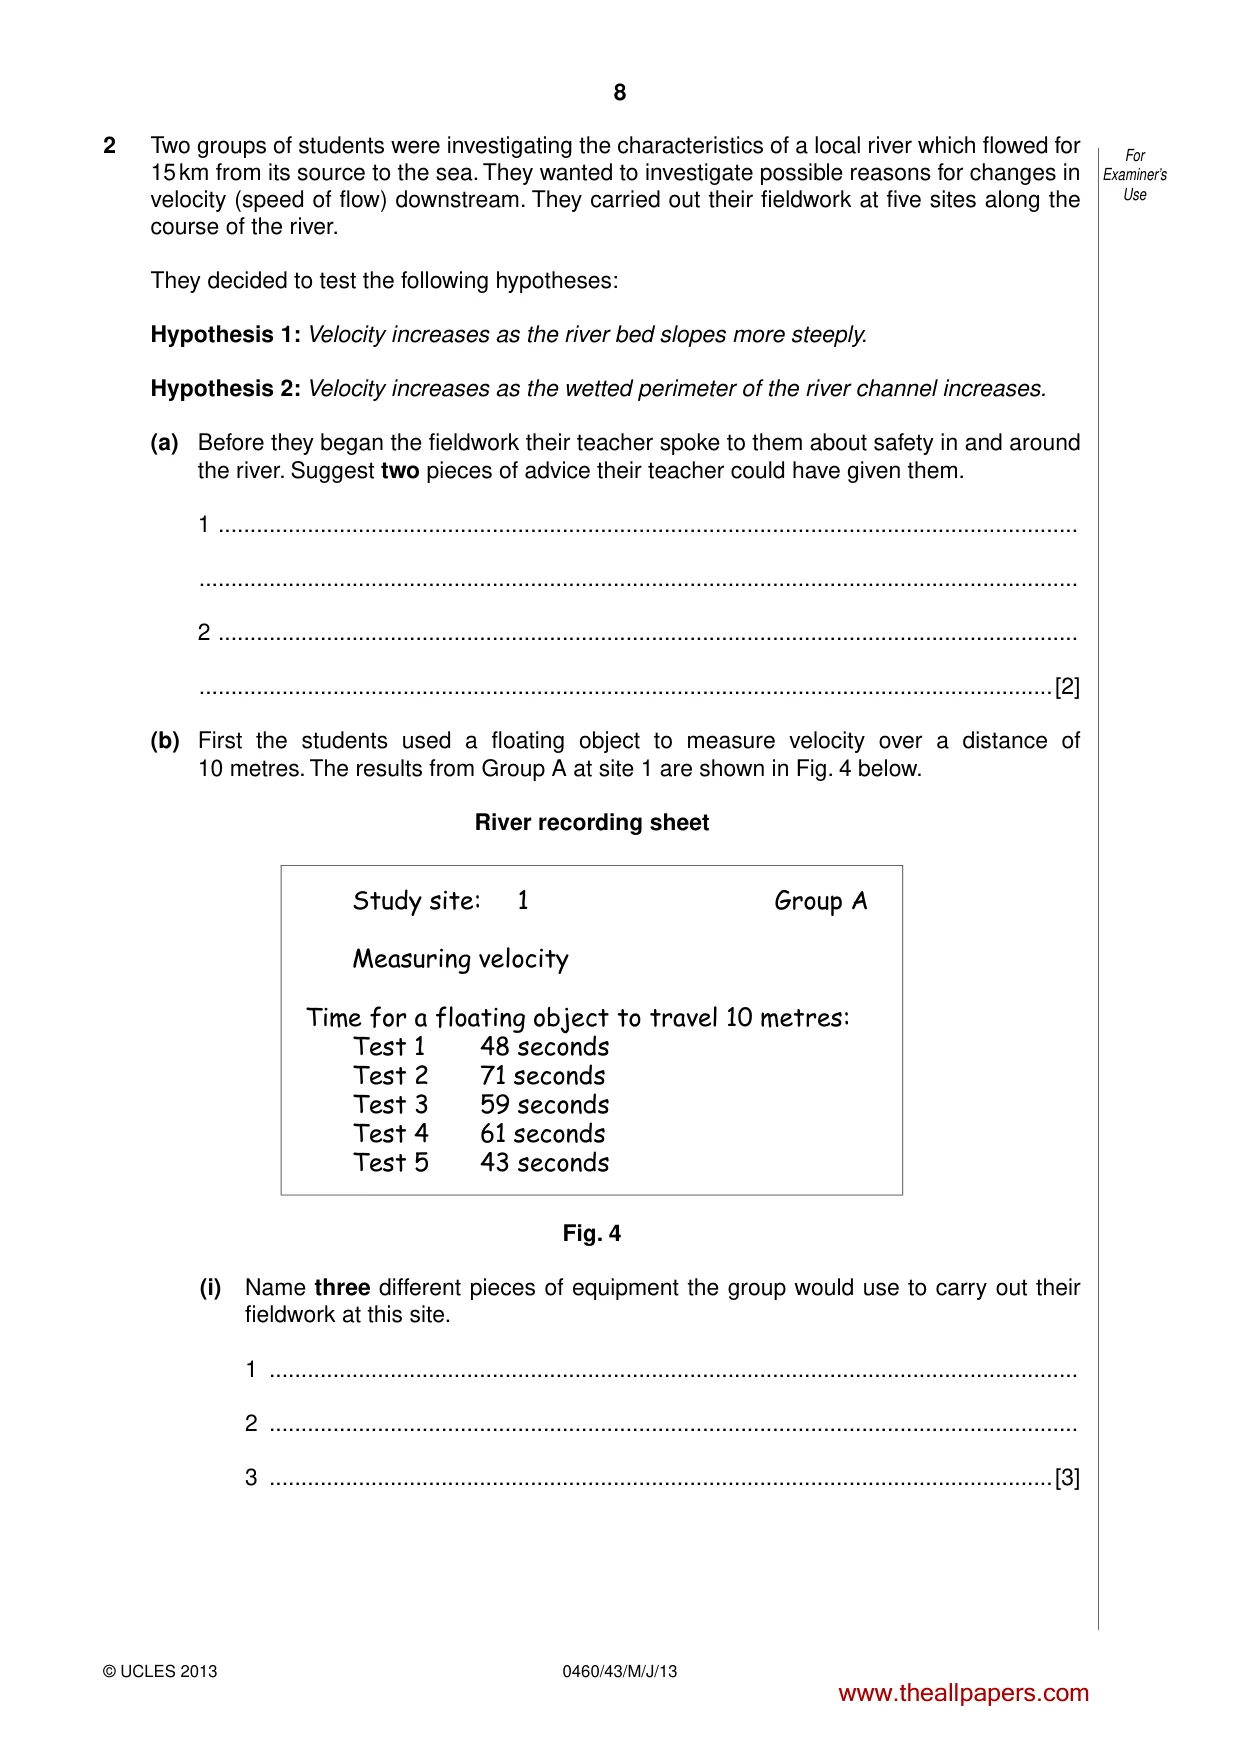
8 0460/43/M/J/13 © UCLES 2013 For Examiner’s Use 2 Two groups of students were investigating the characteristics of a local river which flowed for 15 km from its source to the sea. They wanted to investigate possible reasons for changes in velocity (speed of flow) downstream. They carried out their fieldwork at five sites along the course of the river. They decided to test the following hypotheses: Hypothesis 1: Velocity increases as the river bed slopes more steeply. Hypothesis 2: Velocity increases as the wetted perimeter of the river channel increases. (a) Before they began the fieldwork their teacher spoke to them about safety in and around the river. Suggest two pieces of advice their teacher could have given them. 1 … … 2 … …[2] (b) First the students used a floating object to measure velocity over a distance of 10 metres. The results from Group A at site 1 are shown in Fig. 4 below. River recording sheet Study site: 1 Group A Measuring velocity Time for a floating object to travel 10 metres: Test 1 48 seconds Test 2 71 seconds Test 3 59 seconds Test 4 61 seconds Test 5 43 seconds Fig. 4 (i) Name three different pieces of equipment the group would use to carry out their fieldwork at this site. 1 … 2 … 3 …[3] www.theallpapers.com
Question paper, page 9
9 [Turn over © UCLES 2013 0460/43/M/J/13 For Examiner’s Use (ii) Calculate the average velocity at site 1 using the results shown in Fig. 4. Show your working and your answer in the box below. [3] Study site: 1 Group A Average (mean) length of time to float 10 metres = Average velocity = distance average time Average velocity = metres per second (iii) When they had completed their measurements at site 1 the two groups compared their results. These results are shown in Table 6 below. Table 6 Times for a floating object to travel 10 metres at site 1 Group A Group B Test 1 48 seconds 38 seconds Test 2 71 seconds 27 seconds Test 3 59 seconds 49 seconds Test 4 61 seconds 29 seconds Test 5 43 seconds 31 seconds Suggest two reasons why the results obtained by the two groups were different. 1 … … 2 … …[2] www.theallpapers.com
Question paper, page 10
10 0460/43/M/J/13 © UCLES 2013 For Examiner’s Use (iv) At each site the students also measured the downstream slope (gradient) of the river bed using a clinometer and ranging poles. Photograph A (Insert) shows the measurement being taken. Describe how the students measured the downstream slope. … … … … … …[3] (v) The downstream slope and average velocity results which group B obtained at the five sampling sites are shown in Table 7 below. Table 7 Results of group B site gradient (degrees) average velocity (m/s) nearest source 1 8 0.29 2 6 0.43 3 5 0.37 4 3 0.46 5 nearest mouth 1 0.47 What conclusion would the students have made about Hypothesis 1: Velocity increases as the river bed slopes more steeply? Use evidence from Table 7 to support the conclusion. … … … … … …[3] www.theallpapers.com
Question paper, page 11
11 © UCLES 2013 0460/43/M/J/13 For Examiner’s Use [Turn over (c) To investigate Hypothesis 2: Velocity increases as the wetted perimeter of the river channel increases, the students needed to measure the width of the river channel and the depth of the river at each site. (i) Complete Fig. 5 below to identify the two different pieces of equipment used to measure the width of the river. [2] river Fig. 5 (ii) The students measured the depth of the river every 0.5 m across the channel. Their results for site 1 are shown in Table 8, below. Table 8 Results for site 1 Distance across channel (m) 0.5 1.0 1.5 2.0 2.5 3.0 Depth of river (m) 0.18 0.20 0.25 0.40 0.30 0.20 Use these results to complete Fig. 6 below, the cross-section of the channel at site 1. [2] Cross-section of channel at site 1 0.5 0.5 0 1.0 1.5 width of channel (m) depth of channel (m) 2.0 2.5 3.0 3.5 0.4 0.3 0.2 0.1 0 Fig. 6 www.theallpapers.com
Question paper, page 12
12 0460/43/M/J/13 © UCLES 2013 For Examiner’s Use (iii) Photograph B (Insert) shows how students measured the wetted perimeter of a river. The wetted perimeter is the part of the channel cross-section which the river touches. Their method is described in Fig. 7, below, which is part of a student’s fieldwork notebook. Extract from fieldwork notebook Measuring the wetted perimeter The tape measure was placed along the bed of the river, starting and finishing at water level on both banks. To make the method more accurate a student walked along it to cross the river. Fig. 7 The students’ results are shown in Table 9 (Insert). Use these results to complete Fig. 8 below by plotting the result for site 1. [1] Scatter graph of length of wetted perimeter and average velocity 0 1 2 3 0 0.05 0.1 0.15 0.2 0.25 average velocity (m/s) 0.3 0.35 0.4 0.45 0.5 4 5 6 wetted perimeter (m) 7 8 9 10 11 12 13 2 4 3 5 Fig. 8 www.theallpapers.com
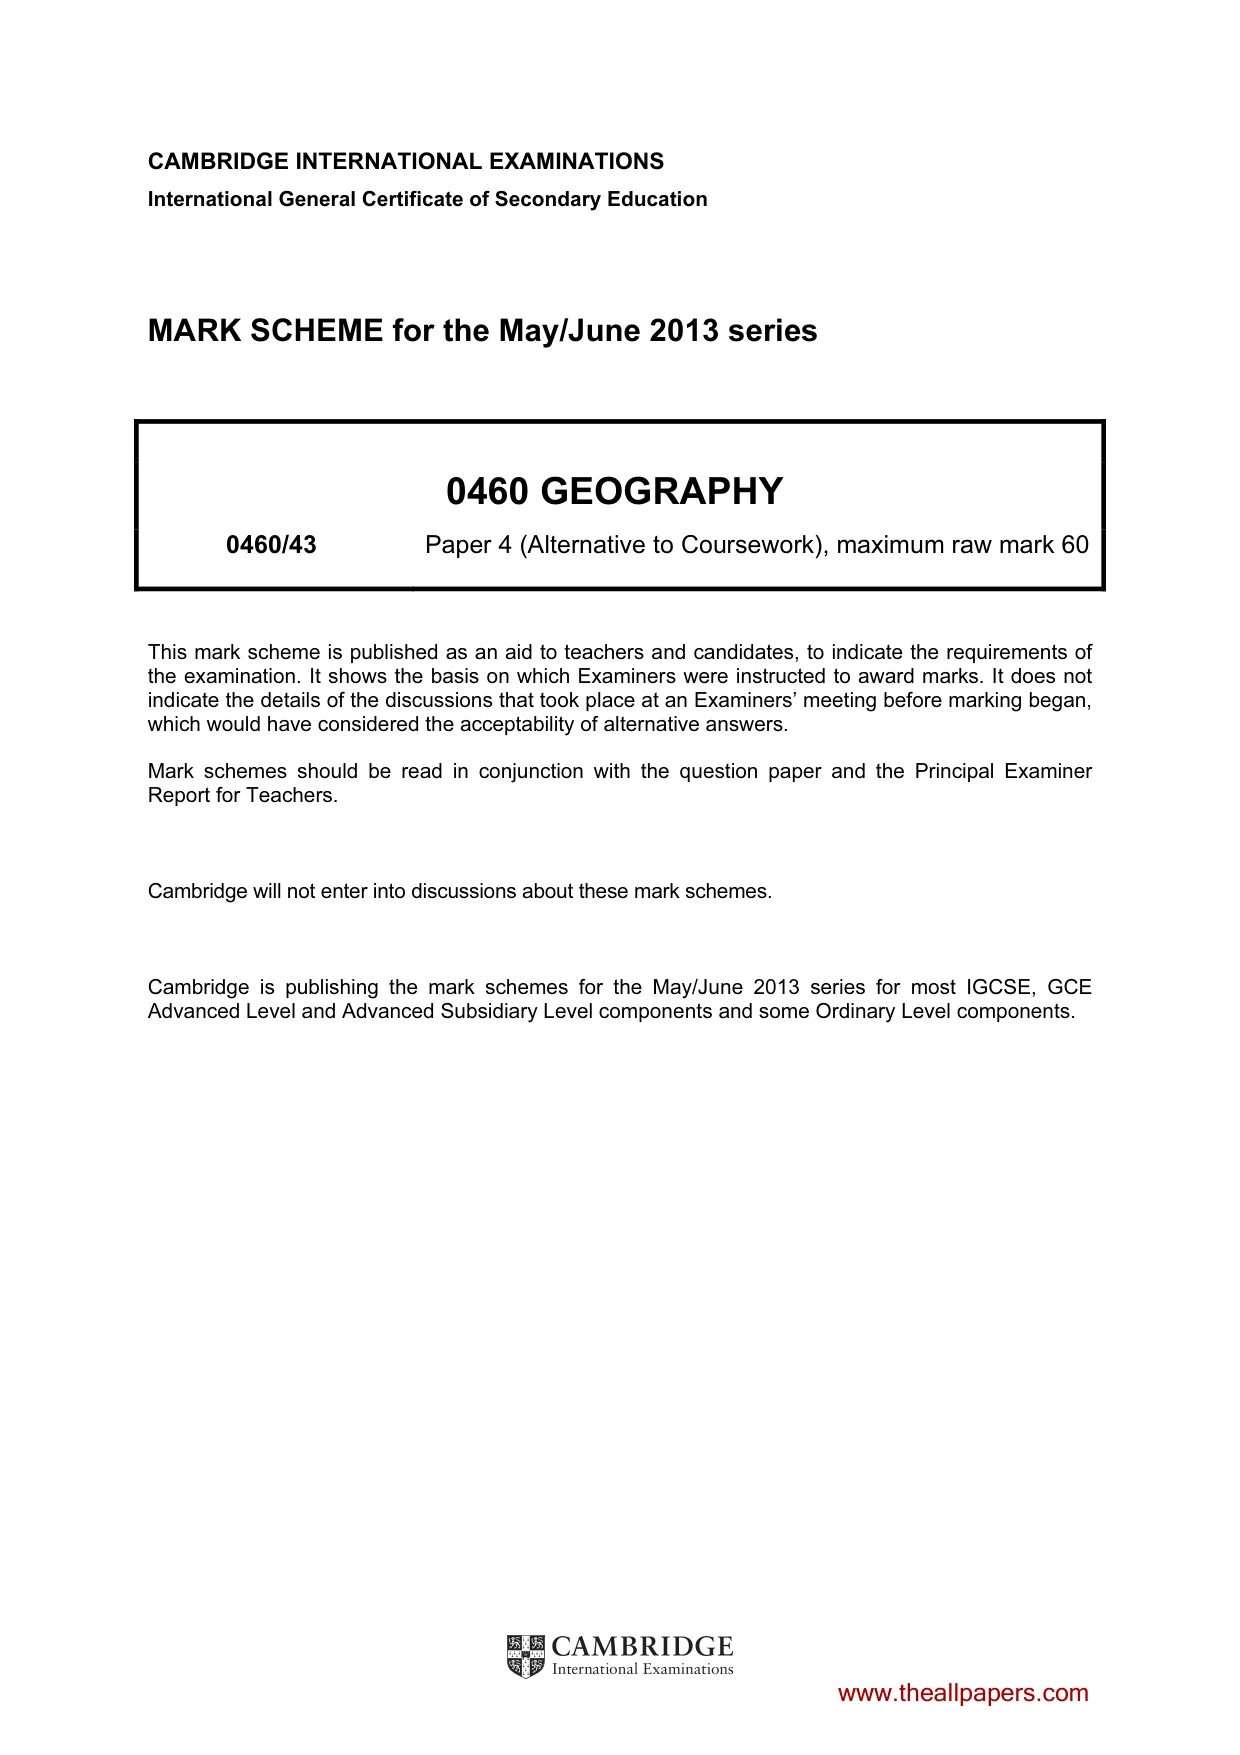
Question paper, page 13
13 © UCLES 2013 0460/43/M/J/13 For Examiner’s Use (iv) Do their results support Hypothesis 2: Velocity increases as the wetted perimeter of the river channel increases? Support your conclusion with evidence from Table 9 and Fig. 8. … … … … … …[3] (v) Suggest two disadvantages of their method for measuring the wetted perimeter in a large river. 1 … … 2 … …[2] (d) To extend their fieldwork the students investigated the impact of people on the river. State one impact people may have on a river. Describe how the impact could be investigated. Impact of people … … Investigation … … … … … …[4] [Total: 30 marks] www.theallpapers.com
Question paper, page 14
14 0460/43/M/J/13 © UCLES 2013 BLANK PAGE www.theallpapers.com
Question paper, page 15
15 0460/43/M/J/13 © UCLES 2013 BLANK PAGE www.theallpapers.com
Question paper, page 16
16 0460/43/M/J/13 © UCLES 2013 Copyright Acknowledgements: Question 2 Photograph A © www.georesources.co.uk/darentfte2. Question 2 Photograph B © Amy Hatchwell; Royal Geographical Society; www.rgs.org/OurWork/Schools/Fieldwork+and+local+learning/Fieldwork+techniques/Rivers. Permission to reproduce items where third-party owned material protected by copyright is included has been sought and cleared where possible. Every reasonable effort has been made by the publisher (UCLES) to trace copyright holders, but if any items requiring clearance have unwittingly been included, the publisher will be pleased to make amends at the earliest possible opportunity. University of Cambridge International Examinations is part of the Cambridge Assessment Group. Cambridge Assessment is the brand name of University of Cambridge Local Examinations Syndicate (UCLES), which is itself a department of the University of Cambridge. BLANK PAGE www.theallpapers.com
Mark scheme, page 1
CAMBRIDGE INTERNATIONAL EXAMINATIONS International General Certificate of Secondary Education MARK SCHEME for the May/June 2013 series 0460 GEOGRAPHY 0460/43 Paper 4 (Alternative to Coursework), maximum raw mark 60 This mark scheme is published as an aid to teachers and candidates, to indicate the requirements of the examination. It shows the basis on which Examiners were instructed to award marks. It does not indicate the details of the discussions that took place at an Examiners’ meeting before marking began, which would have considered the acceptability of alternative answers. Mark schemes should be read in conjunction with the question paper and the Principal Examiner Report for Teachers. Cambridge will not enter into discussions about these mark schemes. Cambridge is publishing the mark schemes for the May/June 2013 series for most IGCSE, GCE Advanced Level and Advanced Subsidiary Level components and some Ordinary Level components. www.theallpapers.com
Mark scheme, page 2
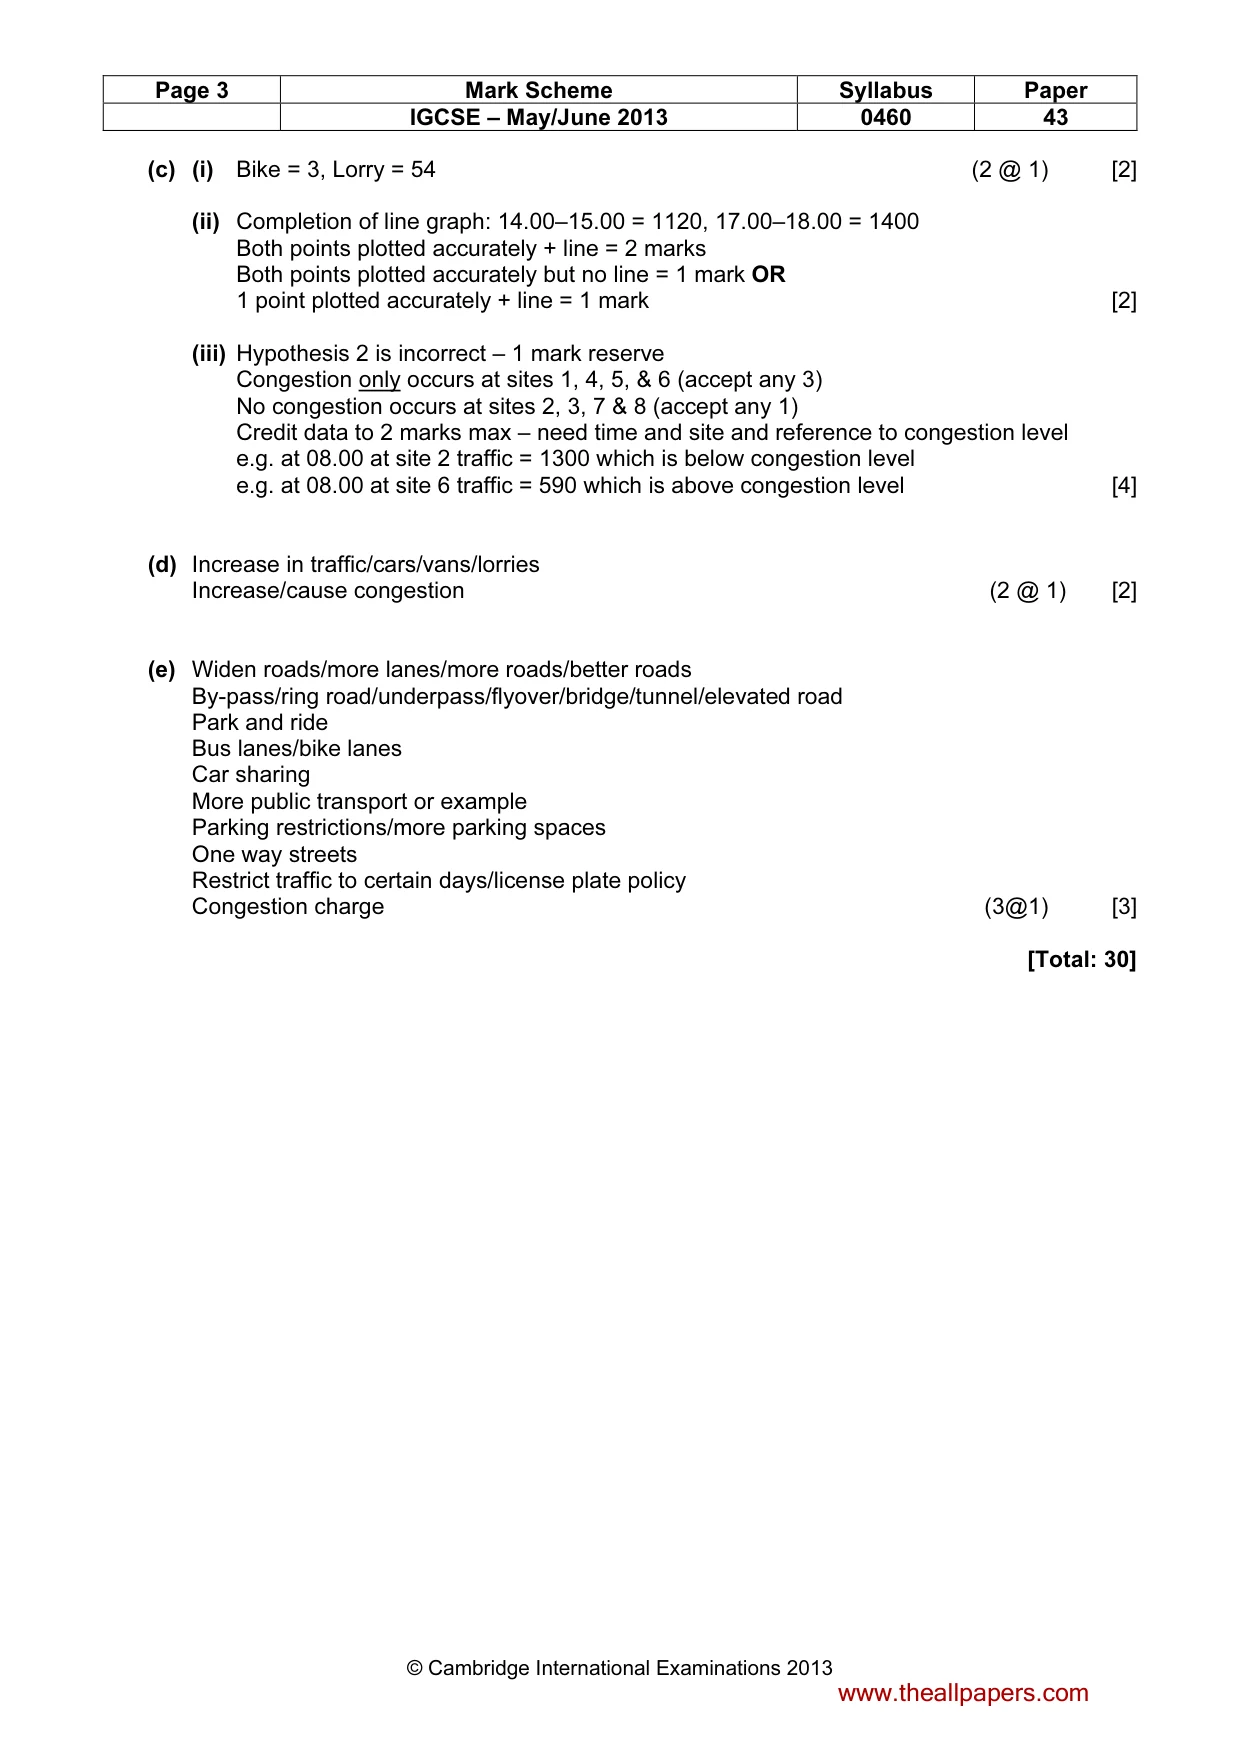
Page 2 Mark Scheme Syllabus Paper IGCSE – May/June 2013 0460 43 © Cambridge International Examinations 2013 1 (a) (i) Go to 2 sites on each road/opposite sides of road Split into groups/pairs Organise tasks within group Which points on the roads to do the survey Which day/when to do the survey What equipment they would need – stopwatch/clock/counters/clickers Synchronising timing/start & finish at same time Agree vehicle categories Information to include on recording sheet/put location or date Method – tally count/automatic counters [4] (ii) Being unable to count accurately at busy times/lots of traffic/traffic going too fast/too many lanes to count. Students losing concentration/bored/no break Breathing difficulties/breathing exhaust fumes Timings is hard to synchronise Specific weather difficulty – e.g. rain ruins paper/sunstroke Keep returning to do count/meet at different times (3 @ 1) [3] (b) (i) 158 [1] (ii) Completion of divided bar graph – van/minibus to 140 & lorry/bus to 158 for 1 mark each. Don’t need V & L [2] (iii) Pie Chart [1] (iv) Hypothesis is true – 1 mark reserve Total number of vehicles decreases during day Bikes also decreases during day Cars/vans/lorries slightly increase then decrease/decrease overall Paired data to show changes to 2 mark max – need 2 times of day & figures e.g. at 08.00 total was 160 & at 14.00 total was 126 e.g. at 08.00 there were 8 bikes and 2 bikes at 17.00 [4] (v) Number: less vehicles at site 7/more at site 3 Type: more lorries/vans/less cars at site 7 Need comparison (2 @ 1) [2] www.theallpapers.com
Mark scheme, page 3
Page 3 Mark Scheme Syllabus Paper IGCSE – May/June 2013 0460 43 © Cambridge International Examinations 2013 (c) (i) Bike = 3, Lorry = 54 (2 @ 1) [2] (ii) Completion of line graph: 14.00–15.00 = 1120, 17.00–18.00 = 1400 Both points plotted accurately + line = 2 marks Both points plotted accurately but no line = 1 mark OR 1 point plotted accurately + line = 1 mark [2] (iii) Hypothesis 2 is incorrect – 1 mark reserve Congestion only occurs at sites 1, 4, 5, & 6 (accept any 3) No congestion occurs at sites 2, 3, 7 & 8 (accept any 1) Credit data to 2 marks max – need time and site and reference to congestion level e.g. at 08.00 at site 2 traffic = 1300 which is below congestion level e.g. at 08.00 at site 6 traffic = 590 which is above congestion level [4] (d) Increase in traffic/cars/vans/lorries Increase/cause congestion (2 @ 1) [2] (e) Widen roads/more lanes/more roads/better roads By-pass/ring road/underpass/flyover/bridge/tunnel/elevated road Park and ride Bus lanes/bike lanes Car sharing More public transport or example Parking restrictions/more parking spaces One way streets Restrict traffic to certain days/license plate policy Congestion charge (3@1) [3] [Total: 30] www.theallpapers.com
Mark scheme, page 4
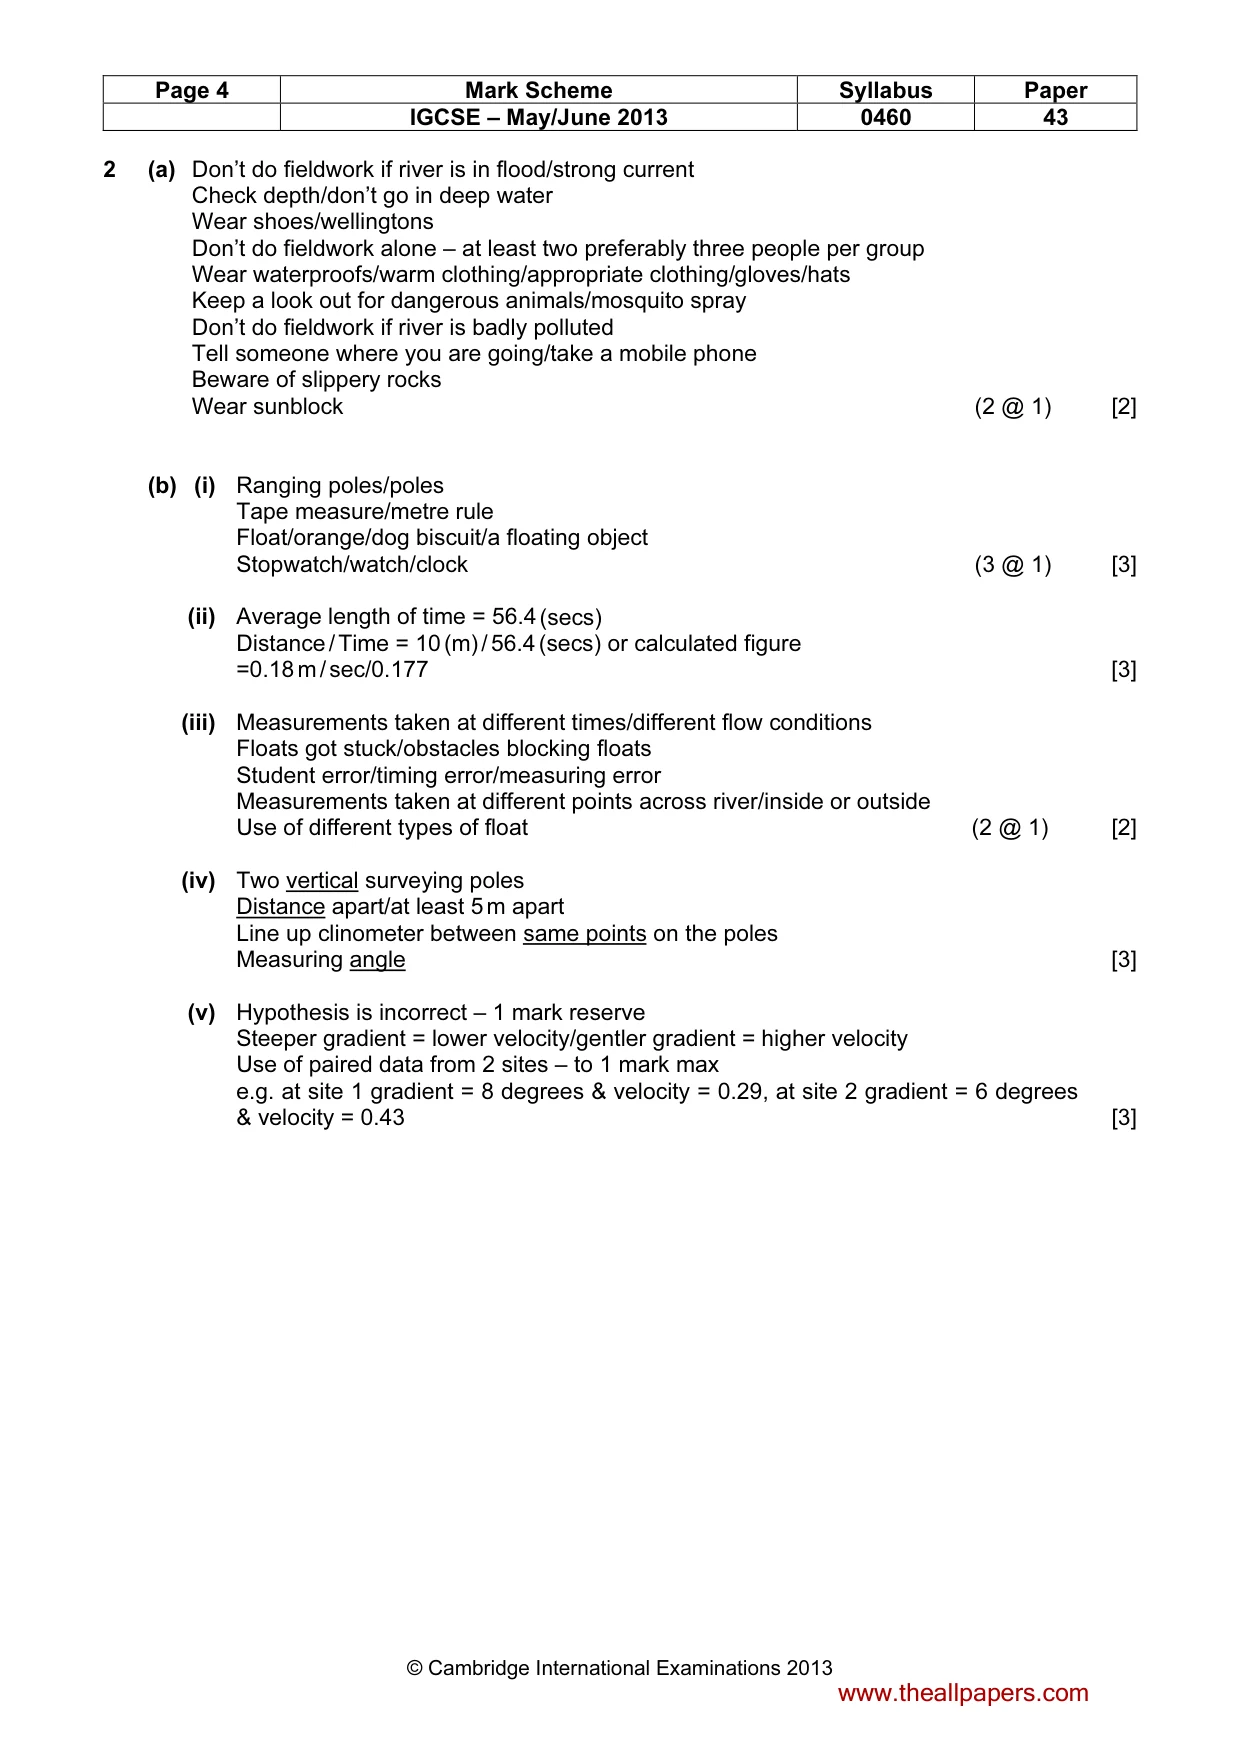
Page 4 Mark Scheme Syllabus Paper IGCSE – May/June 2013 0460 43 © Cambridge International Examinations 2013 2 (a) Don’t do fieldwork if river is in flood/strong current Check depth/don’t go in deep water Wear shoes/wellingtons Don’t do fieldwork alone – at least two preferably three people per group Wear waterproofs/warm clothing/appropriate clothing/gloves/hats Keep a look out for dangerous animals/mosquito spray Don’t do fieldwork if river is badly polluted Tell someone where you are going/take a mobile phone Beware of slippery rocks Wear sunblock (2 @ 1) [2] (b) (i) Ranging poles/poles Tape measure/metre rule Float/orange/dog biscuit/a floating object Stopwatch/watch/clock (3 @ 1) [3] (ii) Average length of time = 56.4 (secs) Distance / Time = 10 (m) / 56.4 (secs) or calculated figure =0.18 m / sec/0.177 [3] (iii) Measurements taken at different times/different flow conditions Floats got stuck/obstacles blocking floats Student error/timing error/measuring error Measurements taken at different points across river/inside or outside Use of different types of float (2 @ 1) [2] (iv) Two vertical surveying poles Distance apart/at least 5 m apart Line up clinometer between same points on the poles Measuring angle [3] (v) Hypothesis is incorrect – 1 mark reserve Steeper gradient = lower velocity/gentler gradient = higher velocity Use of paired data from 2 sites – to 1 mark max e.g. at site 1 gradient = 8 degrees & velocity = 0.29, at site 2 gradient = 6 degrees & velocity = 0.43 [3] www.theallpapers.com
Mark scheme, page 5
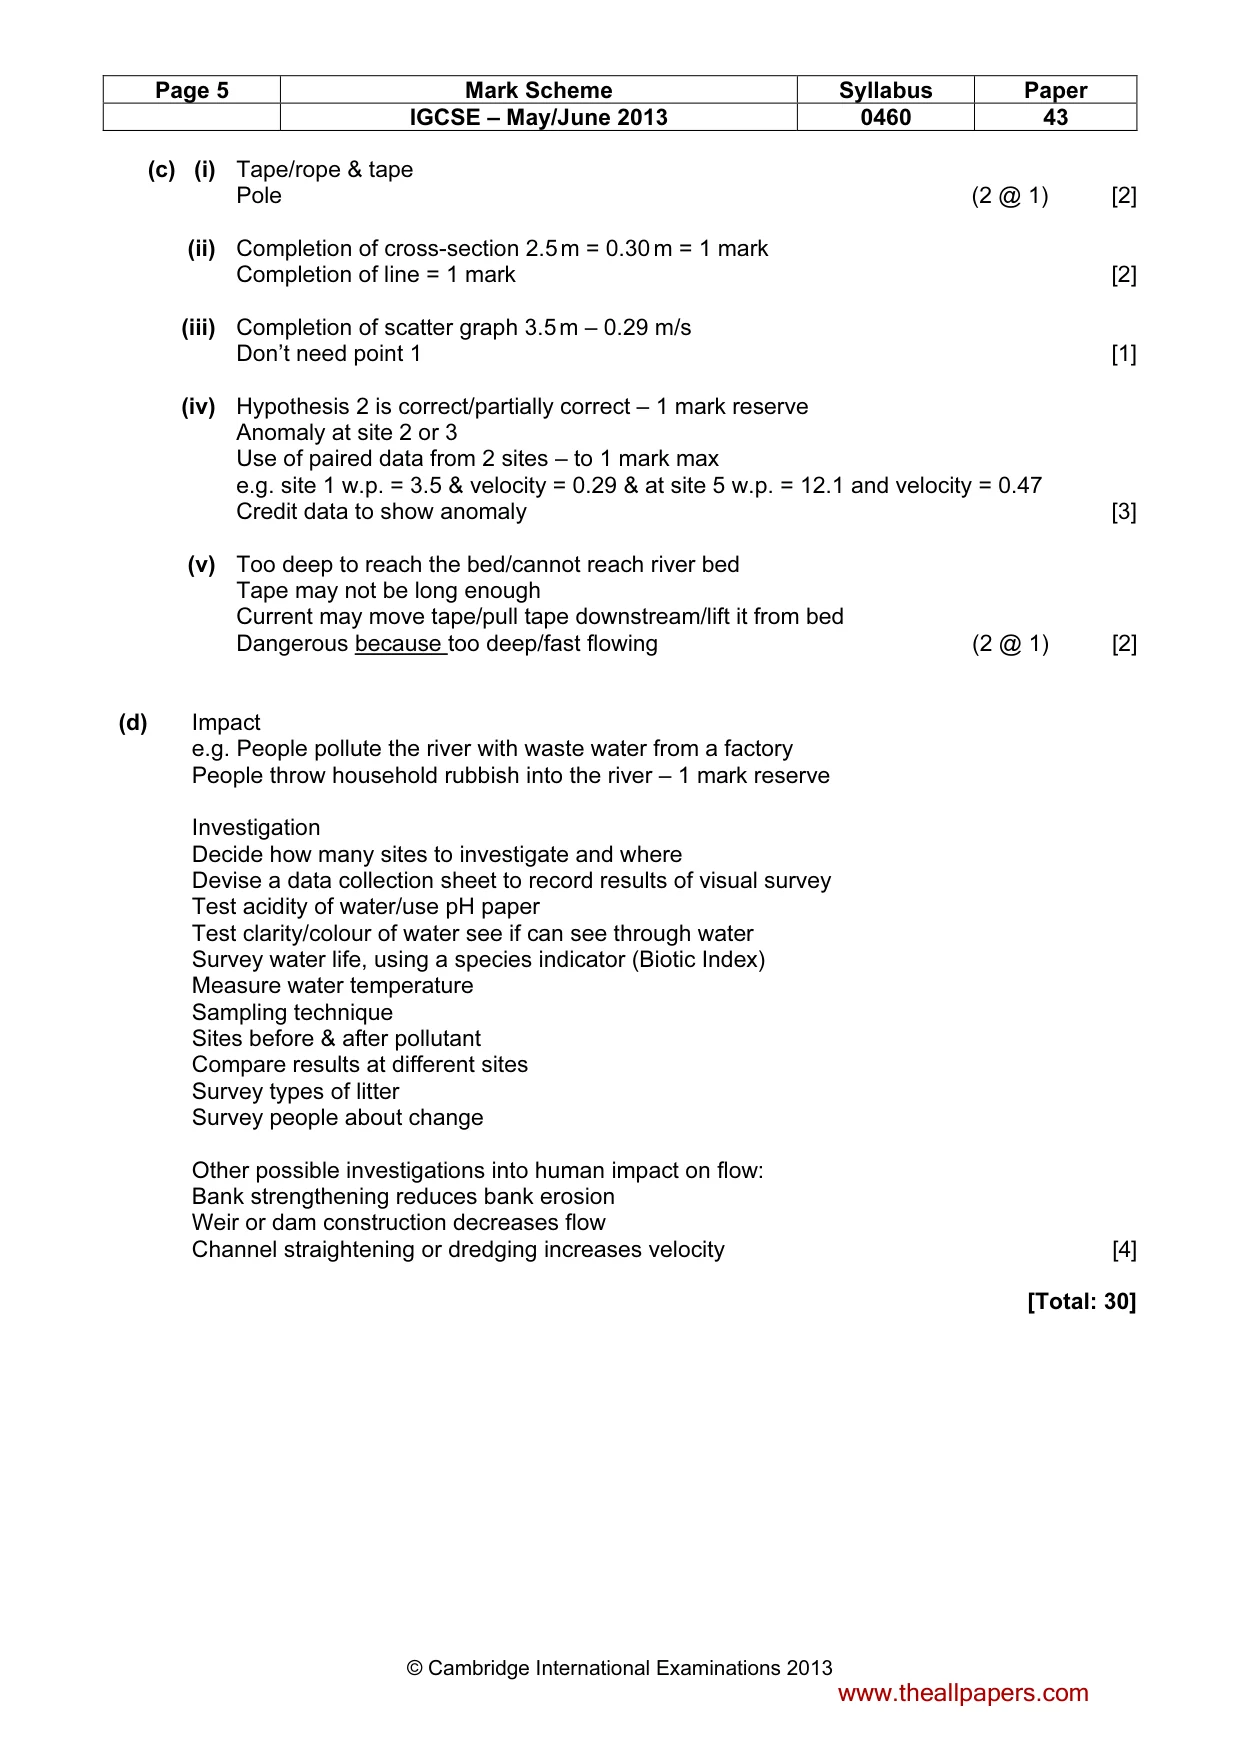
Page 5 Mark Scheme Syllabus Paper IGCSE – May/June 2013 0460 43 © Cambridge International Examinations 2013 (c) (i) Tape/rope & tape Pole (2 @ 1) [2] (ii) Completion of cross-section 2.5 m = 0.30 m = 1 mark Completion of line = 1 mark [2] (iii) Completion of scatter graph 3.5 m – 0.29 m/s Don’t need point 1 [1] (iv) Hypothesis 2 is correct/partially correct – 1 mark reserve Anomaly at site 2 or 3 Use of paired data from 2 sites – to 1 mark max e.g. site 1 w.p. = 3.5 & velocity = 0.29 & at site 5 w.p. = 12.1 and velocity = 0.47 Credit data to show anomaly [3] (v) Too deep to reach the bed/cannot reach river bed Tape may not be long enough Current may move tape/pull tape downstream/lift it from bed Dangerous because too deep/fast flowing (2 @ 1) [2] (d) Impact e.g. People pollute the river with waste water from a factory People throw household rubbish into the river – 1 mark reserve Investigation Decide how many sites to investigate and where Devise a data collection sheet to record results of visual survey Test acidity of water/use pH paper Test clarity/colour of water see if can see through water Survey water life, using a species indicator (Biotic Index) Measure water temperature Sampling technique Sites before & after pollutant Compare results at different sites Survey types of litter Survey people about change Other possible investigations into human impact on flow: Bank strengthening reduces bank erosion Weir or dam construction decreases flow Channel straightening or dredging increases velocity [4] [Total: 30] www.theallpapers.com
What you needed in this session
Cambridge’s own grade thresholds for 2013 May/June, Paper 4 · Variant 3. A higher threshold means an easier paper — the bar moves with how the cohort did.