Cambridge IGCSE Geography 0460 — 2013 May/June Paper 4 · Variant 2
0460/42/M/J/13 · 60 marks · ≈68 min
The question paper and its mark scheme, free to read here and free to download. This is Cambridge’s own paper, exactly as it was sat.
Question paper12 pages

Mark scheme6 pages
Answers below. Sit the paper first if you are practising.
Paper as text
Question paper, page 1
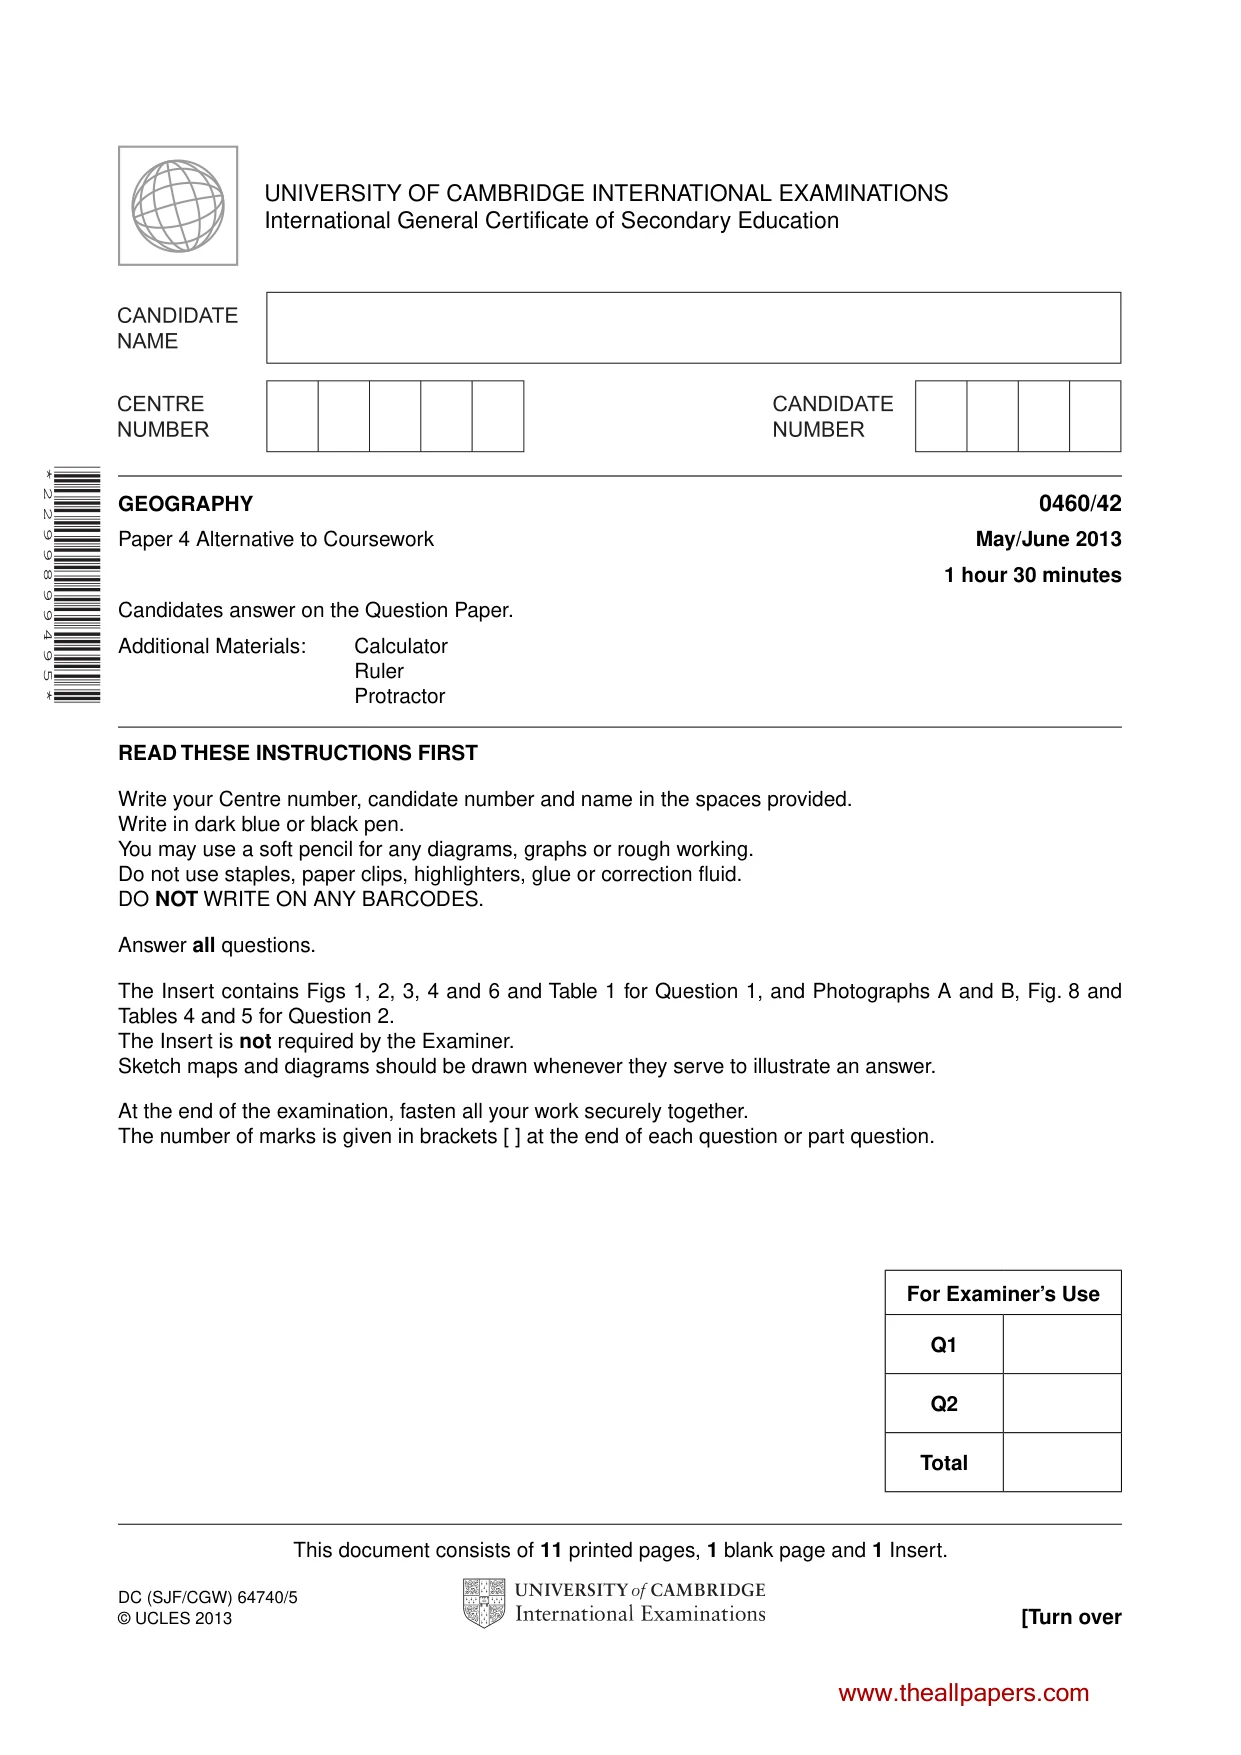
This document consists of 11 printed pages, 1 blank page and 1 Insert. DC (SJF/CGW) 64740/5 © UCLES 2013 [Turn over UNIVERSITY OF CAMBRIDGE INTERNATIONAL EXAMINATIONS International General Certificate of Secondary Education * 2 2 9 9 8 9 9 4 9 5 * GEOGRAPHY 0460/42 Paper 4 Alternative to Coursework May/June 2013 1 hour 30 minutes Candidates answer on the Question Paper. Additional Materials: Calculator Ruler Protractor READ THESE INSTRUCTIONS FIRST Write your Centre number, candidate number and name in the spaces provided. Write in dark blue or black pen. You may use a soft pencil for any diagrams, graphs or rough working. Do not use staples, paper clips, highlighters, glue or correction fluid. DO NOT WRITE ON ANY BARCODES. Answer all questions. The Insert contains Figs 1, 2, 3, 4 and 6 and Table 1 for Question 1, and Photographs A and B, Fig. 8 and Tables 4 and 5 for Question 2. The Insert is not required by the Examiner. Sketch maps and diagrams should be drawn whenever they serve to illustrate an answer. At the end of the examination, fasten all your work securely together. The number of marks is given in brackets [ ] at the end of each question or part question. For Examiner’s Use Q1 Q2 Total www.theallpapers.com
Question paper, page 2
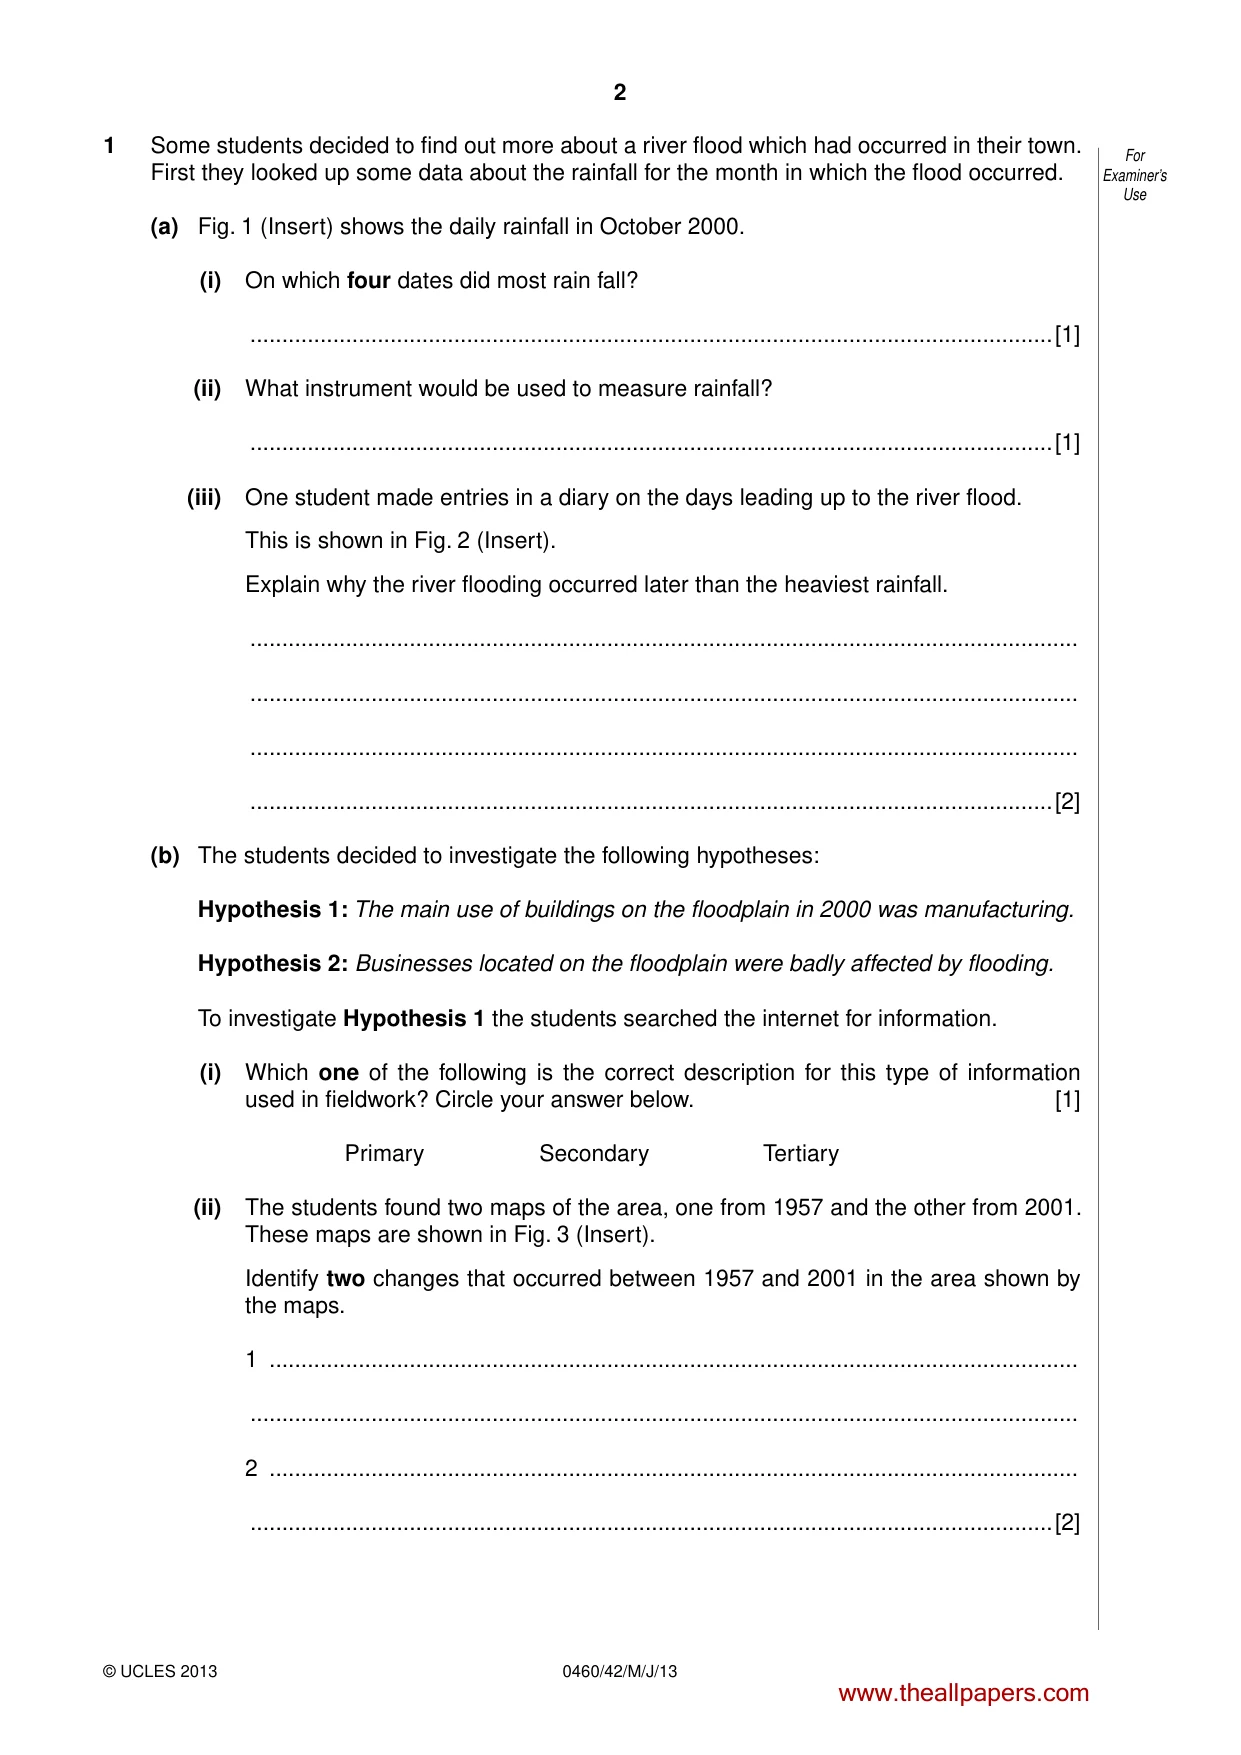
2 0460/42/M/J/13 © UCLES 2013 For Examiner’s Use 1 Some students decided to find out more about a river flood which had occurred in their town. First they looked up some data about the rainfall for the month in which the flood occurred. (a) Fig. 1 (Insert) shows the daily rainfall in October 2000. (i) On which four dates did most rain fall? …[1] (ii) What instrument would be used to measure rainfall? …[1] (iii) One student made entries in a diary on the days leading up to the river flood. This is shown in Fig. 2 (Insert). Explain why the river flooding occurred later than the heaviest rainfall. … … … …[2] (b) The students decided to investigate the following hypotheses: Hypothesis 1: The main use of buildings on the floodplain in 2000 was manufacturing. Hypothesis 2: Businesses located on the floodplain were badly affected by flooding. To investigate Hypothesis 1 the students searched the internet for information. (i) Which one of the following is the correct description for this type of information used in fieldwork? Circle your answer below. [1] Primary Secondary Tertiary (ii) The students found two maps of the area, one from 1957 and the other from 2001. These maps are shown in Fig. 3 (Insert). Identify two changes that occurred between 1957 and 2001 in the area shown by the maps. 1 … … 2 … …[2] www.theallpapers.com
Question paper, page 3
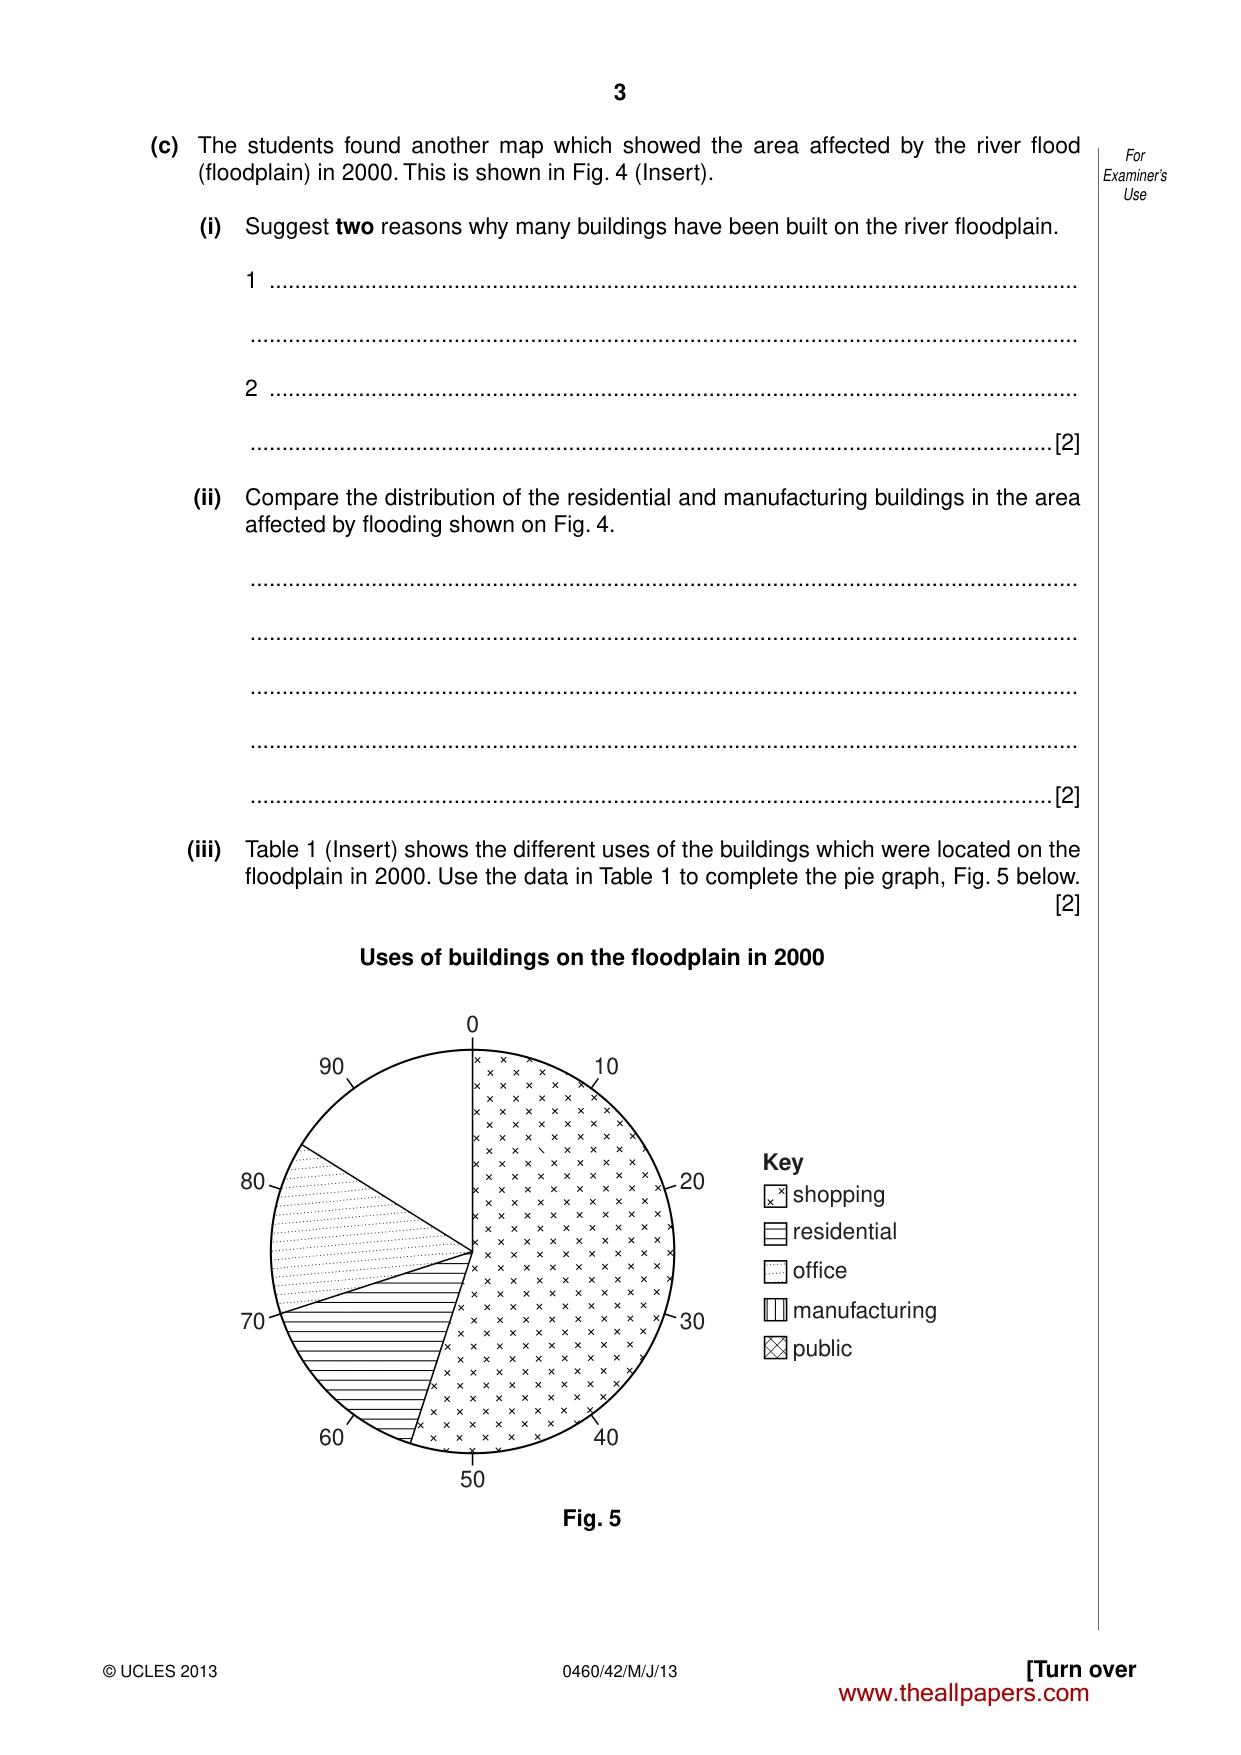
3 0460/42/M/J/13 © UCLES 2013 [Turn over For Examiner’s Use (c) The students found another map which showed the area affected by the river flood (floodplain) in 2000. This is shown in Fig. 4 (Insert). (i) Suggest two reasons why many buildings have been built on the river floodplain. 1 … … 2 … …[2] (ii) Compare the distribution of the residential and manufacturing buildings in the area affected by flooding shown on Fig. 4. … … … … …[2] (iii) Table 1 (Insert) shows the different uses of the buildings which were located on the floodplain in 2000. Use the data in Table 1 to complete the pie graph, Fig. 5 below. [2] Uses of buildings on the floodplain in 2000 0 50 10 40 90 60 20 public Key office residential manufacturing shopping 80 70 30 Fig. 5 www.theallpapers.com
Question paper, page 4
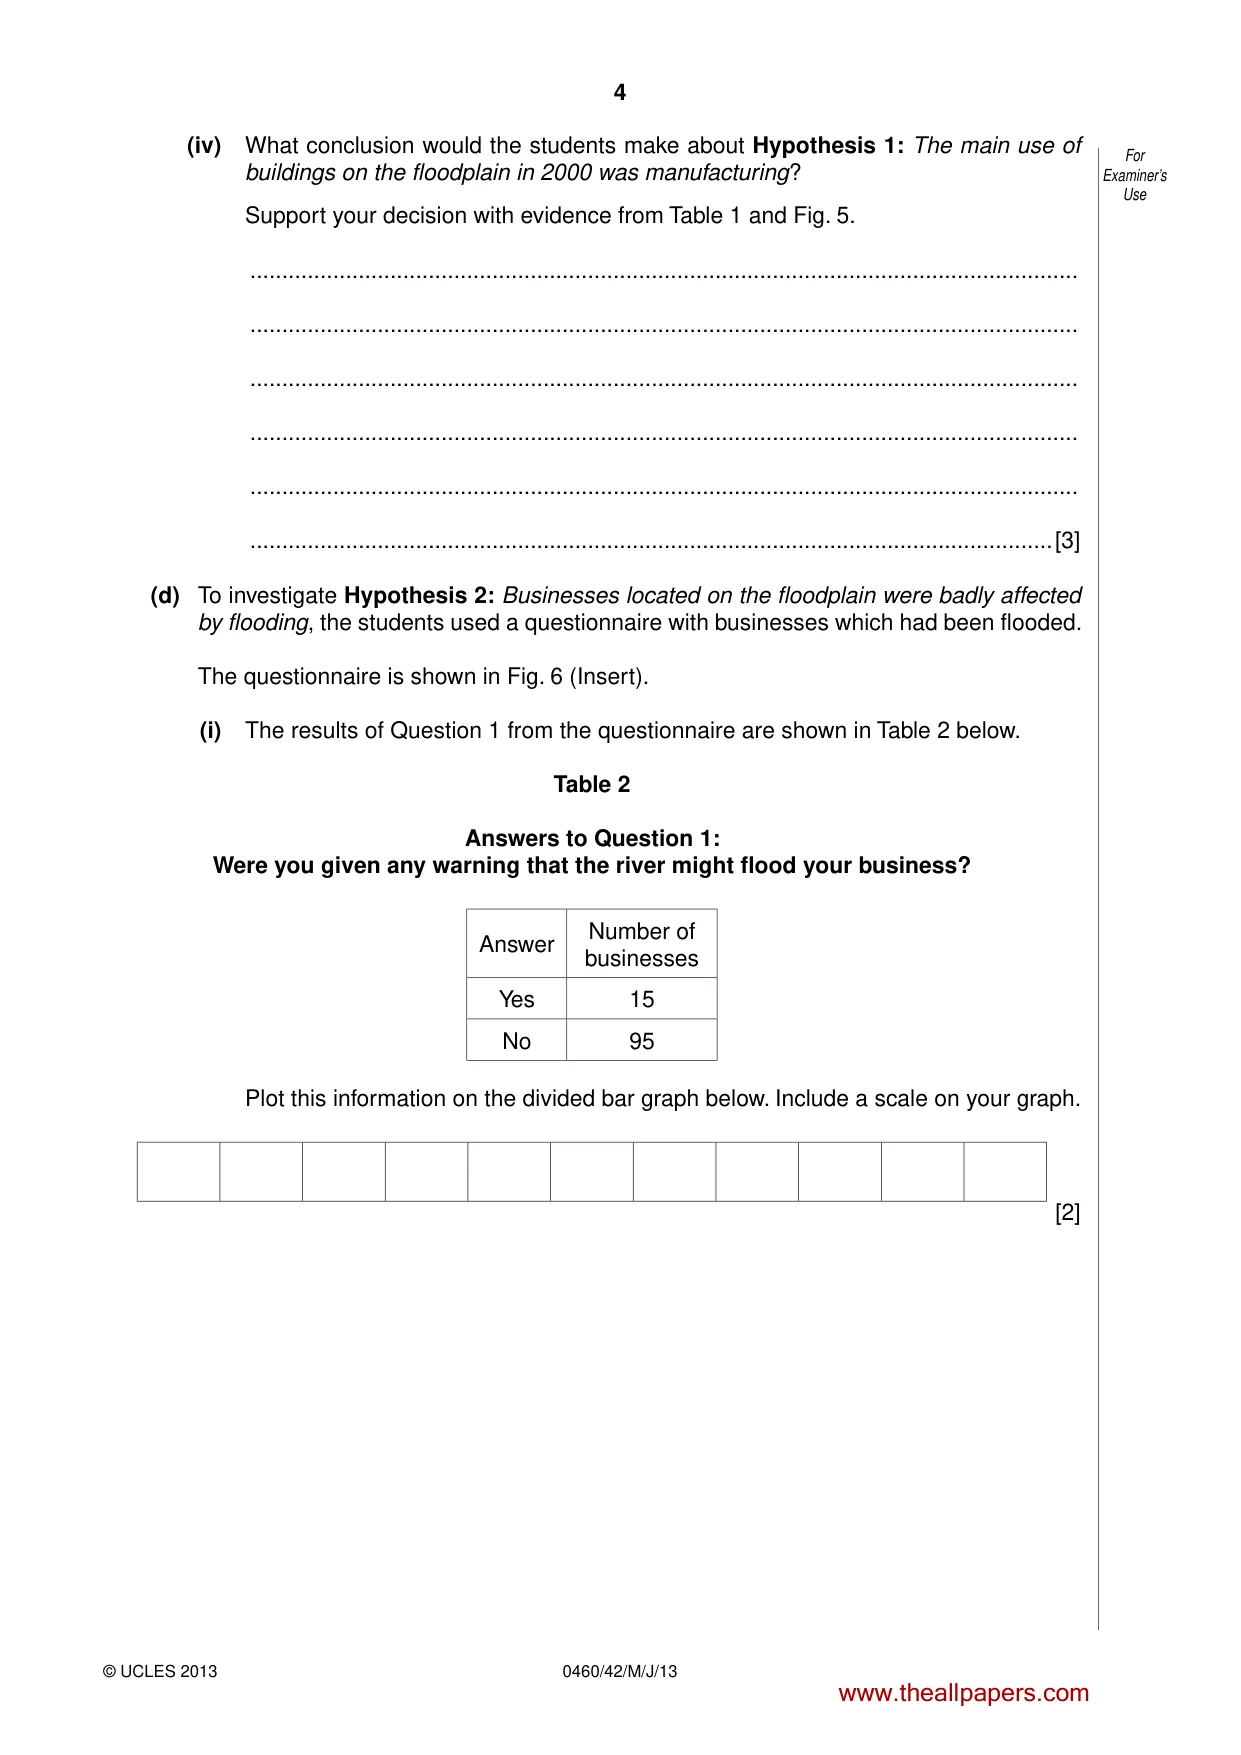
4 0460/42/M/J/13 © UCLES 2013 For Examiner’s Use (iv) What conclusion would the students make about Hypothesis 1: The main use of buildings on the floodplain in 2000 was manufacturing? Support your decision with evidence from Table 1 and Fig. 5. … … … … … …[3] (d) To investigate Hypothesis 2: Businesses located on the floodplain were badly affected by flooding, the students used a questionnaire with businesses which had been flooded. The questionnaire is shown in Fig. 6 (Insert). (i) The results of Question 1 from the questionnaire are shown in Table 2 below. Table 2 Answers to Question 1: Were you given any warning that the river might flood your business? Answer Number of businesses Yes 15 No 95 Plot this information on the divided bar graph below. Include a scale on your graph. [2] www.theallpapers.com
Question paper, page 5
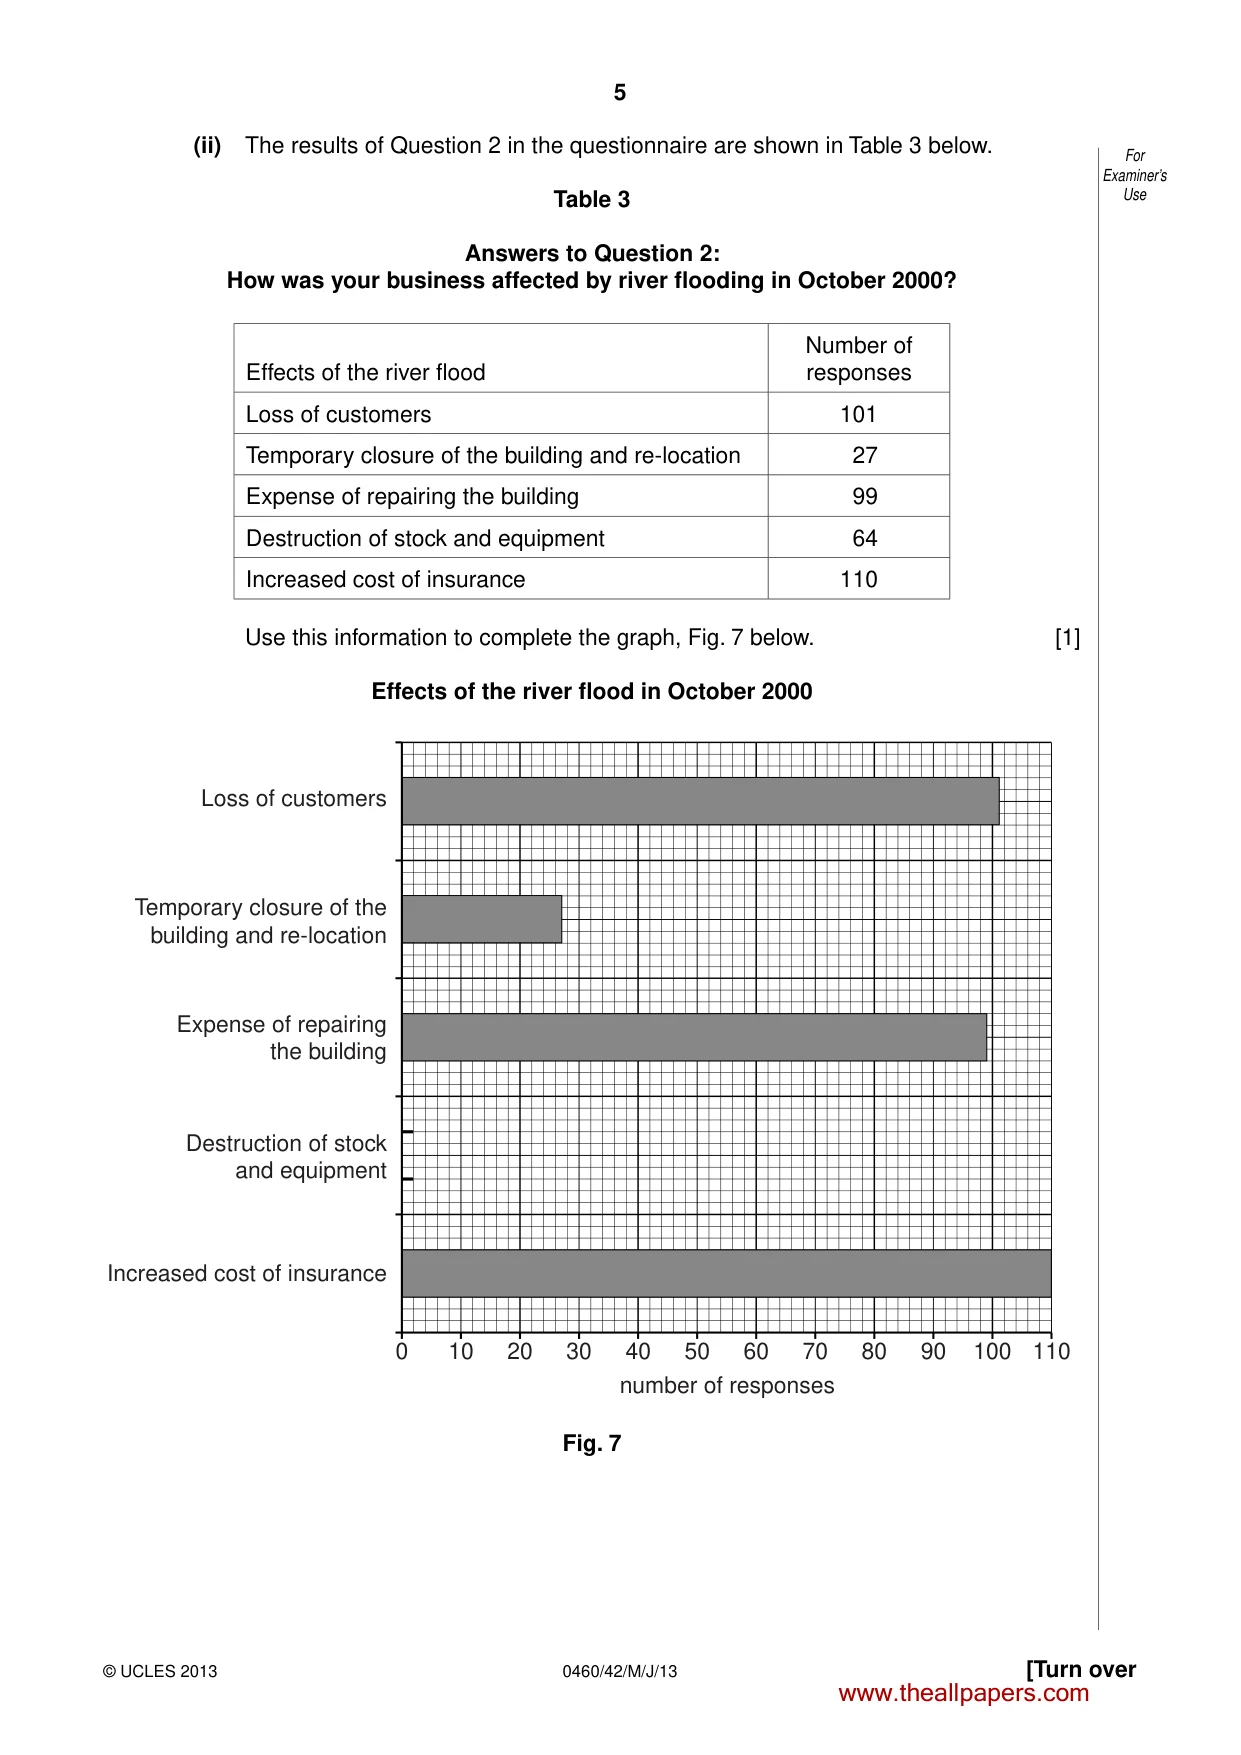
5 0460/42/M/J/13 © UCLES 2013 [Turn over For Examiner’s Use (ii) The results of Question 2 in the questionnaire are shown in Table 3 below. Table 3 Answers to Question 2: How was your business affected by river flooding in October 2000? Effects of the river flood Number of responses Loss of customers 101 Temporary closure of the building and re-location 27 Expense of repairing the building 99 Destruction of stock and equipment 64 Increased cost of insurance 110 Use this information to complete the graph, Fig. 7 below. [1] Effects of the river flood in October 2000 0 10 20 30 40 number of responses Increased cost of insurance Destruction of stock and equipment Expense of repairing the building Temporary closure of the building and re-location Loss of customers 50 60 70 80 90 110 100 Fig. 7 www.theallpapers.com
Question paper, page 6
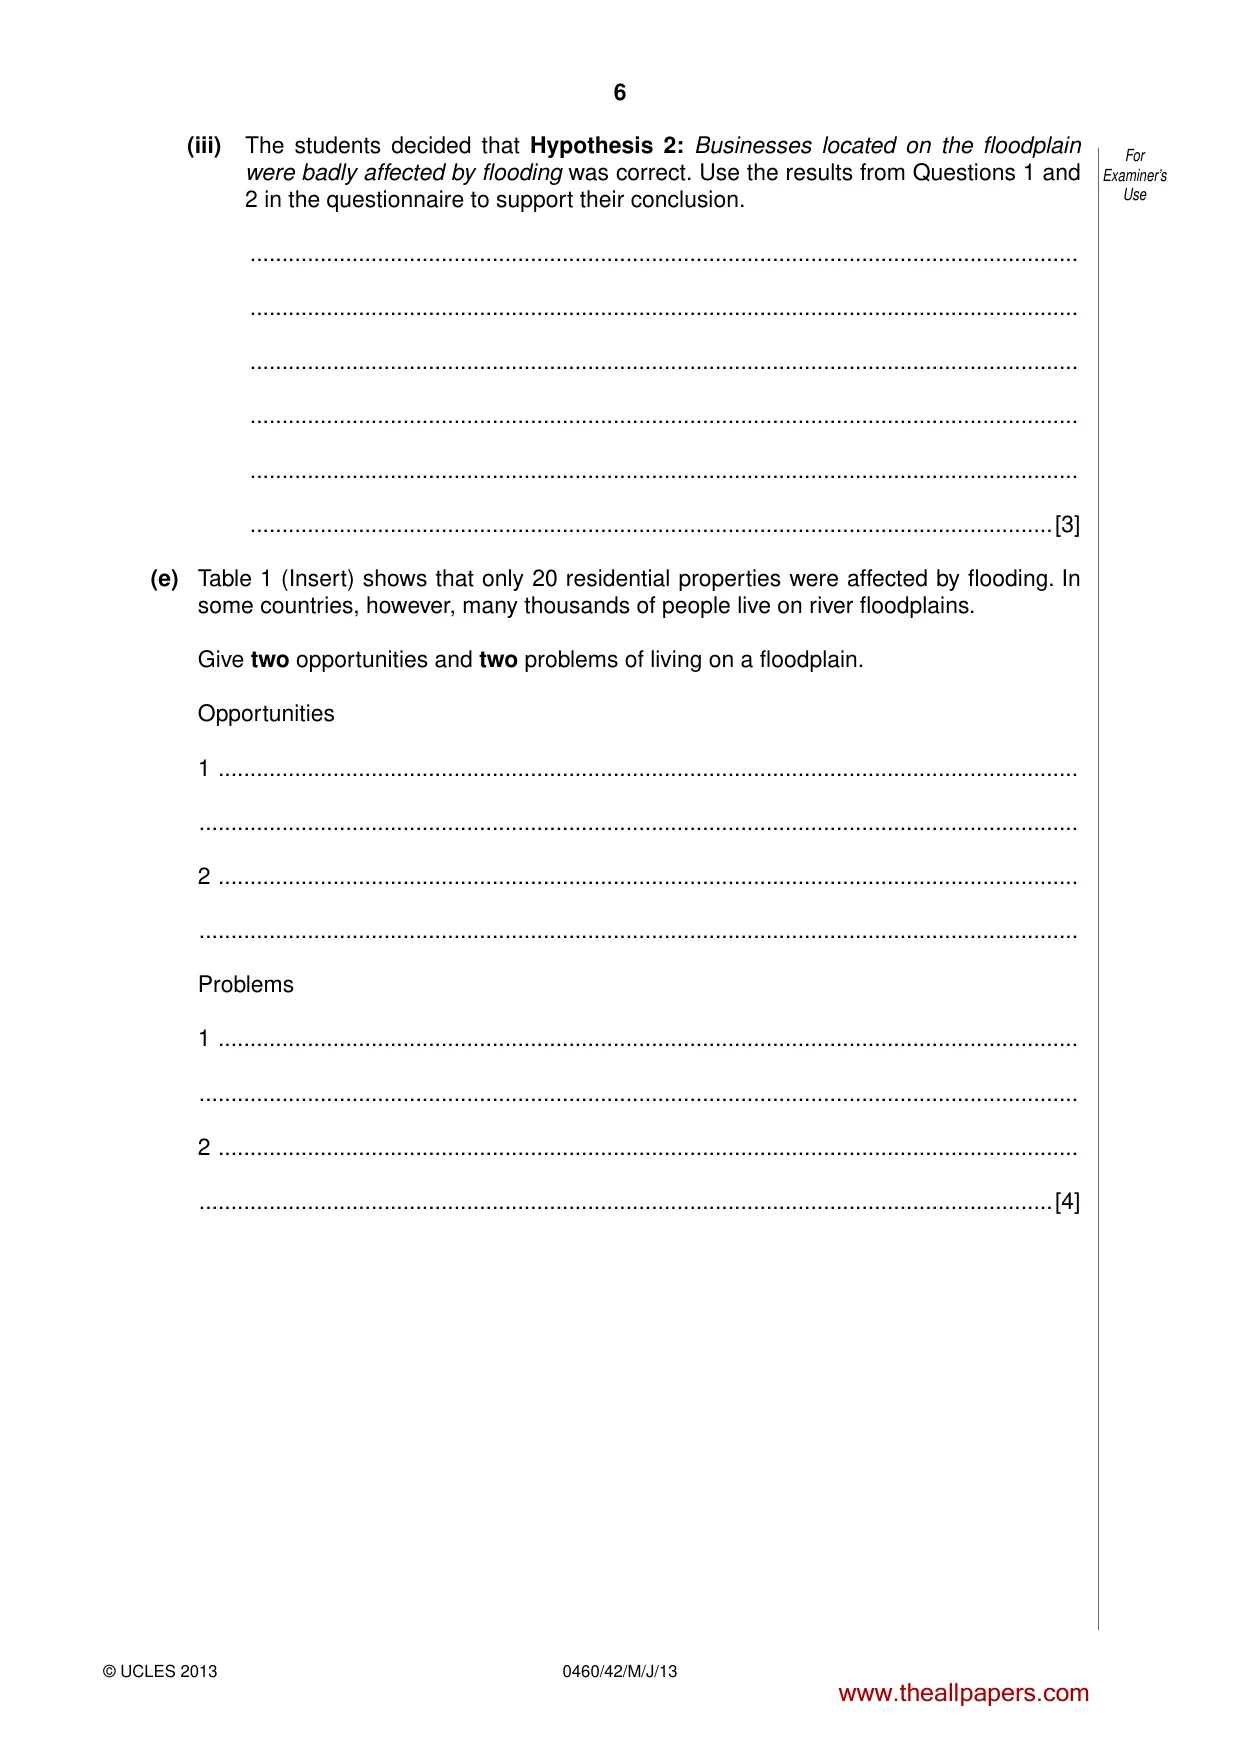
6 0460/42/M/J/13 © UCLES 2013 For Examiner’s Use (iii) The students decided that Hypothesis 2: Businesses located on the floodplain were badly affected by flooding was correct. Use the results from Questions 1 and 2 in the questionnaire to support their conclusion. … … … … … …[3] (e) Table 1 (Insert) shows that only 20 residential properties were affected by flooding. In some countries, however, many thousands of people live on river floodplains. Give two opportunities and two problems of living on a floodplain. Opportunities 1 … … 2 … … Problems 1 … … 2 … …[4] www.theallpapers.com
Question paper, page 7
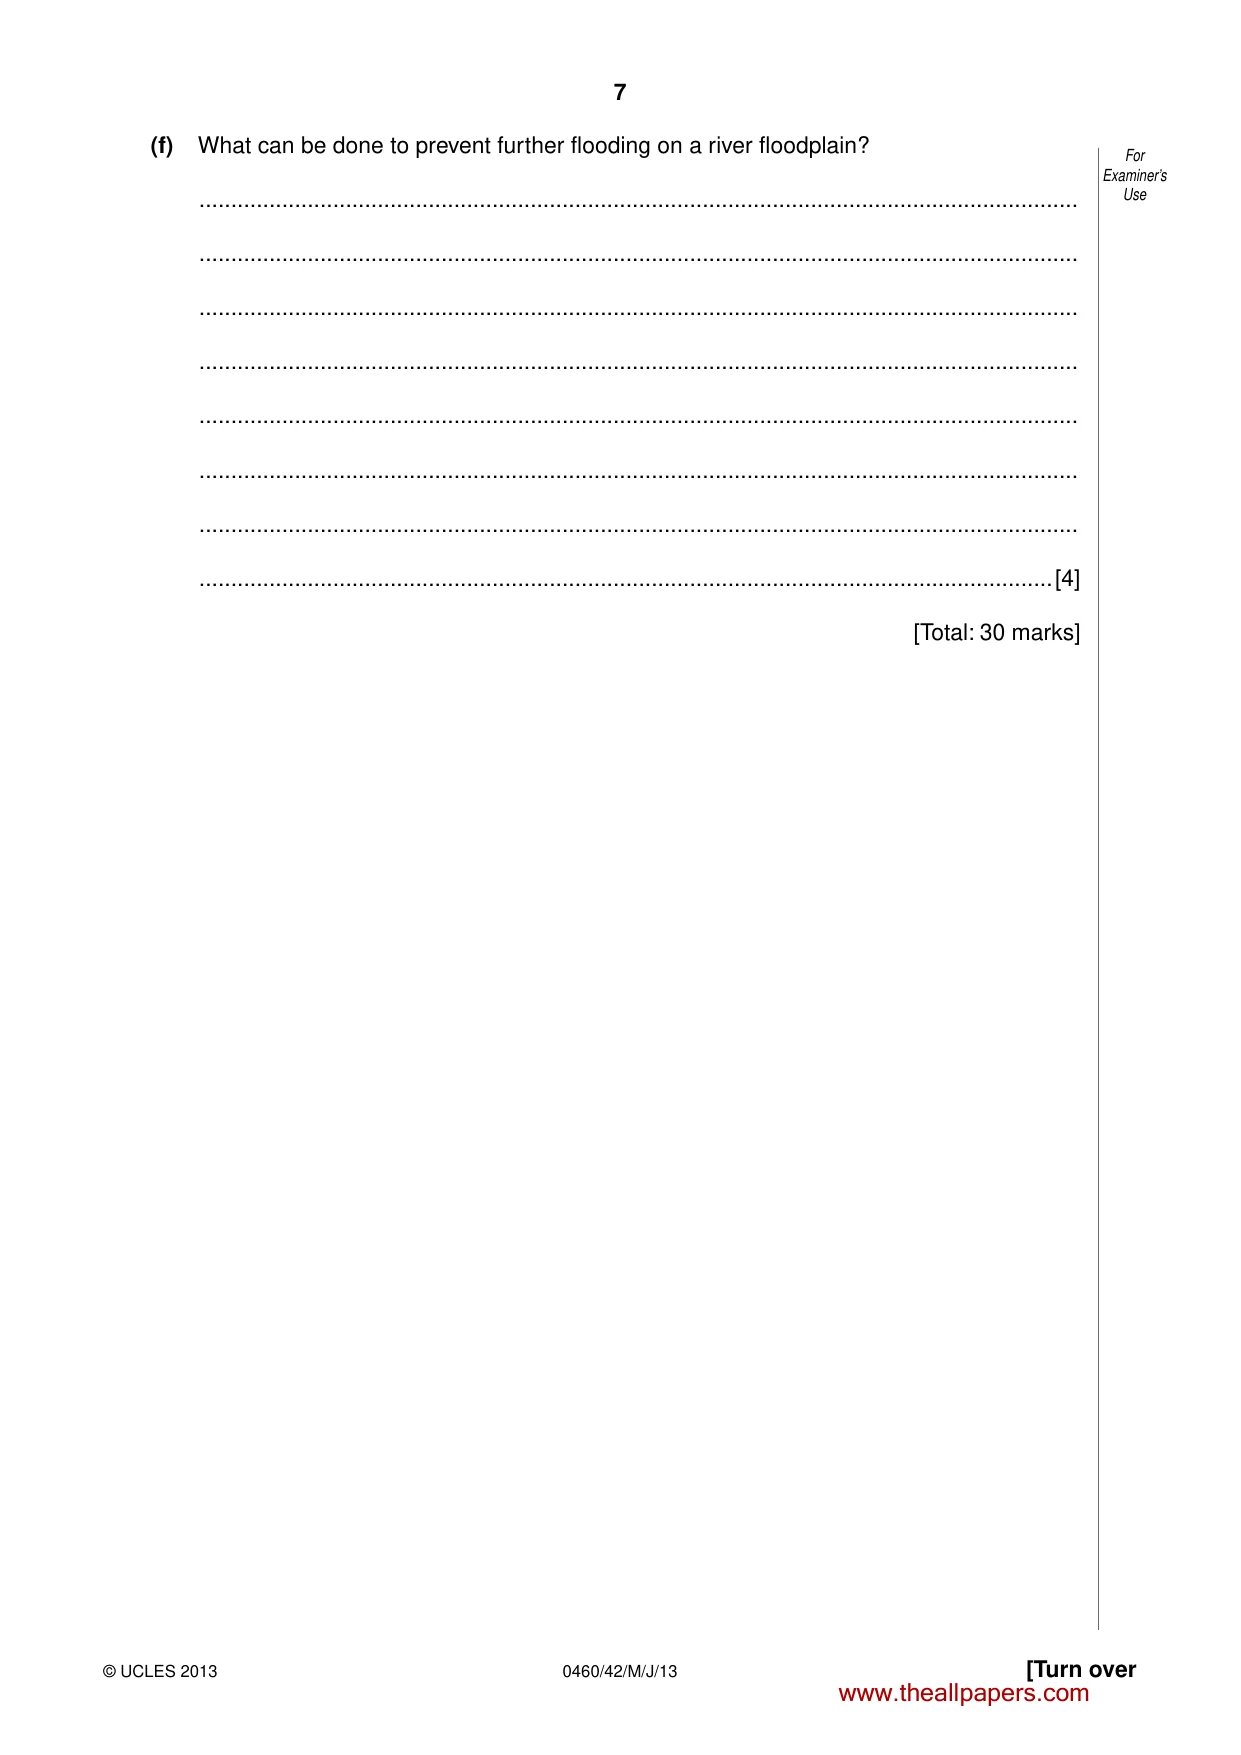
7 0460/42/M/J/13 © UCLES 2013 [Turn over For Examiner’s Use (f) What can be done to prevent further flooding on a river floodplain? … … … … … … … …[4] [Total: 30 marks] www.theallpapers.com
Question paper, page 8
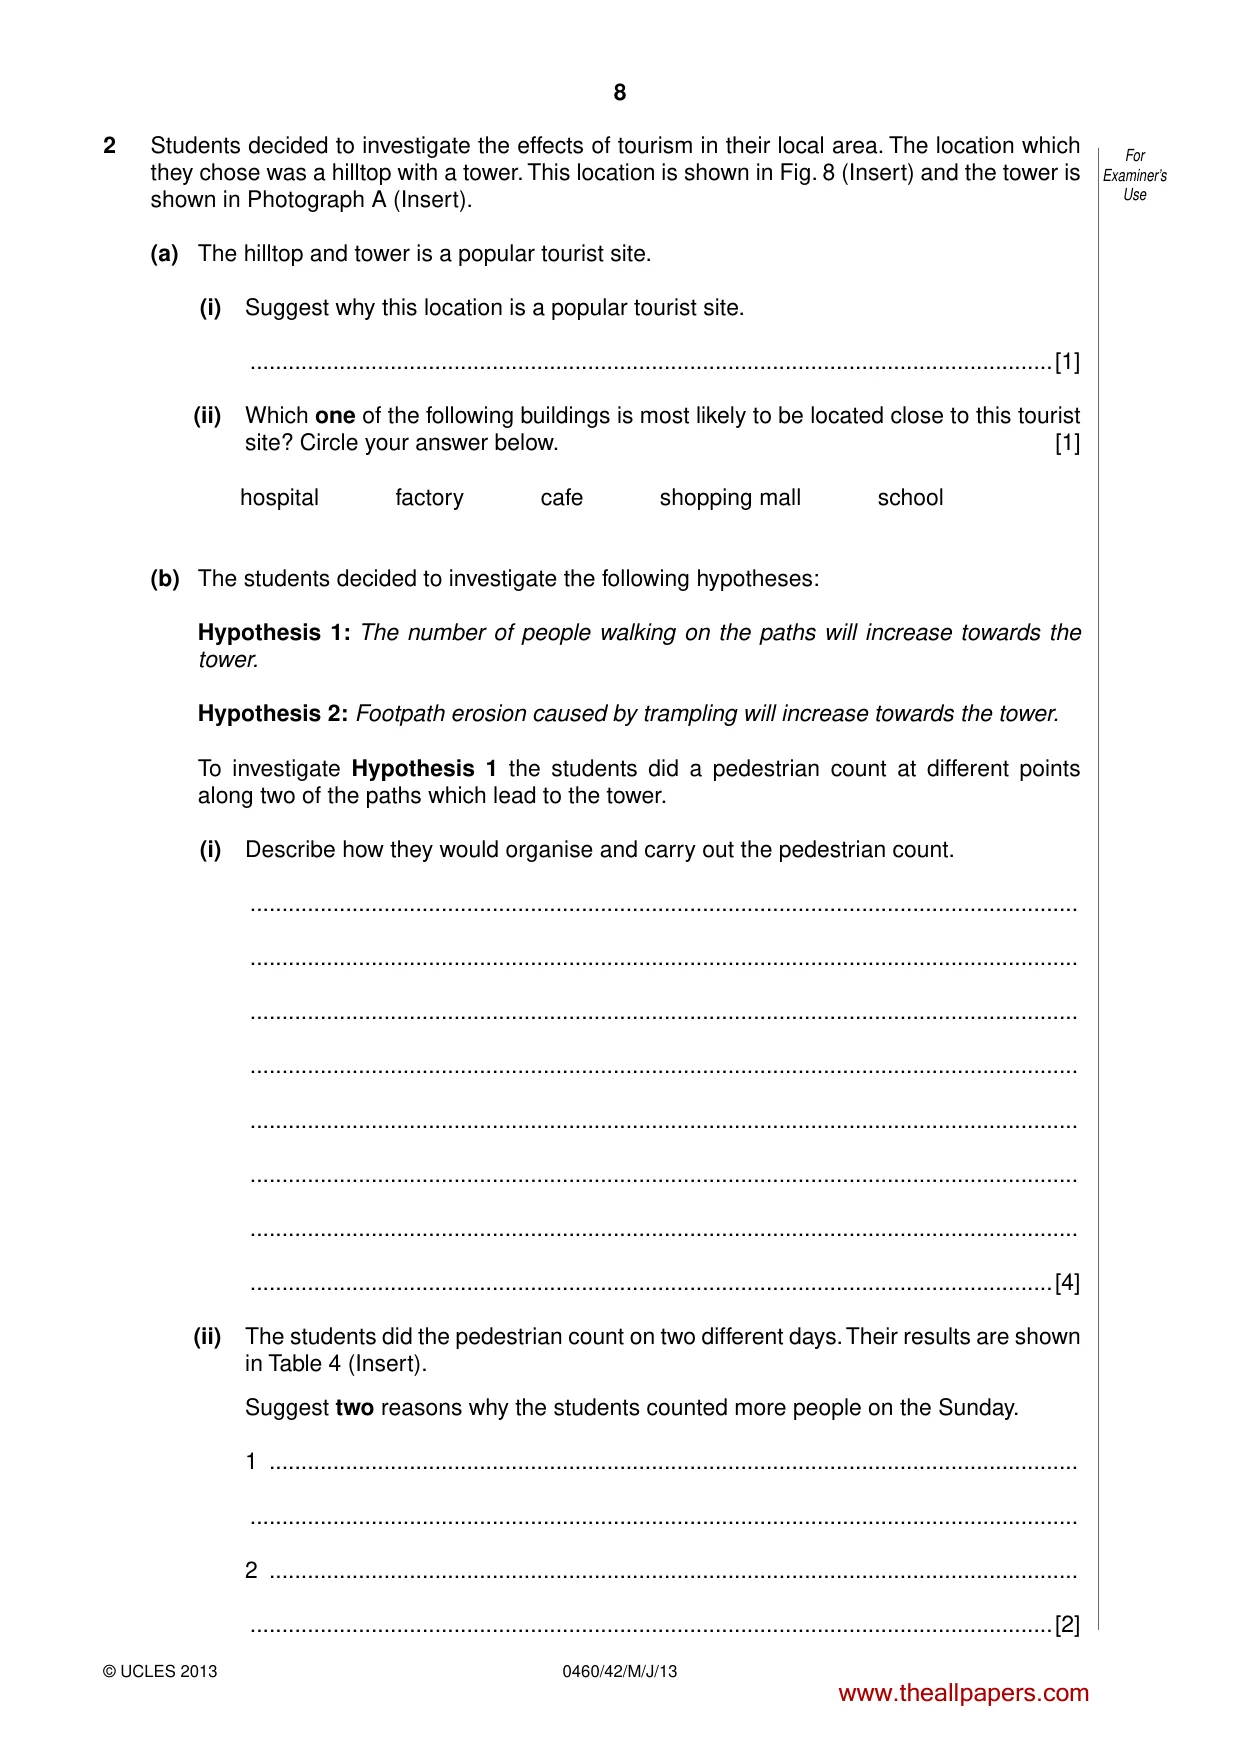
8 0460/42/M/J/13 © UCLES 2013 For Examiner’s Use 2 Students decided to investigate the effects of tourism in their local area. The location which they chose was a hilltop with a tower. This location is shown in Fig. 8 (Insert) and the tower is shown in Photograph A (Insert). (a) The hilltop and tower is a popular tourist site. (i) Suggest why this location is a popular tourist site. …[1] (ii) Which one of the following buildings is most likely to be located close to this tourist site? Circle your answer below. [1] hospital factory cafe shopping mall school (b) The students decided to investigate the following hypotheses: Hypothesis 1: The number of people walking on the paths will increase towards the tower. Hypothesis 2: Footpath erosion caused by trampling will increase towards the tower. To investigate Hypothesis 1 the students did a pedestrian count at different points along two of the paths which lead to the tower. (i) Describe how they would organise and carry out the pedestrian count. … … … … … … … …[4] (ii) The students did the pedestrian count on two different days. Their results are shown in Table 4 (Insert). Suggest two reasons why the students counted more people on the Sunday. 1 … … 2 … …[2] www.theallpapers.com
Question paper, page 9
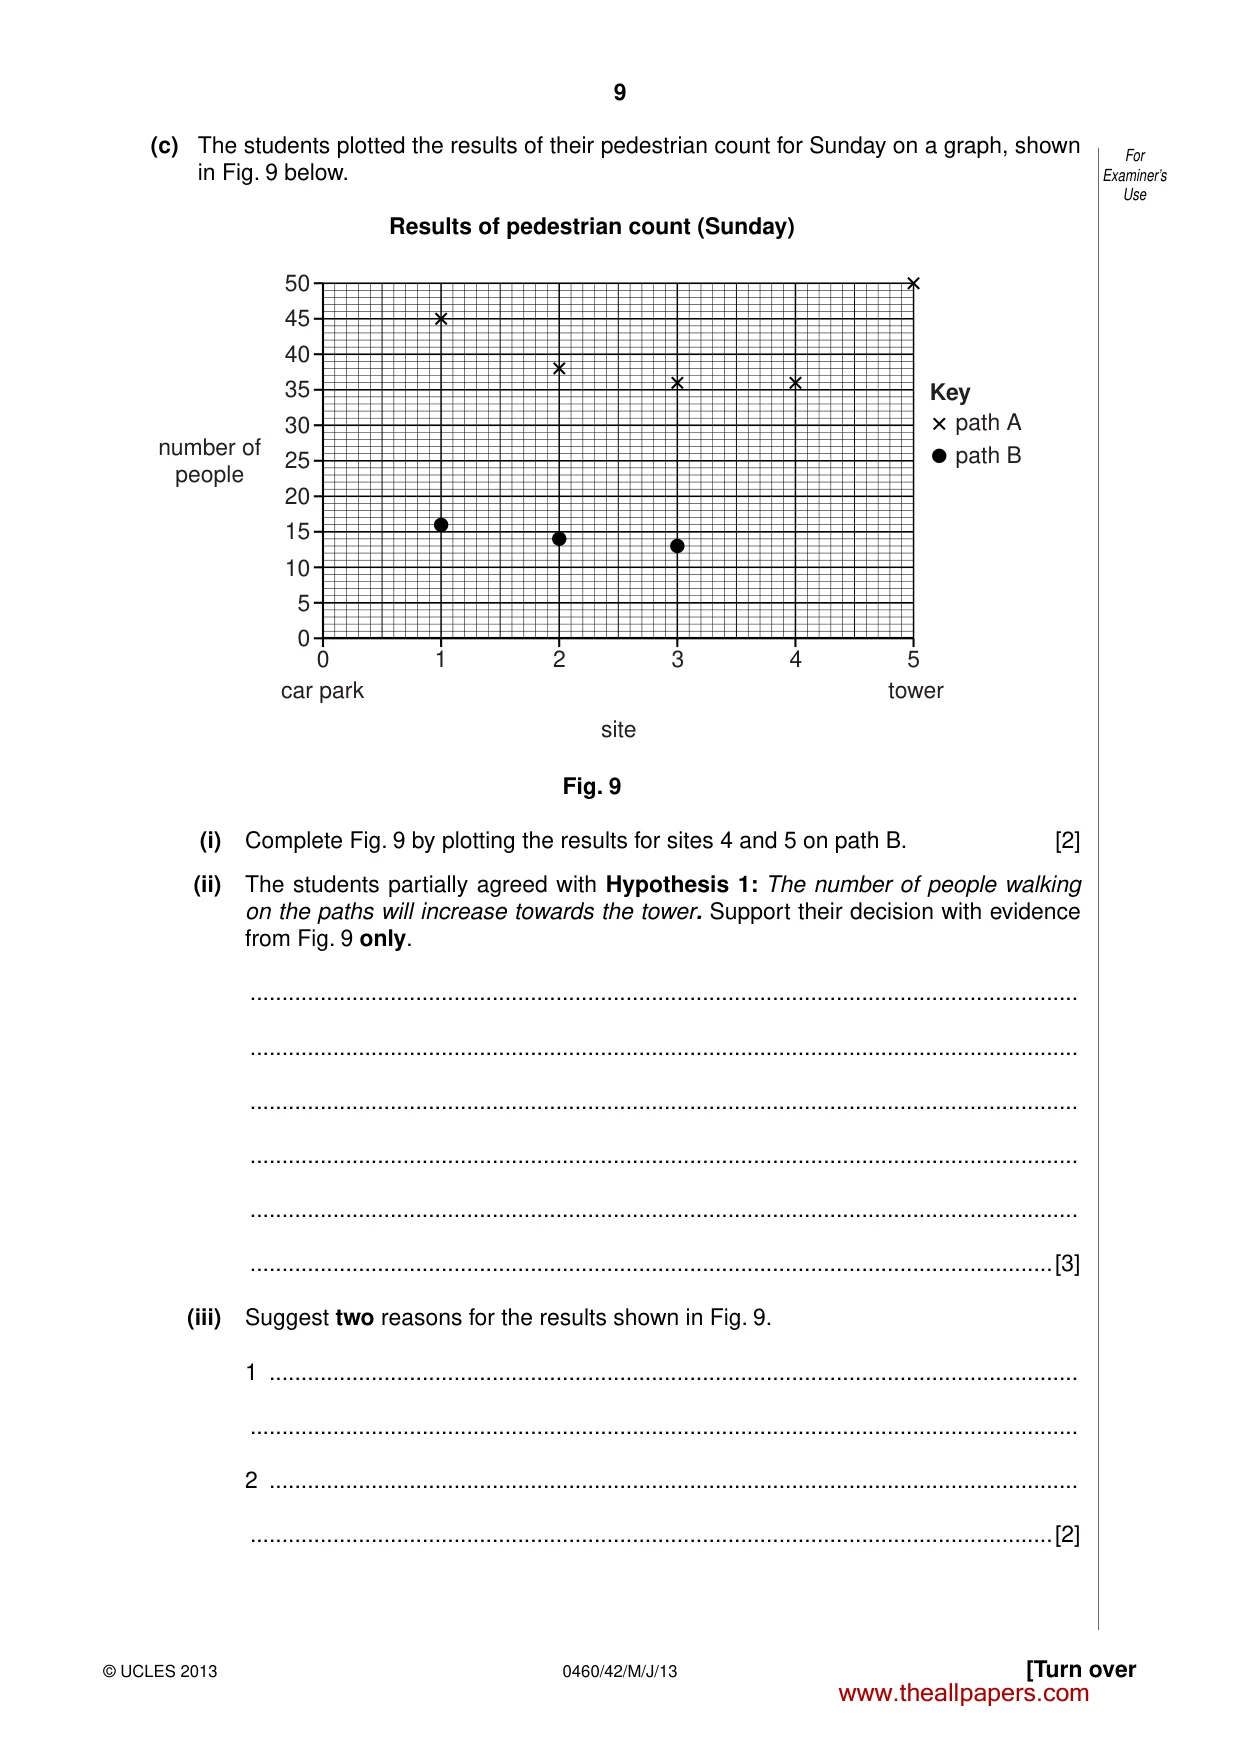
9 0460/42/M/J/13 © UCLES 2013 [Turn over For Examiner’s Use (c) The students plotted the results of their pedestrian count for Sunday on a graph, shown in Fig. 9 below. Results of pedestrian count (Sunday) 50 45 40 35 30 25 20 0 1 2 site car park tower number of people 3 4 5 path A Key path B 15 10 5 0 Fig. 9 (i) Complete Fig. 9 by plotting the results for sites 4 and 5 on path B. [2] (ii) The students partially agreed with Hypothesis 1: The number of people walking on the paths will increase towards the tower. Support their decision with evidence from Fig. 9 only. … … … … … …[3] (iii) Suggest two reasons for the results shown in Fig. 9. 1 … … 2 … …[2] www.theallpapers.com
Question paper, page 10
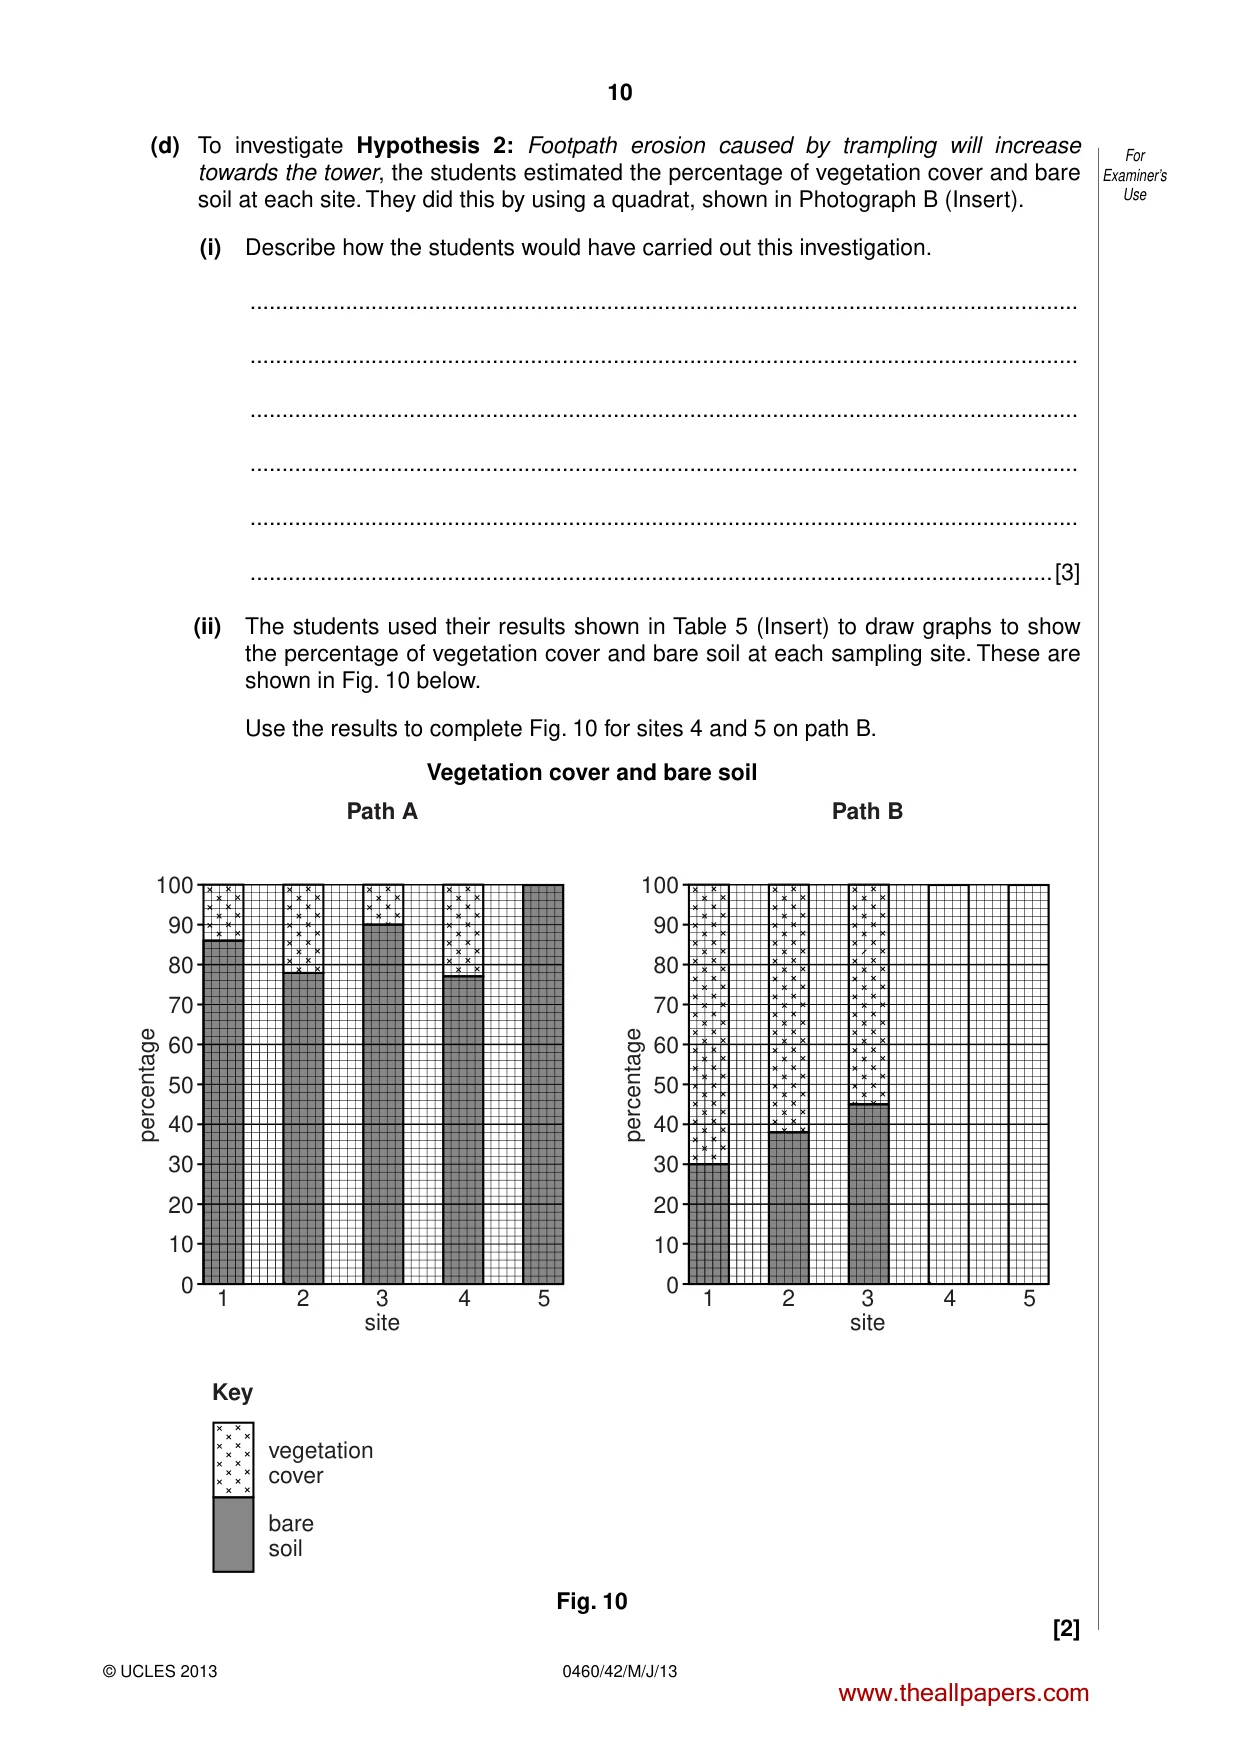
10 0460/42/M/J/13 © UCLES 2013 For Examiner’s Use (d) To investigate Hypothesis 2: Footpath erosion caused by trampling will increase towards the tower, the students estimated the percentage of vegetation cover and bare soil at each site. They did this by using a quadrat, shown in Photograph B (Insert). (i) Describe how the students would have carried out this investigation. … … … … … …[3] (ii) The students used their results shown in Table 5 (Insert) to draw graphs to show the percentage of vegetation cover and bare soil at each sampling site. These are shown in Fig. 10 below. Use the results to complete Fig. 10 for sites 4 and 5 on path B. Vegetation cover and bare soil 100 90 80 70 60 50 40 1 2 site percentage percentage 3 4 5 vegetation cover Key bare soil 30 20 10 0 100 90 80 70 60 50 40 1 2 site Path A Path B 3 4 5 30 20 10 0 Fig. 10 [2] www.theallpapers.com
Question paper, page 11
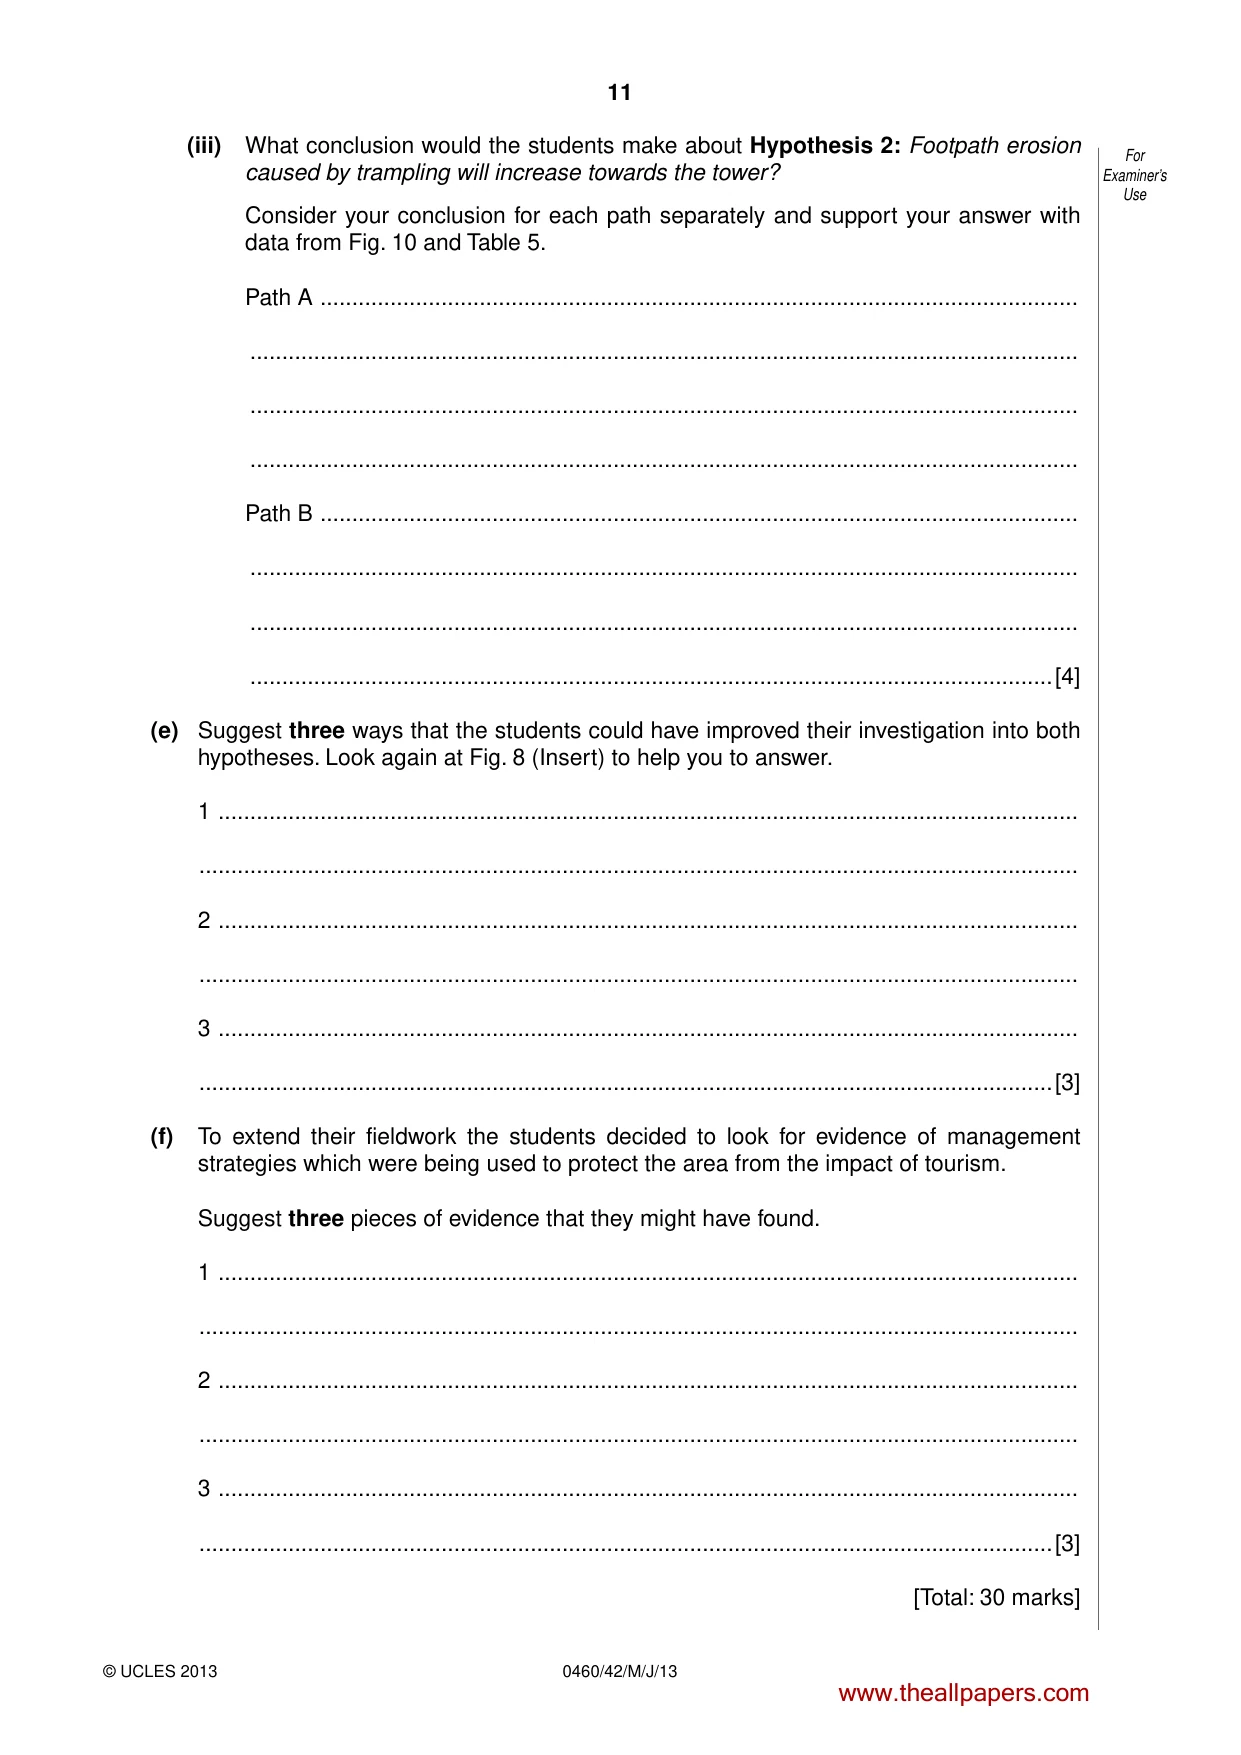
11 0460/42/M/J/13 © UCLES 2013 For Examiner’s Use (iii) What conclusion would the students make about Hypothesis 2: Footpath erosion caused by trampling will increase towards the tower? Consider your conclusion for each path separately and support your answer with data from Fig. 10 and Table 5. Path A … … … … Path B … … … …[4] (e) Suggest three ways that the students could have improved their investigation into both hypotheses. Look again at Fig. 8 (Insert) to help you to answer. 1 … … 2 … … 3 … …[3] (f) To extend their fieldwork the students decided to look for evidence of management strategies which were being used to protect the area from the impact of tourism. Suggest three pieces of evidence that they might have found. 1 … … 2 … … 3 … …[3] [Total: 30 marks] www.theallpapers.com
Question paper, page 12
12 0460/42/M/J/13 © UCLES 2013 Copyright Acknowledgements: Question 1 Fig. 4 © www.geography.org.uk/download/GA_Luckfield_data_flood_map; 2000. Question 2 Photograph A © www.stonemole.wordpress.org; 21 February 2009. Permission to reproduce items where third-party owned material protected by copyright is included has been sought and cleared where possible. Every reasonable effort has been made by the publisher (UCLES) to trace copyright holders, but if any items requiring clearance have unwittingly been included, the publisher will be pleased to make amends at the earliest possible opportunity. University of Cambridge International Examinations is part of the Cambridge Assessment Group. Cambridge Assessment is the brand name of University of Cambridge Local Examinations Syndicate (UCLES), which is itself a department of the University of Cambridge. BLANK PAGE www.theallpapers.com
Mark scheme, page 1
CAMBRIDGE INTERNATIONAL EXAMINATIONS International General Certificate of Secondary Education MARK SCHEME for the May/June 2013 series 0460 GEOGRAPHY 0460/42 Paper 4 (Alternative to Coursework), maximum raw mark 60 This mark scheme is published as an aid to teachers and candidates, to indicate the requirements of the examination. It shows the basis on which Examiners were instructed to award marks. It does not indicate the details of the discussions that took place at an Examiners’ meeting before marking began, which would have considered the acceptability of alternative answers. Mark schemes should be read in conjunction with the question paper and the Principal Examiner Report for Teachers. Cambridge will not enter into discussions about these mark schemes. Cambridge is publishing the mark schemes for the May/June 2013 series for most IGCSE, GCE Advanced Level and Advanced Subsidiary Level components and some Ordinary Level components. www.theallpapers.com
Mark scheme, page 2
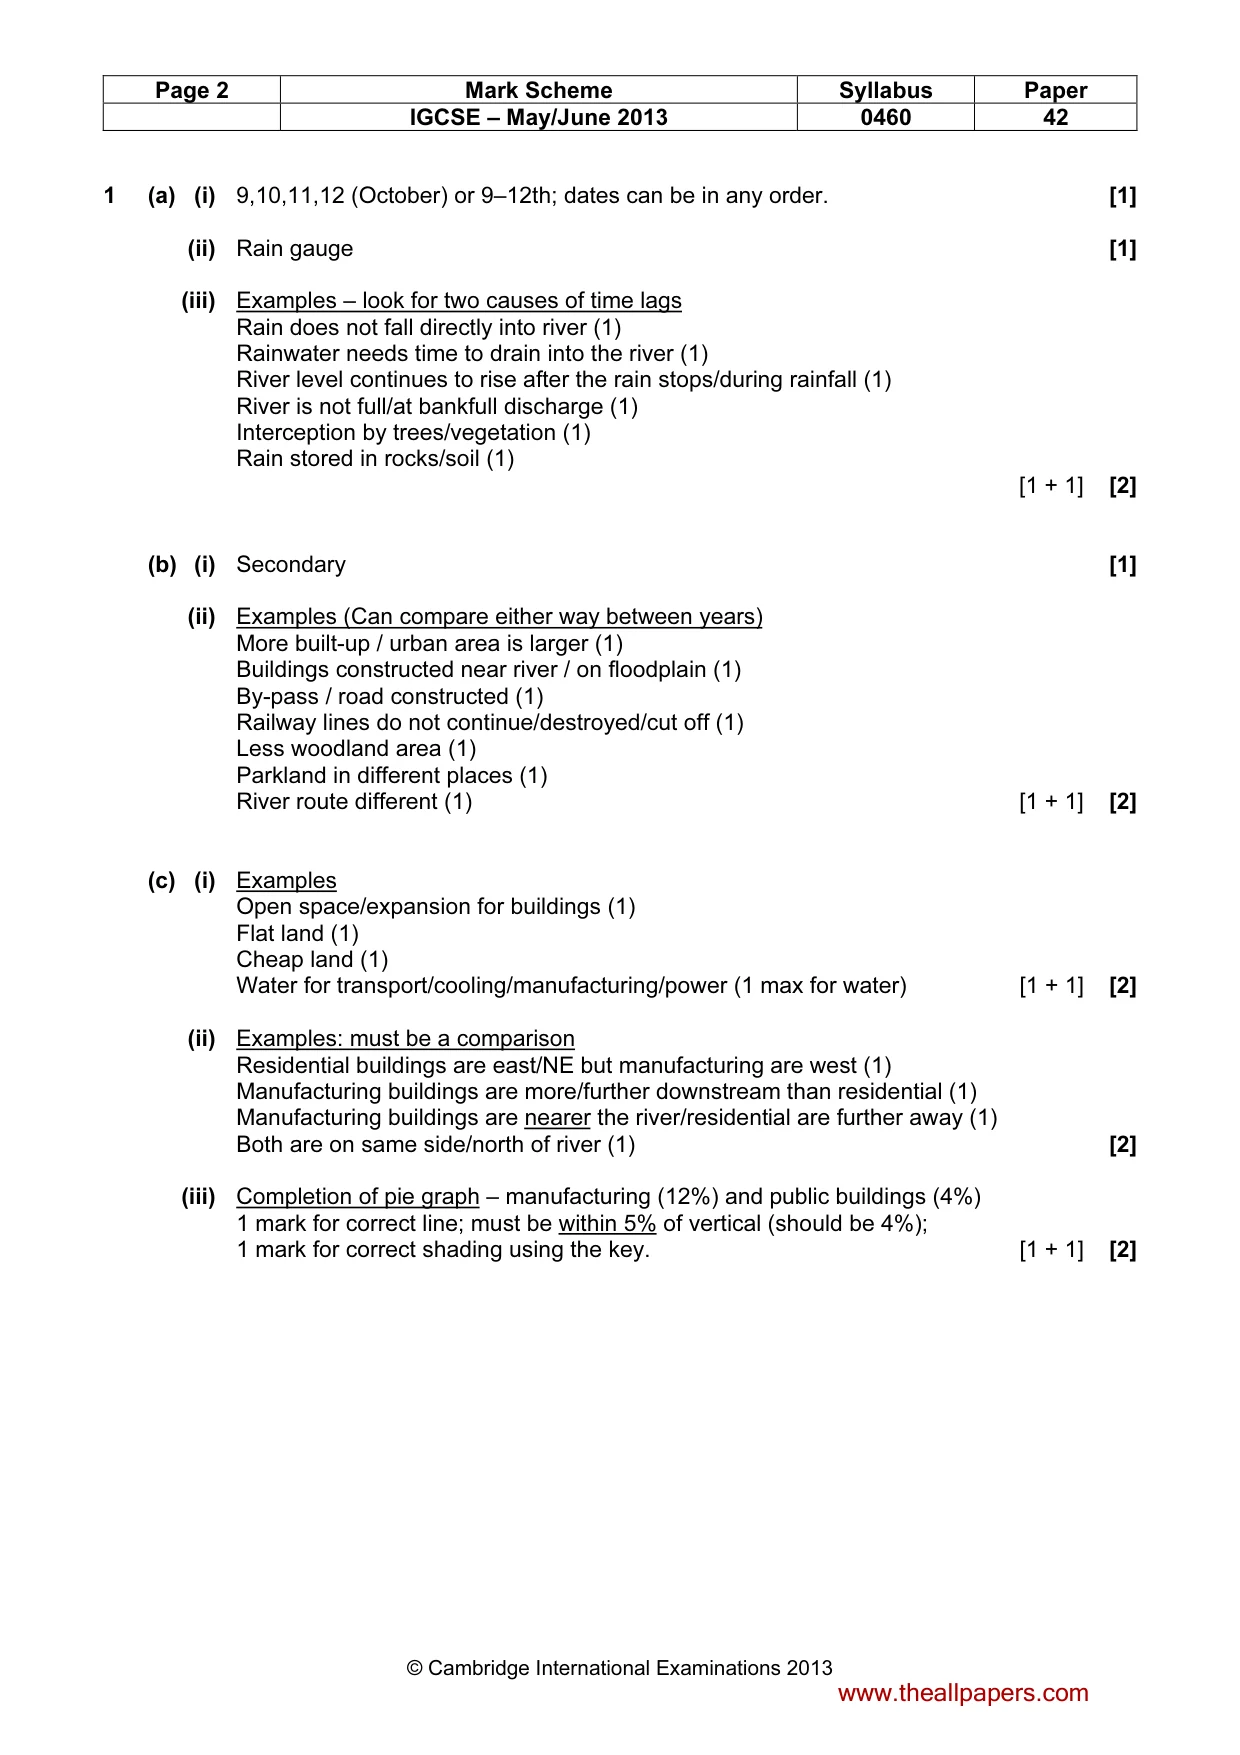
Page 2 Mark Scheme Syllabus Paper IGCSE – May/June 2013 0460 42 © Cambridge International Examinations 2013 1 (a) (i) 9,10,11,12 (October) or 9–12th; dates can be in any order. [1] (ii) Rain gauge [1] (iii) Examples – look for two causes of time lags Rain does not fall directly into river (1) Rainwater needs time to drain into the river (1) River level continues to rise after the rain stops/during rainfall (1) River is not full/at bankfull discharge (1) Interception by trees/vegetation (1) Rain stored in rocks/soil (1) [1 + 1] [2] (b) (i) Secondary [1] (ii) Examples (Can compare either way between years) More built-up / urban area is larger (1) Buildings constructed near river / on floodplain (1) By-pass / road constructed (1) Railway lines do not continue/destroyed/cut off (1) Less woodland area (1) Parkland in different places (1) River route different (1) [1 + 1] [2] (c) (i) Examples Open space/expansion for buildings (1) Flat land (1) Cheap land (1) Water for transport/cooling/manufacturing/power (1 max for water) [1 + 1] [2] (ii) Examples: must be a comparison Residential buildings are east/NE but manufacturing are west (1) Manufacturing buildings are more/further downstream than residential (1) Manufacturing buildings are nearer the river/residential are further away (1) Both are on same side/north of river (1) [2] (iii) Completion of pie graph – manufacturing (12%) and public buildings (4%) 1 mark for correct line; must be within 5% of vertical (should be 4%); 1 mark for correct shading using the key. [1 + 1] [2] www.theallpapers.com
Mark scheme, page 3
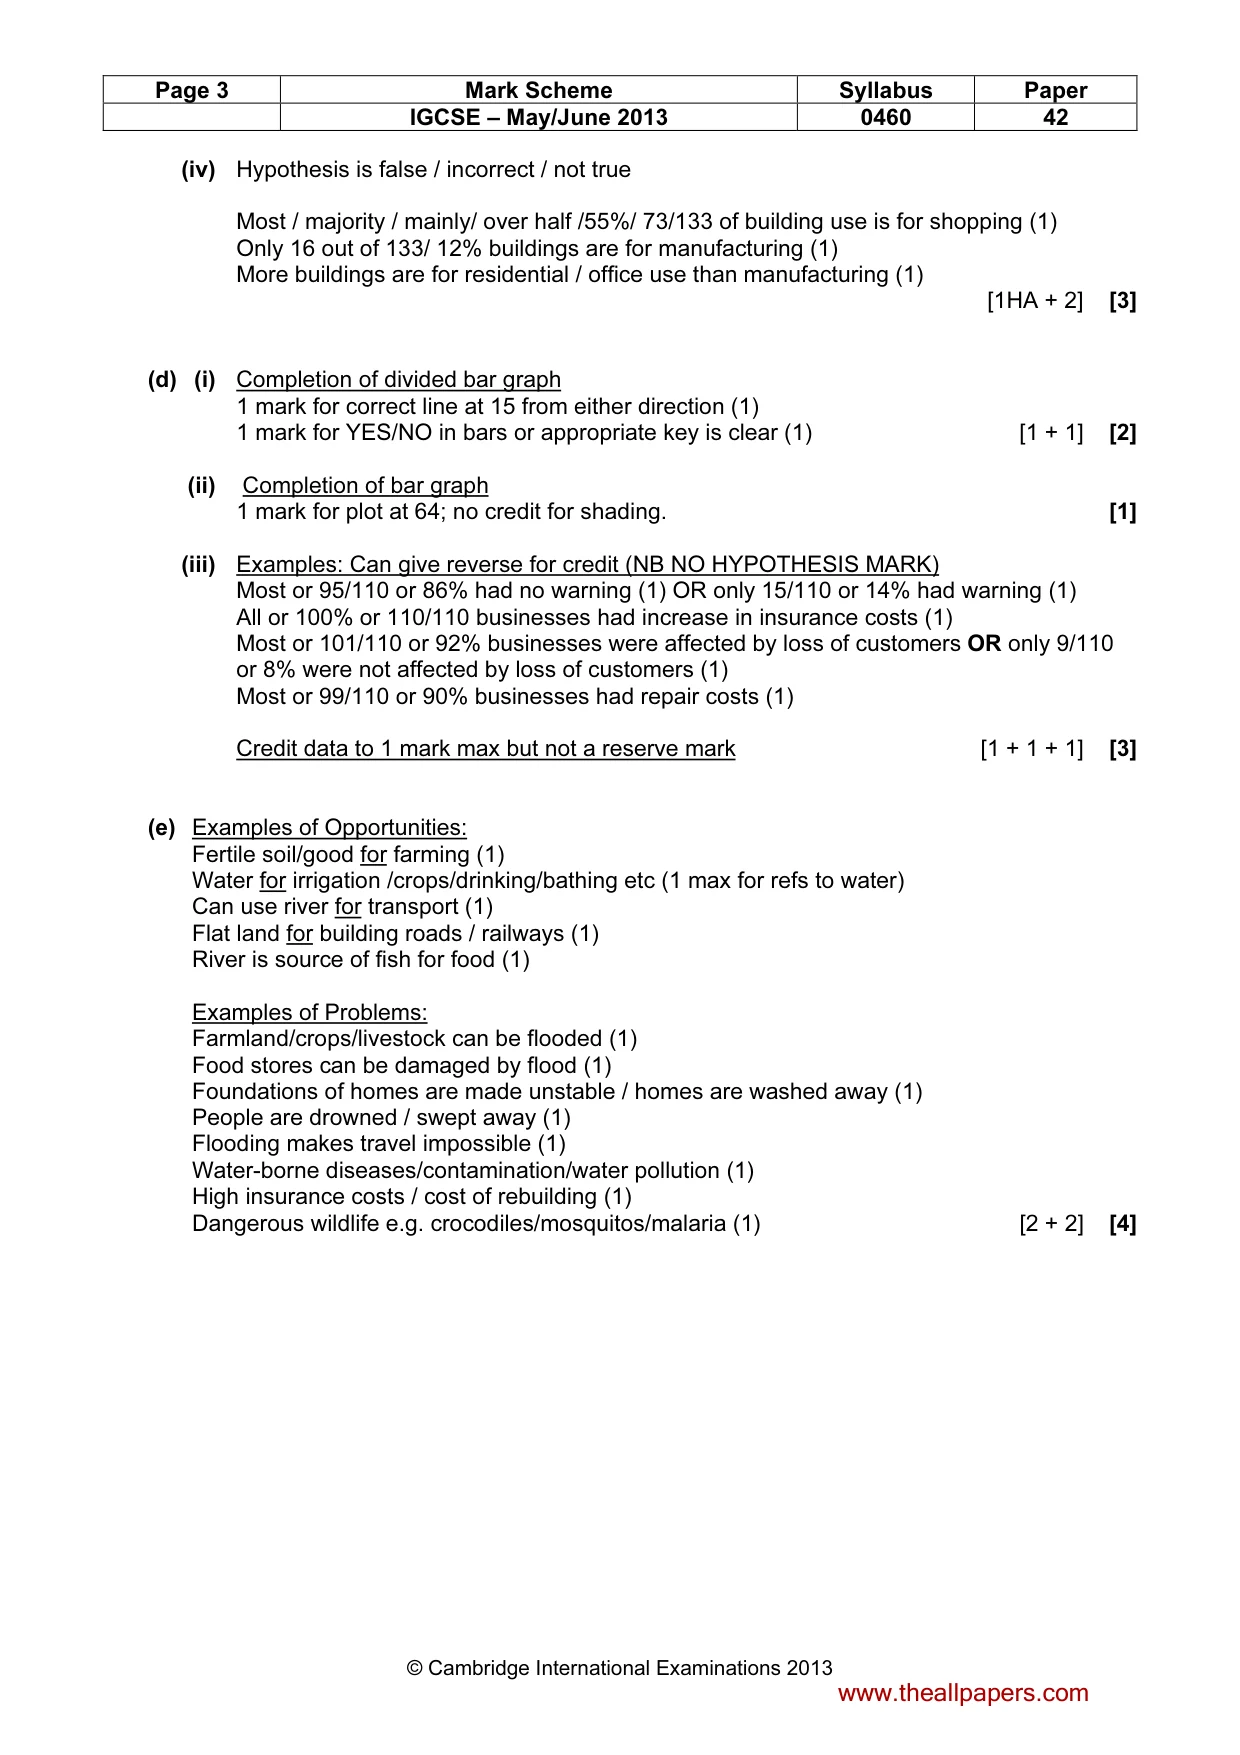
Page 3 Mark Scheme Syllabus Paper IGCSE – May/June 2013 0460 42 © Cambridge International Examinations 2013 (iv) Hypothesis is false / incorrect / not true Most / majority / mainly/ over half /55%/ 73/133 of building use is for shopping (1) Only 16 out of 133/ 12% buildings are for manufacturing (1) More buildings are for residential / office use than manufacturing (1) [1HA + 2] [3] (d) (i) Completion of divided bar graph 1 mark for correct line at 15 from either direction (1) 1 mark for YES/NO in bars or appropriate key is clear (1) [1 + 1] [2] (ii) Completion of bar graph 1 mark for plot at 64; no credit for shading. [1] (iii) Examples: Can give reverse for credit (NB NO HYPOTHESIS MARK) Most or 95/110 or 86% had no warning (1) OR only 15/110 or 14% had warning (1) All or 100% or 110/110 businesses had increase in insurance costs (1) Most or 101/110 or 92% businesses were affected by loss of customers OR only 9/110 or 8% were not affected by loss of customers (1) Most or 99/110 or 90% businesses had repair costs (1) Credit data to 1 mark max but not a reserve mark [1 + 1 + 1] [3] (e) Examples of Opportunities: Fertile soil/good for farming (1) Water for irrigation /crops/drinking/bathing etc (1 max for refs to water) Can use river for transport (1) Flat land for building roads / railways (1) River is source of fish for food (1) Examples of Problems: Farmland/crops/livestock can be flooded (1) Food stores can be damaged by flood (1) Foundations of homes are made unstable / homes are washed away (1) People are drowned / swept away (1) Flooding makes travel impossible (1) Water-borne diseases/contamination/water pollution (1) High insurance costs / cost of rebuilding (1) Dangerous wildlife e.g. crocodiles/mosquitos/malaria (1) [2 + 2] [4] www.theallpapers.com
Mark scheme, page 4
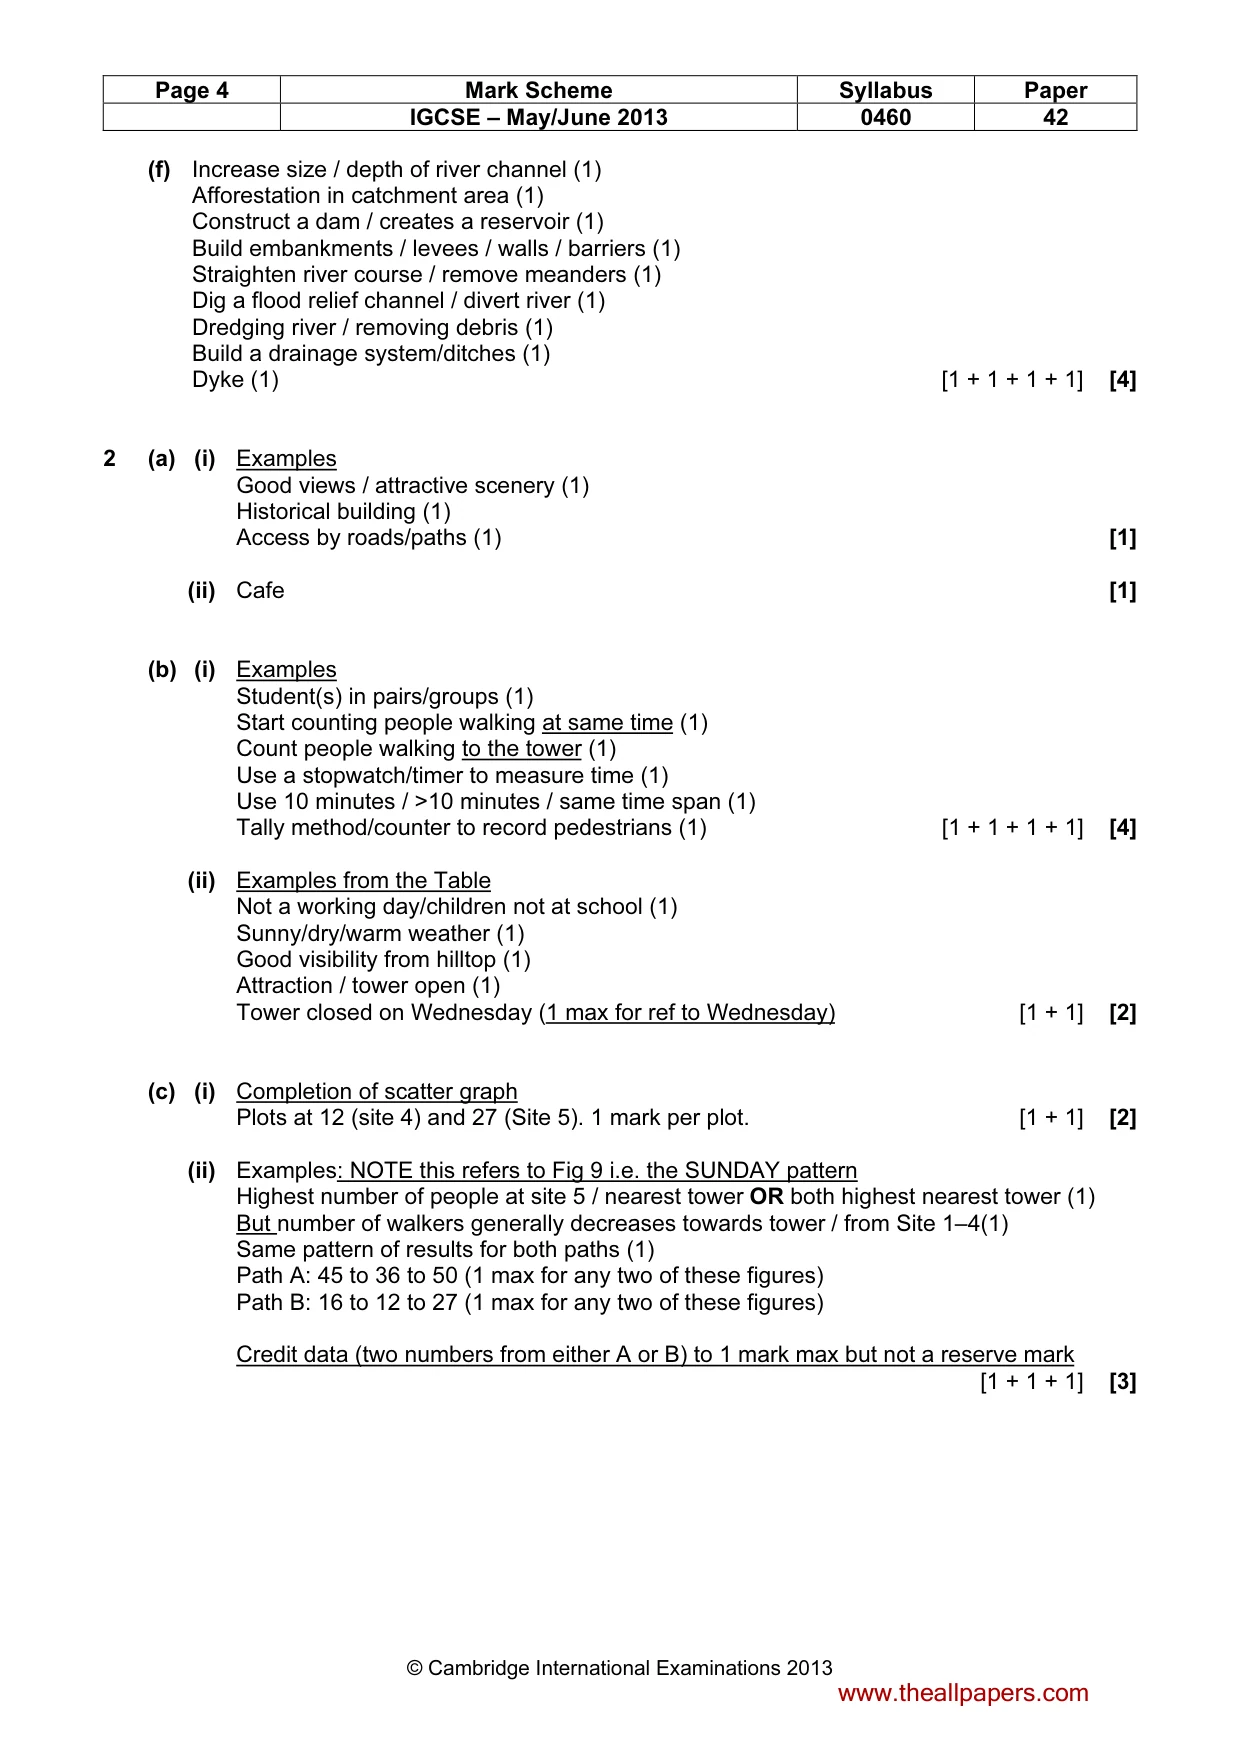
Page 4 Mark Scheme Syllabus Paper IGCSE – May/June 2013 0460 42 © Cambridge International Examinations 2013 (f) Increase size / depth of river channel (1) Afforestation in catchment area (1) Construct a dam / creates a reservoir (1) Build embankments / levees / walls / barriers (1) Straighten river course / remove meanders (1) Dig a flood relief channel / divert river (1) Dredging river / removing debris (1) Build a drainage system/ditches (1) Dyke (1) [1 + 1 + 1 + 1] [4] 2 (a) (i) Examples Good views / attractive scenery (1) Historical building (1) Access by roads/paths (1) [1] (ii) Cafe [1] (b) (i) Examples Student(s) in pairs/groups (1) Start counting people walking at same time (1) Count people walking to the tower (1) Use a stopwatch/timer to measure time (1) Use 10 minutes / >10 minutes / same time span (1) Tally method/counter to record pedestrians (1) [1 + 1 + 1 + 1] [4] (ii) Examples from the Table Not a working day/children not at school (1) Sunny/dry/warm weather (1) Good visibility from hilltop (1) Attraction / tower open (1) Tower closed on Wednesday (1 max for ref to Wednesday) [1 + 1] [2] (c) (i) Completion of scatter graph Plots at 12 (site 4) and 27 (Site 5). 1 mark per plot. [1 + 1] [2] (ii) Examples: NOTE this refers to Fig 9 i.e. the SUNDAY pattern Highest number of people at site 5 / nearest tower OR both highest nearest tower (1) But number of walkers generally decreases towards tower / from Site 1–4(1) Same pattern of results for both paths (1) Path A: 45 to 36 to 50 (1 max for any two of these figures) Path B: 16 to 12 to 27 (1 max for any two of these figures) Credit data (two numbers from either A or B) to 1 mark max but not a reserve mark [1 + 1 + 1] [3] www.theallpapers.com
Mark scheme, page 5
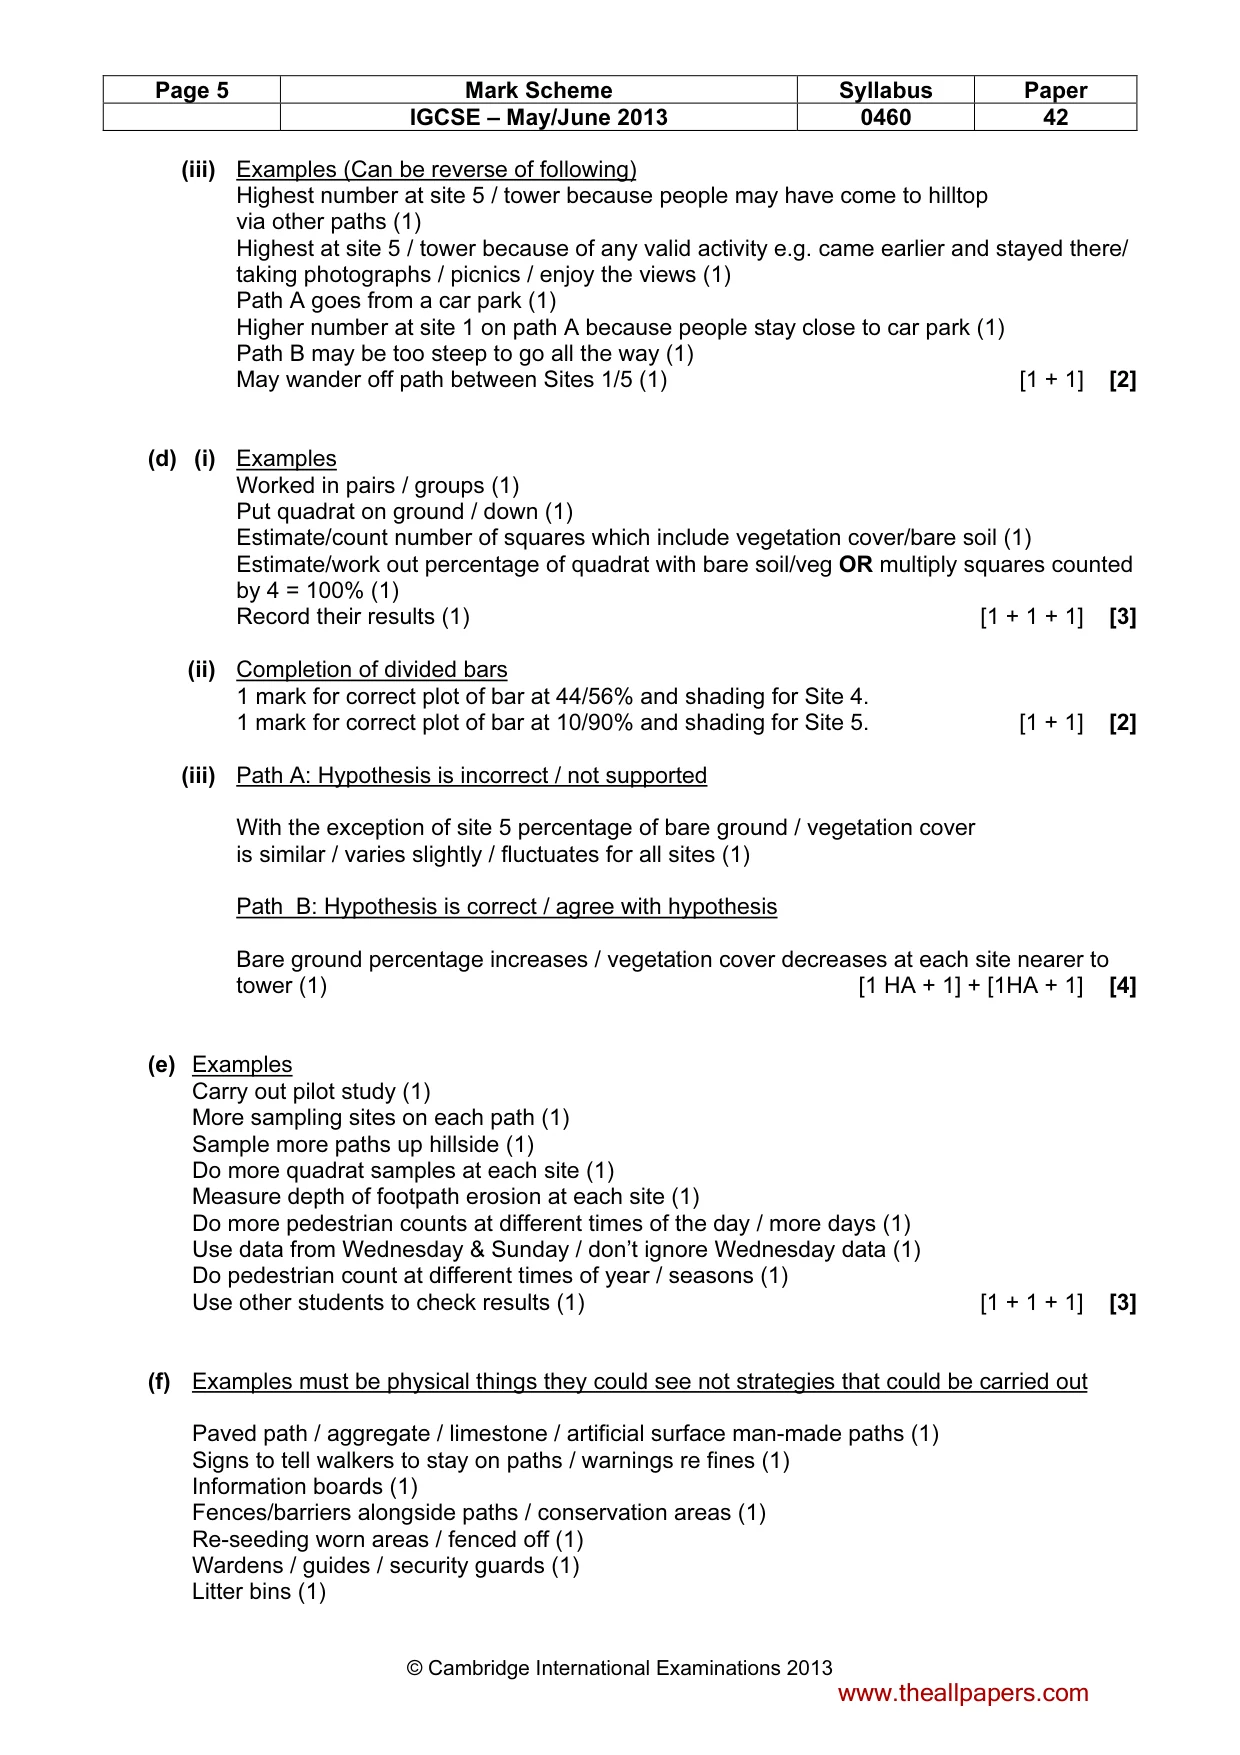
Page 5 Mark Scheme Syllabus Paper IGCSE – May/June 2013 0460 42 © Cambridge International Examinations 2013 (iii) Examples (Can be reverse of following) Highest number at site 5 / tower because people may have come to hilltop via other paths (1) Highest at site 5 / tower because of any valid activity e.g. came earlier and stayed there/ taking photographs / picnics / enjoy the views (1) Path A goes from a car park (1) Higher number at site 1 on path A because people stay close to car park (1) Path B may be too steep to go all the way (1) May wander off path between Sites 1/5 (1) [1 + 1] [2] (d) (i) Examples Worked in pairs / groups (1) Put quadrat on ground / down (1) Estimate/count number of squares which include vegetation cover/bare soil (1) Estimate/work out percentage of quadrat with bare soil/veg OR multiply squares counted by 4 = 100% (1) Record their results (1) [1 + 1 + 1] [3] (ii) Completion of divided bars 1 mark for correct plot of bar at 44/56% and shading for Site 4. 1 mark for correct plot of bar at 10/90% and shading for Site 5. [1 + 1] [2] (iii) Path A: Hypothesis is incorrect / not supported With the exception of site 5 percentage of bare ground / vegetation cover is similar / varies slightly / fluctuates for all sites (1) Path B: Hypothesis is correct / agree with hypothesis Bare ground percentage increases / vegetation cover decreases at each site nearer to tower (1) [1 HA + 1] + [1HA + 1] [4] (e) Examples Carry out pilot study (1) More sampling sites on each path (1) Sample more paths up hillside (1) Do more quadrat samples at each site (1) Measure depth of footpath erosion at each site (1) Do more pedestrian counts at different times of the day / more days (1) Use data from Wednesday & Sunday / don’t ignore Wednesday data (1) Do pedestrian count at different times of year / seasons (1) Use other students to check results (1) [1 + 1 + 1] [3] (f) Examples must be physical things they could see not strategies that could be carried out Paved path / aggregate / limestone / artificial surface man-made paths (1) Signs to tell walkers to stay on paths / warnings re fines (1) Information boards (1) Fences/barriers alongside paths / conservation areas (1) Re-seeding worn areas / fenced off (1) Wardens / guides / security guards (1) Litter bins (1) www.theallpapers.com
Mark scheme, page 6
Page 6 Mark Scheme Syllabus Paper IGCSE – May/June 2013 0460 42 © Cambridge International Examinations 2013 Car parks (1) Seating / picnic places (1) [1 + 1 + 1] [3] www.theallpapers.com
What you needed in this session
Cambridge’s own grade thresholds for 2013 May/June, Paper 4 · Variant 2. A higher threshold means an easier paper — the bar moves with how the cohort did.