Cambridge IGCSE Geography 0460 — 2013 May/June Paper 4 · Variant 1
0460/41/M/J/13 · 60 marks · ≈68 min
The question paper and its mark scheme, free to read here and free to download. This is Cambridge’s own paper, exactly as it was sat.
Question paper16 pages

Mark scheme5 pages
Answers below. Sit the paper first if you are practising.
Paper as text
Question paper, page 1
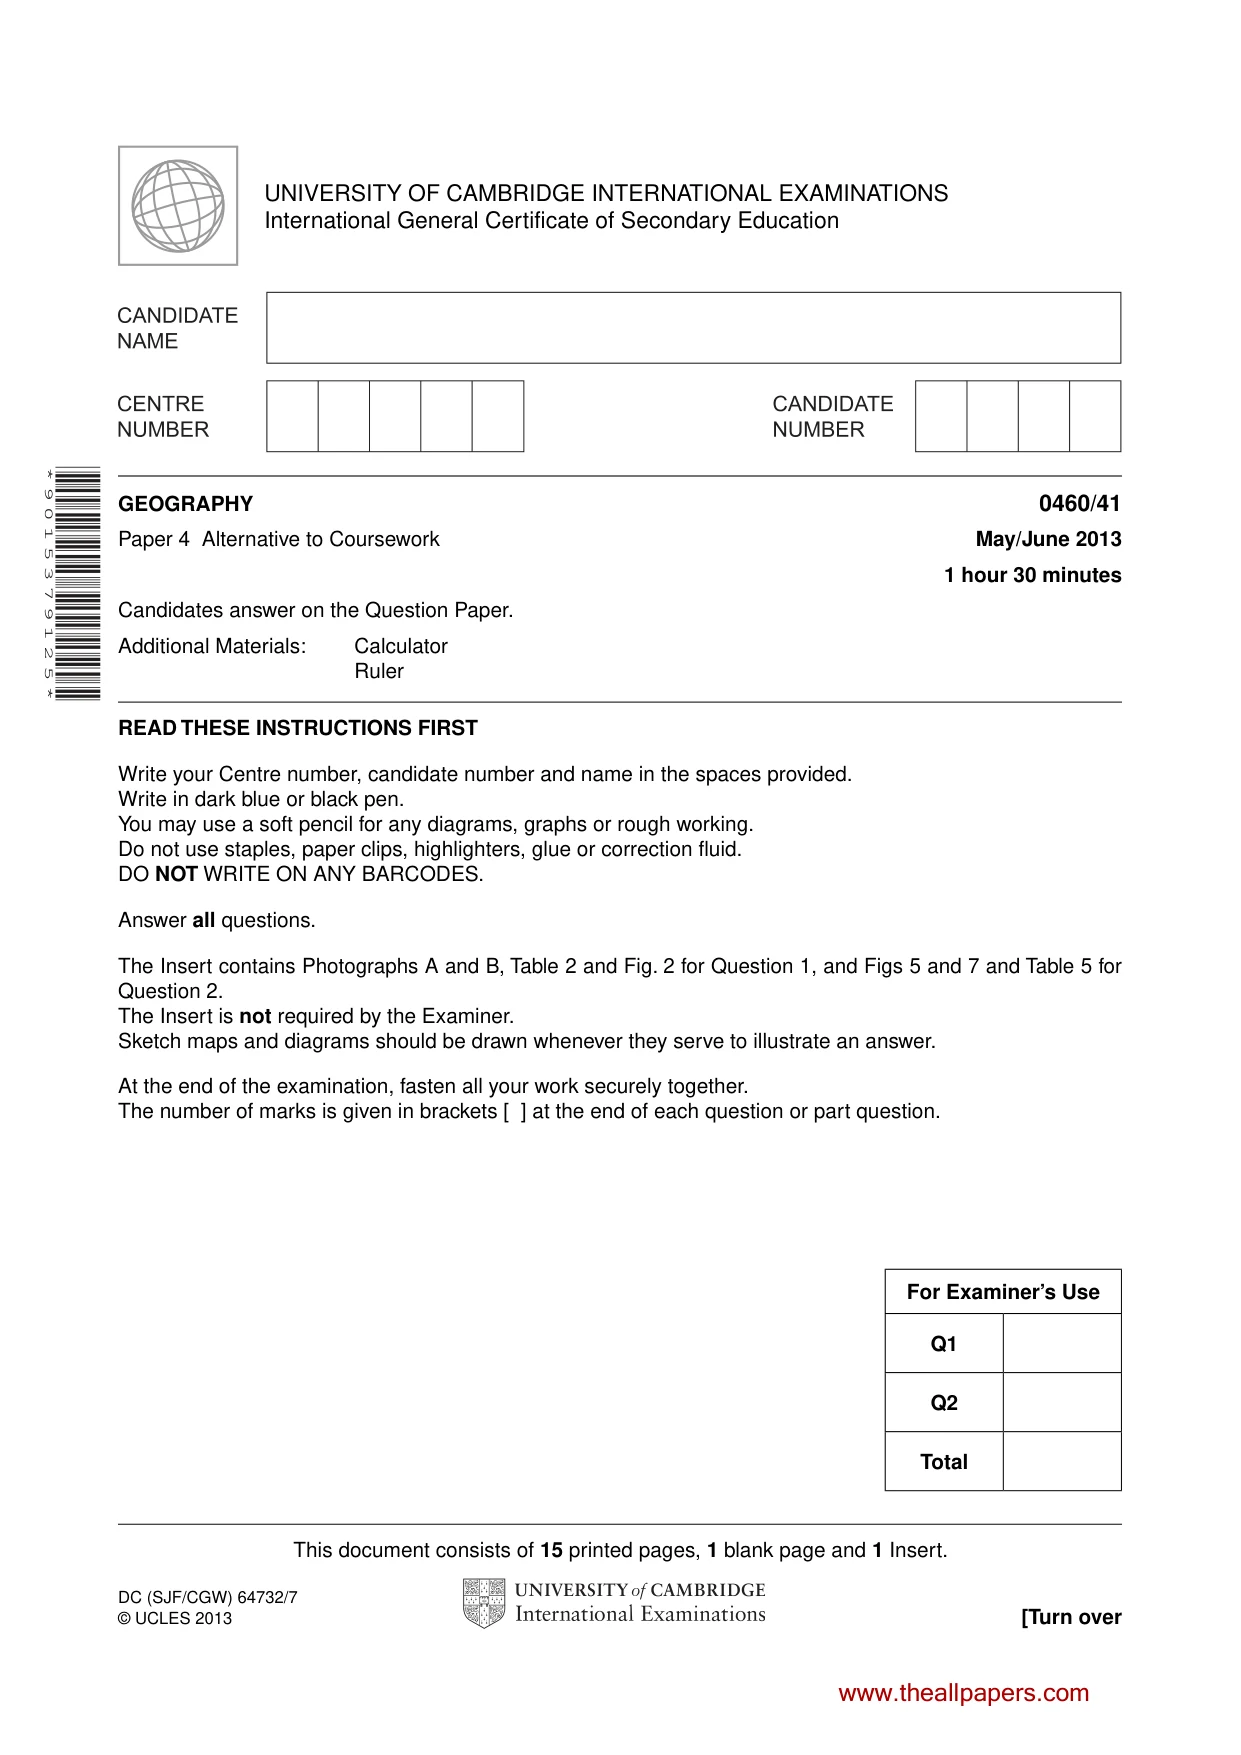
This document consists of 15 printed pages, 1 blank page and 1 Insert. DC (SJF/CGW) 64732/7 © UCLES 2013 [Turn over UNIVERSITY OF CAMBRIDGE INTERNATIONAL EXAMINATIONS International General Certificate of Secondary Education * 9 0 1 5 3 7 9 1 2 5 * GEOGRAPHY 0460/41 Paper 4 Alternative to Coursework May/June 2013 1 hour 30 minutes Candidates answer on the Question Paper. Additional Materials: Calculator Ruler READ THESE INSTRUCTIONS FIRST Write your Centre number, candidate number and name in the spaces provided. Write in dark blue or black pen. You may use a soft pencil for any diagrams, graphs or rough working. Do not use staples, paper clips, highlighters, glue or correction fluid. DO NOT WRITE ON ANY BARCODES. Answer all questions. The Insert contains Photographs A and B, Table 2 and Fig. 2 for Question 1, and Figs 5 and 7 and Table 5 for Question 2. The Insert is not required by the Examiner. Sketch maps and diagrams should be drawn whenever they serve to illustrate an answer. At the end of the examination, fasten all your work securely together. The number of marks is given in brackets [ ] at the end of each question or part question. For Examiner’s Use Q1 Q2 Total www.theallpapers.com
Question paper, page 2
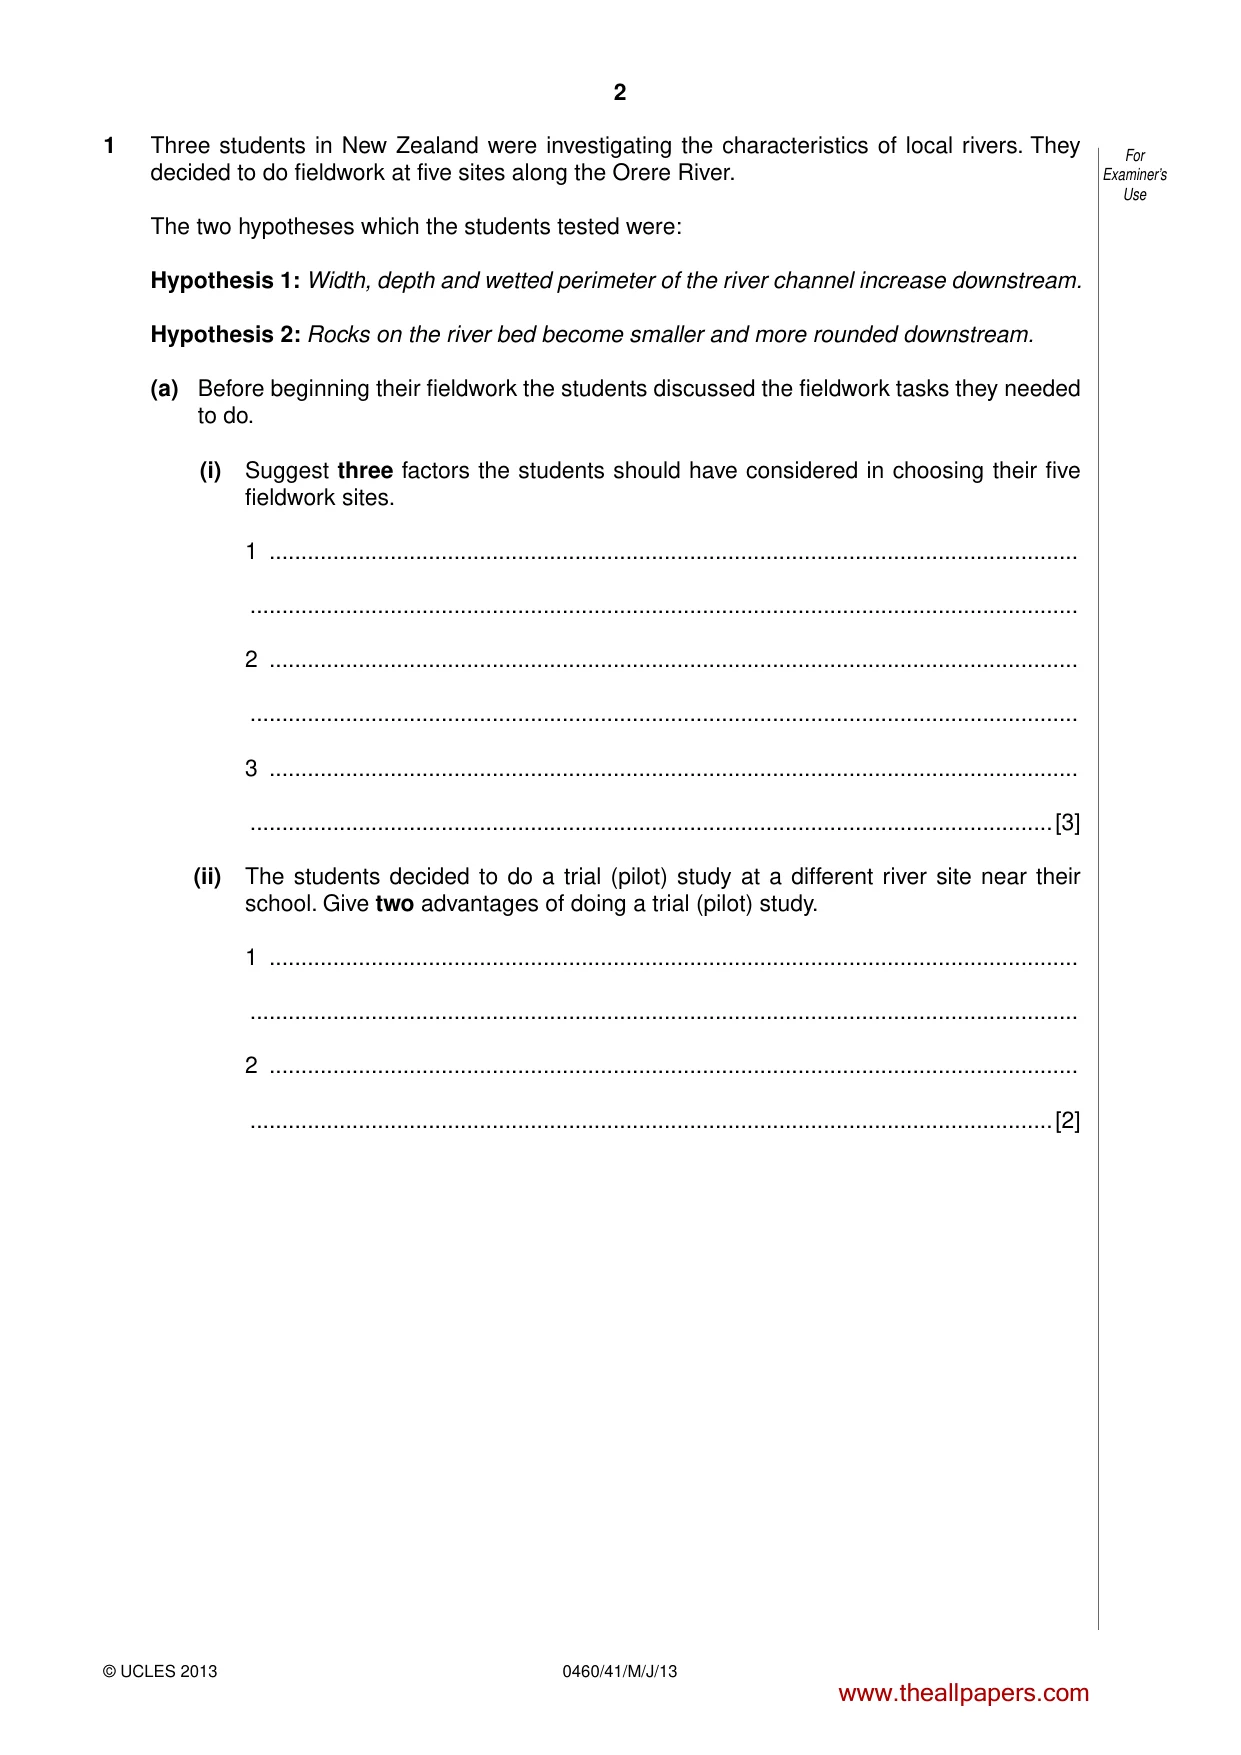
2 0460/41/M/J/13 © UCLES 2013 For Examiner’s Use 1 Three students in New Zealand were investigating the characteristics of local rivers. They decided to do fieldwork at five sites along the Orere River. The two hypotheses which the students tested were: Hypothesis 1: Width, depth and wetted perimeter of the river channel increase downstream. Hypothesis 2: Rocks on the river bed become smaller and more rounded downstream. (a) Before beginning their fieldwork the students discussed the fieldwork tasks they needed to do. (i) Suggest three factors the students should have considered in choosing their five fieldwork sites. 1 … … 2 … … 3 … …[3] (ii) The students decided to do a trial (pilot) study at a different river site near their school. Give two advantages of doing a trial (pilot) study. 1 … … 2 … …[2] www.theallpapers.com
Question paper, page 3
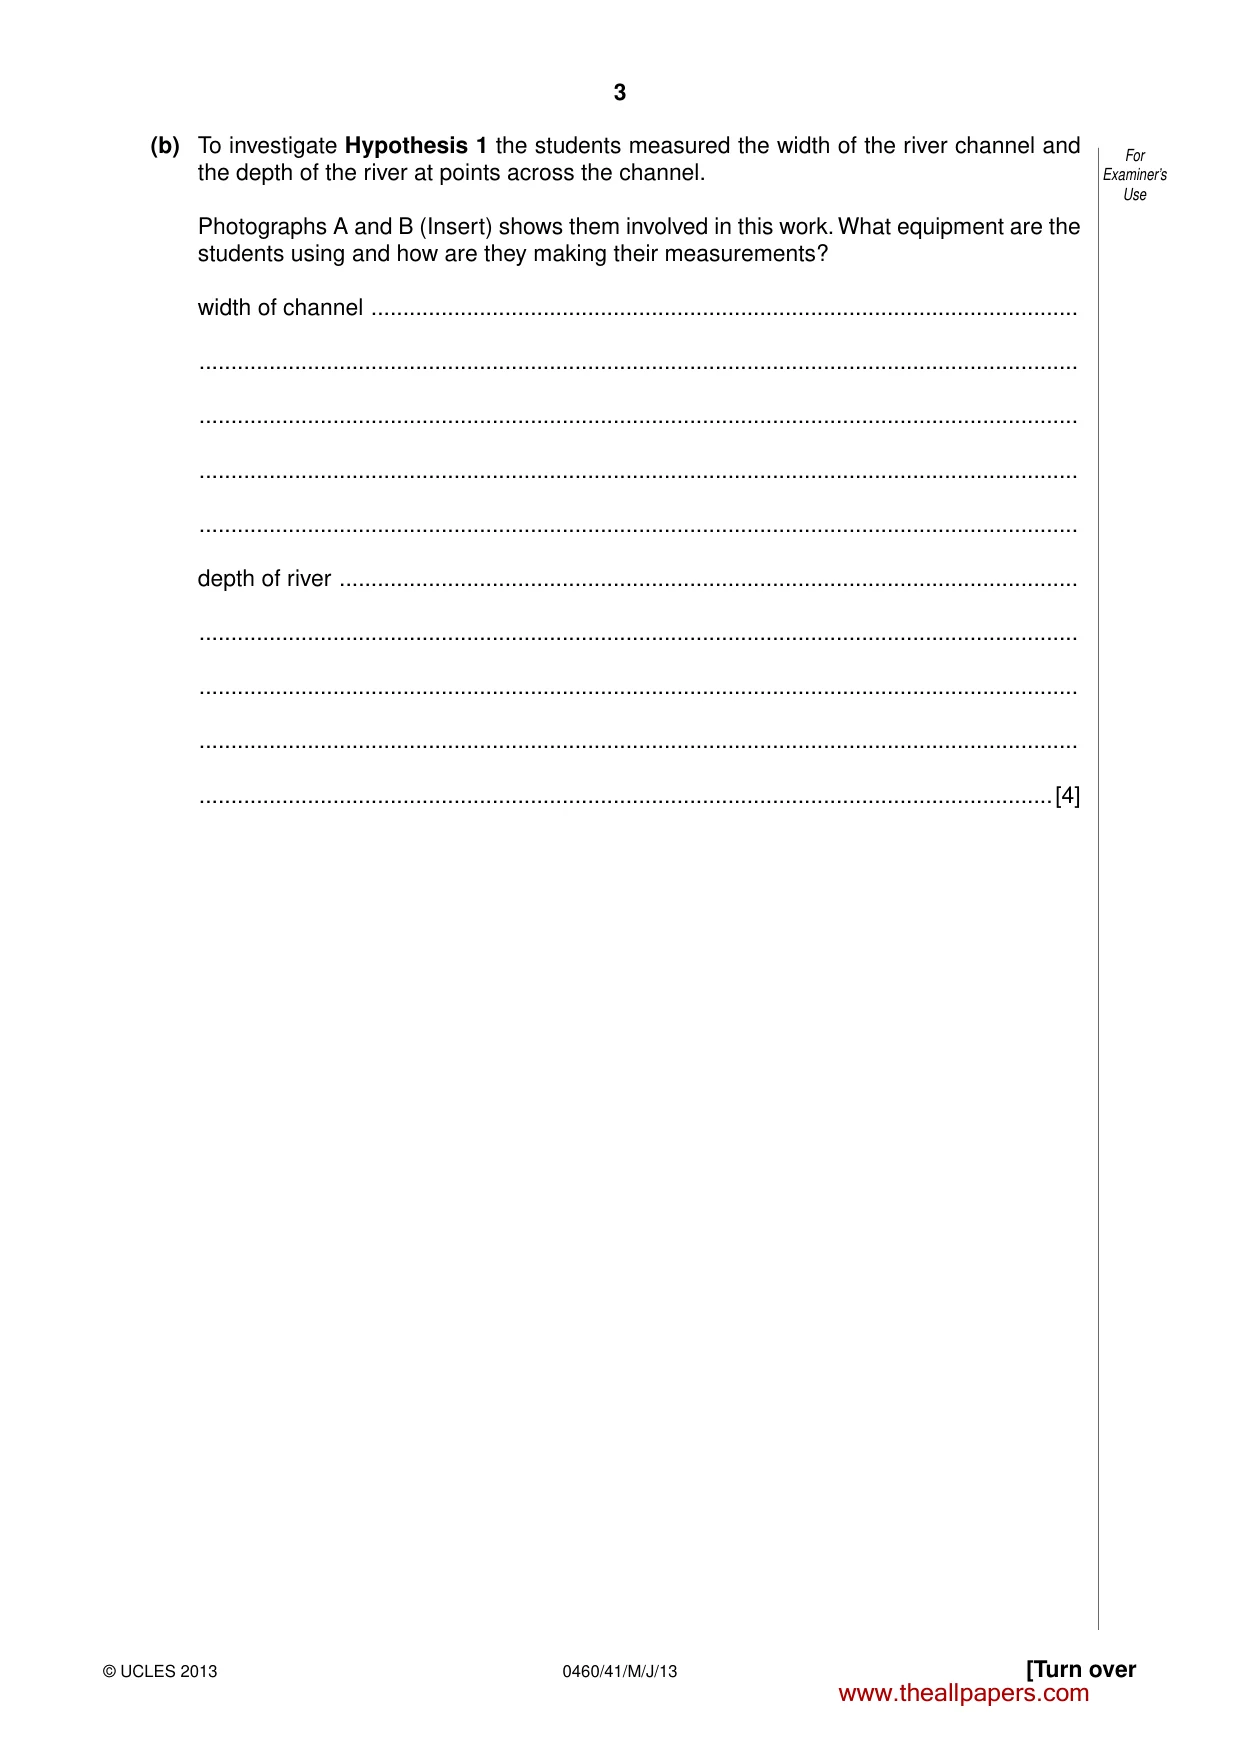
3 0460/41/M/J/13 © UCLES 2013 [Turn over For Examiner’s Use (b) To investigate Hypothesis 1 the students measured the width of the river channel and the depth of the river at points across the channel. Photographs A and B (Insert) shows them involved in this work. What equipment are the students using and how are they making their measurements? width of channel … … … … … depth of river … … … … …[4] www.theallpapers.com
Question paper, page 4
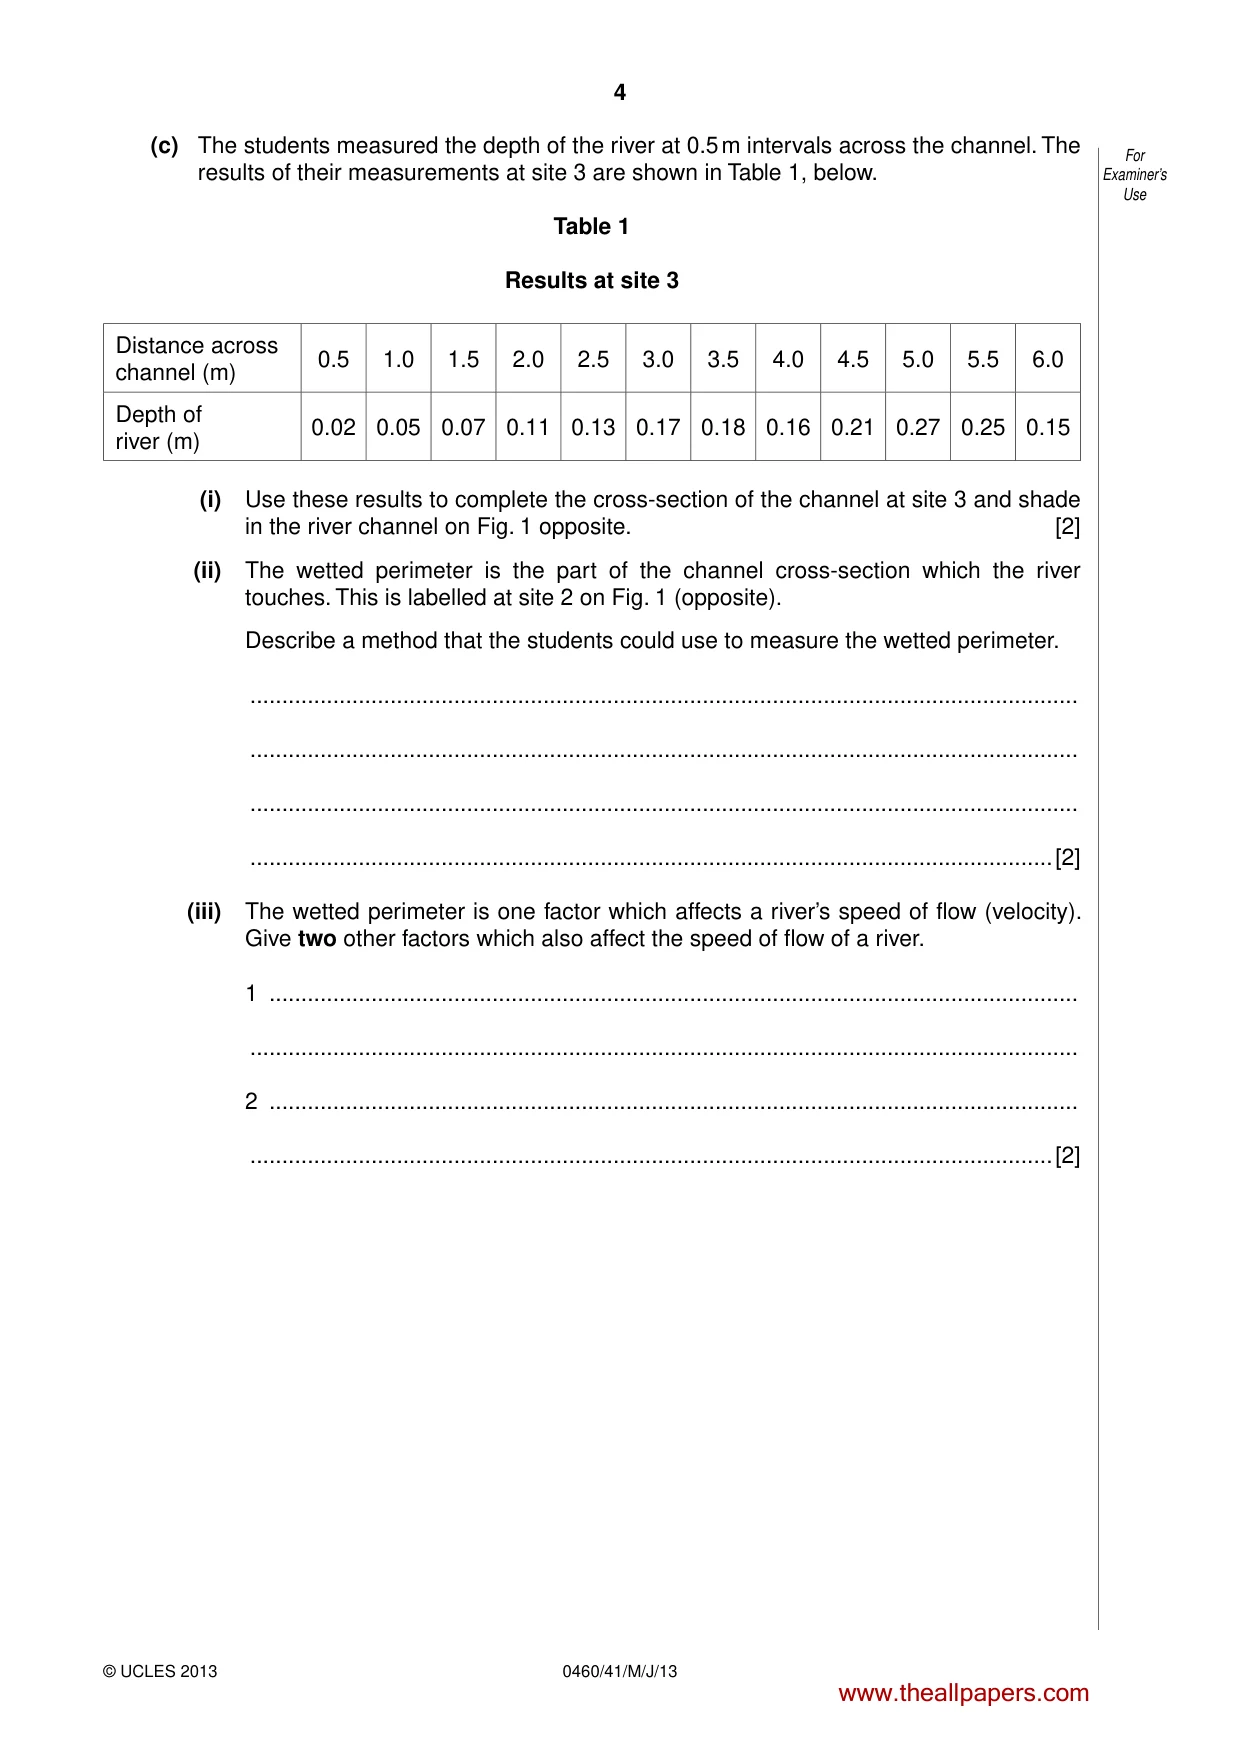
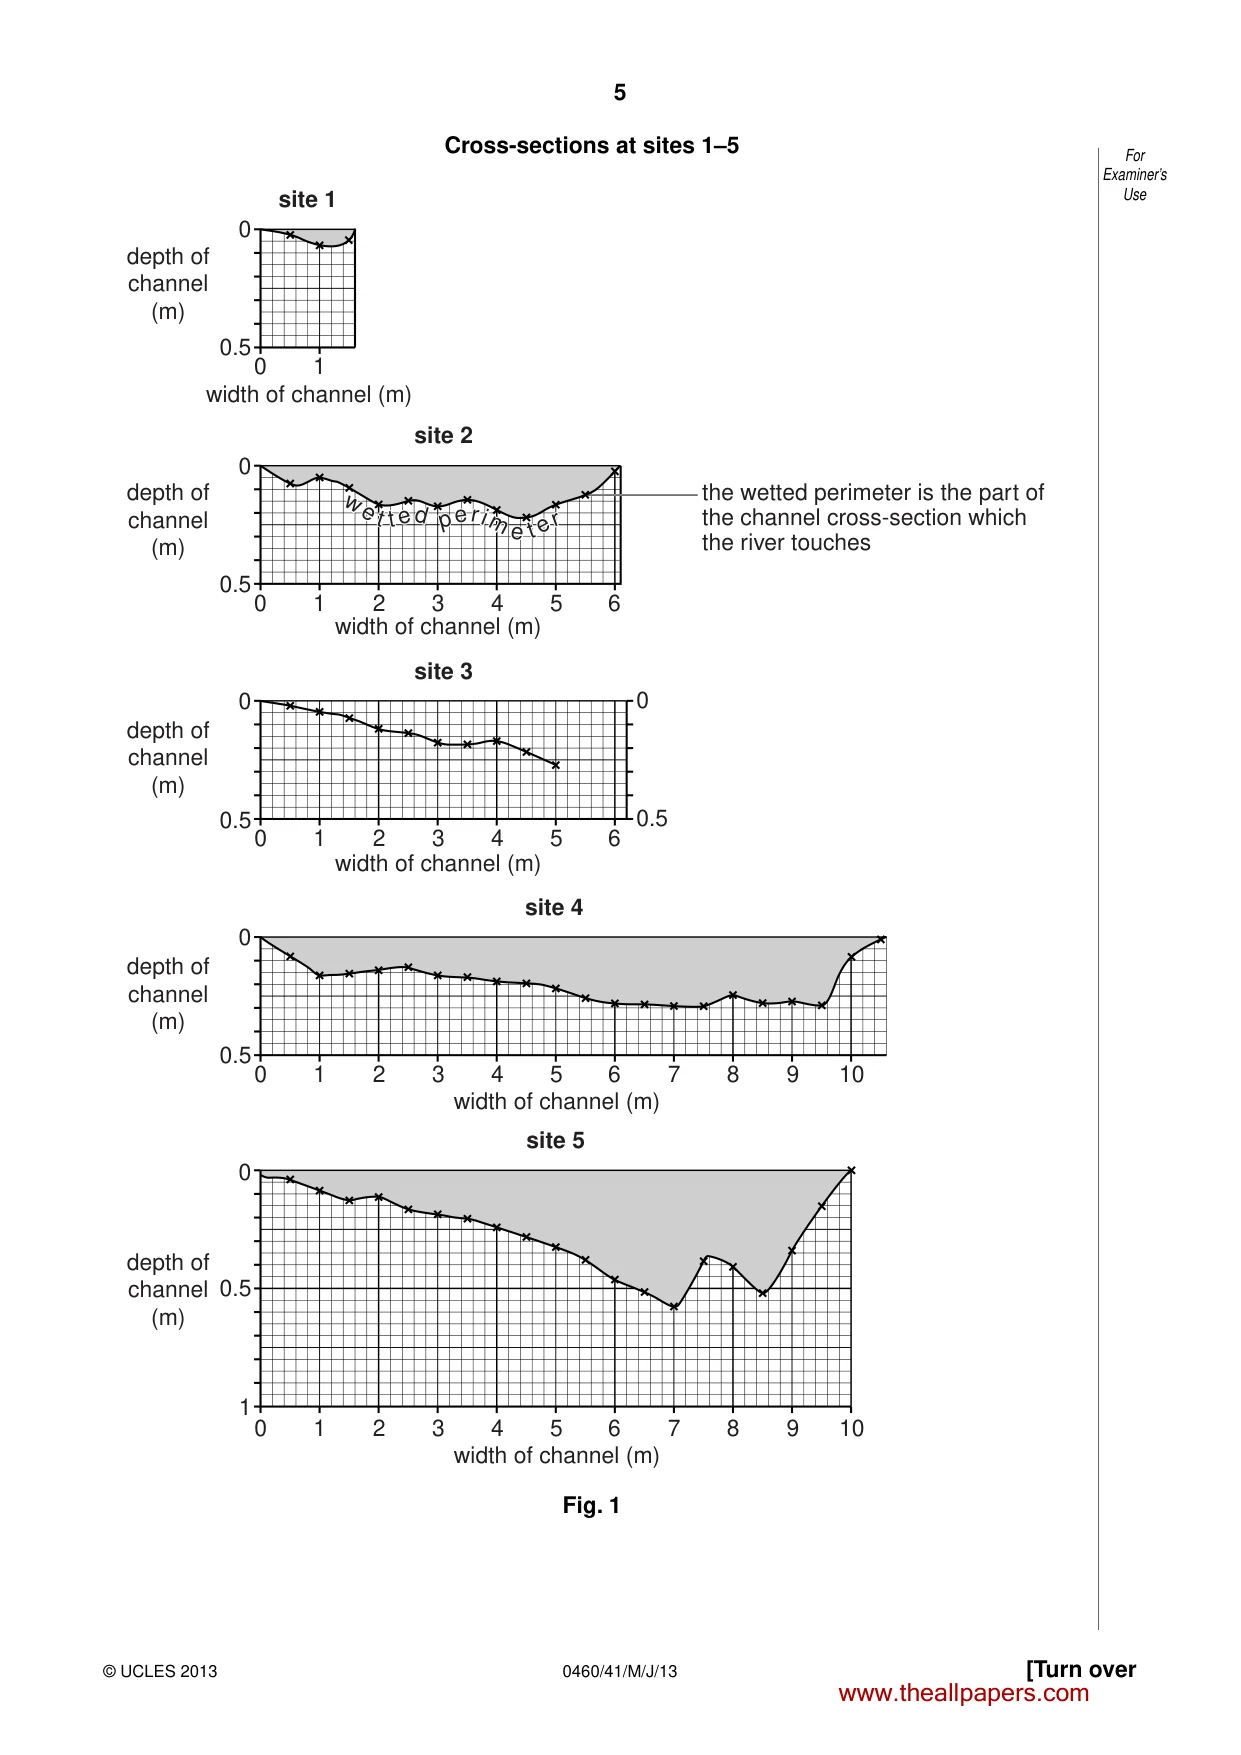
4 0460/41/M/J/13 © UCLES 2013 For Examiner’s Use (c) The students measured the depth of the river at 0.5 m intervals across the channel. The results of their measurements at site 3 are shown in Table 1, below. Table 1 Results at site 3 Distance across channel (m) 0.5 1.0 1.5 2.0 2.5 3.0 3.5 4.0 4.5 5.0 5.5 6.0 Depth of river (m) 0.02 0.05 0.07 0.11 0.13 0.17 0.18 0.16 0.21 0.27 0.25 0.15 (i) Use these results to complete the cross-section of the channel at site 3 and shade in the river channel on Fig. 1 opposite. [2] (ii) The wetted perimeter is the part of the channel cross-section which the river touches. This is labelled at site 2 on Fig. 1 (opposite). Describe a method that the students could use to measure the wetted perimeter. … … … …[2] (iii) The wetted perimeter is one factor which affects a river’s speed of flow (velocity). Give two other factors which also affect the speed of flow of a river. 1 … … 2 … …[2] www.theallpapers.com
Question paper, page 5
5 0460/41/M/J/13 © UCLES 2013 [Turn over For Examiner’s Use Cross-sections at sites 1–5 0 0 1 0 1 2 3 width of channel (m) width of channel (m) depth of channel (m) 0 depth of channel (m) 0 depth of channel (m) 0 depth of channel (m) 0 depth of channel (m) width of channel (m) width of channel (m) width of channel (m) 4 5 the wetted perimeter is the part of the channel cross-section which the river touches 6 site 1 site 2 site 3 site 4 site 5 0.5 0.5 0 1 2 3 4 5 6 0.5 0 1 2 3 4 5 6 7 8 9 10 0.5 0 1 2 3 4 5 6 7 8 9 10 0.5 1 0 0.5 w e t t e d p e r i m e t e r w e t t e d p e r i m e t e r Fig. 1 www.theallpapers.com
Question paper, page 6
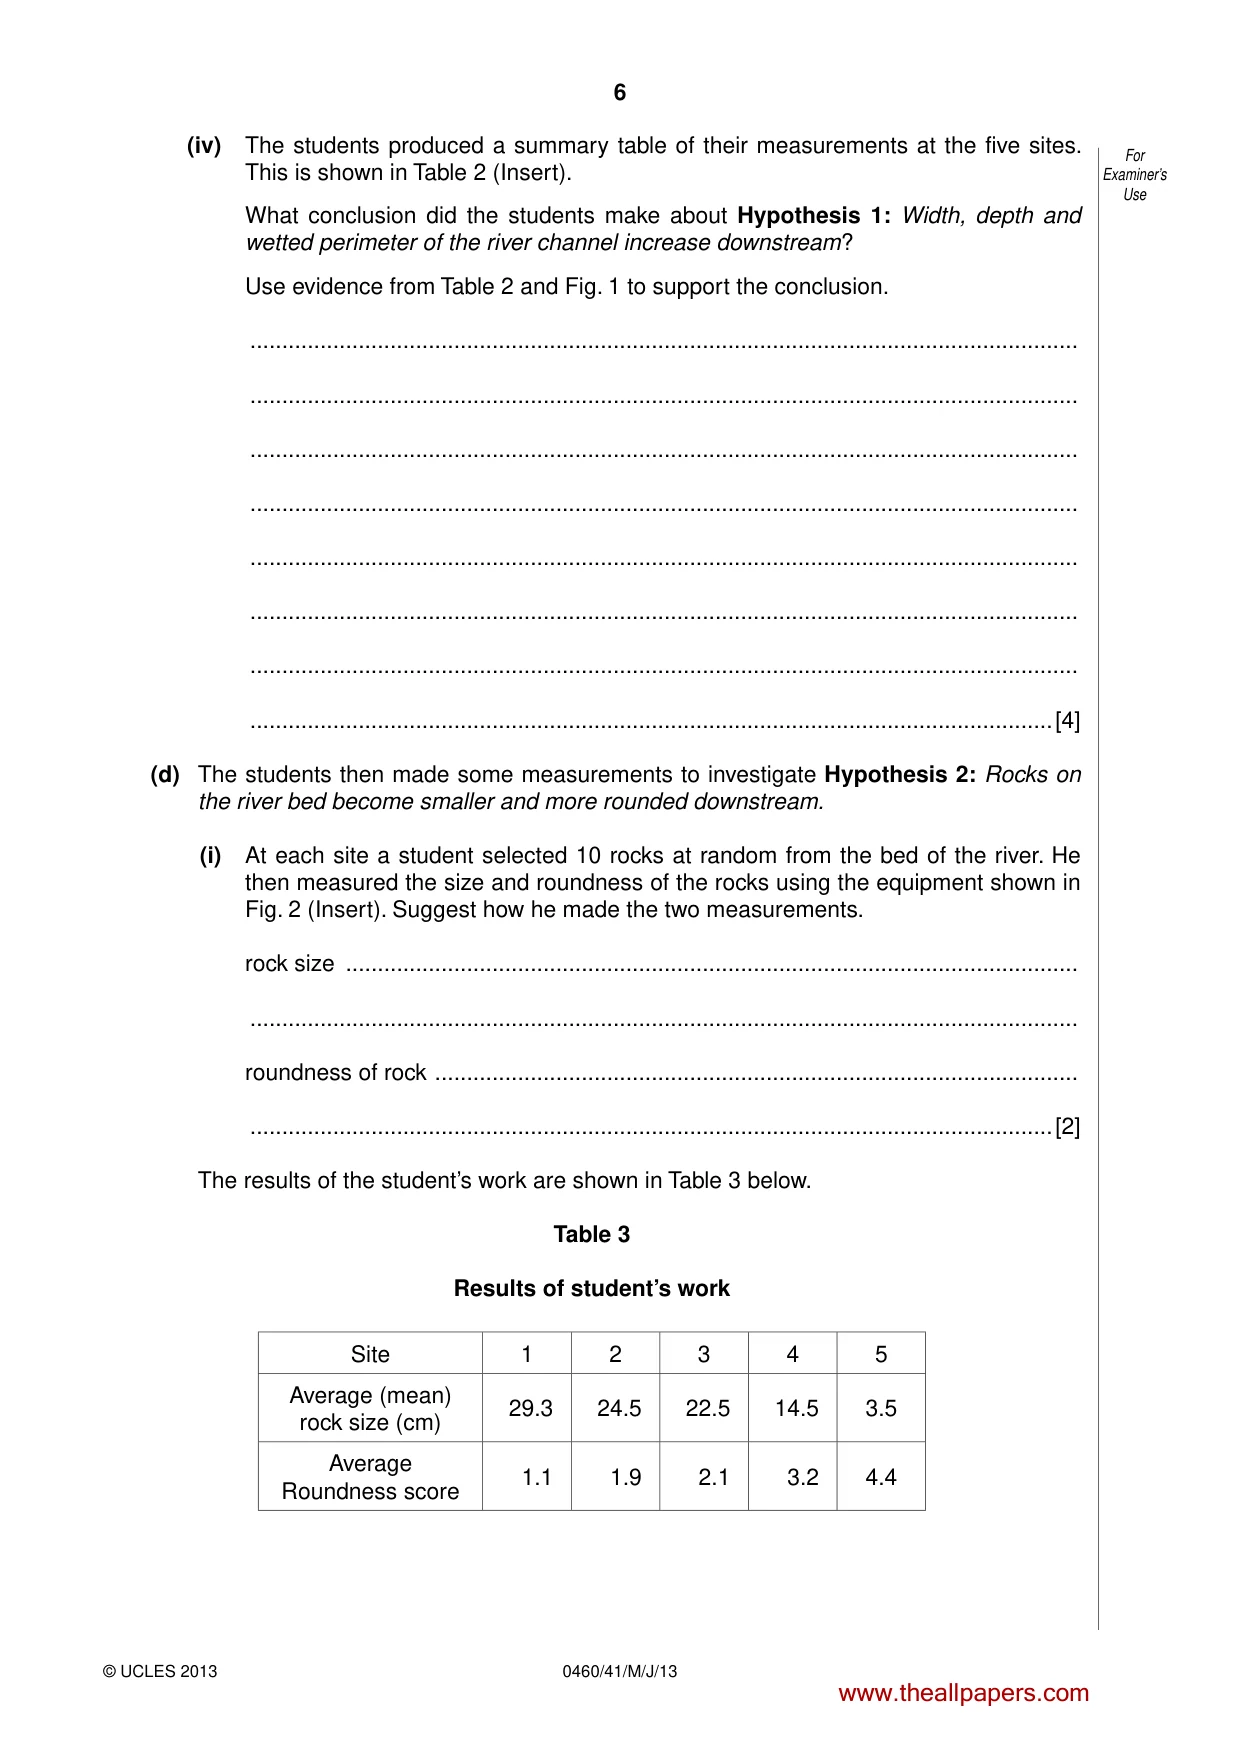
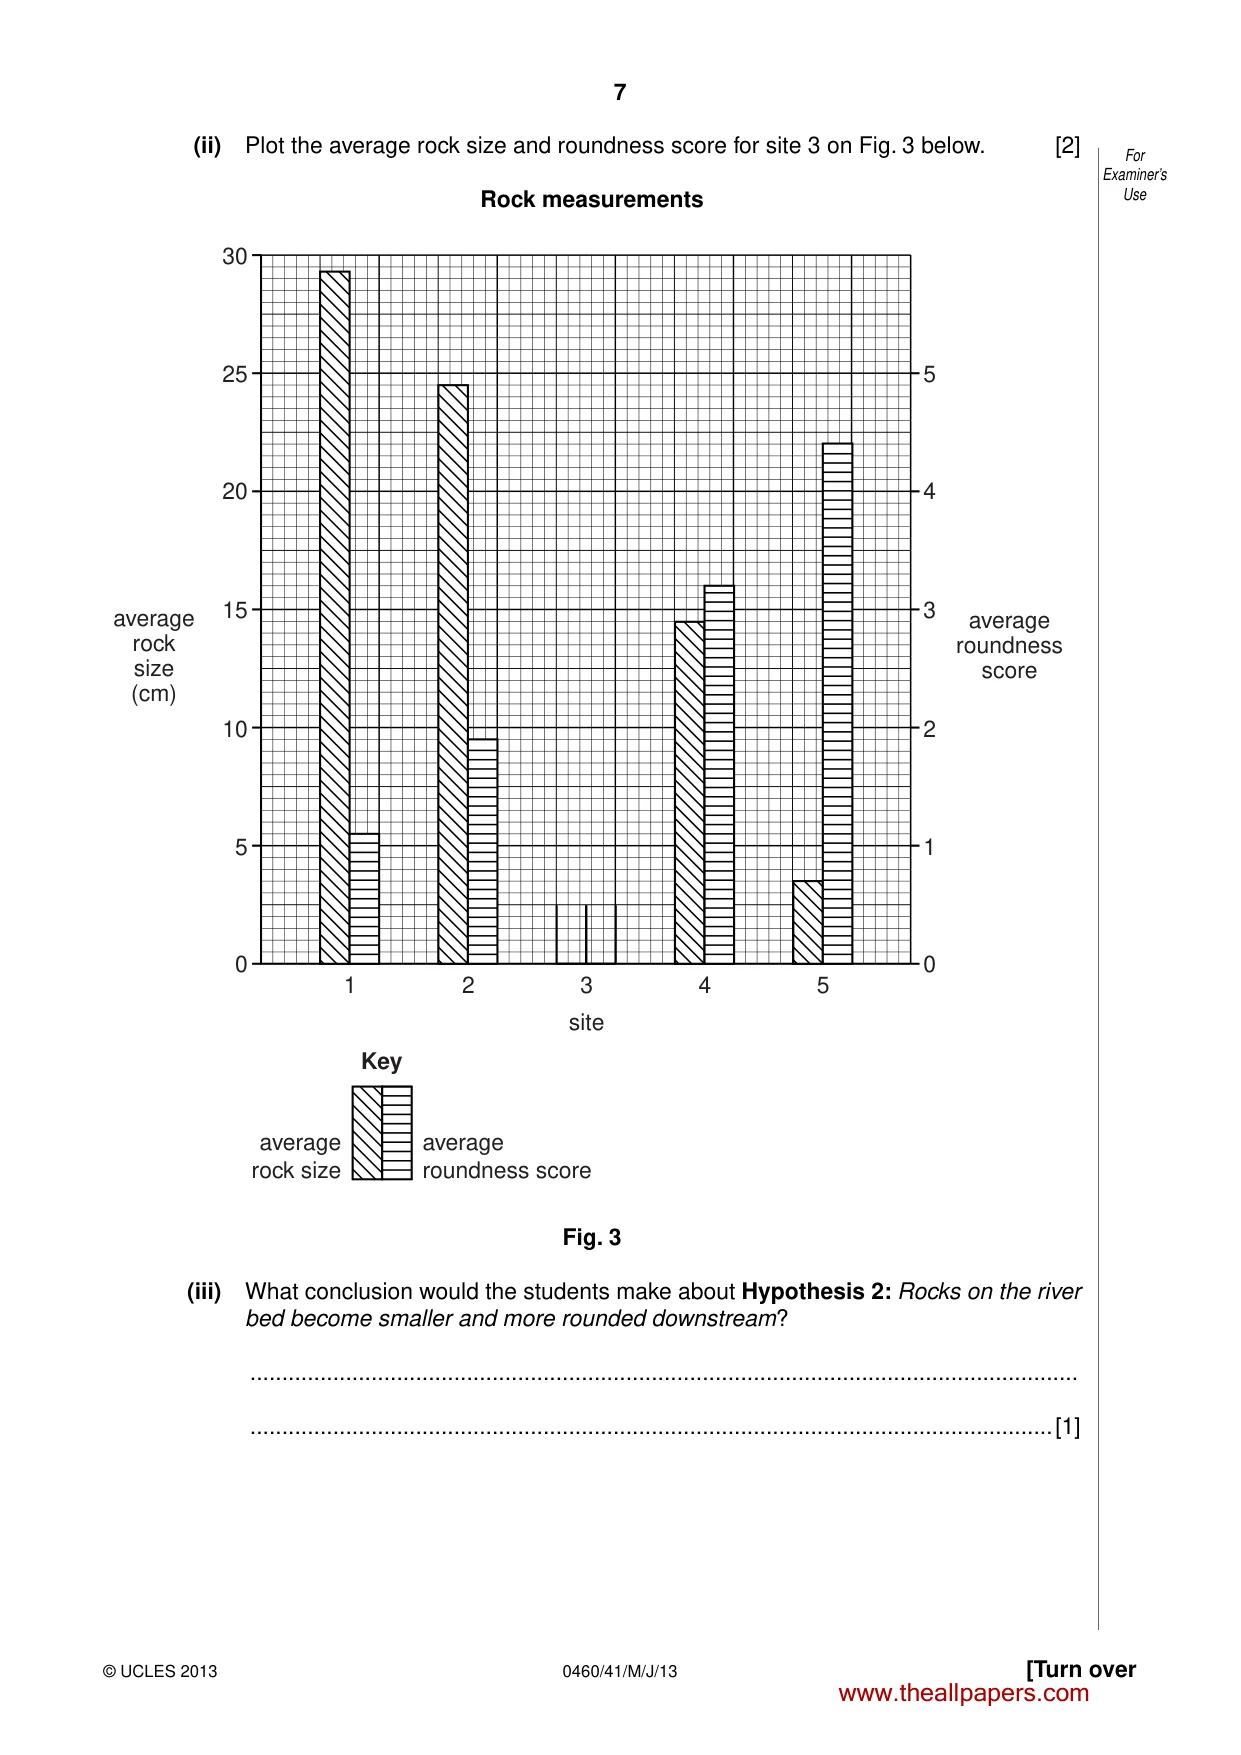
6 0460/41/M/J/13 © UCLES 2013 For Examiner’s Use (iv) The students produced a summary table of their measurements at the five sites. This is shown in Table 2 (Insert). What conclusion did the students make about Hypothesis 1: Width, depth and wetted perimeter of the river channel increase downstream? Use evidence from Table 2 and Fig. 1 to support the conclusion. … … … … … … … …[4] (d) The students then made some measurements to investigate Hypothesis 2: Rocks on the river bed become smaller and more rounded downstream. (i) At each site a student selected 10 rocks at random from the bed of the river. He then measured the size and roundness of the rocks using the equipment shown in Fig. 2 (Insert). Suggest how he made the two measurements. rock size … … roundness of rock … …[2] The results of the student’s work are shown in Table 3 below. Table 3 Results of student’s work Site 1 2 3 4 5 Average (mean) rock size (cm) 29.3 24.5 22.5 14.5 3.5 Average Roundness score 1.1 1.9 2.1 3.2 4.4 www.theallpapers.com
Question paper, page 7
7 0460/41/M/J/13 © UCLES 2013 [Turn over For Examiner’s Use (ii) Plot the average rock size and roundness score for site 3 on Fig. 3 below. [2] Rock measurements 30 25 20 15 10 5 0 5 4 3 2 1 0 5 4 3 site average roundness score Key average rock size average roundness score average rock size (cm) 2 1 Fig. 3 (iii) What conclusion would the students make about Hypothesis 2: Rocks on the river bed become smaller and more rounded downstream? … …[1] www.theallpapers.com
Question paper, page 8
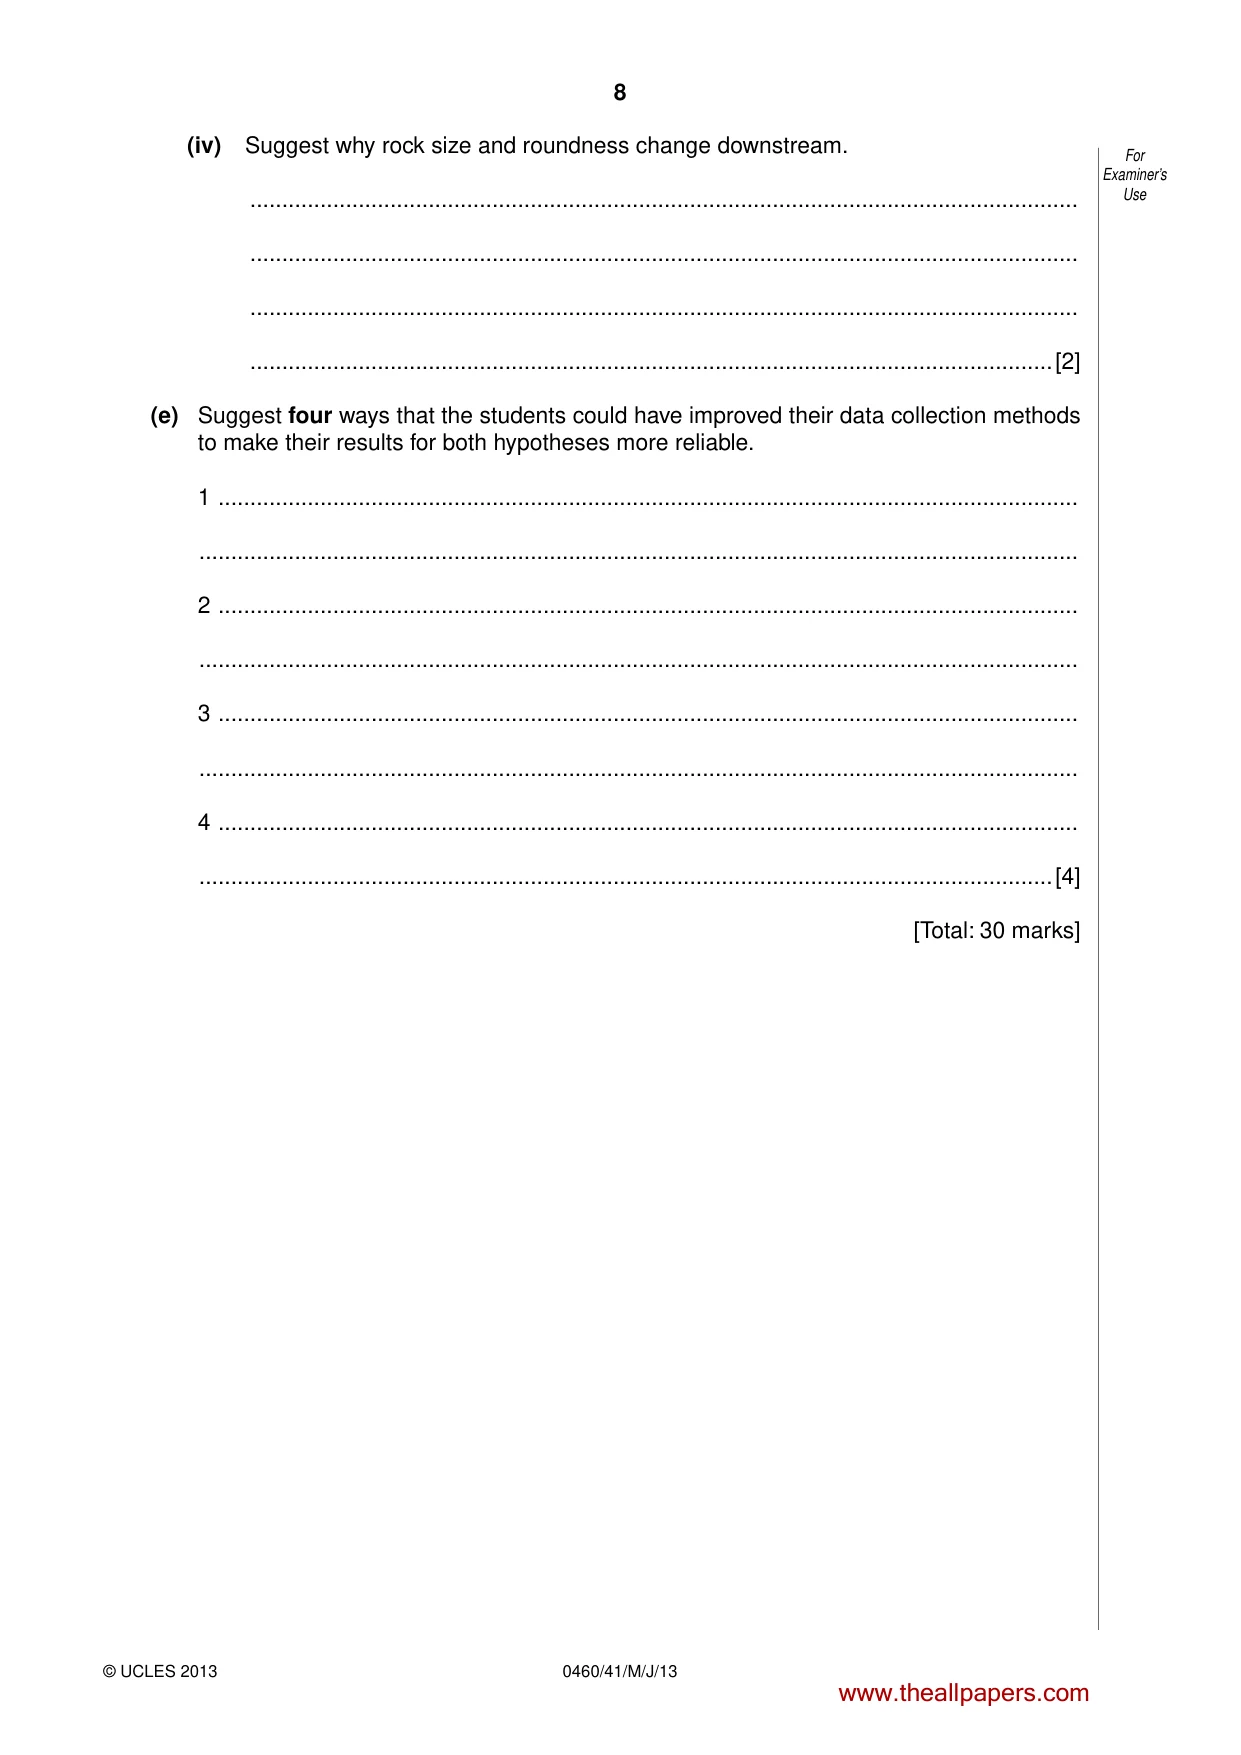
8 0460/41/M/J/13 © UCLES 2013 For Examiner’s Use (iv) Suggest why rock size and roundness change downstream. … … … …[2] (e) Suggest four ways that the students could have improved their data collection methods to make their results for both hypotheses more reliable. 1 … … 2 … … 3 … … 4 … …[4] [Total: 30 marks] www.theallpapers.com
Question paper, page 9
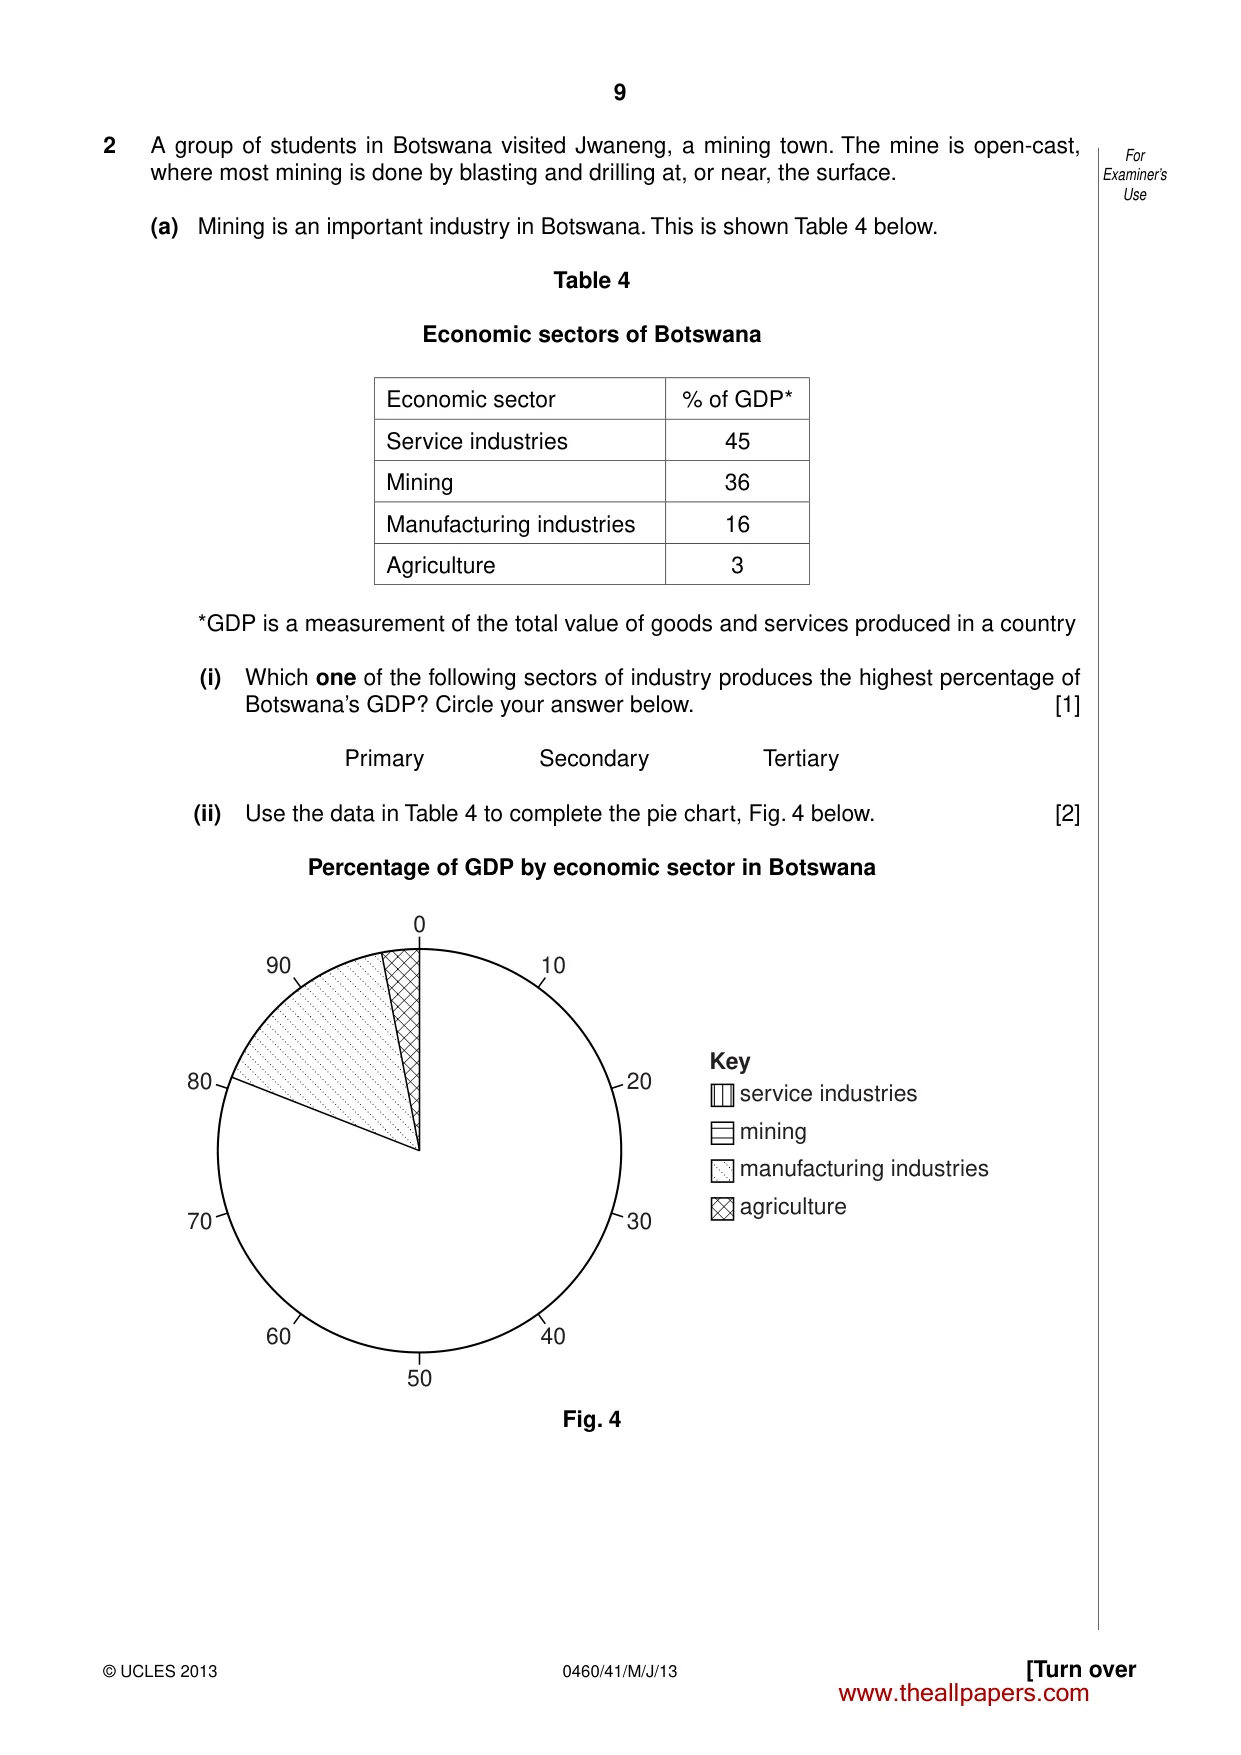
9 0460/41/M/J/13 © UCLES 2013 [Turn over For Examiner’s Use 2 A group of students in Botswana visited Jwaneng, a mining town. The mine is open-cast, where most mining is done by blasting and drilling at, or near, the surface. (a) Mining is an important industry in Botswana. This is shown Table 4 below. Table 4 Economic sectors of Botswana Economic sector % of GDP* Service industries 45 Mining 36 Manufacturing industries 16 Agriculture 3 *GDP is a measurement of the total value of goods and services produced in a country (i) Which one of the following sectors of industry produces the highest percentage of Botswana’s GDP? Circle your answer below. [1] Primary Secondary Tertiary (ii) Use the data in Table 4 to complete the pie chart, Fig. 4 below. [2] Percentage of GDP by economic sector in Botswana 0 50 10 40 90 60 20 service industries Key mining manufacturing industries agriculture 30 80 70 Fig. 4 www.theallpapers.com
Question paper, page 10
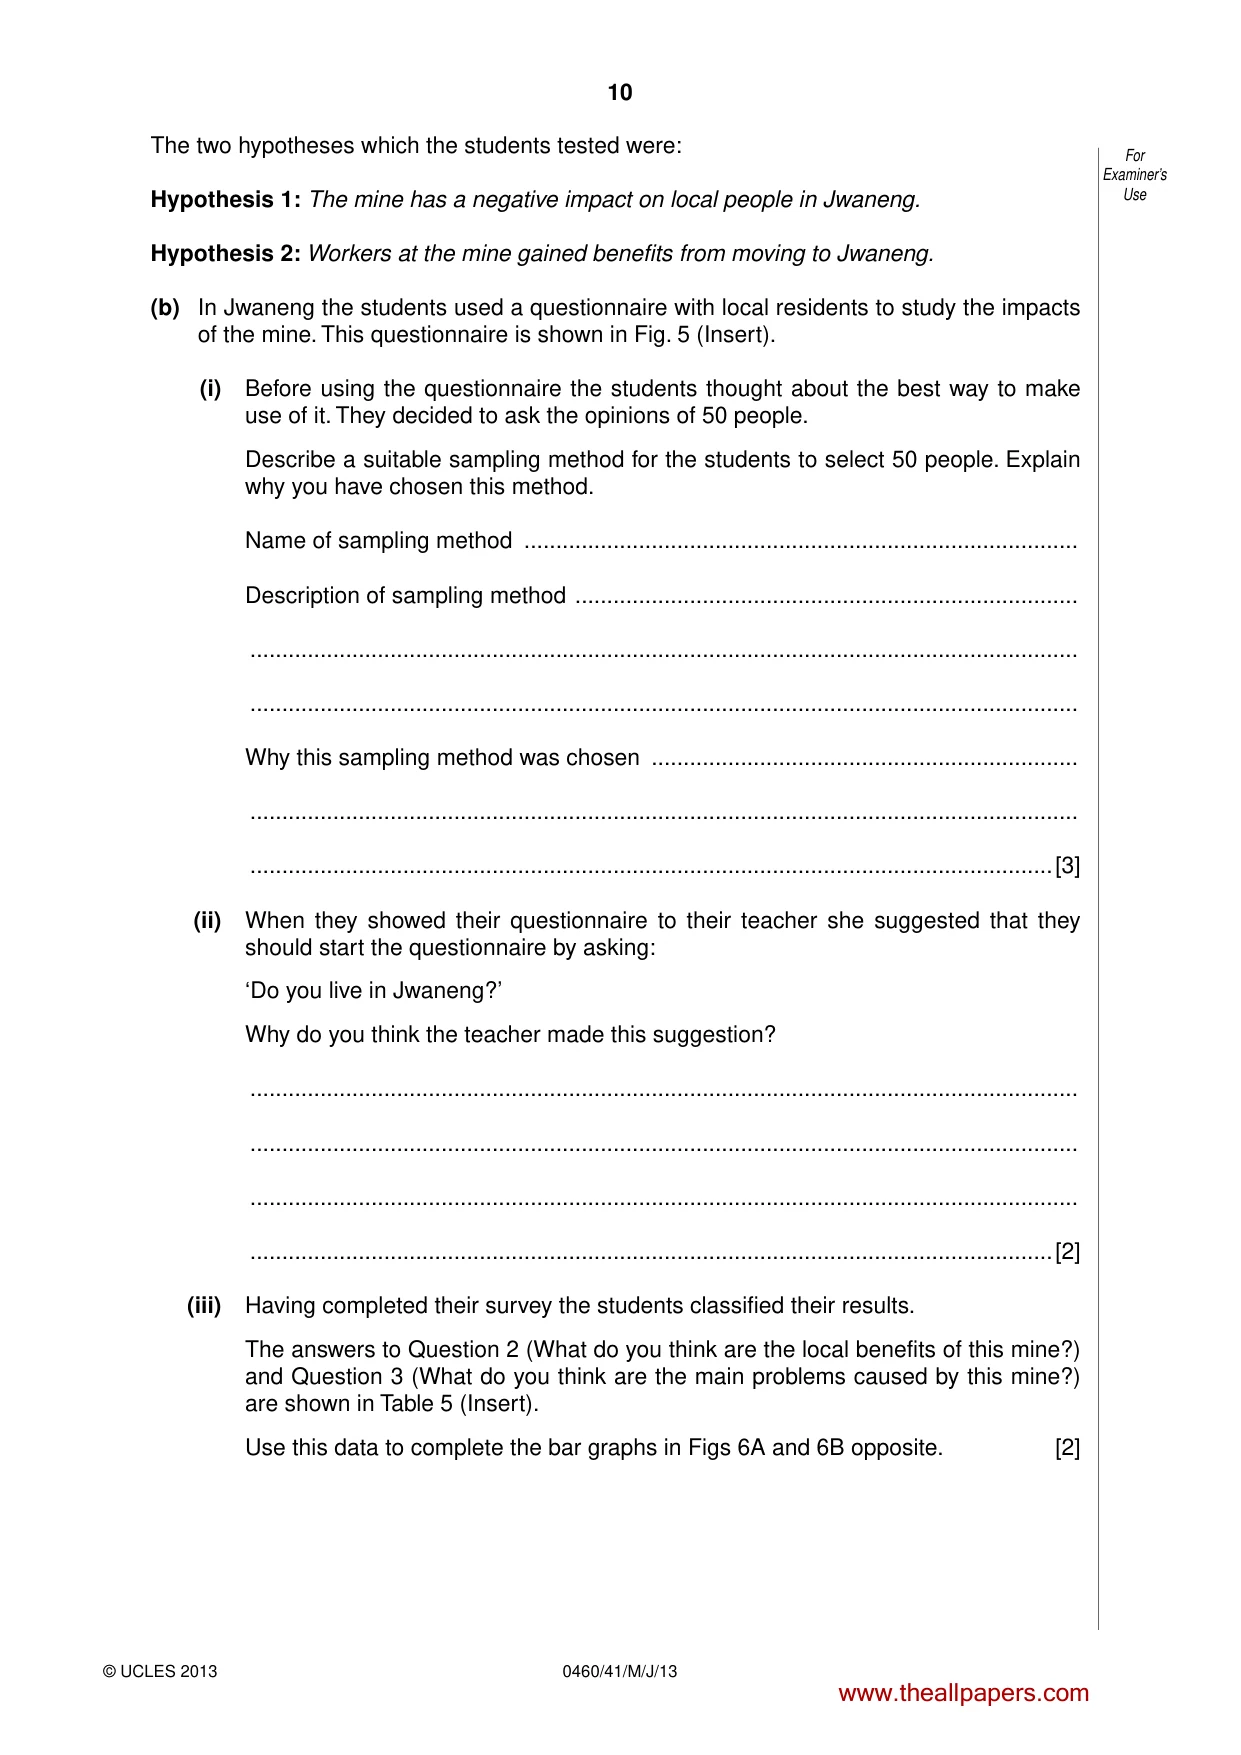
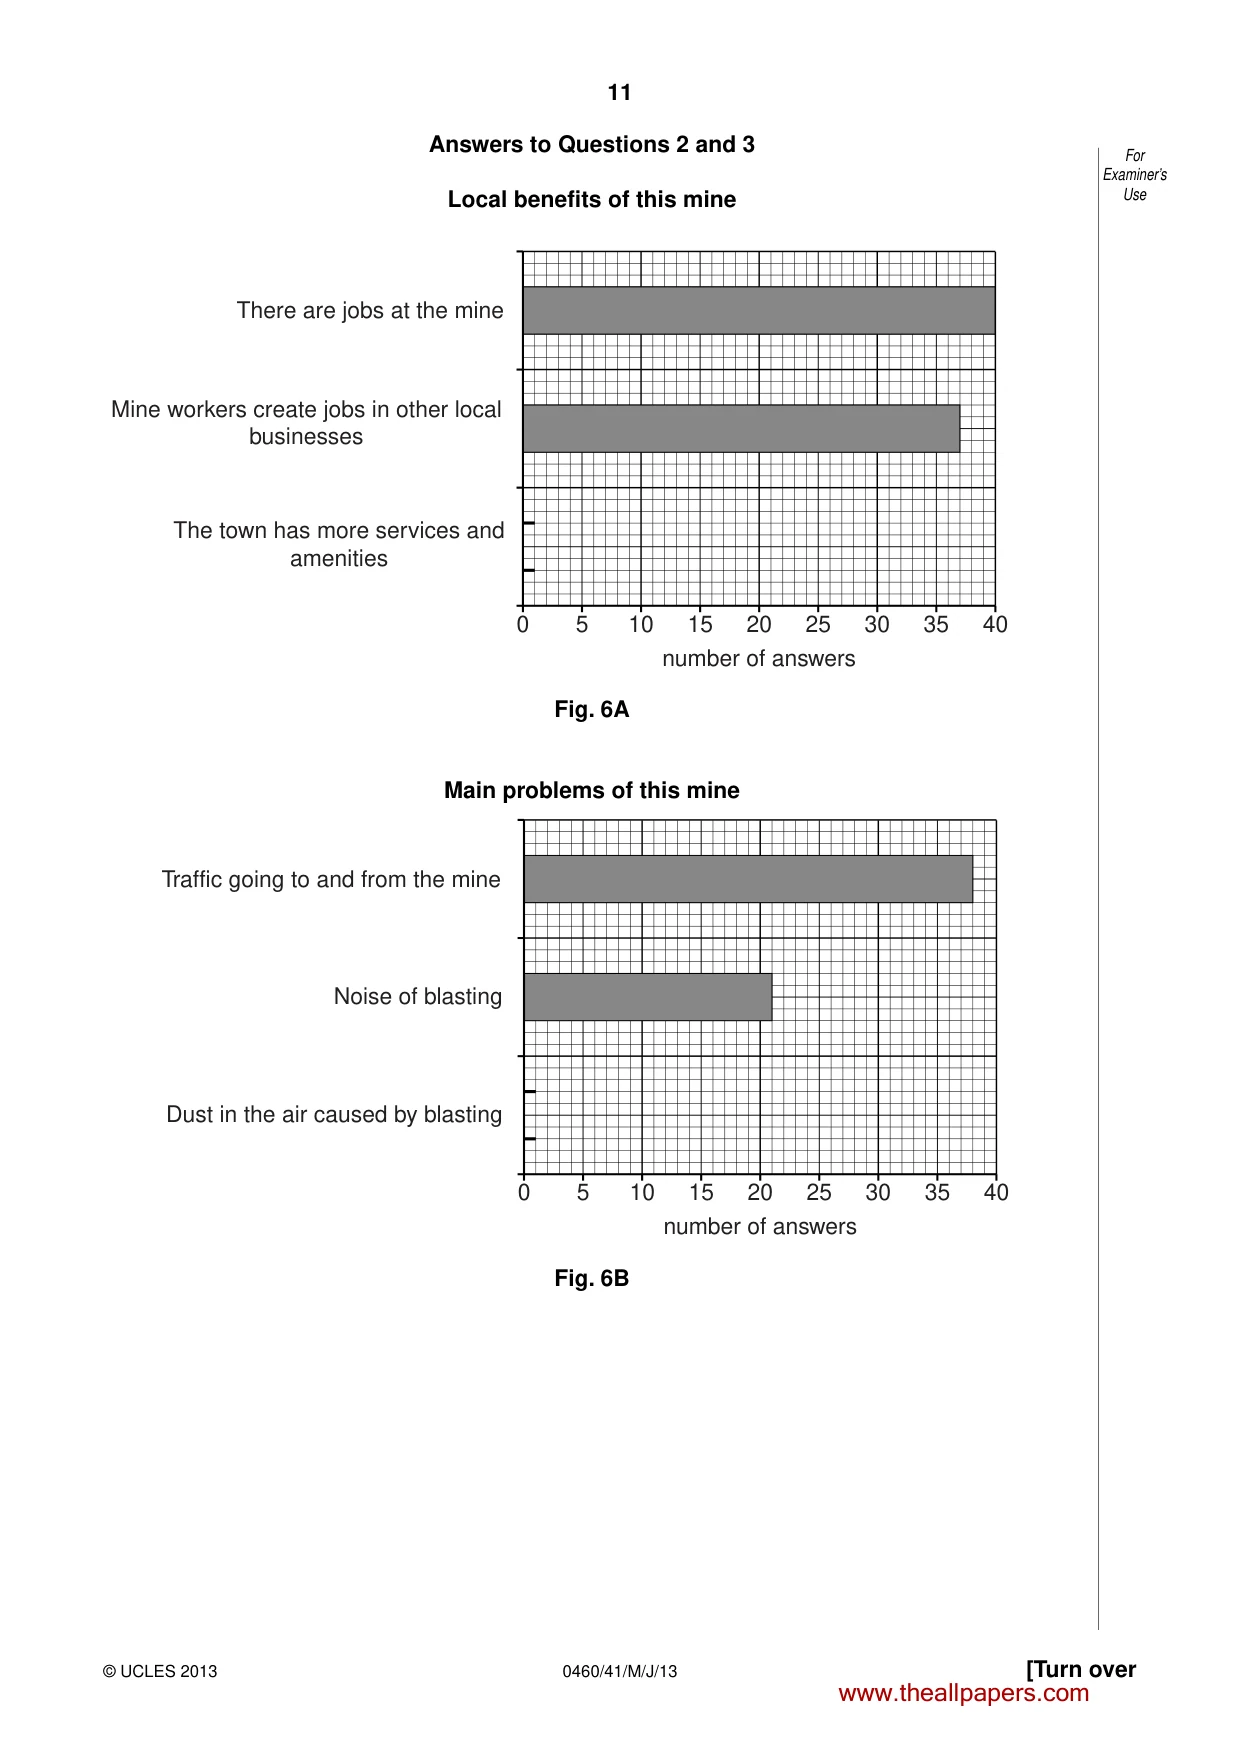
10 0460/41/M/J/13 © UCLES 2013 For Examiner’s Use The two hypotheses which the students tested were: Hypothesis 1: The mine has a negative impact on local people in Jwaneng. Hypothesis 2: Workers at the mine gained benefits from moving to Jwaneng. (b) In Jwaneng the students used a questionnaire with local residents to study the impacts of the mine. This questionnaire is shown in Fig. 5 (Insert). (i) Before using the questionnaire the students thought about the best way to make use of it. They decided to ask the opinions of 50 people. Describe a suitable sampling method for the students to select 50 people. Explain why you have chosen this method. Name of sampling method … Description of sampling method … … … Why this sampling method was chosen … … …[3] (ii) When they showed their questionnaire to their teacher she suggested that they should start the questionnaire by asking: ‘Do you live in Jwaneng?’ Why do you think the teacher made this suggestion? … … … …[2] (iii) Having completed their survey the students classified their results. The answers to Question 2 (What do you think are the local benefits of this mine?) and Question 3 (What do you think are the main problems caused by this mine?) are shown in Table 5 (Insert). Use this data to complete the bar graphs in Figs 6A and 6B opposite. [2] www.theallpapers.com
Question paper, page 11
11 0460/41/M/J/13 © UCLES 2013 [Turn over For Examiner’s Use Answers to Questions 2 and 3 Local benefits of this mine 0 5 10 15 20 number of answers The town has more services and amenities Mine workers create jobs in other local businesses There are jobs at the mine 25 30 35 40 Fig. 6A Main problems of this mine 0 5 10 15 20 number of answers Dust in the air caused by blasting Noise of blasting 25 30 35 40 Traffic going to and from the mine Fig. 6B www.theallpapers.com
Question paper, page 12
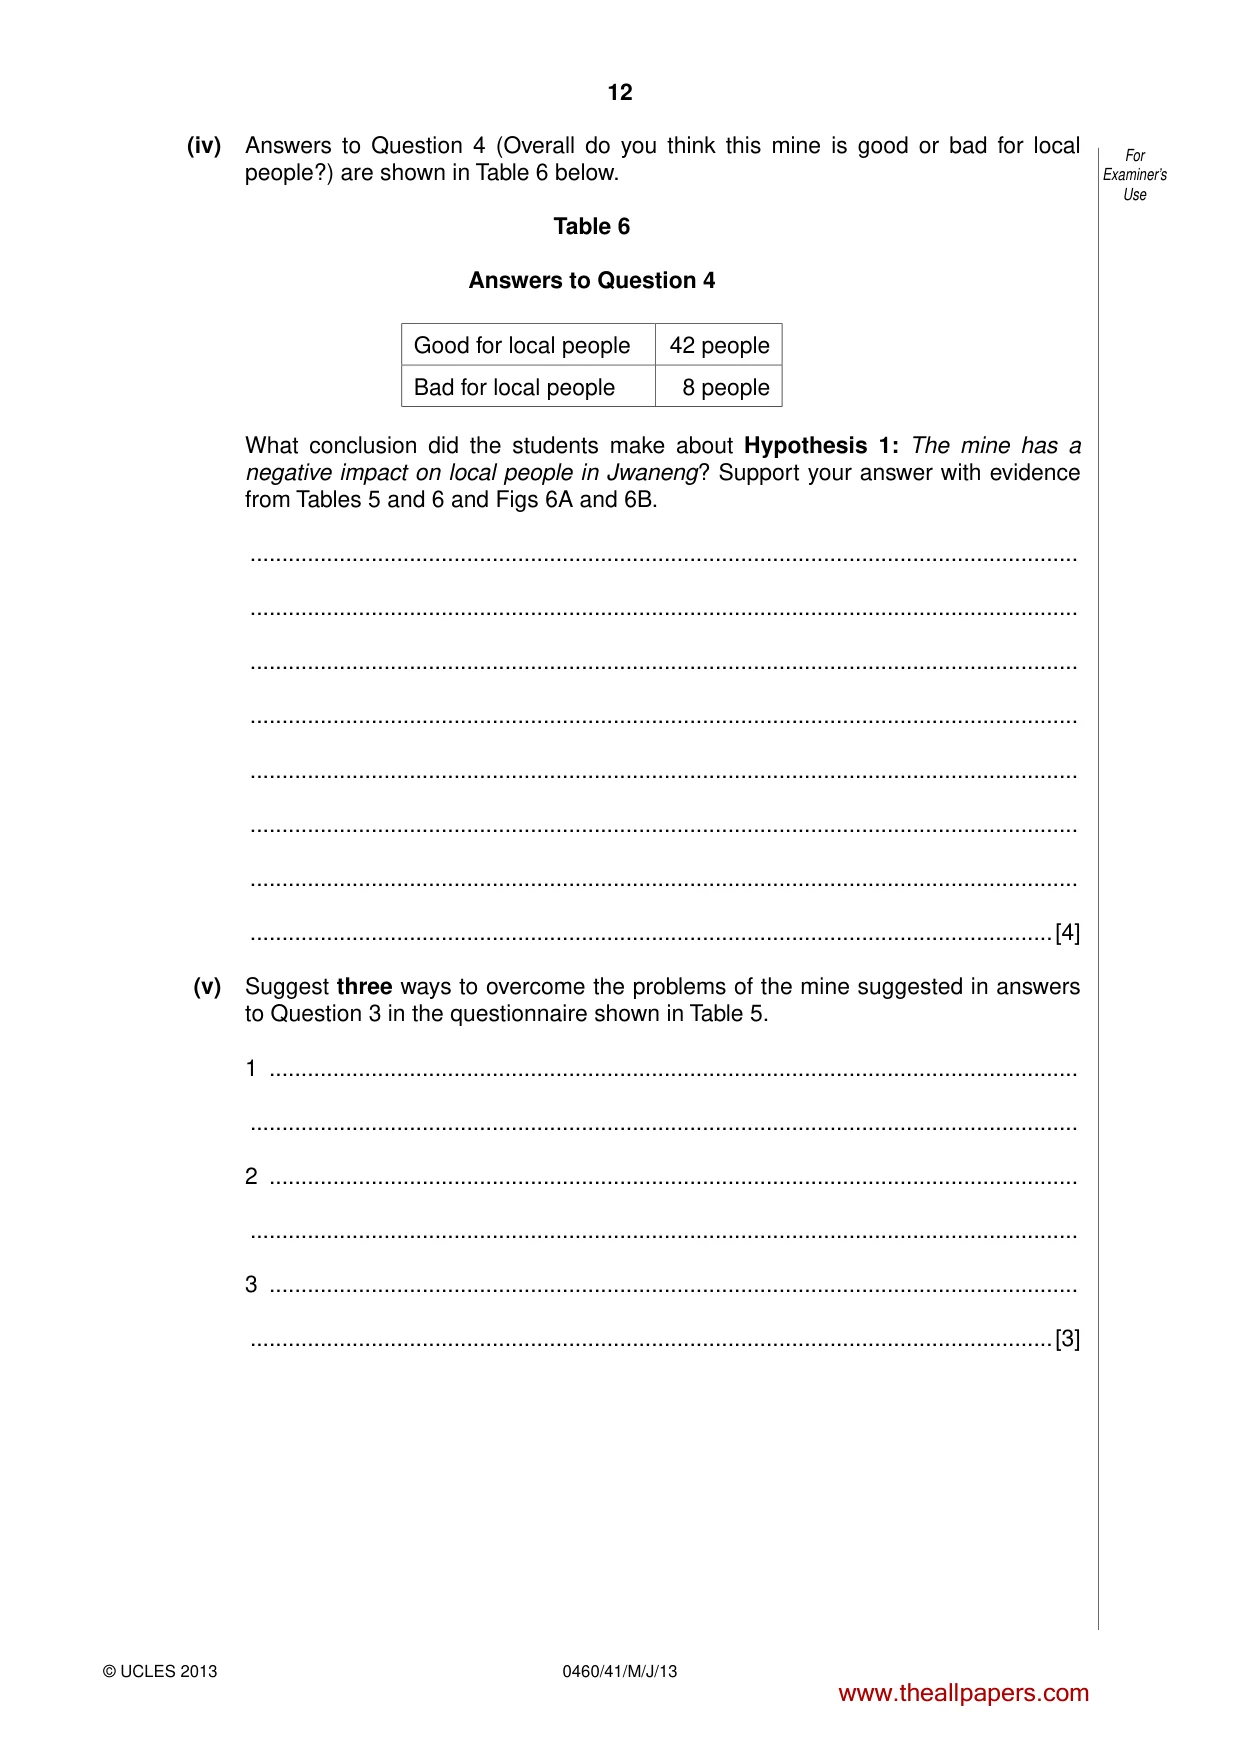
12 0460/41/M/J/13 © UCLES 2013 For Examiner’s Use (iv) Answers to Question 4 (Overall do you think this mine is good or bad for local people?) are shown in Table 6 below. Table 6 Answers to Question 4 Good for local people 42 people Bad for local people 8 people What conclusion did the students make about Hypothesis 1: The mine has a negative impact on local people in Jwaneng? Support your answer with evidence from Tables 5 and 6 and Figs 6A and 6B. … … … … … … … …[4] (v) Suggest three ways to overcome the problems of the mine suggested in answers to Question 3 in the questionnaire shown in Table 5. 1 … … 2 … … 3 … …[3] www.theallpapers.com
Question paper, page 13
13 0460/41/M/J/13 © UCLES 2013 [Turn over BLANK PAGE Question 2(c) begins on page 14 www.theallpapers.com
Question paper, page 14
14 0460/41/M/J/13 © UCLES 2013 (c) The students used a different questionnaire to investigate Hypothesis 2: Workers at the mine gained benefits from moving to Jwaneng. This questionnaire, which they used with workers at the mine, is shown in Fig. 7 (Insert). (i) The students decided to plot the answers to Question 1 (In which town did you live before you moved to work at the mine?) on the flow line map, Fig. 8 below. Towns where miners at Jwaneng mine previously lived NAMIBIA ZIMBABWE SOUTH AFRICA 0 100 km N 0 5 1 mm = 1 person Jwaneng mine home town of miners international boundary Key BOTSWANA Orapa Francistown Kanye Tshabong Fig. 8 www.theallpapers.com
Question paper, page 15
15 0460/41/M/J/13 © UCLES 2013 [Turn over For Examiner’s Use Plot the information in Table 7 below onto Fig. 8 (opposite). Table 7 Town Number of workers Orapa 5 Francistown 1 [2] (ii) Describe three features of the distribution of the towns where miners lived before they came to work at Jwaneng. 1 … … 2 … … 3 … …[3] (iii) Why is the flow line map shown in Fig. 8 an appropriate method to show this data? … … … …[2] www.theallpapers.com
Question paper, page 16
16 0460/41/M/J/13 © UCLES 2013 For Examiner’s Use (iv) Some answers to Question 2 (Why did you move to work at the mine?) are shown in Table 8 below. The students reached the conclusion that Hypothesis 2: Workers at the mine gained benefits from moving to Jwaneng was generally correct. Which three answers in Table 8 best support their conclusion? Tick your three choices below. Table 8 Answers to Question 2: Why did you move to work at the mine? Answers Tick ✓ Working in a mine is better paid than jobs in my home town No qualifications to get any other job Not allowed to work in South Africa where wages are higher Relatives already worked at the mine Send money to my family back home There are no jobs in my home town [3] (d) The students could have asked the mine workers about problems of working at the mine. Suggest three possible problems for these workers. 1 … … 2 … … 3 … …[3] [Total: 30 marks] Copyright Acknowledgements: Question 1 Photograph A © Anna Vaughan; www.rgs.org/OurWork/Schools/Fieldwork+and+local+learning/Fieldwork+techniques/Rivers. Question 1 Photograph B © Amy Hatchwell; www.rgs.org/OurWork/Schools/Fieldwork+and+local+learning/Fieldwork+techniques/Rivers. Permission to reproduce items where third-party owned material protected by copyright is included has been sought and cleared where possible. Every reasonable effort has been made by the publisher (UCLES) to trace copyright holders, but if any items requiring clearance have unwittingly been included, the publisher will be pleased to make amends at the earliest possible opportunity. University of Cambridge International Examinations is part of the Cambridge Assessment Group. Cambridge Assessment is the brand name of University of Cambridge Local Examinations Syndicate (UCLES), which is itself a department of the University of Cambridge. www.theallpapers.com
Mark scheme, page 1
CAMBRIDGE INTERNATIONAL EXAMINATIONS International General Certificate of Secondary Education MARK SCHEME for the May/June 2013 series 0460 GEOGRAPHY 0460/41 Paper 4 (Alternative to Coursework), maximum raw mark 60 This mark scheme is published as an aid to teachers and candidates, to indicate the requirements of the examination. It shows the basis on which Examiners were instructed to award marks. It does not indicate the details of the discussions that took place at an Examiners’ meeting before marking began, which would have considered the acceptability of alternative answers. Mark schemes should be read in conjunction with the question paper and the Principal Examiner Report for Teachers. Cambridge will not enter into discussions about these mark schemes. Cambridge is publishing the mark schemes for the May/June 2013 series for most IGCSE, GCE Advanced Level and Advanced Subsidiary Level components and some Ordinary Level components. www.theallpapers.com
Mark scheme, page 2
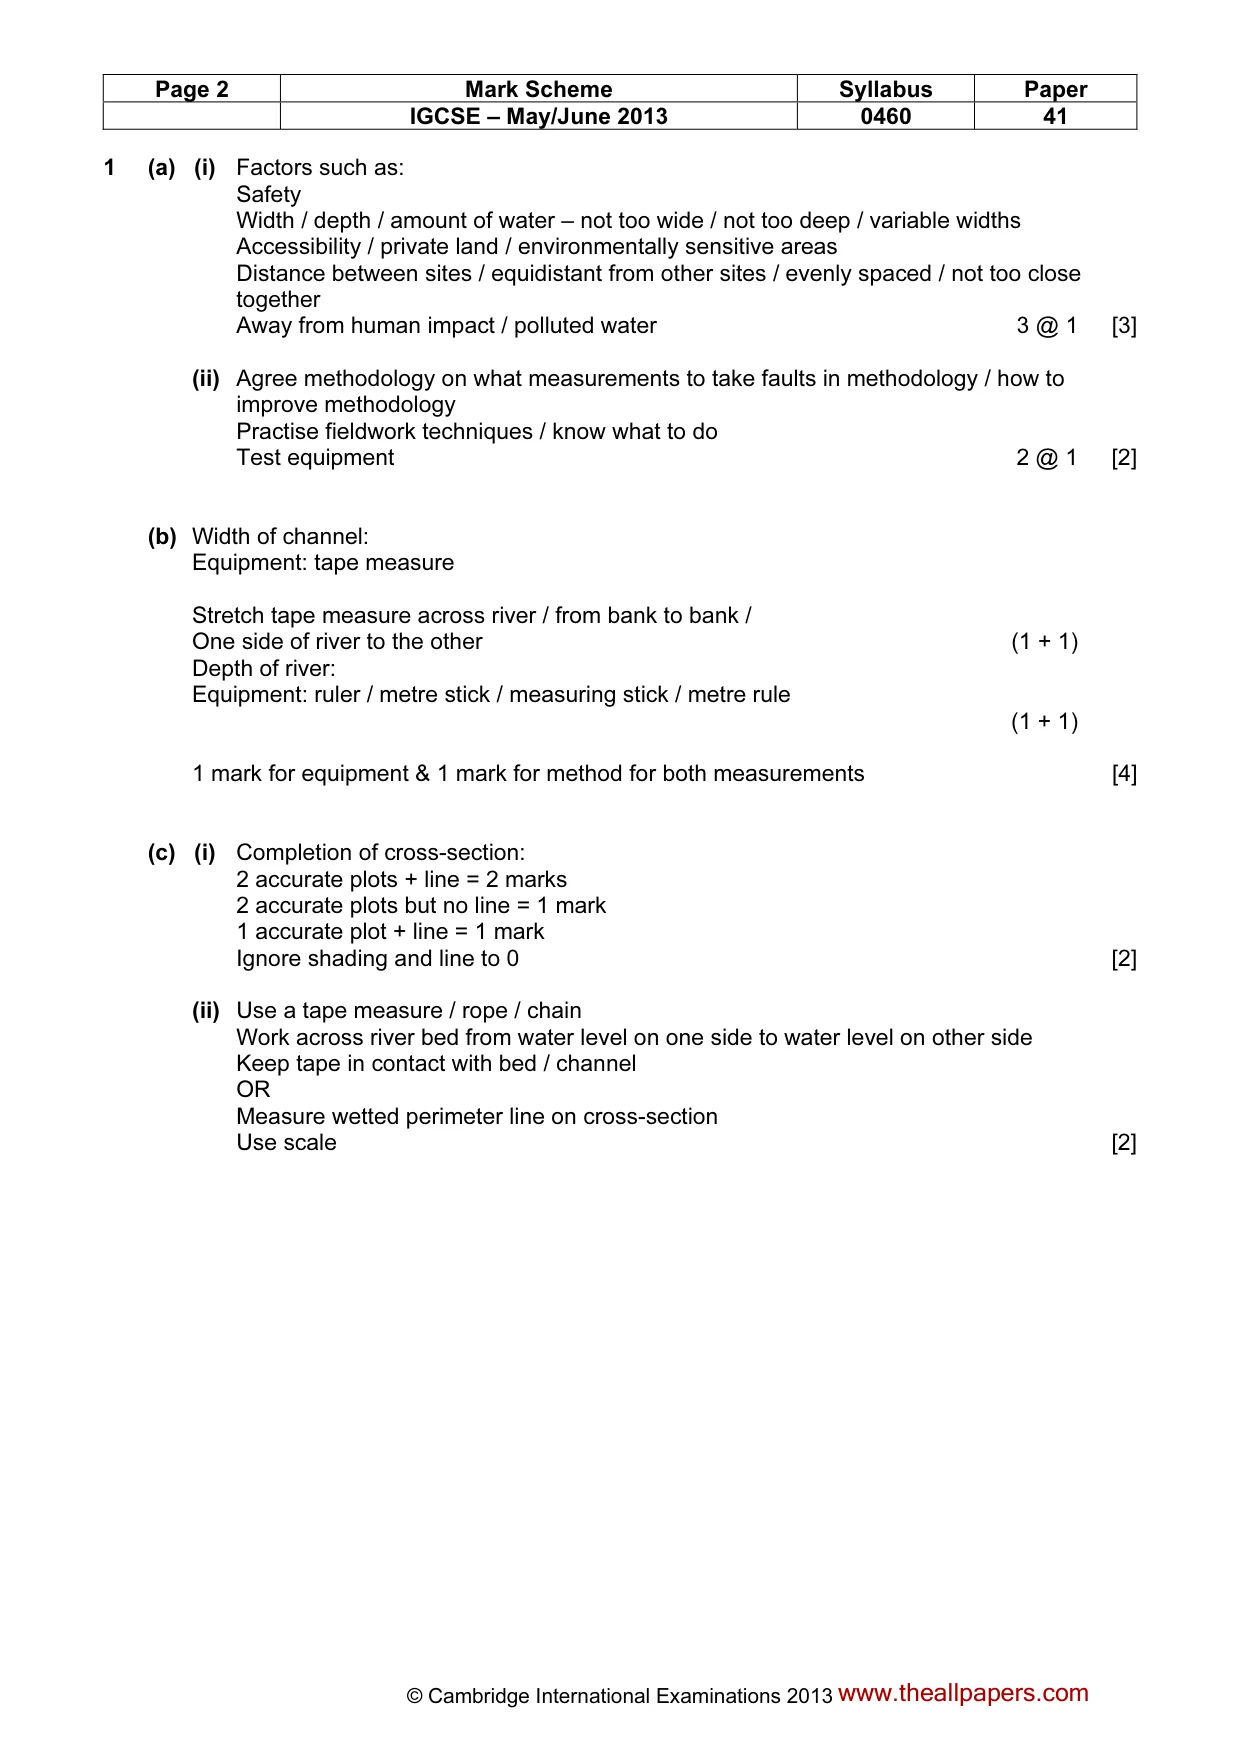
Page 2 Mark Scheme Syllabus Paper IGCSE – May/June 2013 0460 41 © Cambridge International Examinations 2013 1 (a) (i) Factors such as: Safety Width / depth / amount of water – not too wide / not too deep / variable widths Accessibility / private land / environmentally sensitive areas Distance between sites / equidistant from other sites / evenly spaced / not too close together Away from human impact / polluted water 3 @ 1 [3] (ii) Agree methodology on what measurements to take faults in methodology / how to improve methodology Practise fieldwork techniques / know what to do Test equipment 2 @ 1 [2] (b) Width of channel: Equipment: tape measure Stretch tape measure across river / from bank to bank / One side of river to the other (1 + 1) Depth of river: Equipment: ruler / metre stick / measuring stick / metre rule (1 + 1) 1 mark for equipment & 1 mark for method for both measurements [4] (c) (i) Completion of cross-section: 2 accurate plots + line = 2 marks 2 accurate plots but no line = 1 mark 1 accurate plot + line = 1 mark Ignore shading and line to 0 [2] (ii) Use a tape measure / rope / chain Work across river bed from water level on one side to water level on other side Keep tape in contact with bed / channel OR Measure wetted perimeter line on cross-section Use scale [2] www.theallpapers.com
Mark scheme, page 3
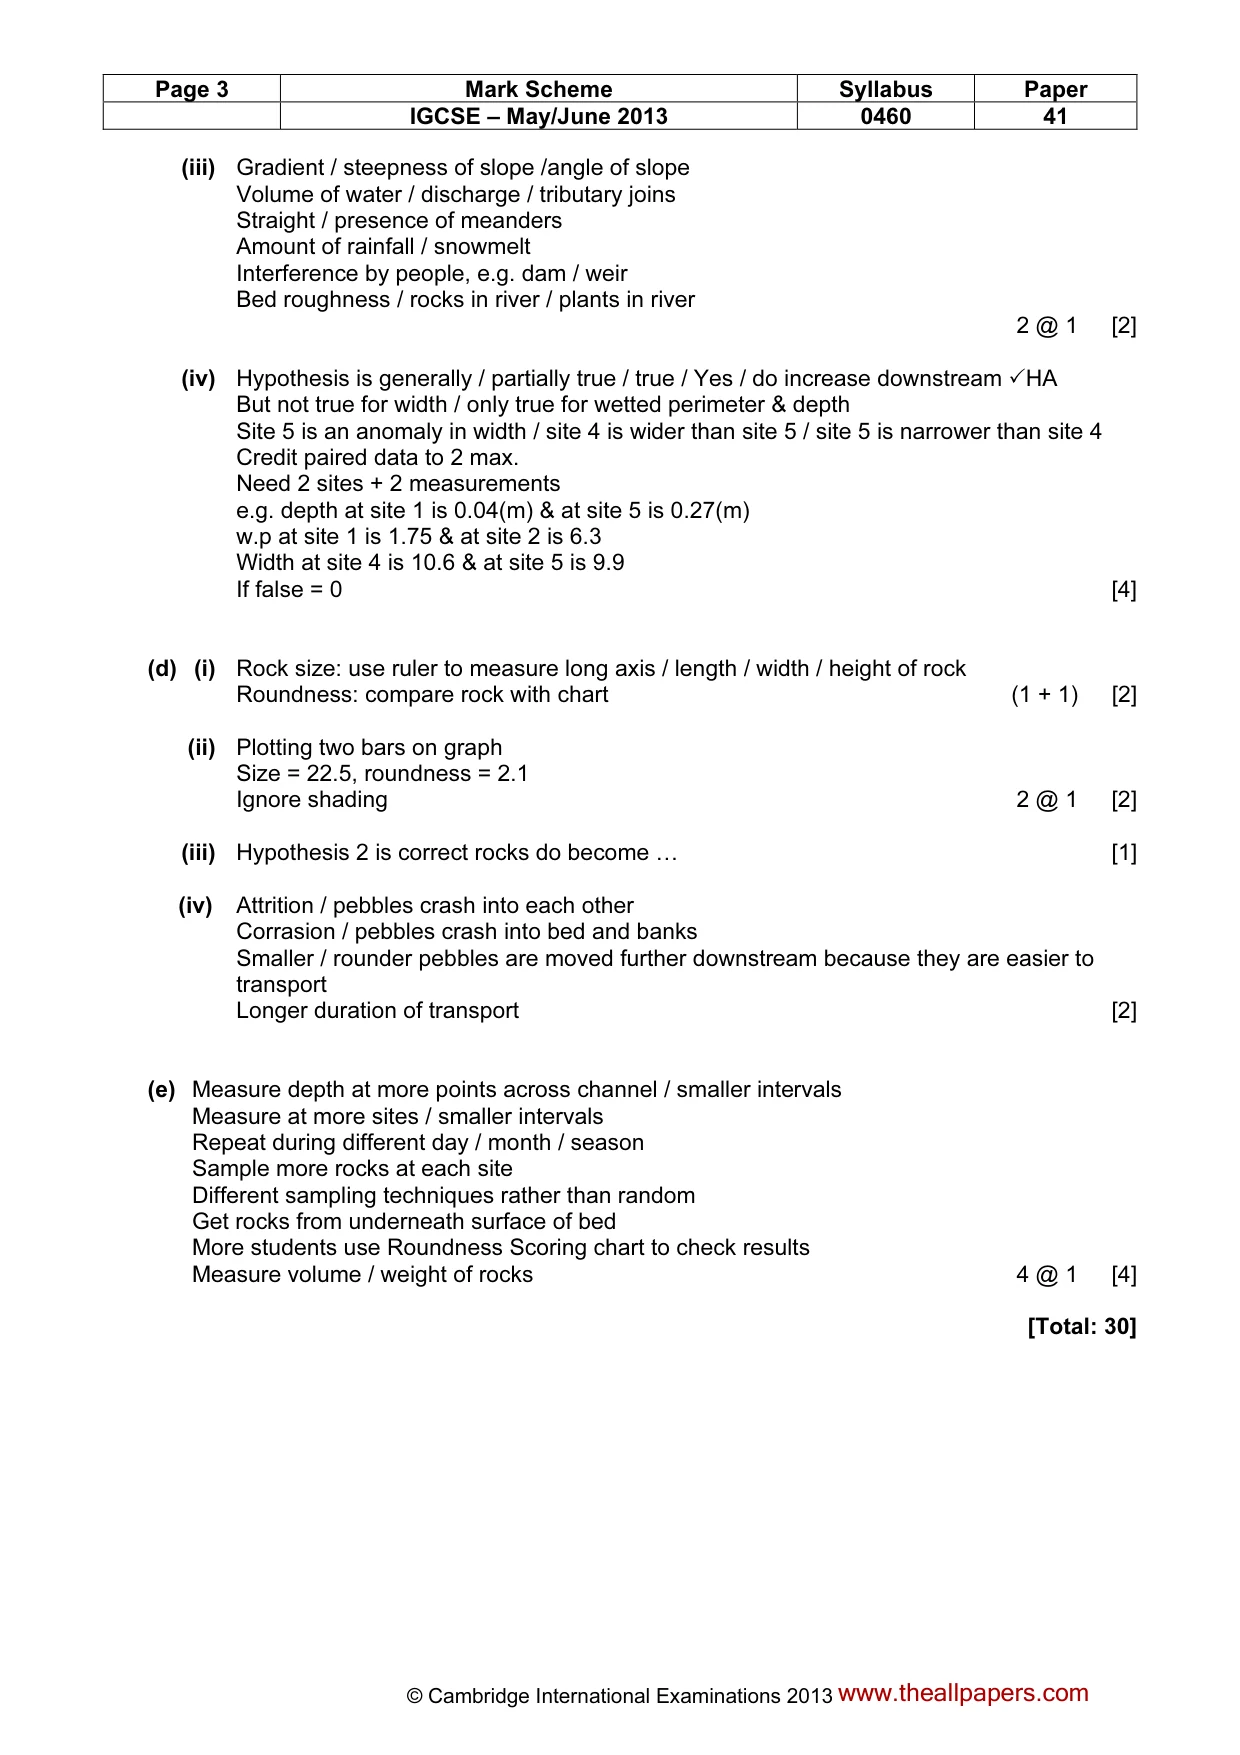
Page 3 Mark Scheme Syllabus Paper IGCSE – May/June 2013 0460 41 © Cambridge International Examinations 2013 (iii) Gradient / steepness of slope /angle of slope Volume of water / discharge / tributary joins Straight / presence of meanders Amount of rainfall / snowmelt Interference by people, e.g. dam / weir Bed roughness / rocks in river / plants in river 2 @ 1 [2] (iv) Hypothesis is generally / partially true / true / Yes / do increase downstream ✓HA But not true for width / only true for wetted perimeter & depth Site 5 is an anomaly in width / site 4 is wider than site 5 / site 5 is narrower than site 4 Credit paired data to 2 max. Need 2 sites + 2 measurements e.g. depth at site 1 is 0.04(m) & at site 5 is 0.27(m) w.p at site 1 is 1.75 & at site 2 is 6.3 Width at site 4 is 10.6 & at site 5 is 9.9 If false = 0 [4] (d) (i) Rock size: use ruler to measure long axis / length / width / height of rock Roundness: compare rock with chart (1 + 1) [2] (ii) Plotting two bars on graph Size = 22.5, roundness = 2.1 Ignore shading 2 @ 1 [2] (iii) Hypothesis 2 is correct rocks do become … [1] (iv) Attrition / pebbles crash into each other Corrasion / pebbles crash into bed and banks Smaller / rounder pebbles are moved further downstream because they are easier to transport Longer duration of transport [2] (e) Measure depth at more points across channel / smaller intervals Measure at more sites / smaller intervals Repeat during different day / month / season Sample more rocks at each site Different sampling techniques rather than random Get rocks from underneath surface of bed More students use Roundness Scoring chart to check results Measure volume / weight of rocks 4 @ 1 [4] [Total: 30] www.theallpapers.com
Mark scheme, page 4
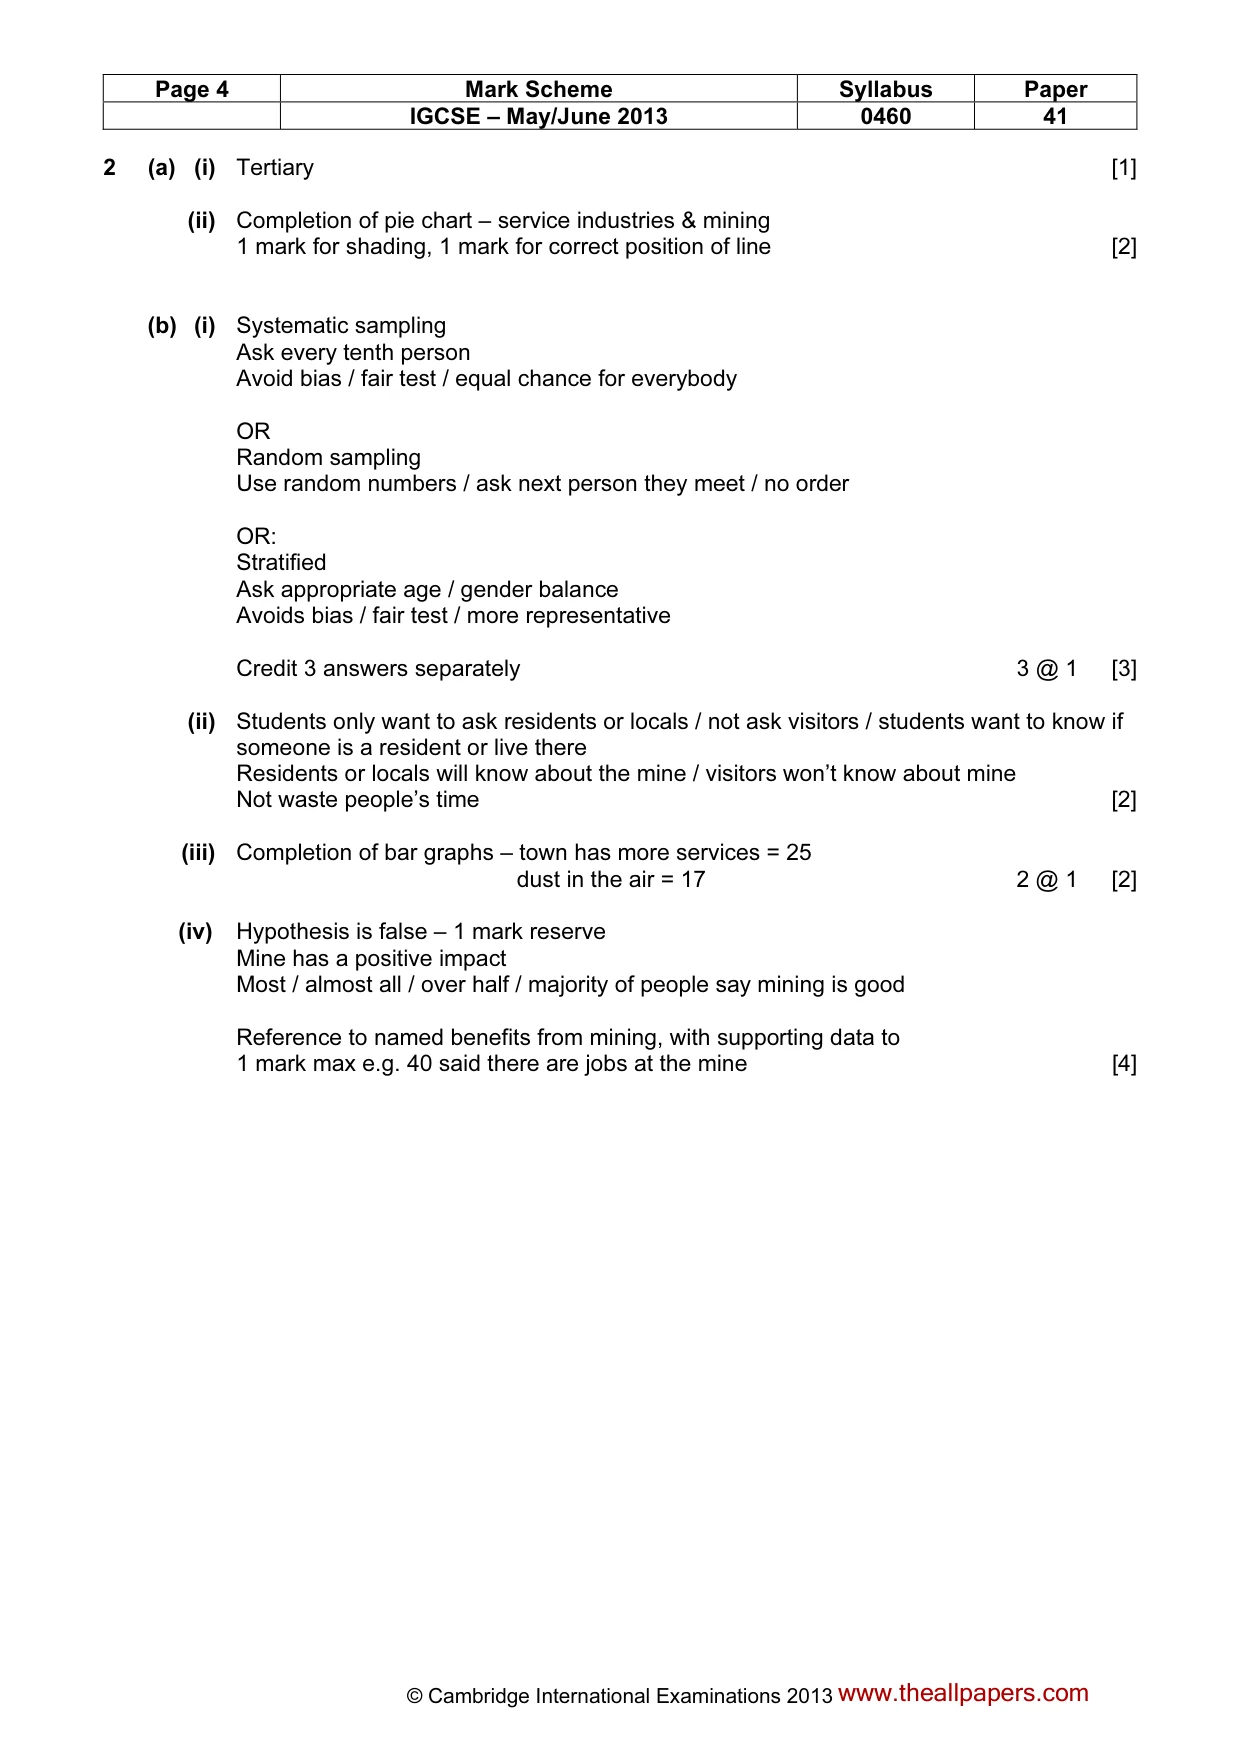
Page 4 Mark Scheme Syllabus Paper IGCSE – May/June 2013 0460 41 © Cambridge International Examinations 2013 2 (a) (i) Tertiary [1] (ii) Completion of pie chart – service industries & mining 1 mark for shading, 1 mark for correct position of line [2] (b) (i) Systematic sampling Ask every tenth person Avoid bias / fair test / equal chance for everybody OR Random sampling Use random numbers / ask next person they meet / no order OR: Stratified Ask appropriate age / gender balance Avoids bias / fair test / more representative Credit 3 answers separately 3 @ 1 [3] (ii) Students only want to ask residents or locals / not ask visitors / students want to know if someone is a resident or live there Residents or locals will know about the mine / visitors won’t know about mine Not waste people’s time [2] (iii) Completion of bar graphs – town has more services = 25 dust in the air = 17 2 @ 1 [2] (iv) Hypothesis is false – 1 mark reserve Mine has a positive impact Most / almost all / over half / majority of people say mining is good Reference to named benefits from mining, with supporting data to 1 mark max e.g. 40 said there are jobs at the mine [4] www.theallpapers.com
Mark scheme, page 5
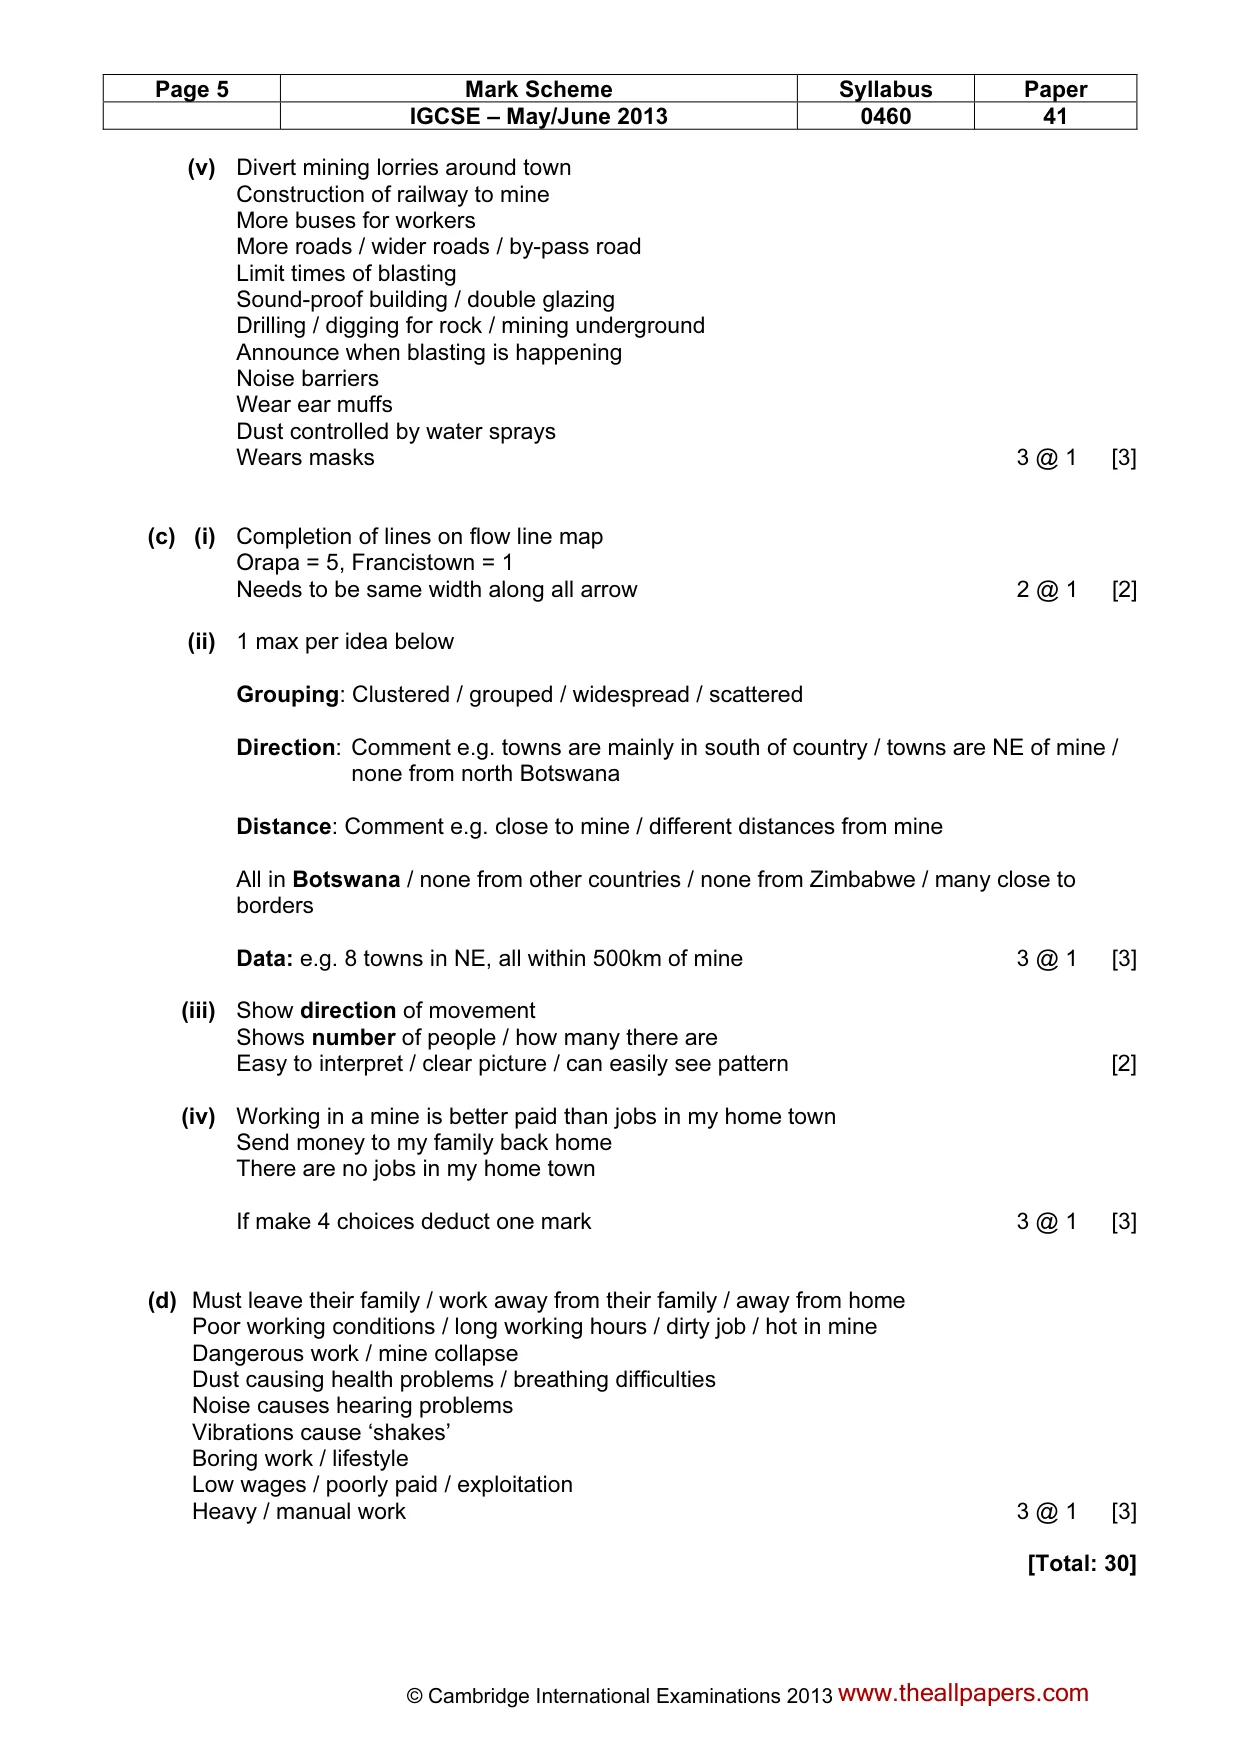
Page 5 Mark Scheme Syllabus Paper IGCSE – May/June 2013 0460 41 © Cambridge International Examinations 2013 (v) Divert mining lorries around town Construction of railway to mine More buses for workers More roads / wider roads / by-pass road Limit times of blasting Sound-proof building / double glazing Drilling / digging for rock / mining underground Announce when blasting is happening Noise barriers Wear ear muffs Dust controlled by water sprays Wears masks 3 @ 1 [3] (c) (i) Completion of lines on flow line map Orapa = 5, Francistown = 1 Needs to be same width along all arrow 2 @ 1 [2] (ii) 1 max per idea below Grouping: Clustered / grouped / widespread / scattered Direction: Comment e.g. towns are mainly in south of country / towns are NE of mine / none from north Botswana Distance: Comment e.g. close to mine / different distances from mine All in Botswana / none from other countries / none from Zimbabwe / many close to borders Data: e.g. 8 towns in NE, all within 500km of mine 3 @ 1 [3] (iii) Show direction of movement Shows number of people / how many there are Easy to interpret / clear picture / can easily see pattern [2] (iv) Working in a mine is better paid than jobs in my home town Send money to my family back home There are no jobs in my home town If make 4 choices deduct one mark 3 @ 1 [3] (d) Must leave their family / work away from their family / away from home Poor working conditions / long working hours / dirty job / hot in mine Dangerous work / mine collapse Dust causing health problems / breathing difficulties Noise causes hearing problems Vibrations cause ‘shakes’ Boring work / lifestyle Low wages / poorly paid / exploitation Heavy / manual work 3 @ 1 [3] [Total: 30] www.theallpapers.com
What you needed in this session
Cambridge’s own grade thresholds for 2013 May/June, Paper 4 · Variant 1. A higher threshold means an easier paper — the bar moves with how the cohort did.