Cambridge IGCSE Geography 0460 — 2013 May/June Paper 2 · Variant 3
0460/23/M/J/13 · 60 marks · ≈68 min
The question paper and its mark scheme, free to read here and free to download. This is Cambridge’s own paper, exactly as it was sat.
Question paper16 pages

Mark scheme5 pages
Answers below. Sit the paper first if you are practising.
Paper as text
Question paper, page 1
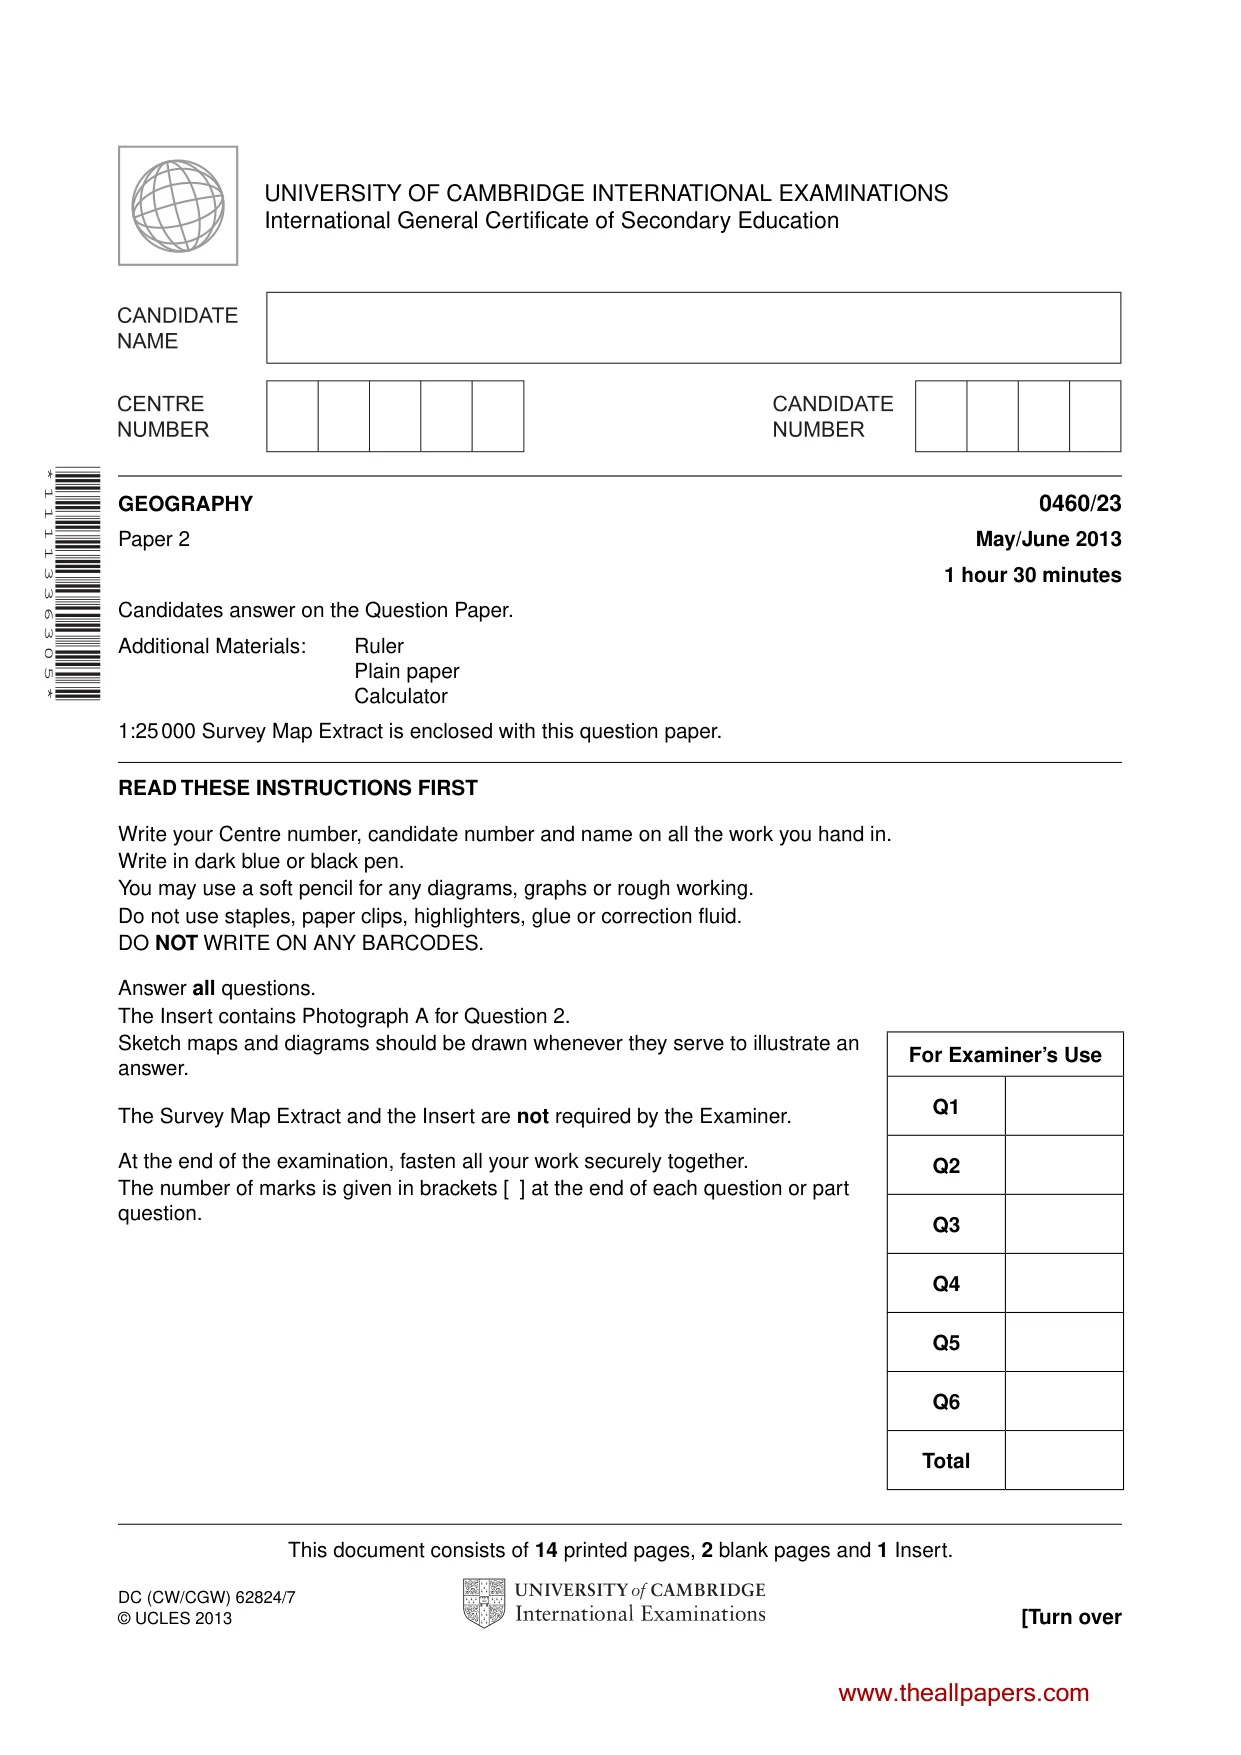
This document consists of 14 printed pages, 2 blank pages and 1 Insert. DC (CW/CGW) 62824/7 © UCLES 2013 [Turn over UNIVERSITY OF CAMBRIDGE INTERNATIONAL EXAMINATIONS International General Certificate of Secondary Education * 1 1 1 1 3 3 6 3 0 5 * GEOGRAPHY 0460/23 Paper 2 May/June 2013 1 hour 30 minutes Candidates answer on the Question Paper. Additional Materials: Ruler Plain paper Calculator 1:25 000 Survey Map Extract is enclosed with this question paper. READ THESE INSTRUCTIONS FIRST Write your Centre number, candidate number and name on all the work you hand in. Write in dark blue or black pen. You may use a soft pencil for any diagrams, graphs or rough working. Do not use staples, paper clips, highlighters, glue or correction fluid. DO NOT WRITE ON ANY BARCODES. Answer all questions. The Insert contains Photograph A for Question 2. Sketch maps and diagrams should be drawn whenever they serve to illustrate an answer. The Survey Map Extract and the Insert are not required by the Examiner. At the end of the examination, fasten all your work securely together. The number of marks is given in brackets [ ] at the end of each question or part question. For Examiner’s Use Q1 Q2 Q3 Q4 Q5 Q6 Total www.theallpapers.com
Question paper, page 2
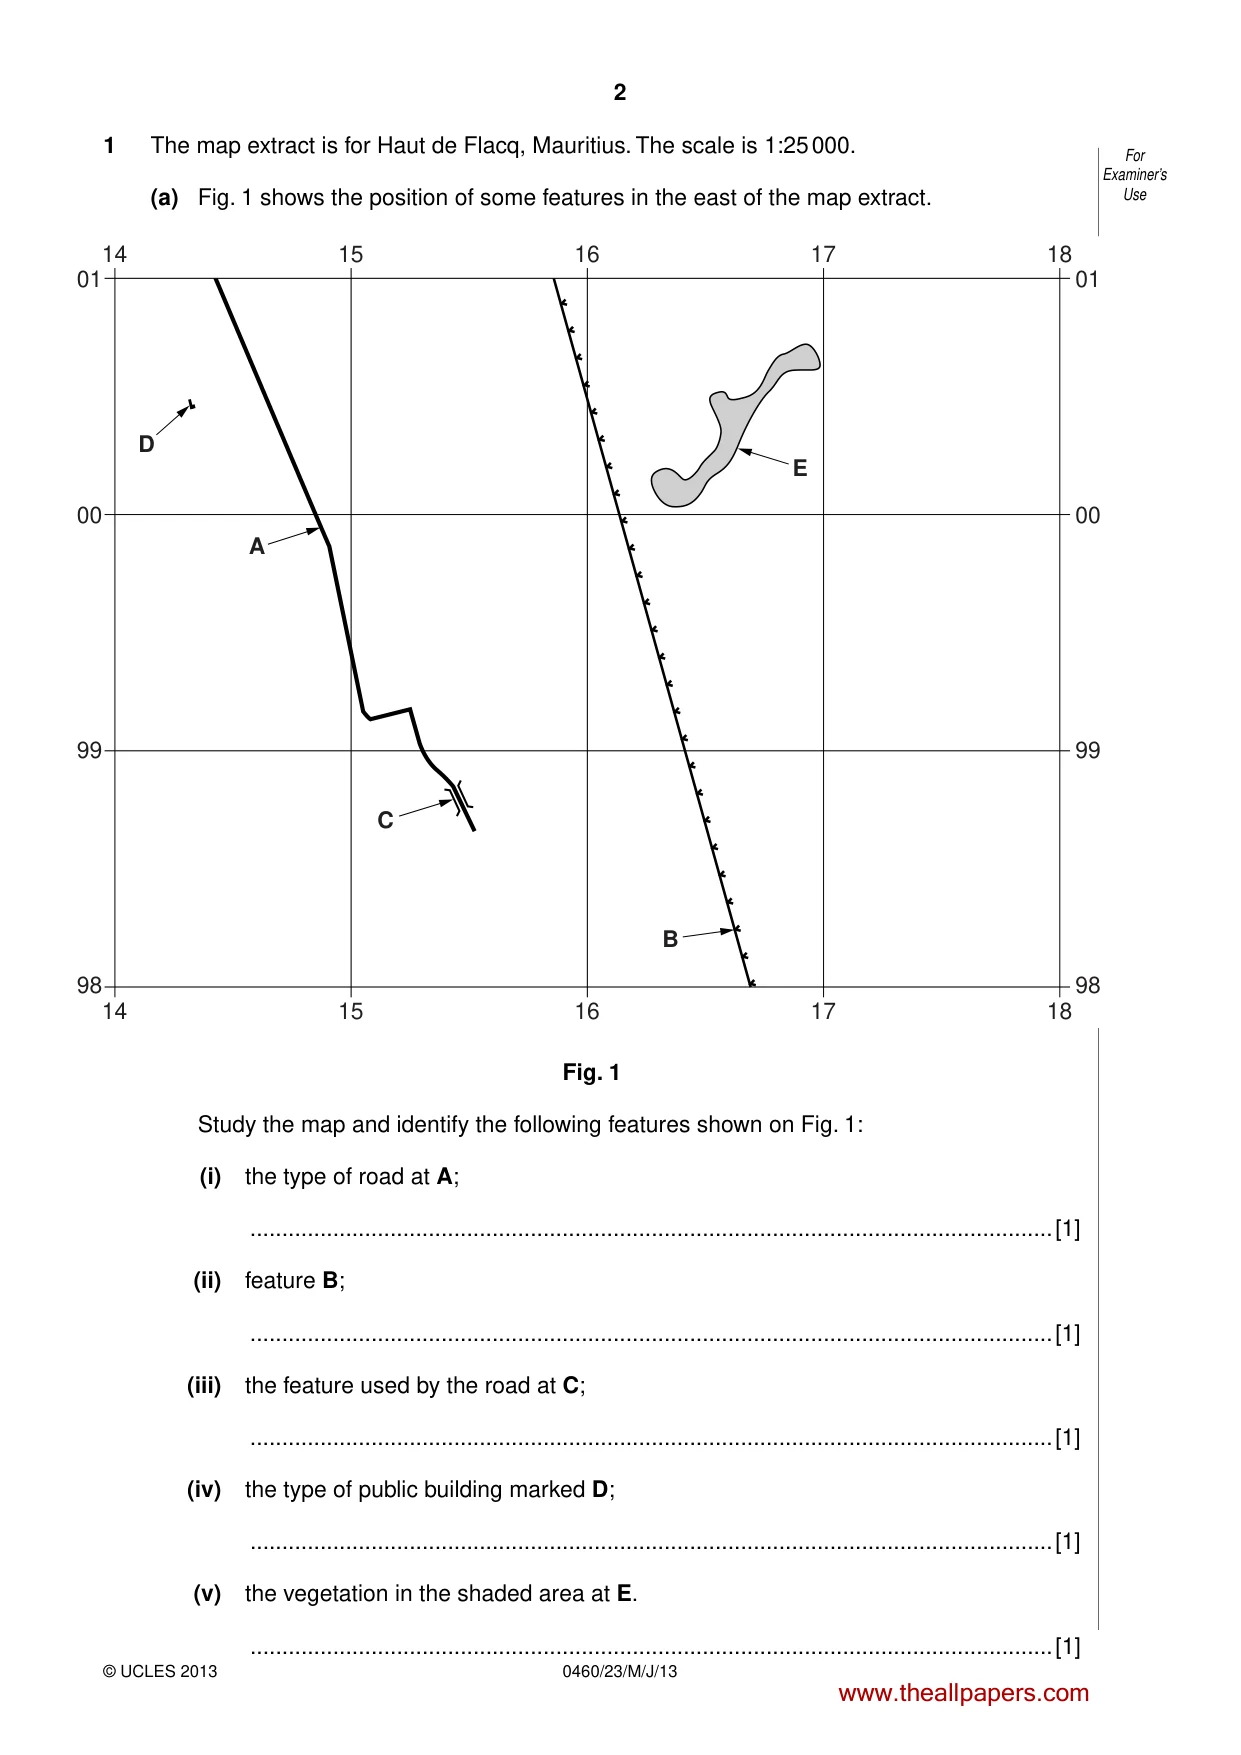
2 0460/23/M/J/13 © UCLES 2013 For Examiner’s Use 1 The map extract is for Haut de Flacq, Mauritius. The scale is 1:25 000. (a) Fig. 1 shows the position of some features in the east of the map extract. A D C B 16 15 14 18 17 16 15 14 01 00 99 98 01 00 99 98 18 17 E Fig. 1 Study the map and identify the following features shown on Fig. 1: (i) the type of road at A; …[1] (ii) feature B; …[1] (iii) the feature used by the road at C; …[1] (iv) the type of public building marked D; …[1] (v) the vegetation in the shaded area at E. …[1] www.theallpapers.com
Question paper, page 3
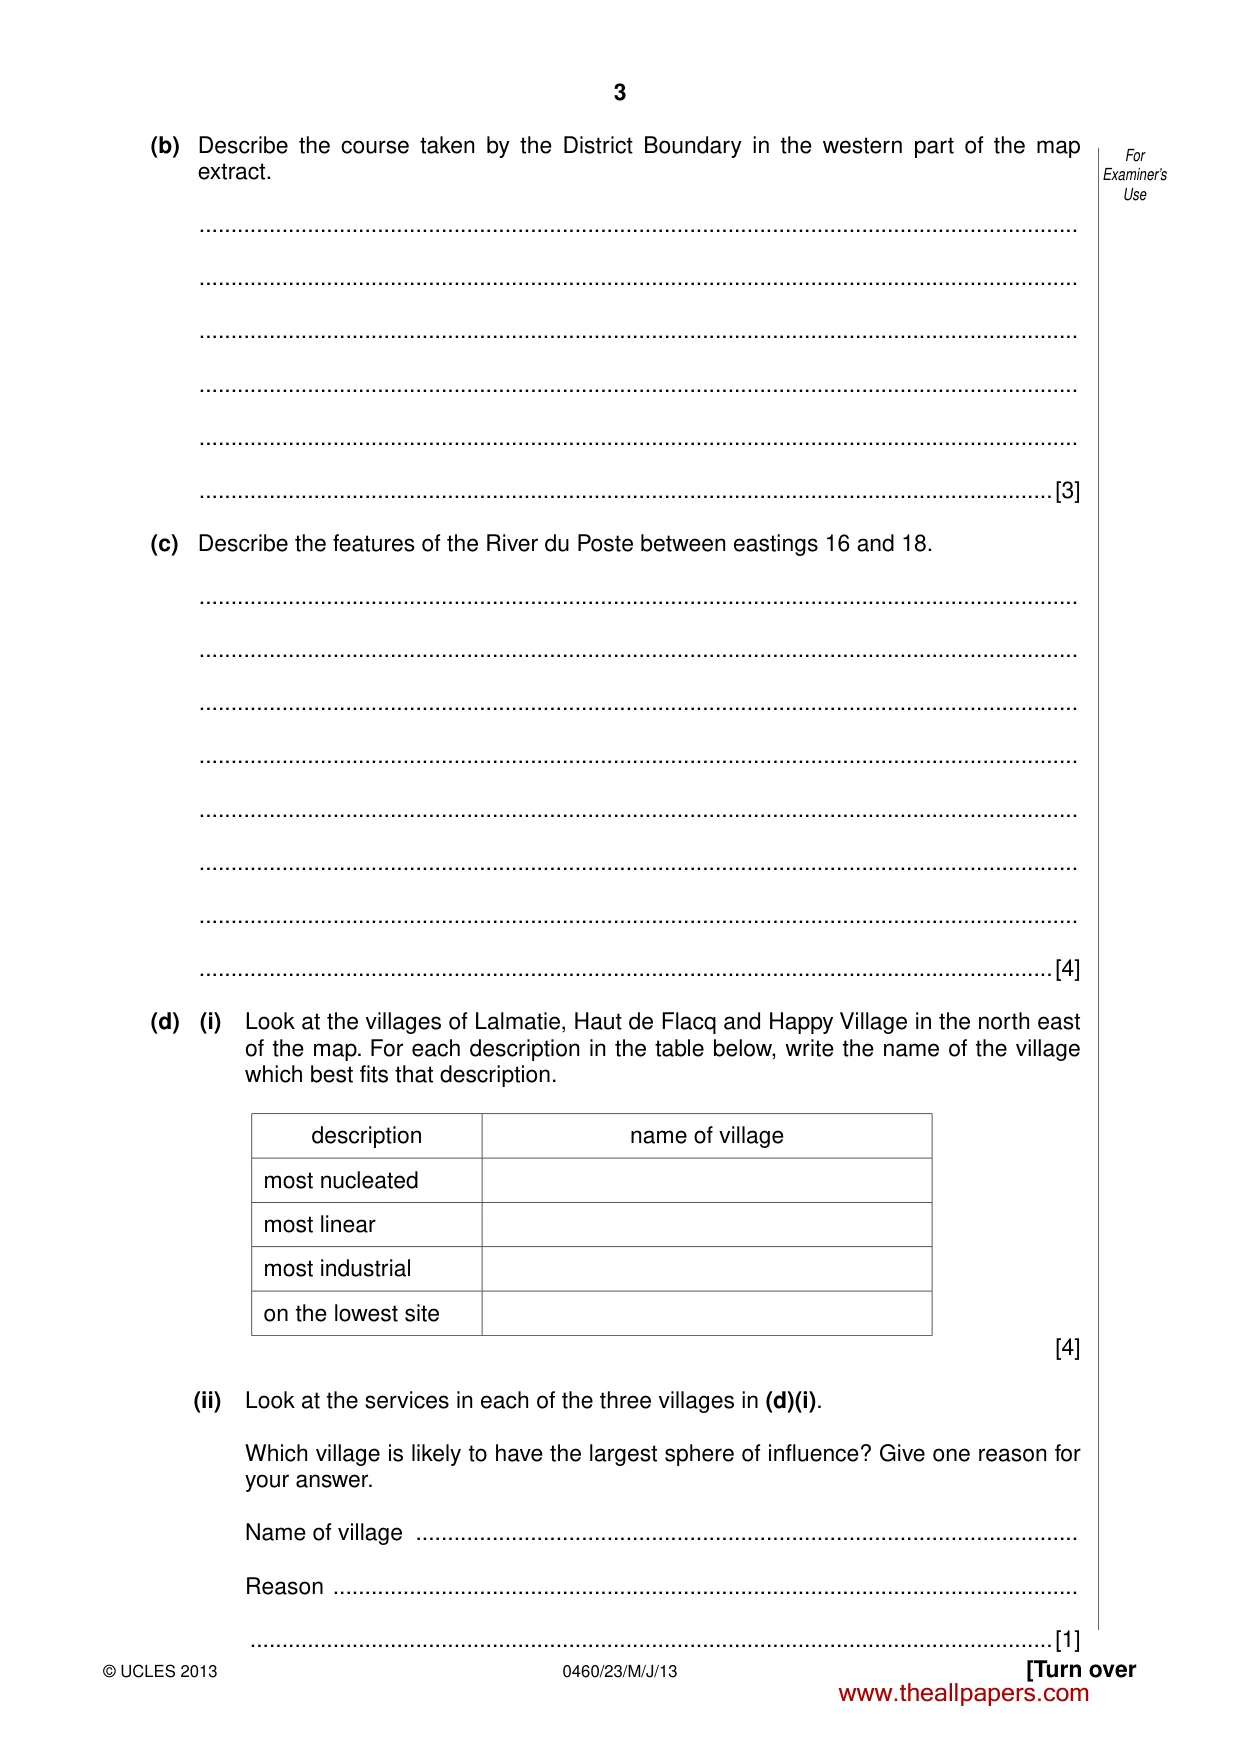
3 0460/23/M/J/13 © UCLES 2013 [Turn over For Examiner’s Use (b) Describe the course taken by the District Boundary in the western part of the map extract. … … … … … …[3] (c) Describe the features of the River du Poste between eastings 16 and 18. … … … … … … … …[4] (d) (i) Look at the villages of Lalmatie, Haut de Flacq and Happy Village in the north east of the map. For each description in the table below, write the name of the village which best fits that description. description name of village most nucleated most linear most industrial on the lowest site [4] (ii) Look at the services in each of the three villages in (d)(i). Which village is likely to have the largest sphere of influence? Give one reason for your answer. Name of village … Reason … …[1] www.theallpapers.com
Question paper, page 4
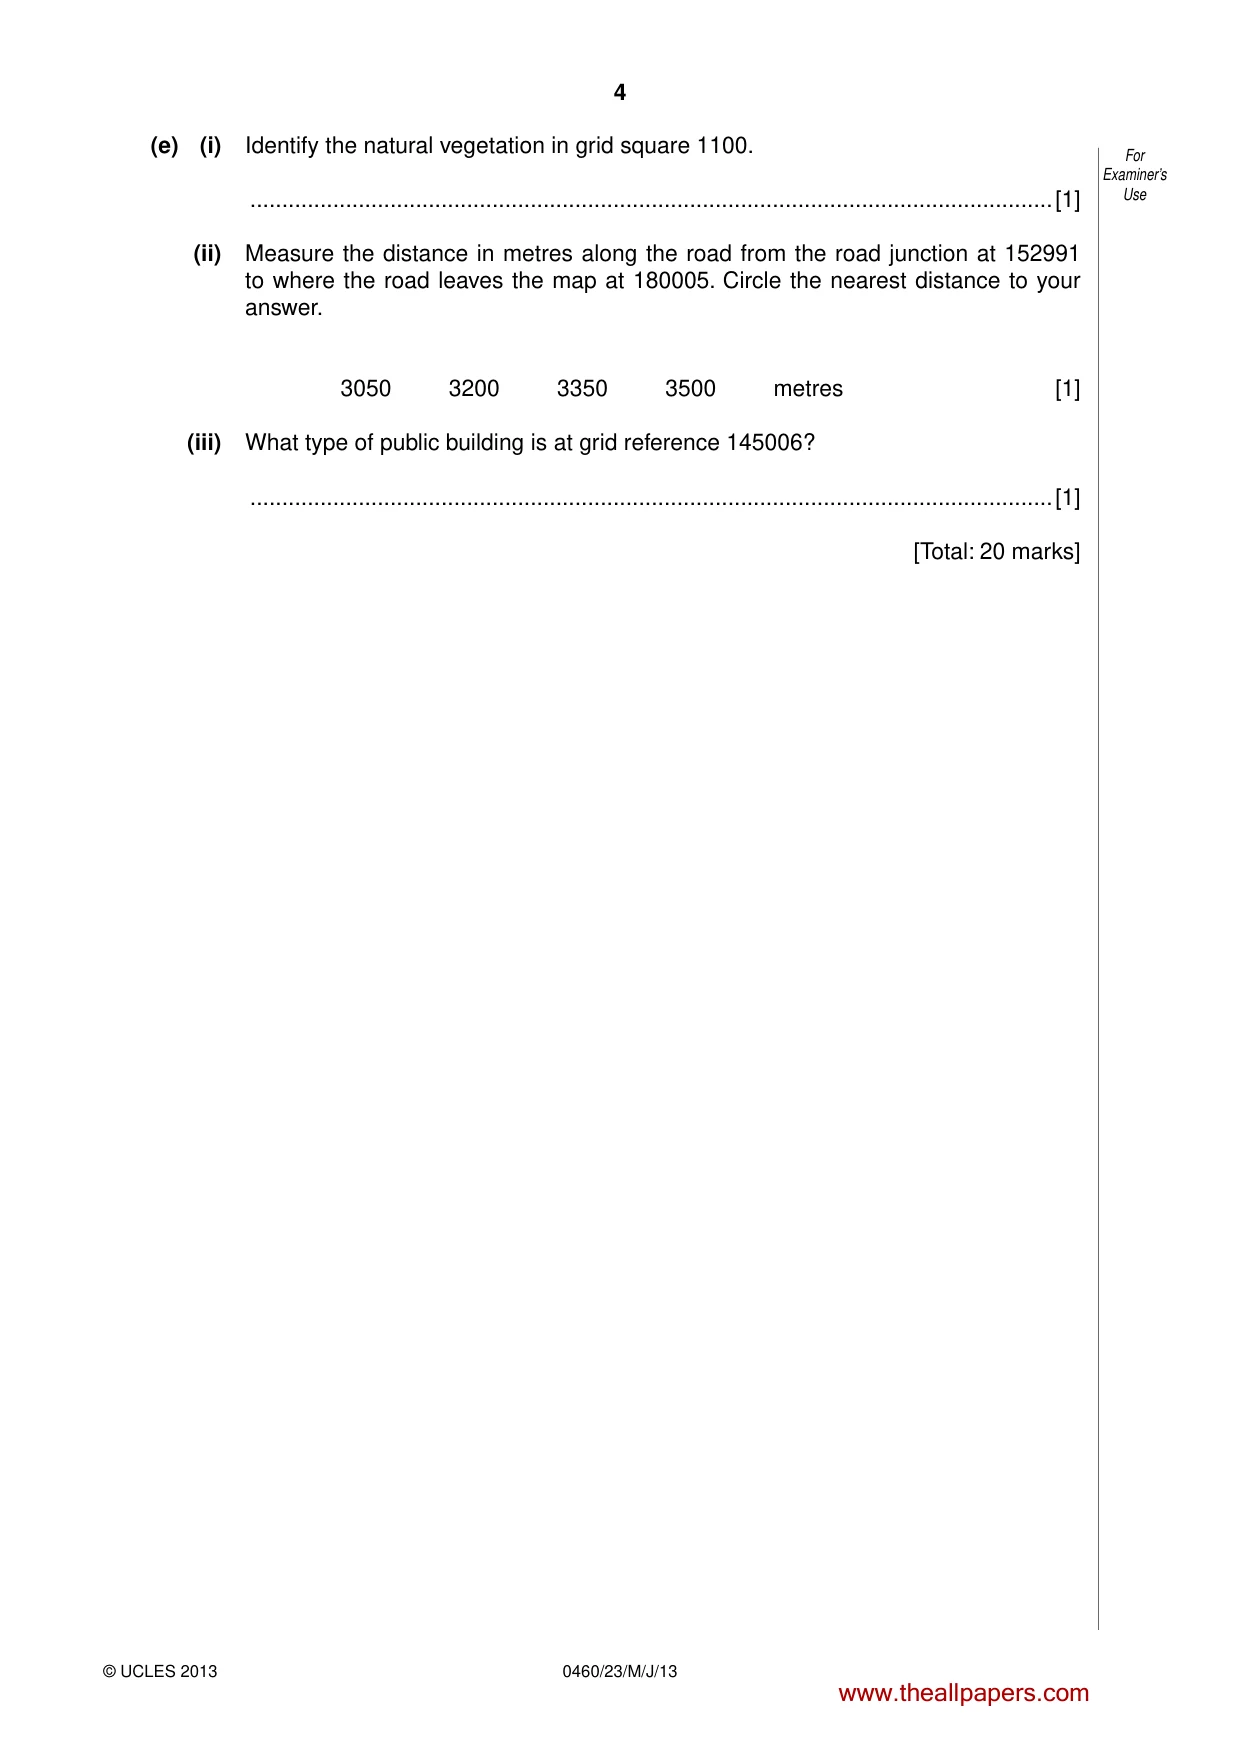
4 0460/23/M/J/13 © UCLES 2013 For Examiner’s Use (e) (i) Identify the natural vegetation in grid square 1100. …[1] (ii) Measure the distance in metres along the road from the road junction at 152991 to where the road leaves the map at 180005. Circle the nearest distance to your answer. 3050 3200 3350 3500 metres [1] (iii) What type of public building is at grid reference 145006? …[1] [Total: 20 marks] www.theallpapers.com
Question paper, page 5
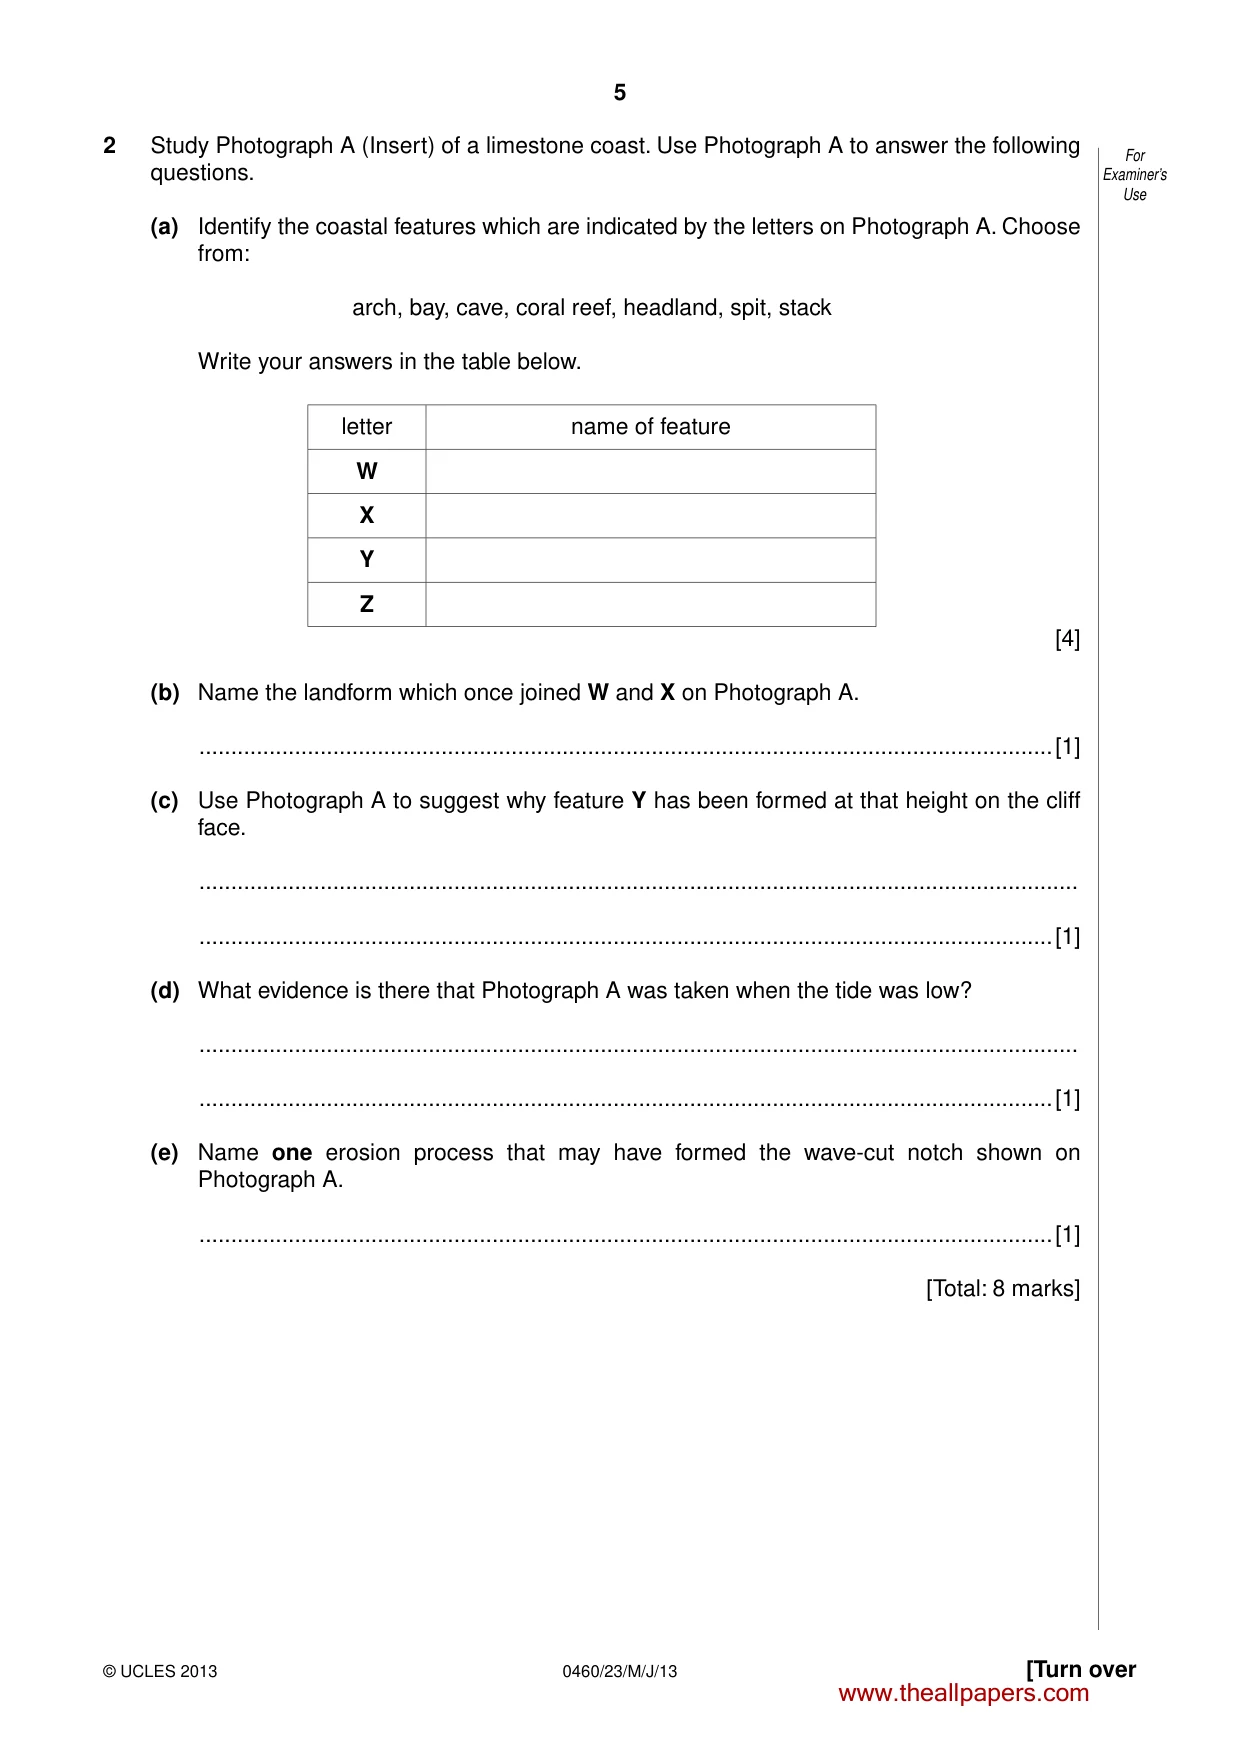
5 0460/23/M/J/13 © UCLES 2013 [Turn over For Examiner’s Use 2 Study Photograph A (Insert) of a limestone coast. Use Photograph A to answer the following questions. (a) Identify the coastal features which are indicated by the letters on Photograph A. Choose from: arch, bay, cave, coral reef, headland, spit, stack Write your answers in the table below. letter name of feature W X Y Z [4] (b) Name the landform which once joined W and X on Photograph A. …[1] (c) Use Photograph A to suggest why feature Y has been formed at that height on the cliff face. … …[1] (d) What evidence is there that Photograph A was taken when the tide was low? … …[1] (e) Name one erosion process that may have formed the wave-cut notch shown on Photograph A. …[1] [Total: 8 marks] www.theallpapers.com
Question paper, page 6
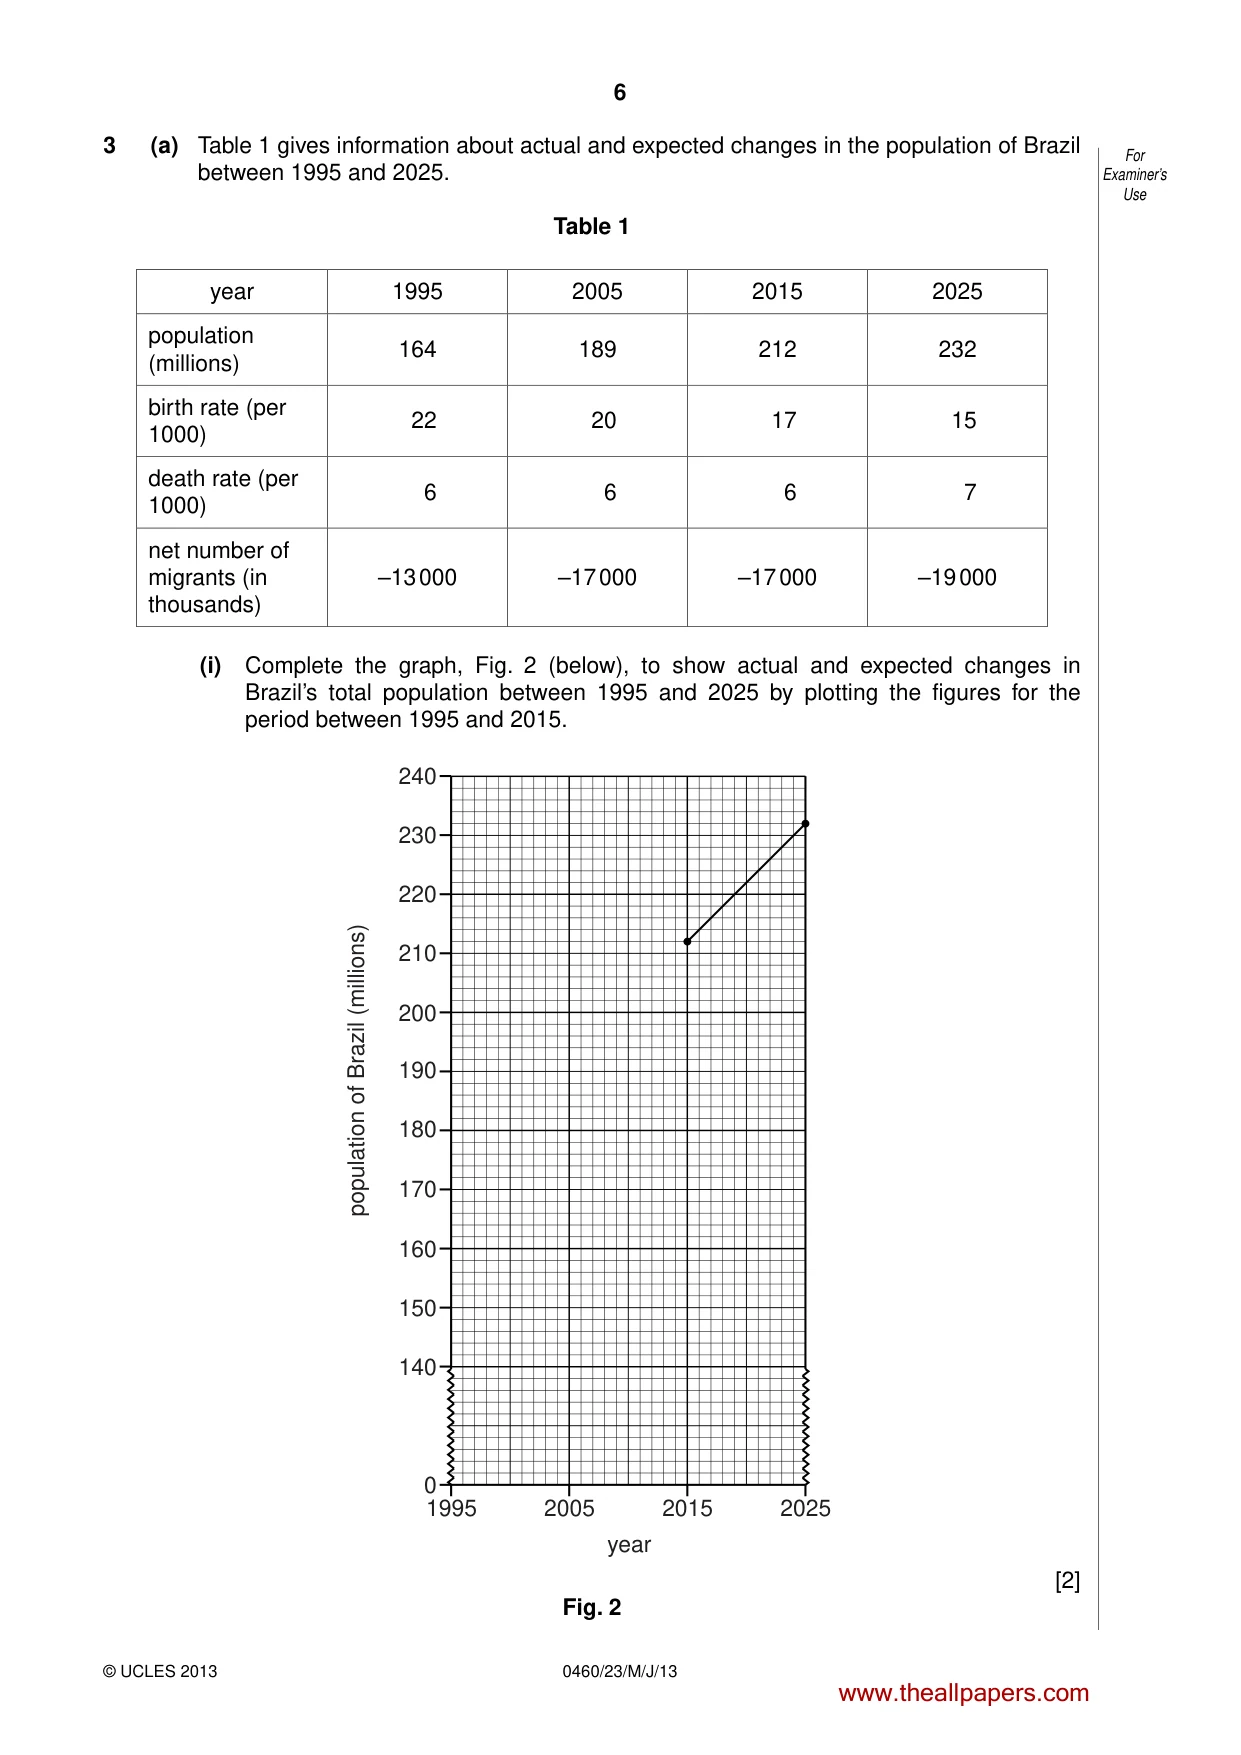
6 0460/23/M/J/13 © UCLES 2013 For Examiner’s Use 3 (a) Table 1 gives information about actual and expected changes in the population of Brazil between 1995 and 2025. Table 1 year 1995 2005 2015 2025 population (millions) 164 189 212 232 birth rate (per 1000) 22 20 17 15 death rate (per 1000) 6 6 6 7 net number of migrants (in thousands) –13 000 –17 000 –17 000 –19 000 (i) Complete the graph, Fig. 2 (below), to show actual and expected changes in Brazil’s total population between 1995 and 2025 by plotting the figures for the period between 1995 and 2015. 240 230 220 210 200 190 180 population of Brazil (millions) 170 160 150 1995 2005 year 2015 2025 140 0 [2] Fig. 2 www.theallpapers.com
Question paper, page 7
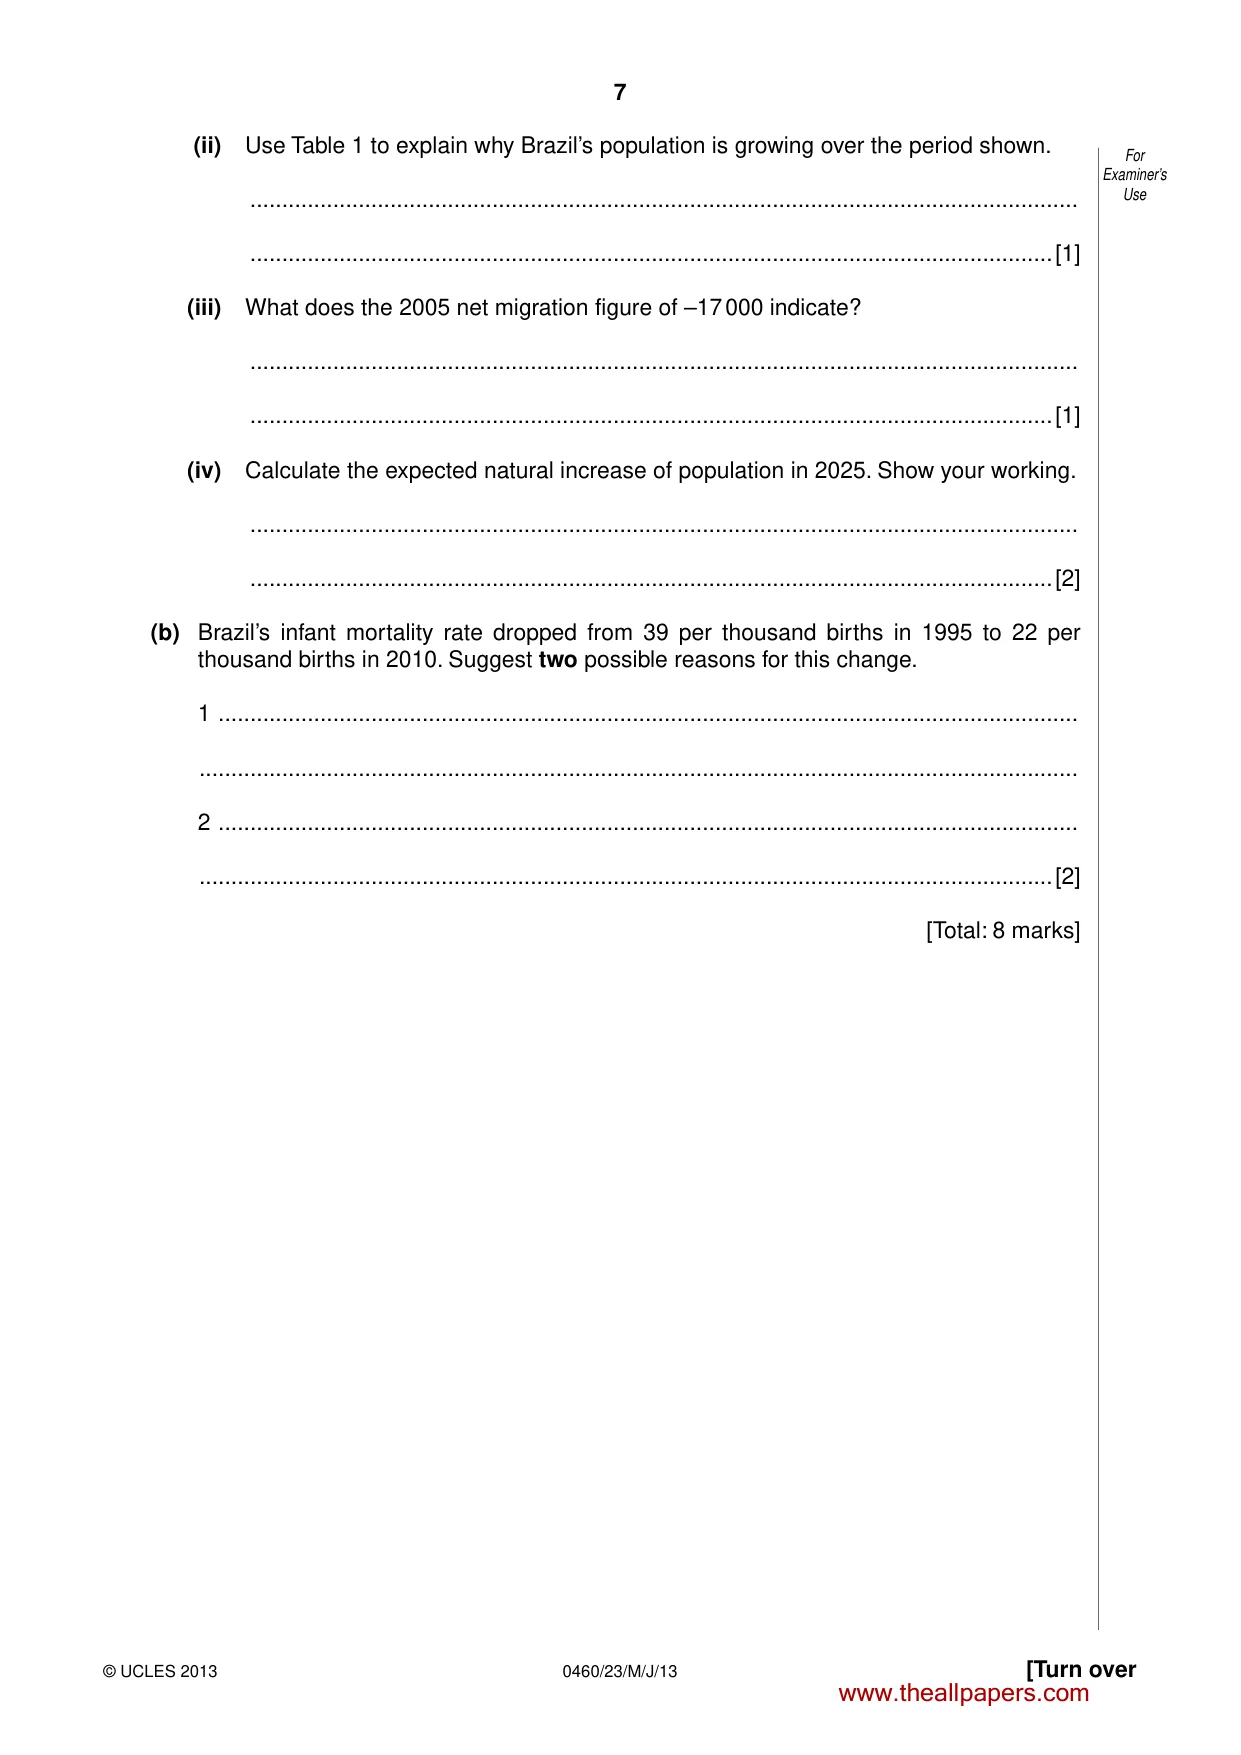
7 0460/23/M/J/13 © UCLES 2013 [Turn over For Examiner’s Use (ii) Use Table 1 to explain why Brazil’s population is growing over the period shown. … …[1] (iii) What does the 2005 net migration figure of –17 000 indicate? … …[1] (iv) Calculate the expected natural increase of population in 2025. Show your working. … …[2] (b) Brazil’s infant mortality rate dropped from 39 per thousand births in 1995 to 22 per thousand births in 2010. Suggest two possible reasons for this change. 1 … … 2 … …[2] [Total: 8 marks] www.theallpapers.com
Question paper, page 8
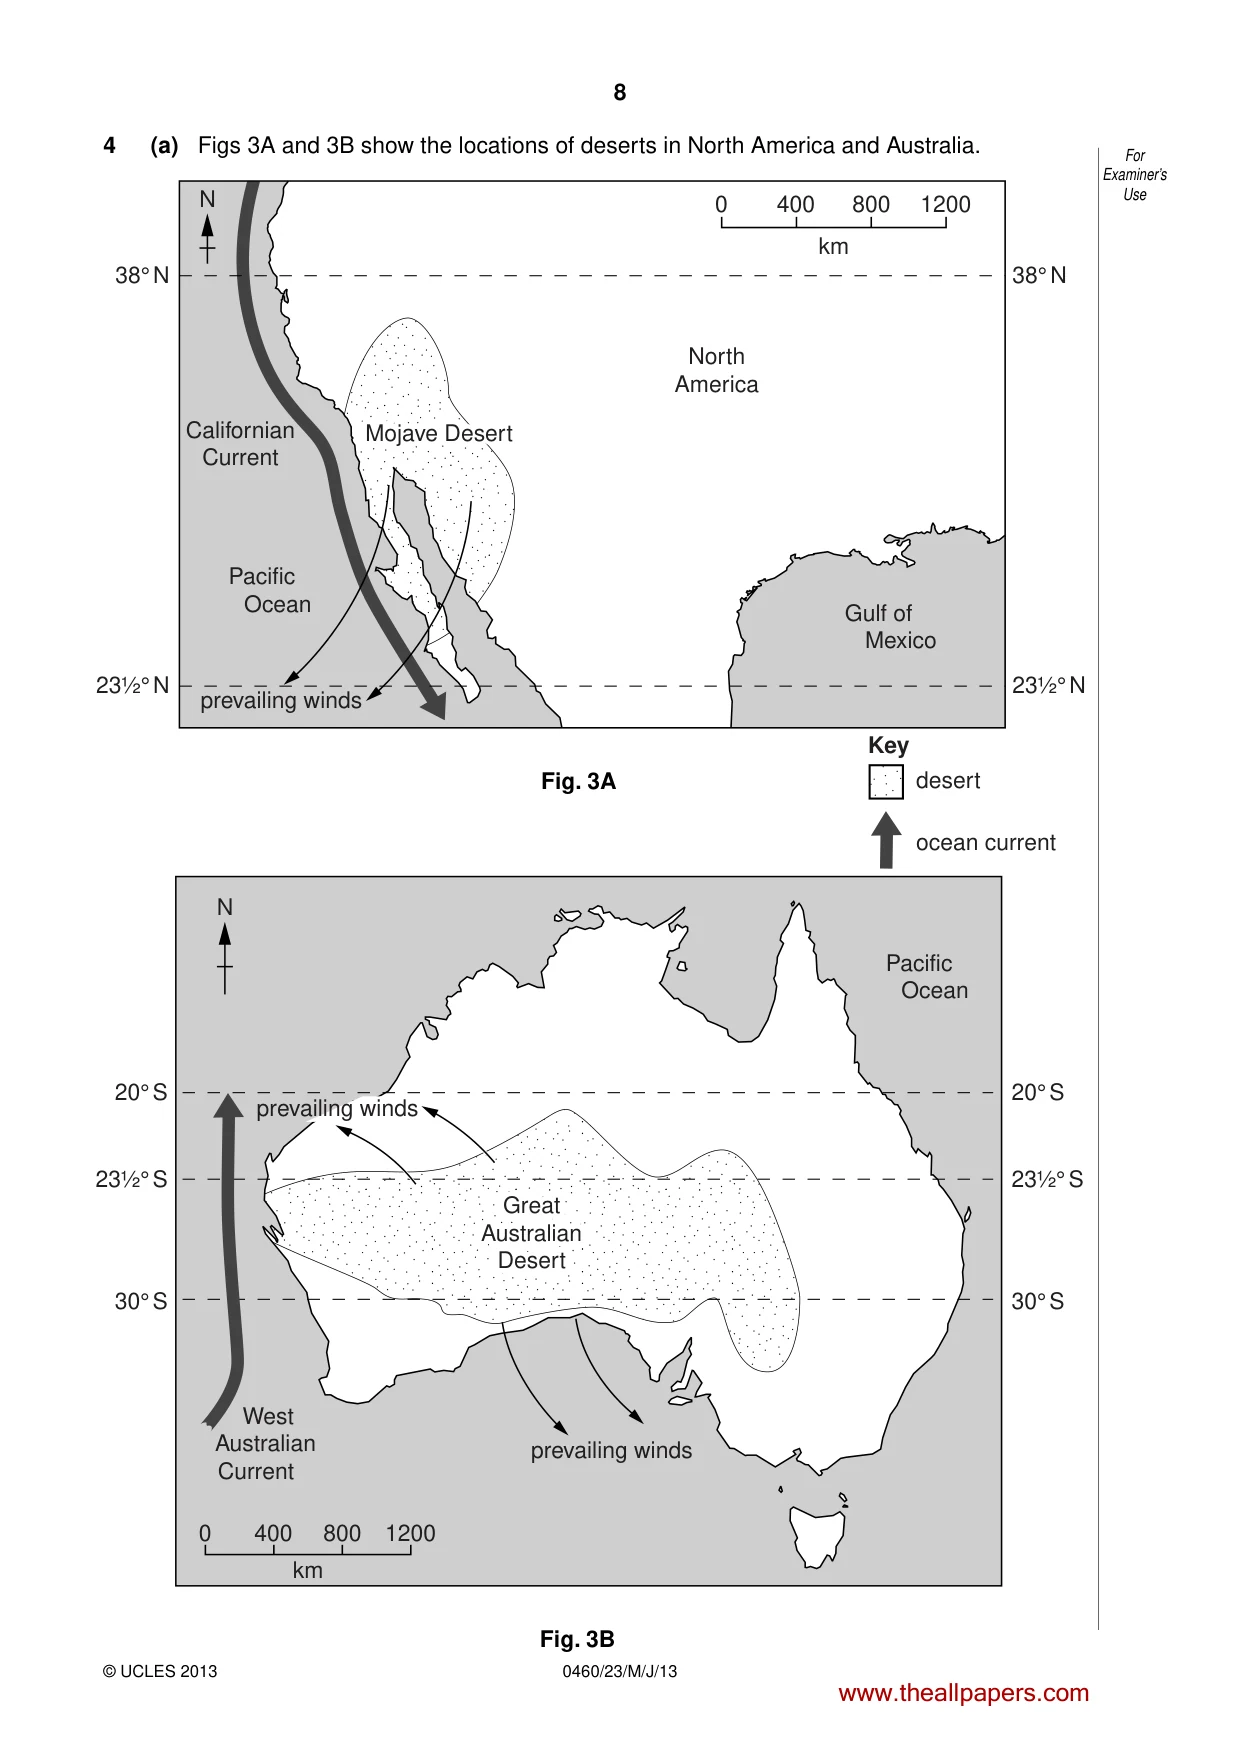
8 0460/23/M/J/13 © UCLES 2013 For Examiner’s Use 4 (a) Figs 3A and 3B show the locations of deserts in North America and Australia. 20° S N 23½° S 30° S 20° S Pacific Ocean desert ocean current Key West Australian Current 23½° S 30° S prevailing winds Great Australian Desert Great Australian Desert prevailing winds 0 400 800 km 1200 N 23½° N 38° N 23½° N 38° N Pacific Ocean Californian Current Gulf of Mexico North America prevailing winds 0 400 800 km 1200 Mojave Desert Mojave Desert Fig. 3A Fig. 3B www.theallpapers.com
Question paper, page 9
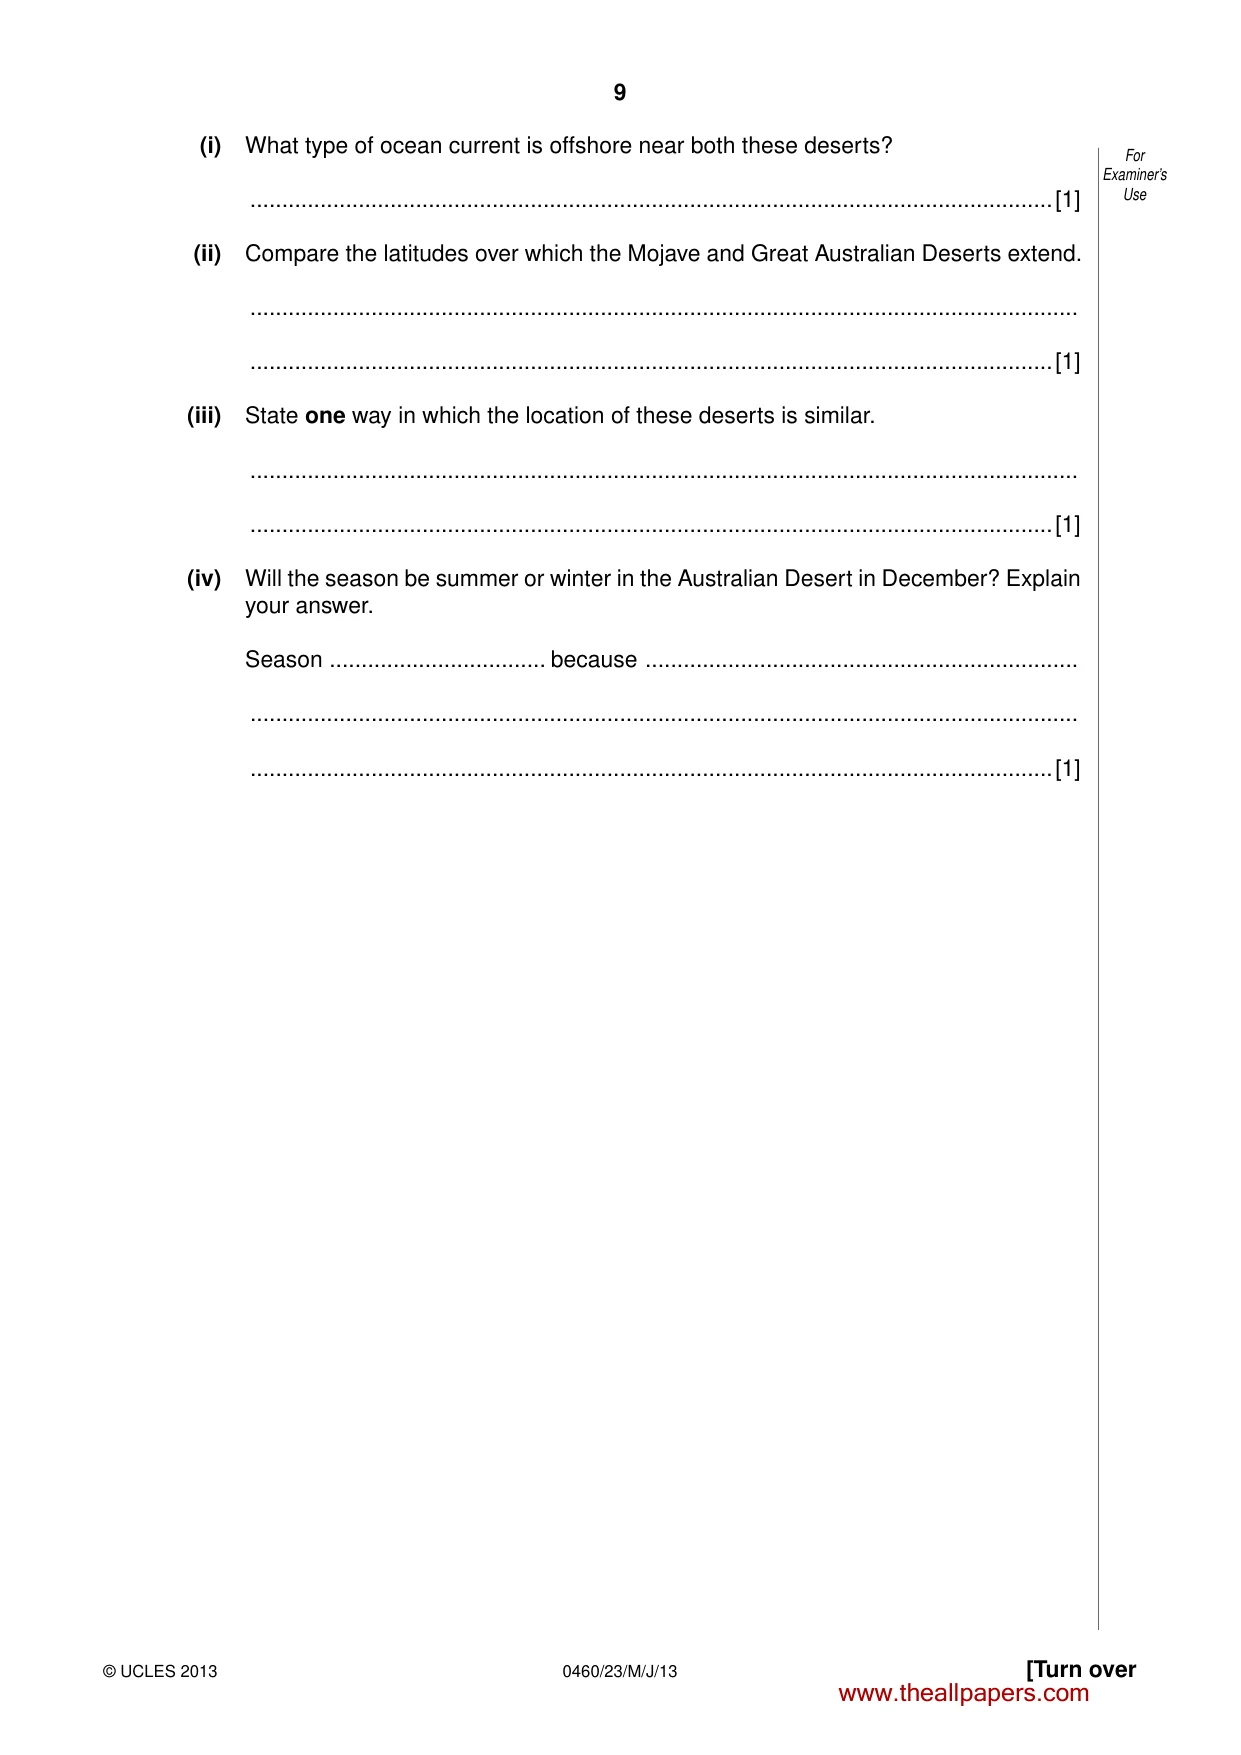
9 0460/23/M/J/13 © UCLES 2013 [Turn over For Examiner’s Use (i) What type of ocean current is offshore near both these deserts? …[1] (ii) Compare the latitudes over which the Mojave and Great Australian Deserts extend. … …[1] (iii) State one way in which the location of these deserts is similar. … …[1] (iv) Will the season be summer or winter in the Australian Desert in December? Explain your answer. Season … because … … …[1] www.theallpapers.com
Question paper, page 10
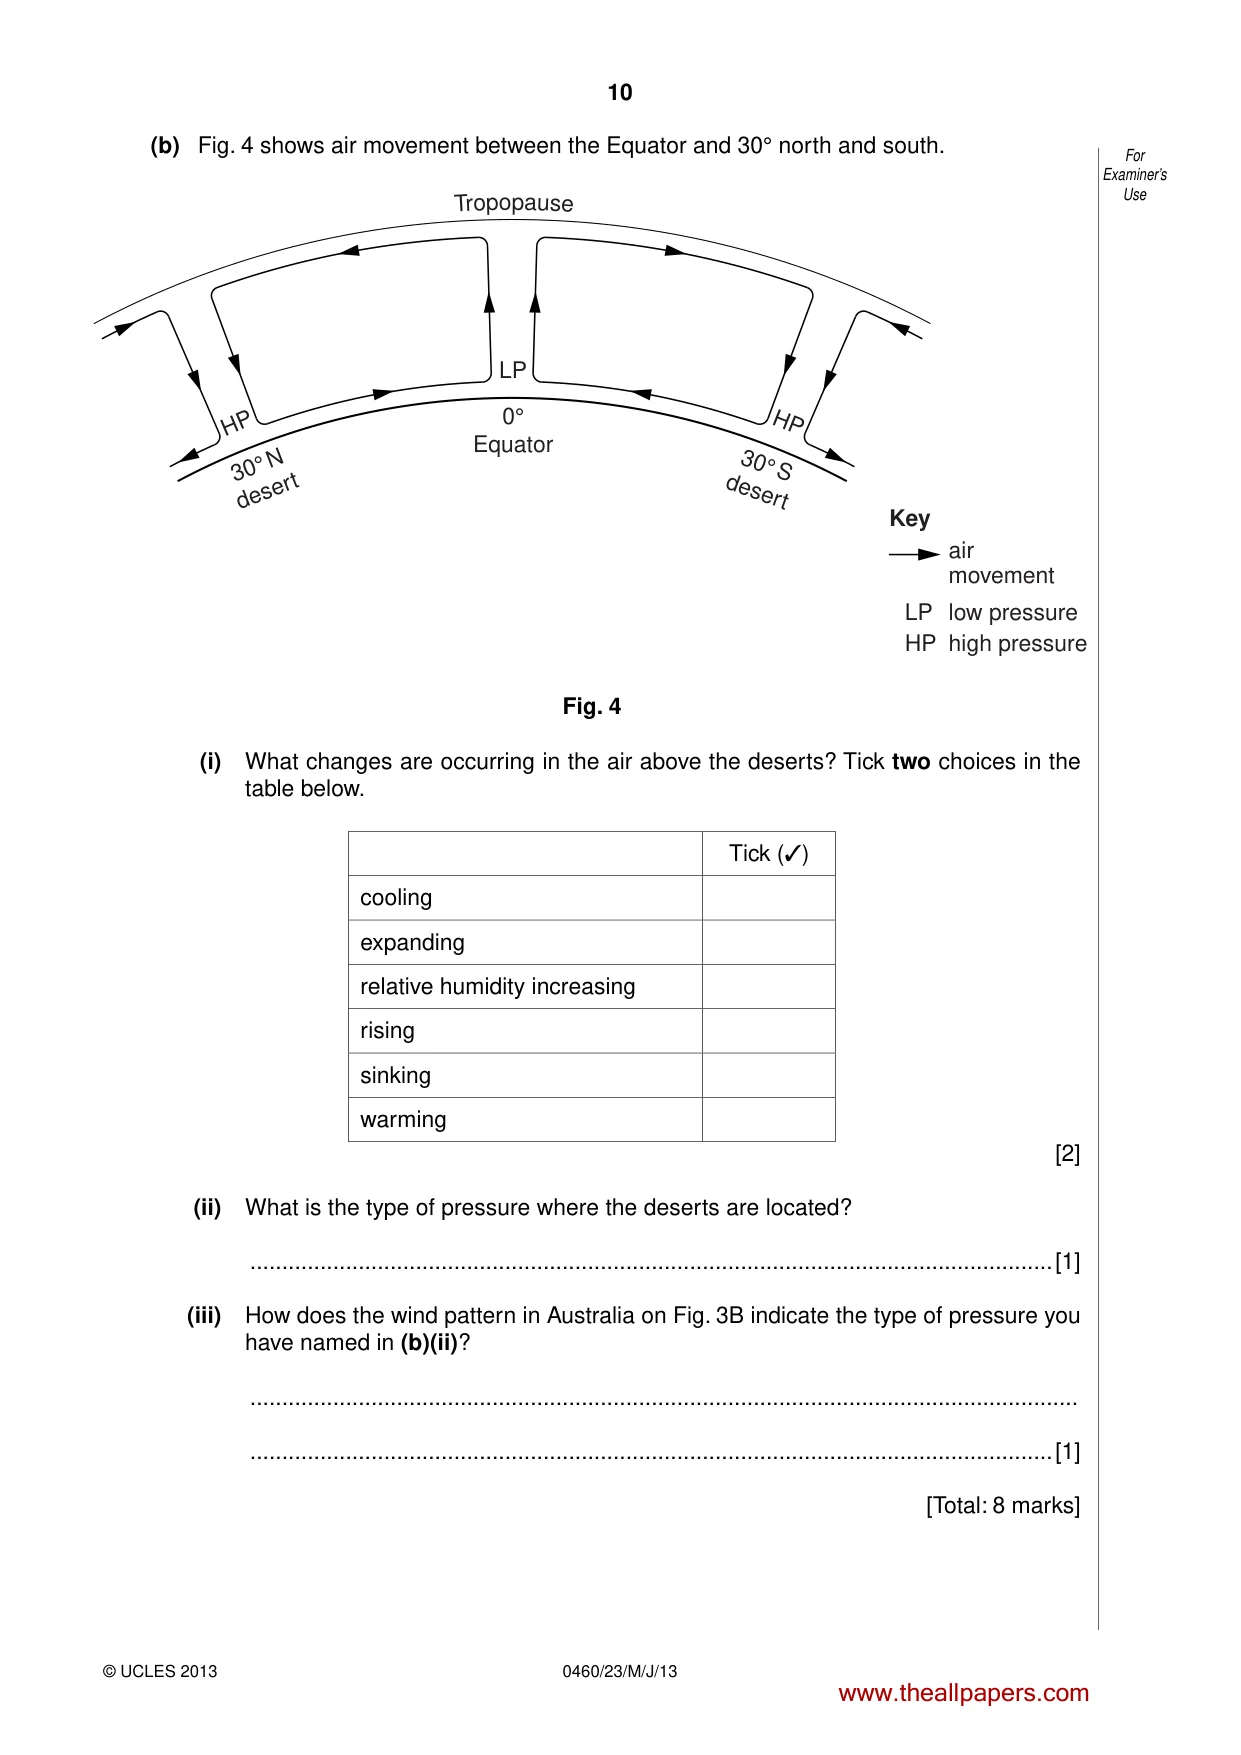
10 0460/23/M/J/13 © UCLES 2013 For Examiner’s Use (b) Fig. 4 shows air movement between the Equator and 30° north and south. 30° N desert 30° S desert HP HP LP Key air movement low pressure high pressure LP HP Trop opau se 0° Equator Fig. 4 (i) What changes are occurring in the air above the deserts? Tick two choices in the table below. Tick (✓) cooling expanding relative humidity increasing rising sinking warming [2] (ii) What is the type of pressure where the deserts are located? …[1] (iii) How does the wind pattern in Australia on Fig. 3B indicate the type of pressure you have named in (b)(ii)? … …[1] [Total: 8 marks] www.theallpapers.com
Question paper, page 11
11 0460/23/M/J/13 © UCLES 2013 [Turn over BLANK PAGE Turn over for Question 5 www.theallpapers.com
Question paper, page 12
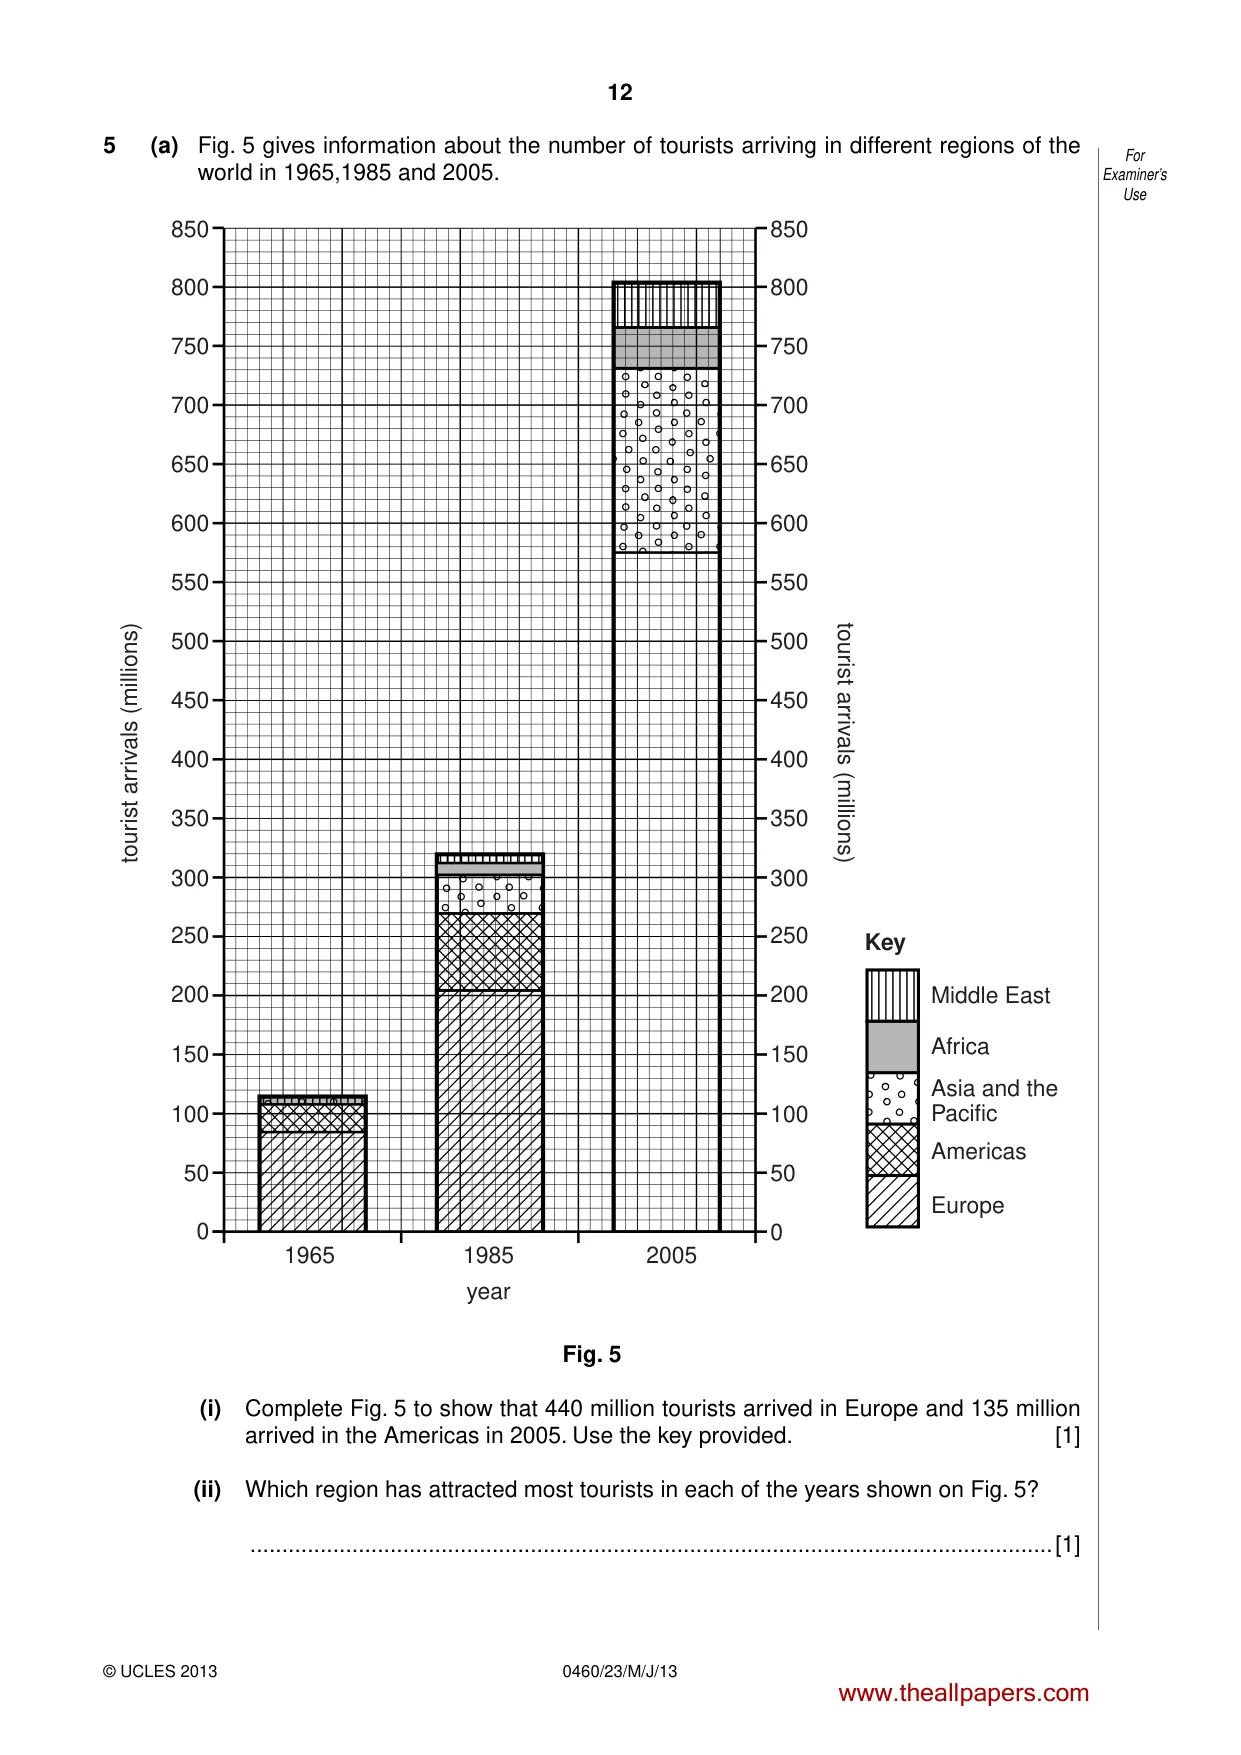
12 0460/23/M/J/13 © UCLES 2013 For Examiner’s Use 5 (a) Fig. 5 gives information about the number of tourists arriving in different regions of the world in 1965,1985 and 2005. tourist arrivals (millions) tourist arrivals (millions) 1985 2005 Key 1965 year 500 450 400 650 600 550 800 750 850 700 350 300 250 200 Middle East Africa Asia and the Pacific Europe Americas 150 100 50 500 450 400 650 600 550 800 750 850 700 350 300 250 200 150 100 50 0 0 Fig. 5 (i) Complete Fig. 5 to show that 440 million tourists arrived in Europe and 135 million arrived in the Americas in 2005. Use the key provided. [1] (ii) Which region has attracted most tourists in each of the years shown on Fig. 5? …[1] www.theallpapers.com
Question paper, page 13
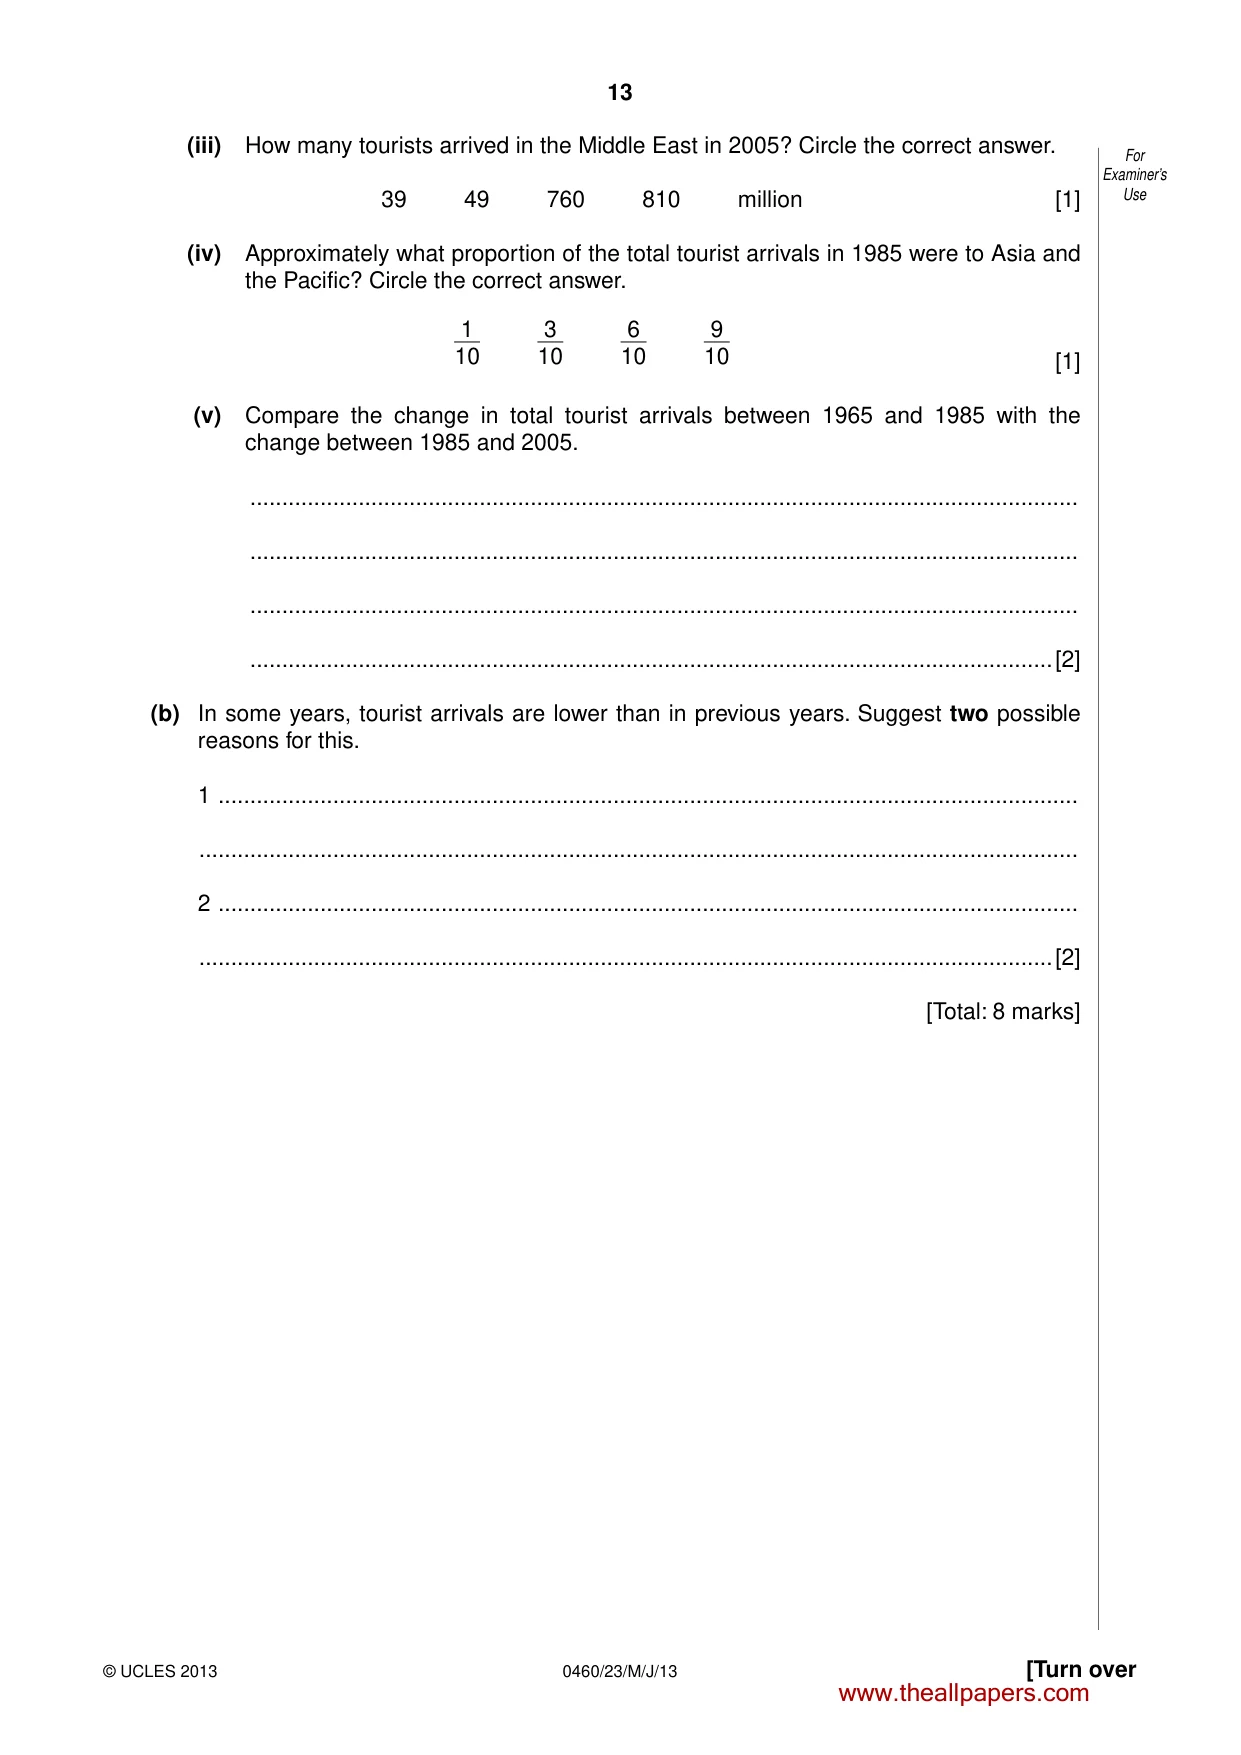
13 0460/23/M/J/13 © UCLES 2013 [Turn over For Examiner’s Use (iii) How many tourists arrived in the Middle East in 2005? Circle the correct answer. 39 49 760 810 million [1] (iv) Approximately what proportion of the total tourist arrivals in 1985 were to Asia and the Pacific? Circle the correct answer. 1 10 3 10 6 10 9 10 [1] (v) Compare the change in total tourist arrivals between 1965 and 1985 with the change between 1985 and 2005. … … … …[2] (b) In some years, tourist arrivals are lower than in previous years. Suggest two possible reasons for this. 1 … … 2 … …[2] [Total: 8 marks] www.theallpapers.com
Question paper, page 14
14 0460/23/M/J/13 © UCLES 2013 For Examiner’s Use 6 Fig. 6A shows the average amounts of water available per person for countries in Africa. Fig. 6B shows the variation in annual rainfall in Africa. Liberia Nigeria Namibia South Africa Kenya 0 500 km 1000 Egypt 0 − 999 1000 − 2499 2500 − 14 999 15 000 and over available water (m3 per person per year) N Key 0 − 249 250 − 999 1000 − 1999 2000 and over annual rainfall (mm) Key N D.R. Congo Fig. 6A Fig. 6B Table 2 country water available per person (m3 per person per year) Namibia 6130 South Africa 1400 (a) Complete Fig. 6A using the information in Table 2. Use the key provided. [1] (b) (i) Describe the distribution of the countries with the lowest water availability in Africa. … … … …[2] www.theallpapers.com
Question paper, page 15
15 0460/23/M/J/13 © UCLES 2013 For Examiner’s Use (ii) Complete the table below by inserting the name of countries which have the water availability and rainfall described in the table. Select only from the countries named in Fig. 6A. country water availability (m3 per person per year) annual rainfall … 15 000 and over 2000 mm and over … 15 000 and over 1000 – 1999 mm … 0 – 999 0 – 249 mm [3] (iii) Suggest two reasons why some countries with high rainfall are unable to supply enough water to meet demand. 1 … … 2 … …[2] [Total: 8 marks] www.theallpapers.com
Question paper, page 16
16 0460/23/M/J/13 © UCLES 2013 BLANK PAGE Copyright Acknowledgements: Question 1 Map © adapted: Haut de Flacq, Mauritius; Eastings 11-18, Northings 96-01; Government of Mauritius; 1989. Question 2 Photograph A Muriel Fretwell © UCLES. Question 3 Table 1 © adapted: CIA World Factbook; US Census Bureau; www.census.gov/ipc/www/idb/county.php; 3 May 2011. Question 5 Fig. 5 © adapted: UN World Tourism Organisation; 9284402212; http://publications, unwto.org/ca/node28528; November 2006 Edition. Question 6 Figs 6A & 6B © adapted: Aquastat Database, IWMI; Food and Agriculture Organisation; 2011. Permission to reproduce items where third-party owned material protected by copyright is included has been sought and cleared where possible. Every reasonable effort has been made by the publisher (UCLES) to trace copyright holders, but if any items requiring clearance have unwittingly been included, the publisher will be pleased to make amends at the earliest possible opportunity. University of Cambridge International Examinations is part of the Cambridge Assessment Group. Cambridge Assessment is the brand name of University of Cambridge Local Examinations Syndicate (UCLES), which is itself a department of the University of Cambridge. www.theallpapers.com
Mark scheme, page 1
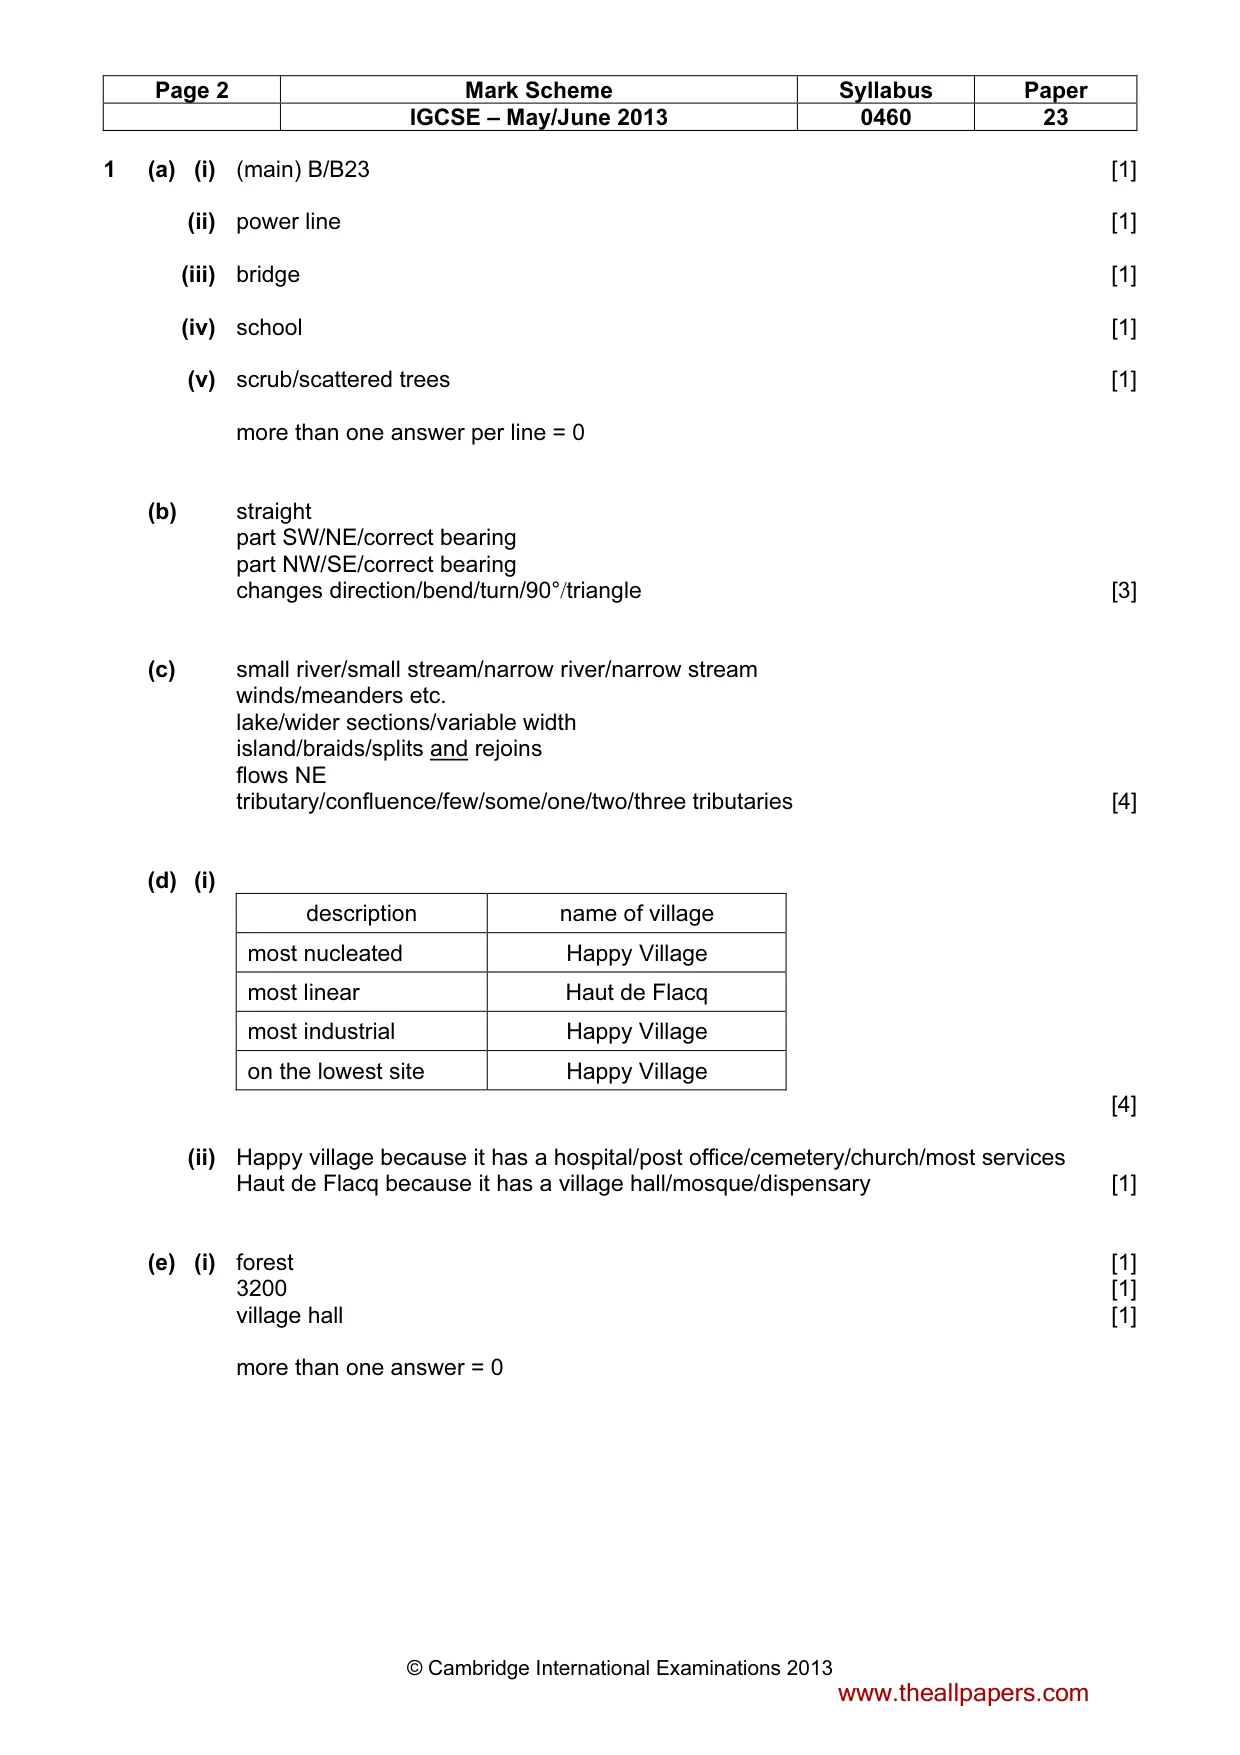
CAMBRIDGE INTERNATIONAL EXAMINATIONS International General Certificate of Secondary Education MARK SCHEME for the May/June 2013 series 0460 GEOGRAPHY 0460/23 Paper 2, maximum raw mark 60 This mark scheme is published as an aid to teachers and candidates, to indicate the requirements of the examination. It shows the basis on which Examiners were instructed to award marks. It does not indicate the details of the discussions that took place at an Examiners’ meeting before marking began, which would have considered the acceptability of alternative answers. Mark schemes should be read in conjunction with the question paper and the Principal Examiner Report for Teachers. Cambridge will not enter into discussions about these mark schemes. Cambridge is publishing the mark schemes for the May/June 2013 series for most IGCSE, GCE Advanced Level and Advanced Subsidiary Level components and some Ordinary Level components. www.theallpapers.com
Mark scheme, page 2
Page 2 Mark Scheme Syllabus Paper IGCSE – May/June 2013 0460 23 © Cambridge International Examinations 2013 1 (a) (i) (main) B/B23 [1] (ii) power line [1] (iii) bridge [1] (iv) school [1] (v) scrub/scattered trees [1] more than one answer per line = 0 (b) straight part SW/NE/correct bearing part NW/SE/correct bearing changes direction/bend/turn/90°/triangle [3] (c) small river/small stream/narrow river/narrow stream winds/meanders etc. lake/wider sections/variable width island/braids/splits and rejoins flows NE tributary/confluence/few/some/one/two/three tributaries [4] (d) (i) description name of village most nucleated Happy Village most linear Haut de Flacq most industrial Happy Village on the lowest site Happy Village [4] (ii) Happy village because it has a hospital/post office/cemetery/church/most services Haut de Flacq because it has a village hall/mosque/dispensary [1] (e) (i) forest [1] 3200 [1] village hall [1] more than one answer = 0 www.theallpapers.com
Mark scheme, page 3
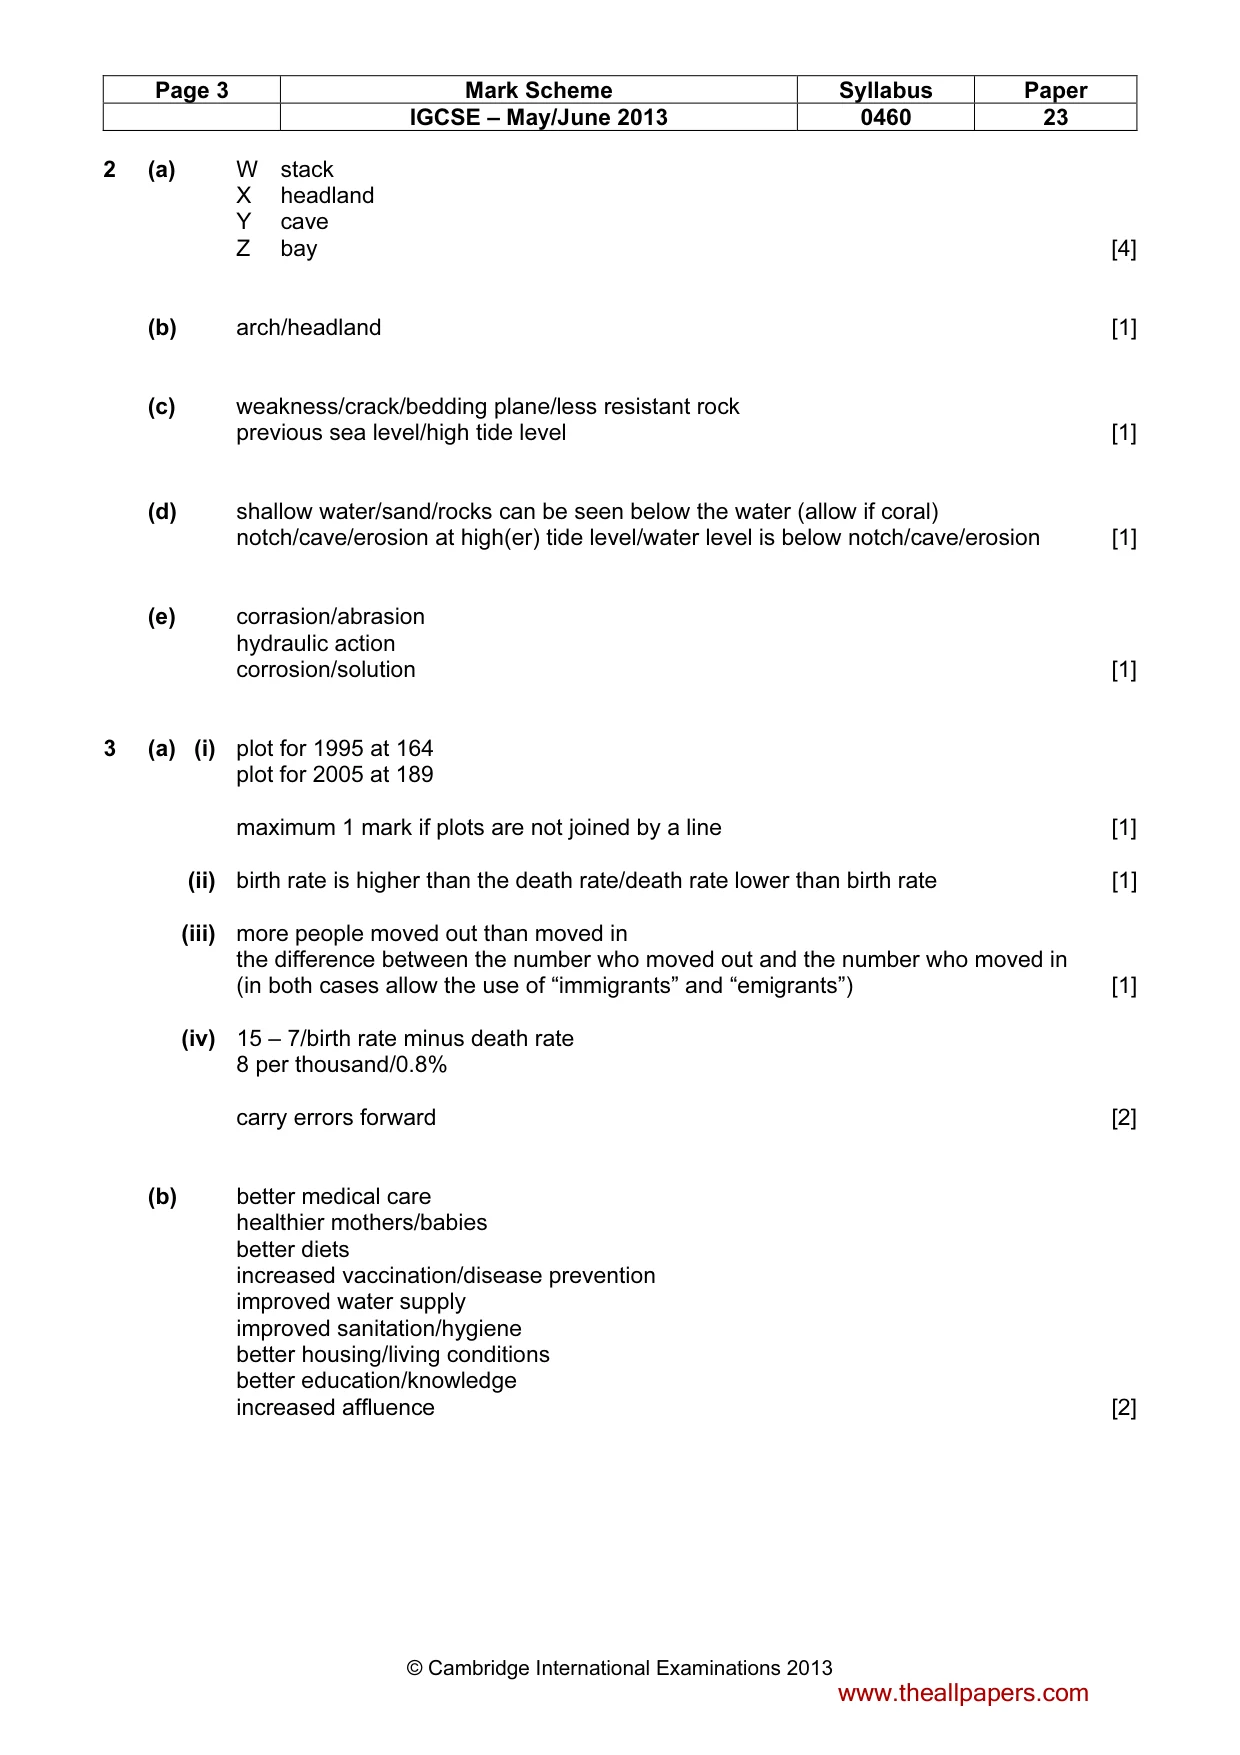
Page 3 Mark Scheme Syllabus Paper IGCSE – May/June 2013 0460 23 © Cambridge International Examinations 2013 2 (a) W stack X headland Y cave Z bay [4] (b) arch/headland [1] (c) weakness/crack/bedding plane/less resistant rock previous sea level/high tide level [1] (d) shallow water/sand/rocks can be seen below the water (allow if coral) notch/cave/erosion at high(er) tide level/water level is below notch/cave/erosion [1] (e) corrasion/abrasion hydraulic action corrosion/solution [1] 3 (a) (i) plot for 1995 at 164 plot for 2005 at 189 maximum 1 mark if plots are not joined by a line [1] (ii) birth rate is higher than the death rate/death rate lower than birth rate [1] (iii) more people moved out than moved in the difference between the number who moved out and the number who moved in (in both cases allow the use of “immigrants” and “emigrants”) [1] (iv) 15 – 7/birth rate minus death rate 8 per thousand/0.8% carry errors forward [2] (b) better medical care healthier mothers/babies better diets increased vaccination/disease prevention improved water supply improved sanitation/hygiene better housing/living conditions better education/knowledge increased affluence [2] www.theallpapers.com
Mark scheme, page 4
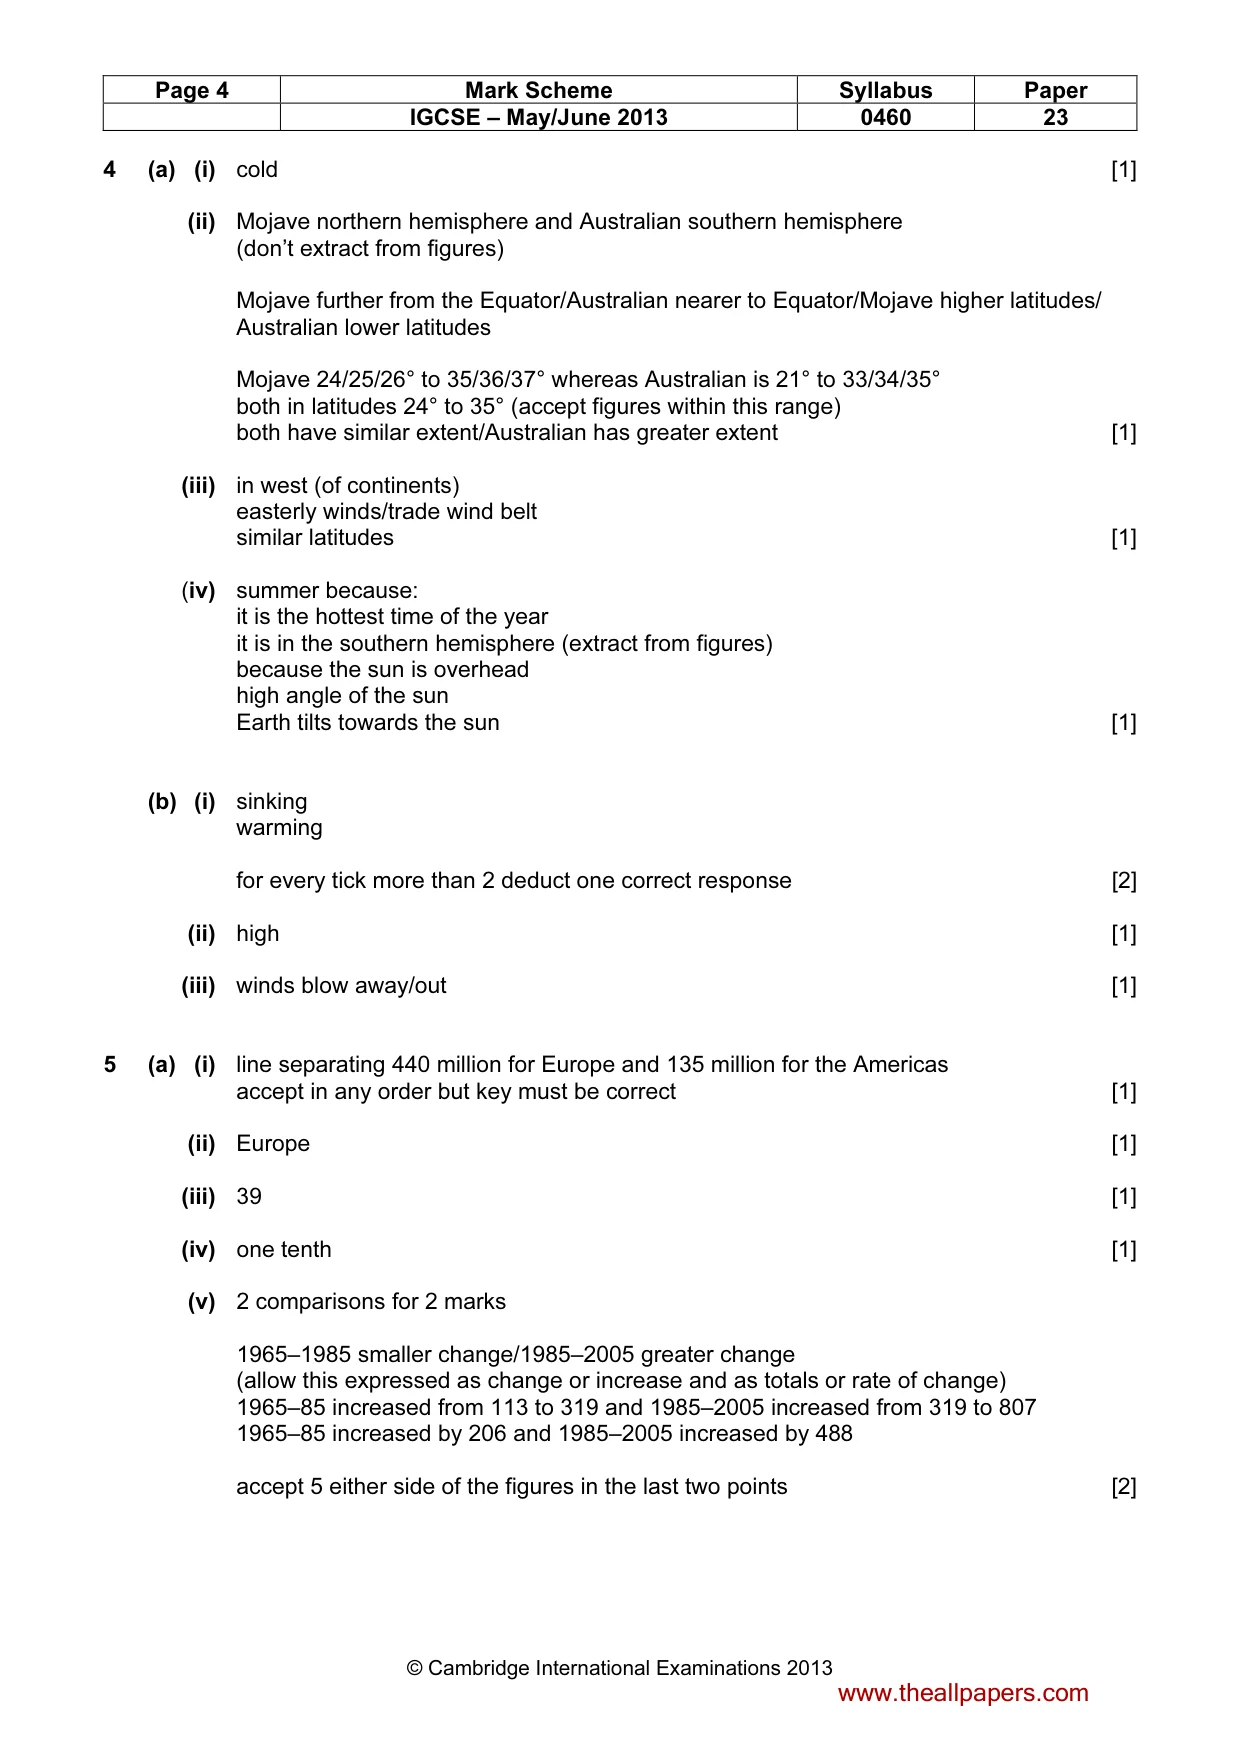
Page 4 Mark Scheme Syllabus Paper IGCSE – May/June 2013 0460 23 © Cambridge International Examinations 2013 4 (a) (i) cold [1] (ii) Mojave northern hemisphere and Australian southern hemisphere (don’t extract from figures) Mojave further from the Equator/Australian nearer to Equator/Mojave higher latitudes/ Australian lower latitudes Mojave 24/25/26° to 35/36/37° whereas Australian is 21° to 33/34/35° both in latitudes 24° to 35° (accept figures within this range) both have similar extent/Australian has greater extent [1] (iii) in west (of continents) easterly winds/trade wind belt similar latitudes [1] (iv) summer because: it is the hottest time of the year it is in the southern hemisphere (extract from figures) because the sun is overhead high angle of the sun Earth tilts towards the sun [1] (b) (i) sinking warming for every tick more than 2 deduct one correct response [2] (ii) high [1] (iii) winds blow away/out [1] 5 (a) (i) line separating 440 million for Europe and 135 million for the Americas accept in any order but key must be correct [1] (ii) Europe [1] (iii) 39 [1] (iv) one tenth [1] (v) 2 comparisons for 2 marks 1965–1985 smaller change/1985–2005 greater change (allow this expressed as change or increase and as totals or rate of change) 1965–85 increased from 113 to 319 and 1985–2005 increased from 319 to 807 1965–85 increased by 206 and 1985–2005 increased by 488 accept 5 either side of the figures in the last two points [2] www.theallpapers.com
Mark scheme, page 5
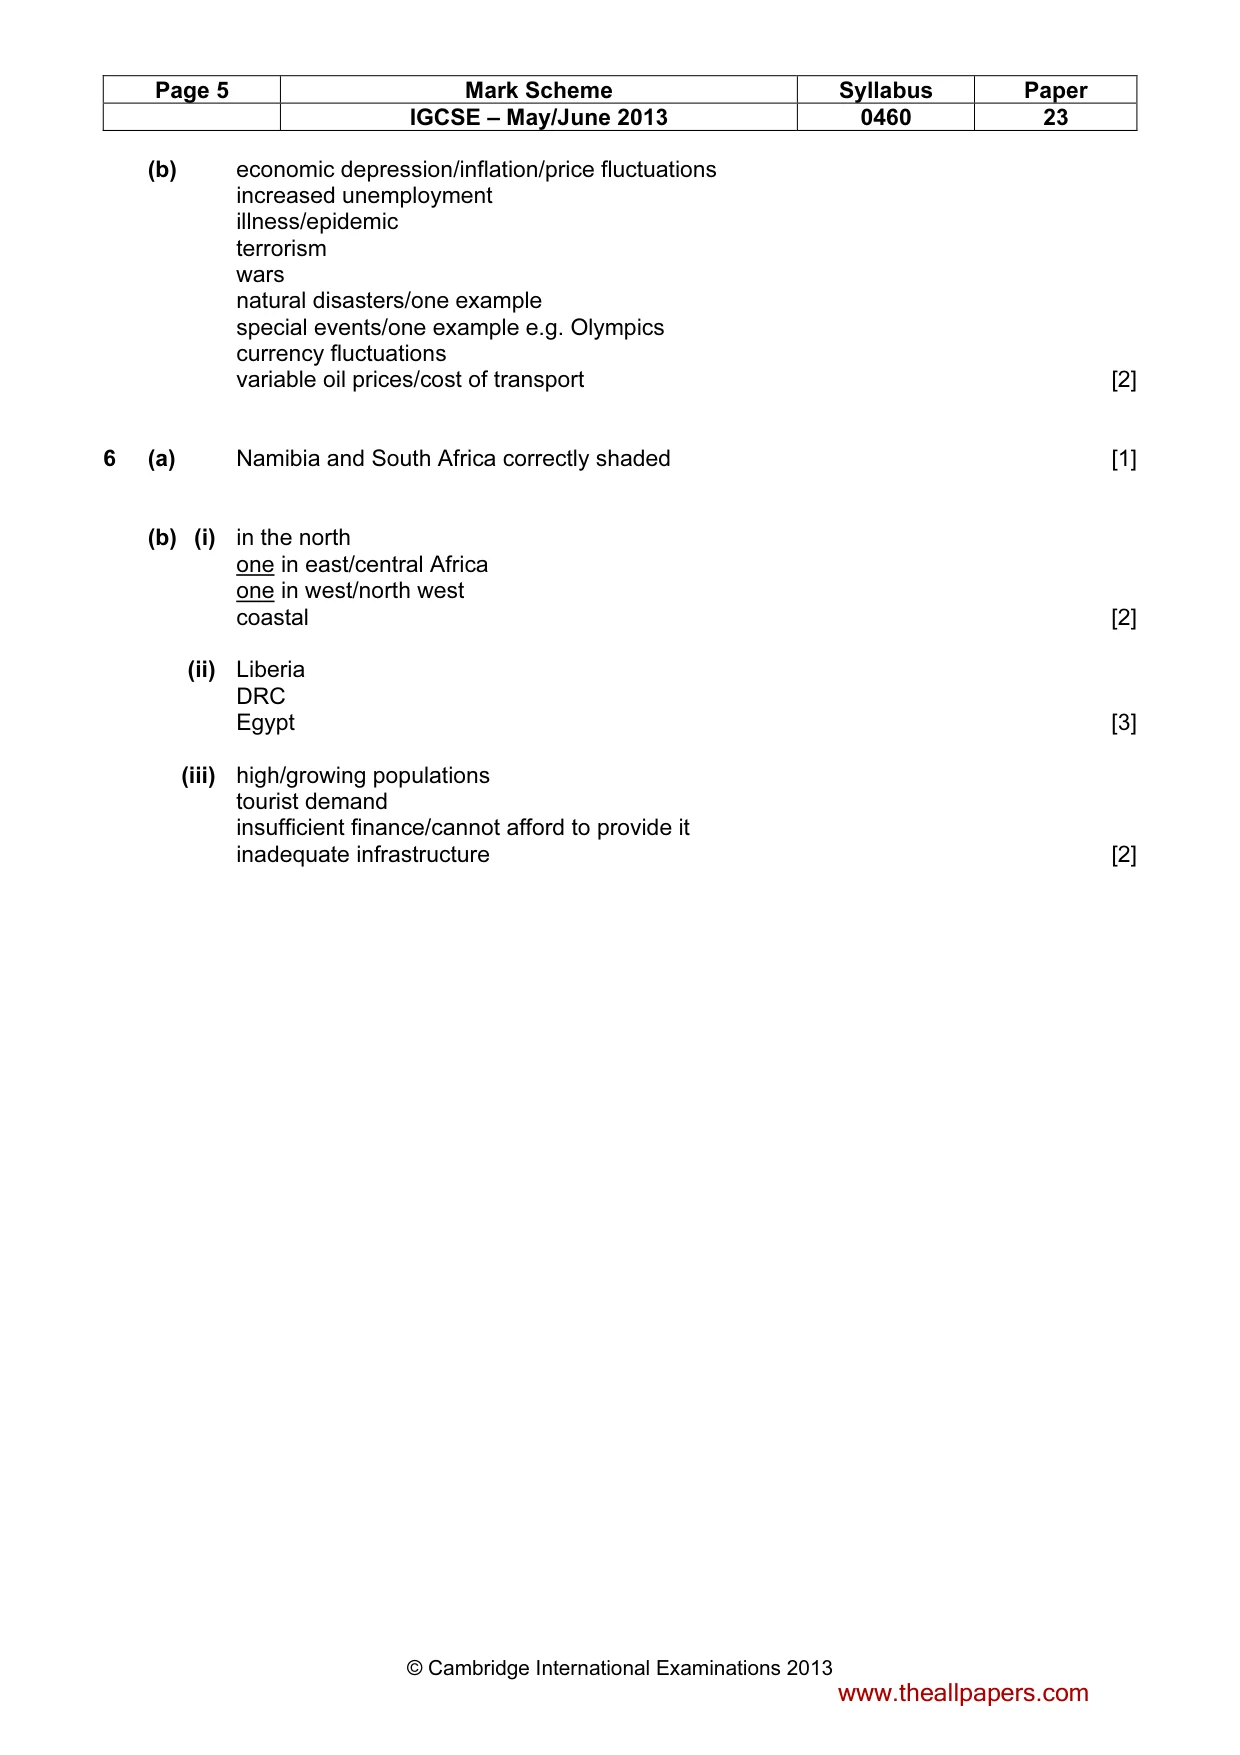
Page 5 Mark Scheme Syllabus Paper IGCSE – May/June 2013 0460 23 © Cambridge International Examinations 2013 (b) economic depression/inflation/price fluctuations increased unemployment illness/epidemic terrorism wars natural disasters/one example special events/one example e.g. Olympics currency fluctuations variable oil prices/cost of transport [2] 6 (a) Namibia and South Africa correctly shaded [1] (b) (i) in the north one in east/central Africa one in west/north west coastal [2] (ii) Liberia DRC Egypt [3] (iii) high/growing populations tourist demand insufficient finance/cannot afford to provide it inadequate infrastructure [2] www.theallpapers.com
What you needed in this session
Cambridge’s own grade thresholds for 2013 May/June, Paper 2 · Variant 3. A higher threshold means an easier paper — the bar moves with how the cohort did.