Cambridge IGCSE Geography 0460 — 2012 May/June Paper 4 · Variant 3
0460/43/M/J/12 · 60 marks · ≈68 min
The question paper and its mark scheme, free to read here and free to download. This is Cambridge’s own paper, exactly as it was sat.
Question paper16 pages

Mark scheme5 pages
Answers below. Sit the paper first if you are practising.
Paper as text
Question paper, page 1
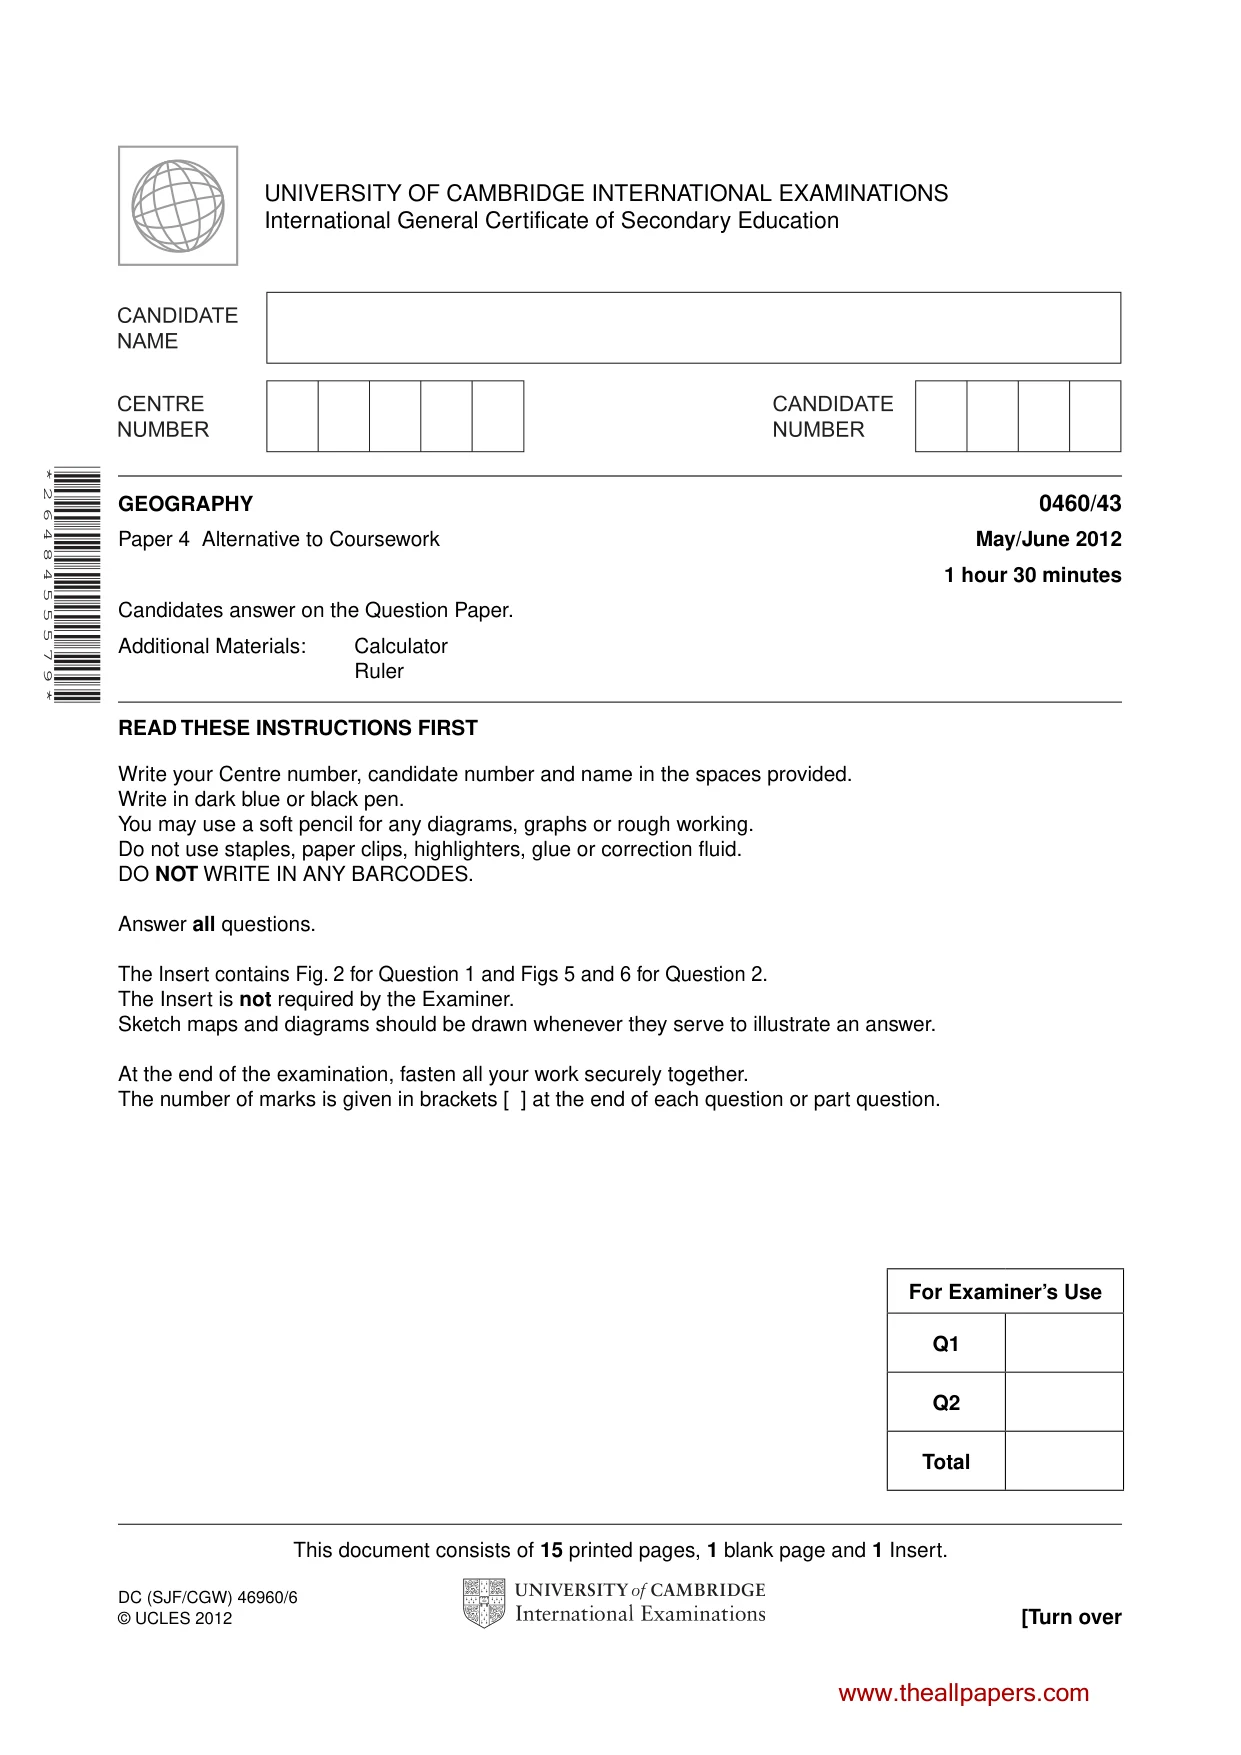
This document consists of 15 printed pages, 1 blank page and 1 Insert. DC (SJF/CGW) 46960/6 © UCLES 2012 [Turn over UNIVERSITY OF CAMBRIDGE INTERNATIONAL EXAMINATIONS International General Certificate of Secondary Education * 2 6 4 8 4 5 5 5 7 9 * GEOGRAPHY 0460/43 Paper 4 Alternative to Coursework May/June 2012 1 hour 30 minutes Candidates answer on the Question Paper. Additional Materials: Calculator Ruler READ THESE INSTRUCTIONS FIRST Write your Centre number, candidate number and name in the spaces provided. Write in dark blue or black pen. You may use a soft pencil for any diagrams, graphs or rough working. Do not use staples, paper clips, highlighters, glue or correction fluid. DO NOT WRITE IN ANY BARCODES. Answer all questions. The Insert contains Fig. 2 for Question 1 and Figs 5 and 6 for Question 2. The Insert is not required by the Examiner. Sketch maps and diagrams should be drawn whenever they serve to illustrate an answer. At the end of the examination, fasten all your work securely together. The number of marks is given in brackets [ ] at the end of each question or part question. For Examiner’s Use Q1 Q2 Total www.theallpapers.com
Question paper, page 2
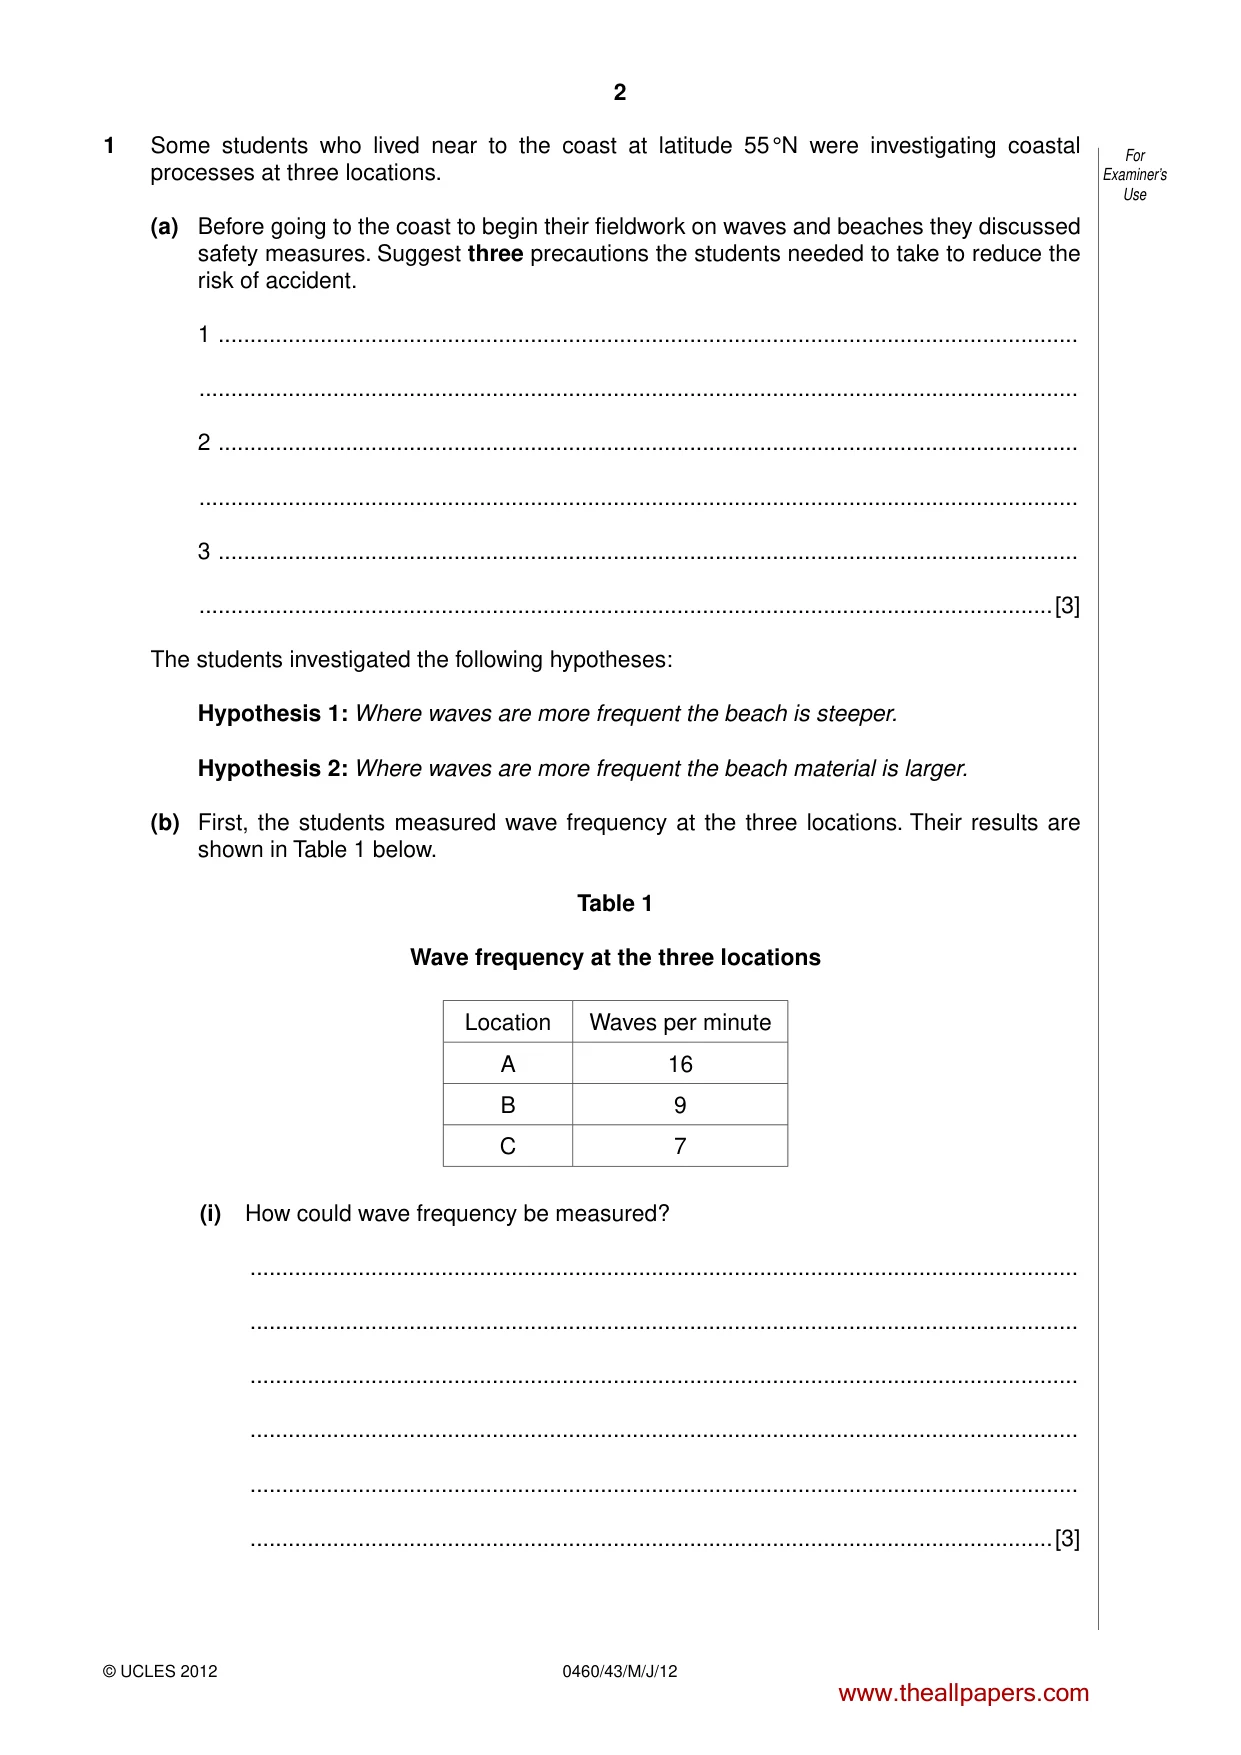
2 0460/43/M/J/12 © UCLES 2012 For Examiner’s Use 1 Some students who lived near to the coast at latitude 55 °N were investigating coastal processes at three locations. (a) Before going to the coast to begin their fieldwork on waves and beaches they discussed safety measures. Suggest three precautions the students needed to take to reduce the risk of accident. 1 … … 2 … … 3 … …[3] The students investigated the following hypotheses: Hypothesis 1: Where waves are more frequent the beach is steeper. Hypothesis 2: Where waves are more frequent the beach material is larger. (b) First, the students measured wave frequency at the three locations. Their results are shown in Table 1 below. Table 1 Wave frequency at the three locations Location Waves per minute A 16 B 9 C 7 (i) How could wave frequency be measured? … … … … … …[3] www.theallpapers.com
Question paper, page 3
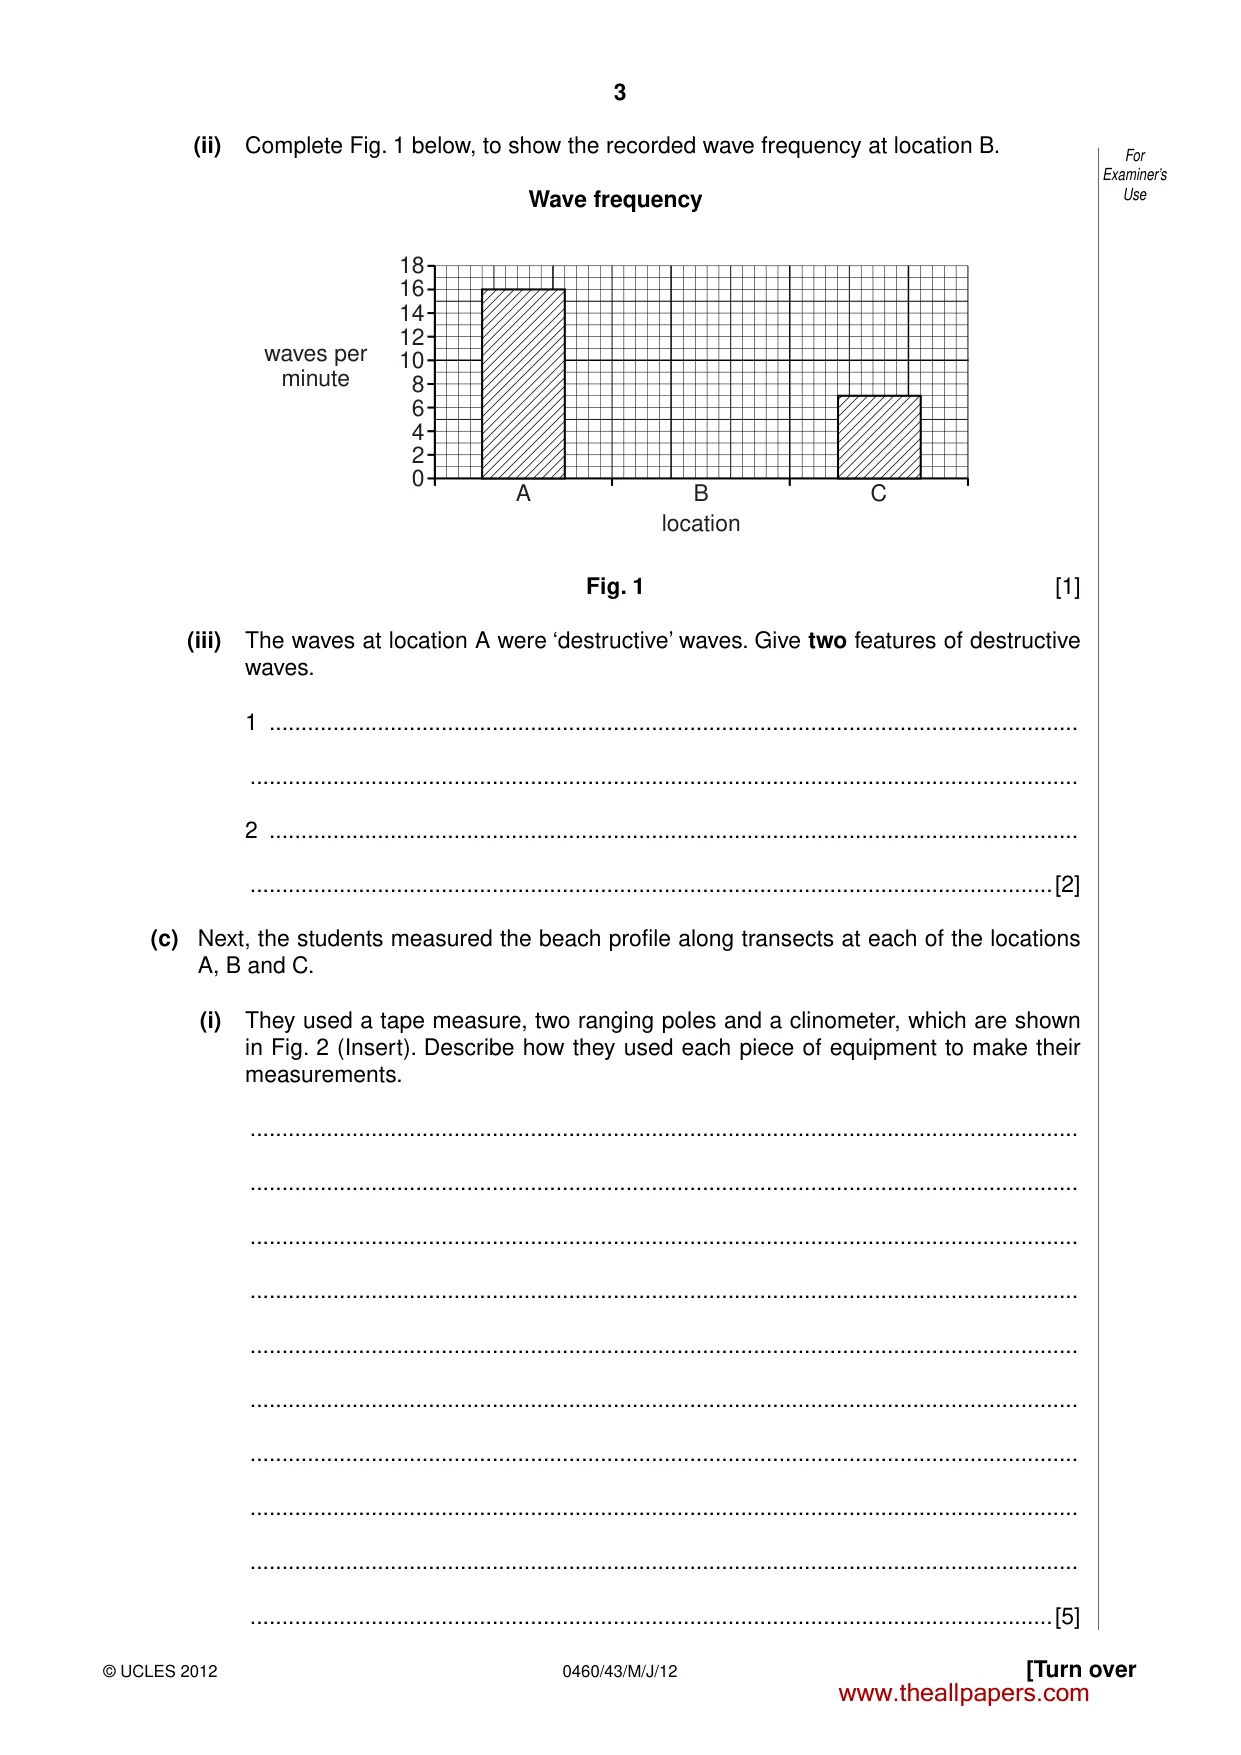
3 [Turn over © UCLES 2012 0460/43/M/J/12 For Examiner’s Use (ii) Complete Fig. 1 below, to show the recorded wave frequency at location B. Wave frequency A 0 2 4 6 8 10 12 14 16 18 B location waves per minute C Fig. 1 [1] (iii) The waves at location A were ‘destructive’ waves. Give two features of destructive waves. 1 … … 2 … …[2] (c) Next, the students measured the beach profile along transects at each of the locations A, B and C. (i) They used a tape measure, two ranging poles and a clinometer, which are shown in Fig. 2 (Insert). Describe how they used each piece of equipment to make their measurements. … … … … … … … … … …[5] www.theallpapers.com
Question paper, page 4
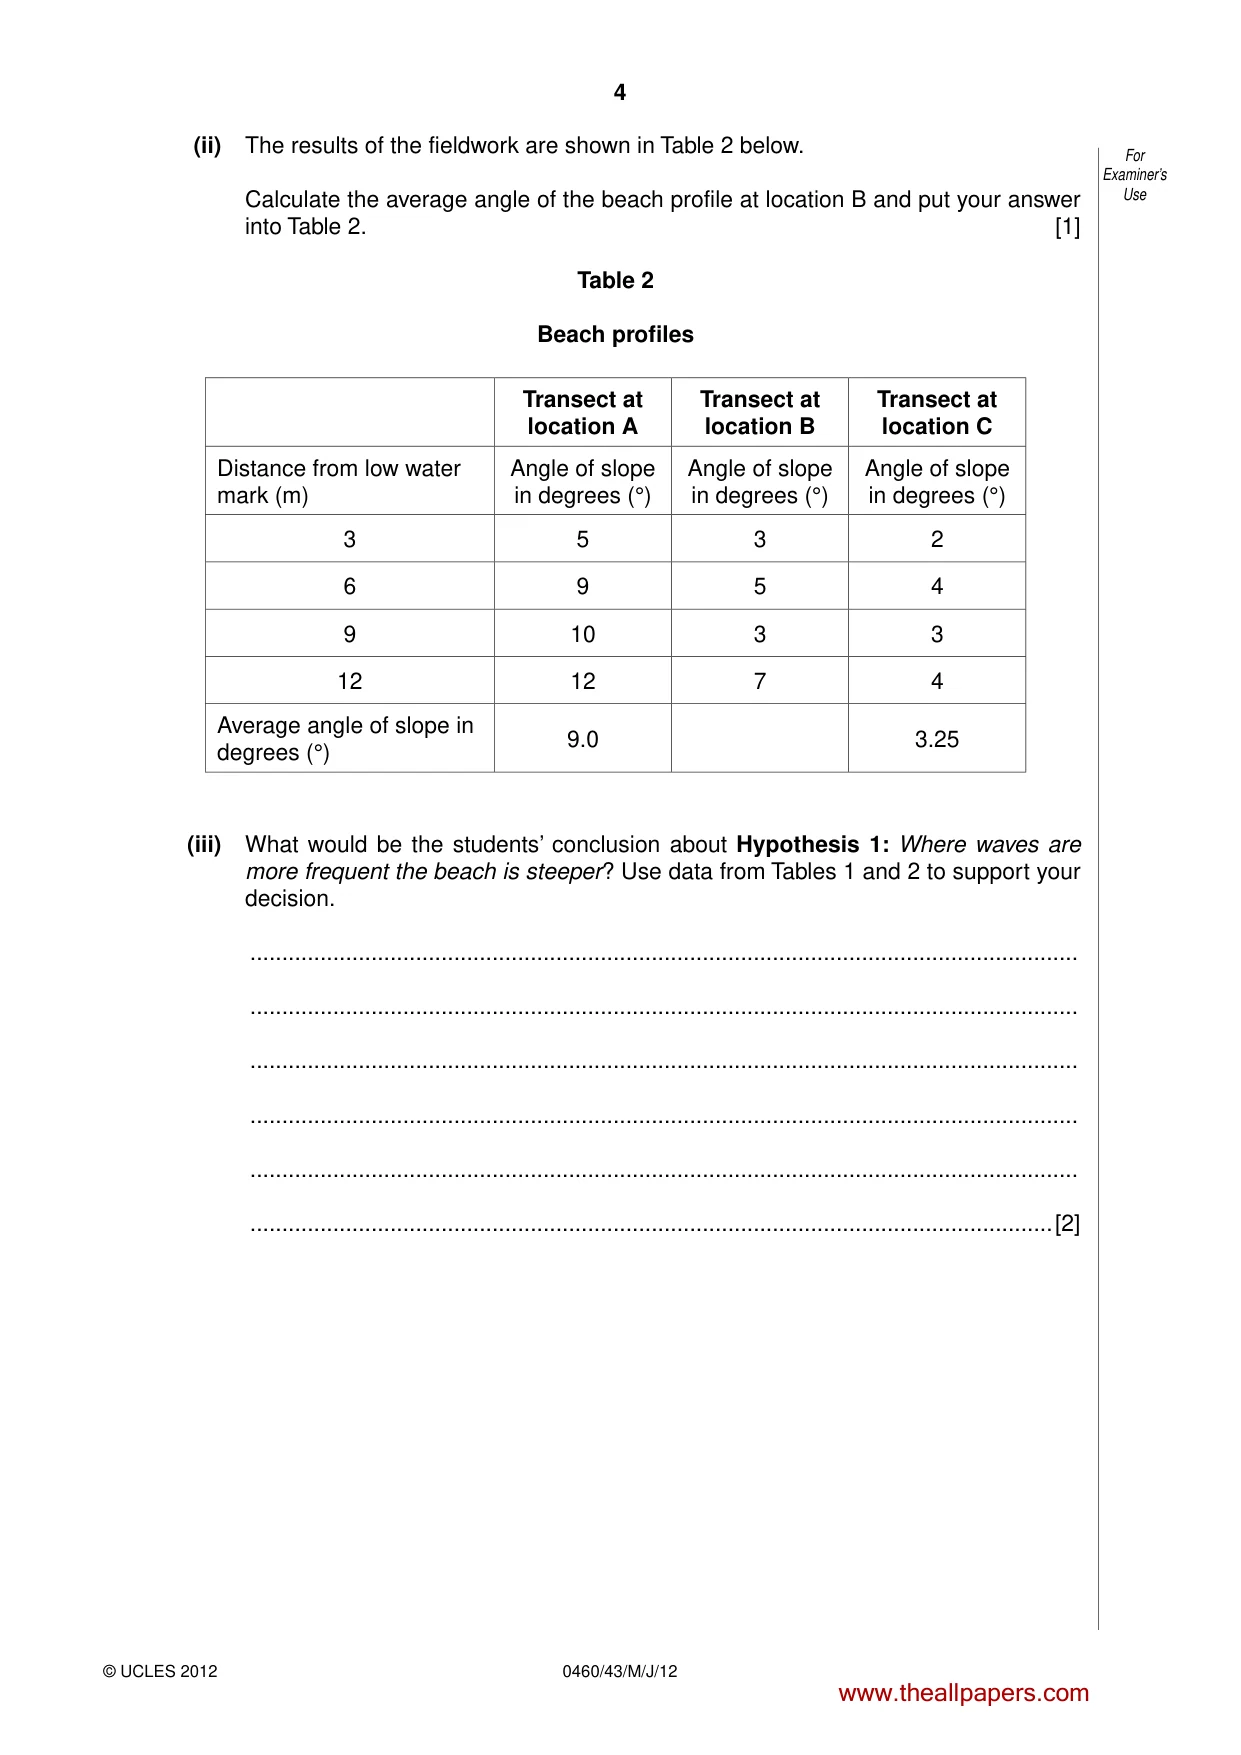
4 0460/43/M/J/12 © UCLES 2012 For Examiner’s Use (ii) The results of the fieldwork are shown in Table 2 below. Calculate the average angle of the beach profile at location B and put your answer into Table 2. [1] Table 2 Beach profiles Transect at location A Transect at location B Transect at location C Distance from low water mark (m) Angle of slope in degrees (°) Angle of slope in degrees (°) Angle of slope in degrees (°) 3 5 3 2 6 9 5 4 9 10 3 3 12 12 7 4 Average angle of slope in degrees (°) 9.0 3.25 (iii) What would be the students’ conclusion about Hypothesis 1: Where waves are more frequent the beach is steeper? Use data from Tables 1 and 2 to support your decision. … … … … … …[2] www.theallpapers.com
Question paper, page 5
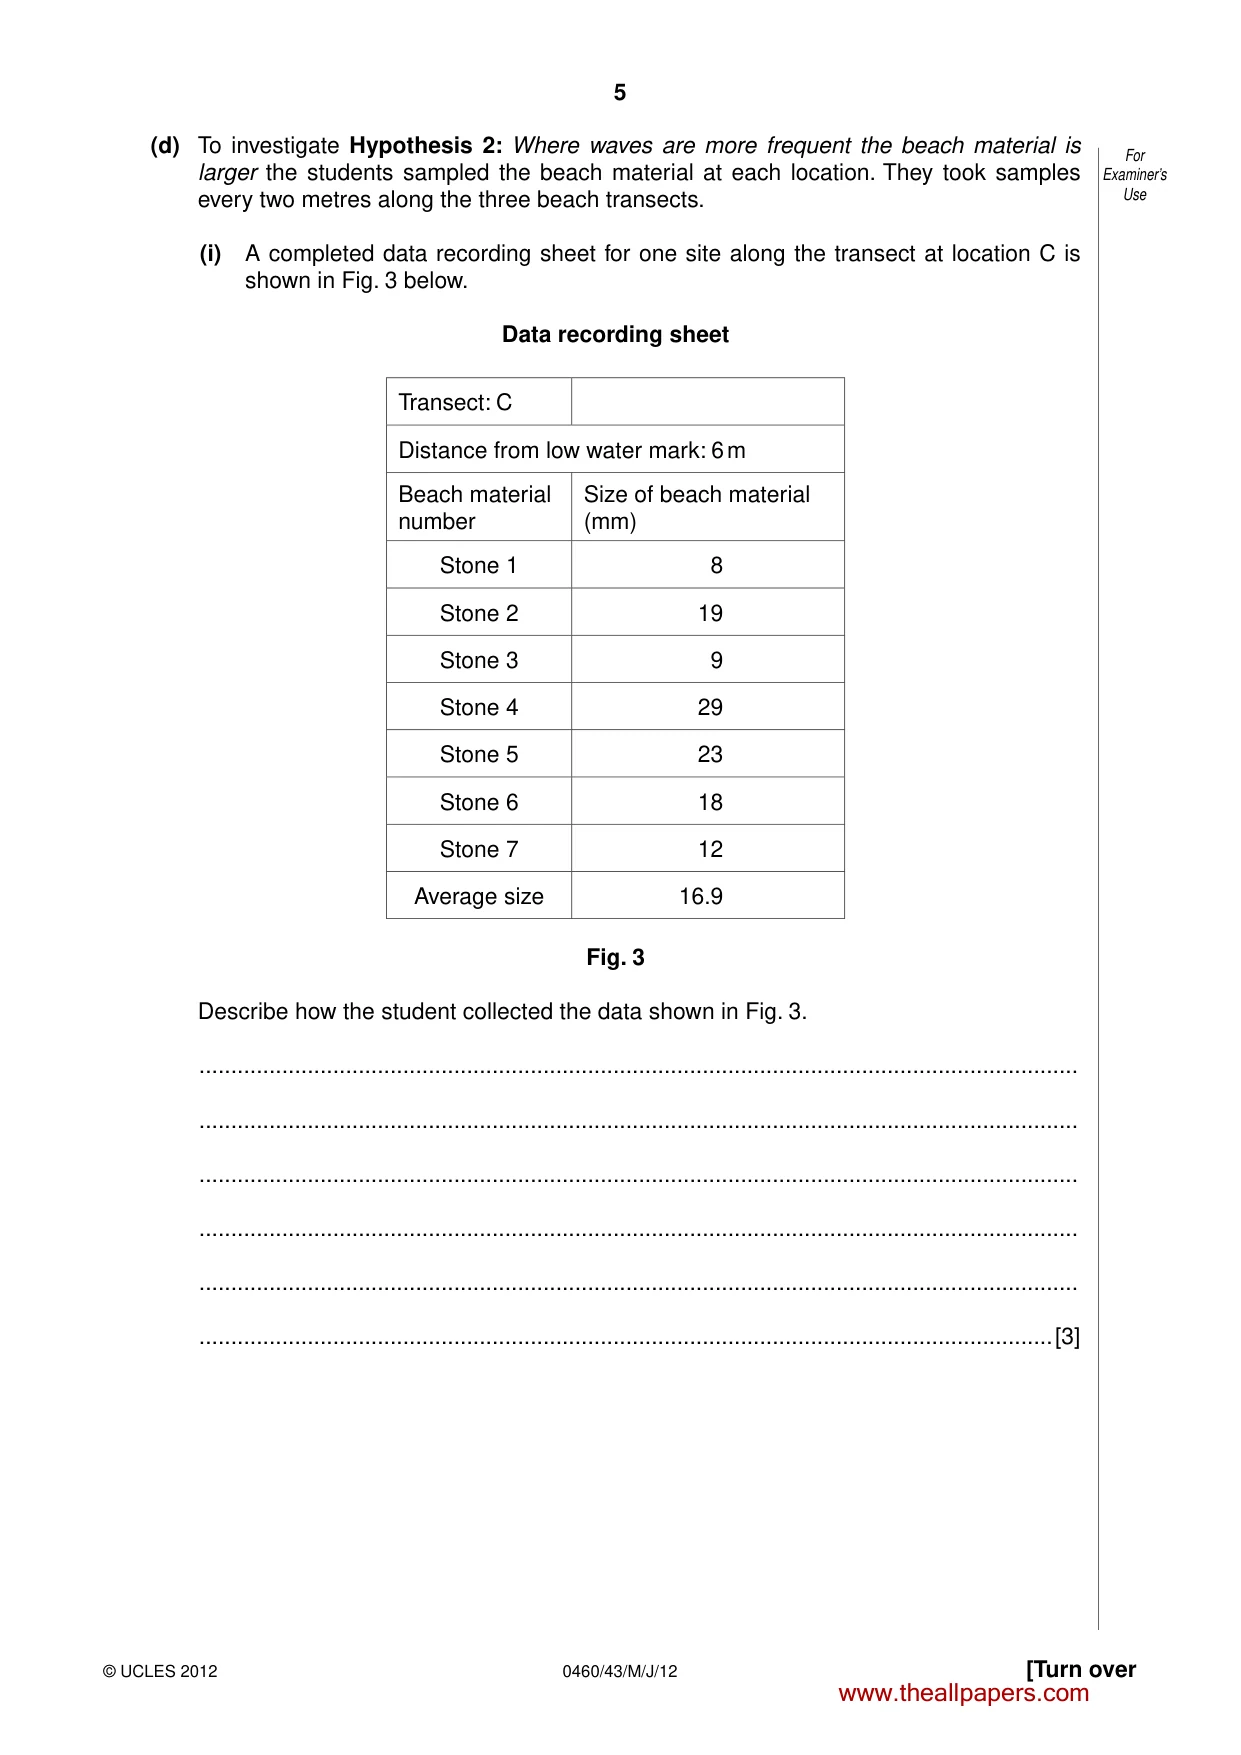
5 [Turn over © UCLES 2012 0460/43/M/J/12 For Examiner’s Use (d) To investigate Hypothesis 2: Where waves are more frequent the beach material is larger the students sampled the beach material at each location. They took samples every two metres along the three beach transects. (i) A completed data recording sheet for one site along the transect at location C is shown in Fig. 3 below. Data recording sheet Transect: C Distance from low water mark: 6 m Beach material number Size of beach material (mm) Stone 1 8 Stone 2 19 Stone 3 9 Stone 4 29 Stone 5 23 Stone 6 18 Stone 7 12 Average size 16.9 Fig. 3 Describe how the student collected the data shown in Fig. 3. … … … … … …[3] www.theallpapers.com
Question paper, page 6
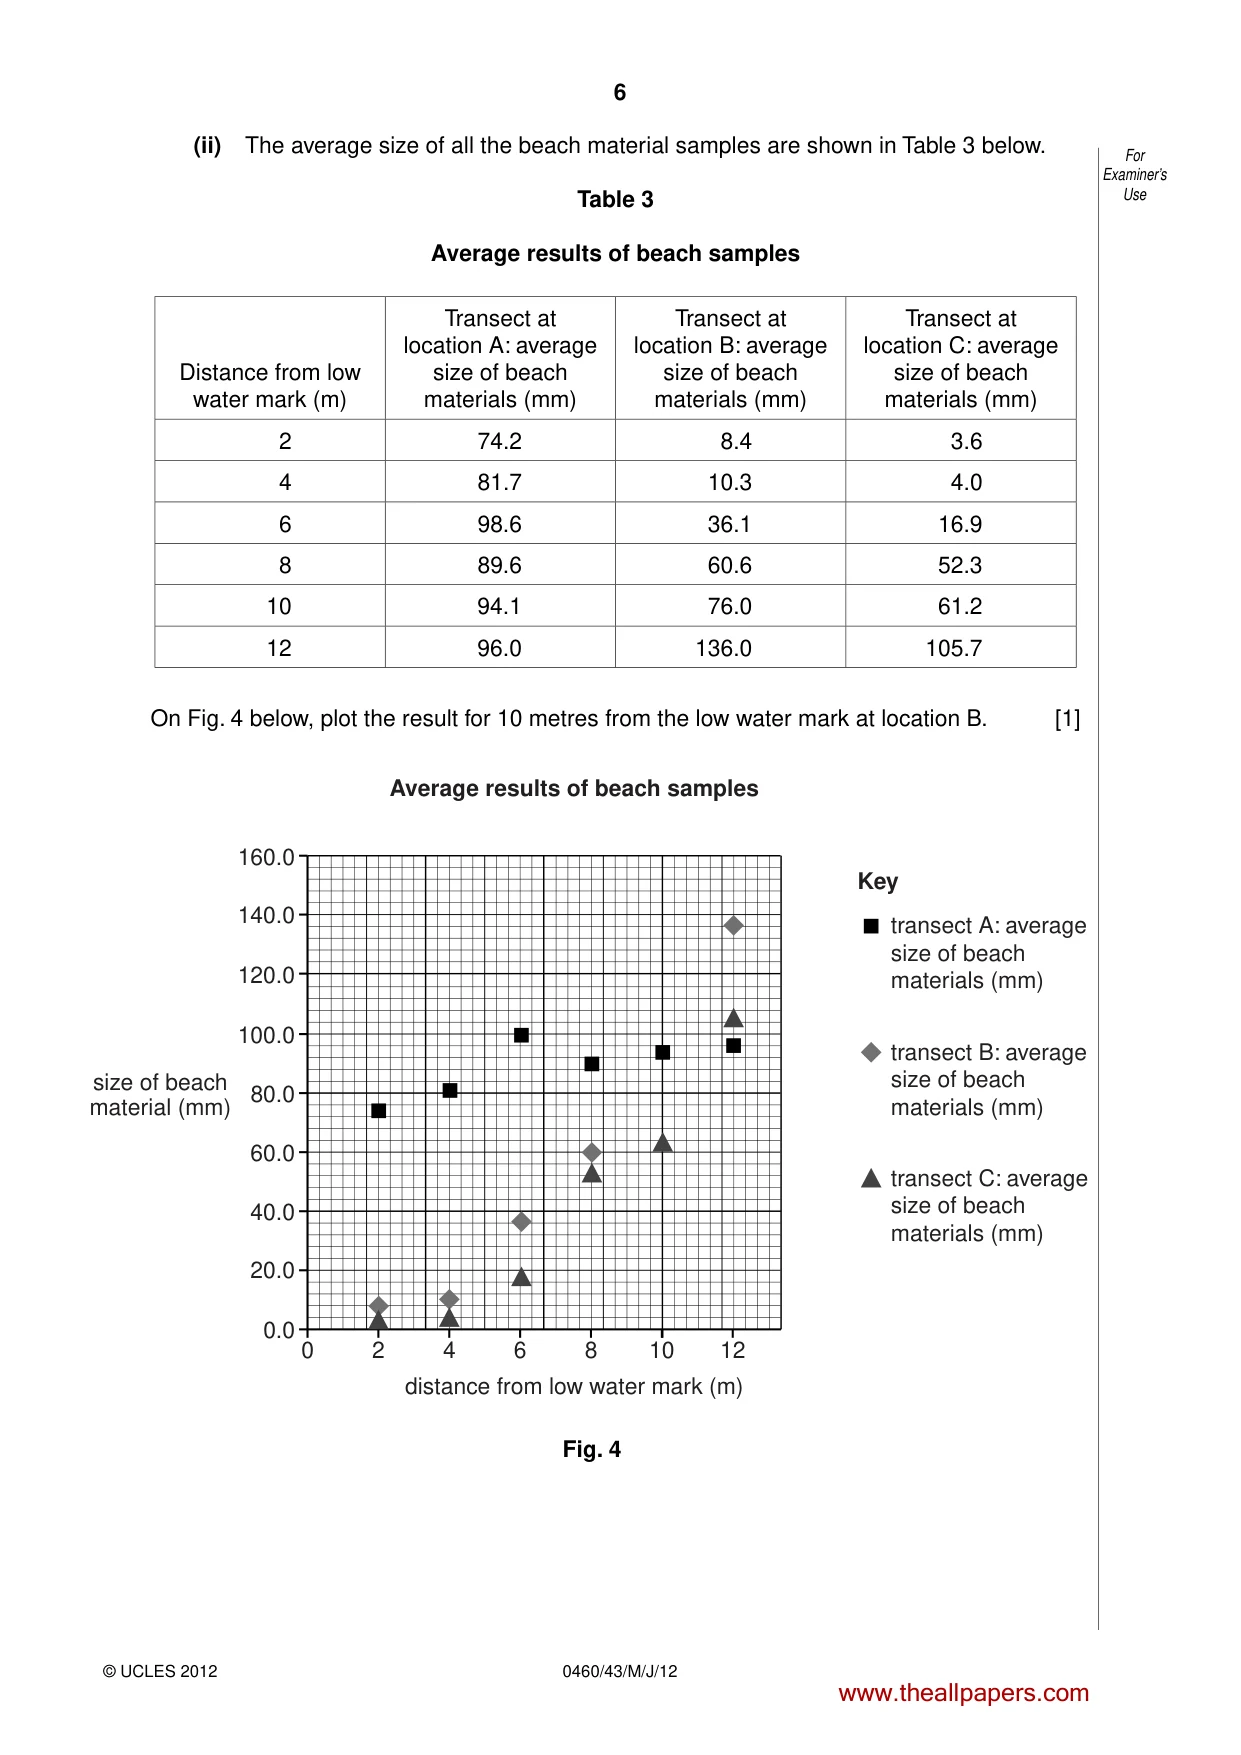
6 0460/43/M/J/12 © UCLES 2012 For Examiner’s Use (ii) The average size of all the beach material samples are shown in Table 3 below. Table 3 Average results of beach samples Distance from low water mark (m) Transect at location A: average size of beach materials (mm) Transect at location B: average size of beach materials (mm) Transect at location C: average size of beach materials (mm) 2 74.2 8.4 3.6 4 81.7 10.3 4.0 6 98.6 36.1 16.9 8 89.6 60.6 52.3 10 94.1 76.0 61.2 12 96.0 136.0 105.7 On Fig. 4 below, plot the result for 10 metres from the low water mark at location B. [1] 160.0 140.0 120.0 transect A: average size of beach materials (mm) transect B: average size of beach materials (mm) transect C: average size of beach materials (mm) 100.0 80.0 size of beach material (mm) 60.0 40.0 20.0 0 2 4 6 8 10 12 distance from low water mark (m) Average results of beach samples Key 0.0 Fig. 4 www.theallpapers.com
Question paper, page 7
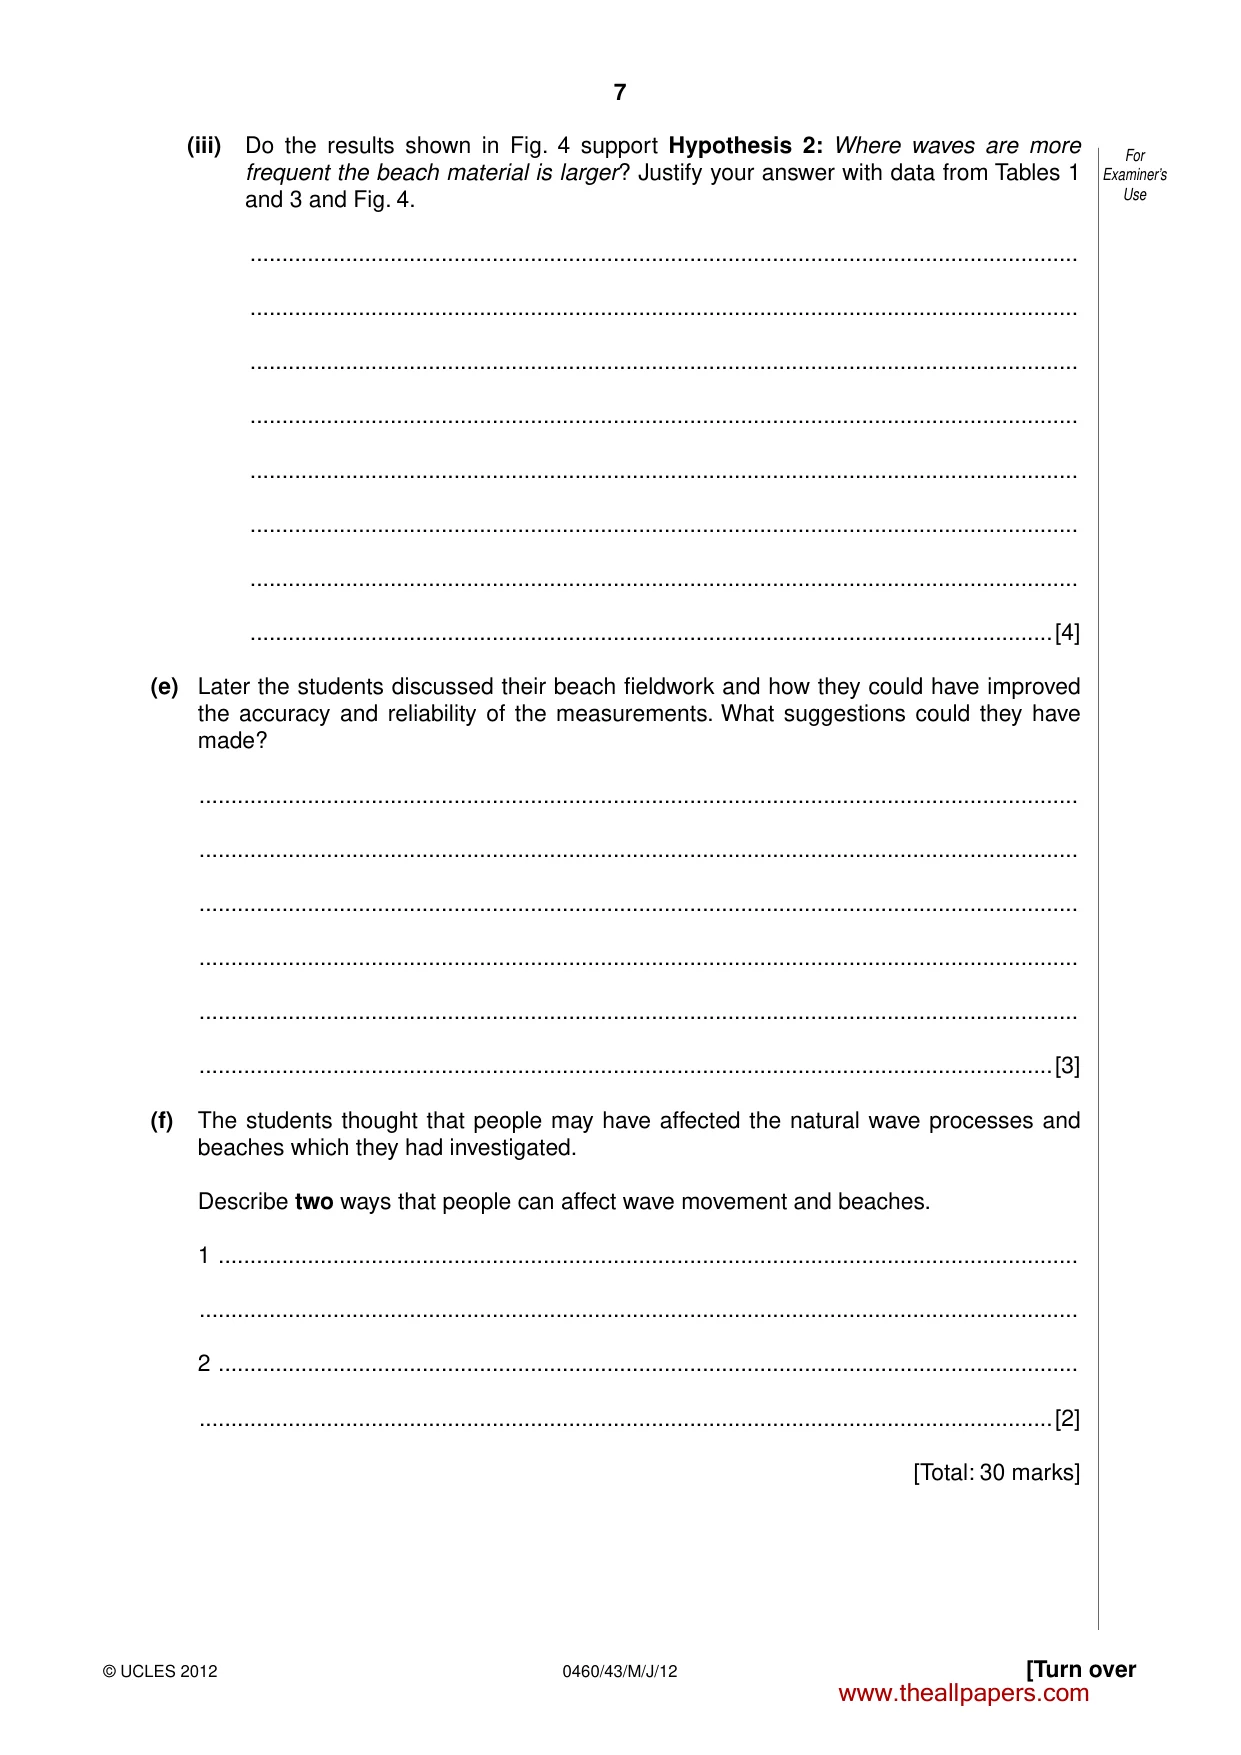
7 [Turn over © UCLES 2012 0460/43/M/J/12 For Examiner’s Use (iii) Do the results shown in Fig. 4 support Hypothesis 2: Where waves are more frequent the beach material is larger? Justify your answer with data from Tables 1 and 3 and Fig. 4. … … … … … … … …[4] (e) Later the students discussed their beach fieldwork and how they could have improved the accuracy and reliability of the measurements. What suggestions could they have made? … … … … … …[3] (f) The students thought that people may have affected the natural wave processes and beaches which they had investigated. Describe two ways that people can affect wave movement and beaches. 1 … … 2 … …[2] [Total: 30 marks] www.theallpapers.com
Question paper, page 8
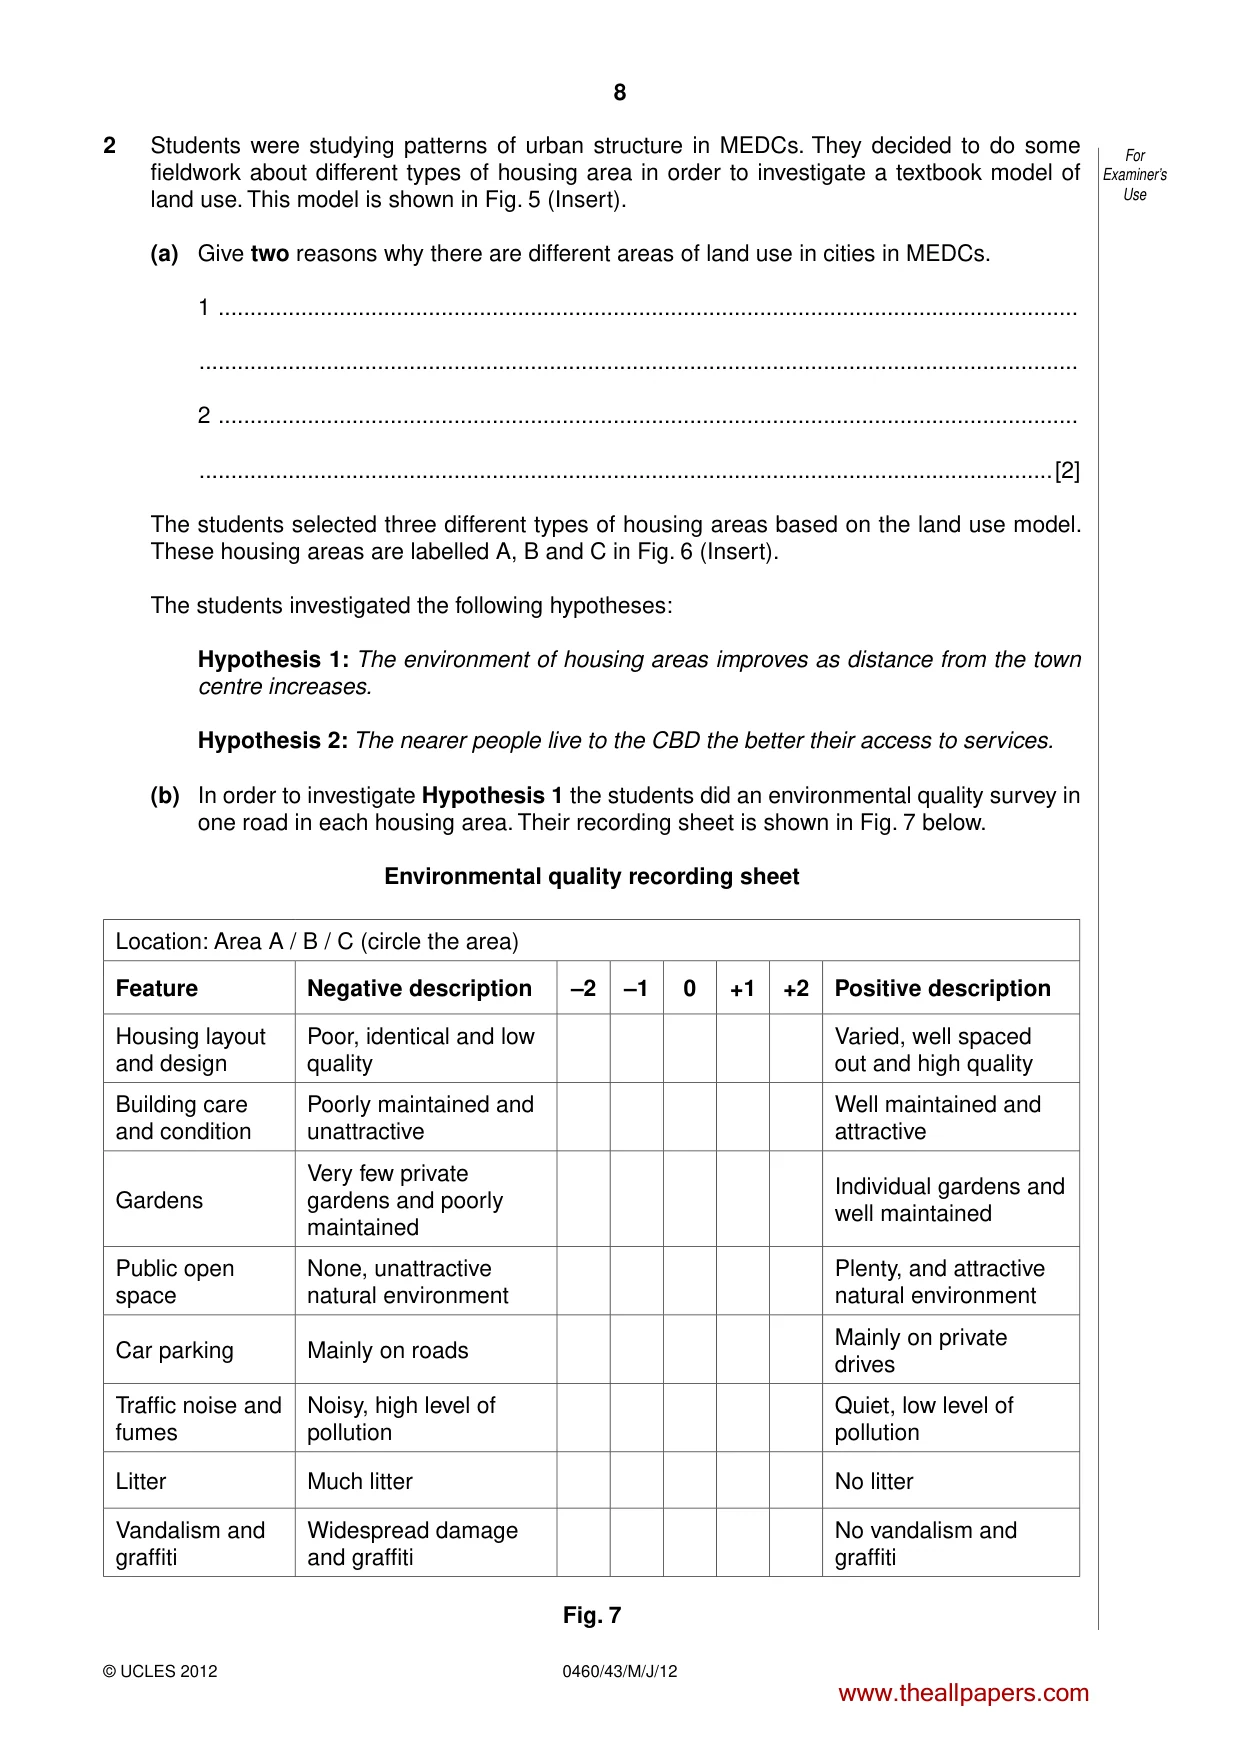
8 0460/43/M/J/12 © UCLES 2012 For Examiner’s Use 2 Students were studying patterns of urban structure in MEDCs. They decided to do some fieldwork about different types of housing area in order to investigate a textbook model of land use. This model is shown in Fig. 5 (Insert). (a) Give two reasons why there are different areas of land use in cities in MEDCs. 1 … … 2 … …[2] The students selected three different types of housing areas based on the land use model. These housing areas are labelled A, B and C in Fig. 6 (Insert). The students investigated the following hypotheses: Hypothesis 1: The environment of housing areas improves as distance from the town centre increases. Hypothesis 2: The nearer people live to the CBD the better their access to services. (b) In order to investigate Hypothesis 1 the students did an environmental quality survey in one road in each housing area. Their recording sheet is shown in Fig. 7 below. Environmental quality recording sheet Location: Area A / B / C (circle the area) Feature Negative description –2 –1 0 +1 +2 Positive description Housing layout and design Poor, identical and low quality Varied, well spaced out and high quality Building care and condition Poorly maintained and unattractive Well maintained and attractive Gardens Very few private gardens and poorly maintained Individual gardens and well maintained Public open space None, unattractive natural environment Plenty, and attractive natural environment Car parking Mainly on roads Mainly on private drives Traffic noise and fumes Noisy, high level of pollution Quiet, low level of pollution Litter Much litter No litter Vandalism and graffiti Widespread damage and graffiti No vandalism and graffiti Fig. 7 www.theallpapers.com
Question paper, page 9
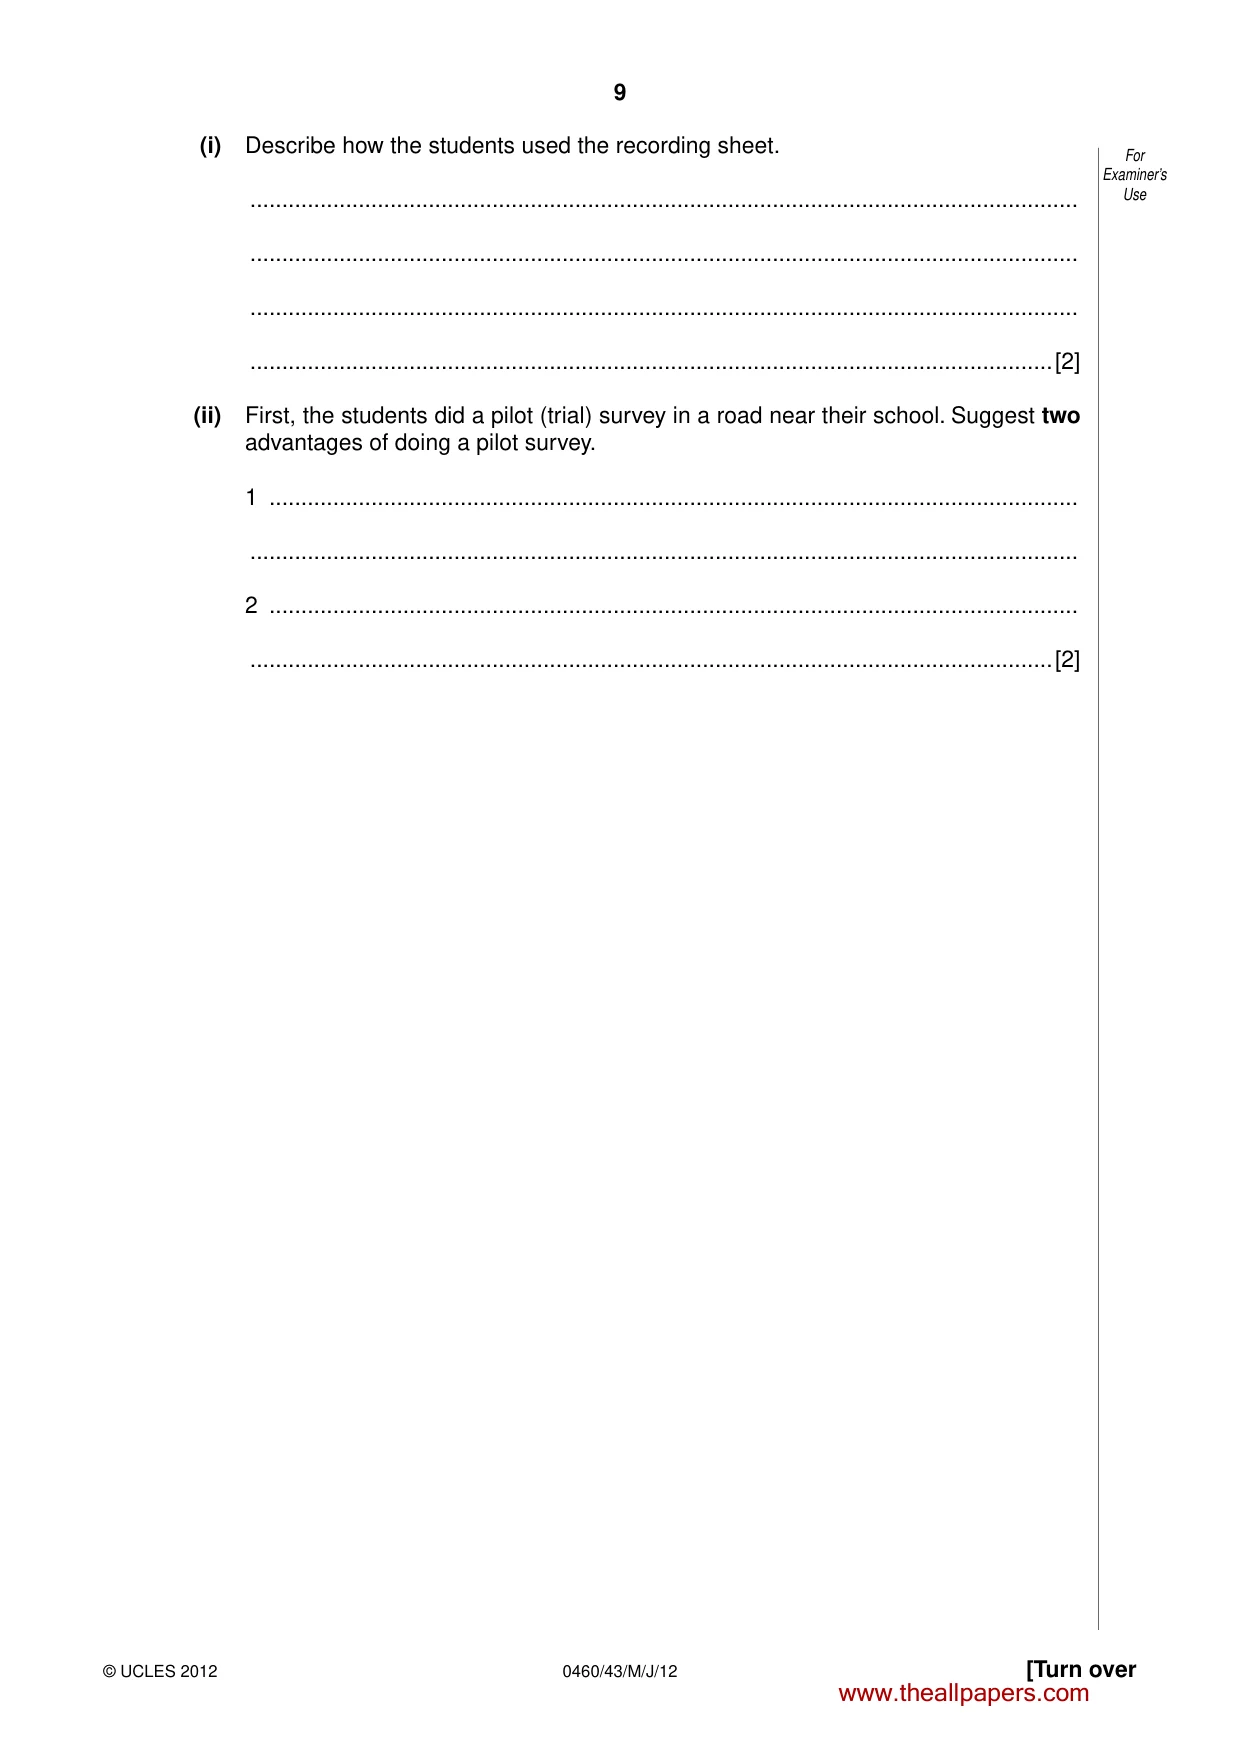
9 [Turn over © UCLES 2012 0460/43/M/J/12 For Examiner’s Use (i) Describe how the students used the recording sheet. … … … …[2] (ii) First, the students did a pilot (trial) survey in a road near their school. Suggest two advantages of doing a pilot survey. 1 … … 2 … …[2] www.theallpapers.com
Question paper, page 10
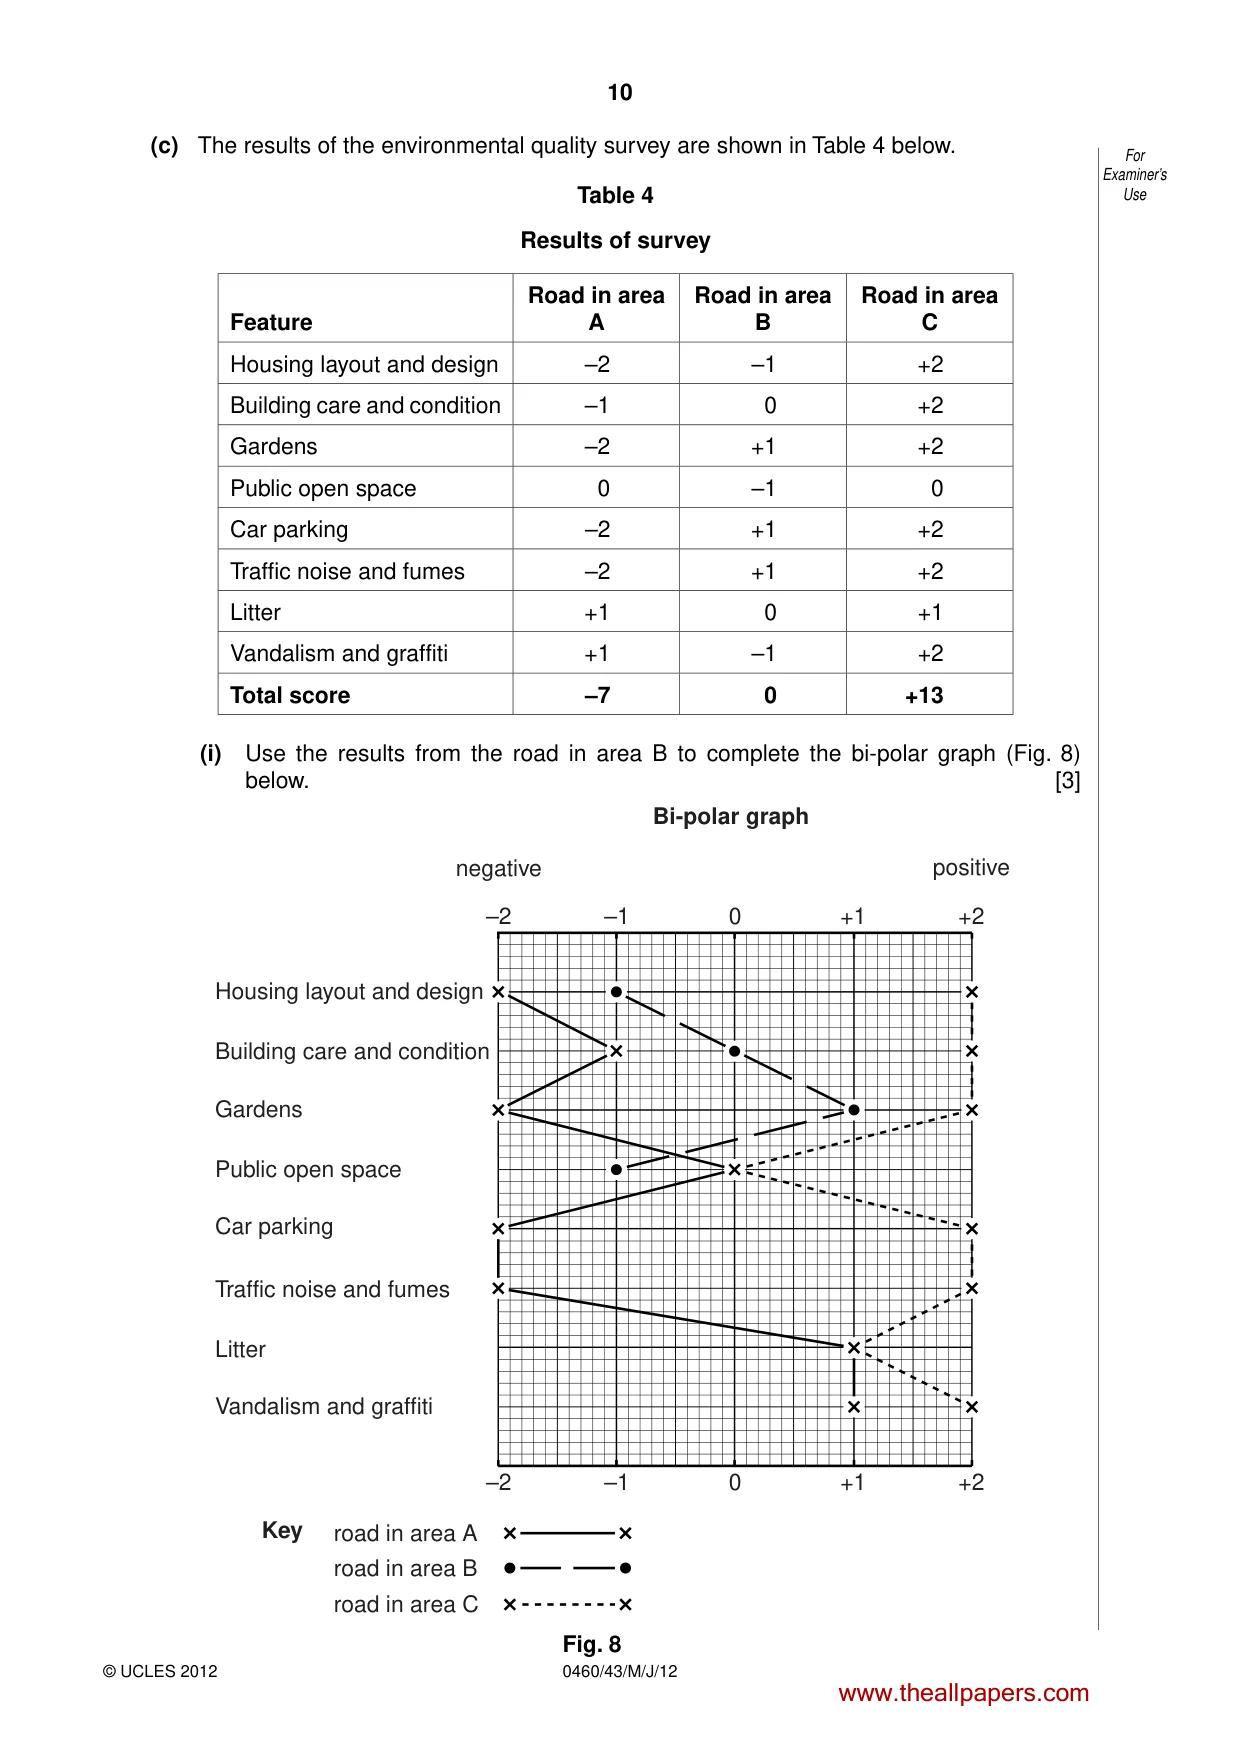
10 0460/43/M/J/12 © UCLES 2012 For Examiner’s Use (c) The results of the environmental quality survey are shown in Table 4 below. Table 4 Results of survey Feature Road in area A Road in area B Road in area C Housing layout and design –2 –1 +2 Building care and condition –1 0 +2 Gardens –2 +1 +2 Public open space 0 –1 0 Car parking –2 +1 +2 Traffic noise and fumes –2 +1 +2 Litter +1 0 +1 Vandalism and graffiti +1 –1 +2 Total score –7 0 +13 (i) Use the results from the road in area B to complete the bi-polar graph (Fig. 8) below. [3] –2 –1 0 +1 +2 –2 –1 0 +1 +2 negative Bi-polar graph Housing layout and design Building care and condition Gardens Public open space Car parking Traffic noise and fumes Litter road in area A road in area B road in area C Vandalism and graffiti Key positive Fig. 8 www.theallpapers.com
Question paper, page 11
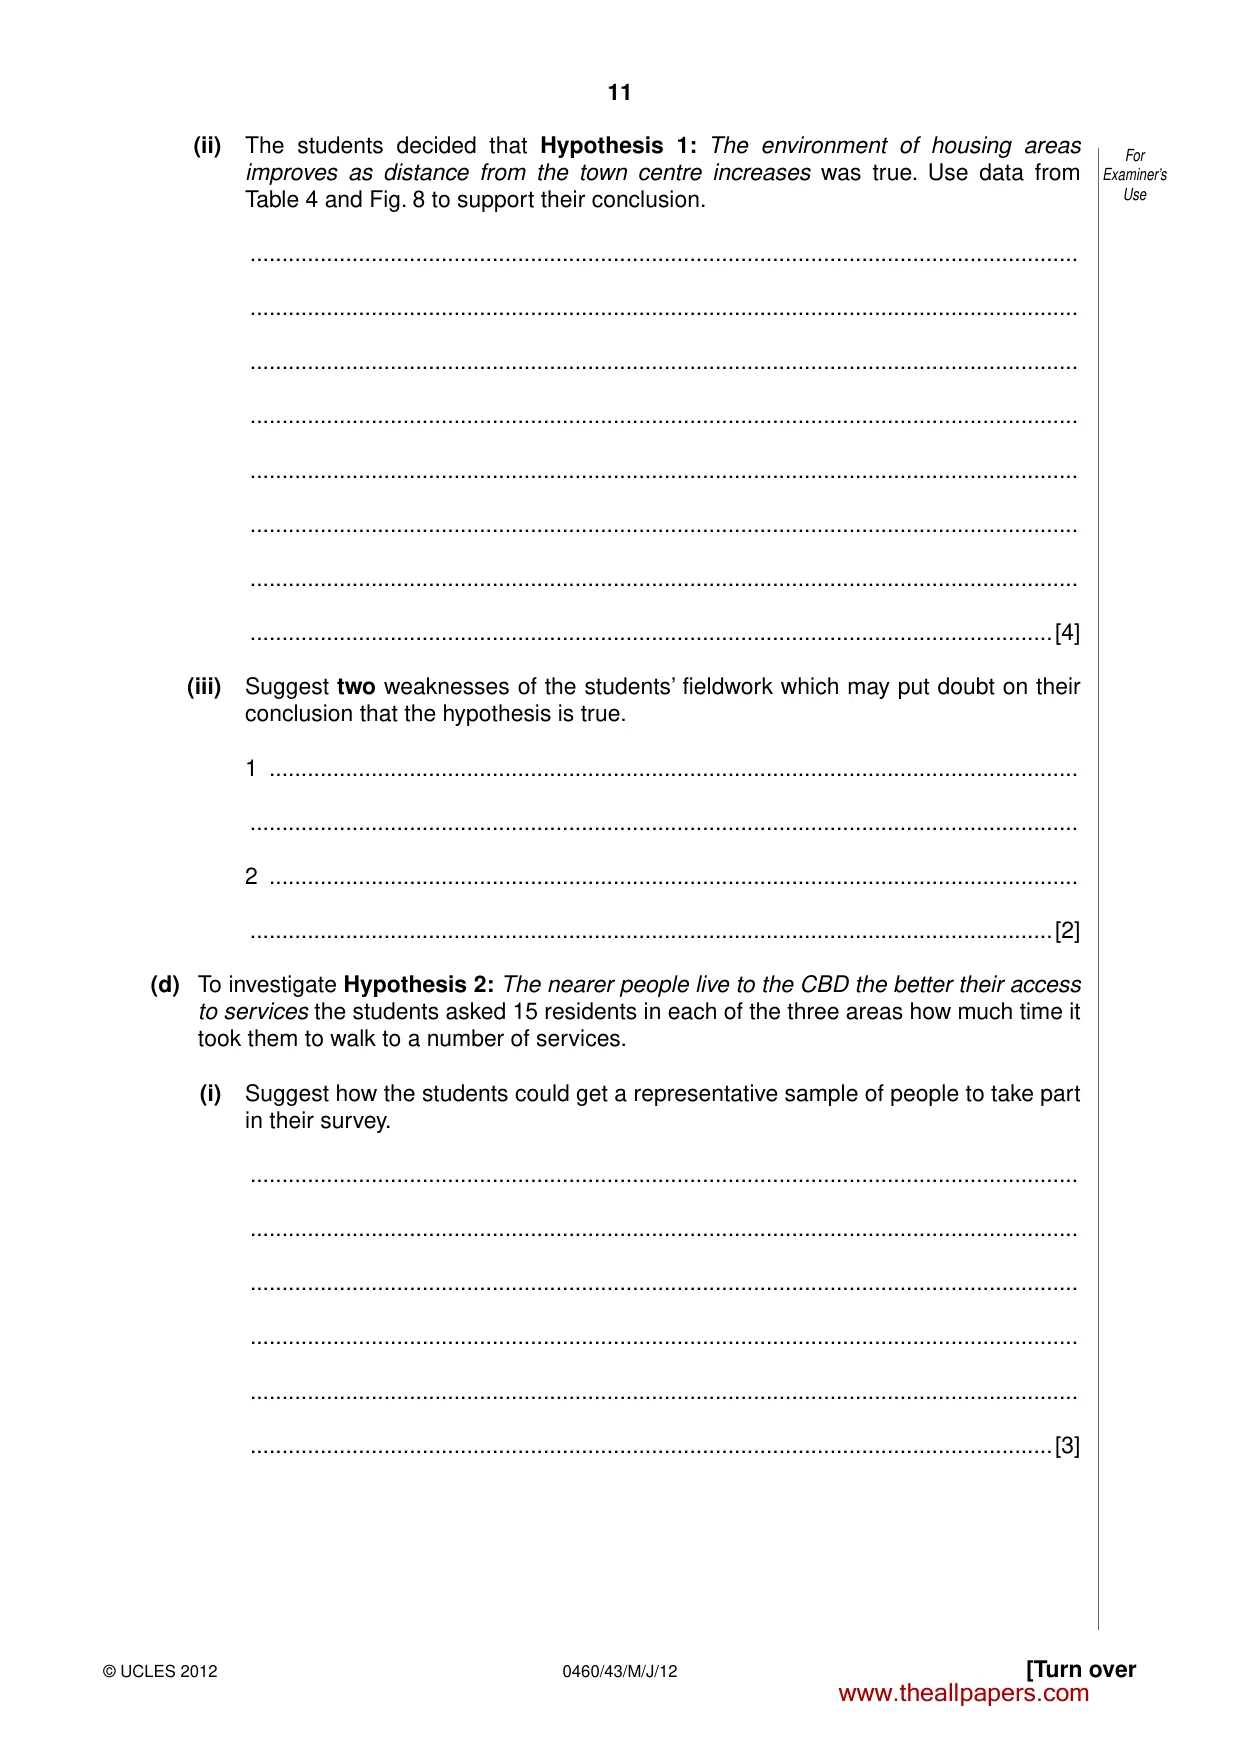
11 © UCLES 2012 0460/43/M/J/12 For Examiner’s Use [Turn over (ii) The students decided that Hypothesis 1: The environment of housing areas improves as distance from the town centre increases was true. Use data from Table 4 and Fig. 8 to support their conclusion. … … … … … … … …[4] (iii) Suggest two weaknesses of the students’ fieldwork which may put doubt on their conclusion that the hypothesis is true. 1 … … 2 … …[2] (d) To investigate Hypothesis 2: The nearer people live to the CBD the better their access to services the students asked 15 residents in each of the three areas how much time it took them to walk to a number of services. (i) Suggest how the students could get a representative sample of people to take part in their survey. … … … … … …[3] www.theallpapers.com
Question paper, page 12
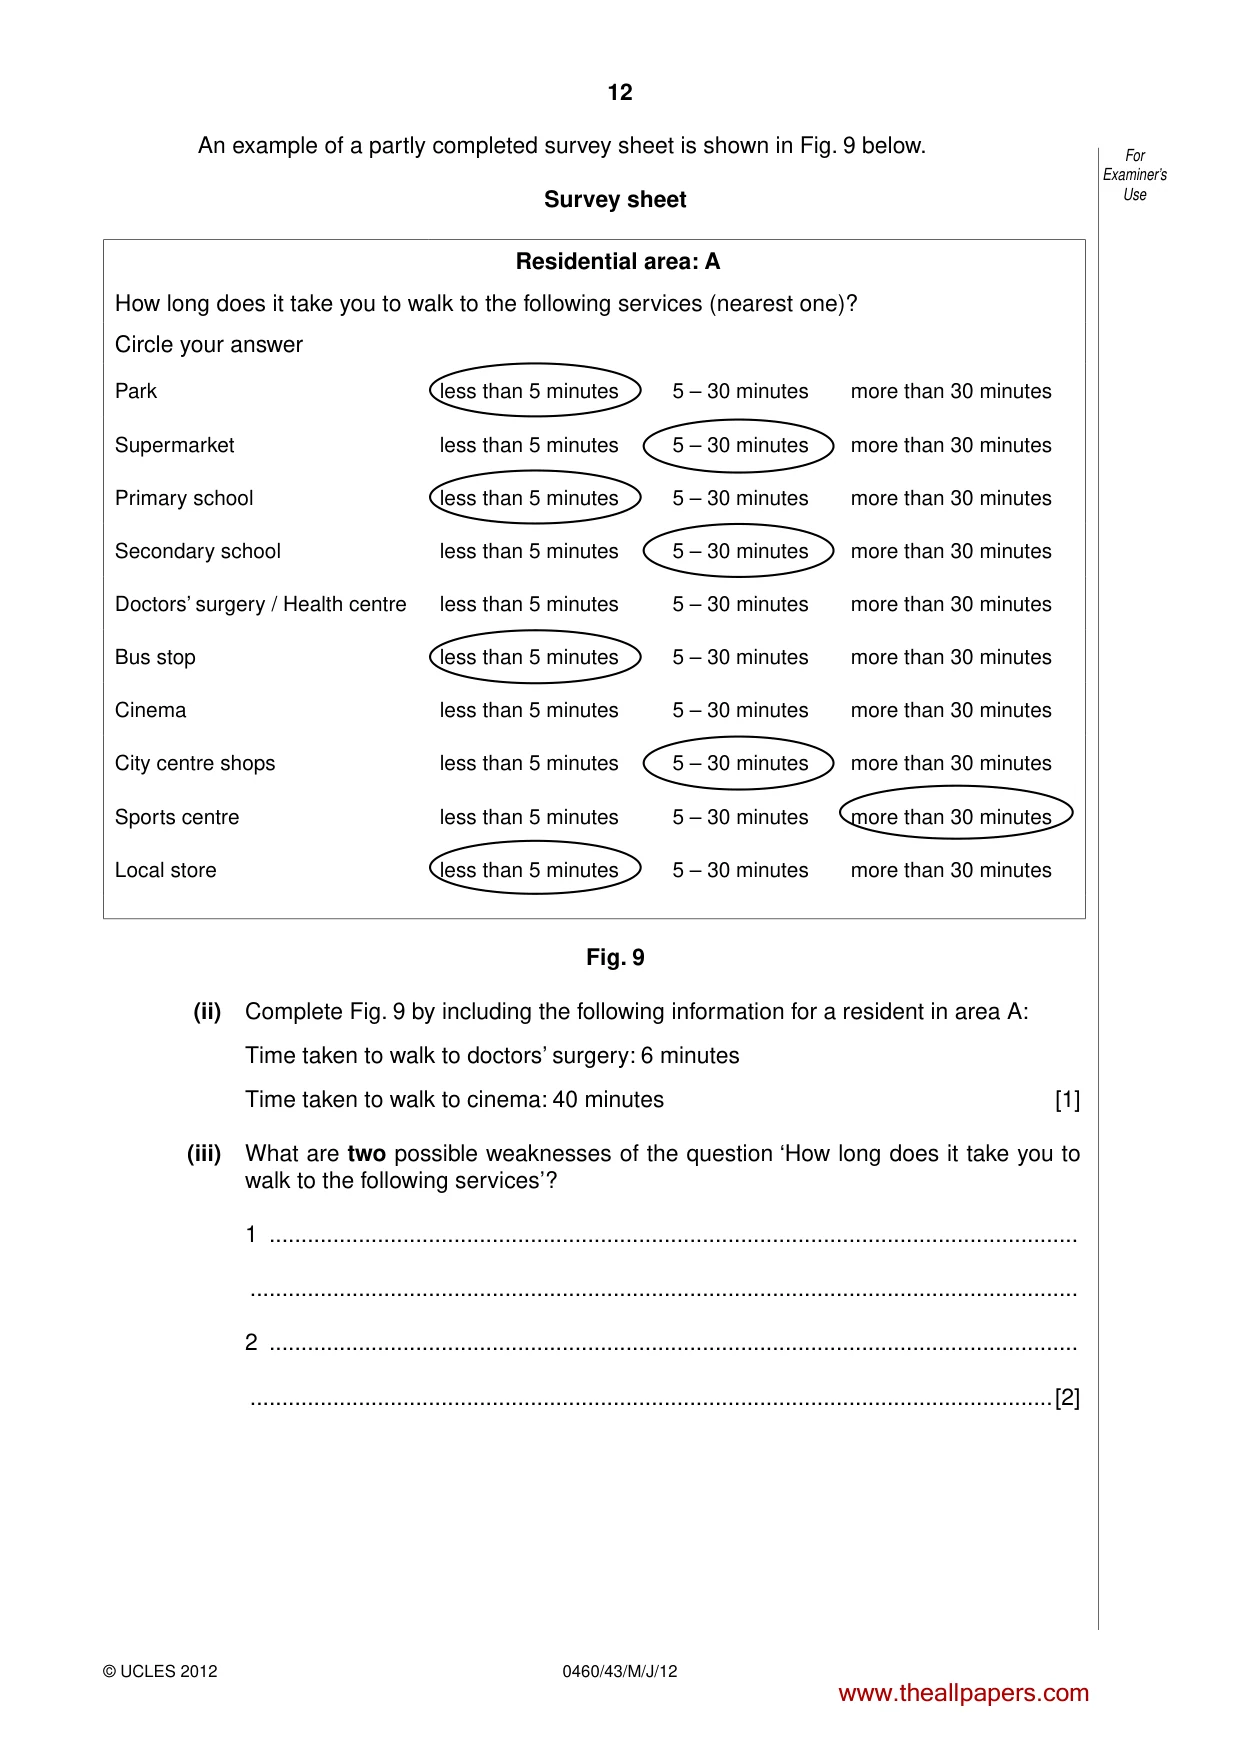
12 0460/43/M/J/12 © UCLES 2012 For Examiner’s Use An example of a partly completed survey sheet is shown in Fig. 9 below. Survey sheet Residential area: A How long does it take you to walk to the following services (nearest one)? Circle your answer Park less than 5 minutes 5 – 30 minutes more than 30 minutes Supermarket less than 5 minutes 5 – 30 minutes more than 30 minutes Primary school less than 5 minutes 5 – 30 minutes more than 30 minutes Secondary school less than 5 minutes 5 – 30 minutes more than 30 minutes Doctors’ surgery / Health centre less than 5 minutes 5 – 30 minutes more than 30 minutes Bus stop less than 5 minutes 5 – 30 minutes more than 30 minutes Cinema less than 5 minutes 5 – 30 minutes more than 30 minutes City centre shops less than 5 minutes 5 – 30 minutes more than 30 minutes Sports centre less than 5 minutes 5 – 30 minutes more than 30 minutes Local store less than 5 minutes 5 – 30 minutes more than 30 minutes Fig. 9 (ii) Complete Fig. 9 by including the following information for a resident in area A: Time taken to walk to doctors’ surgery: 6 minutes Time taken to walk to cinema: 40 minutes [1] (iii) What are two possible weaknesses of the question ‘How long does it take you to walk to the following services’? 1 … … 2 … …[2] www.theallpapers.com
Question paper, page 13
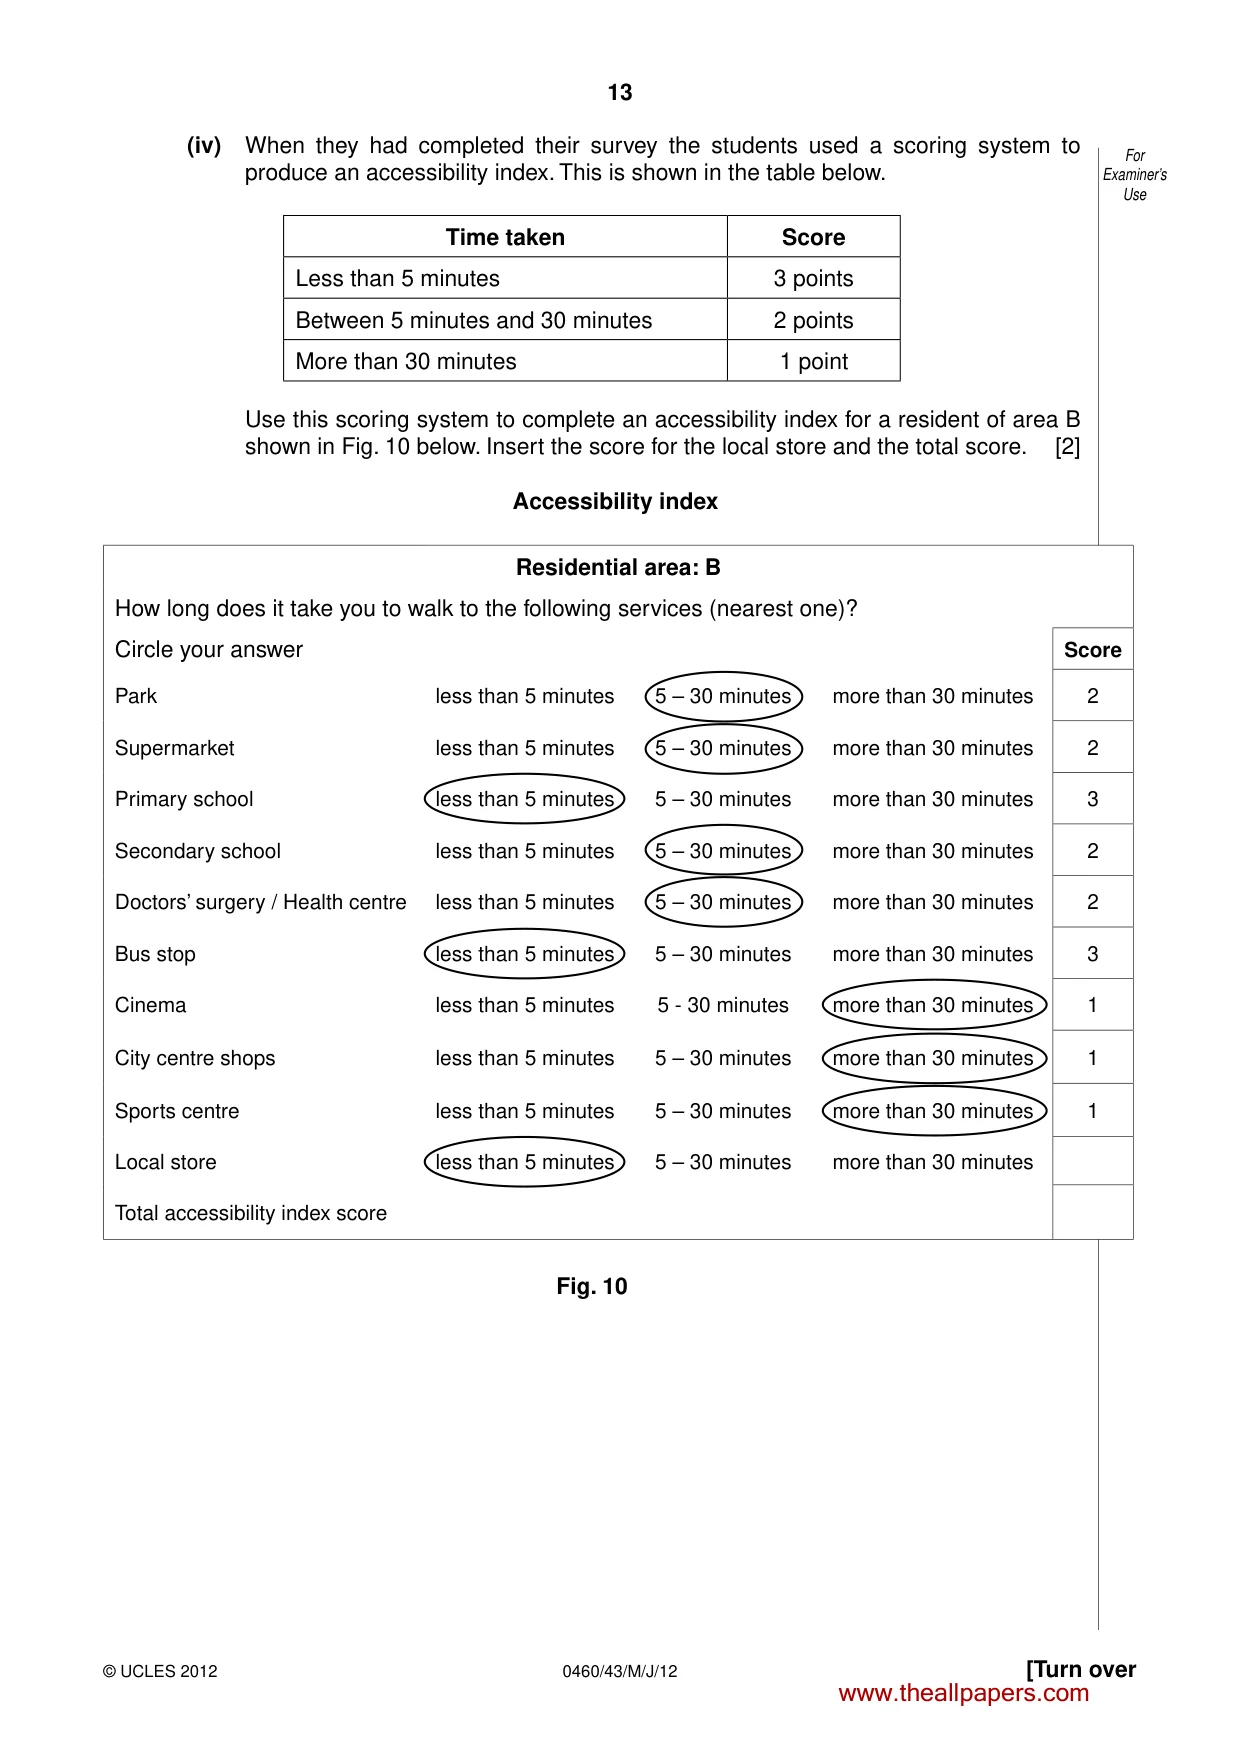
13 © UCLES 2012 0460/43/M/J/12 For Examiner’s Use [Turn over (iv) When they had completed their survey the students used a scoring system to produce an accessibility index. This is shown in the table below. Time taken Score Less than 5 minutes 3 points Between 5 minutes and 30 minutes 2 points More than 30 minutes 1 point Use this scoring system to complete an accessibility index for a resident of area B shown in Fig. 10 below. Insert the score for the local store and the total score. [2] Accessibility index Residential area: B How long does it take you to walk to the following services (nearest one)? Circle your answer Score Park less than 5 minutes 5 – 30 minutes more than 30 minutes 2 Supermarket less than 5 minutes 5 – 30 minutes more than 30 minutes 2 Primary school less than 5 minutes 5 – 30 minutes more than 30 minutes 3 Secondary school less than 5 minutes 5 – 30 minutes more than 30 minutes 2 Doctors’ surgery / Health centre less than 5 minutes 5 – 30 minutes more than 30 minutes 2 Bus stop less than 5 minutes 5 – 30 minutes more than 30 minutes 3 Cinema less than 5 minutes 5 - 30 minutes more than 30 minutes 1 City centre shops less than 5 minutes 5 – 30 minutes more than 30 minutes 1 Sports centre less than 5 minutes 5 – 30 minutes more than 30 minutes 1 Local store less than 5 minutes 5 – 30 minutes more than 30 minutes Total accessibility index score Fig. 10 www.theallpapers.com
Question paper, page 14
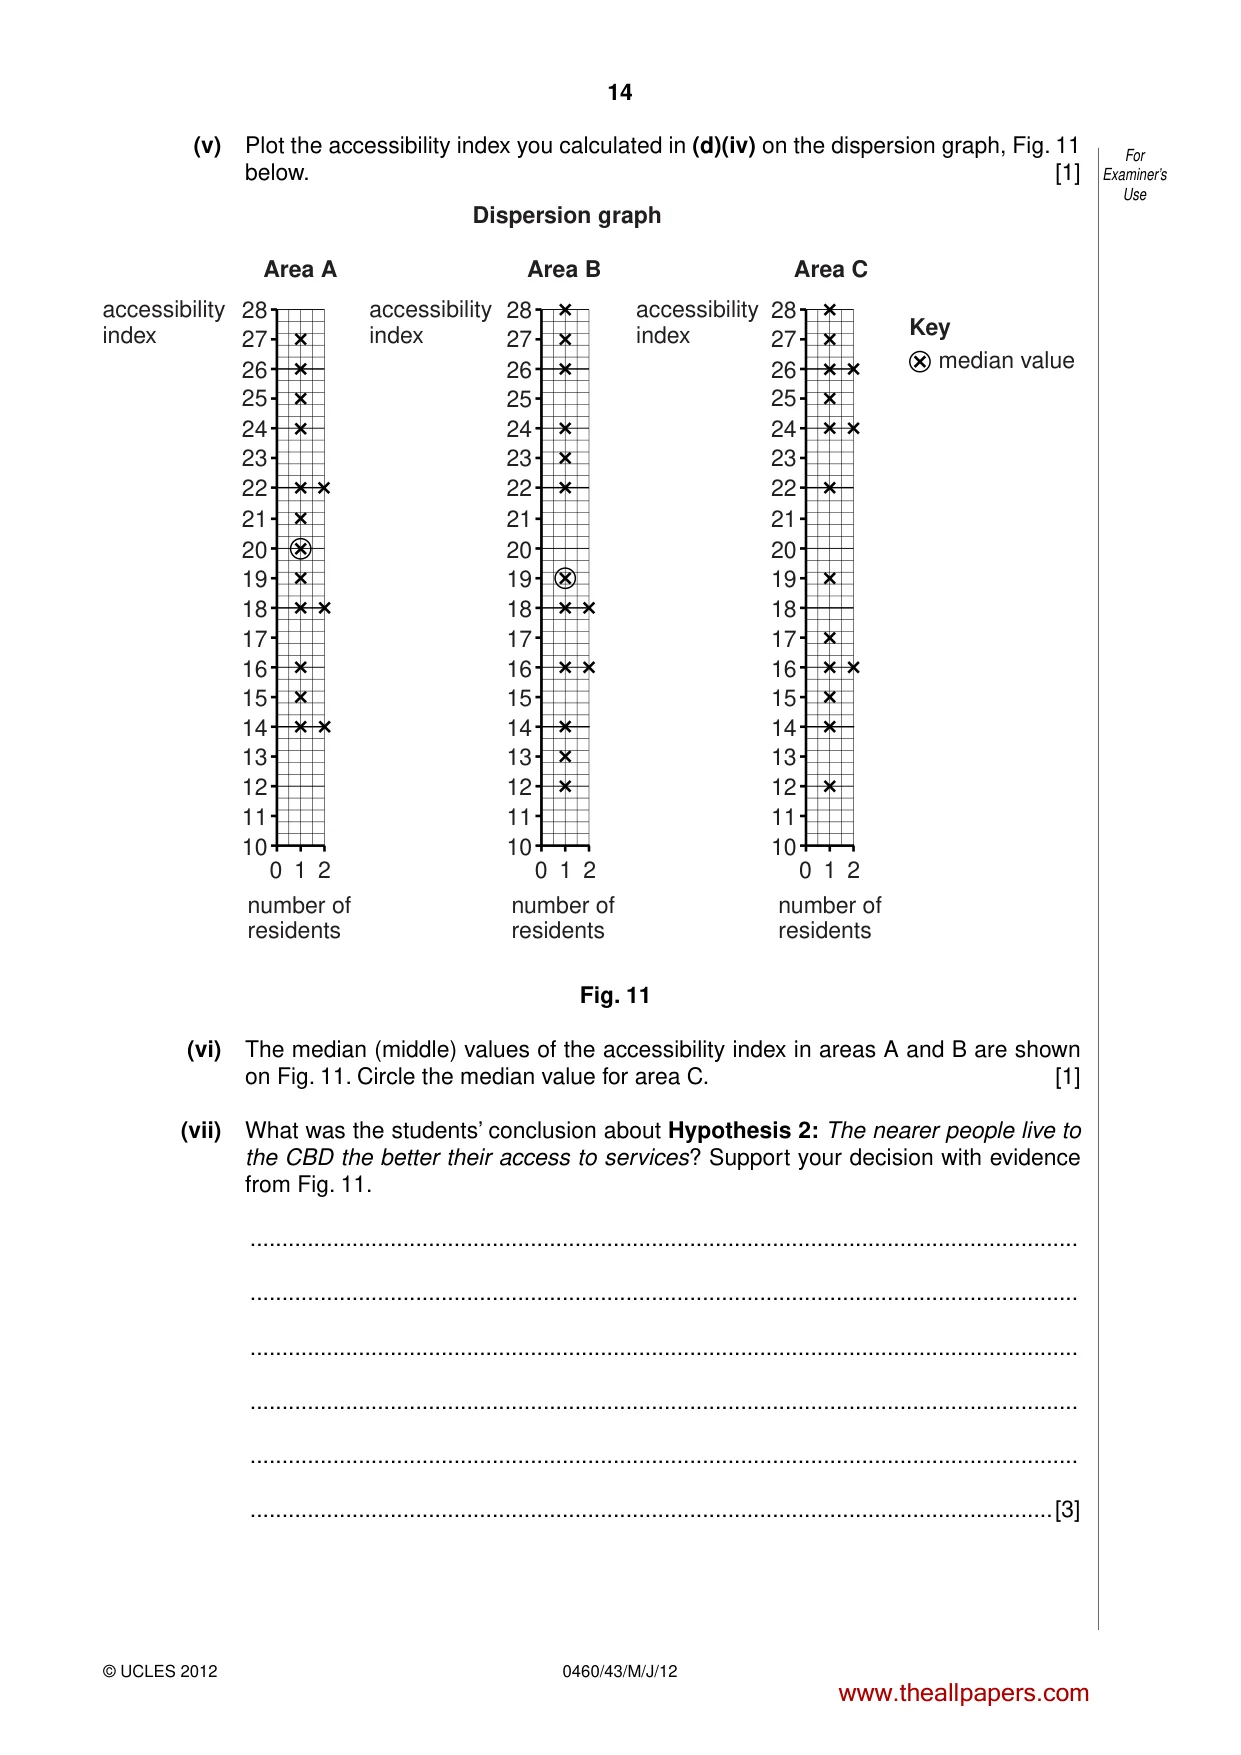
14 0460/43/M/J/12 © UCLES 2012 For Examiner’s Use (v) Plot the accessibility index you calculated in (d)(iv) on the dispersion graph, Fig. 11 below. [1] 10 11 12 13 14 15 16 17 18 19 20 21 22 23 24 25 26 27 28 10 number of residents number of residents number of residents Area B Dispersion graph accessibility index accessibility index accessibility index Key median value Area A Area C 11 12 13 14 15 16 17 18 19 20 21 22 23 24 25 26 27 28 10 0 1 2 0 1 2 0 1 2 11 12 13 14 15 16 17 18 19 20 21 22 23 24 25 26 27 28 Fig. 11 (vi) The median (middle) values of the accessibility index in areas A and B are shown on Fig. 11. Circle the median value for area C. [1] (vii) What was the students’ conclusion about Hypothesis 2: The nearer people live to the CBD the better their access to services? Support your decision with evidence from Fig. 11. … … … … … …[3] www.theallpapers.com
Question paper, page 15
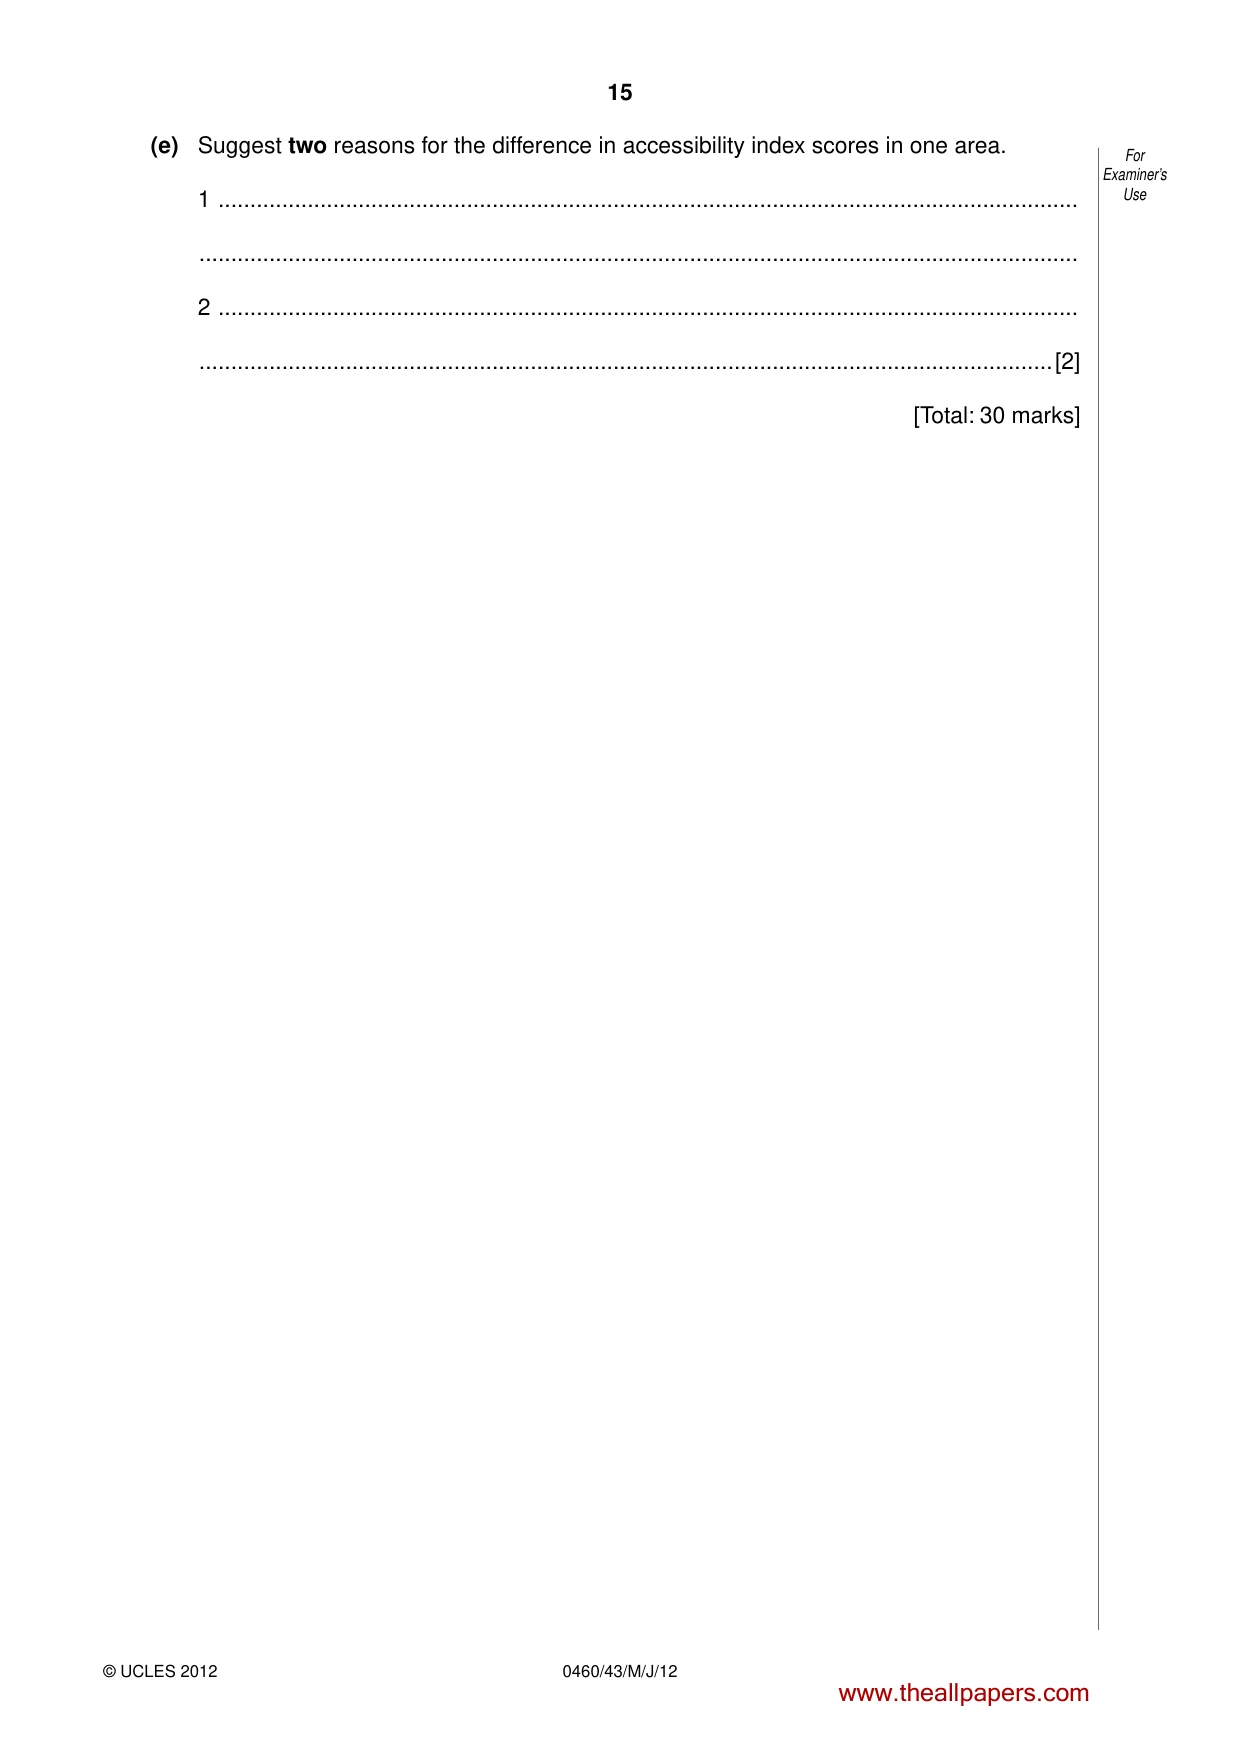
15 © UCLES 2012 0460/43/M/J/12 For Examiner’s Use (e) Suggest two reasons for the difference in accessibility index scores in one area. 1 … … 2 … …[2] [Total: 30 marks] www.theallpapers.com
Question paper, page 16
16 0460/43/M/J/12 © UCLES 2012 Copyright Acknowledgements: Permission to reproduce items where third-party owned material protected by copyright is included has been sought and cleared where possible. Every reasonable effort has been made by the publisher (UCLES) to trace copyright holders, but if any items requiring clearance have unwittingly been included, the publisher will be pleased to make amends at the earliest possible opportunity. University of Cambridge International Examinations is part of the Cambridge Assessment Group. Cambridge Assessment is the brand name of University of Cambridge Local Examinations Syndicate (UCLES), which is itself a department of the University of Cambridge. BLANK PAGE www.theallpapers.com
Mark scheme, page 1
UNIVERSITY OF CAMBRIDGE INTERNATIONAL EXAMINATIONS International General Certificate of Secondary Education MARK SCHEME for the May/June 2012 question paper for the guidance of teachers 0460 GEOGRAPHY 0460/43 Paper 4 (Alternative to Coursework), maximum raw mark 60 This mark scheme is published as an aid to teachers and candidates, to indicate the requirements of the examination. It shows the basis on which Examiners were instructed to award marks. It does not indicate the details of the discussions that took place at an Examiners’ meeting before marking began, which would have considered the acceptability of alternative answers. Mark schemes must be read in conjunction with the question papers and the report on the examination. • Cambridge will not enter into discussions or correspondence in connection with these mark schemes. Cambridge is publishing the mark schemes for the May/June 2012 question papers for most IGCSE, GCE Advanced Level and Advanced Subsidiary Level syllabuses and some Ordinary Level syllabuses. www.theallpapers.com
Mark scheme, page 2
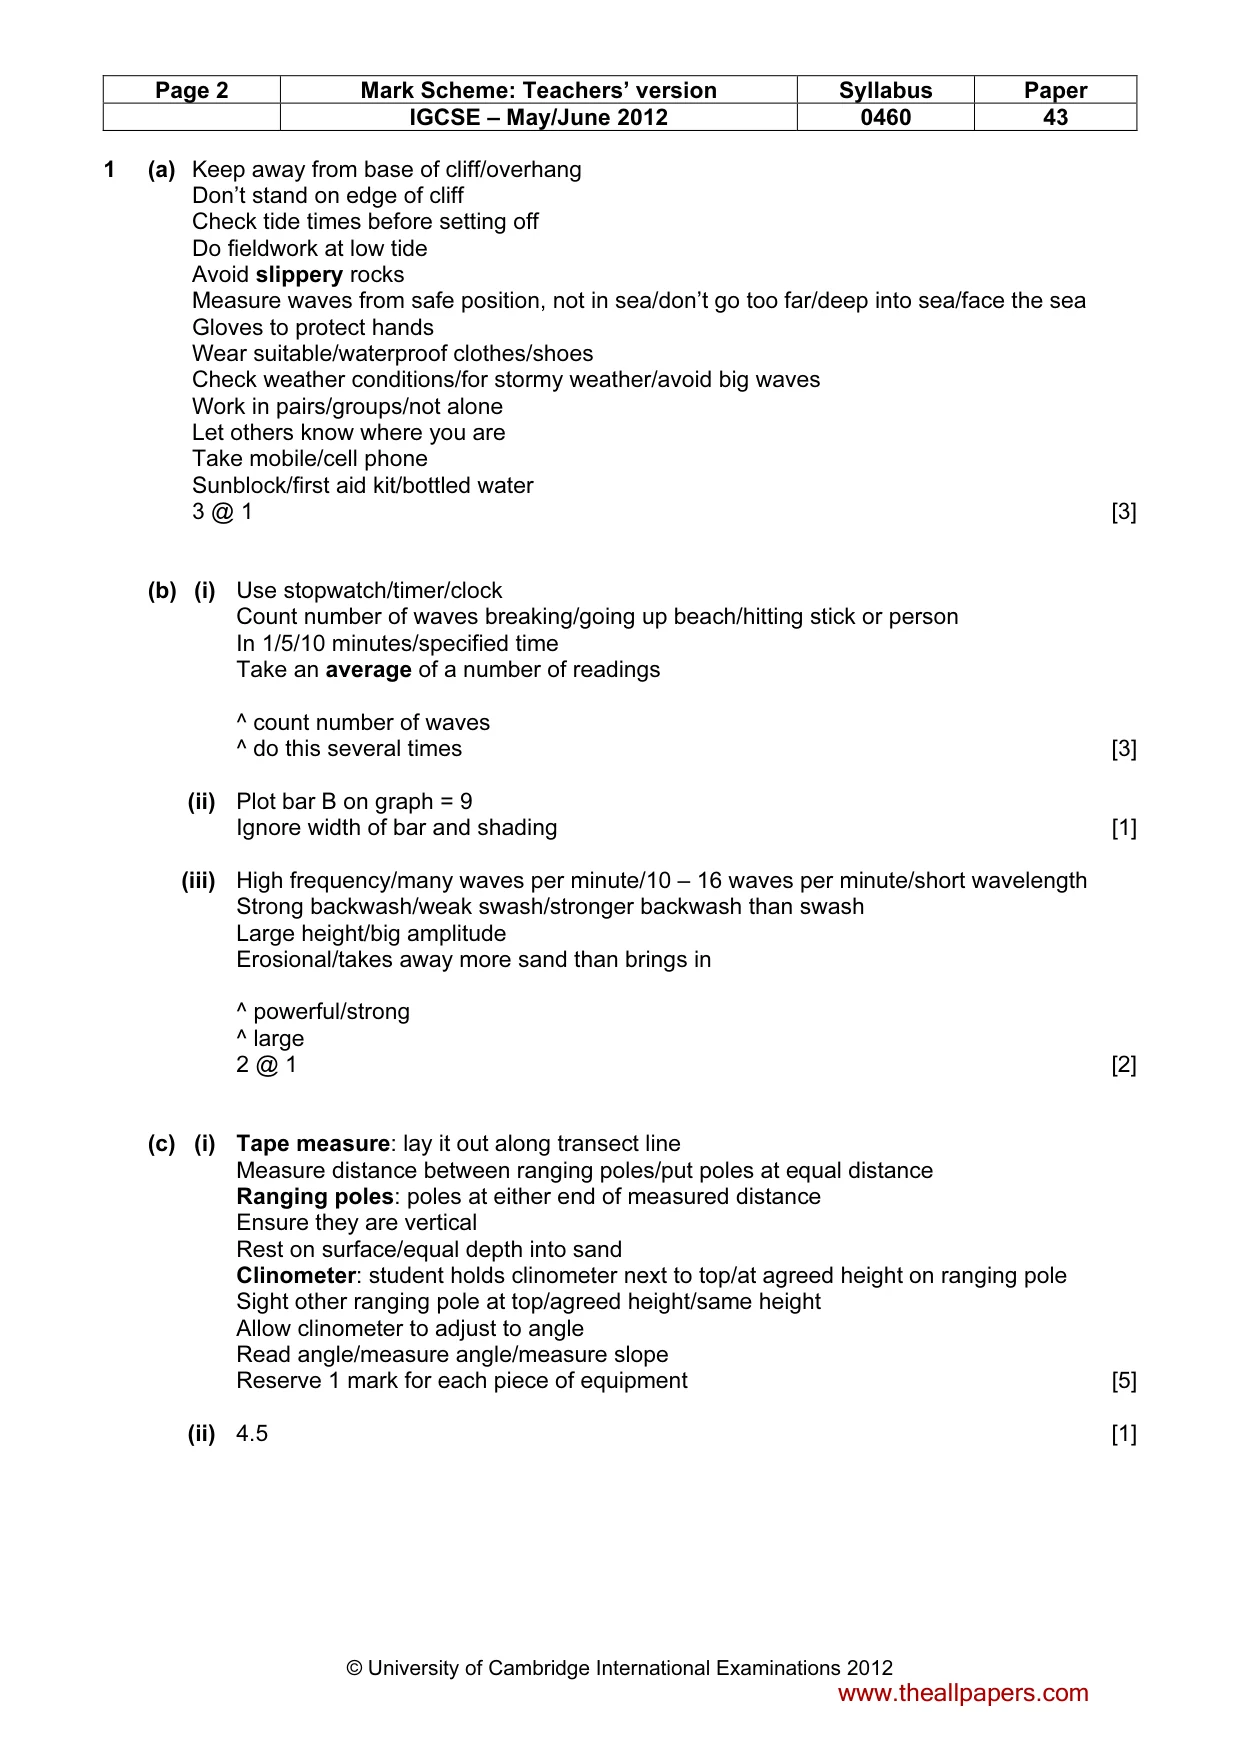
Page 2 Mark Scheme: Teachers’ version Syllabus Paper IGCSE – May/June 2012 0460 43 © University of Cambridge International Examinations 2012 1 (a) Keep away from base of cliff/overhang Don’t stand on edge of cliff Check tide times before setting off Do fieldwork at low tide Avoid slippery rocks Measure waves from safe position, not in sea/don’t go too far/deep into sea/face the sea Gloves to protect hands Wear suitable/waterproof clothes/shoes Check weather conditions/for stormy weather/avoid big waves Work in pairs/groups/not alone Let others know where you are Take mobile/cell phone Sunblock/first aid kit/bottled water 3 @ 1 [3] (b) (i) Use stopwatch/timer/clock Count number of waves breaking/going up beach/hitting stick or person In 1/5/10 minutes/specified time Take an average of a number of readings ^ count number of waves ^ do this several times [3] (ii) Plot bar B on graph = 9 Ignore width of bar and shading [1] (iii) High frequency/many waves per minute/10 – 16 waves per minute/short wavelength Strong backwash/weak swash/stronger backwash than swash Large height/big amplitude Erosional/takes away more sand than brings in ^ powerful/strong ^ large 2 @ 1 [2] (c) (i) Tape measure: lay it out along transect line Measure distance between ranging poles/put poles at equal distance Ranging poles: poles at either end of measured distance Ensure they are vertical Rest on surface/equal depth into sand Clinometer: student holds clinometer next to top/at agreed height on ranging pole Sight other ranging pole at top/agreed height/same height Allow clinometer to adjust to angle Read angle/measure angle/measure slope Reserve 1 mark for each piece of equipment [5] (ii) 4.5 [1] www.theallpapers.com
Mark scheme, page 3
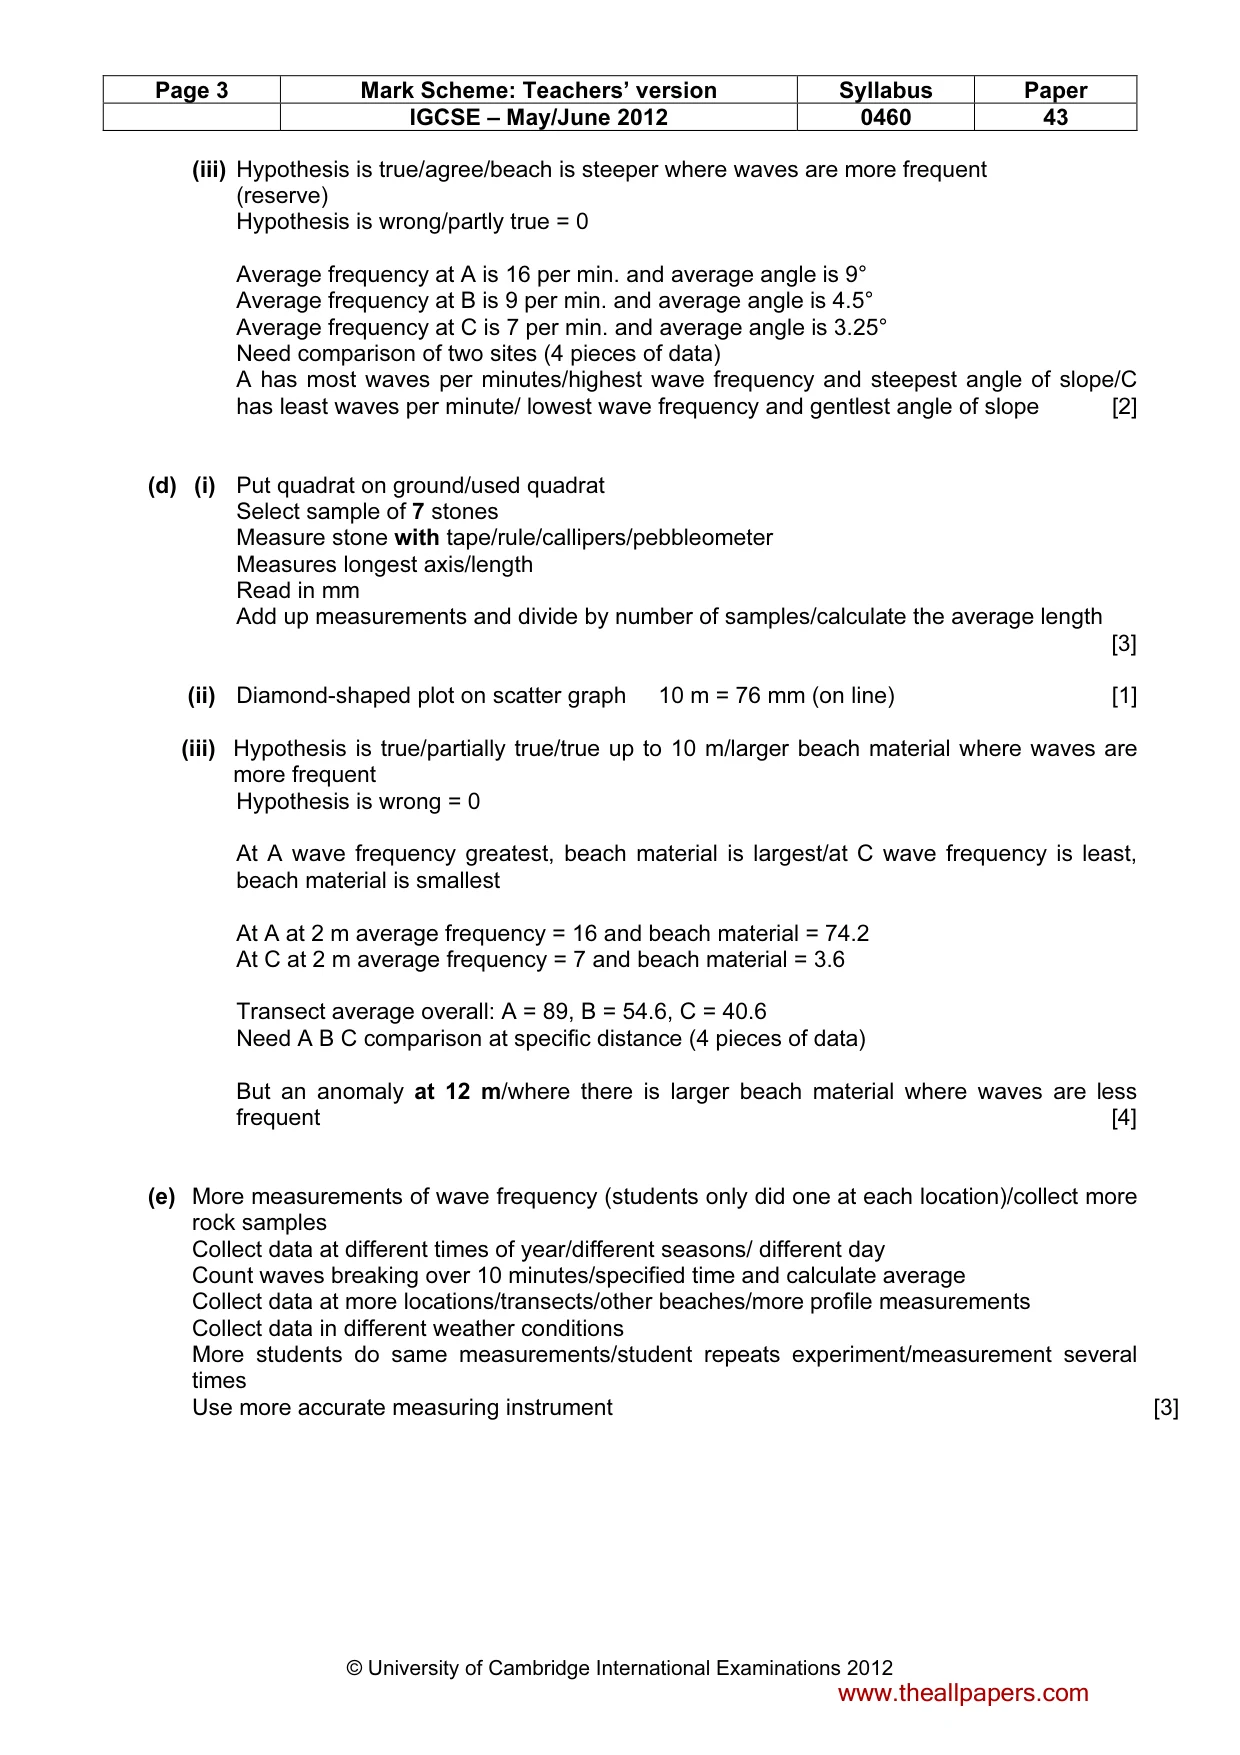
Page 3 Mark Scheme: Teachers’ version Syllabus Paper IGCSE – May/June 2012 0460 43 © University of Cambridge International Examinations 2012 (iii) Hypothesis is true/agree/beach is steeper where waves are more frequent (reserve) Hypothesis is wrong/partly true = 0 Average frequency at A is 16 per min. and average angle is 9° Average frequency at B is 9 per min. and average angle is 4.5° Average frequency at C is 7 per min. and average angle is 3.25° Need comparison of two sites (4 pieces of data) A has most waves per minutes/highest wave frequency and steepest angle of slope/C has least waves per minute/ lowest wave frequency and gentlest angle of slope [2] (d) (i) Put quadrat on ground/used quadrat Select sample of 7 stones Measure stone with tape/rule/callipers/pebbleometer Measures longest axis/length Read in mm Add up measurements and divide by number of samples/calculate the average length [3] (ii) Diamond-shaped plot on scatter graph 10 m = 76 mm (on line) [1] (iii) Hypothesis is true/partially true/true up to 10 m/larger beach material where waves are more frequent Hypothesis is wrong = 0 At A wave frequency greatest, beach material is largest/at C wave frequency is least, beach material is smallest At A at 2 m average frequency = 16 and beach material = 74.2 At C at 2 m average frequency = 7 and beach material = 3.6 Transect average overall: A = 89, B = 54.6, C = 40.6 Need A B C comparison at specific distance (4 pieces of data) But an anomaly at 12 m/where there is larger beach material where waves are less frequent [4] (e) More measurements of wave frequency (students only did one at each location)/collect more rock samples Collect data at different times of year/different seasons/ different day Count waves breaking over 10 minutes/specified time and calculate average Collect data at more locations/transects/other beaches/more profile measurements Collect data in different weather conditions More students do same measurements/student repeats experiment/measurement several times Use more accurate measuring instrument [3] www.theallpapers.com
Mark scheme, page 4
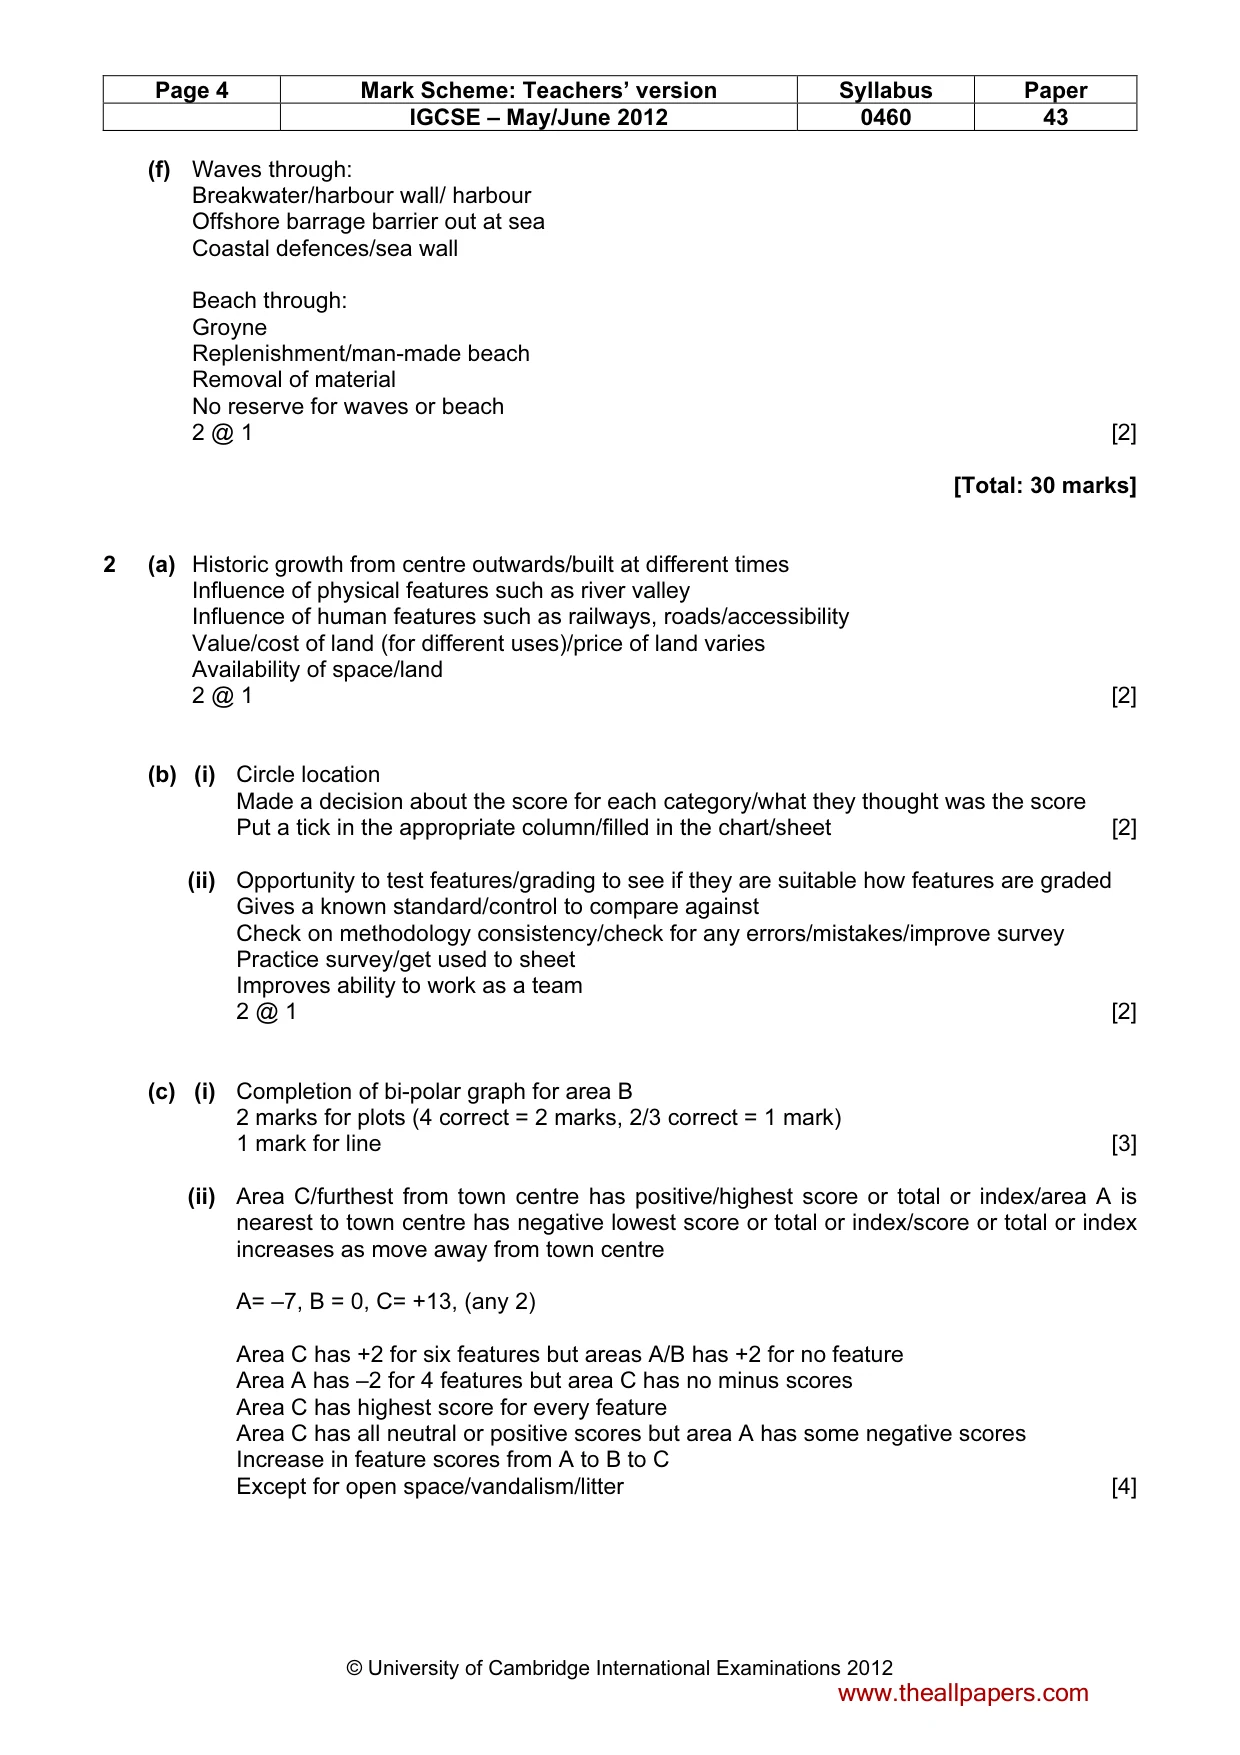
Page 4 Mark Scheme: Teachers’ version Syllabus Paper IGCSE – May/June 2012 0460 43 © University of Cambridge International Examinations 2012 (f) Waves through: Breakwater/harbour wall/ harbour Offshore barrage barrier out at sea Coastal defences/sea wall Beach through: Groyne Replenishment/man-made beach Removal of material No reserve for waves or beach 2 @ 1 [2] [Total: 30 marks] 2 (a) Historic growth from centre outwards/built at different times Influence of physical features such as river valley Influence of human features such as railways, roads/accessibility Value/cost of land (for different uses)/price of land varies Availability of space/land 2 @ 1 [2] (b) (i) Circle location Made a decision about the score for each category/what they thought was the score Put a tick in the appropriate column/filled in the chart/sheet [2] (ii) Opportunity to test features/grading to see if they are suitable how features are graded Gives a known standard/control to compare against Check on methodology consistency/check for any errors/mistakes/improve survey Practice survey/get used to sheet Improves ability to work as a team 2 @ 1 [2] (c) (i) Completion of bi-polar graph for area B 2 marks for plots (4 correct = 2 marks, 2/3 correct = 1 mark) 1 mark for line [3] (ii) Area C/furthest from town centre has positive/highest score or total or index/area A is nearest to town centre has negative lowest score or total or index/score or total or index increases as move away from town centre A= –7, B = 0, C= +13, (any 2) Area C has +2 for six features but areas A/B has +2 for no feature Area A has –2 for 4 features but area C has no minus scores Area C has highest score for every feature Area C has all neutral or positive scores but area A has some negative scores Increase in feature scores from A to B to C Except for open space/vandalism/litter [4] www.theallpapers.com
Mark scheme, page 5
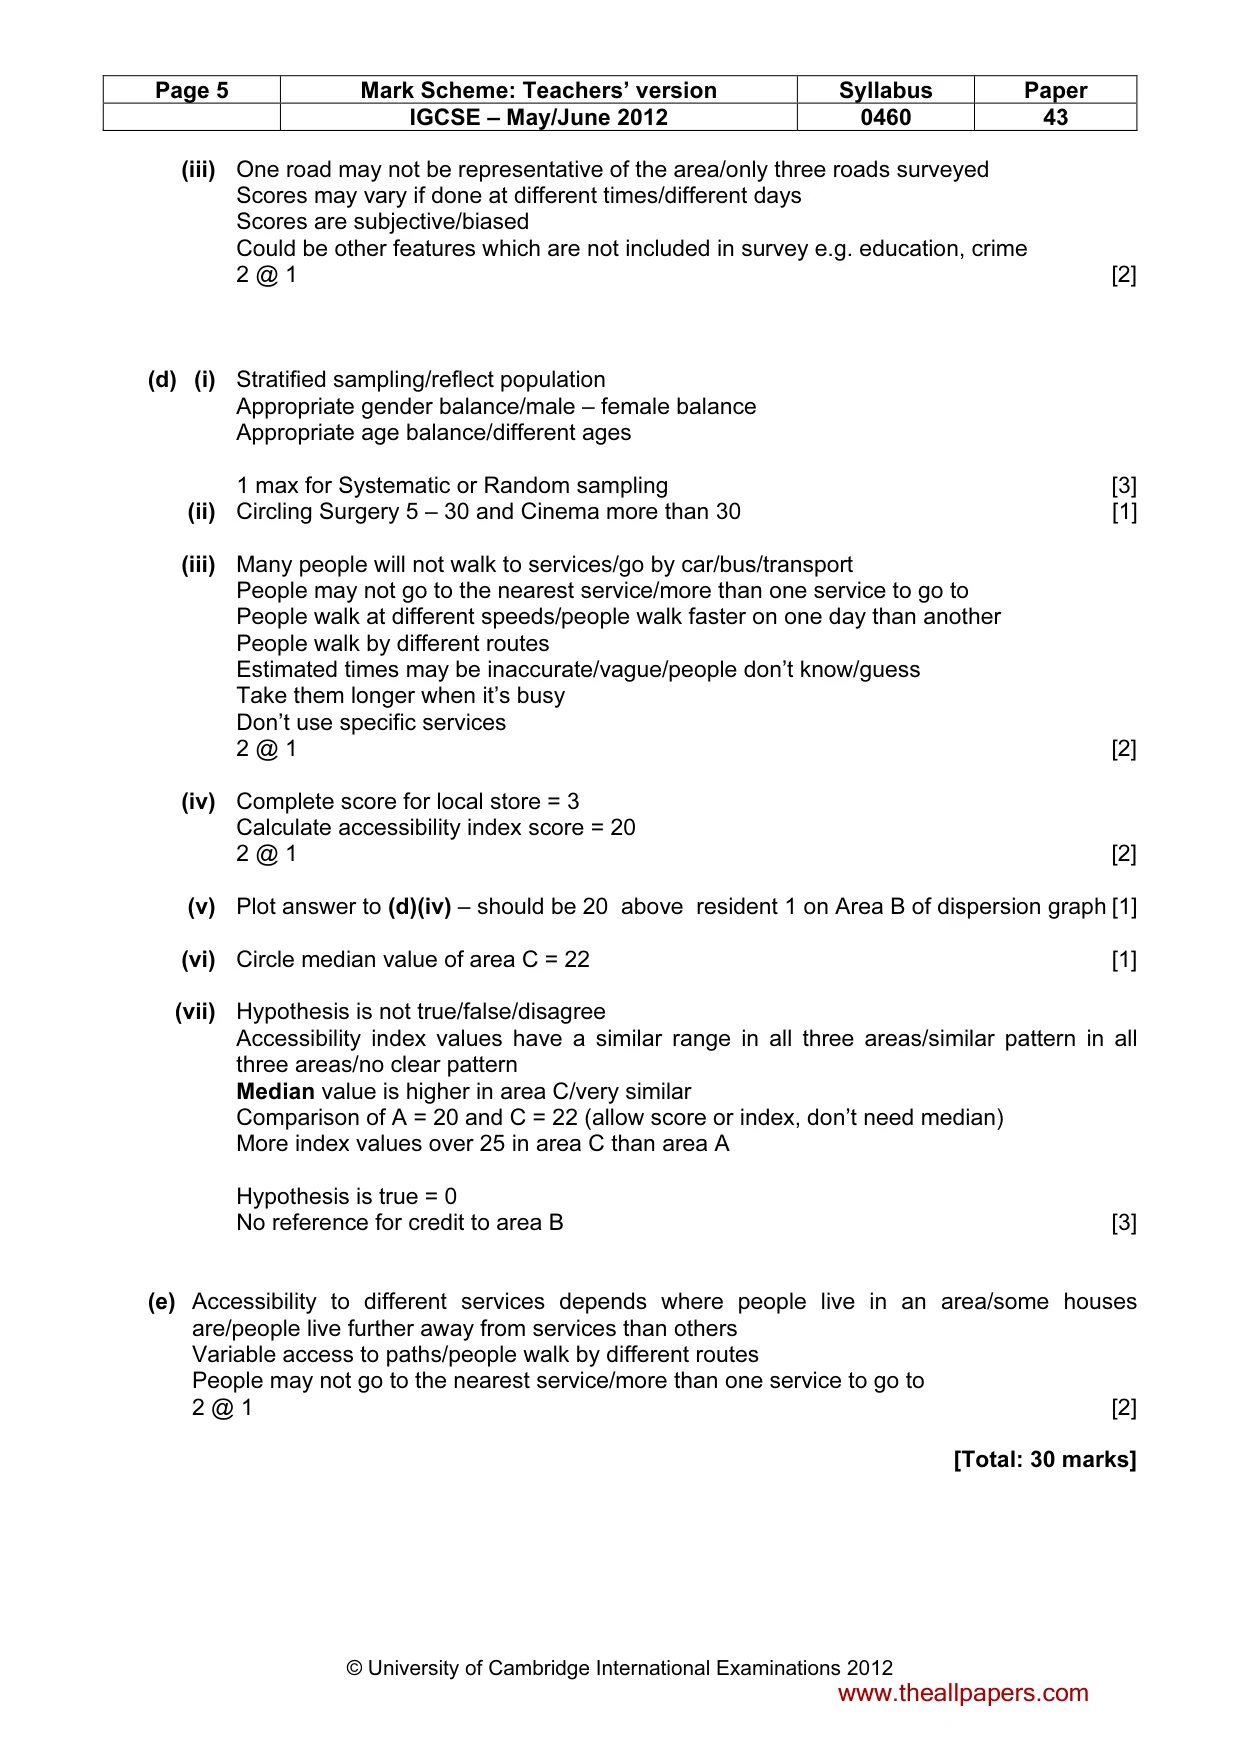
Page 5 Mark Scheme: Teachers’ version Syllabus Paper IGCSE – May/June 2012 0460 43 © University of Cambridge International Examinations 2012 (iii) One road may not be representative of the area/only three roads surveyed Scores may vary if done at different times/different days Scores are subjective/biased Could be other features which are not included in survey e.g. education, crime 2 @ 1 [2] (d) (i) Stratified sampling/reflect population Appropriate gender balance/male – female balance Appropriate age balance/different ages 1 max for Systematic or Random sampling [3] (ii) Circling Surgery 5 – 30 and Cinema more than 30 [1] (iii) Many people will not walk to services/go by car/bus/transport People may not go to the nearest service/more than one service to go to People walk at different speeds/people walk faster on one day than another People walk by different routes Estimated times may be inaccurate/vague/people don’t know/guess Take them longer when it’s busy Don’t use specific services 2 @ 1 [2] (iv) Complete score for local store = 3 Calculate accessibility index score = 20 2 @ 1 [2] (v) Plot answer to (d)(iv) – should be 20 above resident 1 on Area B of dispersion graph [1] (vi) Circle median value of area C = 22 [1] (vii) Hypothesis is not true/false/disagree Accessibility index values have a similar range in all three areas/similar pattern in all three areas/no clear pattern Median value is higher in area C/very similar Comparison of A = 20 and C = 22 (allow score or index, don’t need median) More index values over 25 in area C than area A Hypothesis is true = 0 No reference for credit to area B [3] (e) Accessibility to different services depends where people live in an area/some houses are/people live further away from services than others Variable access to paths/people walk by different routes People may not go to the nearest service/more than one service to go to 2 @ 1 [2] [Total: 30 marks] www.theallpapers.com
What you needed in this session
Cambridge’s own grade thresholds for 2012 May/June, Paper 4 · Variant 3. A higher threshold means an easier paper — the bar moves with how the cohort did.