Cambridge IGCSE Geography 0460 — 2012 May/June Paper 4 · Variant 2
0460/42/M/J/12 · 60 marks · ≈68 min
The question paper and its mark scheme, free to read here and free to download. This is Cambridge’s own paper, exactly as it was sat.
Question paper16 pages


Mark scheme6 pages
Answers below. Sit the paper first if you are practising.
Paper as text
Question paper, page 1
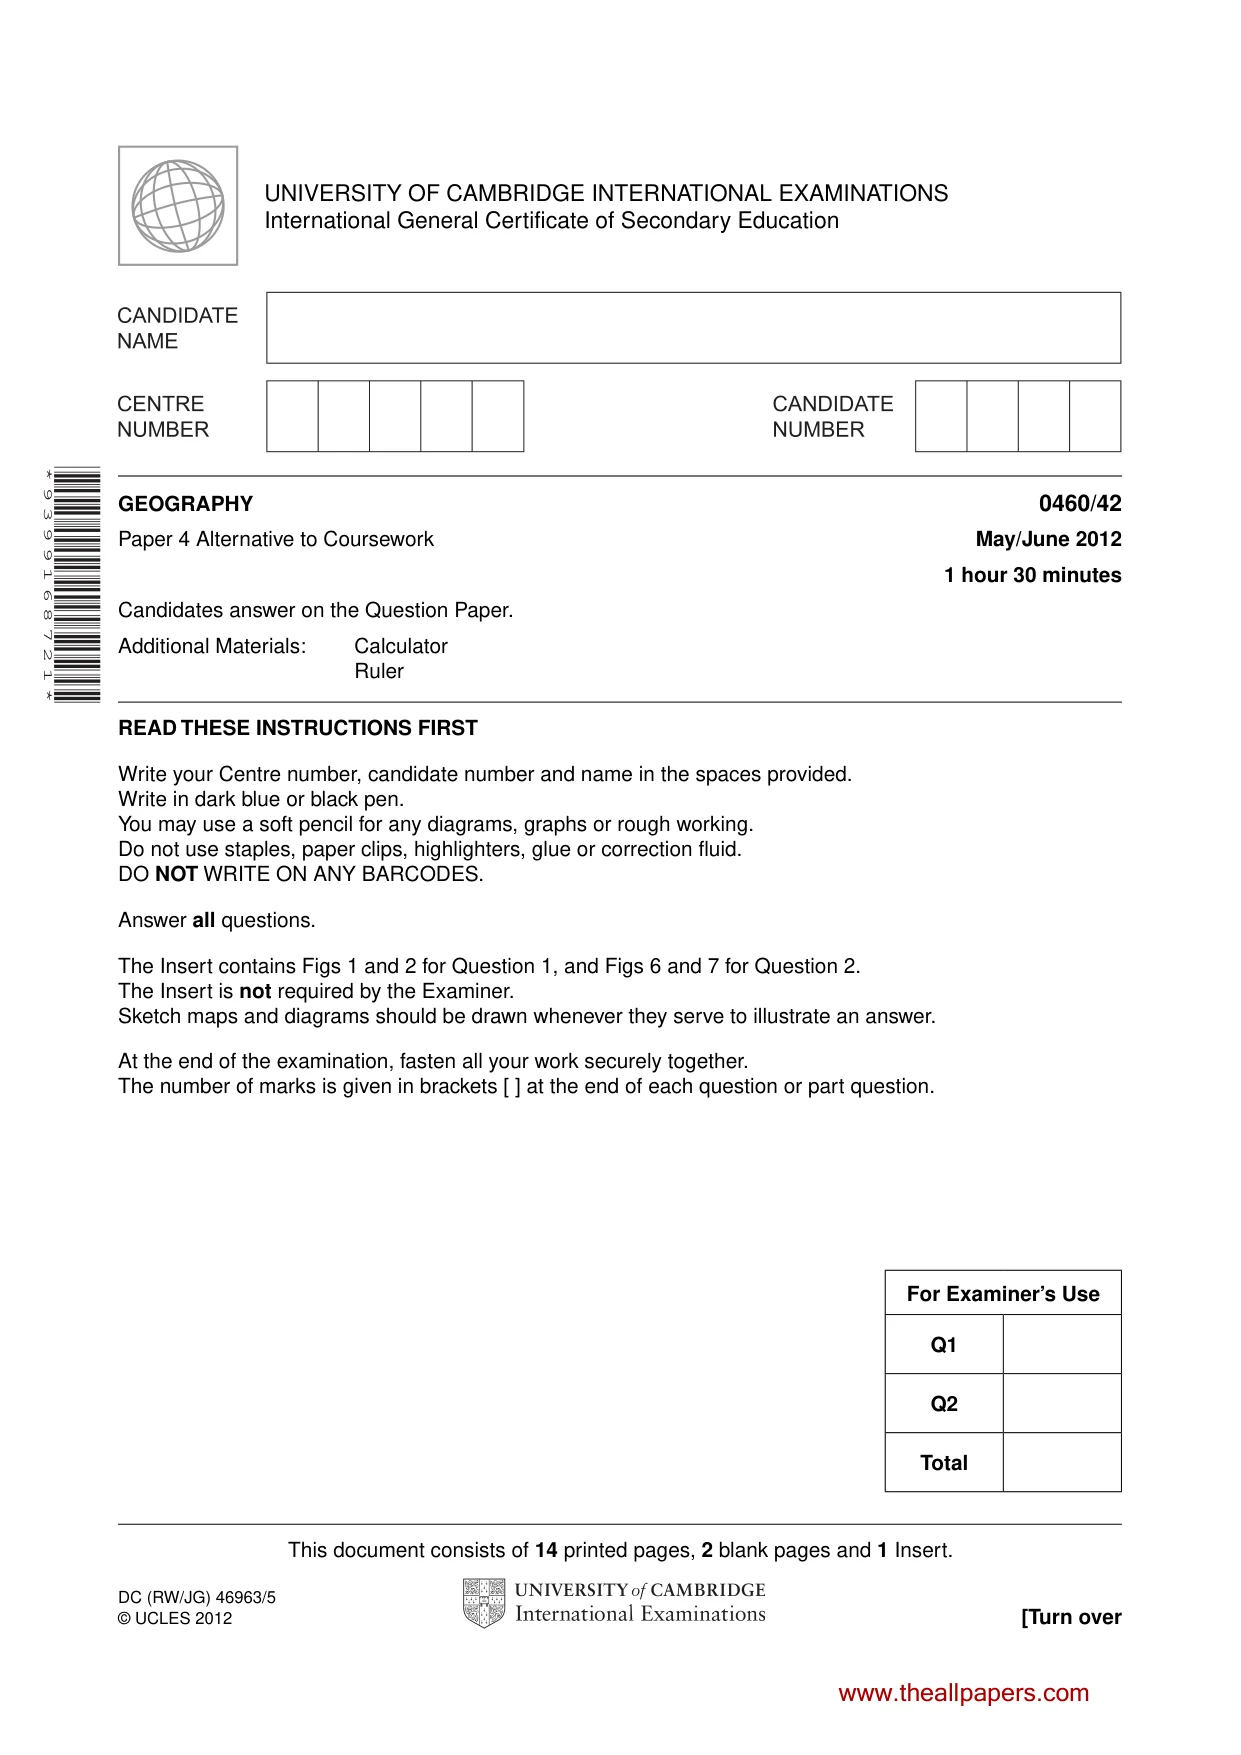
This document consists of 14 printed pages, 2 blank pages and 1 Insert. DC (RW/JG) 46963/5 © UCLES 2012 [Turn over UNIVERSITY OF CAMBRIDGE INTERNATIONAL EXAMINATIONS International General Certificate of Secondary Education * 9 3 9 9 1 6 8 7 2 1 * GEOGRAPHY 0460/42 Paper 4 Alternative to Coursework May/June 2012 1 hour 30 minutes Candidates answer on the Question Paper. Additional Materials: Calculator Ruler READ THESE INSTRUCTIONS FIRST Write your Centre number, candidate number and name in the spaces provided. Write in dark blue or black pen. You may use a soft pencil for any diagrams, graphs or rough working. Do not use staples, paper clips, highlighters, glue or correction fluid. DO NOT WRITE ON ANY BARCODES. Answer all questions. The Insert contains Figs 1 and 2 for Question 1, and Figs 6 and 7 for Question 2. The Insert is not required by the Examiner. Sketch maps and diagrams should be drawn whenever they serve to illustrate an answer. At the end of the examination, fasten all your work securely together. The number of marks is given in brackets [ ] at the end of each question or part question. For Examiner’s Use Q1 Q2 Total www.theallpapers.com
Question paper, page 2
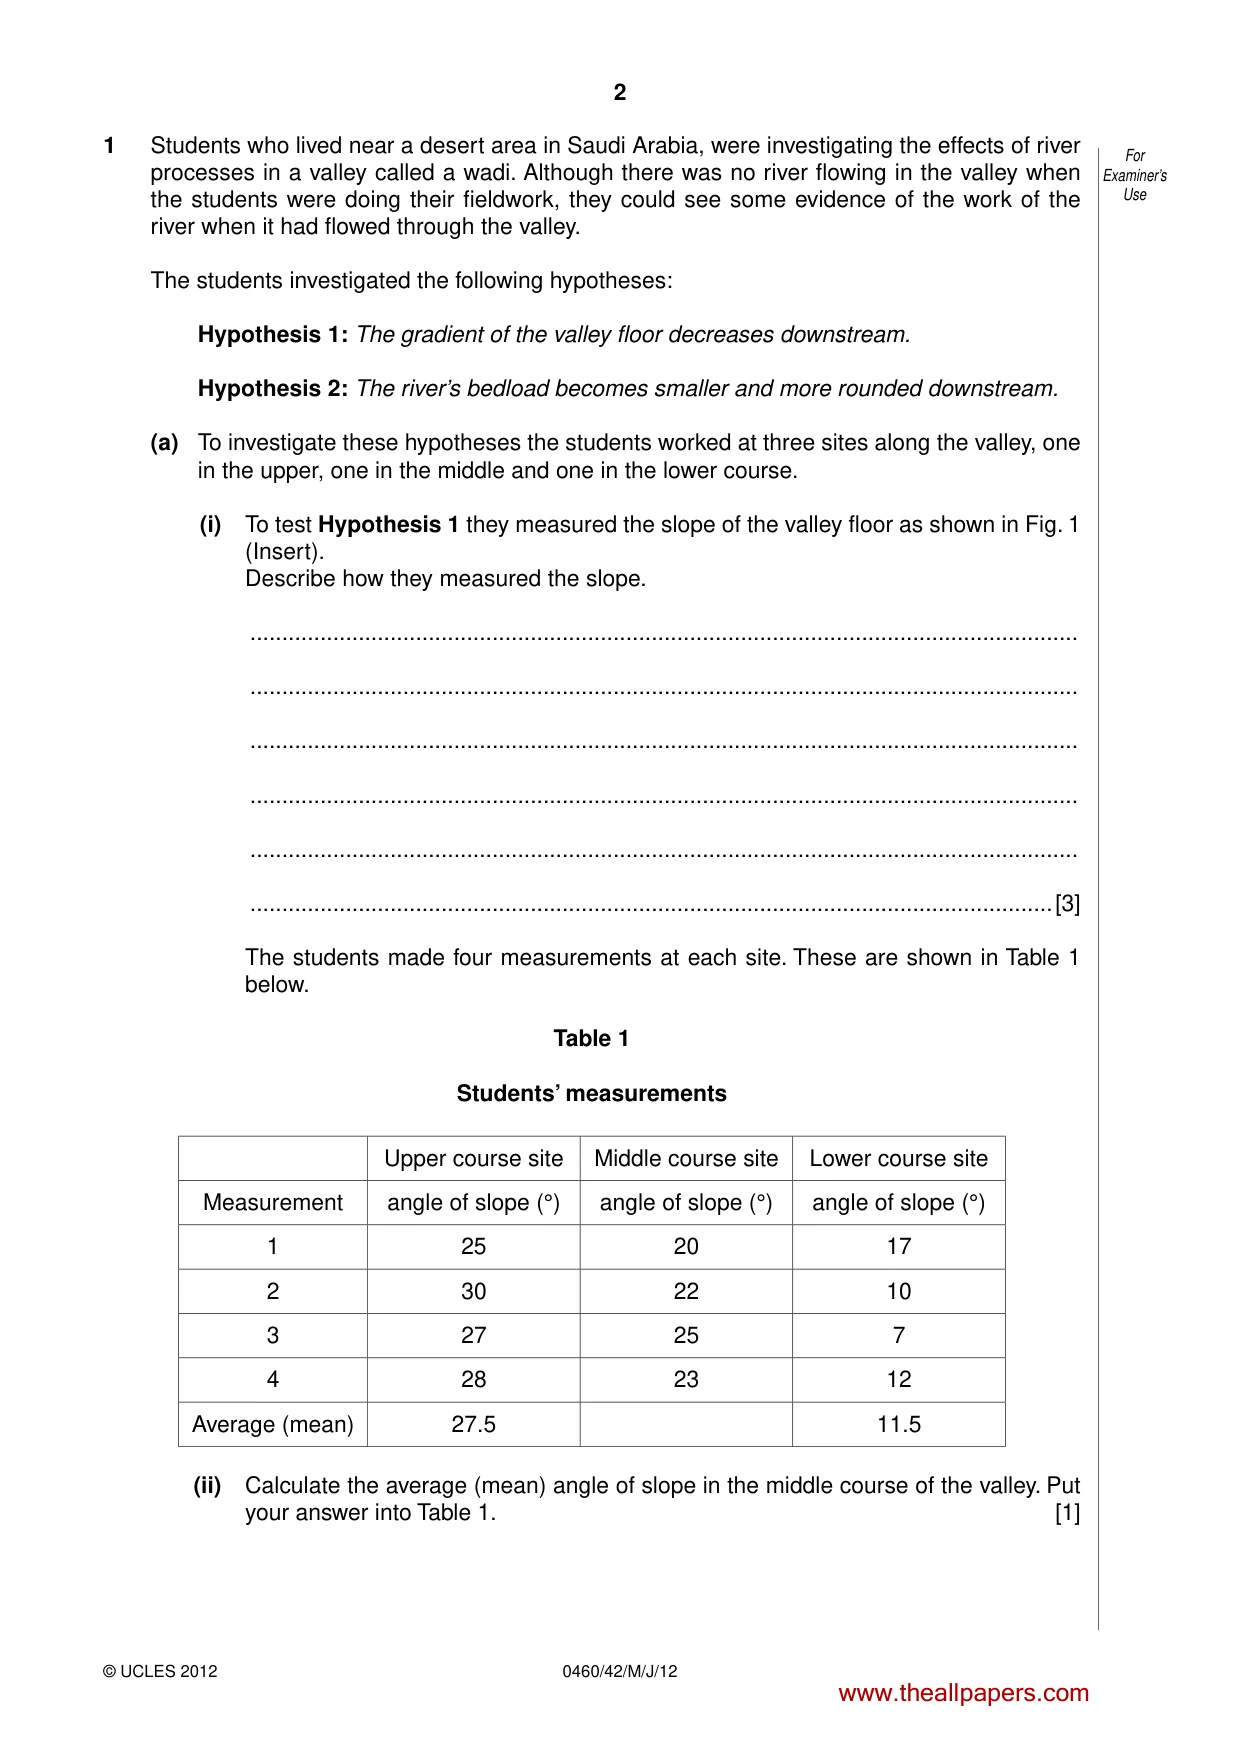
2 0460/42/M/J/12 © UCLES 2012 For Examiner’s Use 1 Students who lived near a desert area in Saudi Arabia, were investigating the effects of river processes in a valley called a wadi. Although there was no river flowing in the valley when the students were doing their fieldwork, they could see some evidence of the work of the river when it had flowed through the valley. The students investigated the following hypotheses: Hypothesis 1: The gradient of the valley floor decreases downstream. Hypothesis 2: The river’s bedload becomes smaller and more rounded downstream. (a) To investigate these hypotheses the students worked at three sites along the valley, one in the upper, one in the middle and one in the lower course. (i) To test Hypothesis 1 they measured the slope of the valley floor as shown in Fig. 1 (Insert). Describe how they measured the slope. … … … … … …[3] The students made four measurements at each site. These are shown in Table 1 below. Table 1 Students’ measurements Upper course site Middle course site Lower course site Measurement angle of slope (°) angle of slope (°) angle of slope (°) 1 25 20 17 2 30 22 10 3 27 25 7 4 28 23 12 Average (mean) 27.5 11.5 (ii) Calculate the average (mean) angle of slope in the middle course of the valley. Put your answer into Table 1. [1] www.theallpapers.com
Question paper, page 3
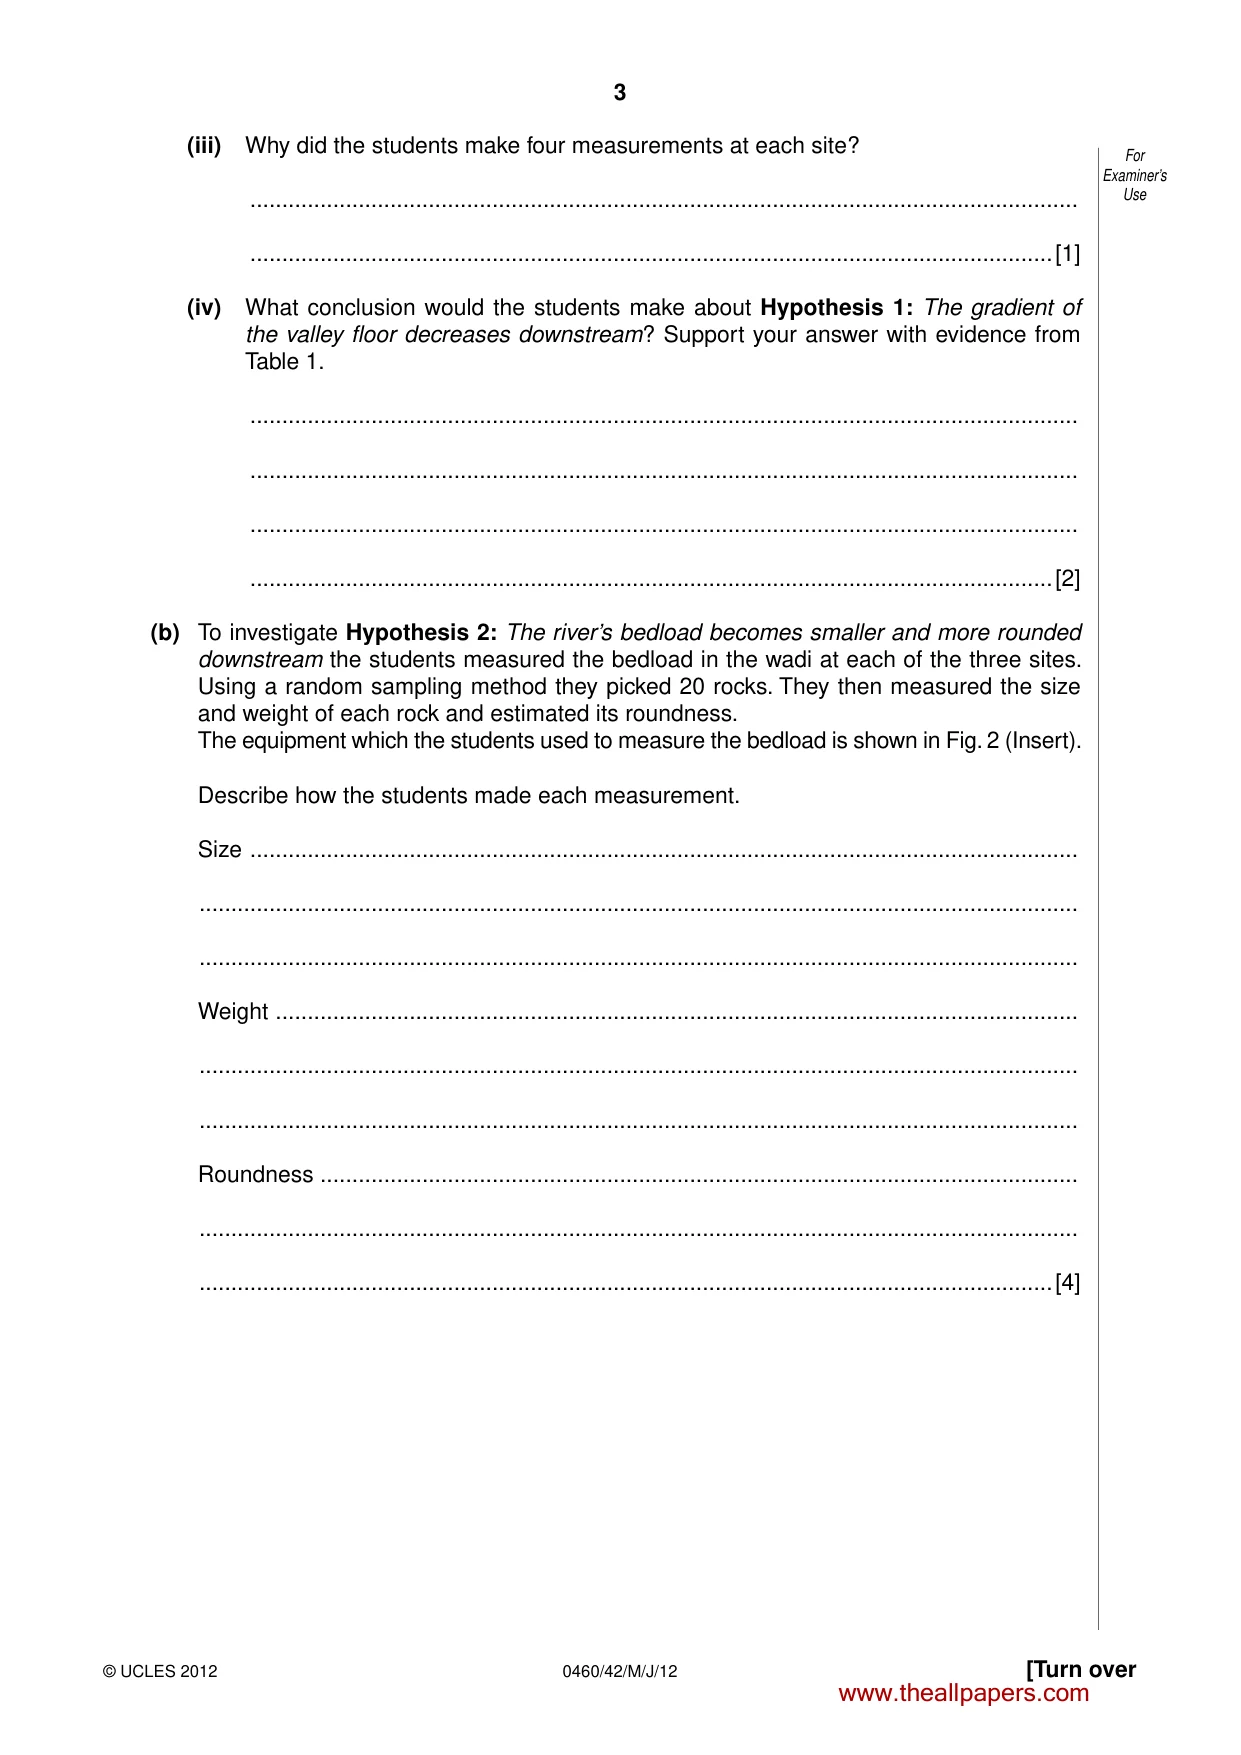
3 0460/42/M/J/12 © UCLES 2012 [Turn over For Examiner’s Use (iii) Why did the students make four measurements at each site? … …[1] (iv) What conclusion would the students make about Hypothesis 1: The gradient of the valley floor decreases downstream? Support your answer with evidence from Table 1. … … … …[2] (b) To investigate Hypothesis 2: The river’s bedload becomes smaller and more rounded downstream the students measured the bedload in the wadi at each of the three sites. Using a random sampling method they picked 20 rocks. They then measured the size and weight of each rock and estimated its roundness. The equipment which the students used to measure the bedload is shown in Fig. 2 (Insert). Describe how the students made each measurement. Size … … … Weight … … … Roundness … … …[4] www.theallpapers.com
Question paper, page 4
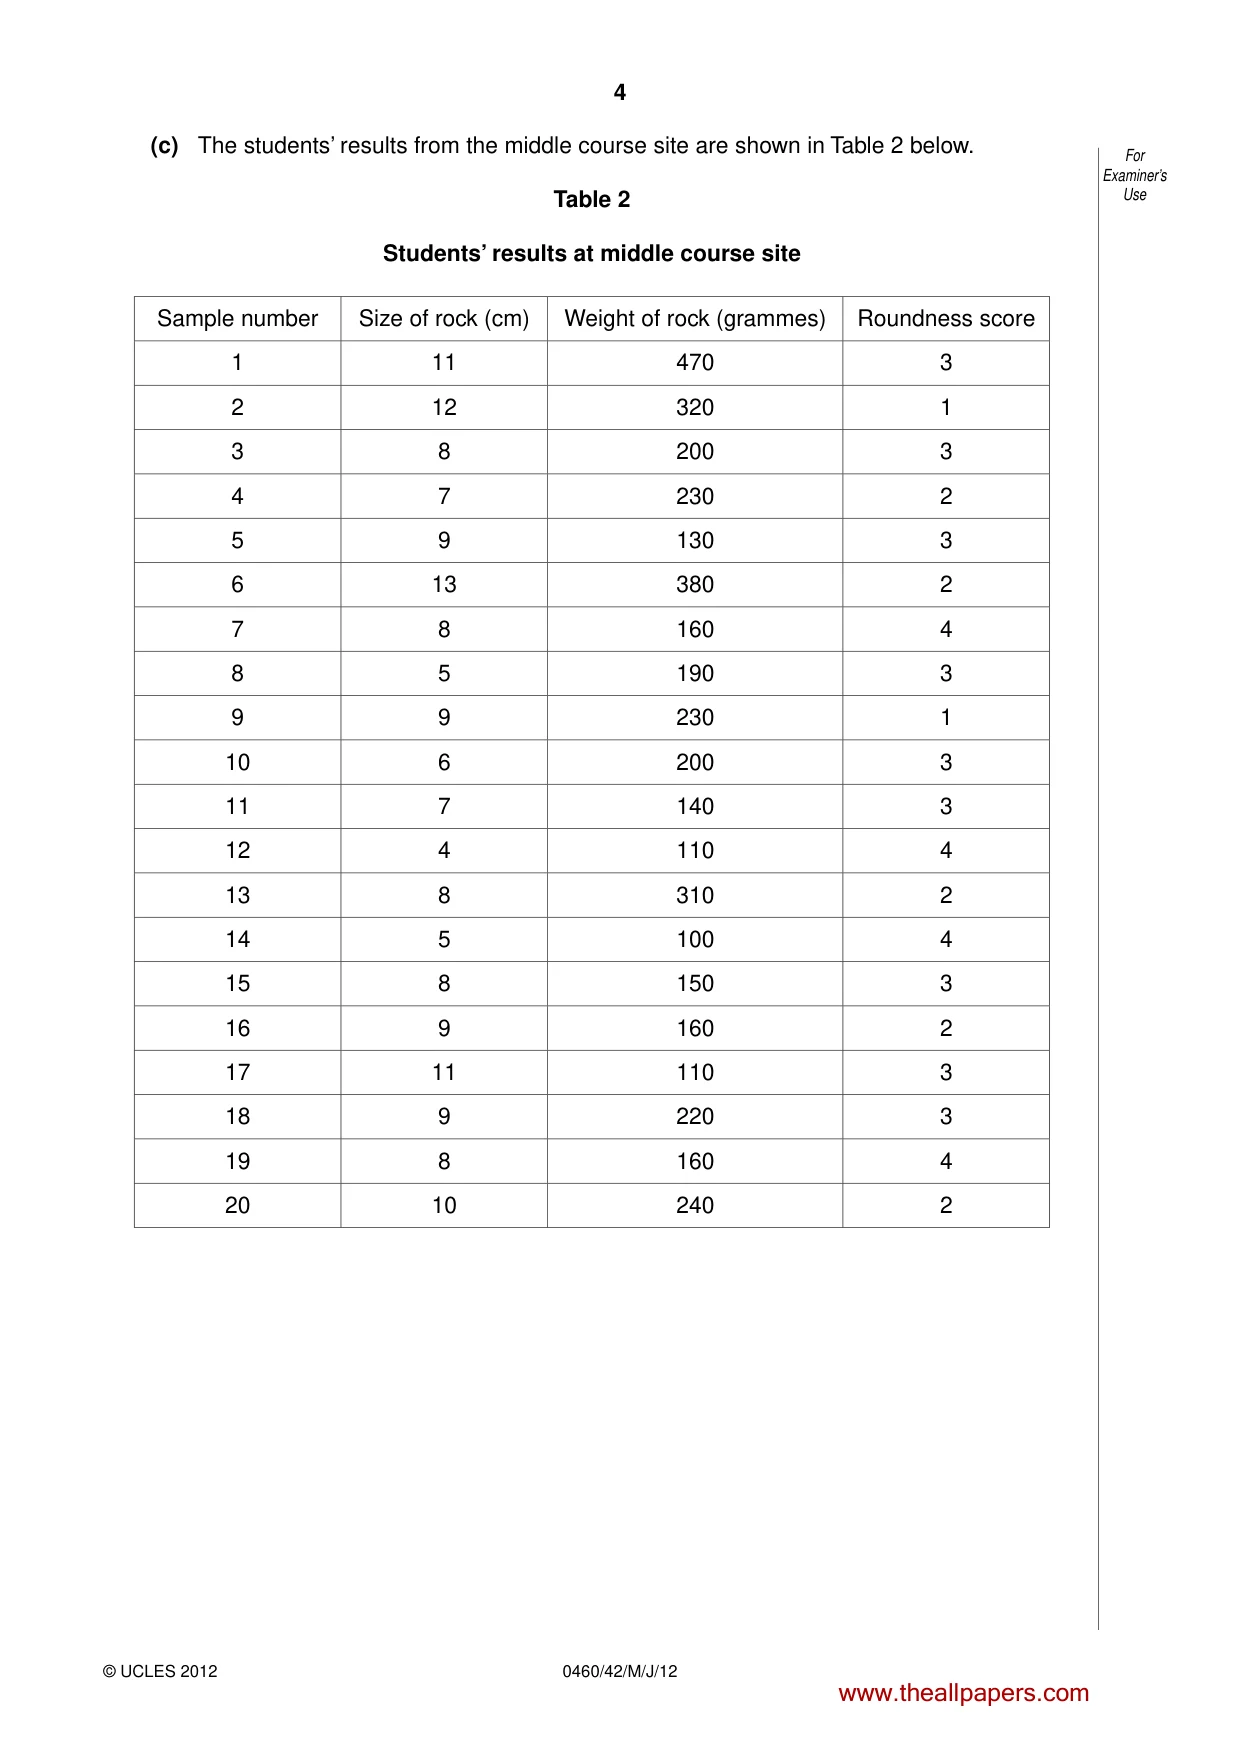
4 0460/42/M/J/12 © UCLES 2012 For Examiner’s Use (c) The students’ results from the middle course site are shown in Table 2 below. Table 2 Students’ results at middle course site Sample number Size of rock (cm) Weight of rock (grammes) Roundness score 1 11 470 3 2 12 320 1 3 8 200 3 4 7 230 2 5 9 130 3 6 13 380 2 7 8 160 4 8 5 190 3 9 9 230 1 10 6 200 3 11 7 140 3 12 4 110 4 13 8 310 2 14 5 100 4 15 8 150 3 16 9 160 2 17 11 110 3 18 9 220 3 19 8 160 4 20 10 240 2 www.theallpapers.com
Question paper, page 5
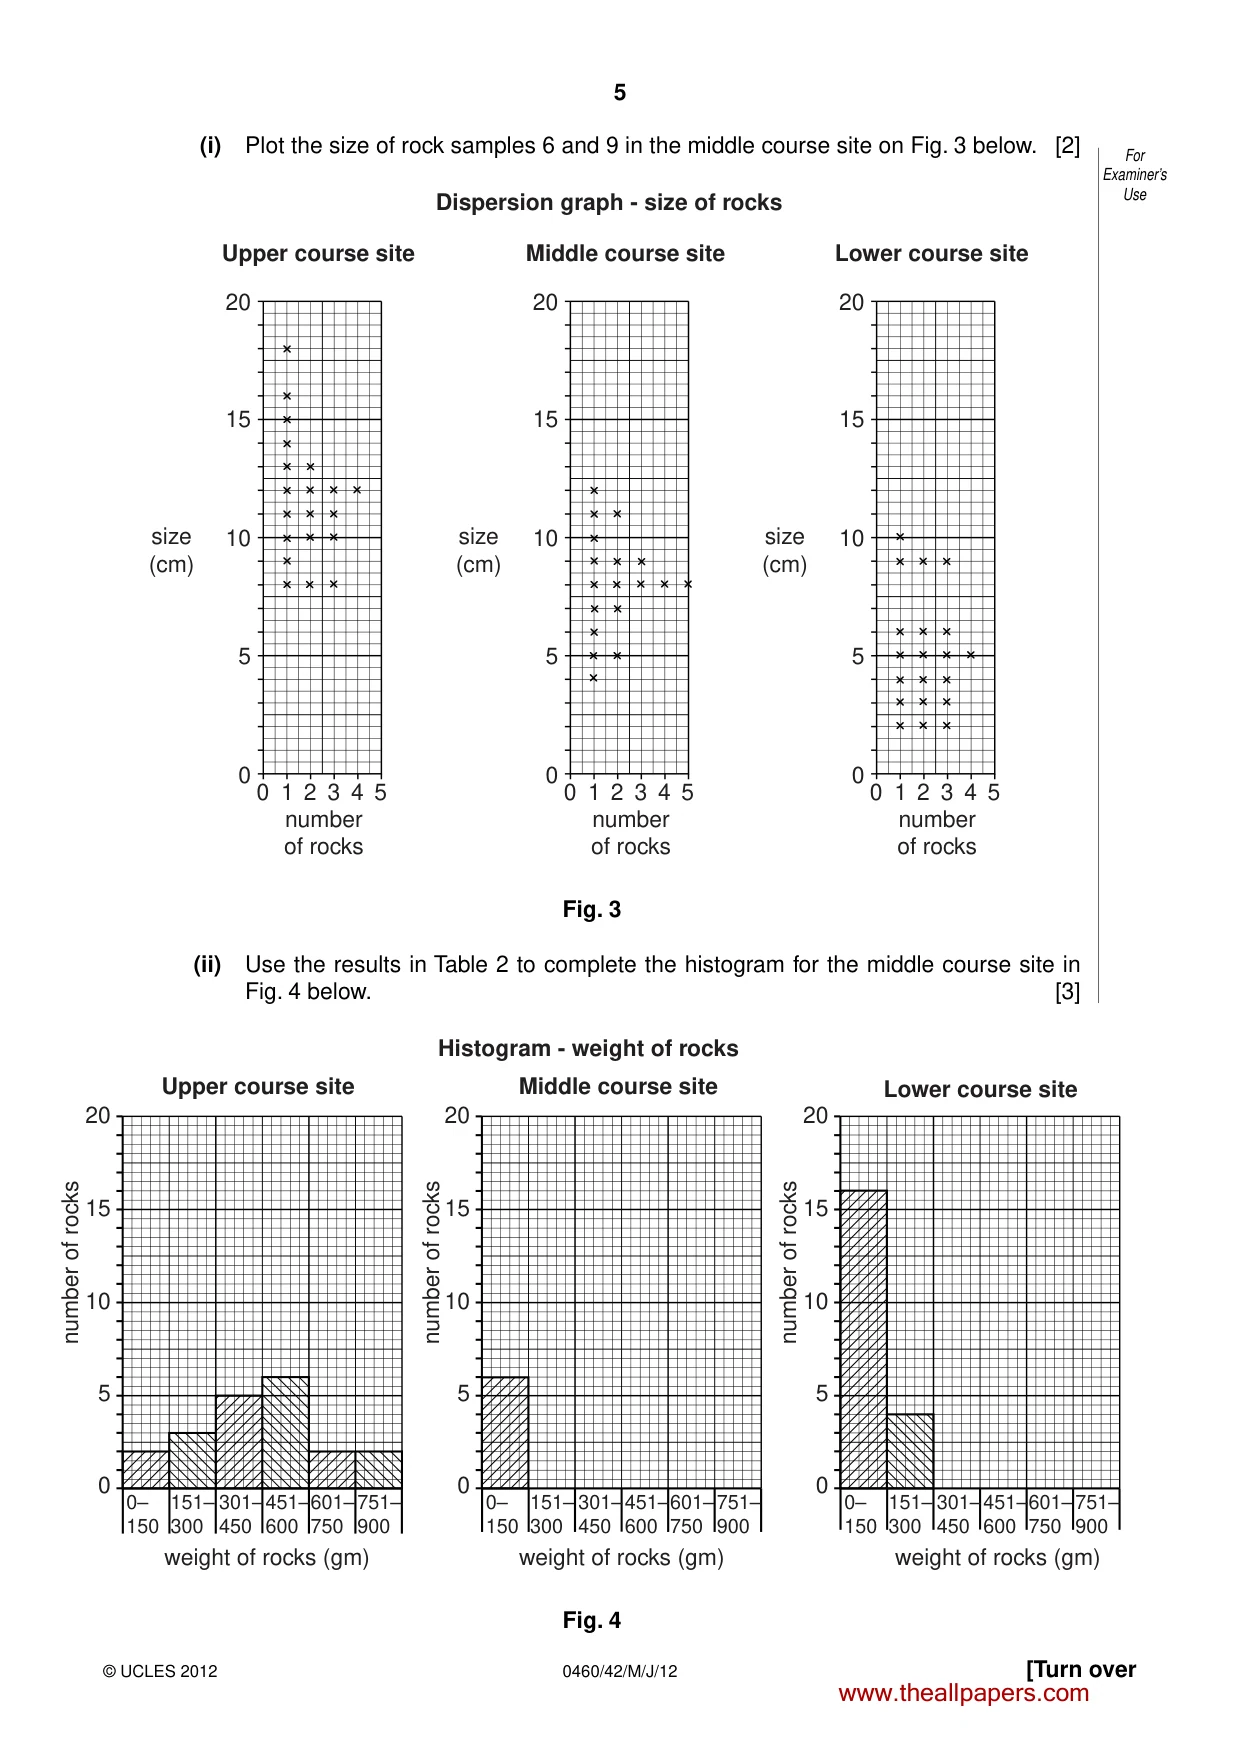
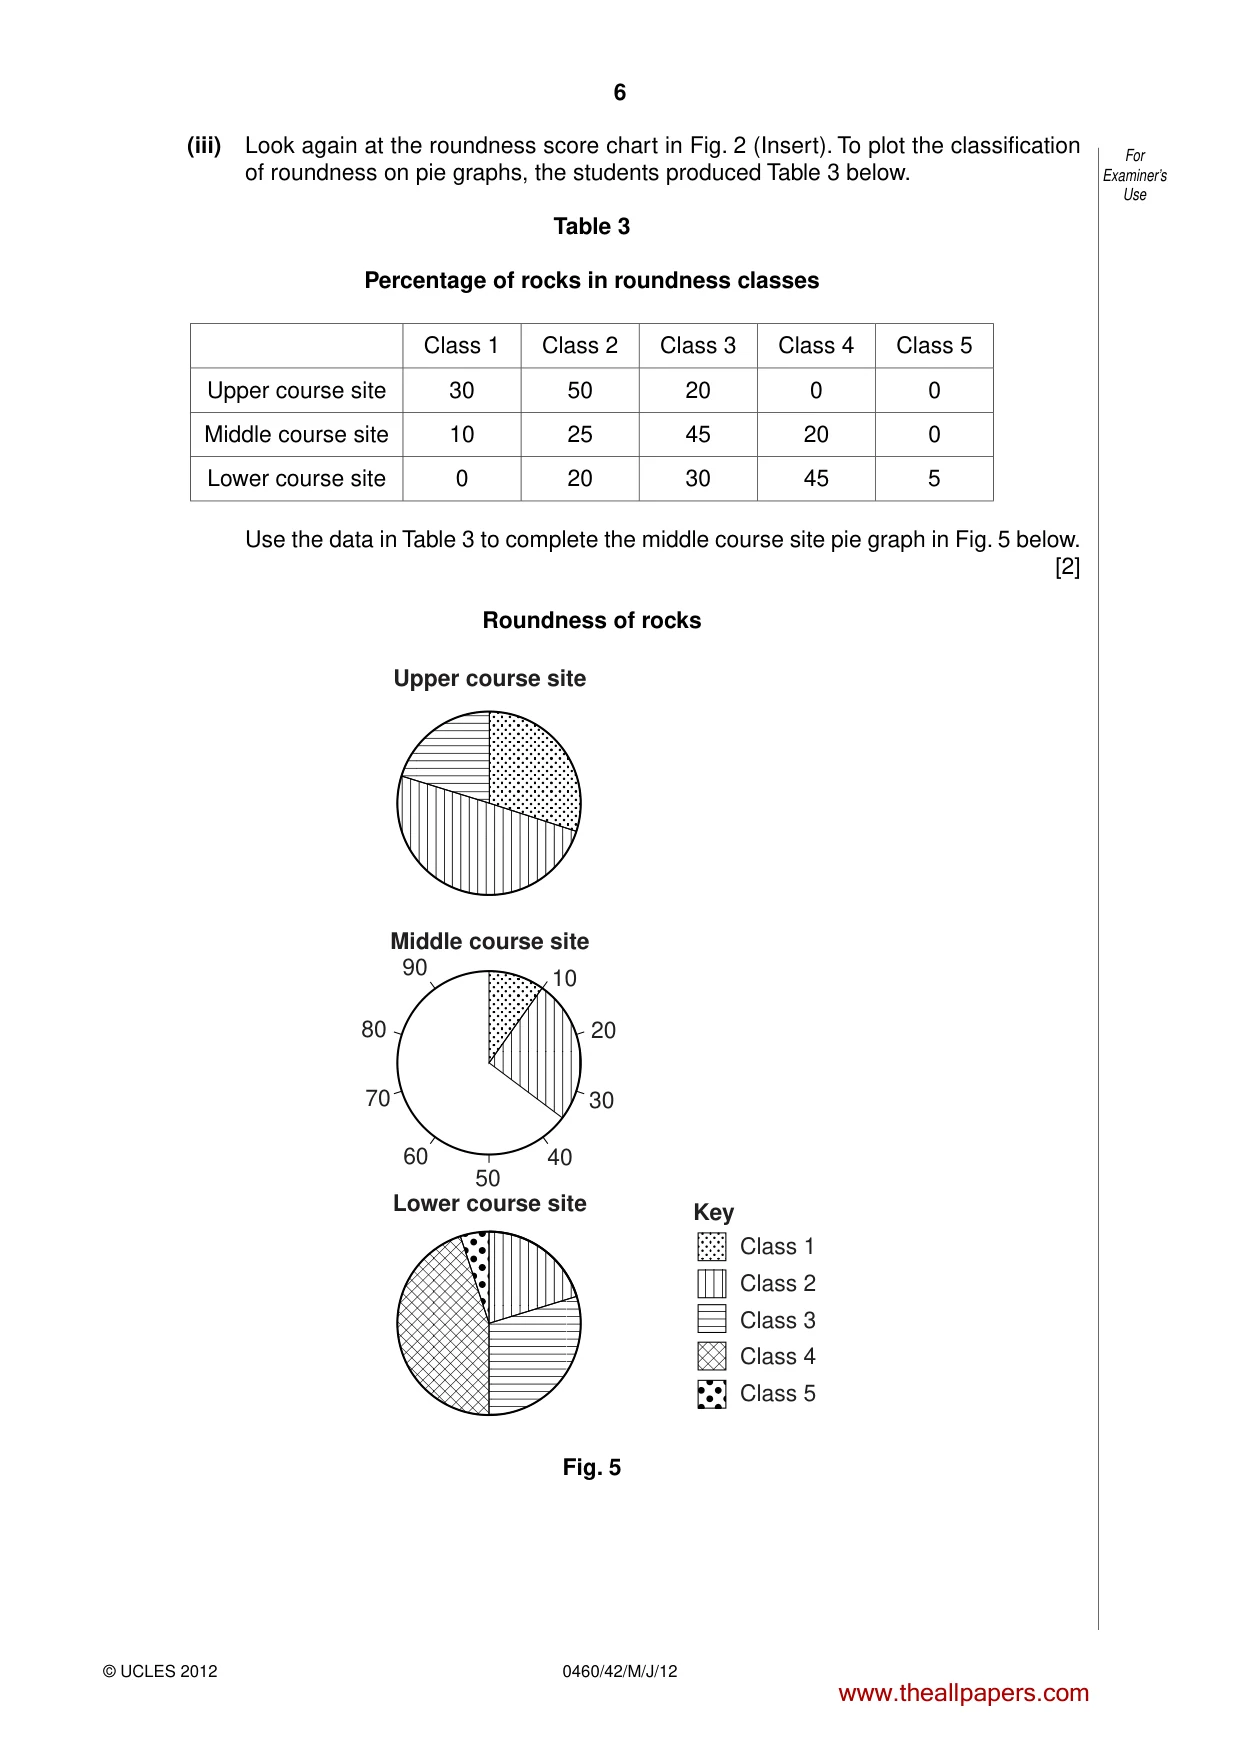
5 0460/42/M/J/12 © UCLES 2012 [Turn over For Examiner’s Use (i) Plot the size of rock samples 6 and 9 in the middle course site on Fig. 3 below. [2] 20 15 10 5 0 0 1 2 3 4 5 size (cm) Upper course site number of rocks 20 15 10 5 0 0 1 2 3 4 5 size (cm) Middle course site number of rocks 20 15 10 5 0 0 1 2 3 4 5 size (cm) Lower course site number of rocks Dispersion graph - size of rocks Fig. 3 (ii) Use the results in Table 2 to complete the histogram for the middle course site in Fig. 4 below. [3] Upper course site Middle course site Lower course site 0– 150 151– 300 301– 450 451– 600 601– 750 751– 900 0– 150 151– 300 301– 450 451– 600 601– 750 751– 900 0– 150 151– 300 301– 450 451– 600 601– 750 751– 900 0 5 10 15 20 0 5 10 15 20 0 5 10 15 20 number of rocks number of rocks number of rocks weight of rocks (gm) weight of rocks (gm) weight of rocks (gm) Histogram - weight of rocks Fig. 4 www.theallpapers.com
Question paper, page 6
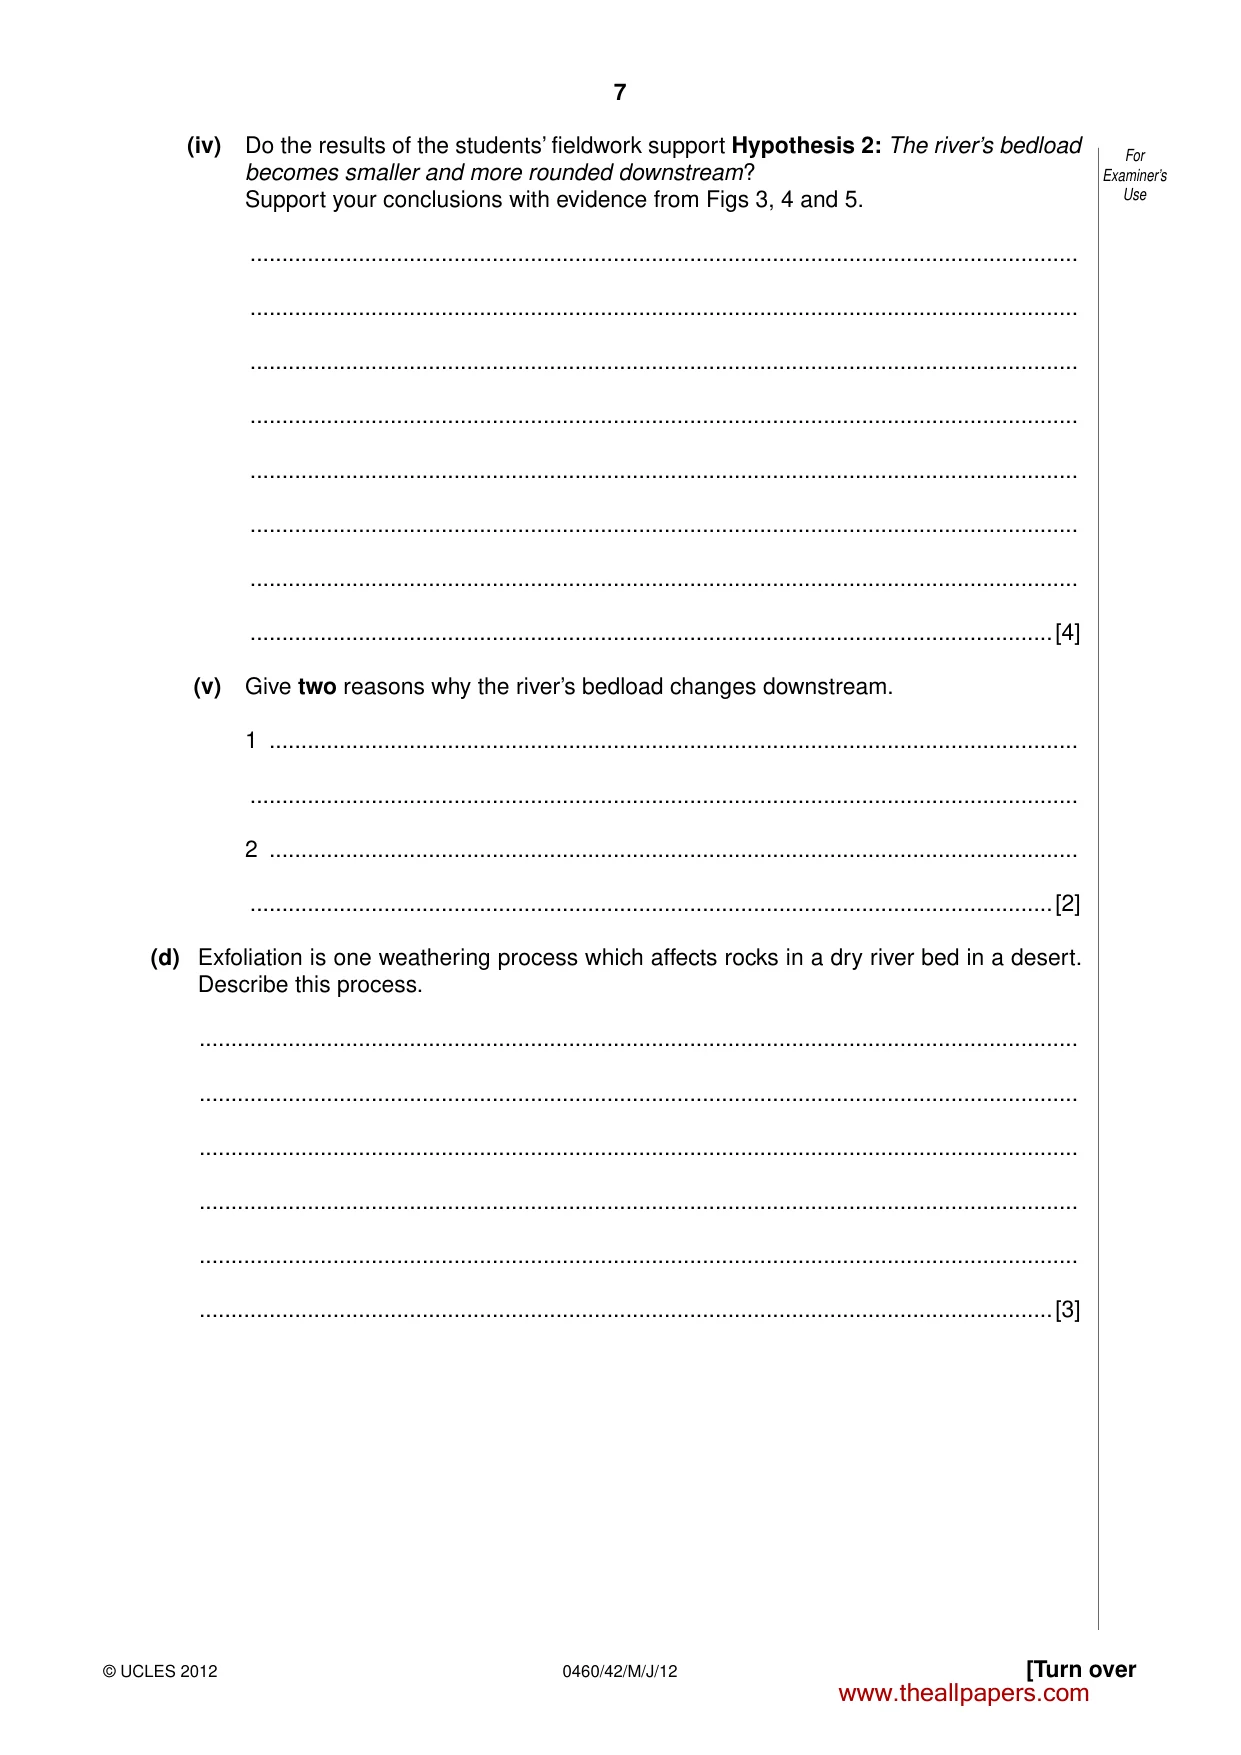
6 0460/42/M/J/12 © UCLES 2012 For Examiner’s Use (iii) Look again at the roundness score chart in Fig. 2 (Insert). To plot the classification of roundness on pie graphs, the students produced Table 3 below. Table 3 Percentage of rocks in roundness classes Class 1 Class 2 Class 3 Class 4 Class 5 Upper course site 30 50 20 0 0 Middle course site 10 25 45 20 0 Lower course site 0 20 30 45 5 Use the data in Table 3 to complete the middle course site pie graph in Fig. 5 below. [2] Roundness of rocks Key Class 1 Class 2 Class 3 Class 4 Class 5 Lower course site Middle course site Upper course site 10 20 30 40 50 60 70 80 90 Fig. 5 www.theallpapers.com
Question paper, page 7
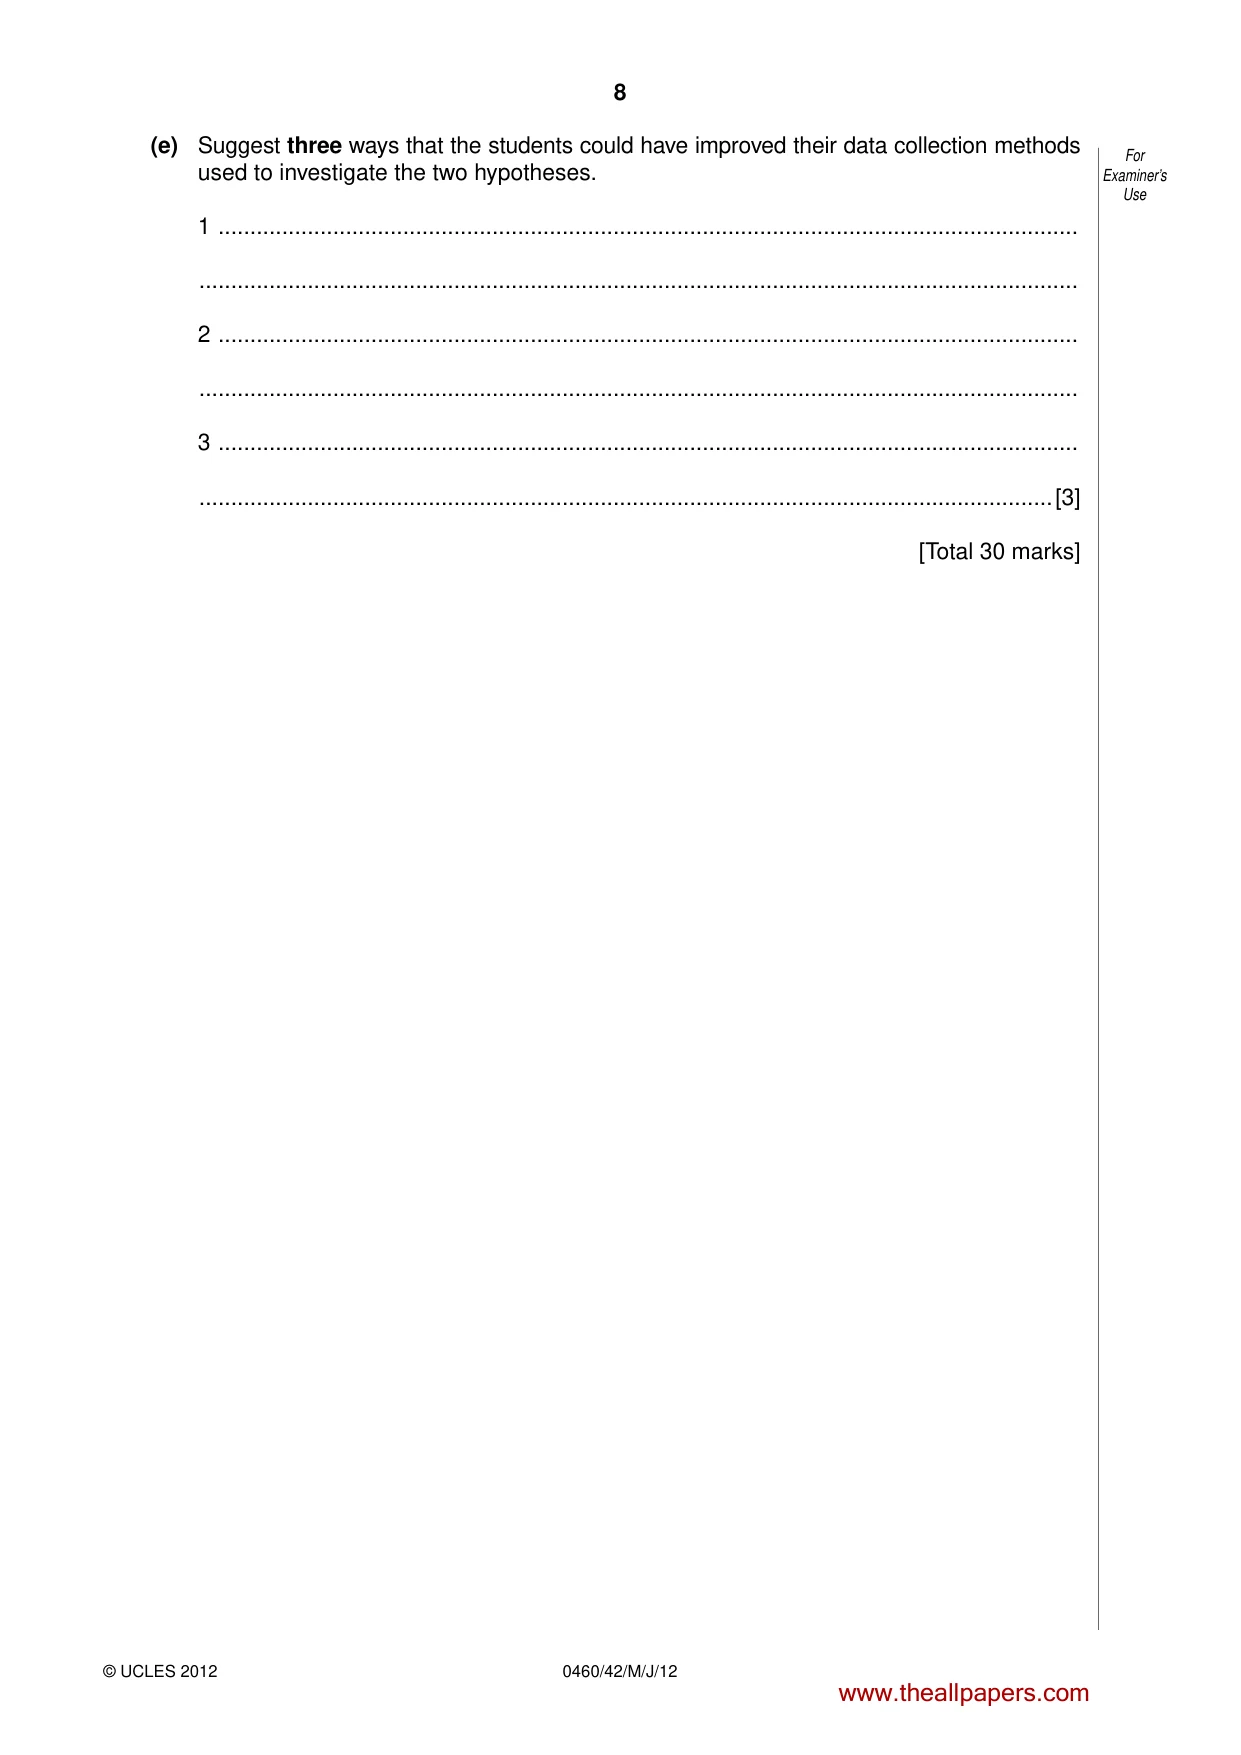
7 0460/42/M/J/12 © UCLES 2012 [Turn over For Examiner’s Use (iv) Do the results of the students’ fieldwork support Hypothesis 2: The river’s bedload becomes smaller and more rounded downstream? Support your conclusions with evidence from Figs 3, 4 and 5. … … … … … … … …[4] (v) Give two reasons why the river’s bedload changes downstream. 1 … … 2 … …[2] (d) Exfoliation is one weathering process which affects rocks in a dry river bed in a desert. Describe this process. … … … … … …[3] www.theallpapers.com
Question paper, page 8
8 0460/42/M/J/12 © UCLES 2012 For Examiner’s Use (e) Suggest three ways that the students could have improved their data collection methods used to investigate the two hypotheses. 1 … … 2 … … 3 … …[3] [Total 30 marks] www.theallpapers.com
Question paper, page 9
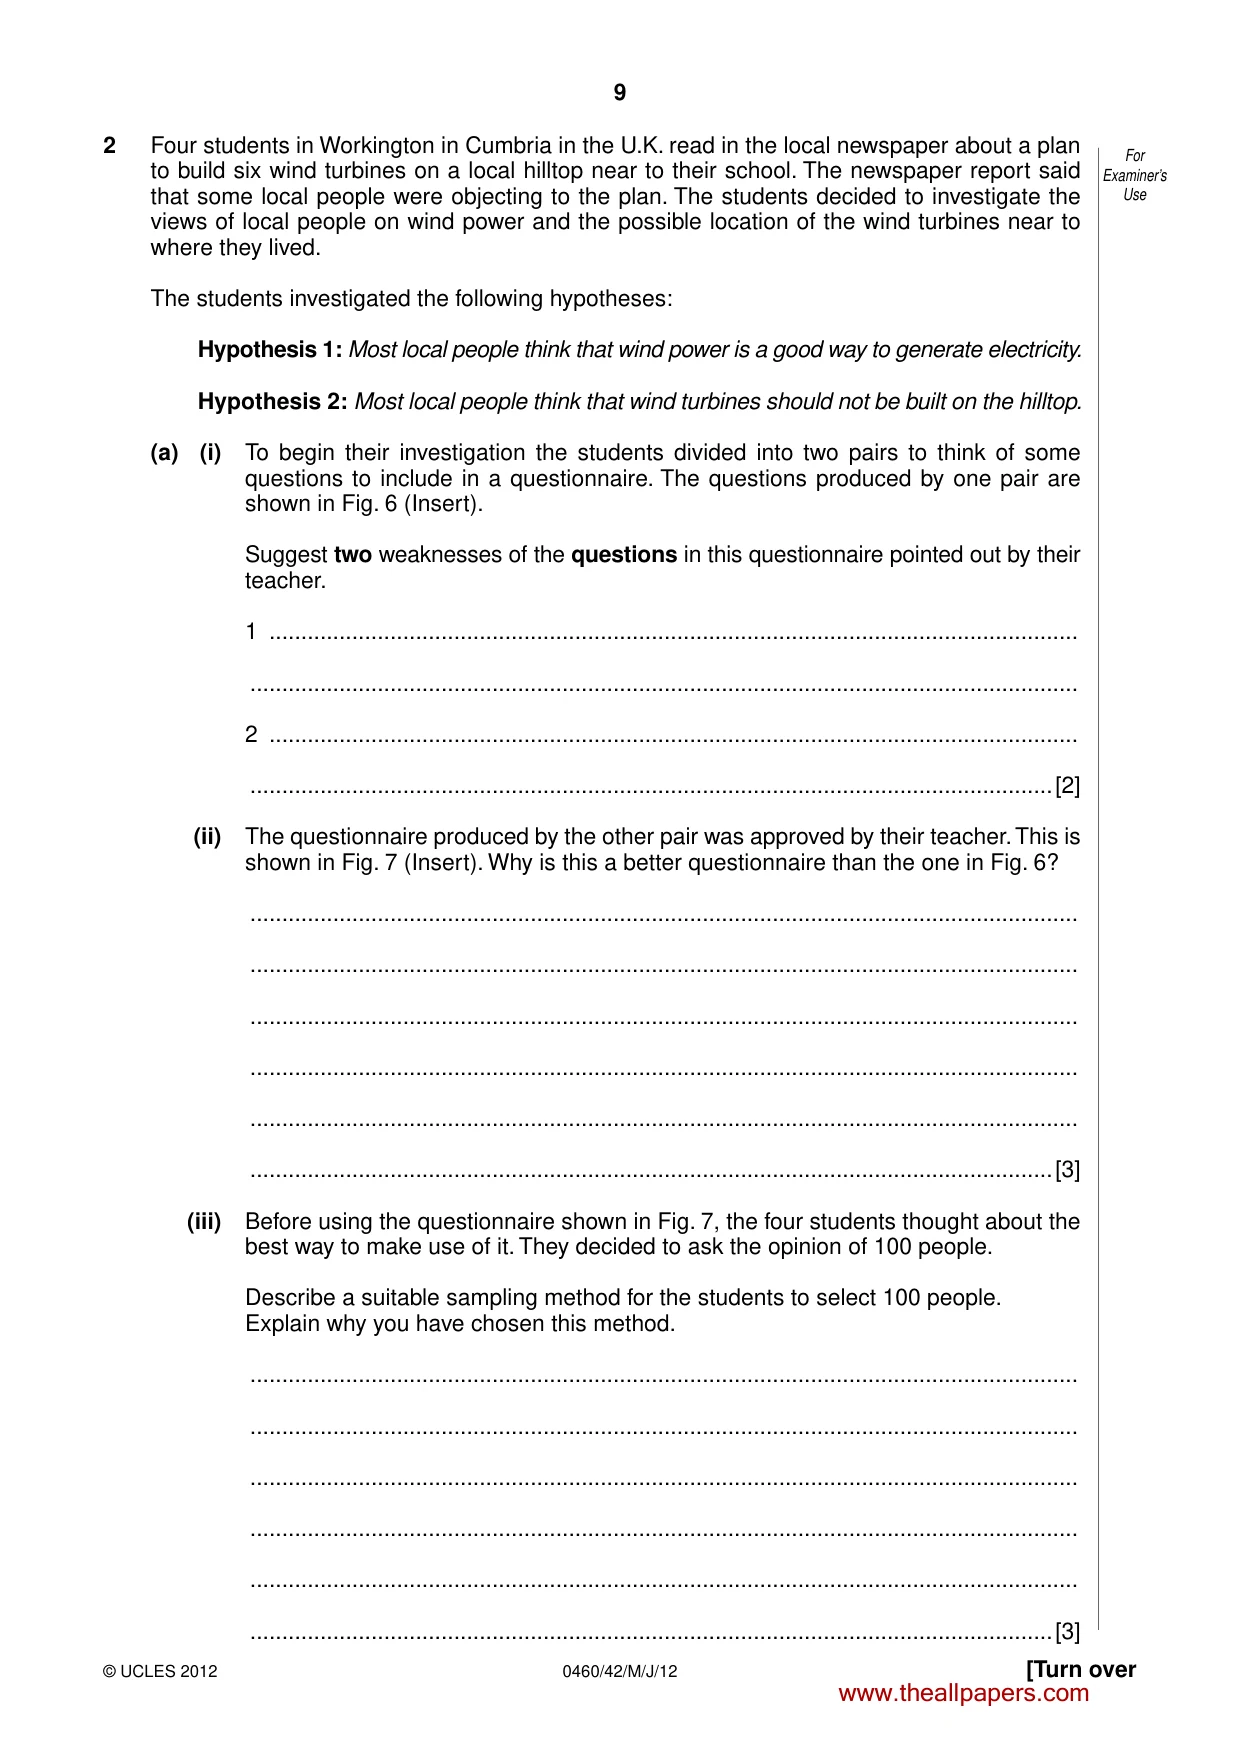
9 0460/42/M/J/12 © UCLES 2012 [Turn over For Examiner’s Use 2 Four students in Workington in Cumbria in the U.K. read in the local newspaper about a plan to build six wind turbines on a local hilltop near to their school. The newspaper report said that some local people were objecting to the plan. The students decided to investigate the views of local people on wind power and the possible location of the wind turbines near to where they lived. The students investigated the following hypotheses: Hypothesis 1: Most local people think that wind power is a good way to generate electricity. Hypothesis 2: Most local people think that wind turbines should not be built on the hilltop. (a) (i) To begin their investigation the students divided into two pairs to think of some questions to include in a questionnaire. The questions produced by one pair are shown in Fig. 6 (Insert). Suggest two weaknesses of the questions in this questionnaire pointed out by their teacher. 1 … … 2 … …[2] (ii) The questionnaire produced by the other pair was approved by their teacher. This is shown in Fig. 7 (Insert). Why is this a better questionnaire than the one in Fig. 6? … … … … … …[3] (iii) Before using the questionnaire shown in Fig. 7, the four students thought about the best way to make use of it. They decided to ask the opinion of 100 people. Describe a suitable sampling method for the students to select 100 people. Explain why you have chosen this method. … … … … … …[3] www.theallpapers.com
Question paper, page 10
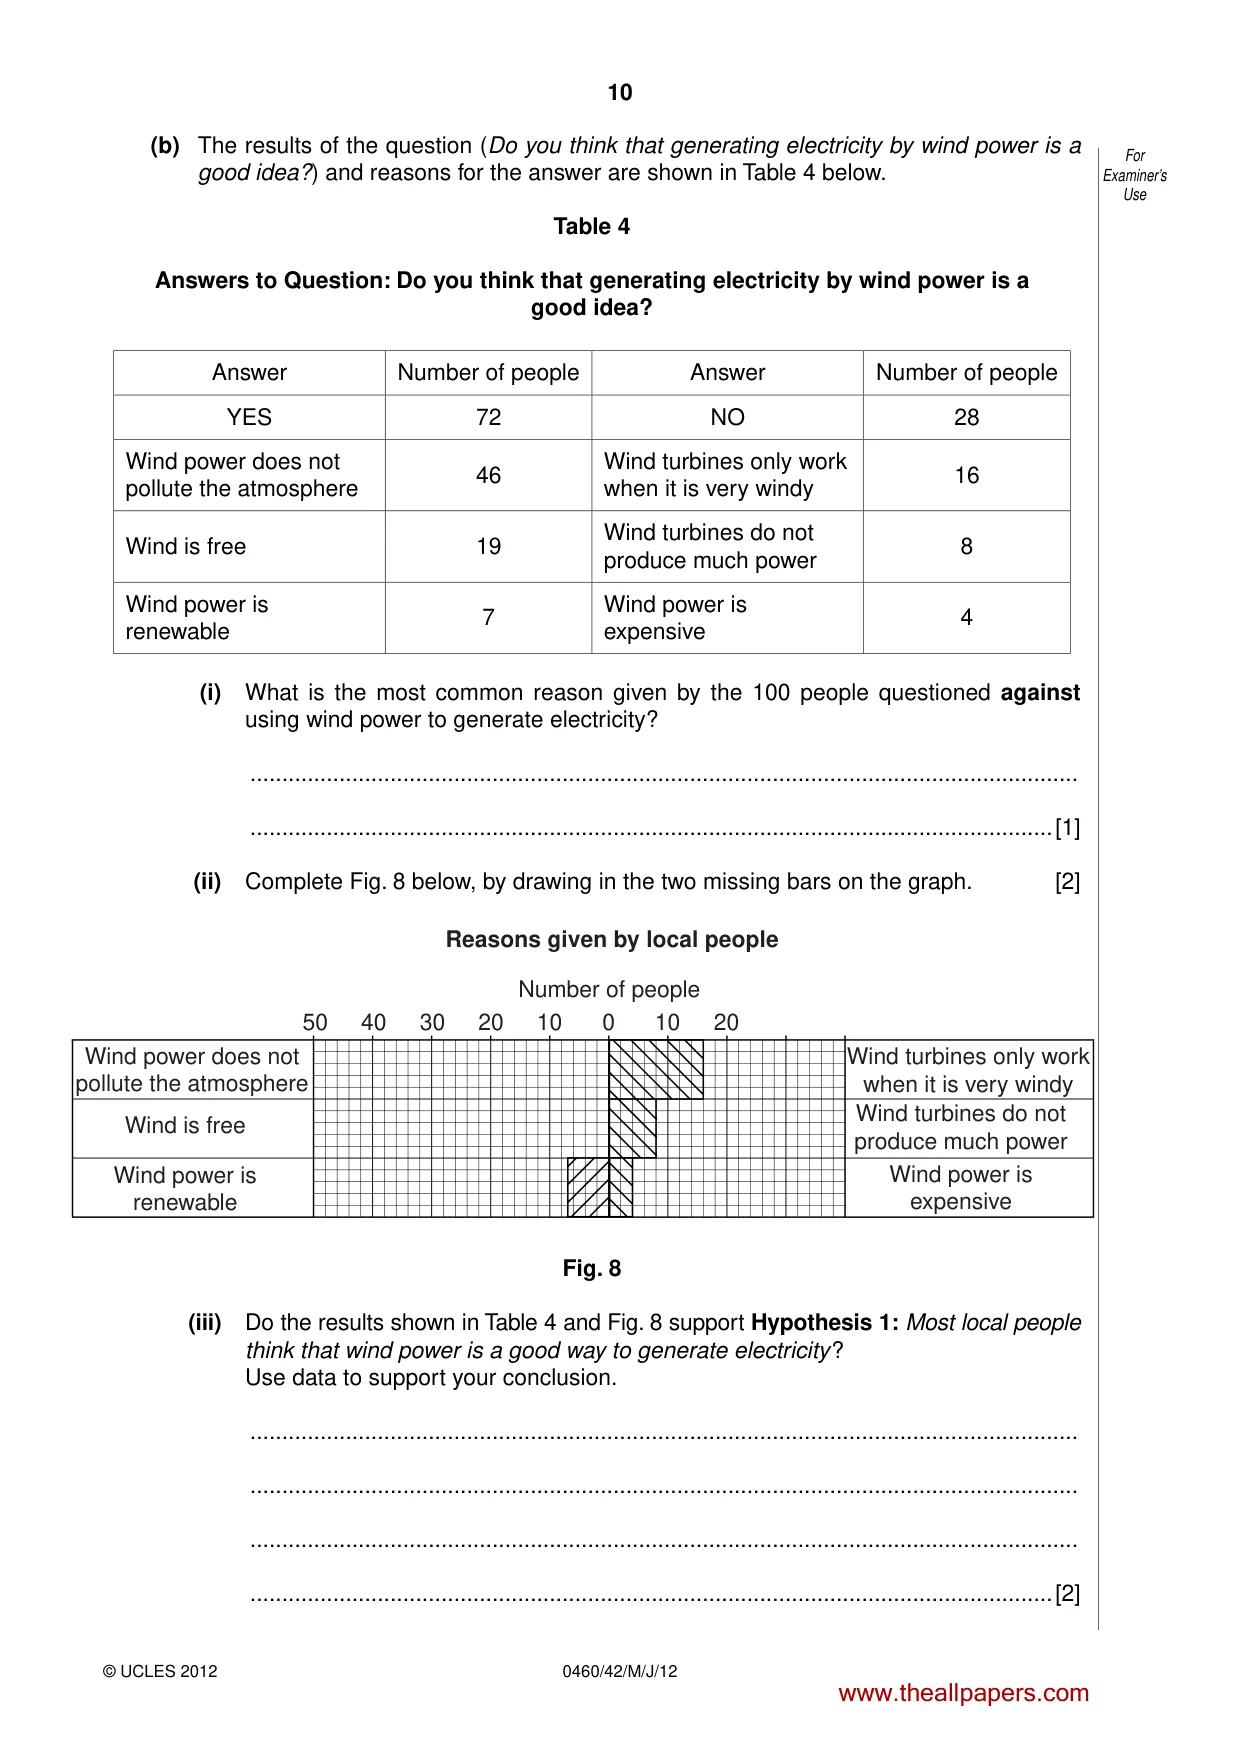
10 0460/42/M/J/12 © UCLES 2012 For Examiner’s Use (b) The results of the question (Do you think that generating electricity by wind power is a good idea?) and reasons for the answer are shown in Table 4 below. Table 4 Answers to Question: Do you think that generating electricity by wind power is a good idea? Answer Number of people Answer Number of people YES 72 NO 28 Wind power does not pollute the atmosphere 46 Wind turbines only work when it is very windy 16 Wind is free 19 Wind turbines do not produce much power 8 Wind power is renewable 7 Wind power is expensive 4 (i) What is the most common reason given by the 100 people questioned against using wind power to generate electricity? … …[1] (ii) Complete Fig. 8 below, by drawing in the two missing bars on the graph. [2] 0 10 20 10 20 30 40 50 Number of people Wind power does not pollute the atmosphere Wind turbines only work when it is very windy Wind turbines do not produce much power Wind power is expensive Wind is free Wind power is renewable Reasons given by local people Fig. 8 (iii) Do the results shown in Table 4 and Fig. 8 support Hypothesis 1: Most local people think that wind power is a good way to generate electricity ? Use data to support your conclusion. … … … …[2] www.theallpapers.com
Question paper, page 11
11 0460/42/M/J/12 © UCLES 2012 [Turn over For Examiner’s Use (iv) Suggest two reasons, not shown in Table 4, why wind power is a good way to generate electricity. 1 … … 2 … …[2] www.theallpapers.com
Question paper, page 12
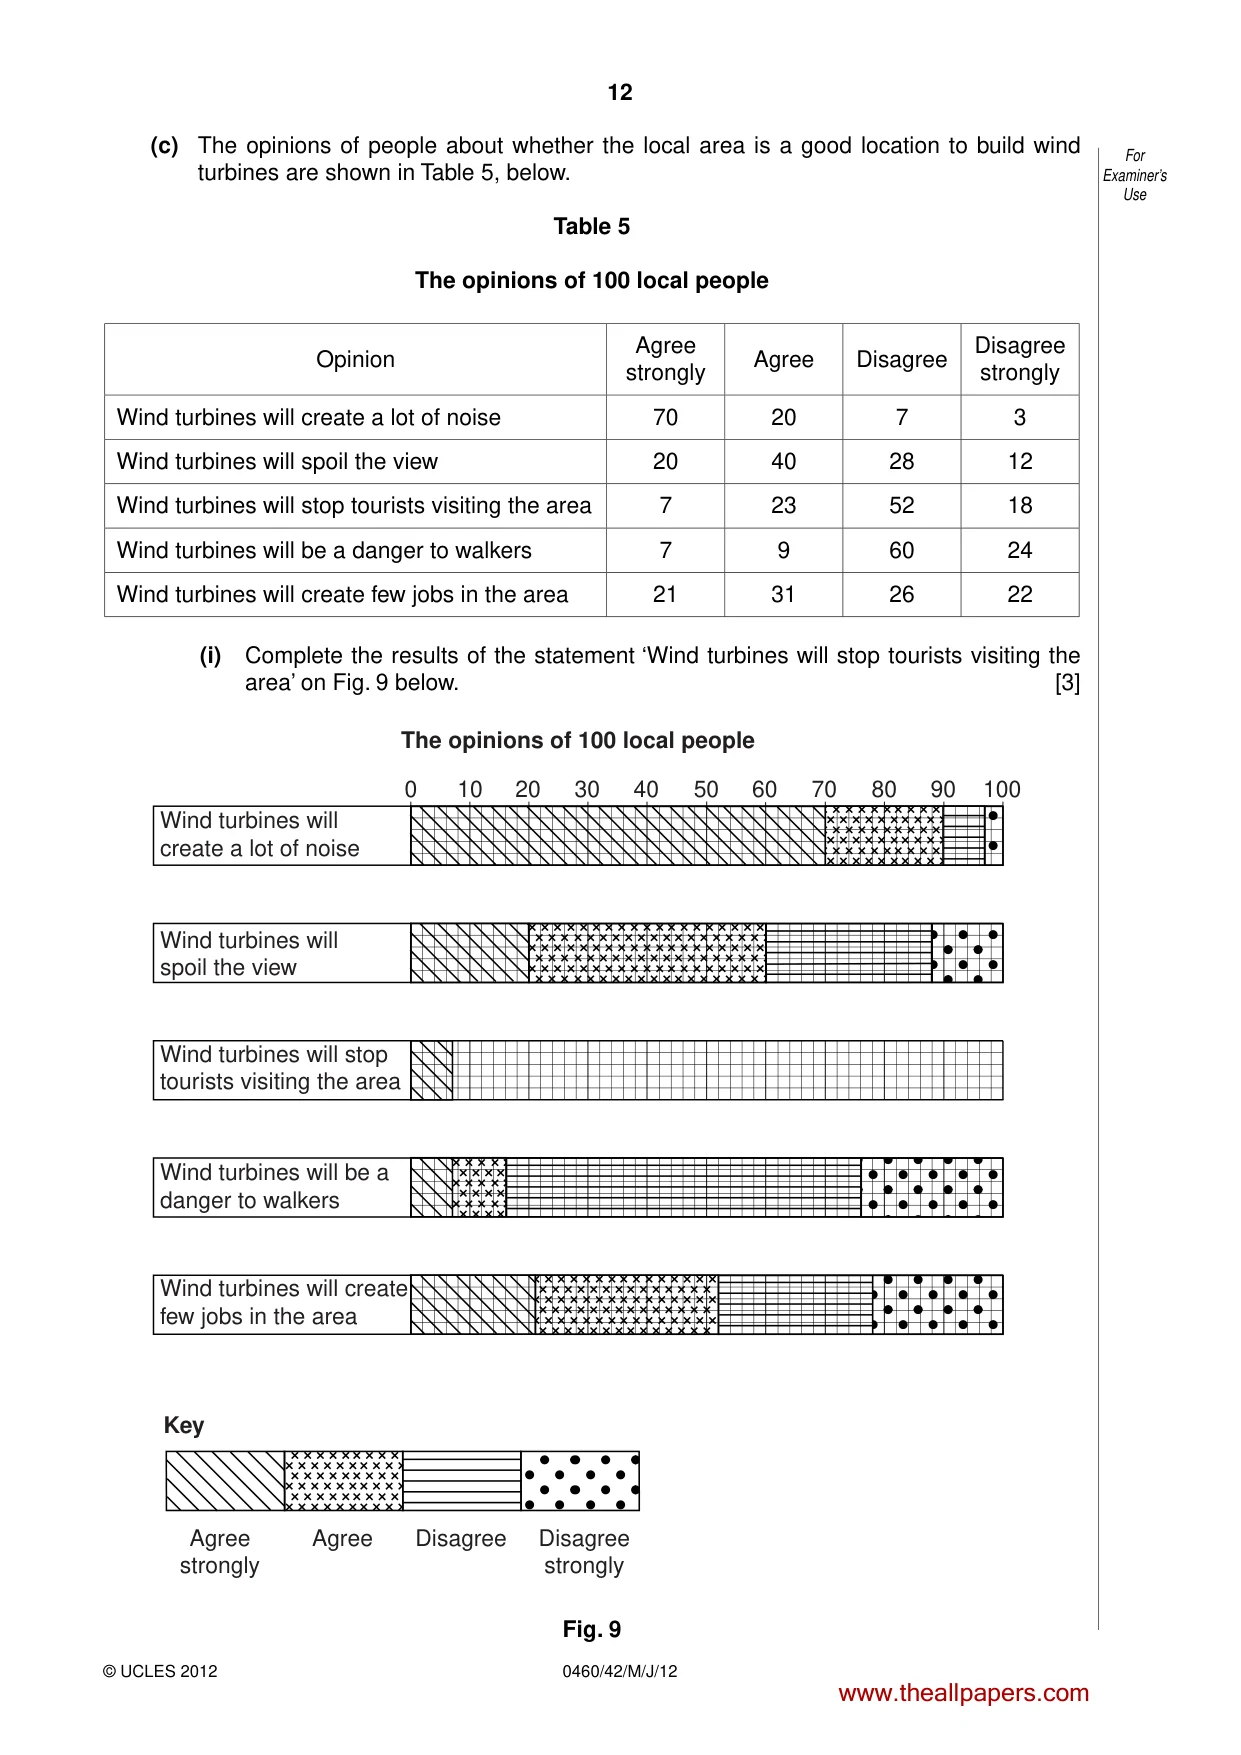
12 0460/42/M/J/12 © UCLES 2012 For Examiner’s Use (c) The opinions of people about whether the local area is a good location to build wind turbines are shown in Table 5, below. Table 5 The opinions of 100 local people Opinion Agree strongly Agree Disagree Disagree strongly Wind turbines will create a lot of noise 70 20 7 3 Wind turbines will spoil the view 20 40 28 12 Wind turbines will stop tourists visiting the area 7 23 52 18 Wind turbines will be a danger to walkers 7 9 60 24 Wind turbines will create few jobs in the area 21 31 26 22 (i) Complete the results of the statement ‘Wind turbines will stop tourists visiting the area’ on Fig. 9 below. [3] Wind turbines will create a lot of noise Wind turbines will spoil the view Wind turbines will stop tourists visiting the area Wind turbines will be a danger to walkers Wind turbines will create few jobs in the area 0 10 20 30 40 50 60 70 80 90 100 Key The opinions of 100 local people Agree strongly Disagree strongly Agree Disagree Fig. 9 www.theallpapers.com
Question paper, page 13
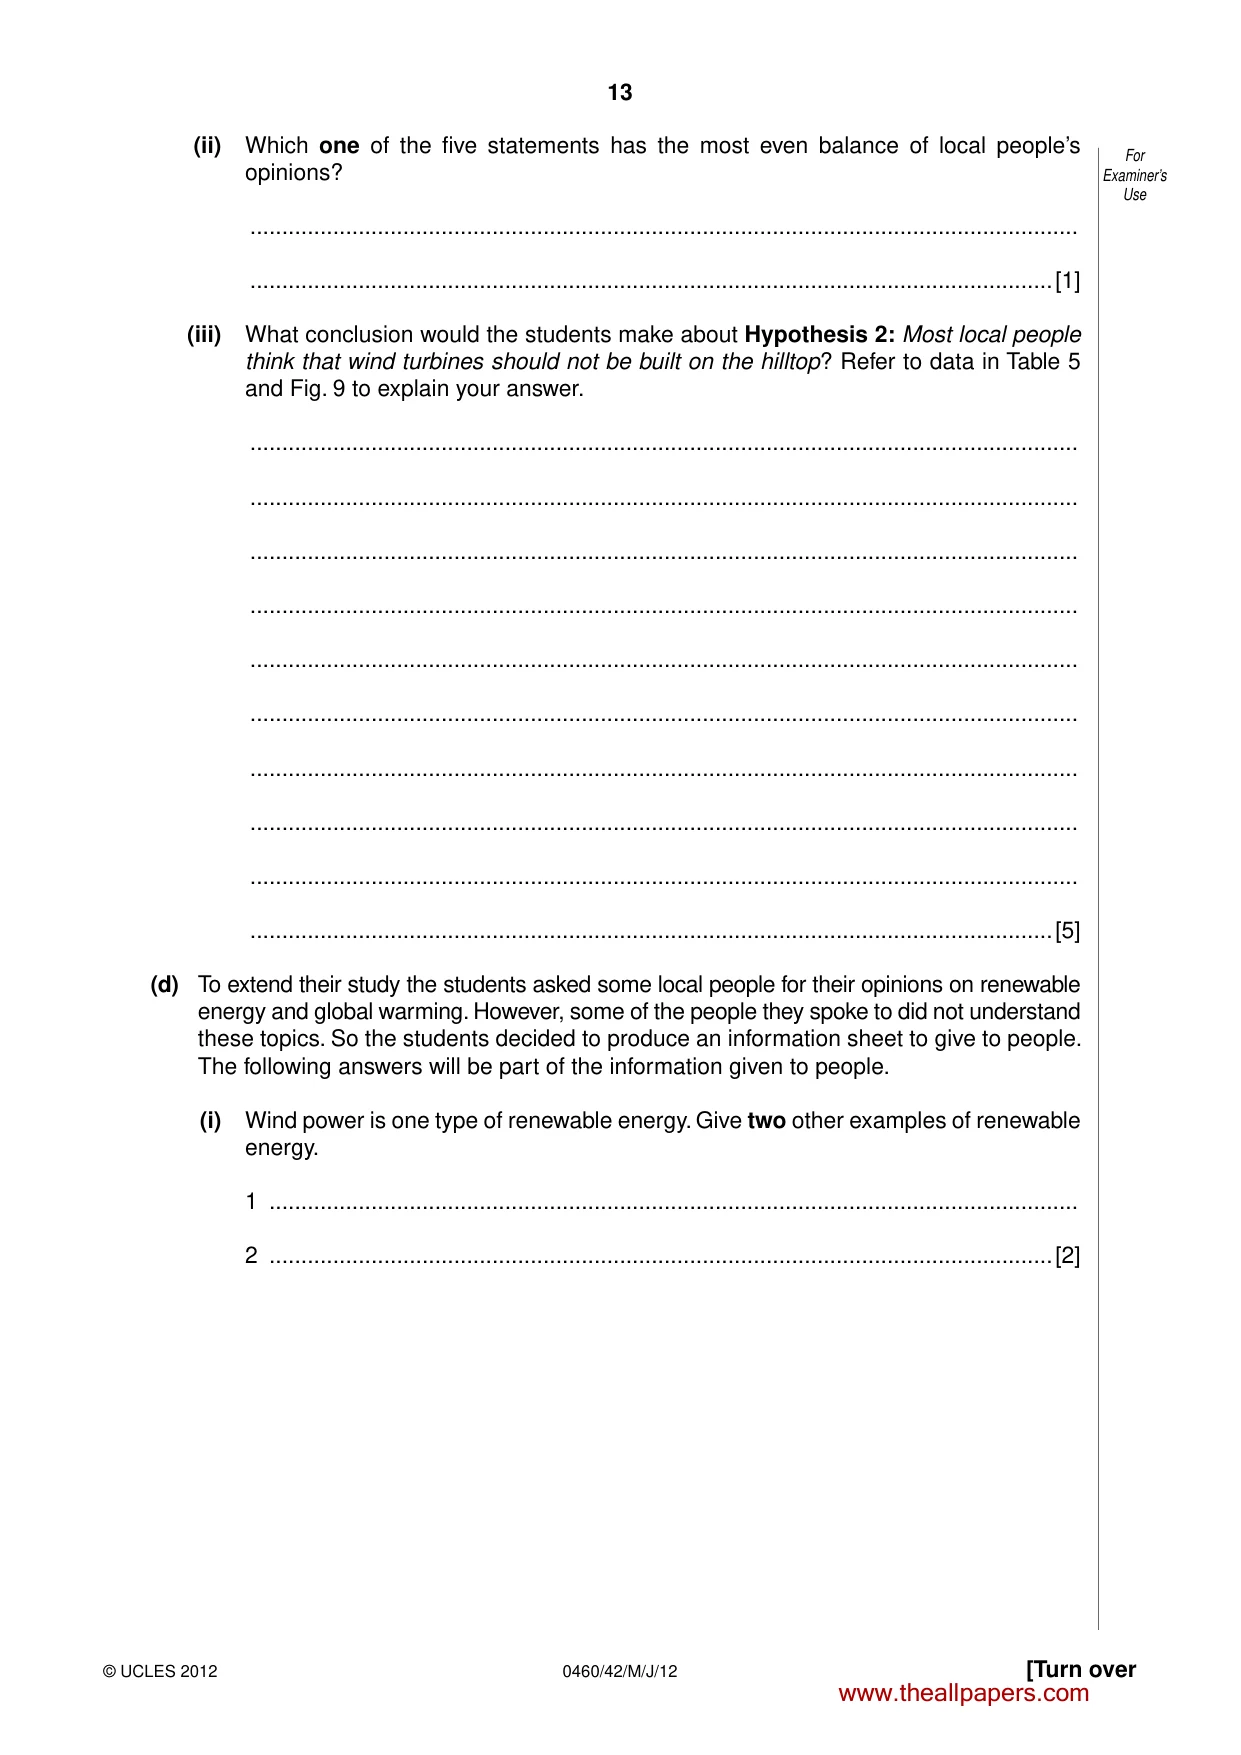
13 0460/42/M/J/12 © UCLES 2012 [Turn over For Examiner’s Use (ii) Which one of the five statements has the most even balance of local people’s opinions? … …[1] (iii) What conclusion would the students make about Hypothesis 2: Most local people think that wind turbines should not be built on the hilltop? Refer to data in Table 5 and Fig. 9 to explain your answer. … … … … … … … … … …[5] (d) To extend their study the students asked some local people for their opinions on renewable energy and global warming. However, some of the people they spoke to did not understand these topics. So the students decided to produce an information sheet to give to people. The following answers will be part of the information given to people. (i) Wind power is one type of renewable energy. Give two other examples of renewable energy. 1 … 2 …[2] www.theallpapers.com
Question paper, page 14
14 0460/42/M/J/12 © UCLES 2012 For Examiner’s Use (ii) Explain how global warming occurs. … … … … … … … …[4] [Total 30 marks] www.theallpapers.com
Question paper, page 15
15 0460/42/M/J/12 © UCLES 2012 BLANK PAGE www.theallpapers.com
Question paper, page 16
16 0460/42/M/J/12 © UCLES 2012 Permission to reproduce items where third-party owned material protected by copyright is included has been sought and cleared where possible. Every reasonable effort has been made by the publisher (UCLES) to trace copyright holders, but if any items requiring clearance have unwittingly been included, the publisher will be pleased to make amends at the earliest possible opportunity. University of Cambridge International Examinations is part of the Cambridge Assessment Group. Cambridge Assessment is the brand name of University of Cambridge Local Examinations Syndicate (UCLES), which is itself a department of the University of Cambridge. BLANK PAGE www.theallpapers.com
Mark scheme, page 1
UNIVERSITY OF CAMBRIDGE INTERNATIONAL EXAMINATIONS International General Certificate of Secondary Education MARK SCHEME for the May/June 2012 question paper for the guidance of teachers 0460 GEOGRAPHY 0460/42 Paper 4 (Alternative to Coursework), maximum raw mark 60 This mark scheme is published as an aid to teachers and candidates, to indicate the requirements of the examination. It shows the basis on which Examiners were instructed to award marks. It does not indicate the details of the discussions that took place at an Examiners’ meeting before marking began, which would have considered the acceptability of alternative answers. Mark schemes must be read in conjunction with the question papers and the report on the examination. • Cambridge will not enter into discussions or correspondence in connection with these mark schemes. Cambridge is publishing the mark schemes for the May/June 2012 question papers for most IGCSE, GCE Advanced Level and Advanced Subsidiary Level syllabuses and some Ordinary Level syllabuses. www.theallpapers.com
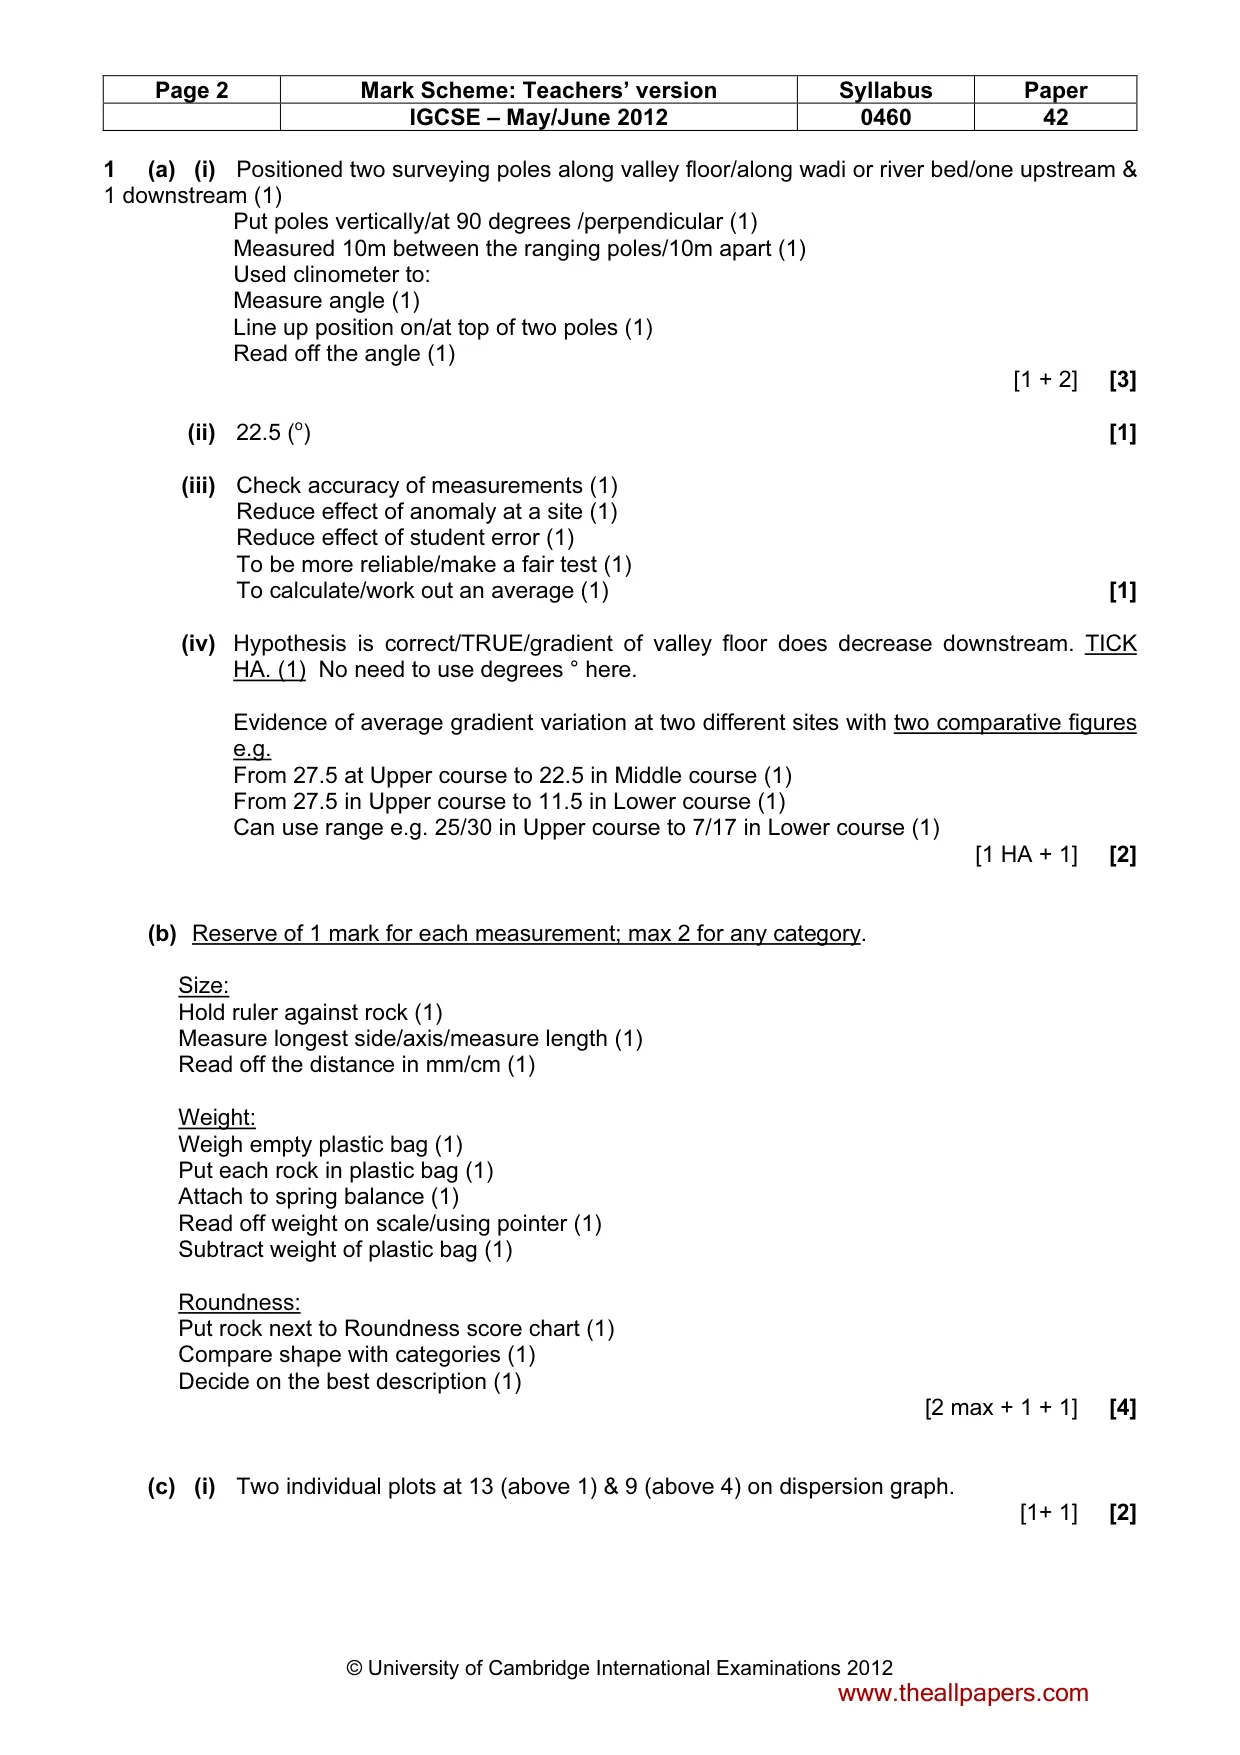
Mark scheme, page 2
Page 2 Mark Scheme: Teachers’ version Syllabus Paper IGCSE – May/June 2012 0460 42 © University of Cambridge International Examinations 2012 1 (a) (i) Positioned two surveying poles along valley floor/along wadi or river bed/one upstream & 1 downstream (1) Put poles vertically/at 90 degrees /perpendicular (1) Measured 10m between the ranging poles/10m apart (1) Used clinometer to: Measure angle (1) Line up position on/at top of two poles (1) Read off the angle (1) [1 + 2] [3] (ii) 22.5 (o) [1] (iii) Check accuracy of measurements (1) Reduce effect of anomaly at a site (1) Reduce effect of student error (1) To be more reliable/make a fair test (1) To calculate/work out an average (1) [1] (iv) Hypothesis is correct/TRUE/gradient of valley floor does decrease downstream. TICK HA. (1) No need to use degrees ° here. Evidence of average gradient variation at two different sites with two comparative figures e.g. From 27.5 at Upper course to 22.5 in Middle course (1) From 27.5 in Upper course to 11.5 in Lower course (1) Can use range e.g. 25/30 in Upper course to 7/17 in Lower course (1) [1 HA + 1] [2] (b) Reserve of 1 mark for each measurement; max 2 for any category. Size: Hold ruler against rock (1) Measure longest side/axis/measure length (1) Read off the distance in mm/cm (1) Weight: Weigh empty plastic bag (1) Put each rock in plastic bag (1) Attach to spring balance (1) Read off weight on scale/using pointer (1) Subtract weight of plastic bag (1) Roundness: Put rock next to Roundness score chart (1) Compare shape with categories (1) Decide on the best description (1) [2 max + 1 + 1] [4] (c) (i) Two individual plots at 13 (above 1) & 9 (above 4) on dispersion graph. [1+ 1] [2] www.theallpapers.com
Mark scheme, page 3
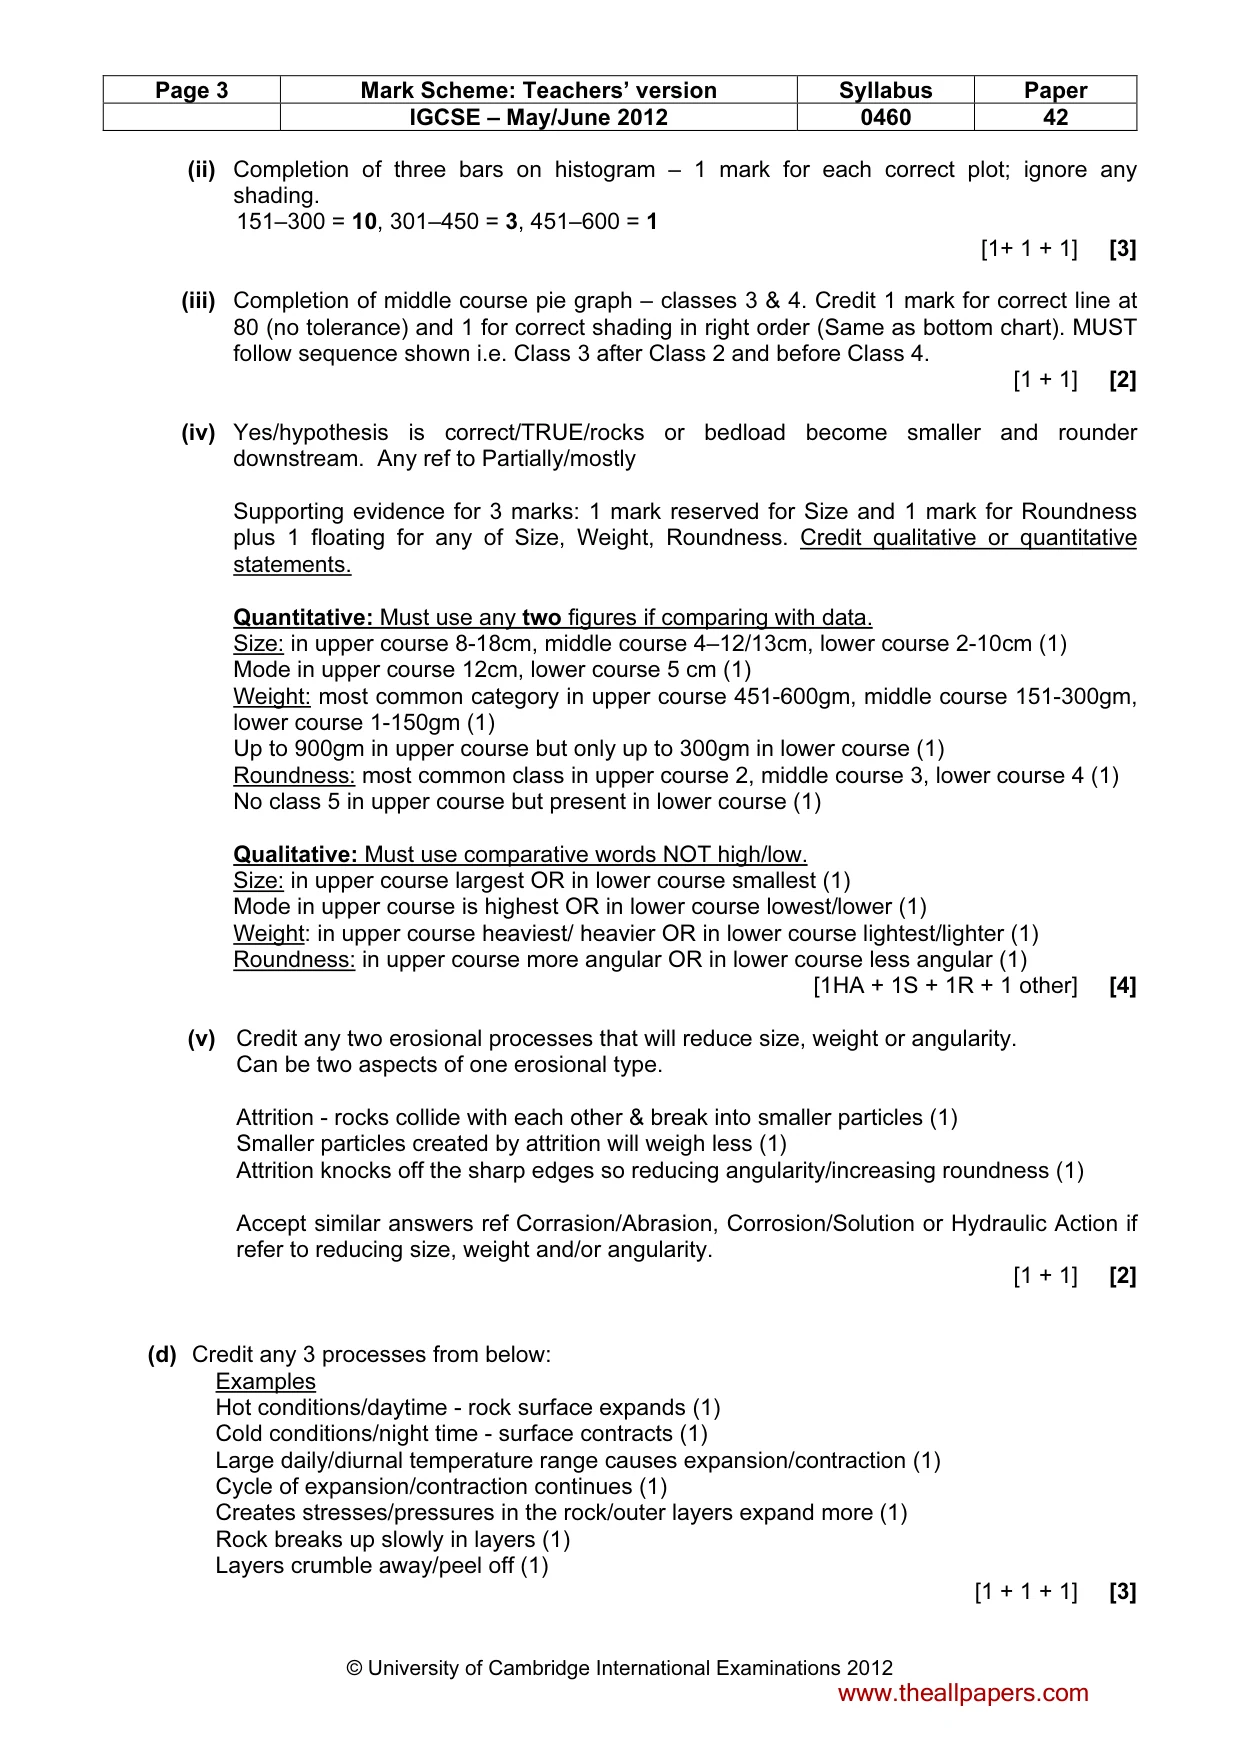
Page 3 Mark Scheme: Teachers’ version Syllabus Paper IGCSE – May/June 2012 0460 42 © University of Cambridge International Examinations 2012 (ii) Completion of three bars on histogram – 1 mark for each correct plot; ignore any shading. 151–300 = 10, 301–450 = 3, 451–600 = 1 [1+ 1 + 1] [3] (iii) Completion of middle course pie graph – classes 3 & 4. Credit 1 mark for correct line at 80 (no tolerance) and 1 for correct shading in right order (Same as bottom chart). MUST follow sequence shown i.e. Class 3 after Class 2 and before Class 4. [1 + 1] [2] (iv) Yes/hypothesis is correct/TRUE/rocks or bedload become smaller and rounder downstream. Any ref to Partially/mostly Supporting evidence for 3 marks: 1 mark reserved for Size and 1 mark for Roundness plus 1 floating for any of Size, Weight, Roundness. Credit qualitative or quantitative statements. Quantitative: Must use any two figures if comparing with data. Size: in upper course 8-18cm, middle course 4–12/13cm, lower course 2-10cm (1) Mode in upper course 12cm, lower course 5 cm (1) Weight: most common category in upper course 451-600gm, middle course 151-300gm, lower course 1-150gm (1) Up to 900gm in upper course but only up to 300gm in lower course (1) Roundness: most common class in upper course 2, middle course 3, lower course 4 (1) No class 5 in upper course but present in lower course (1) Qualitative: Must use comparative words NOT high/low. Size: in upper course largest OR in lower course smallest (1) Mode in upper course is highest OR in lower course lowest/lower (1) Weight: in upper course heaviest/ heavier OR in lower course lightest/lighter (1) Roundness: in upper course more angular OR in lower course less angular (1) [1HA + 1S + 1R + 1 other] [4] (v) Credit any two erosional processes that will reduce size, weight or angularity. Can be two aspects of one erosional type. Attrition - rocks collide with each other & break into smaller particles (1) Smaller particles created by attrition will weigh less (1) Attrition knocks off the sharp edges so reducing angularity/increasing roundness (1) Accept similar answers ref Corrasion/Abrasion, Corrosion/Solution or Hydraulic Action if refer to reducing size, weight and/or angularity. [1 + 1] [2] (d) Credit any 3 processes from below: Examples Hot conditions/daytime - rock surface expands (1) Cold conditions/night time - surface contracts (1) Large daily/diurnal temperature range causes expansion/contraction (1) Cycle of expansion/contraction continues (1) Creates stresses/pressures in the rock/outer layers expand more (1) Rock breaks up slowly in layers (1) Layers crumble away/peel off (1) [1 + 1 + 1] [3] www.theallpapers.com
Mark scheme, page 4
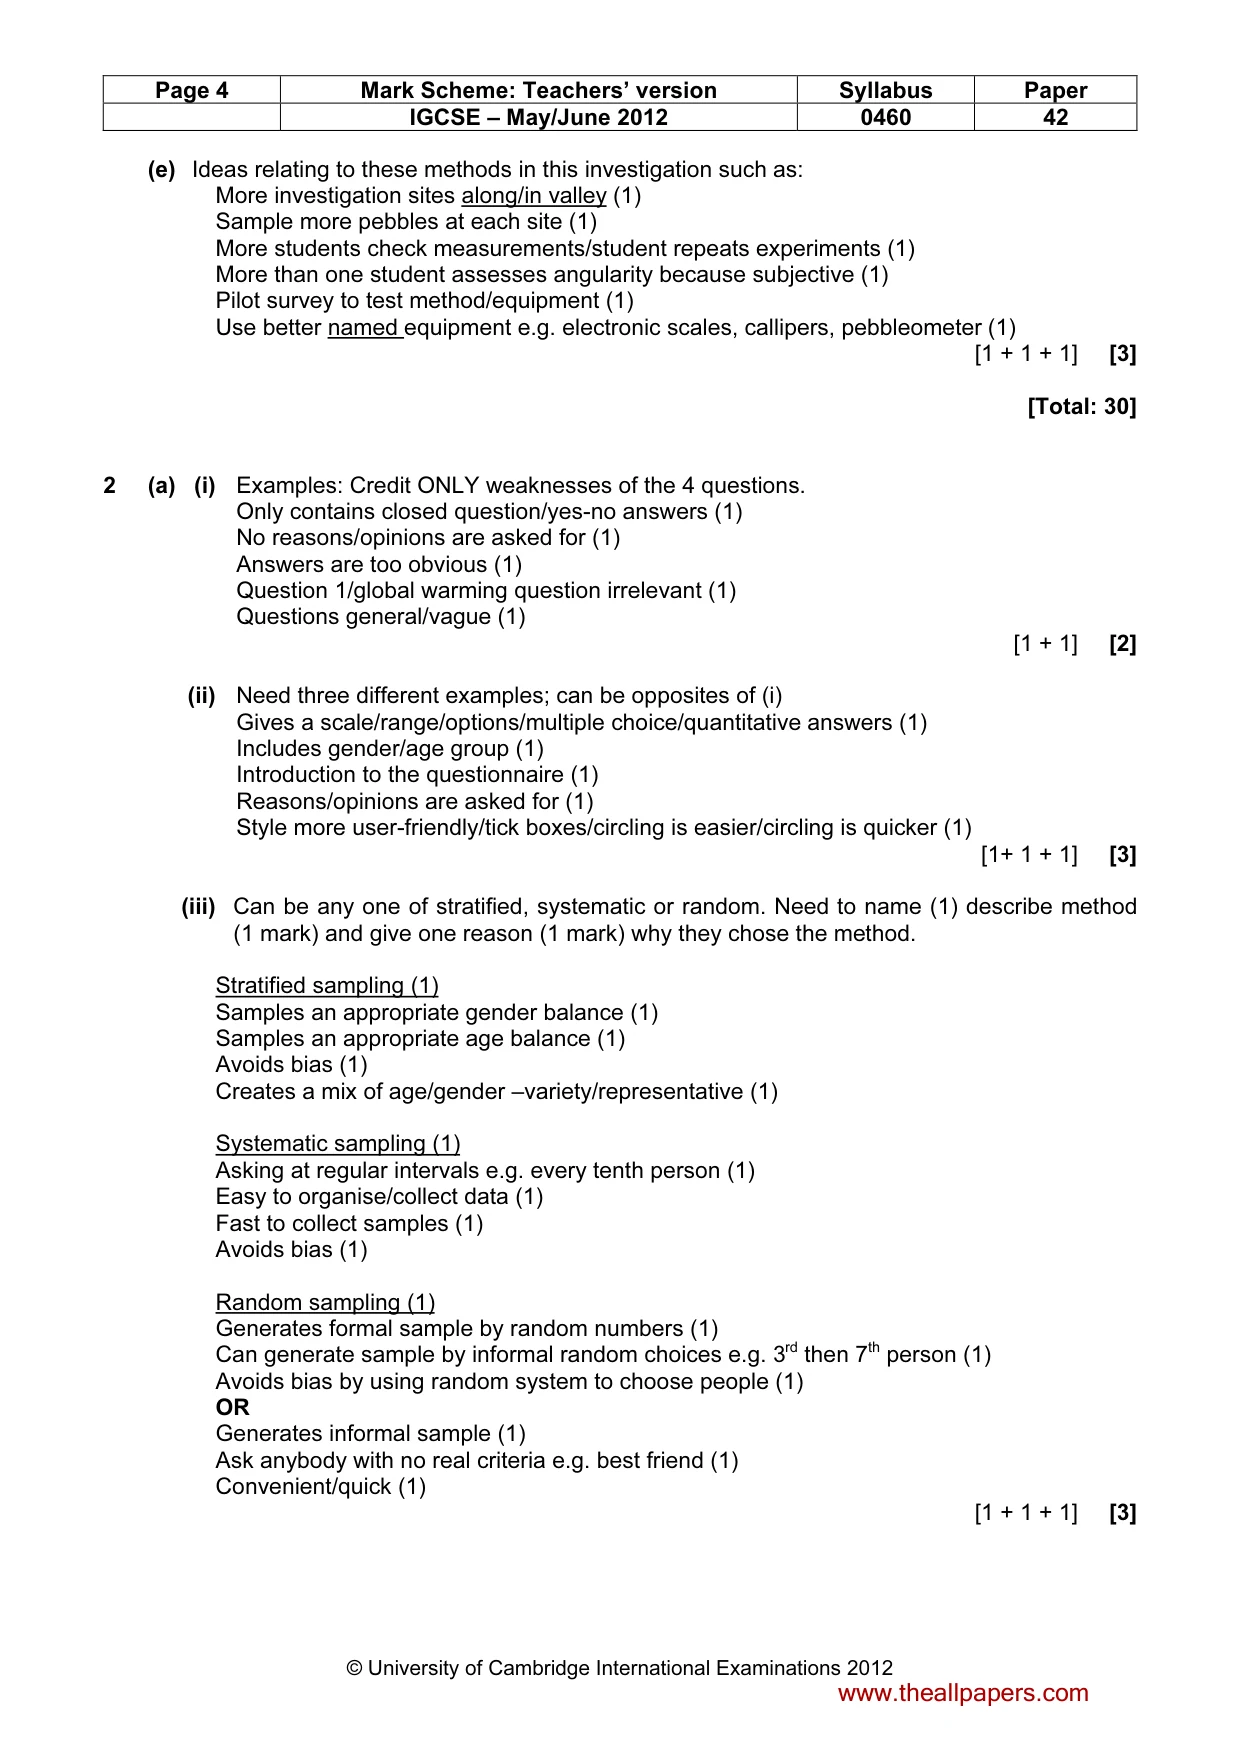
Page 4 Mark Scheme: Teachers’ version Syllabus Paper IGCSE – May/June 2012 0460 42 © University of Cambridge International Examinations 2012 (e) Ideas relating to these methods in this investigation such as: More investigation sites along/in valley (1) Sample more pebbles at each site (1) More students check measurements/student repeats experiments (1) More than one student assesses angularity because subjective (1) Pilot survey to test method/equipment (1) Use better named equipment e.g. electronic scales, callipers, pebbleometer (1) [1 + 1 + 1] [3] [Total: 30] 2 (a) (i) Examples: Credit ONLY weaknesses of the 4 questions. Only contains closed question/yes-no answers (1) No reasons/opinions are asked for (1) Answers are too obvious (1) Question 1/global warming question irrelevant (1) Questions general/vague (1) [1 + 1] [2] (ii) Need three different examples; can be opposites of (i) Gives a scale/range/options/multiple choice/quantitative answers (1) Includes gender/age group (1) Introduction to the questionnaire (1) Reasons/opinions are asked for (1) Style more user-friendly/tick boxes/circling is easier/circling is quicker (1) [1+ 1 + 1] [3] (iii) Can be any one of stratified, systematic or random. Need to name (1) describe method (1 mark) and give one reason (1 mark) why they chose the method. Stratified sampling (1) Samples an appropriate gender balance (1) Samples an appropriate age balance (1) Avoids bias (1) Creates a mix of age/gender –variety/representative (1) Systematic sampling (1) Asking at regular intervals e.g. every tenth person (1) Easy to organise/collect data (1) Fast to collect samples (1) Avoids bias (1) Random sampling (1) Generates formal sample by random numbers (1) Can generate sample by informal random choices e.g. 3rd then 7th person (1) Avoids bias by using random system to choose people (1) OR Generates informal sample (1) Ask anybody with no real criteria e.g. best friend (1) Convenient/quick (1) [1 + 1 + 1] [3] www.theallpapers.com
Mark scheme, page 5
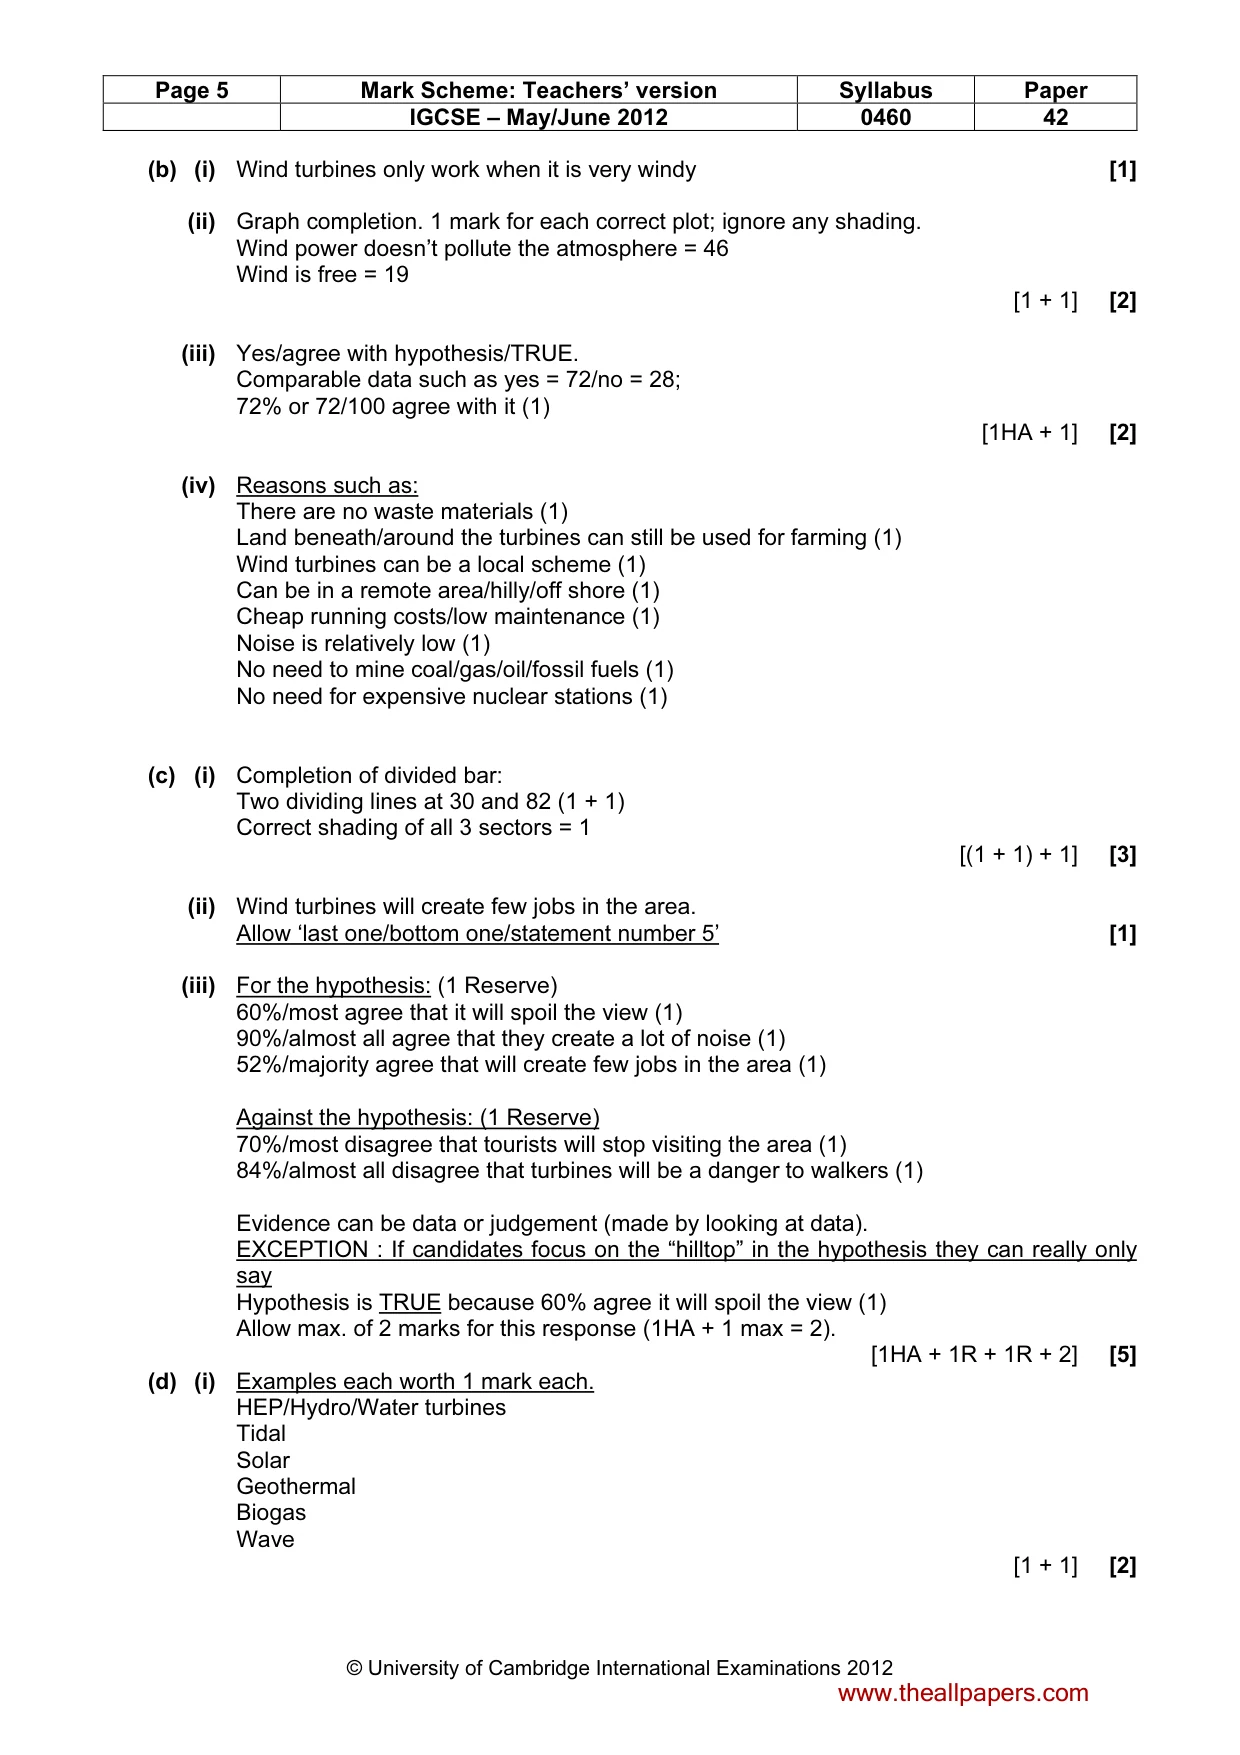
Page 5 Mark Scheme: Teachers’ version Syllabus Paper IGCSE – May/June 2012 0460 42 © University of Cambridge International Examinations 2012 (b) (i) Wind turbines only work when it is very windy [1] (ii) Graph completion. 1 mark for each correct plot; ignore any shading. Wind power doesn’t pollute the atmosphere = 46 Wind is free = 19 [1 + 1] [2] (iii) Yes/agree with hypothesis/TRUE. Comparable data such as yes = 72/no = 28; 72% or 72/100 agree with it (1) [1HA + 1] [2] (iv) Reasons such as: There are no waste materials (1) Land beneath/around the turbines can still be used for farming (1) Wind turbines can be a local scheme (1) Can be in a remote area/hilly/off shore (1) Cheap running costs/low maintenance (1) Noise is relatively low (1) No need to mine coal/gas/oil/fossil fuels (1) No need for expensive nuclear stations (1) (c) (i) Completion of divided bar: Two dividing lines at 30 and 82 (1 + 1) Correct shading of all 3 sectors = 1 [(1 + 1) + 1] [3] (ii) Wind turbines will create few jobs in the area. Allow ‘last one/bottom one/statement number 5’ [1] (iii) For the hypothesis: (1 Reserve) 60%/most agree that it will spoil the view (1) 90%/almost all agree that they create a lot of noise (1) 52%/majority agree that will create few jobs in the area (1) Against the hypothesis: (1 Reserve) 70%/most disagree that tourists will stop visiting the area (1) 84%/almost all disagree that turbines will be a danger to walkers (1) Evidence can be data or judgement (made by looking at data). EXCEPTION : If candidates focus on the “hilltop” in the hypothesis they can really only say Hypothesis is TRUE because 60% agree it will spoil the view (1) Allow max. of 2 marks for this response (1HA + 1 max = 2). [1HA + 1R + 1R + 2] [5] (d) (i) Examples each worth 1 mark each. HEP/Hydro/Water turbines Tidal Solar Geothermal Biogas Wave [1 + 1] [2] www.theallpapers.com
Mark scheme, page 6
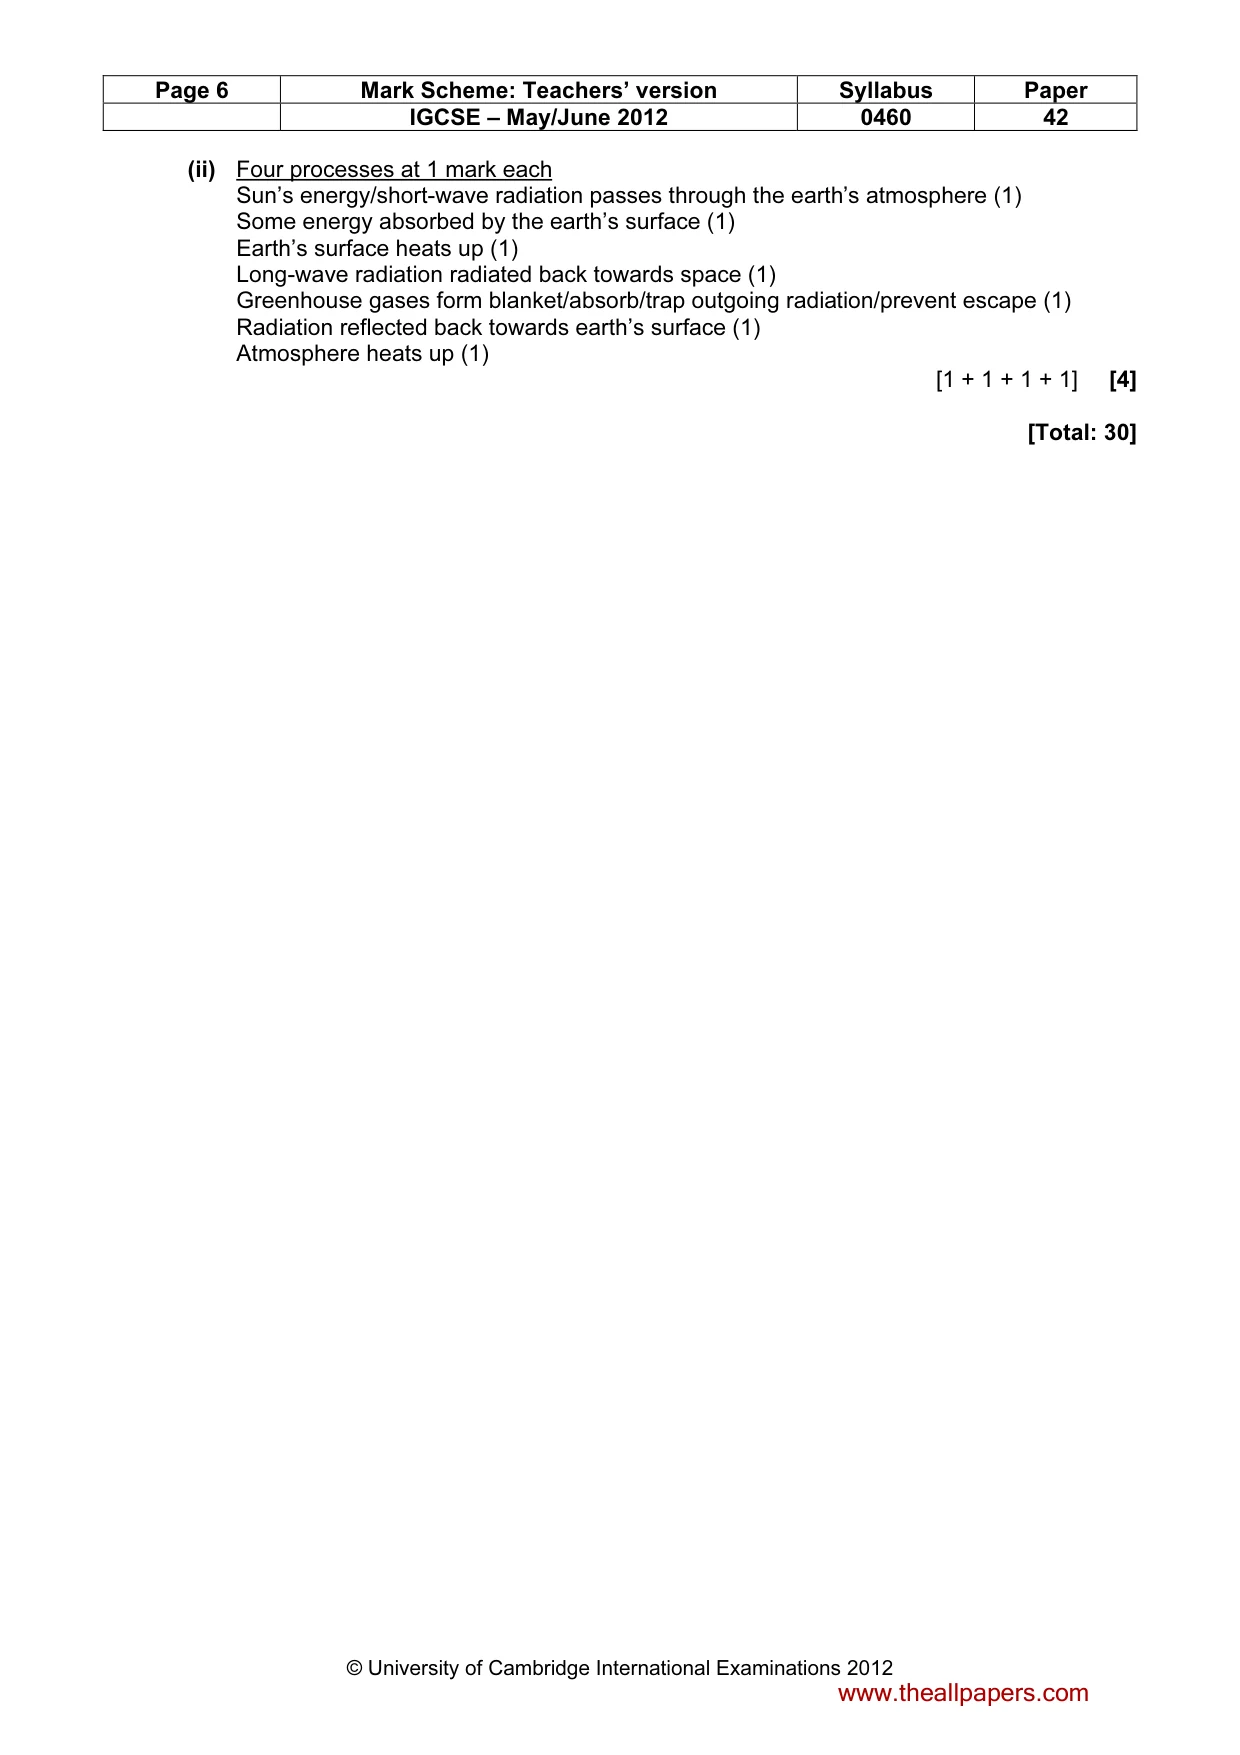
Page 6 Mark Scheme: Teachers’ version Syllabus Paper IGCSE – May/June 2012 0460 42 © University of Cambridge International Examinations 2012 (ii) Four processes at 1 mark each Sun’s energy/short-wave radiation passes through the earth’s atmosphere (1) Some energy absorbed by the earth’s surface (1) Earth’s surface heats up (1) Long-wave radiation radiated back towards space (1) Greenhouse gases form blanket/absorb/trap outgoing radiation/prevent escape (1) Radiation reflected back towards earth’s surface (1) Atmosphere heats up (1) [1 + 1 + 1 + 1] [4] [Total: 30] www.theallpapers.com
What you needed in this session
Cambridge’s own grade thresholds for 2012 May/June, Paper 4 · Variant 2. A higher threshold means an easier paper — the bar moves with how the cohort did.