Cambridge IGCSE Geography 0460 — 2012 May/June Paper 4 · Variant 1
0460/41/M/J/12 · 60 marks · ≈68 min
The question paper and its mark scheme, free to read here and free to download. This is Cambridge’s own paper, exactly as it was sat.
Question paper16 pages



Mark scheme7 pages
Answers below. Sit the paper first if you are practising.
Paper as text
Question paper, page 1
This document consists of 13 printed pages, 3 blank pages and 1 Insert. DC (NF/SW) 46967/5 © UCLES 2012 [Turn over UNIVERSITY OF CAMBRIDGE INTERNATIONAL EXAMINATIONS International General Certificate of Secondary Education * 5 0 1 8 3 0 5 2 1 1 * GEOGRAPHY 0460/41 Paper 4 Alternative to Coursework May/June 2012 1 hour 30 minutes Candidates answer on the Question Paper. Additional Materials: Calculator Ruler Protractor READ THESE INSTRUCTIONS FIRST Write your Centre number, candidate number and name in the spaces provided. Write in dark blue or black pen. You may use a soft pencil for any diagrams, graphs or rough working. Do not use staples, paper clips, highlighters, glue or correction fluid. DO NOT WRITE ON ANY BARCODES. Answer all questions. The Insert contains Fig. 1 and Table 1 for Question 1. The Insert is not required by the Examiner. Sketch maps and diagrams should be drawn whenever they serve to illustrate an answer. The number of marks is given in brackets [ ] at the end of each question or part question. For Examiner’s Use Q1 Q2 Total www.theallpapers.com
Question paper, page 2
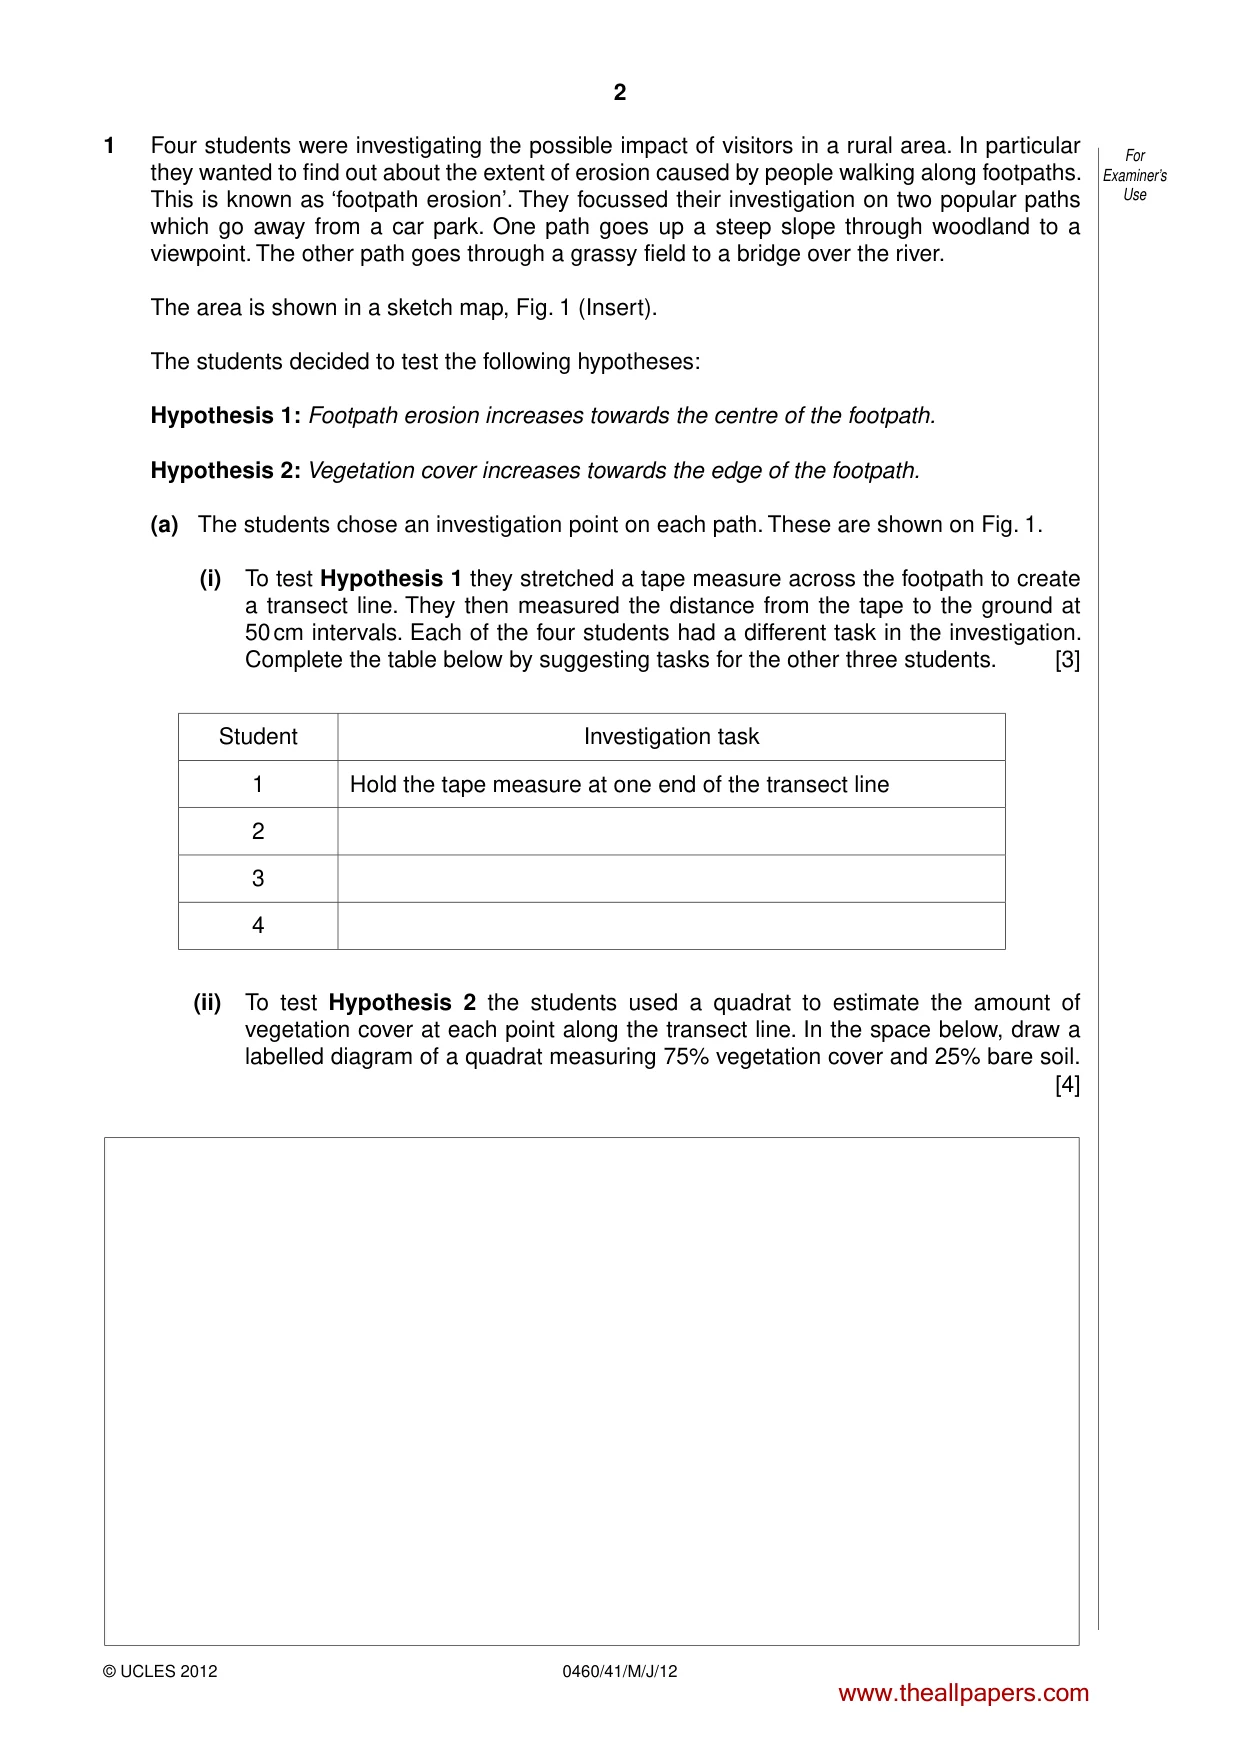
2 0460/41/M/J/12 © UCLES 2012 For Examiner’s Use 1 Four students were investigating the possible impact of visitors in a rural area. In particular they wanted to find out about the extent of erosion caused by people walking along footpaths. This is known as ‘footpath erosion’. They focussed their investigation on two popular paths which go away from a car park. One path goes up a steep slope through woodland to a viewpoint. The other path goes through a grassy field to a bridge over the river. The area is shown in a sketch map, Fig. 1 (Insert). The students decided to test the following hypotheses: Hypothesis 1: Footpath erosion increases towards the centre of the footpath. Hypothesis 2: Vegetation cover increases towards the edge of the footpath. (a) The students chose an investigation point on each path. These are shown on Fig. 1. (i) To test Hypothesis 1 they stretched a tape measure across the footpath to create a transect line. They then measured the distance from the tape to the ground at 50 cm intervals. Each of the four students had a different task in the investigation. Complete the table below by suggesting tasks for the other three students. [3] Student Investigation task 1 Hold the tape measure at one end of the transect line 2 3 4 (ii) To test Hypothesis 2 the students used a quadrat to estimate the amount of vegetation cover at each point along the transect line. In the space below, draw a labelled diagram of a quadrat measuring 75% vegetation cover and 25% bare soil. [4] www.theallpapers.com
Question paper, page 3
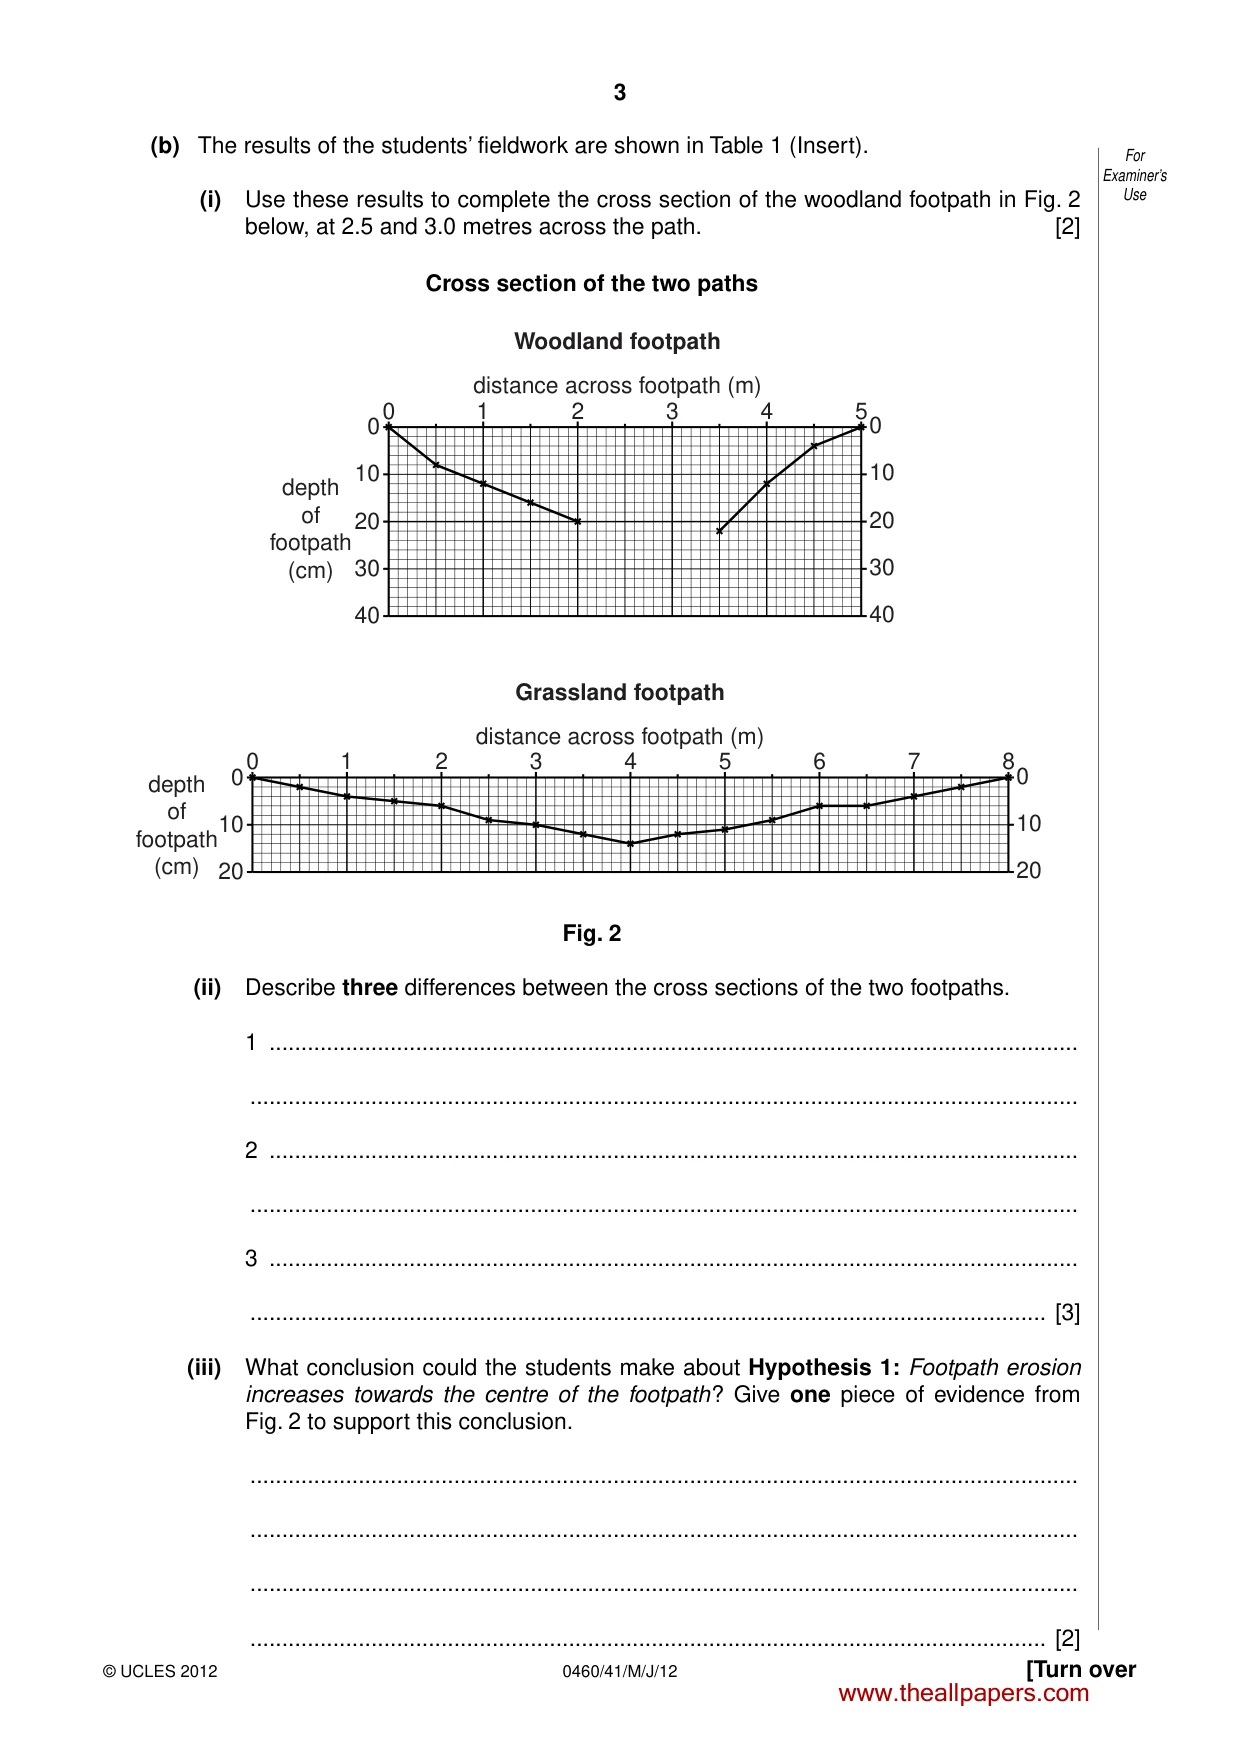
3 0460/41/M/J/12 © UCLES 2012 [Turn over For Examiner’s Use (b) The results of the students’ fieldwork are shown in Table 1 (Insert). (i) Use these results to complete the cross section of the woodland footpath in Fig. 2 below, at 2.5 and 3.0 metres across the path. [2] Cross section of the two paths 40 30 20 depth of footpath (cm) depth of footpath (cm) distance across footpath (m) Woodland footpath distance across footpath (m) Grassland footpath 10 00 1 2 3 4 5 40 30 20 10 0 20 10 00 1 2 3 4 5 6 7 8 20 10 0 Fig. 2 (ii) Describe three differences between the cross sections of the two footpaths. 1 … … 2 … … 3 … … [3] (iii) What conclusion could the students make about Hypothesis 1: Footpath erosion increases towards the centre of the footpath? Give one piece of evidence from Fig. 2 to support this conclusion. … … … … [2] www.theallpapers.com
Question paper, page 4
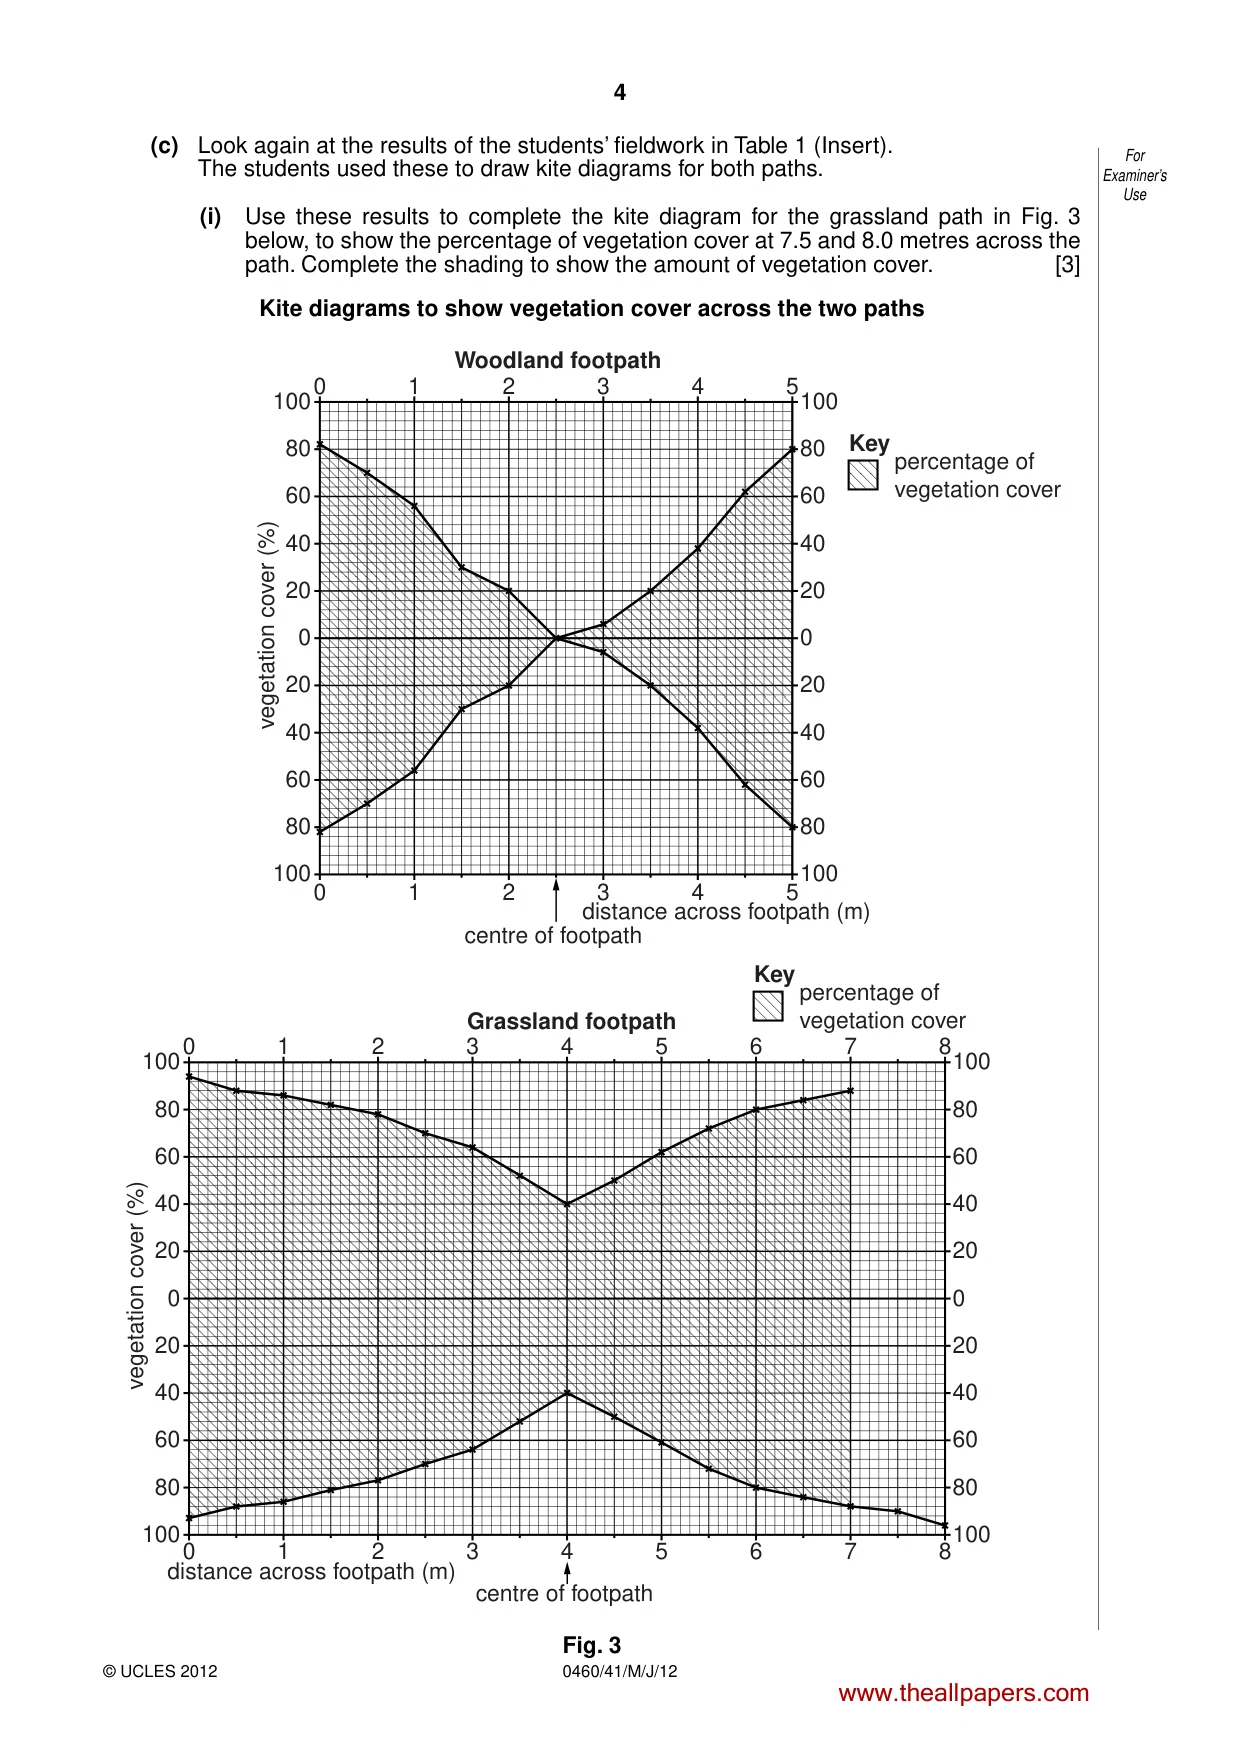
4 0460/41/M/J/12 © UCLES 2012 For Examiner’s Use (c) Look again at the results of the students’ fieldwork in Table 1 (Insert). The students used these to draw kite diagrams for both paths. (i) Use these results to complete the kite diagram for the grassland path in Fig. 3 below, to show the percentage of vegetation cover at 7.5 and 8.0 metres across the path. Complete the shading to show the amount of vegetation cover. [3] Kite diagrams to show vegetation cover across the two paths distance across footpath (m) Grassland footpath Key percentage of vegetation cover Key percentage of vegetation cover 1000 1 2 3 4 5 6 7 8 0 1 2 3 4 centre of footpath 5 6 7 8 80 60 40 20 0 vegetation cover (%) 20 40 60 80 100 100 80 60 40 20 0 20 40 60 80 100 distance across footpath (m) Woodland footpath 1000 1 2 3 4 5 0 1 2 3 4 5 80 60 40 20 0 vegetation cover (%) 20 40 60 80 100 100 80 60 40 20 0 20 40 60 80 100 centre of footpath Fig. 3 www.theallpapers.com
Question paper, page 5
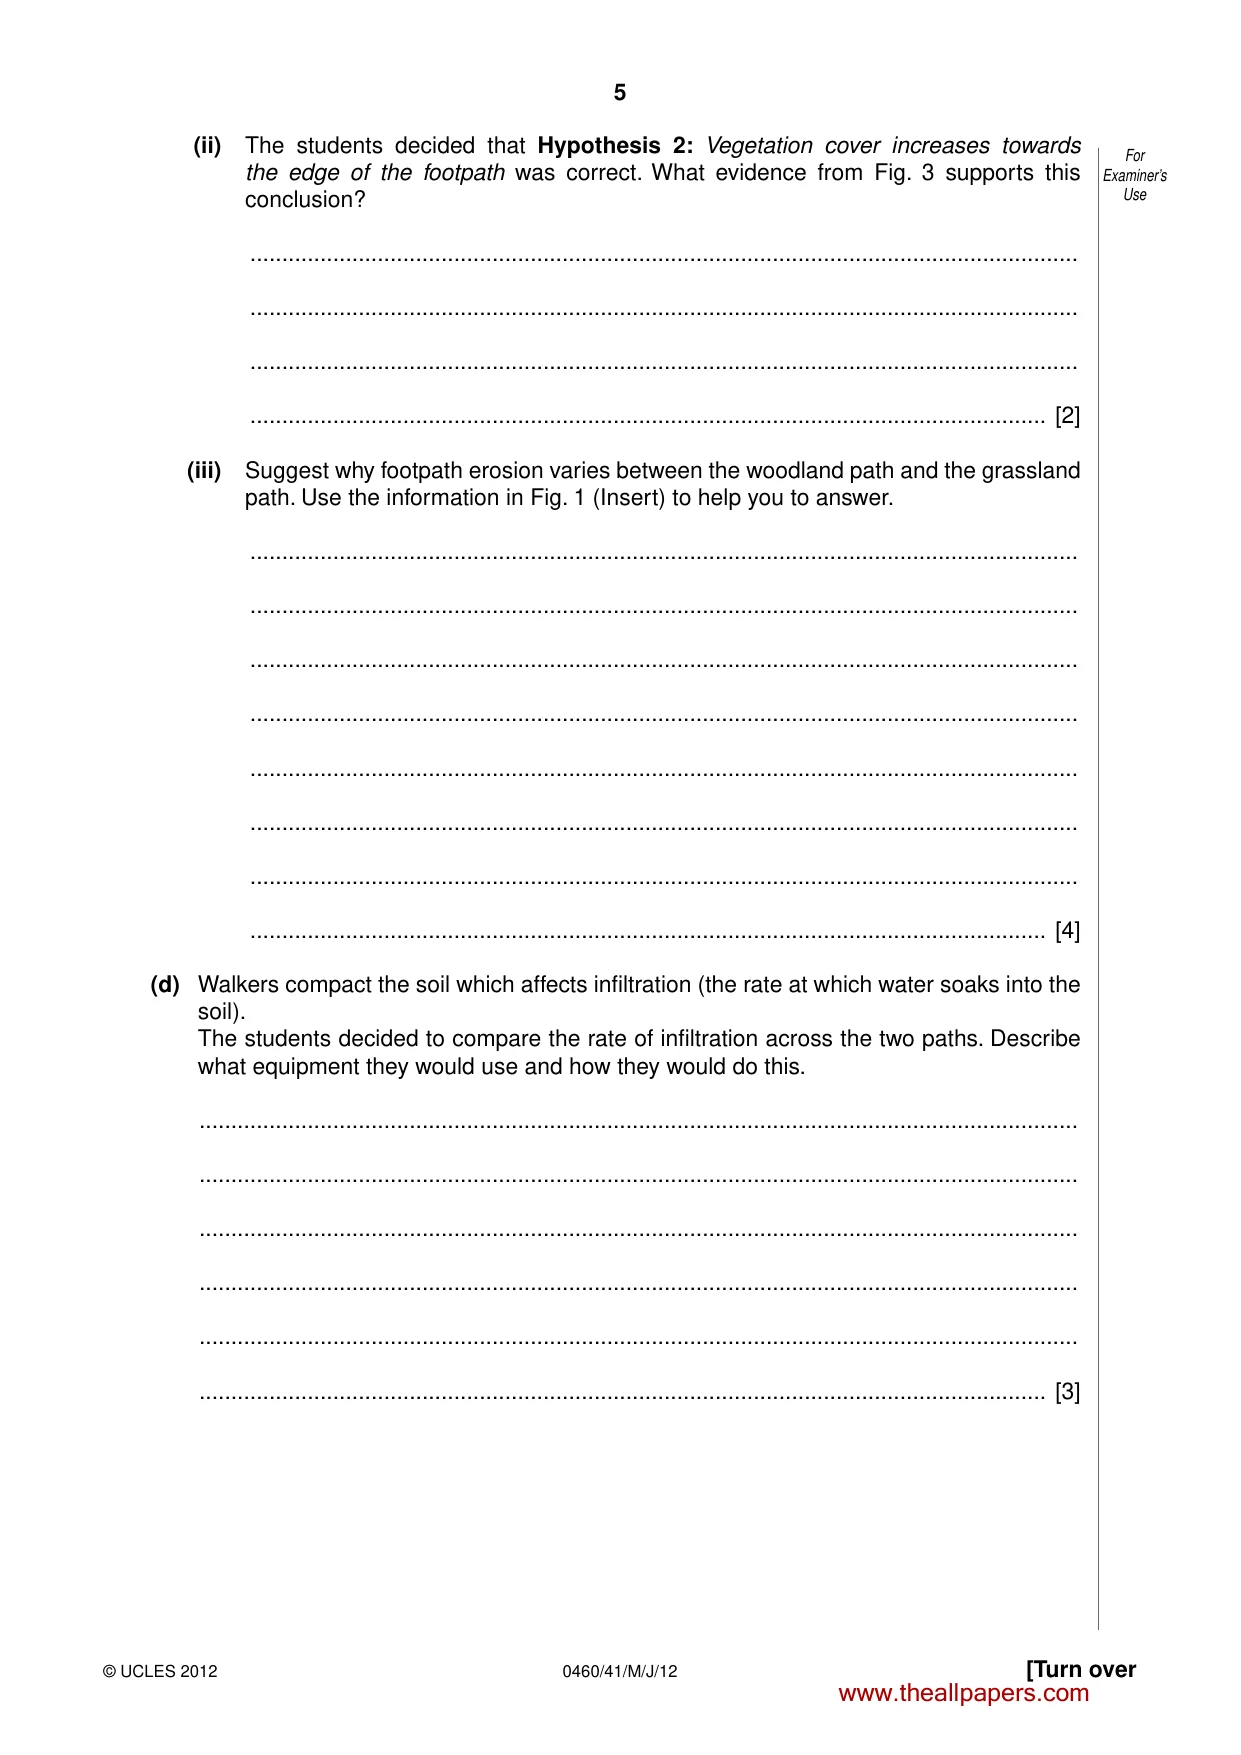
5 0460/41/M/J/12 © UCLES 2012 [Turn over For Examiner’s Use (ii) The students decided that Hypothesis 2: Vegetation cover increases towards the edge of the footpath was correct. What evidence from Fig. 3 supports this conclusion? … … … … [2] (iii) Suggest why footpath erosion varies between the woodland path and the grassland path. Use the information in Fig. 1 (Insert) to help you to answer. … … … … … … … … [4] (d) Walkers compact the soil which affects infiltration (the rate at which water soaks into the soil). The students decided to compare the rate of infiltration across the two paths. Describe what equipment they would use and how they would do this. … … … … … … [3] www.theallpapers.com
Question paper, page 6
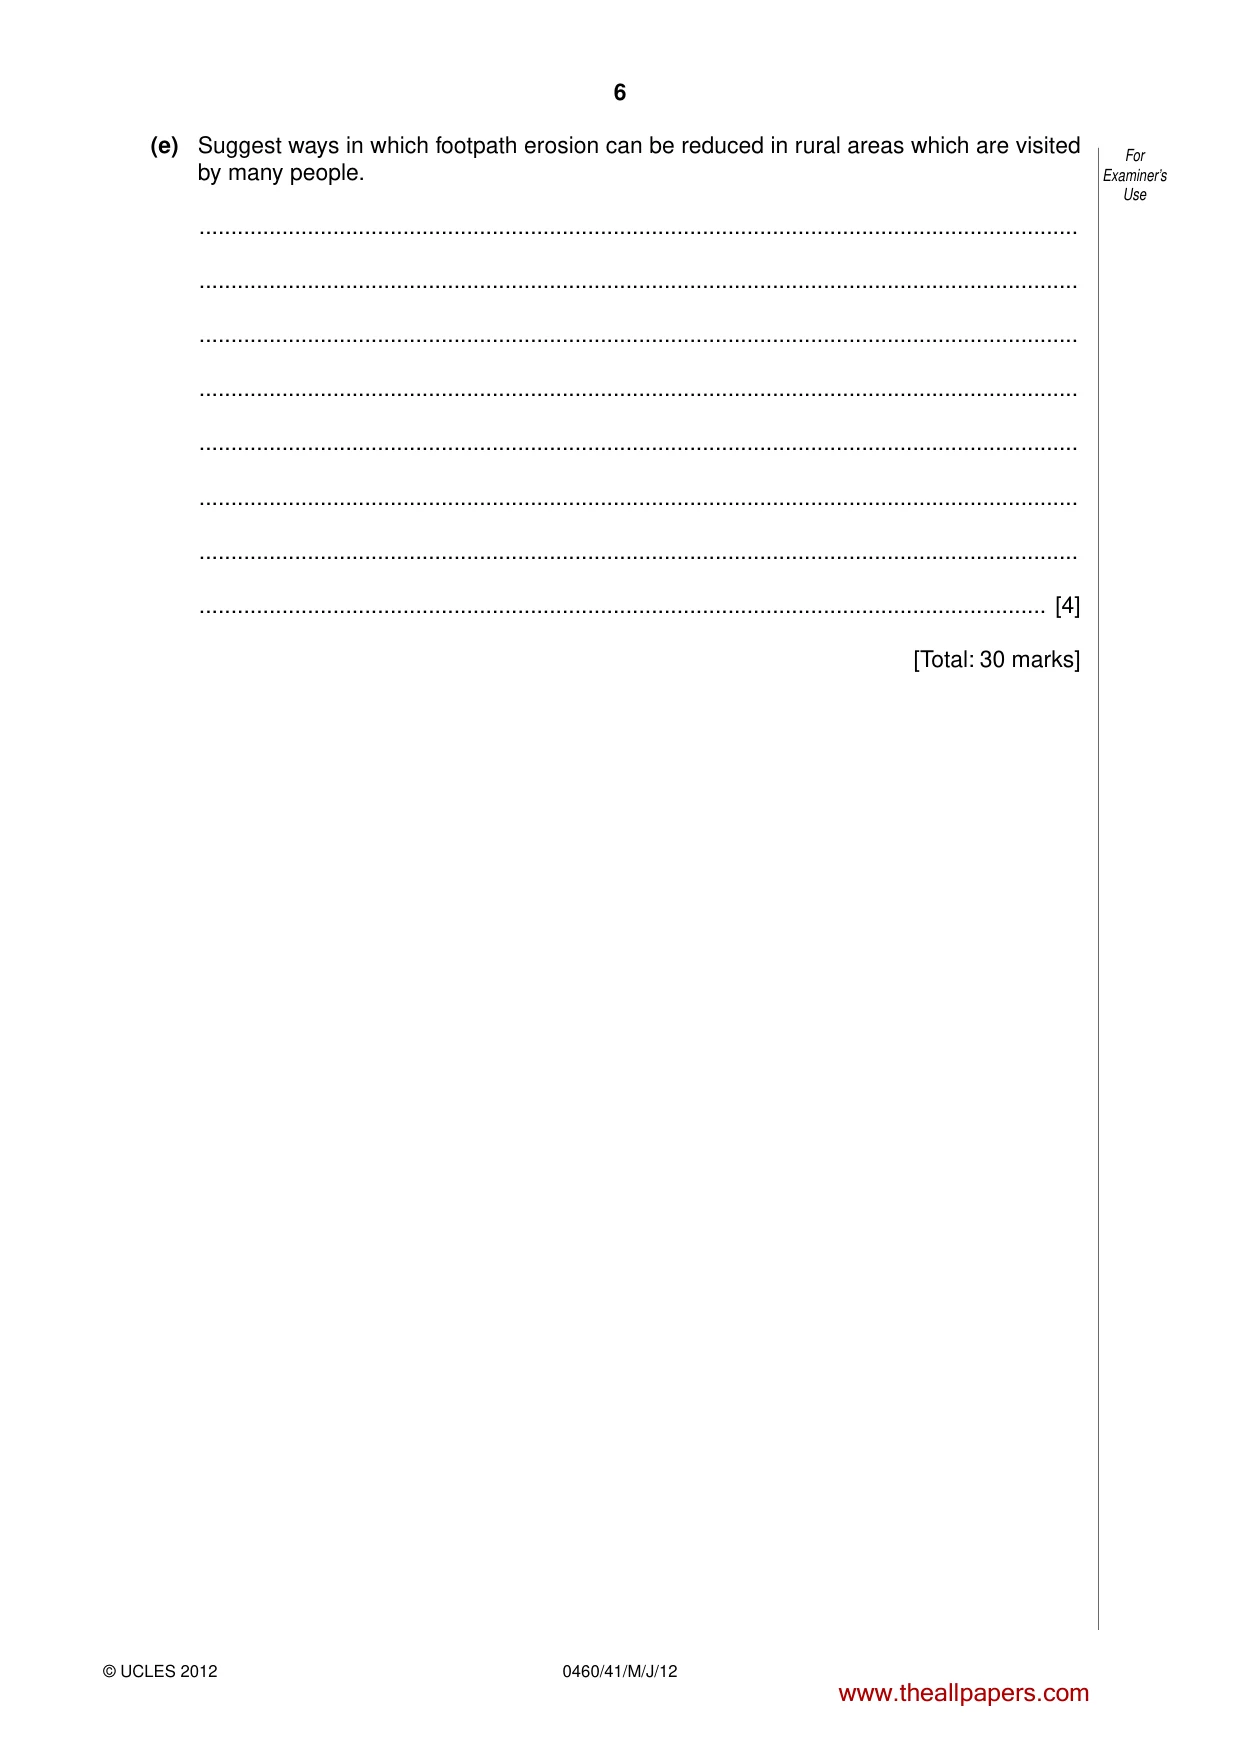
6 0460/41/M/J/12 © UCLES 2012 For Examiner’s Use (e) Suggest ways in which footpath erosion can be reduced in rural areas which are visited by many people. … … … … … … … … [4] [Total: 30 marks] www.theallpapers.com
Question paper, page 7
7 0460/41/M/J/12 © UCLES 2012 [Turn over BLANK PAGE www.theallpapers.com
Question paper, page 8
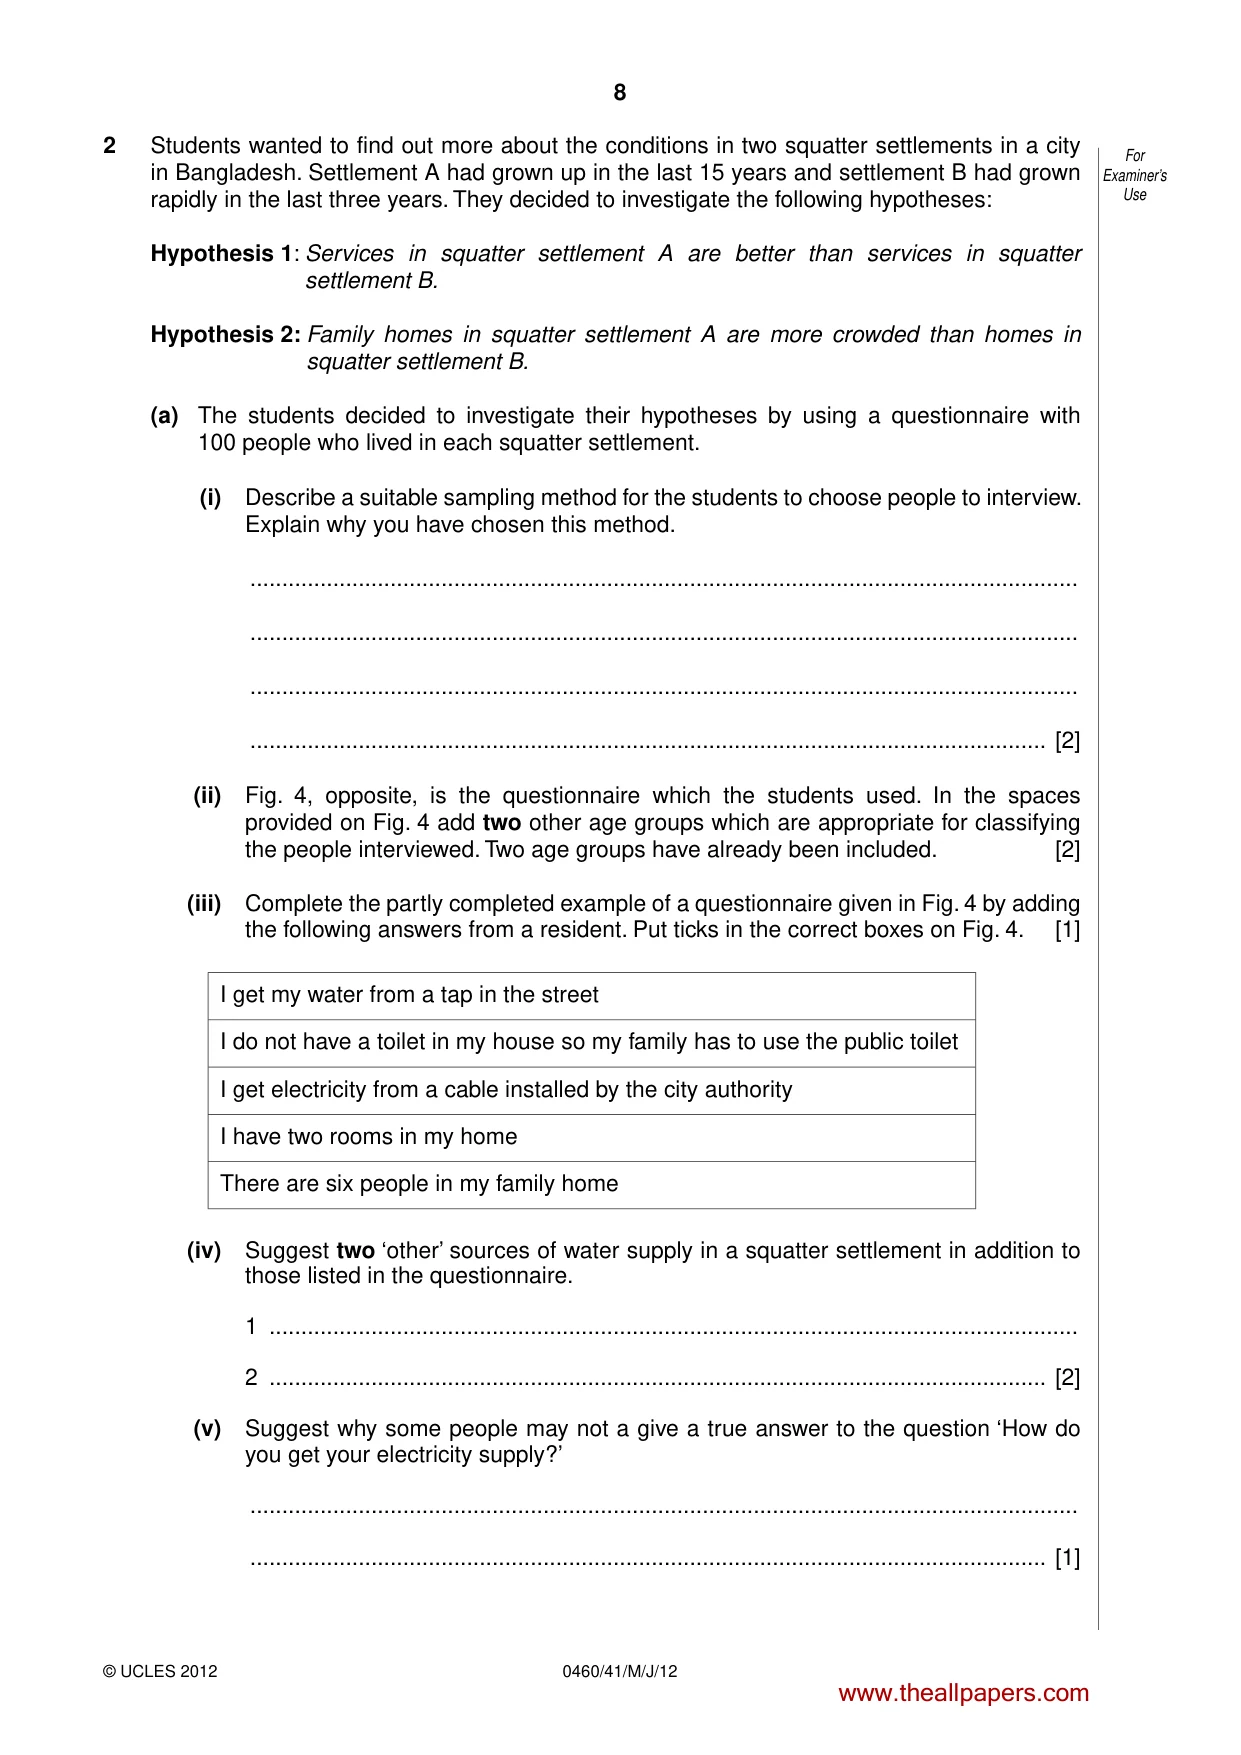
8 0460/41/M/J/12 © UCLES 2012 For Examiner’s Use 2 Students wanted to find out more about the conditions in two squatter settlements in a city in Bangladesh. Settlement A had grown up in the last 15 years and settlement B had grown rapidly in the last three years. They decided to investigate the following hypotheses: Hypothesis 1: Services in squatter settlement A are better than services in squatter settlement B. Hypothesis 2: Family homes in squatter settlement A are more crowded than homes in squatter settlement B. (a) The students decided to investigate their hypotheses by using a questionnaire with 100 people who lived in each squatter settlement. (i) Describe a suitable sampling method for the students to choose people to interview. Explain why you have chosen this method. … … … … [2] (ii) Fig. 4, opposite, is the questionnaire which the students used. In the spaces provided on Fig. 4 add two other age groups which are appropriate for classifying the people interviewed. Two age groups have already been included. [2] (iii) Complete the partly completed example of a questionnaire given in Fig. 4 by adding the following answers from a resident. Put ticks in the correct boxes on Fig. 4. [1] I get my water from a tap in the street I do not have a toilet in my house so my family has to use the public toilet I get electricity from a cable installed by the city authority I have two rooms in my home There are six people in my family home (iv) Suggest two ‘other’ sources of water supply in a squatter settlement in addition to those listed in the questionnaire. 1 … 2 … [2] (v) Suggest why some people may not a give a true answer to the question ‘How do you get your electricity supply?’ … … [1] www.theallpapers.com
Question paper, page 9
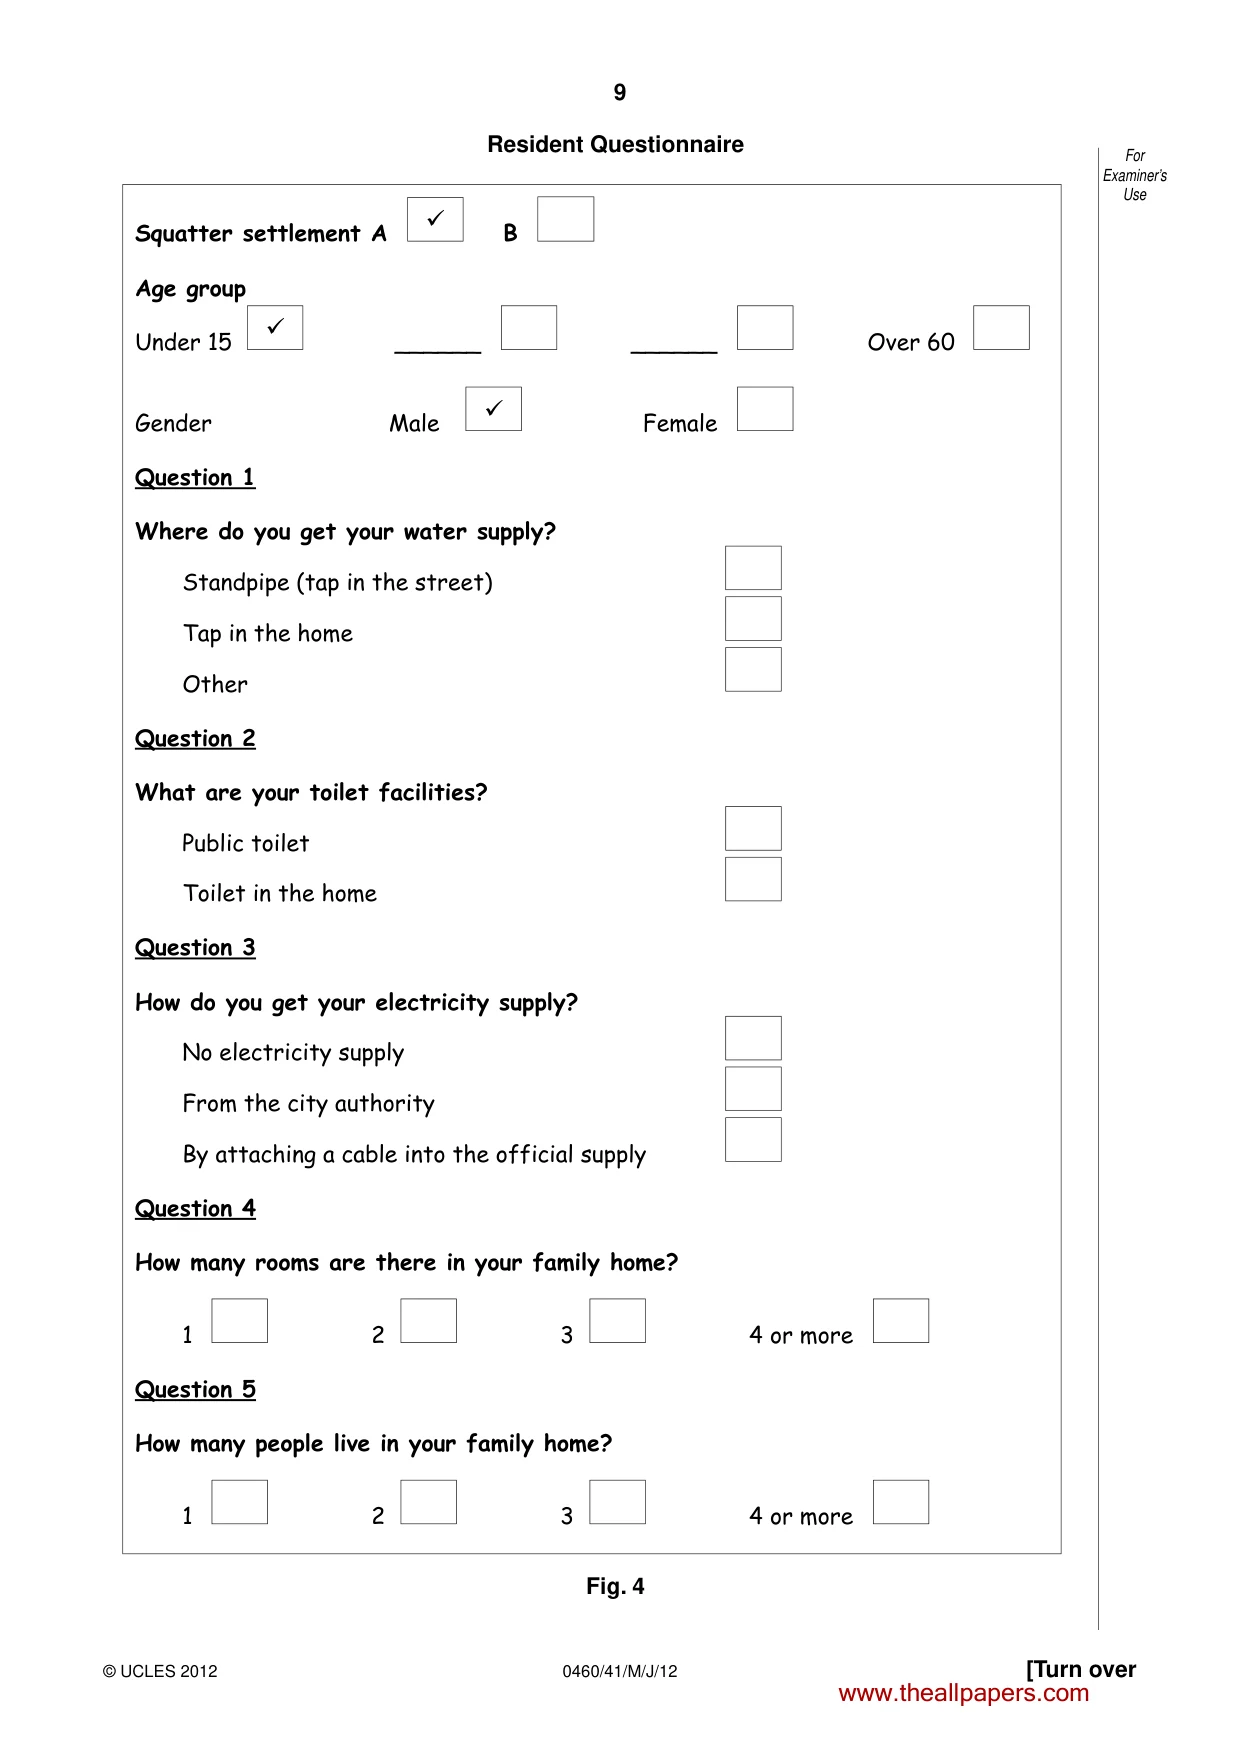
9 0460/41/M/J/12 © UCLES 2012 [Turn over For Examiner’s Use Resident Questionnaire Squatter settlement A 9 B Age group Under 15 9 ______ ______ Over 60 Gender Male 9 Female Question 1 Where do you get your water supply? Standpipe (tap in the street) Tap in the home Other Question 2 What are your toilet facilities? Public toilet Toilet in the home Question 3 How do you get your electricity supply? No electricity supply From the city authority By attaching a cable into the official supply Question 4 How many rooms are there in your family home? 1 2 3 4 or more Question 5 How many people live in your family home? 1 2 3 4 or more Fig. 4 www.theallpapers.com
Question paper, page 10
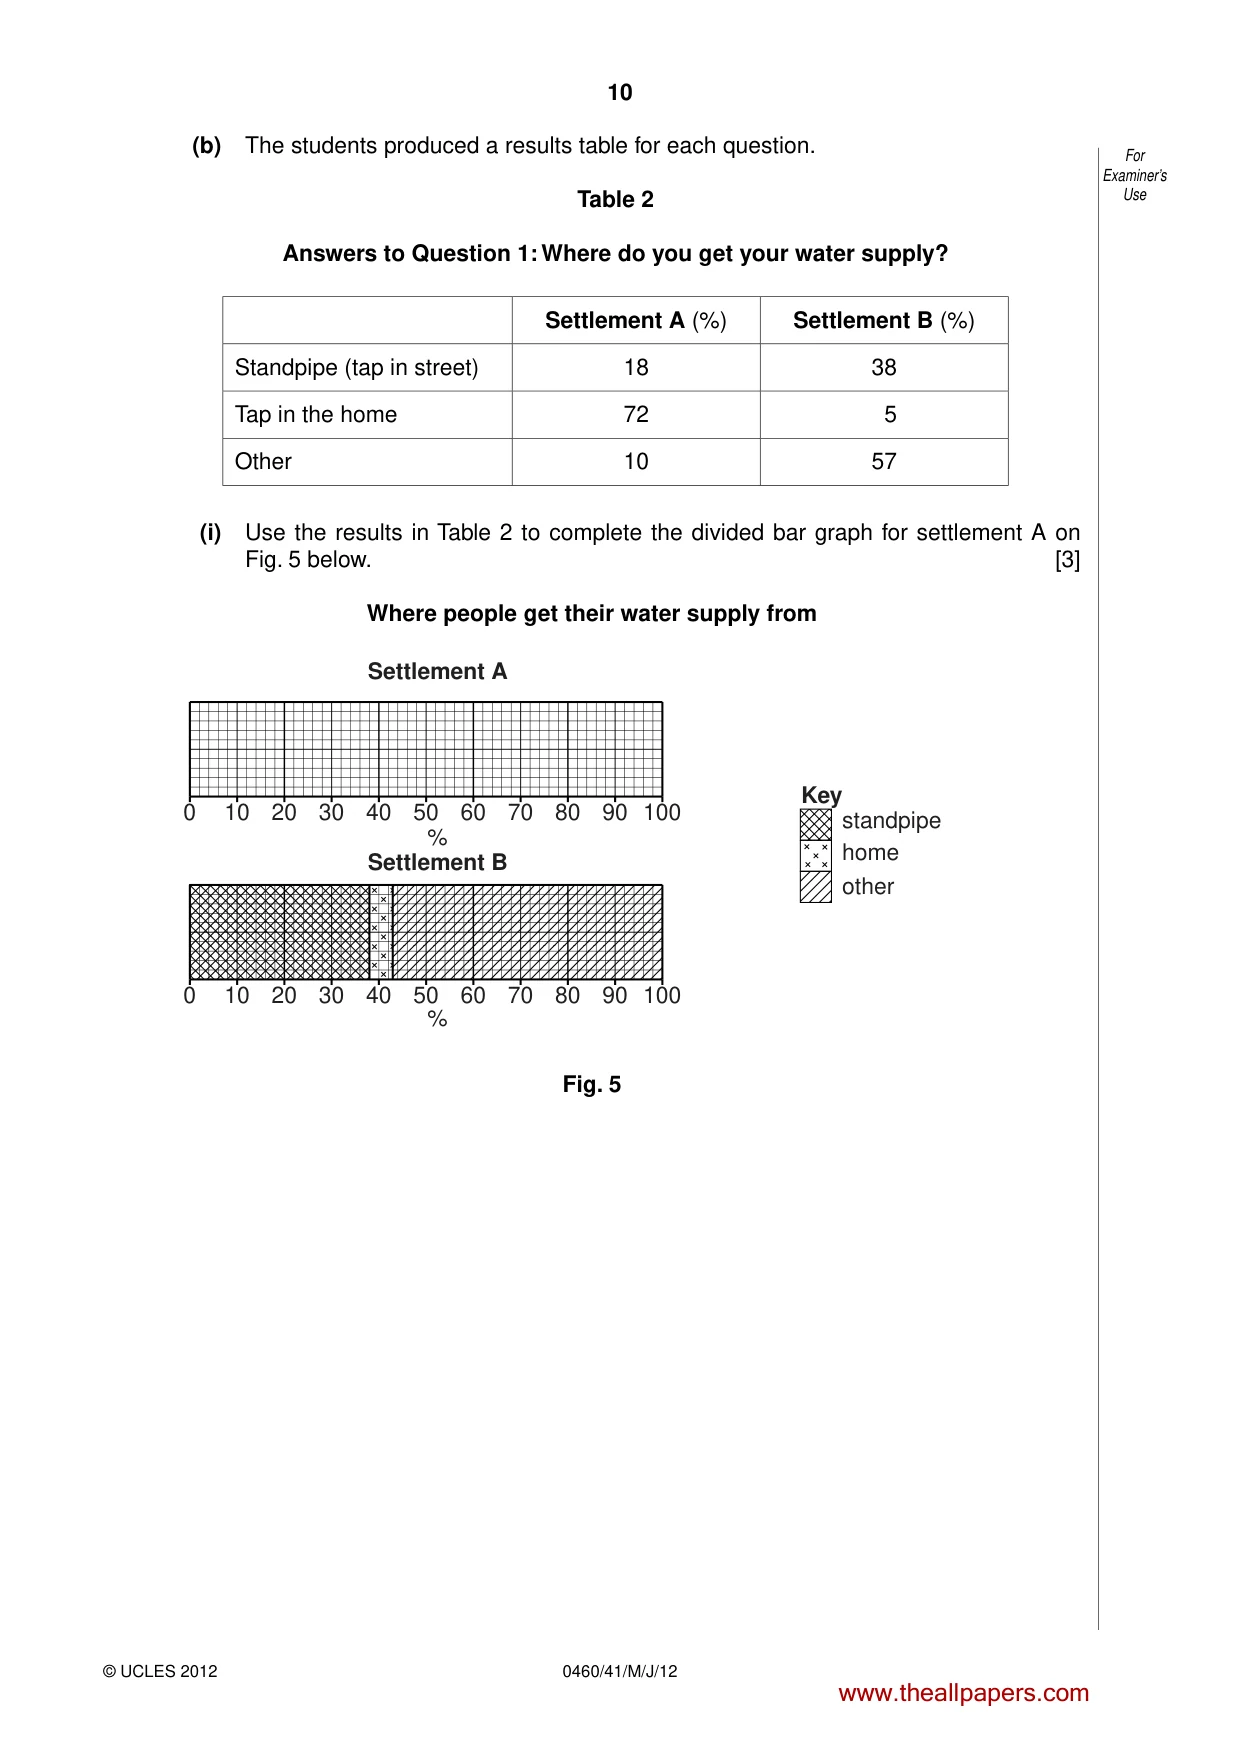
10 0460/41/M/J/12 © UCLES 2012 For Examiner’s Use (b) The students produced a results table for each question. Table 2 Answers to Question 1: Where do you get your water supply? Settlement A (%) Settlement B (%) Standpipe (tap in street) 18 38 Tap in the home 72 5 Other 10 57 (i) Use the results in Table 2 to complete the divided bar graph for settlement A on Fig. 5 below. [3] Where people get their water supply from 0 10 20 30 40 50 60 70 80 90 100 % % 0 10 20 30 40 50 60 70 80 90 100 standpipe Key Settlement A Settlement B home other Fig. 5 www.theallpapers.com
Question paper, page 11
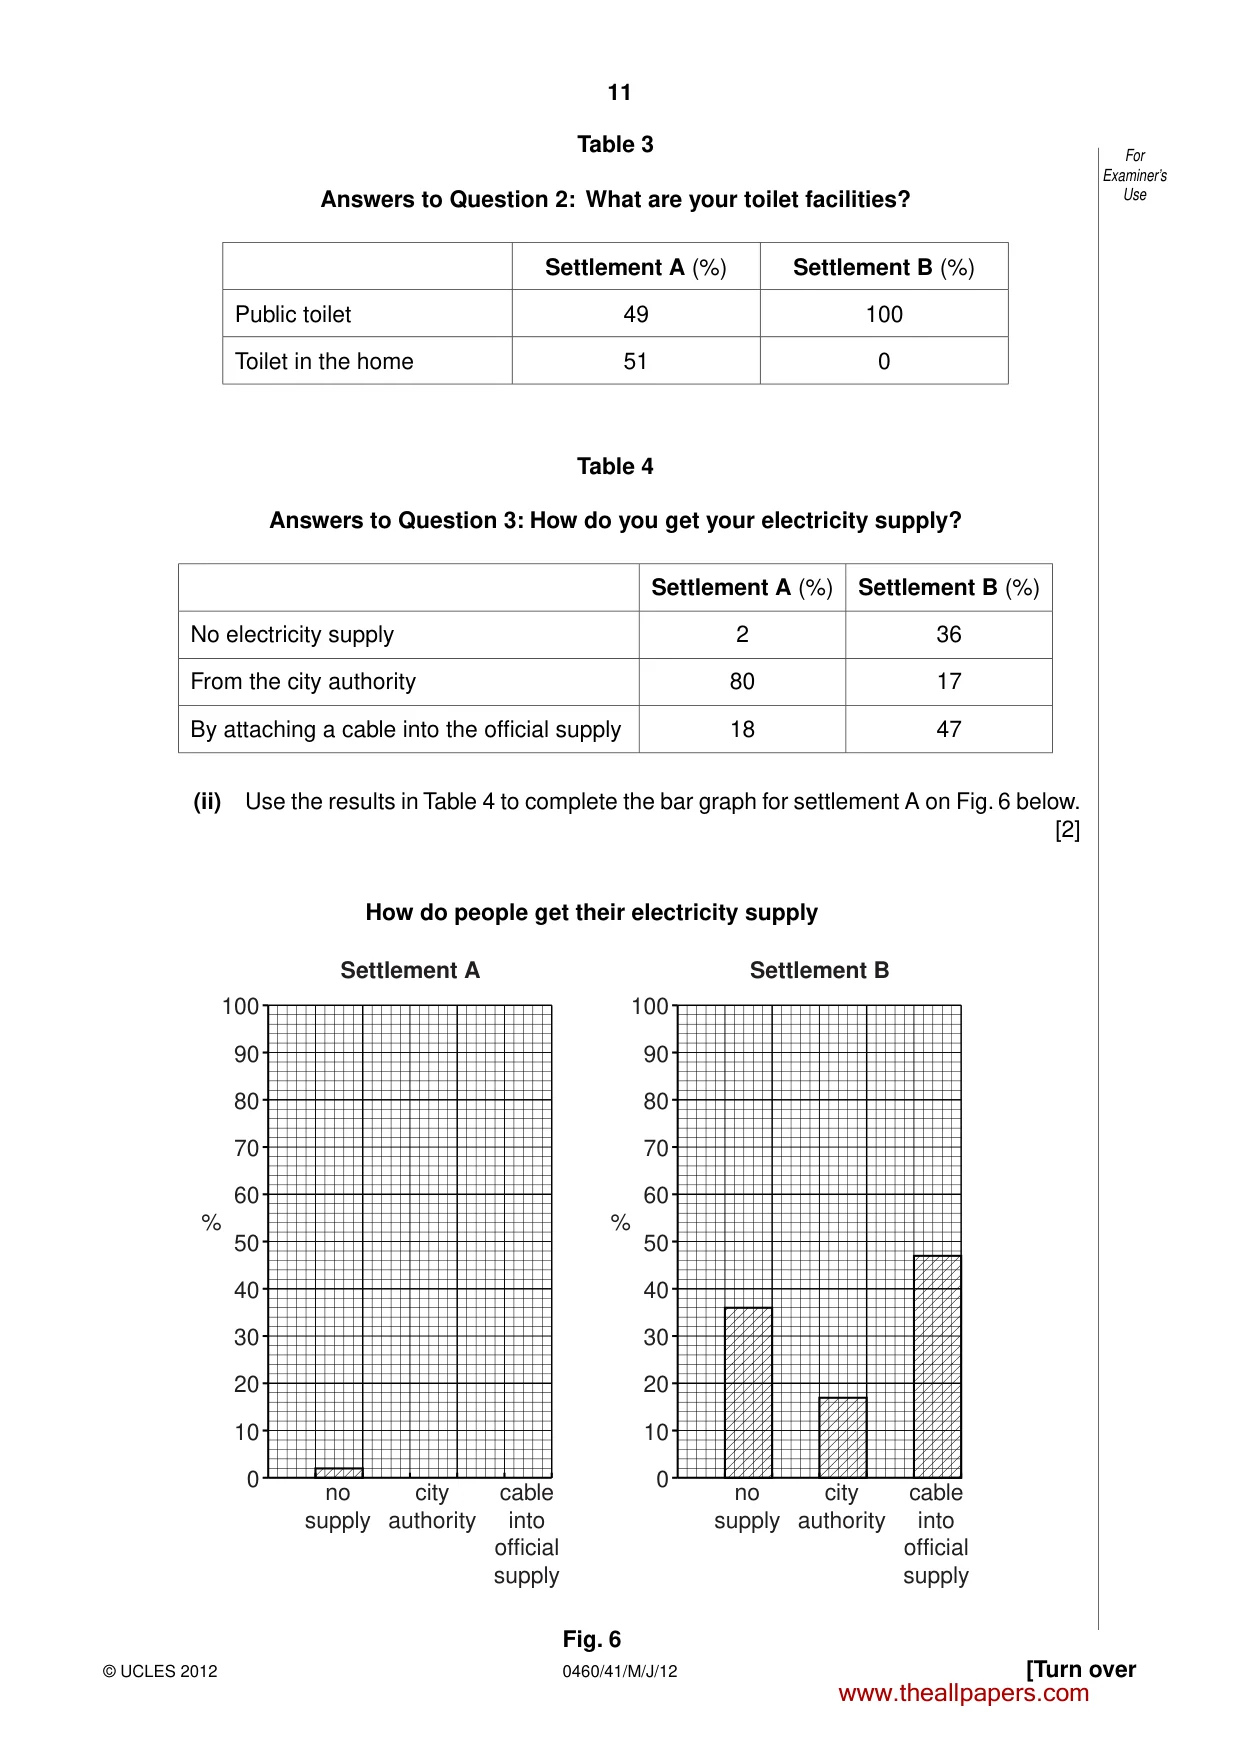
11 0460/41/M/J/12 © UCLES 2012 [Turn over For Examiner’s Use Table 3 Answers to Question 2: What are your toilet facilities? Settlement A (%) Settlement B (%) Public toilet 49 100 Toilet in the home 51 0 Table 4 Answers to Question 3: How do you get your electricity supply? Settlement A (%) Settlement B (%) No electricity supply 2 36 From the city authority 80 17 By attaching a cable into the official supply 18 47 (ii) Use the results in Table 4 to complete the bar graph for settlement A on Fig. 6 below. [2] How do people get their electricity supply 100 90 80 70 60 50 % 40 30 20 10 0 no supply city authority cable into official supply 100 90 80 70 60 50 % 40 30 20 10 0 no supply city authority cable into official supply Settlement A Settlement B Fig. 6 www.theallpapers.com
Question paper, page 12
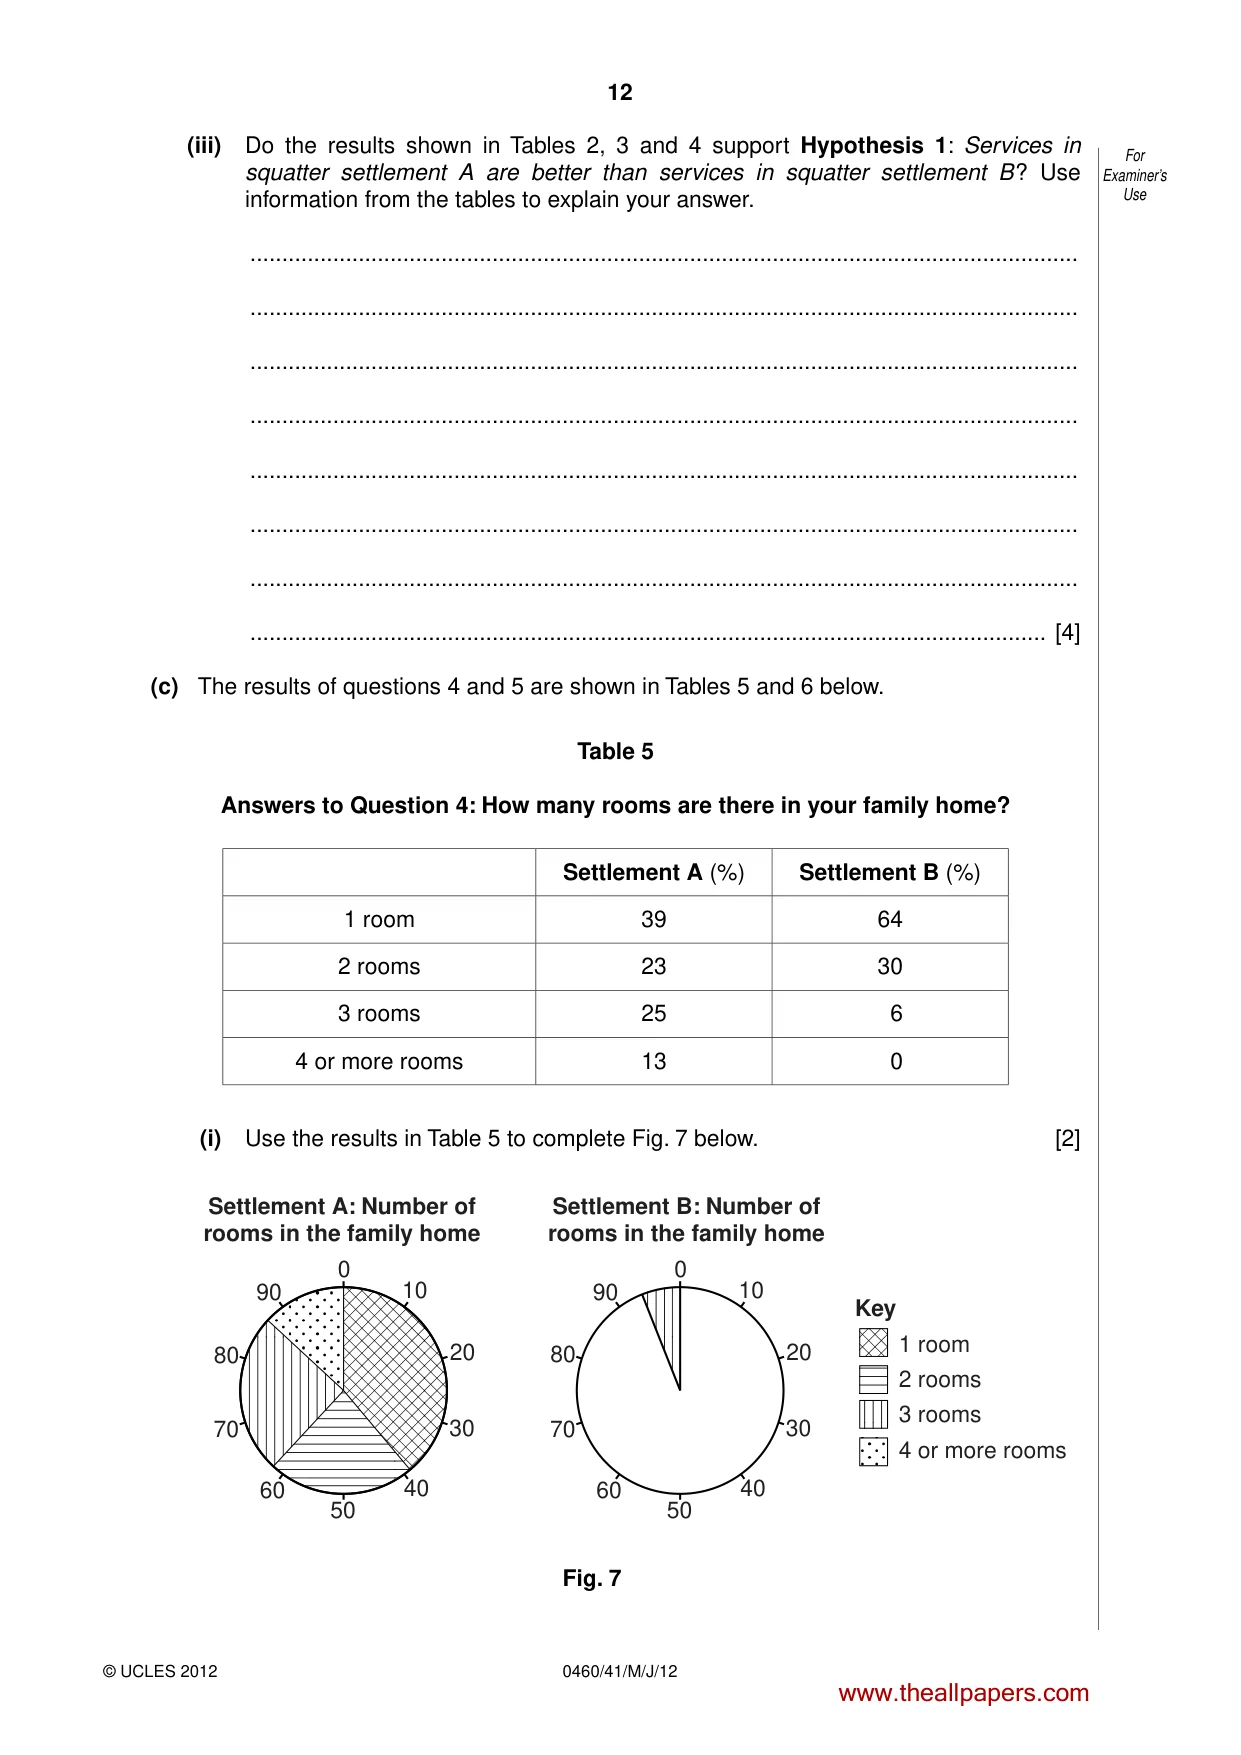
12 0460/41/M/J/12 © UCLES 2012 For Examiner’s Use (iii) Do the results shown in Tables 2, 3 and 4 support Hypothesis 1: Services in squatter settlement A are better than services in squatter settlement B? Use information from the tables to explain your answer. … … … … … … … … [4] (c) The results of questions 4 and 5 are shown in Tables 5 and 6 below. Table 5 Answers to Question 4: How many rooms are there in your family home? Settlement A (%) Settlement B (%) 1 room 39 64 2 rooms 23 30 3 rooms 25 6 4 or more rooms 13 0 (i) Use the results in Table 5 to complete Fig. 7 below. [2] 1 room 2 rooms 3 rooms 4 or more rooms 0 10 20 30 40 50 60 70 80 90 Key Settlement B: Number of rooms in the family home Settlement A: Number of rooms in the family home 0 10 20 30 40 50 60 70 80 90 Fig. 7 www.theallpapers.com
Question paper, page 13
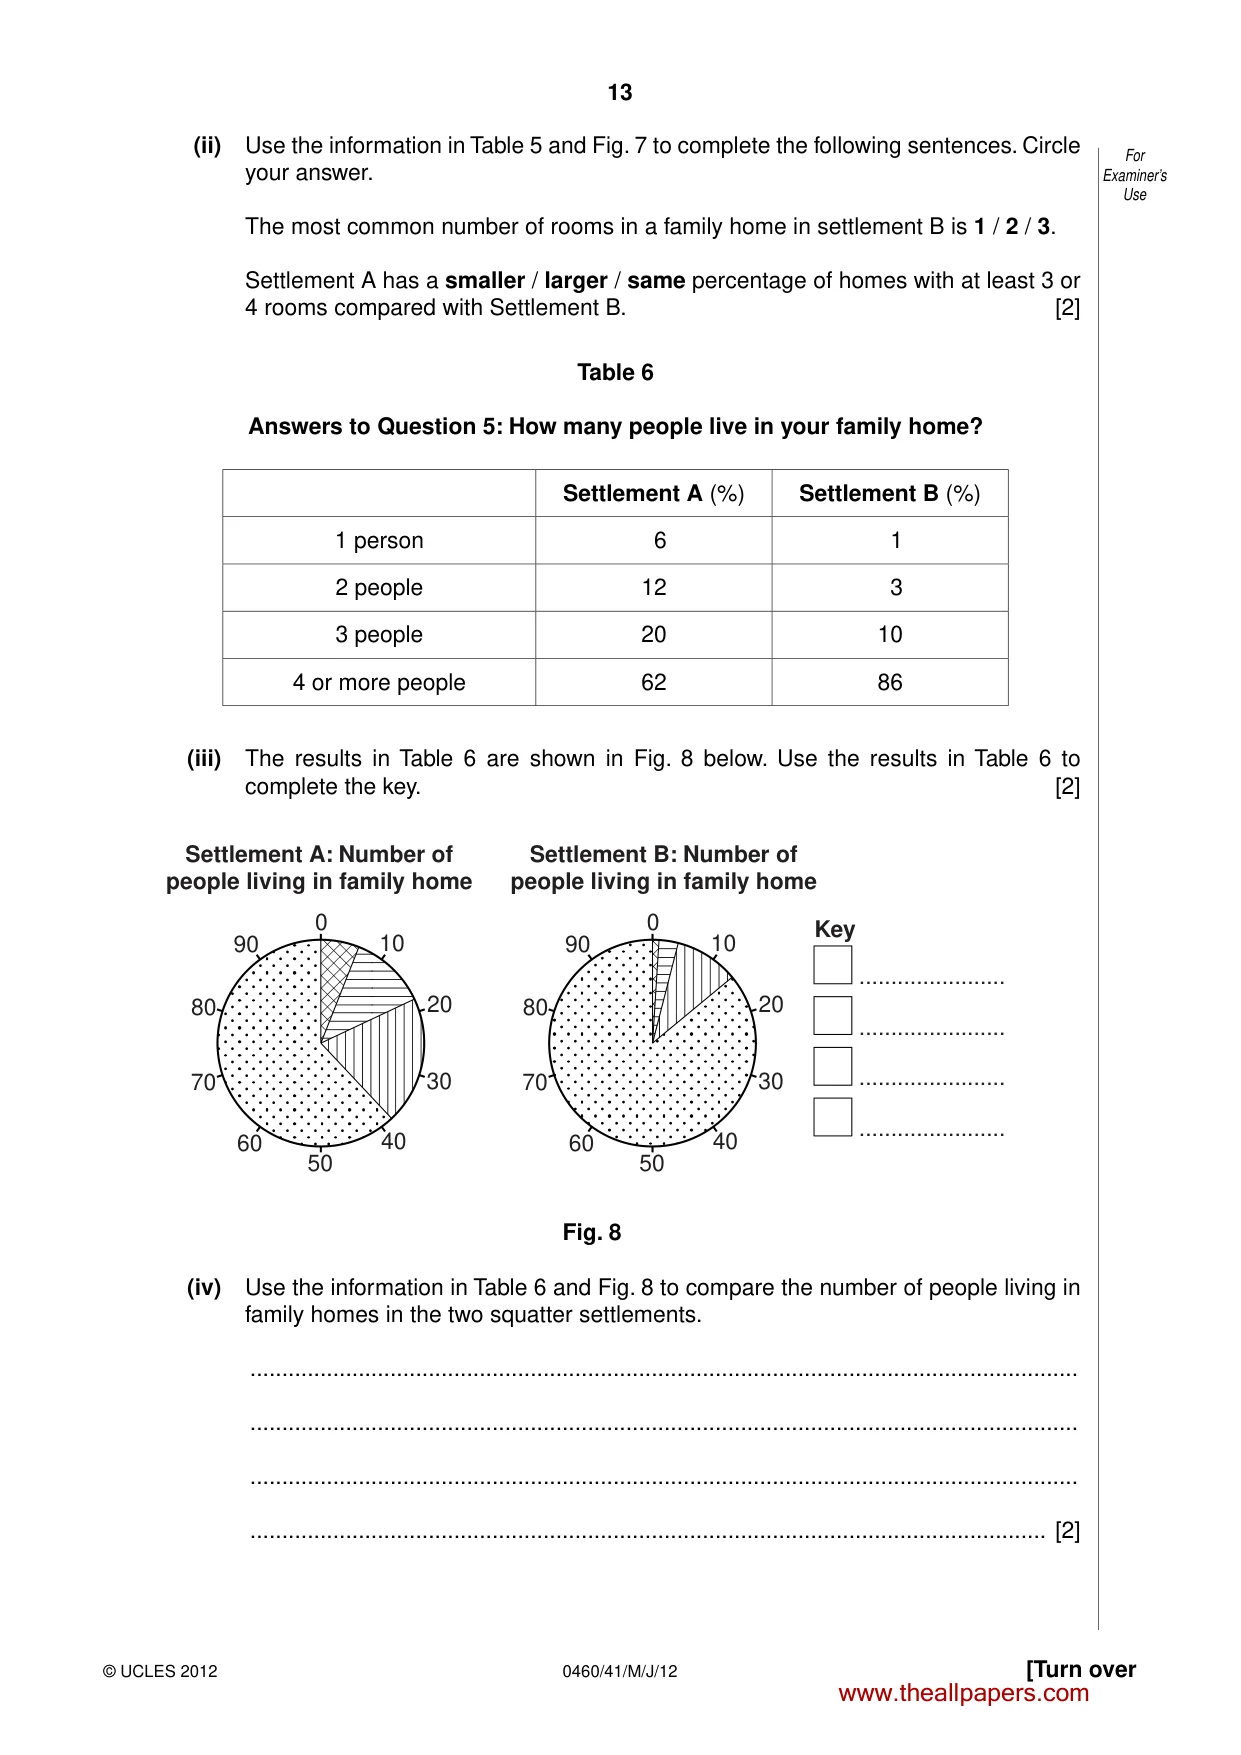
13 0460/41/M/J/12 © UCLES 2012 [Turn over For Examiner’s Use (ii) Use the information in Table 5 and Fig. 7 to complete the following sentences. Circle your answer. The most common number of rooms in a family home in settlement B is 1 / 2 / 3. Settlement A has a smaller / larger / same percentage of homes with at least 3 or 4 rooms compared with Settlement B. [2] Table 6 Answers to Question 5: How many people live in your family home? Settlement A (%) Settlement B (%) 1 person 6 1 2 people 12 3 3 people 20 10 4 or more people 62 86 (iii) The results in Table 6 are shown in Fig. 8 below. Use the results in Table 6 to complete the key. [2] Settlement B: Number of people living in family home Settlement A: Number of people living in family home Key … … … … 0 10 20 30 40 50 60 70 80 90 0 10 20 30 40 50 60 70 80 90 Fig. 8 (iv) Use the information in Table 6 and Fig. 8 to compare the number of people living in family homes in the two squatter settlements. … … … … [2] www.theallpapers.com
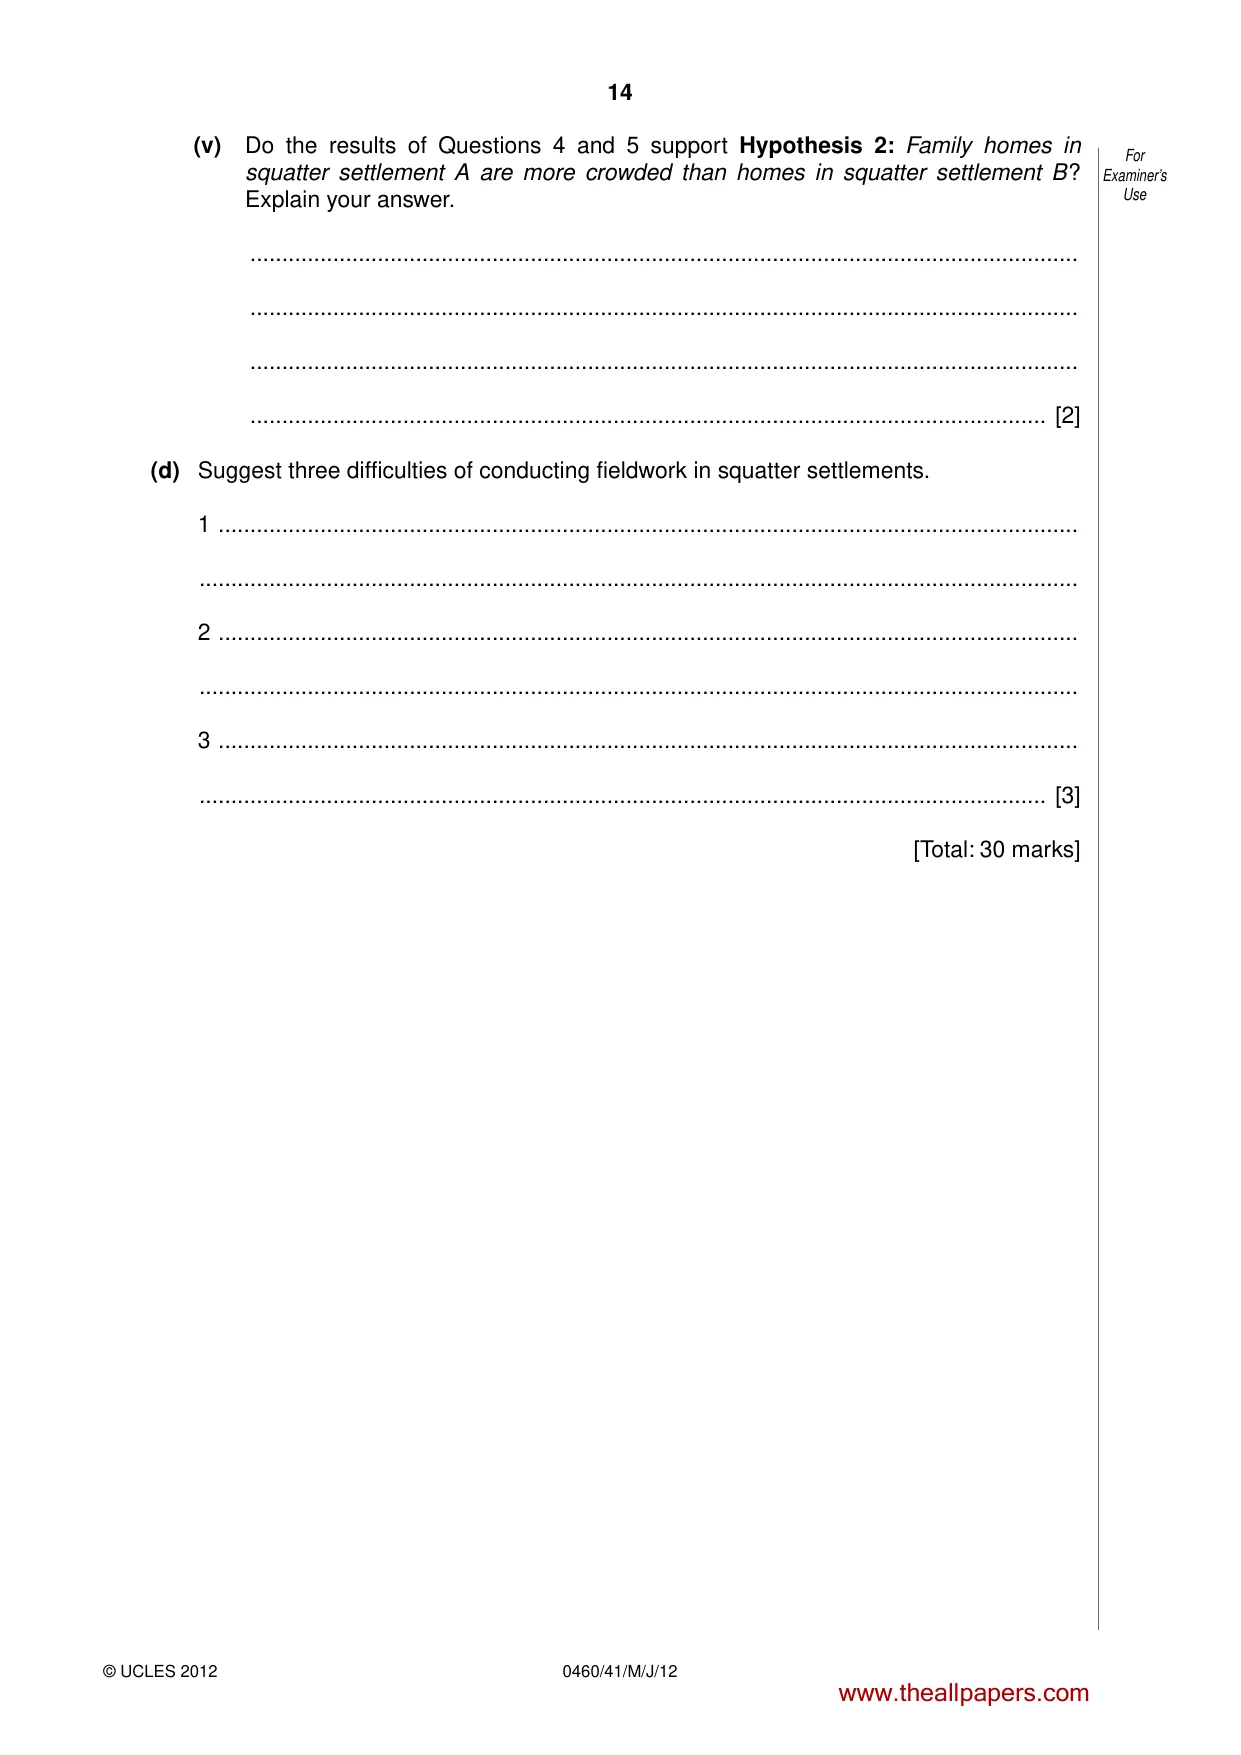
Question paper, page 14
14 0460/41/M/J/12 © UCLES 2012 For Examiner’s Use (v) Do the results of Questions 4 and 5 support Hypothesis 2: Family homes in squatter settlement A are more crowded than homes in squatter settlement B? Explain your answer. … … … … [2] (d) Suggest three difficulties of conducting fieldwork in squatter settlements. 1 … … 2 … … 3 … … [3] [Total: 30 marks] www.theallpapers.com
Question paper, page 15
15 0460/41/M/J/12 © UCLES 2012 BLANK PAGE www.theallpapers.com
Question paper, page 16
16 0460/41/M/J/12 © UCLES 2012 Permission to reproduce items where third-party owned material protected by copyright is included has been sought and cleared where possible. Every reasonable effort has been made by the publisher (UCLES) to trace copyright holders, but if any items requiring clearance have unwittingly been included, the publisher will be pleased to make amends at the earliest possible opportunity. University of Cambridge International Examinations is part of the Cambridge Assessment Group. Cambridge Assessment is the brand name of University of Cambridge Local Examinations Syndicate (UCLES), which is itself a department of the University of Cambridge. BLANK PAGE www.theallpapers.com
Mark scheme, page 1
UNIVERSITY OF CAMBRIDGE INTERNATIONAL EXAMINATIONS International General Certificate of Secondary Education MARK SCHEME for the May/June 2012 question paper for the guidance of teachers 0460 GEOGRAPHY 0460/41 Paper 4 (Alternative to Coursework), maximum raw mark 60 This mark scheme is published as an aid to teachers and candidates, to indicate the requirements of the examination. It shows the basis on which Examiners were instructed to award marks. It does not indicate the details of the discussions that took place at an Examiners’ meeting before marking began, which would have considered the acceptability of alternative answers. Mark schemes must be read in conjunction with the question papers and the report on the examination. • Cambridge will not enter into discussions or correspondence in connection with these mark schemes. Cambridge is publishing the mark schemes for the May/June 2012 question papers for most IGCSE, GCE Advanced Level and Advanced Subsidiary Level syllabuses and some Ordinary Level syllabuses. www.theallpapers.com
Mark scheme, page 2
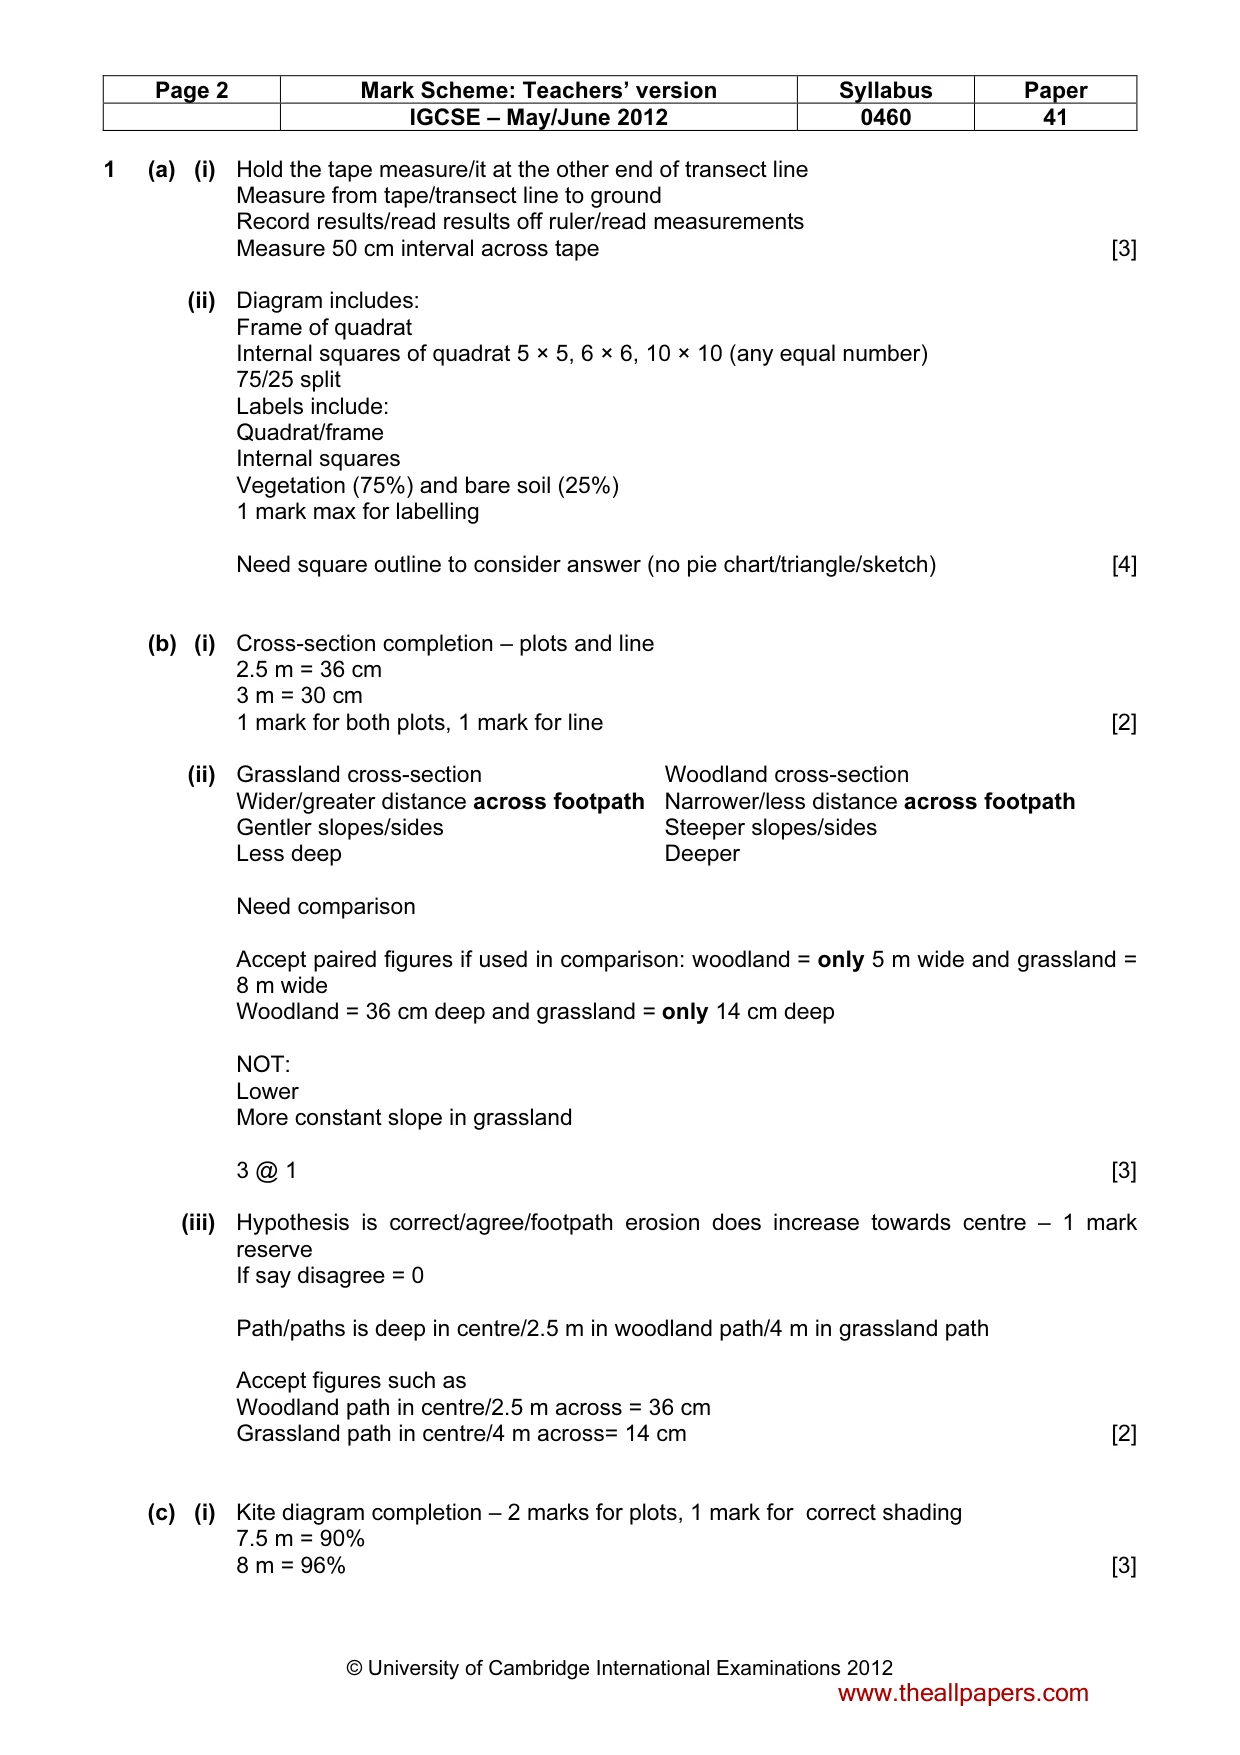
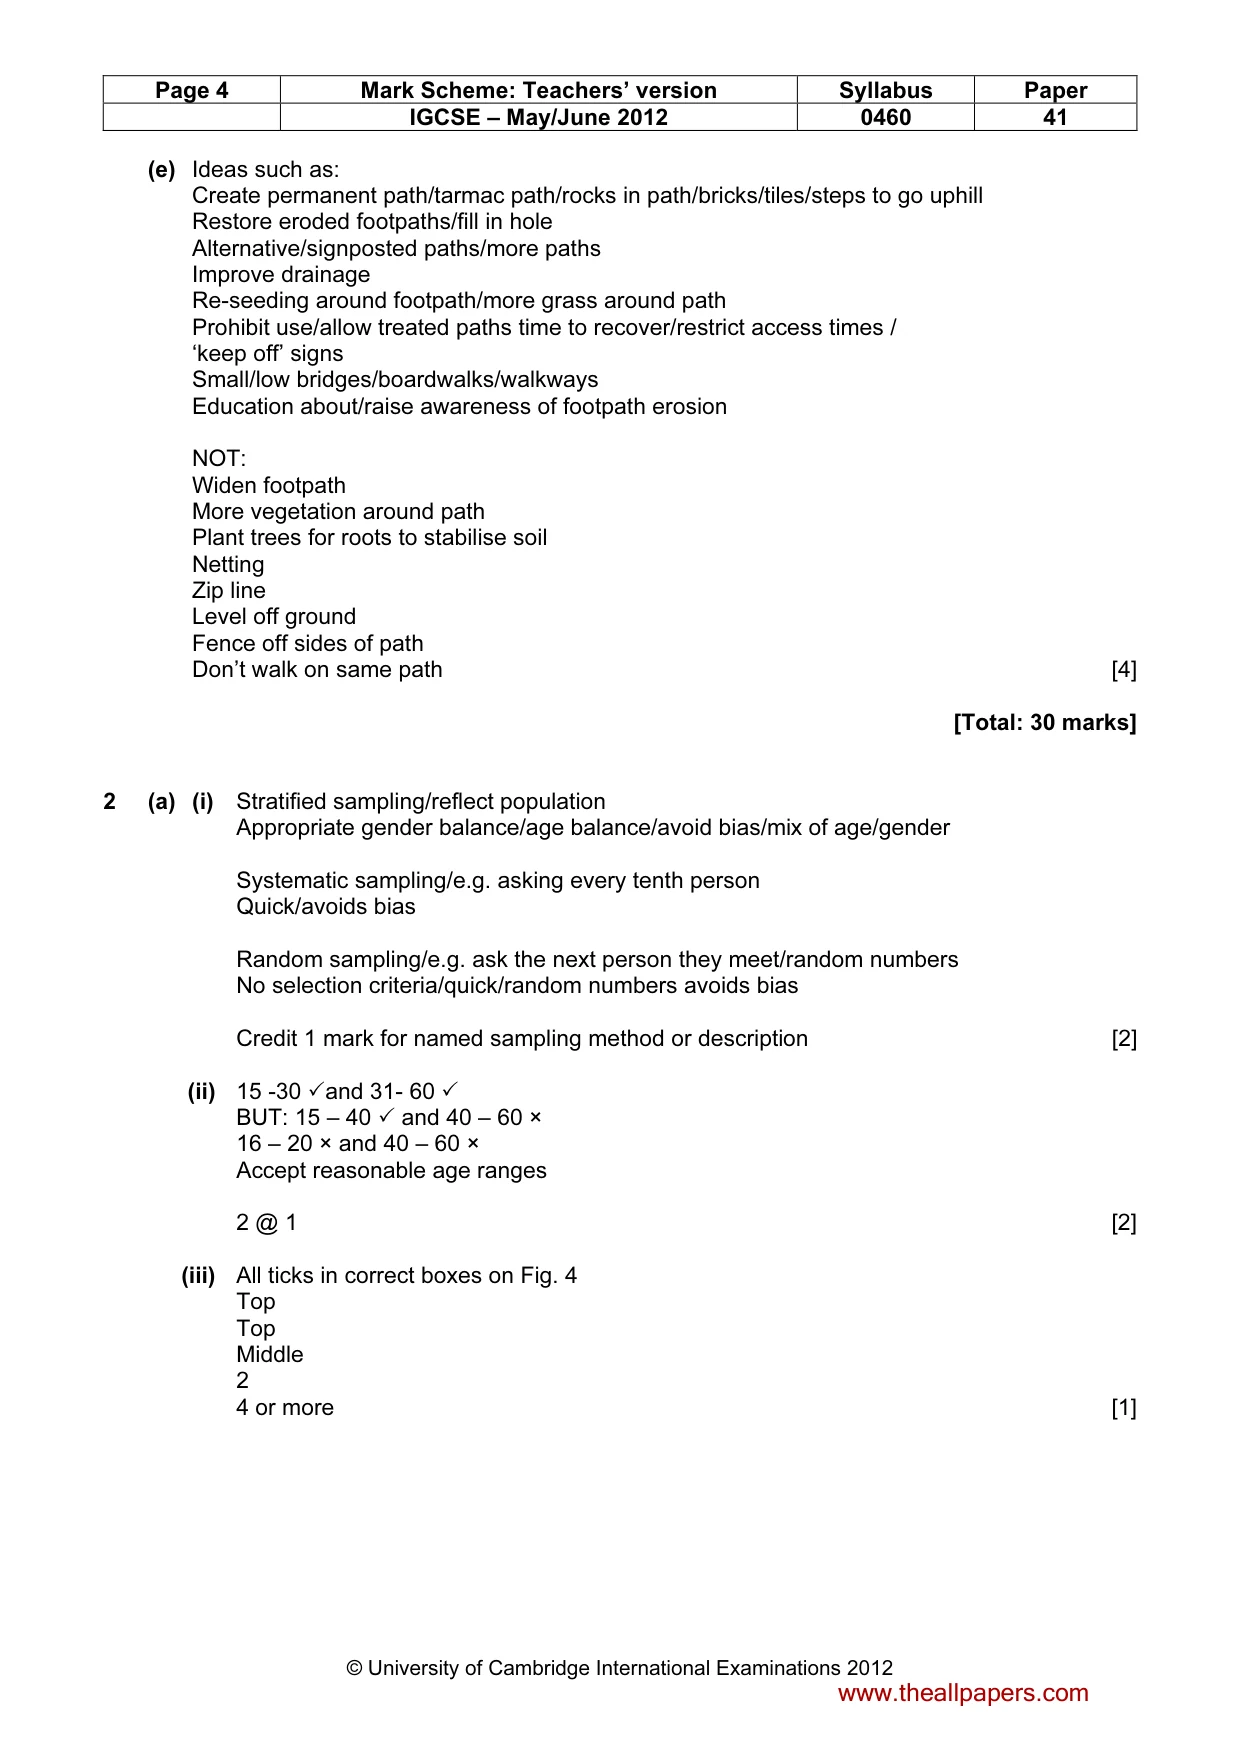
Page 2 Mark Scheme: Teachers’ version Syllabus Paper IGCSE – May/June 2012 0460 41 © University of Cambridge International Examinations 2012 1 (a) (i) Hold the tape measure/it at the other end of transect line Measure from tape/transect line to ground Record results/read results off ruler/read measurements Measure 50 cm interval across tape [3] (ii) Diagram includes: Frame of quadrat Internal squares of quadrat 5 × 5, 6 × 6, 10 × 10 (any equal number) 75/25 split Labels include: Quadrat/frame Internal squares Vegetation (75%) and bare soil (25%) 1 mark max for labelling Need square outline to consider answer (no pie chart/triangle/sketch) [4] (b) (i) Cross-section completion – plots and line 2.5 m = 36 cm 3 m = 30 cm 1 mark for both plots, 1 mark for line [2] (ii) Grassland cross-section Woodland cross-section Wider/greater distance across footpath Narrower/less distance across footpath Gentler slopes/sides Steeper slopes/sides Less deep Deeper Need comparison Accept paired figures if used in comparison: woodland = only 5 m wide and grassland = 8 m wide Woodland = 36 cm deep and grassland = only 14 cm deep NOT: Lower More constant slope in grassland 3 @ 1 [3] (iii) Hypothesis is correct/agree/footpath erosion does increase towards centre – 1 mark reserve If say disagree = 0 Path/paths is deep in centre/2.5 m in woodland path/4 m in grassland path Accept figures such as Woodland path in centre/2.5 m across = 36 cm Grassland path in centre/4 m across= 14 cm [2] (c) (i) Kite diagram completion – 2 marks for plots, 1 mark for correct shading 7.5 m = 90% 8 m = 96% [3] www.theallpapers.com
Mark scheme, page 3
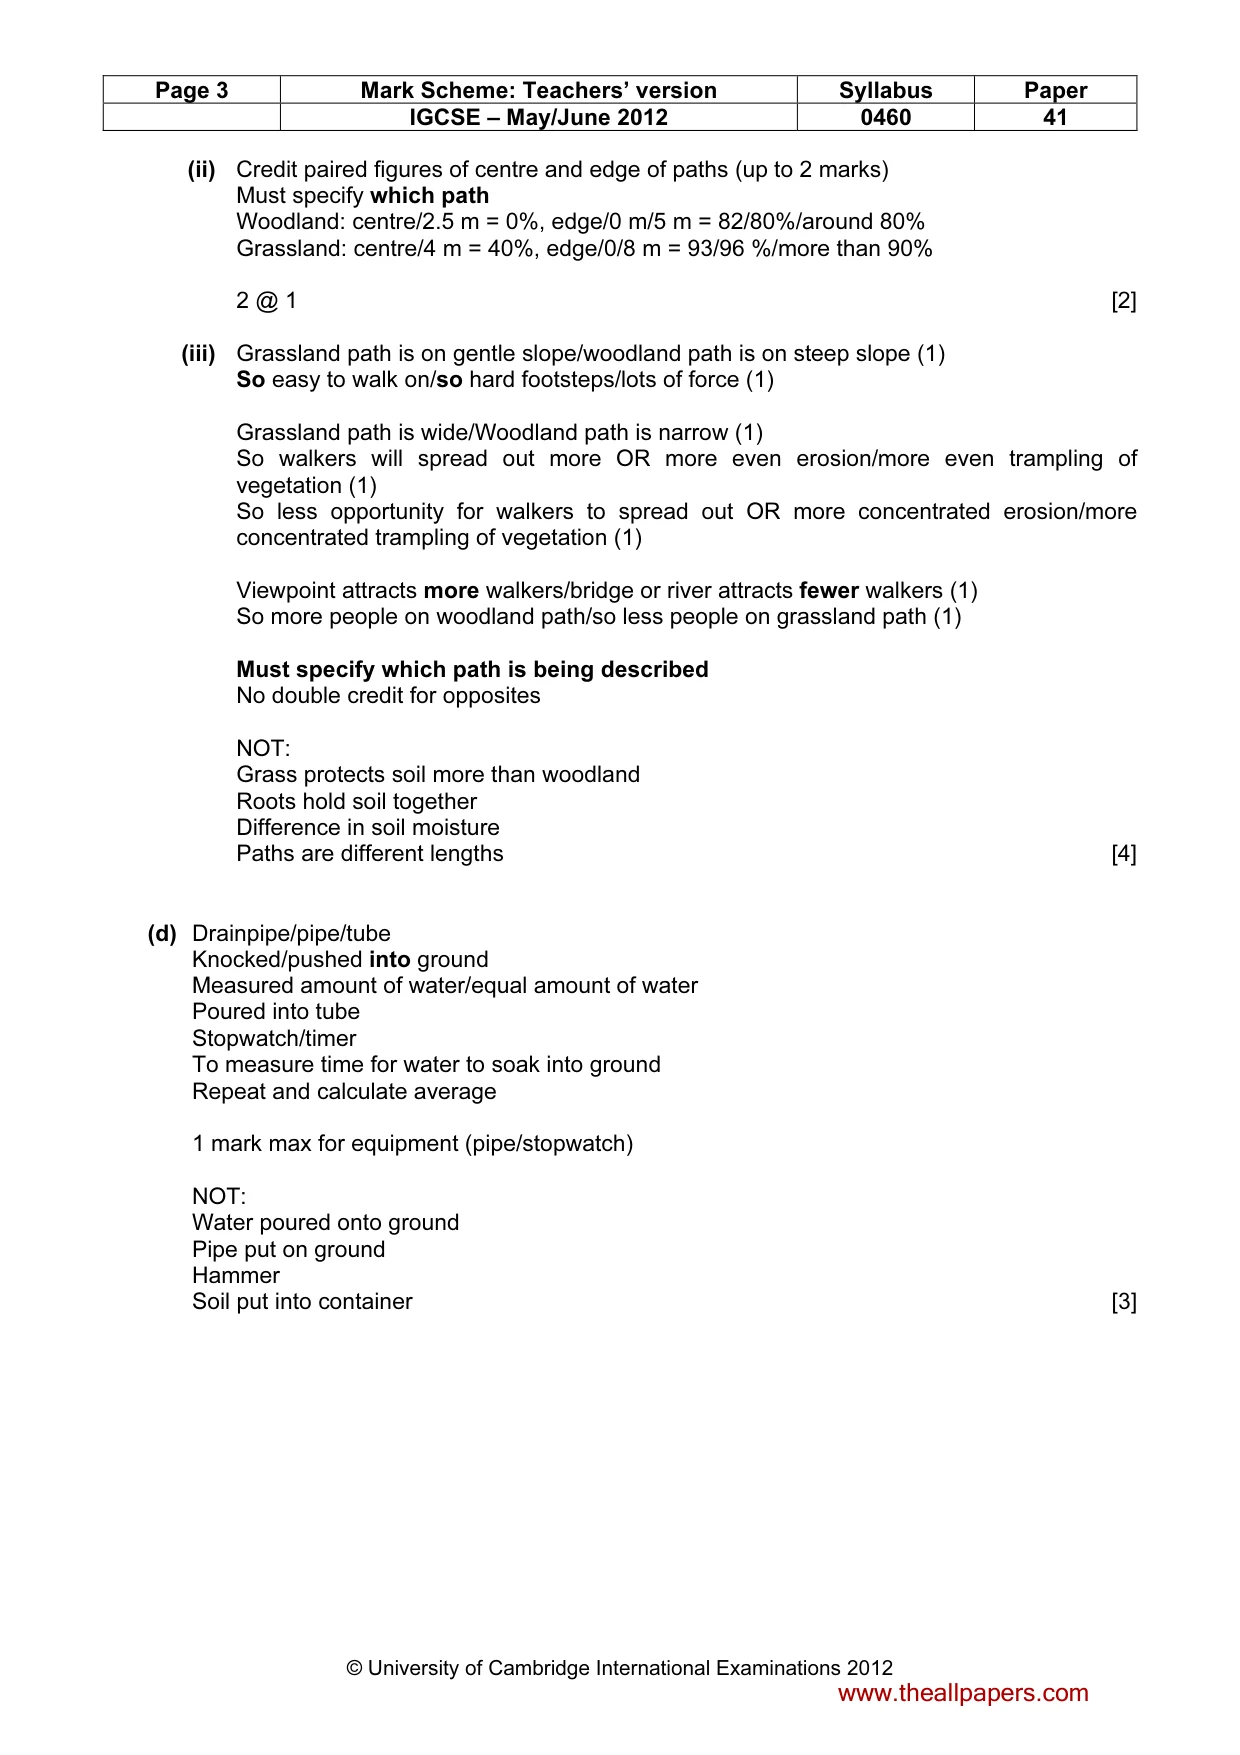
Page 3 Mark Scheme: Teachers’ version Syllabus Paper IGCSE – May/June 2012 0460 41 © University of Cambridge International Examinations 2012 (ii) Credit paired figures of centre and edge of paths (up to 2 marks) Must specify which path Woodland: centre/2.5 m = 0%, edge/0 m/5 m = 82/80%/around 80% Grassland: centre/4 m = 40%, edge/0/8 m = 93/96 %/more than 90% 2 @ 1 [2] (iii) Grassland path is on gentle slope/woodland path is on steep slope (1) So easy to walk on/so hard footsteps/lots of force (1) Grassland path is wide/Woodland path is narrow (1) So walkers will spread out more OR more even erosion/more even trampling of vegetation (1) So less opportunity for walkers to spread out OR more concentrated erosion/more concentrated trampling of vegetation (1) Viewpoint attracts more walkers/bridge or river attracts fewer walkers (1) So more people on woodland path/so less people on grassland path (1) Must specify which path is being described No double credit for opposites NOT: Grass protects soil more than woodland Roots hold soil together Difference in soil moisture Paths are different lengths [4] (d) Drainpipe/pipe/tube Knocked/pushed into ground Measured amount of water/equal amount of water Poured into tube Stopwatch/timer To measure time for water to soak into ground Repeat and calculate average 1 mark max for equipment (pipe/stopwatch) NOT: Water poured onto ground Pipe put on ground Hammer Soil put into container [3] www.theallpapers.com
Mark scheme, page 4
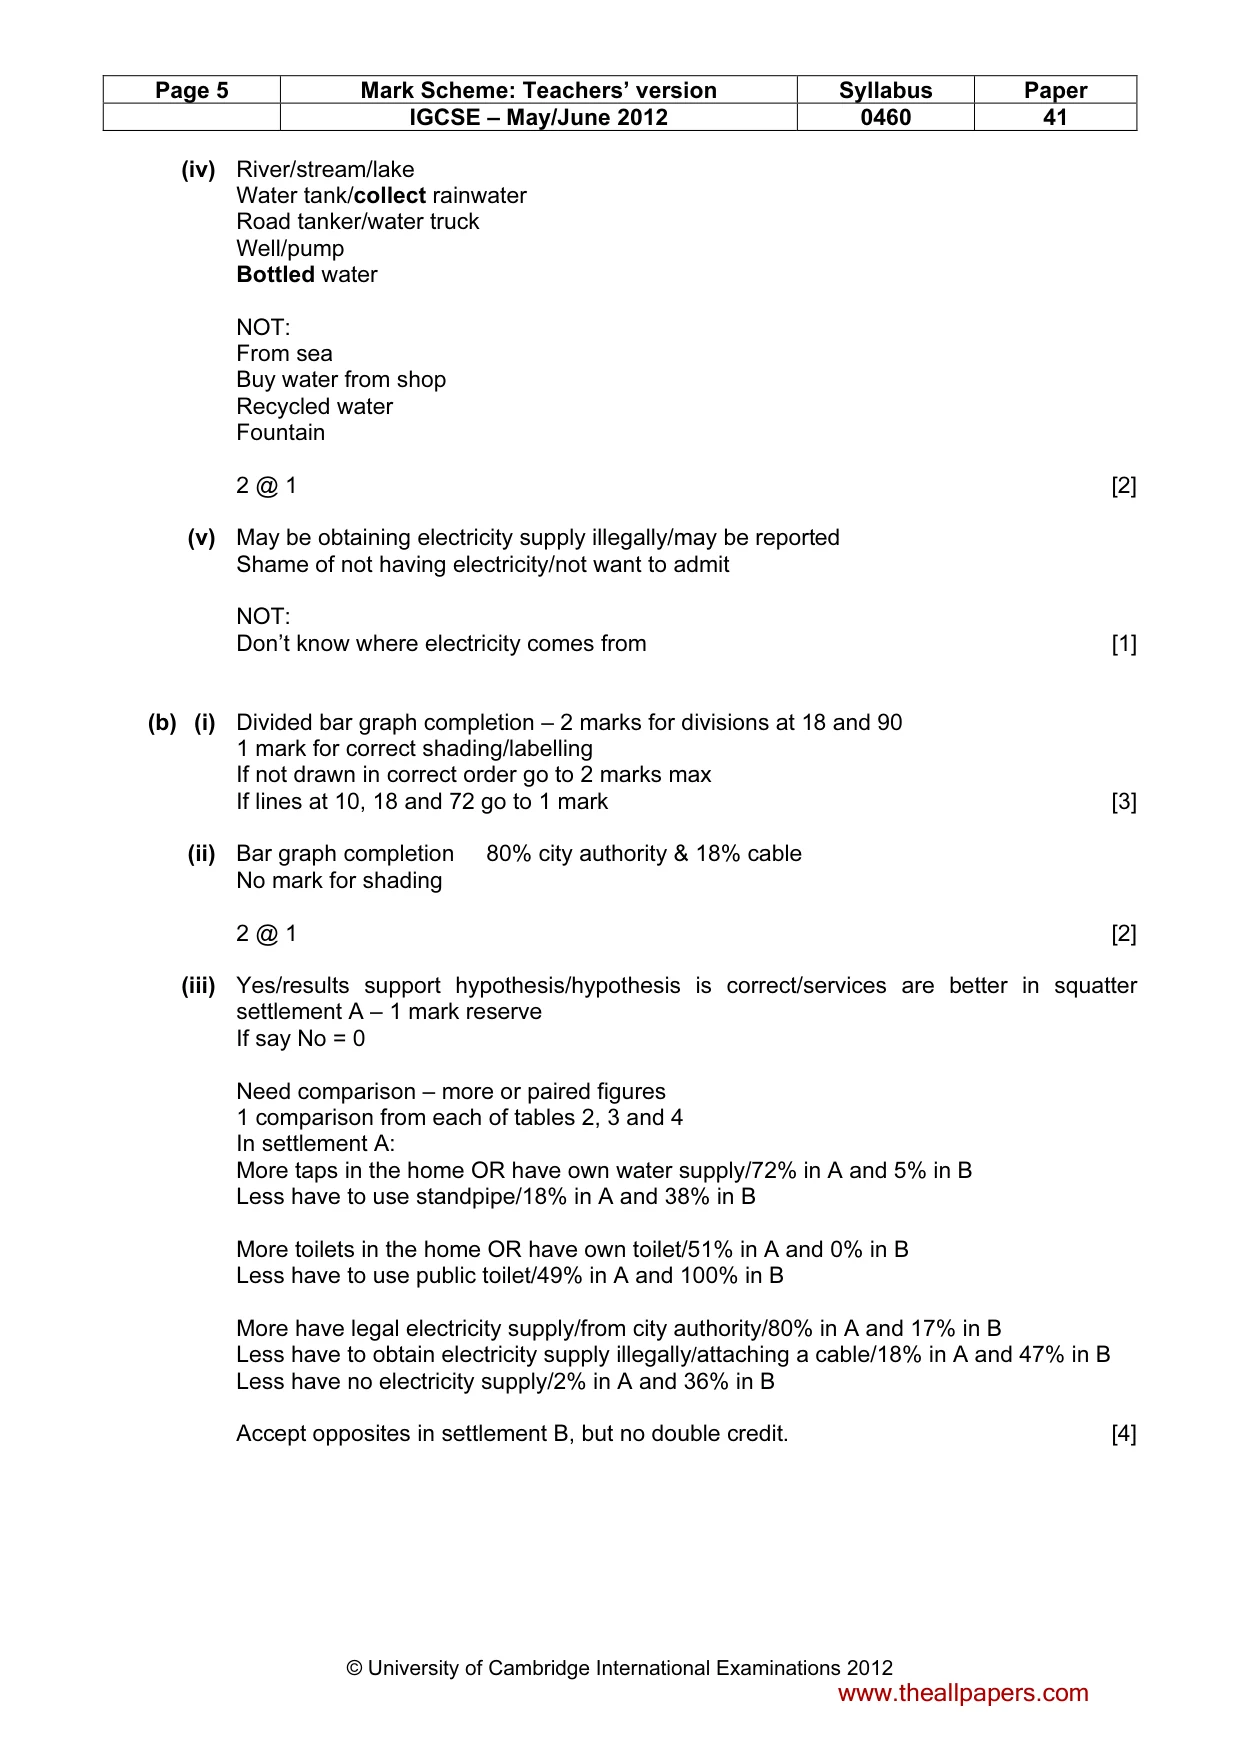
Page 4 Mark Scheme: Teachers’ version Syllabus Paper IGCSE – May/June 2012 0460 41 © University of Cambridge International Examinations 2012 (e) Ideas such as: Create permanent path/tarmac path/rocks in path/bricks/tiles/steps to go uphill Restore eroded footpaths/fill in hole Alternative/signposted paths/more paths Improve drainage Re-seeding around footpath/more grass around path Prohibit use/allow treated paths time to recover/restrict access times / ‘keep off’ signs Small/low bridges/boardwalks/walkways Education about/raise awareness of footpath erosion NOT: Widen footpath More vegetation around path Plant trees for roots to stabilise soil Netting Zip line Level off ground Fence off sides of path Don’t walk on same path [4] [Total: 30 marks] 2 (a) (i) Stratified sampling/reflect population Appropriate gender balance/age balance/avoid bias/mix of age/gender Systematic sampling/e.g. asking every tenth person Quick/avoids bias Random sampling/e.g. ask the next person they meet/random numbers No selection criteria/quick/random numbers avoids bias Credit 1 mark for named sampling method or description [2] (ii) 15 -30 ✓and 31- 60 ✓ BUT: 15 – 40 ✓ and 40 – 60 × 16 – 20 × and 40 – 60 × Accept reasonable age ranges 2 @ 1 [2] (iii) All ticks in correct boxes on Fig. 4 Top Top Middle 2 4 or more [1] www.theallpapers.com
Mark scheme, page 5
Page 5 Mark Scheme: Teachers’ version Syllabus Paper IGCSE – May/June 2012 0460 41 © University of Cambridge International Examinations 2012 (iv) River/stream/lake Water tank/collect rainwater Road tanker/water truck Well/pump Bottled water NOT: From sea Buy water from shop Recycled water Fountain 2 @ 1 [2] (v) May be obtaining electricity supply illegally/may be reported Shame of not having electricity/not want to admit NOT: Don’t know where electricity comes from [1] (b) (i) Divided bar graph completion – 2 marks for divisions at 18 and 90 1 mark for correct shading/labelling If not drawn in correct order go to 2 marks max If lines at 10, 18 and 72 go to 1 mark [3] (ii) Bar graph completion 80% city authority & 18% cable No mark for shading 2 @ 1 [2] (iii) Yes/results support hypothesis/hypothesis is correct/services are better in squatter settlement A – 1 mark reserve If say No = 0 Need comparison – more or paired figures 1 comparison from each of tables 2, 3 and 4 In settlement A: More taps in the home OR have own water supply/72% in A and 5% in B Less have to use standpipe/18% in A and 38% in B More toilets in the home OR have own toilet/51% in A and 0% in B Less have to use public toilet/49% in A and 100% in B More have legal electricity supply/from city authority/80% in A and 17% in B Less have to obtain electricity supply illegally/attaching a cable/18% in A and 47% in B Less have no electricity supply/2% in A and 36% in B Accept opposites in settlement B, but no double credit. [4] www.theallpapers.com
Mark scheme, page 6
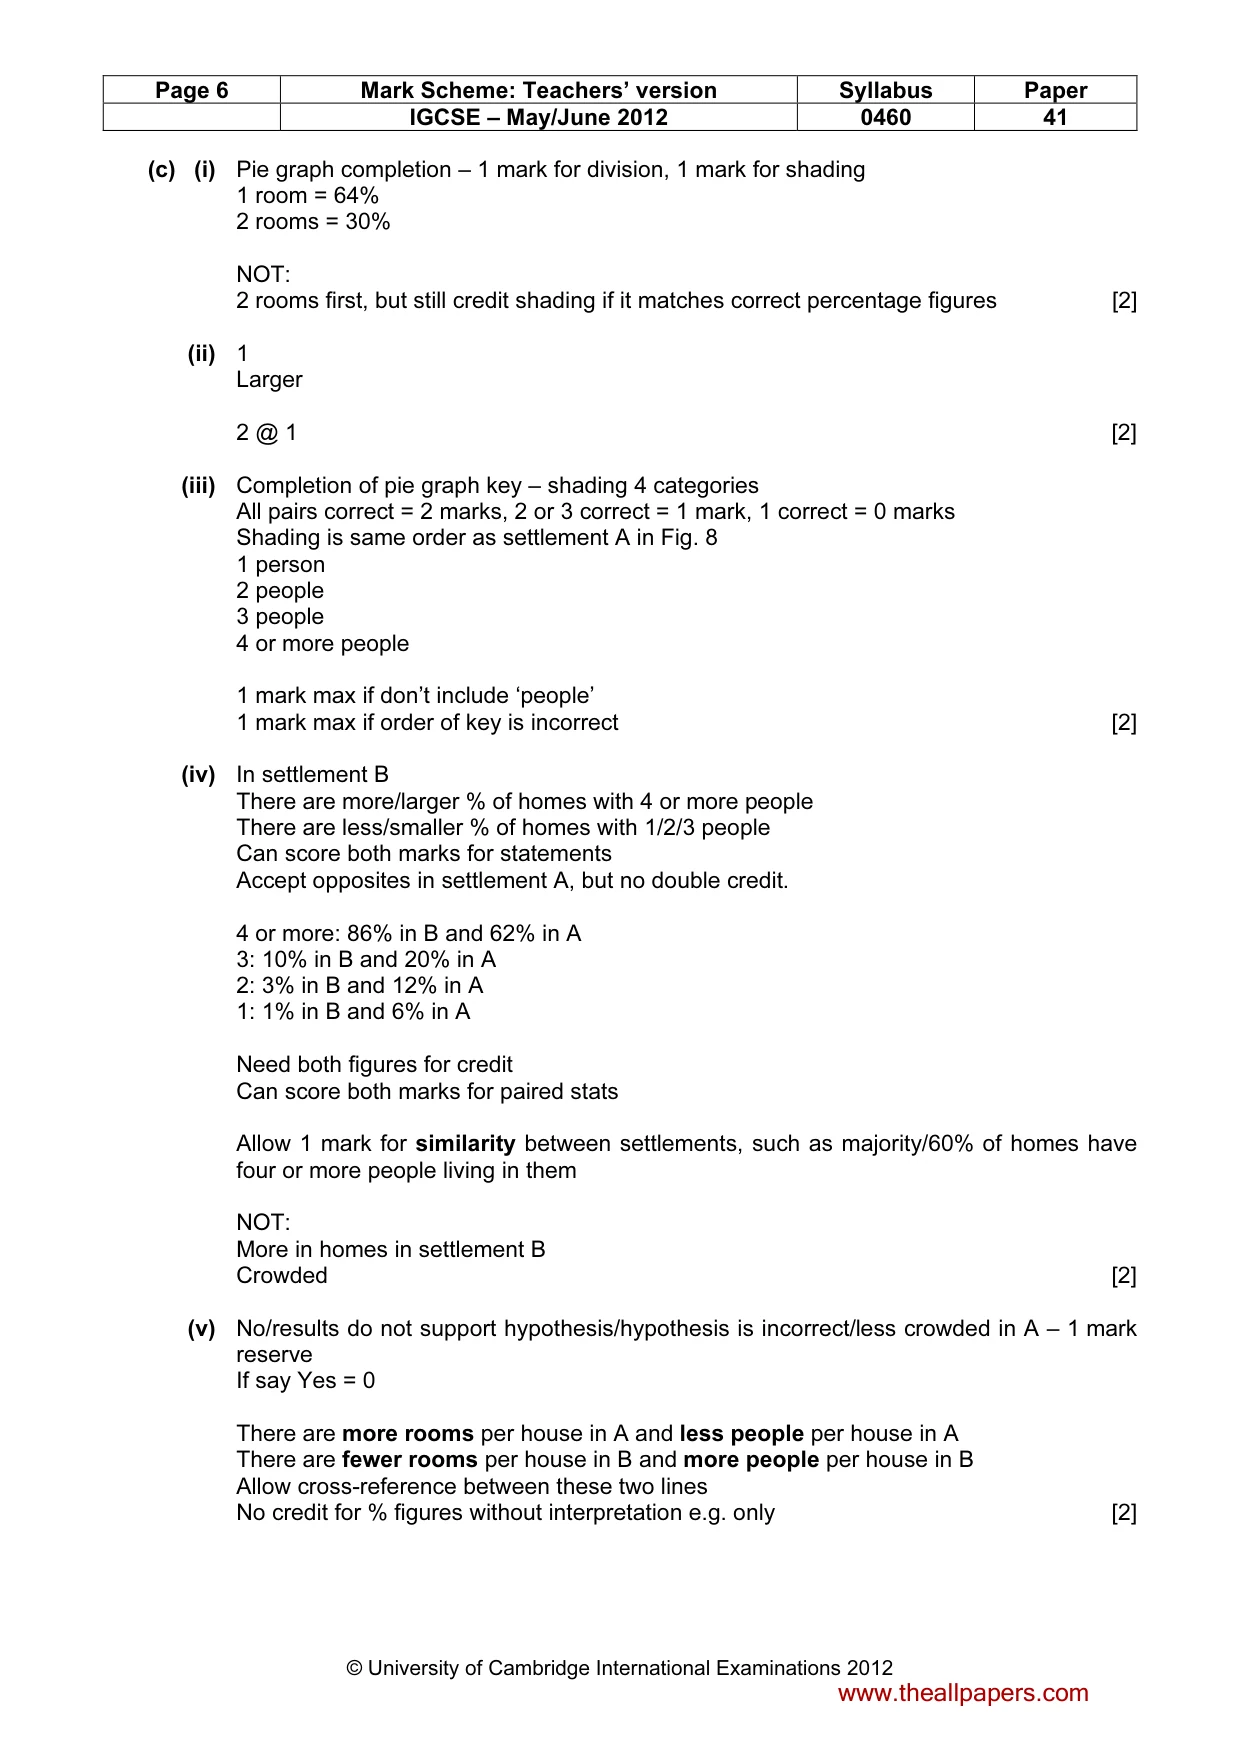
Page 6 Mark Scheme: Teachers’ version Syllabus Paper IGCSE – May/June 2012 0460 41 © University of Cambridge International Examinations 2012 (c) (i) Pie graph completion – 1 mark for division, 1 mark for shading 1 room = 64% 2 rooms = 30% NOT: 2 rooms first, but still credit shading if it matches correct percentage figures [2] (ii) 1 Larger 2 @ 1 [2] (iii) Completion of pie graph key – shading 4 categories All pairs correct = 2 marks, 2 or 3 correct = 1 mark, 1 correct = 0 marks Shading is same order as settlement A in Fig. 8 1 person 2 people 3 people 4 or more people 1 mark max if don’t include ‘people’ 1 mark max if order of key is incorrect [2] (iv) In settlement B There are more/larger % of homes with 4 or more people There are less/smaller % of homes with 1/2/3 people Can score both marks for statements Accept opposites in settlement A, but no double credit. 4 or more: 86% in B and 62% in A 3: 10% in B and 20% in A 2: 3% in B and 12% in A 1: 1% in B and 6% in A Need both figures for credit Can score both marks for paired stats Allow 1 mark for similarity between settlements, such as majority/60% of homes have four or more people living in them NOT: More in homes in settlement B Crowded [2] (v) No/results do not support hypothesis/hypothesis is incorrect/less crowded in A – 1 mark reserve If say Yes = 0 There are more rooms per house in A and less people per house in A There are fewer rooms per house in B and more people per house in B Allow cross-reference between these two lines No credit for % figures without interpretation e.g. only [2] www.theallpapers.com
Mark scheme, page 7
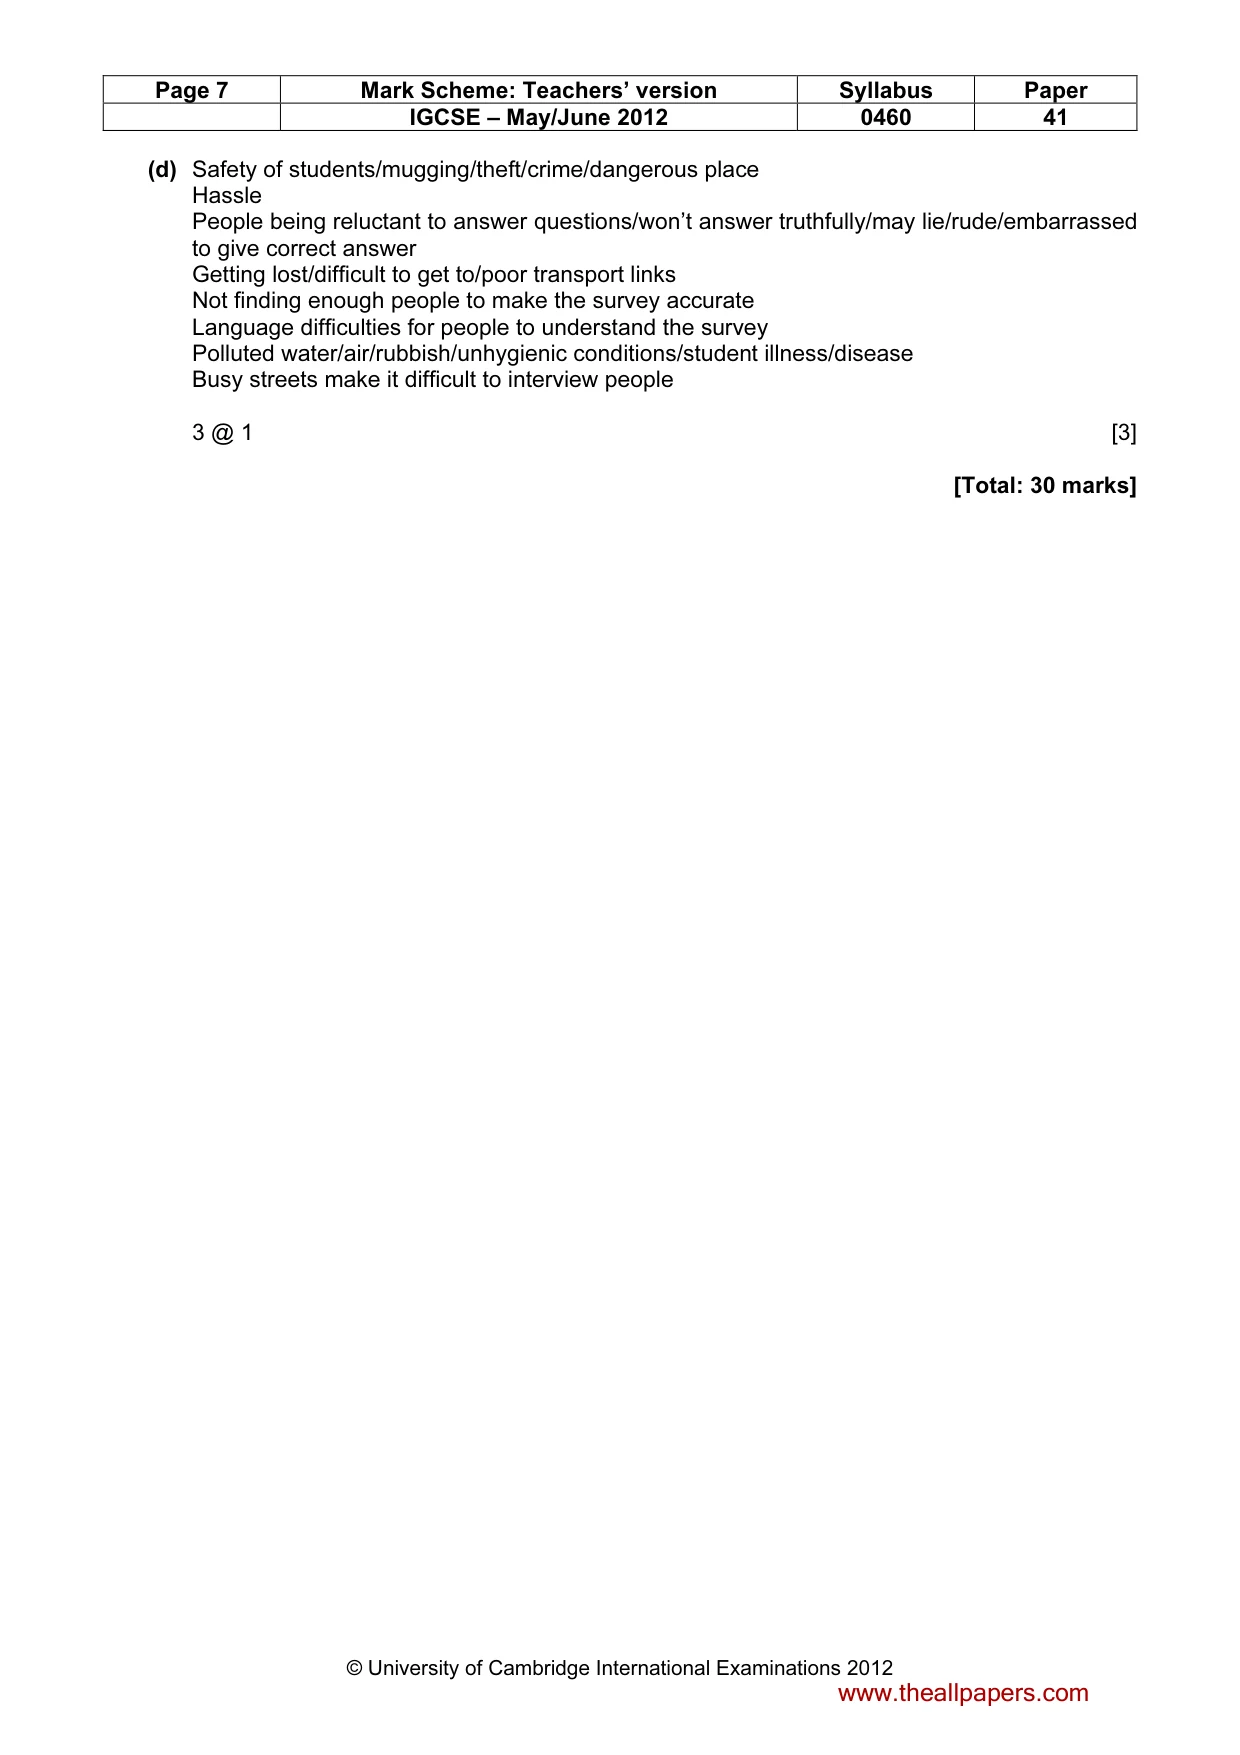
Page 7 Mark Scheme: Teachers’ version Syllabus Paper IGCSE – May/June 2012 0460 41 © University of Cambridge International Examinations 2012 (d) Safety of students/mugging/theft/crime/dangerous place Hassle People being reluctant to answer questions/won’t answer truthfully/may lie/rude/embarrassed to give correct answer Getting lost/difficult to get to/poor transport links Not finding enough people to make the survey accurate Language difficulties for people to understand the survey Polluted water/air/rubbish/unhygienic conditions/student illness/disease Busy streets make it difficult to interview people 3 @ 1 [3] [Total: 30 marks] www.theallpapers.com
What you needed in this session
Cambridge’s own grade thresholds for 2012 May/June, Paper 4 · Variant 1. A higher threshold means an easier paper — the bar moves with how the cohort did.