Cambridge IGCSE Geography 0460 — 2011 Oct/Nov Paper 4 · Variant 3
0460/43/O/N/11 · 60 marks · ≈68 min
The question paper and its mark scheme, free to read here and free to download. This is Cambridge’s own paper, exactly as it was sat.
Question paper16 pages


Mark scheme5 pages
Answers below. Sit the paper first if you are practising.
Paper as text
Question paper, page 1
This document consists of 14 printed pages and 2 blank pages, and 1 Insert. DC (AC/SW) 32278/6 © UCLES 2011 [Turn over UNIVERSITY OF CAMBRIDGE INTERNATIONAL EXAMINATIONS International General Certificate of Secondary Education * 0 6 1 2 3 9 2 8 4 9 * GEOGRAPHY 0460/43 Paper 4 Alternative to Coursework October/November 2011 1 hour 30 minutes Candidates answer on the Question Paper Additional Materials: Ruler READ THESE INSTRUCTIONS FIRST Write your Centre number, candidate number and name on all the work you hand in. Write in dark blue or black pen. You may use a soft pencil for any diagrams, graphs or rough working. Do not use staples, paper clips, highlighters, glue or correction fluid. DO NOT WRITE ON ANY BARCODES. Answer all questions. The Insert contains Figs 1 and 3 for Question 1, and Tables 3 and 4 for Question 2. The Insert is not required by the Examiner. Sketch maps and diagrams should be drawn whenever they serve to illustrate an answer. The number of marks is given in brackets [ ] at the end of each question or part question. www.theallpapers.com
Question paper, page 2
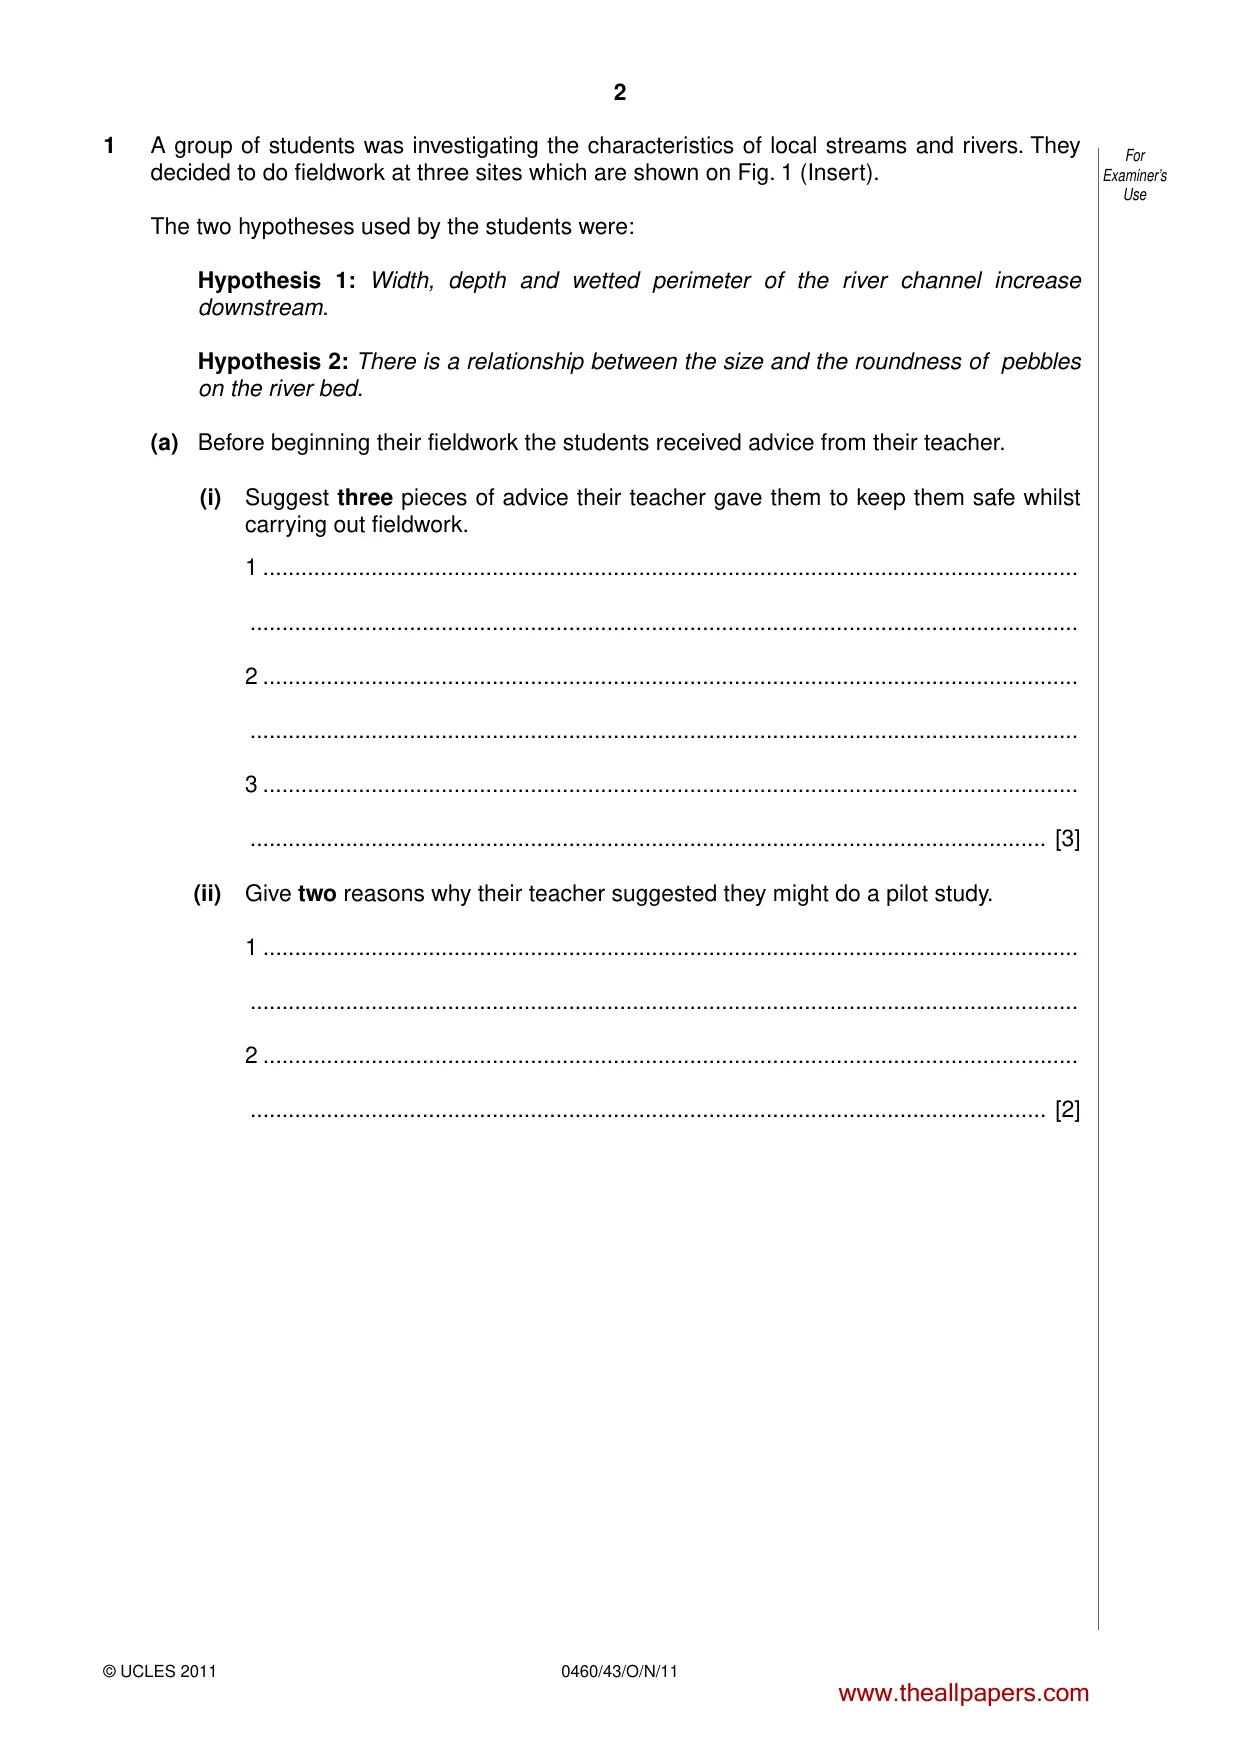
2 0460/43/O/N/11 © UCLES 2011 For Examiner’s Use 1 A group of students was investigating the characteristics of local streams and rivers. They decided to do fieldwork at three sites which are shown on Fig. 1 (Insert). The two hypotheses used by the students were: Hypothesis 1: Width, depth and wetted perimeter of the river channel increase downstream. Hypothesis 2: There is a relationship between the size and the roundness of pebbles on the river bed. (a) Before beginning their fieldwork the students received advice from their teacher. (i) Suggest three pieces of advice their teacher gave them to keep them safe whilst carrying out fieldwork. 1 … … 2 … … 3 … … [3] (ii) Give two reasons why their teacher suggested they might do a pilot study. 1 … … 2 … … [2] www.theallpapers.com
Question paper, page 3
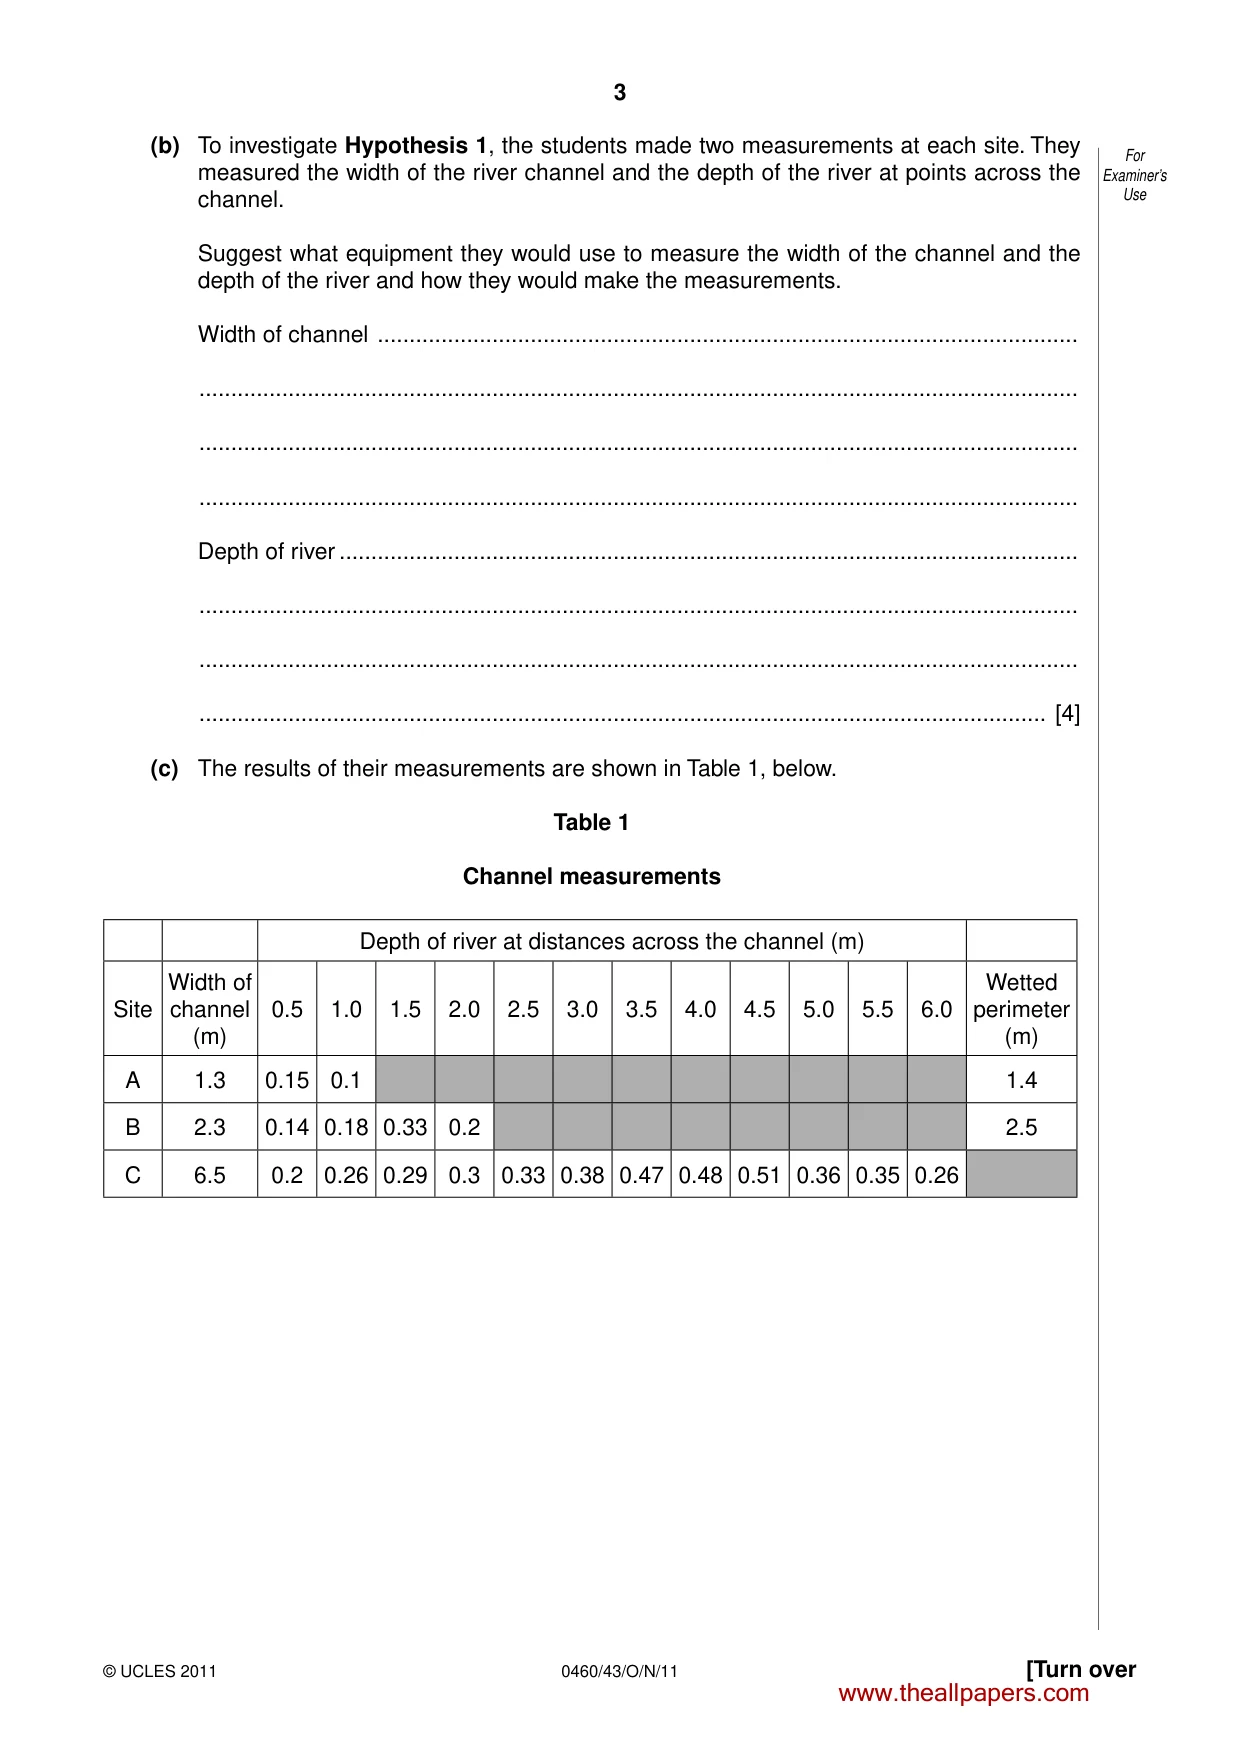
3 0460/43/O/N/11 © UCLES 2011 [Turn over For Examiner’s Use (b) To investigate Hypothesis 1, the students made two measurements at each site. They measured the width of the river channel and the depth of the river at points across the channel. Suggest what equipment they would use to measure the width of the channel and the depth of the river and how they would make the measurements. Width of channel … … … … Depth of river … … … … [4] (c) The results of their measurements are shown in Table 1, below. Table 1 Channel measurements Depth of river at distances across the channel (m) Site Width of channel (m) 0.5 1.0 1.5 2.0 2.5 3.0 3.5 4.0 4.5 5.0 5.5 6.0 Wetted perimeter (m) A 1.3 0.15 0.1 1.4 B 2.3 0.14 0.18 0.33 0.2 2.5 C 6.5 0.2 0.26 0.29 0.3 0.33 0.38 0.47 0.48 0.51 0.36 0.35 0.26 www.theallpapers.com
Question paper, page 4
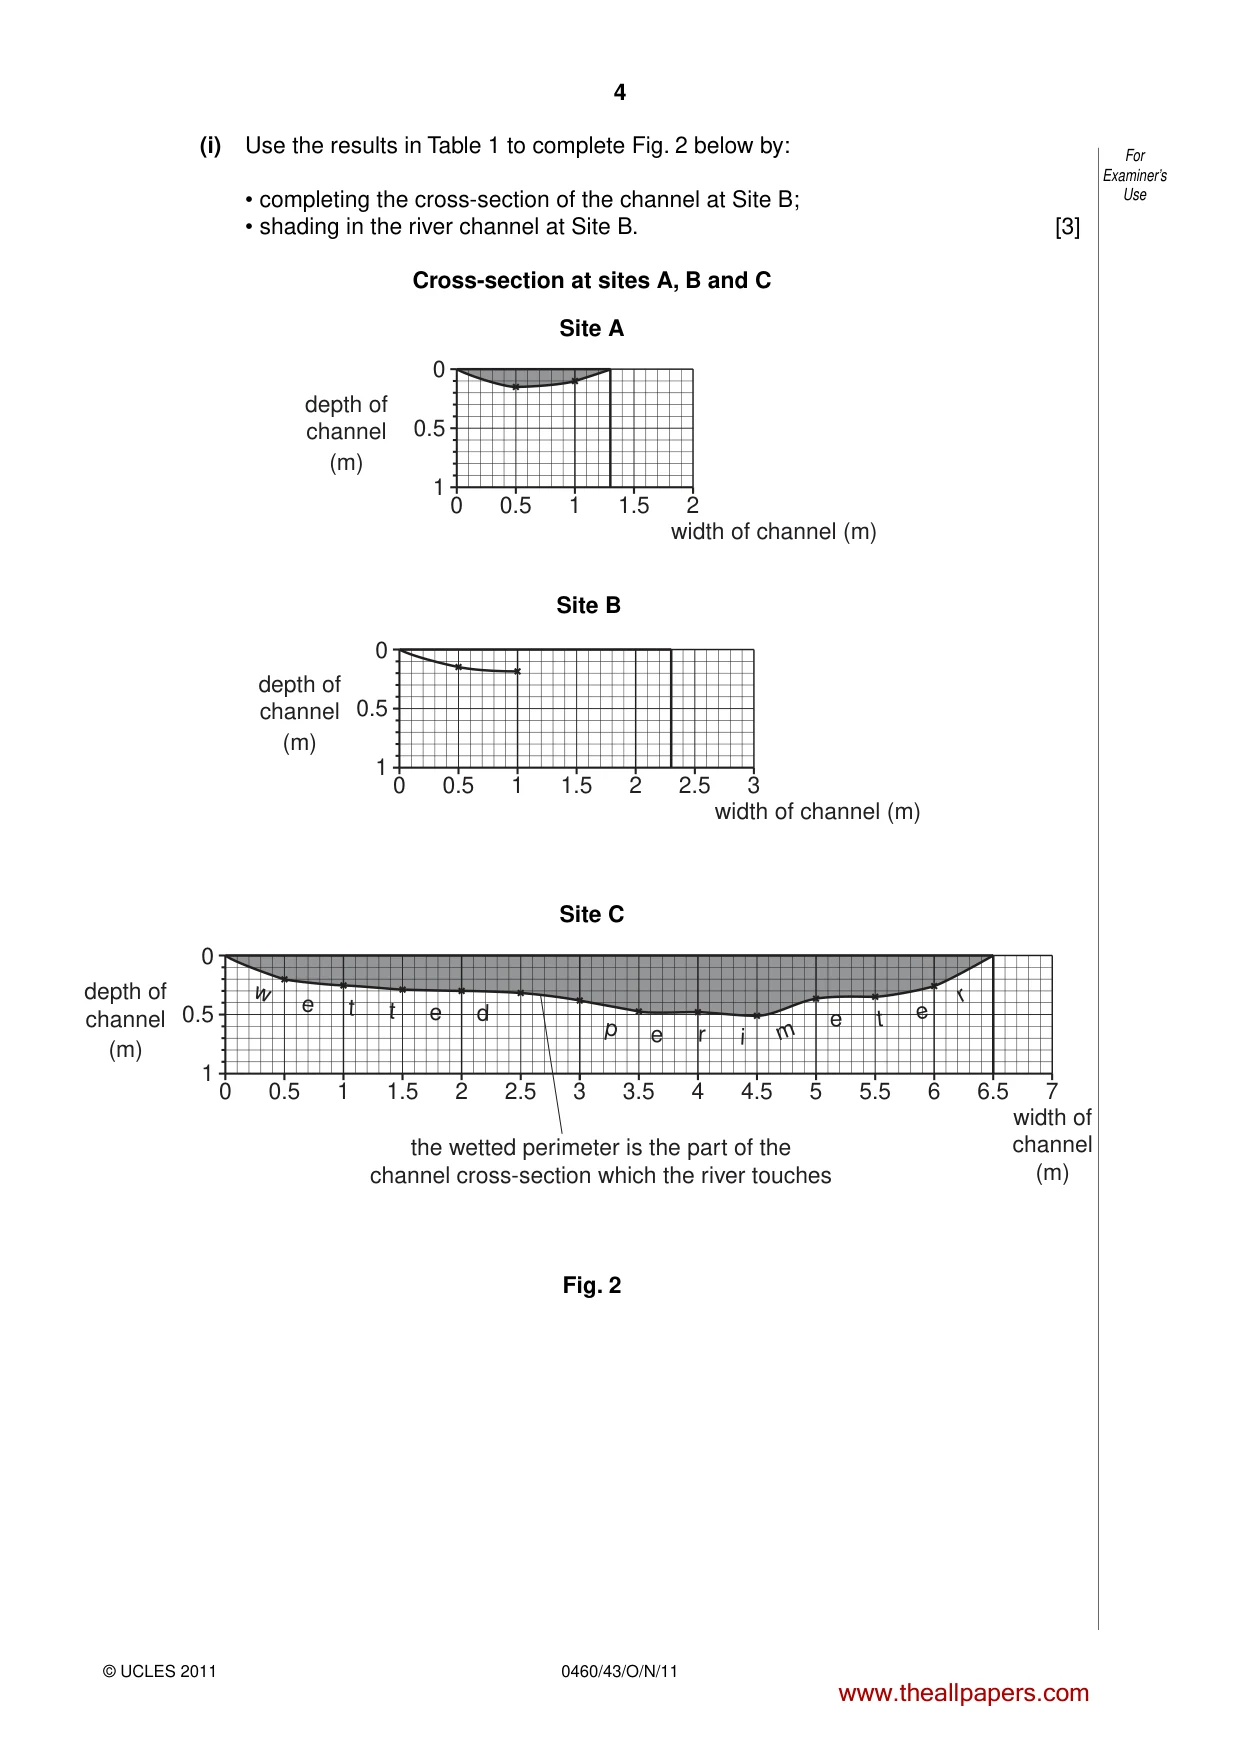
4 0460/43/O/N/11 © UCLES 2011 For Examiner’s Use (i) Use the results in Table 1 to complete Fig. 2 below by: • completing the cross-section of the channel at Site B; • shading in the river channel at Site B. [3] Cross-section at sites A, B and C 0 0.5 1 0 0.5 1 1.5 2 (m) depth of channel width of channel (m) 0 0.5 1 0 0.5 1 1.5 2 2.5 3 (m) depth of channel width of channel (m) 0 0.5 1 0 0.5 1 1.5 2 2.5 the wetted perimeter is the part of the channel cross-section which the river touches 3 3.5 4 4.5 5 5.5 6 6.5 7 (m) depth of channel width of channel (m) w e t t e d p e r i m e t e r Fig. 2 Site A Site B Site C www.theallpapers.com
Question paper, page 5
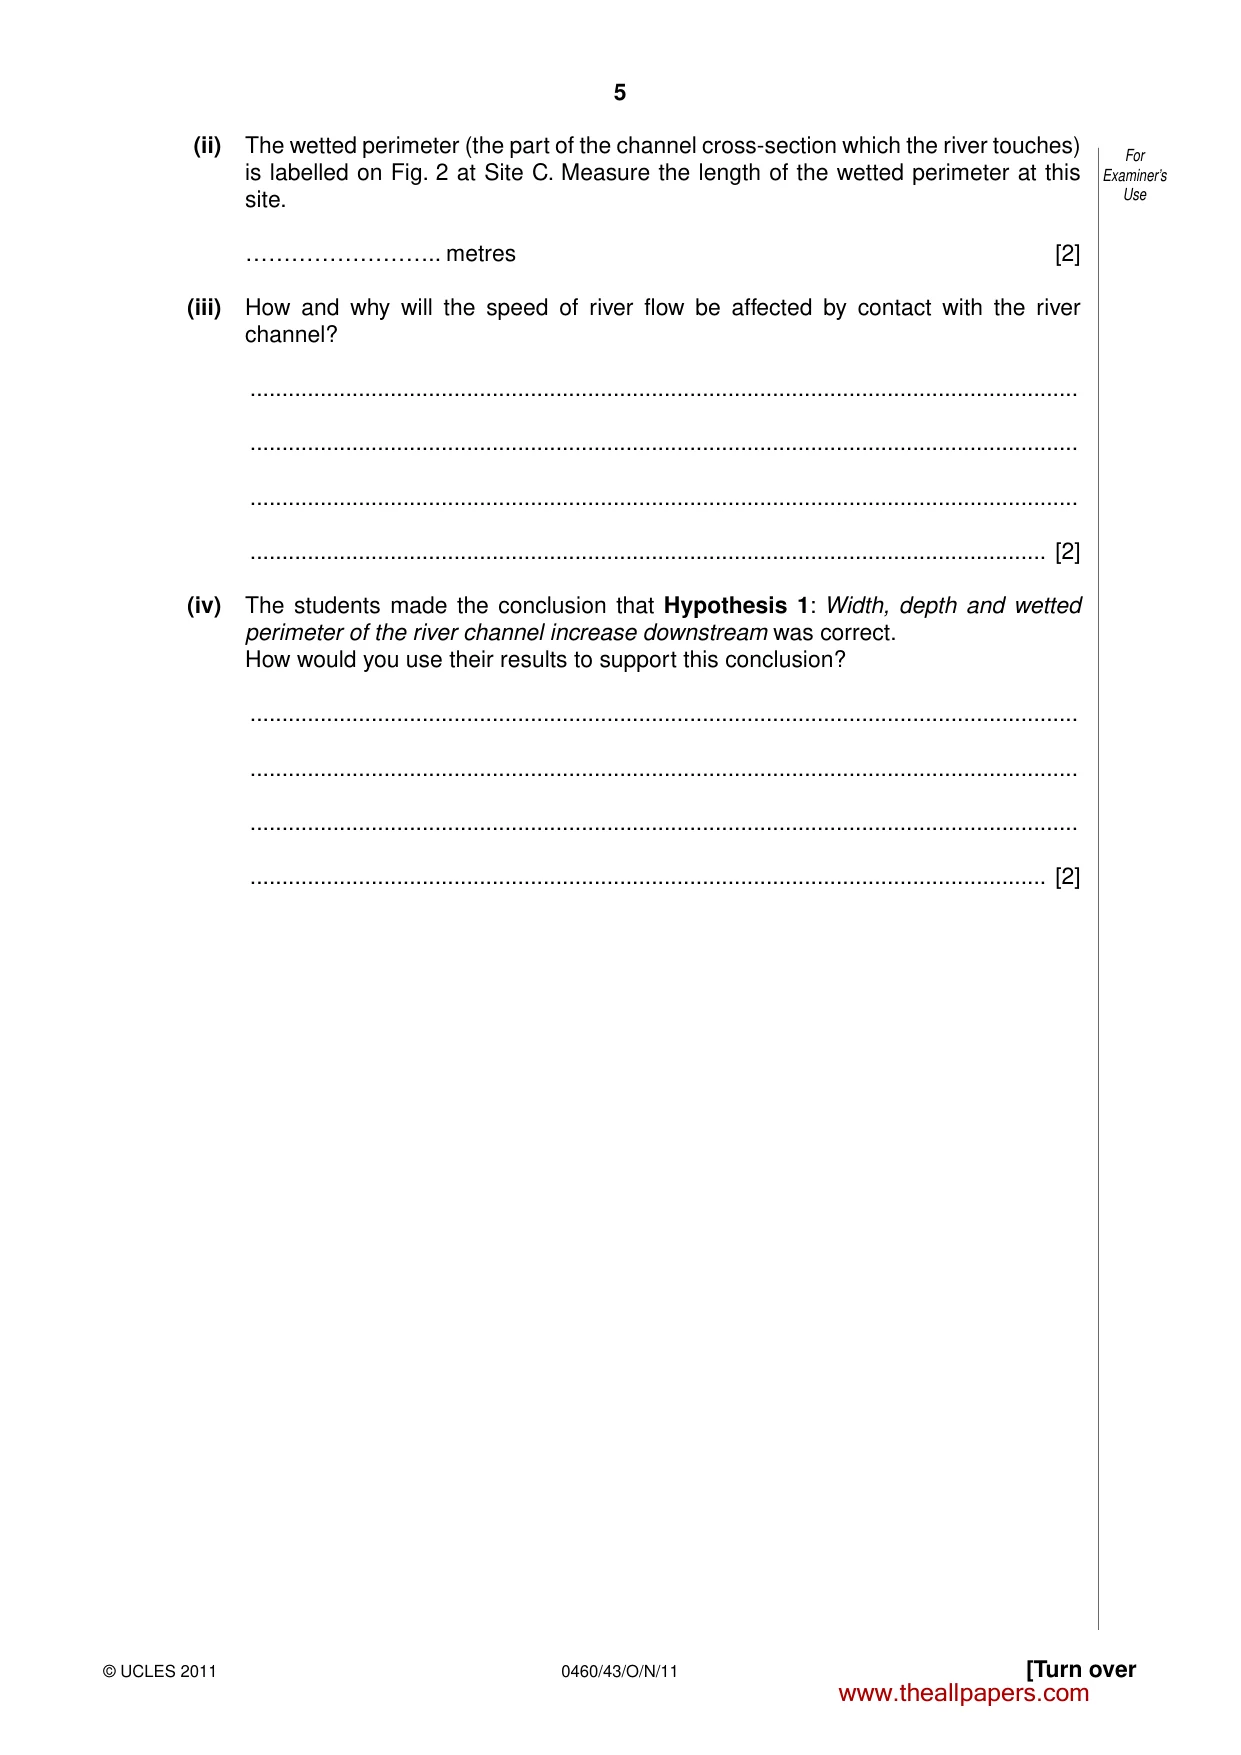
5 0460/43/O/N/11 © UCLES 2011 [Turn over For Examiner’s Use (ii) The wetted perimeter (the part of the channel cross-section which the river touches) is labelled on Fig. 2 at Site C. Measure the length of the wetted perimeter at this site. …………………….. metres [2] (iii) How and why will the speed of river flow be affected by contact with the river channel? … … … … [2] (iv) The students made the conclusion that Hypothesis 1: Width, depth and wetted perimeter of the river channel increase downstream was correct. How would you use their results to support this conclusion? … … … … [2] www.theallpapers.com
Question paper, page 6
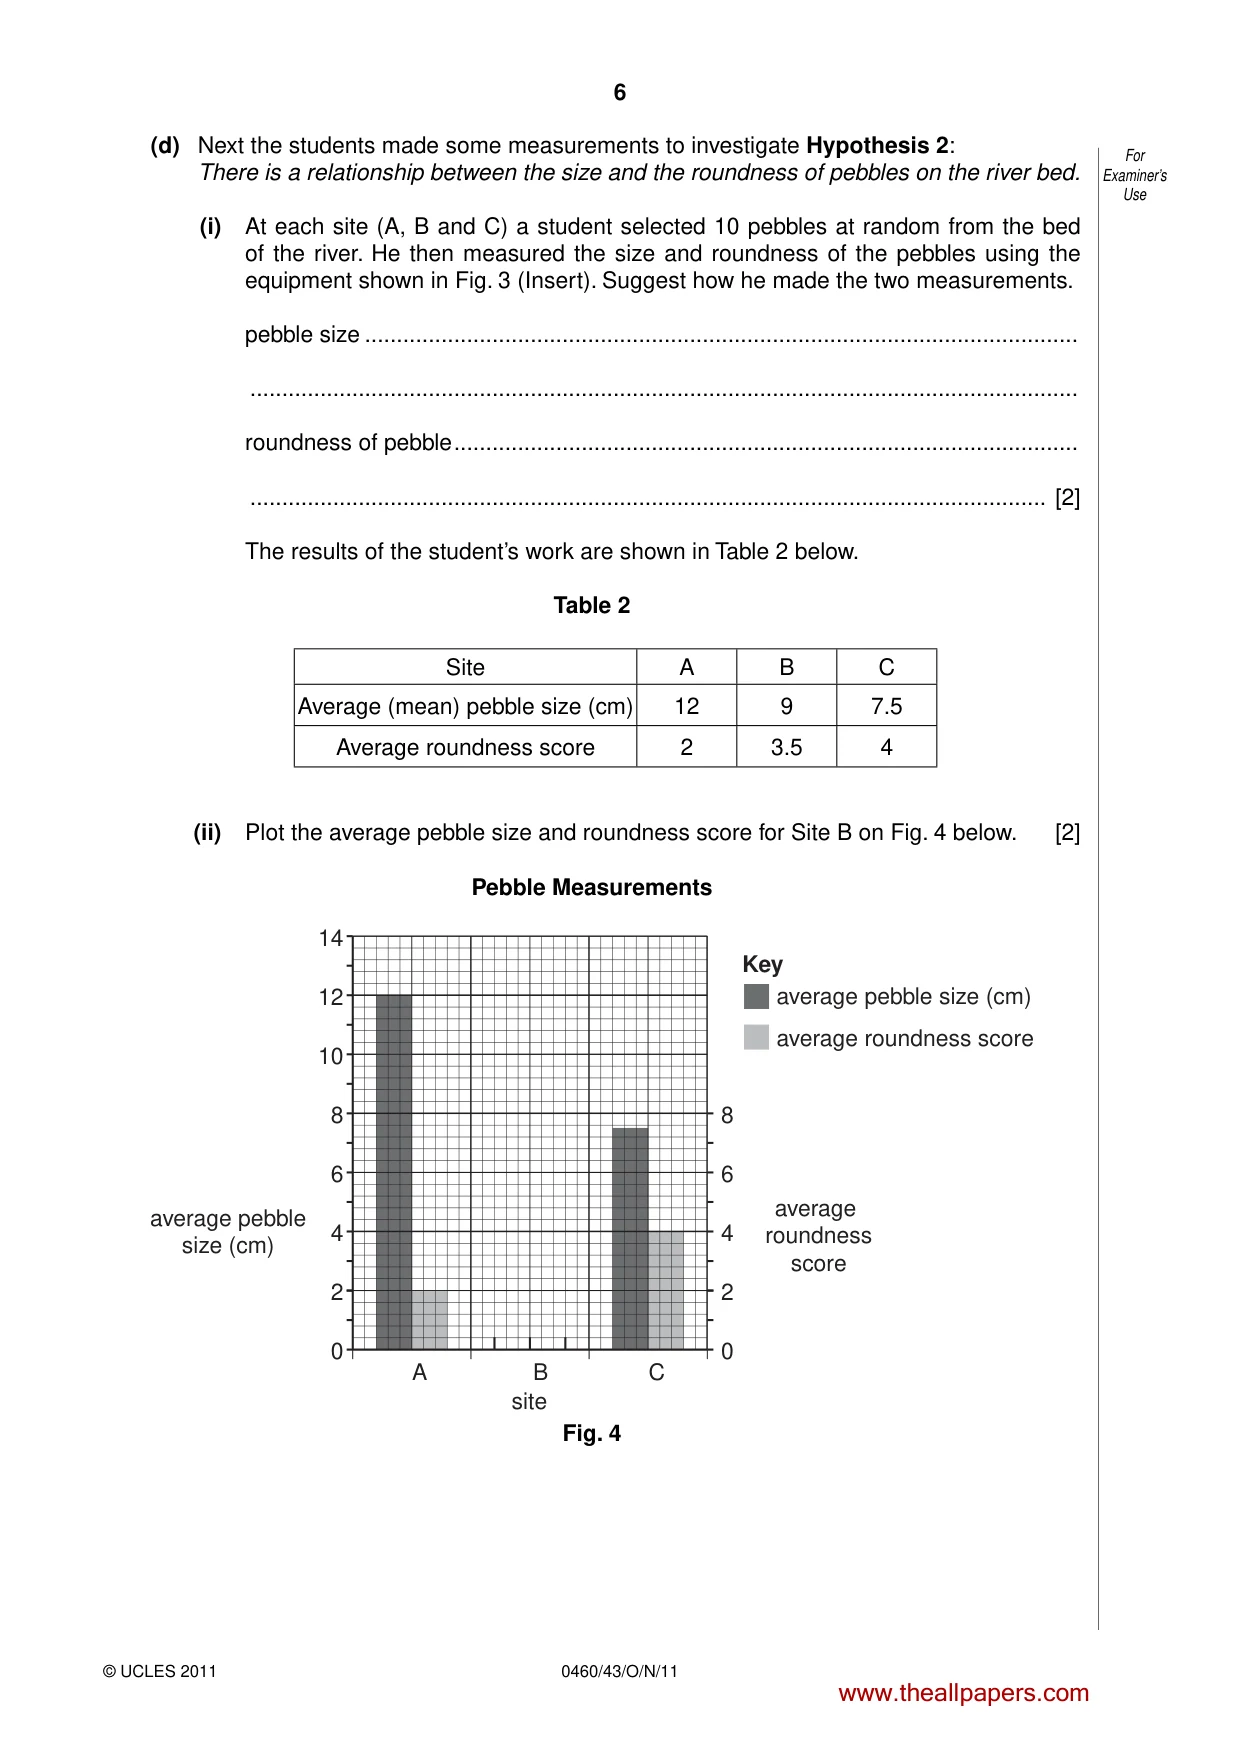
6 0460/43/O/N/11 © UCLES 2011 For Examiner’s Use (d) Next the students made some measurements to investigate Hypothesis 2: There is a relationship between the size and the roundness of pebbles on the river bed. (i) At each site (A, B and C) a student selected 10 pebbles at random from the bed of the river. He then measured the size and roundness of the pebbles using the equipment shown in Fig. 3 (Insert). Suggest how he made the two measurements. pebble size … … roundness of pebble … … [2] The results of the student’s work are shown in Table 2 below. Table 2 Site A B C Average (mean) pebble size (cm) 12 9 7.5 Average roundness score 2 3.5 4 (ii) Plot the average pebble size and roundness score for Site B on Fig. 4 below. [2] Pebble Measurements average pebble size (cm) average roundness score Key average pebble size (cm) average roundness score 0 2 4 6 8 0 2 4 6 8 A C B site 10 12 14 Fig. 4 www.theallpapers.com
Question paper, page 7
7 0460/43/O/N/11 © UCLES 2011 [Turn over For Examiner’s Use (iii) What conclusion would the students make about Hypothesis 2: There is a relationship between the size and the roundness of pebbles on the river bed? … … … … [2] (iv) Suggest why pebble size and roundness change downstream. … … … … [2] (e) Suggest four ways that the students could have improved their data collection methods to make their results for both hypotheses more reliable. 1 … … 2 … … 3 … … 4 … … [4] [Total: 30 marks] www.theallpapers.com
Question paper, page 8
8 0460/43/O/N/11 © UCLES 2011 BLANK PAGE www.theallpapers.com
Question paper, page 9
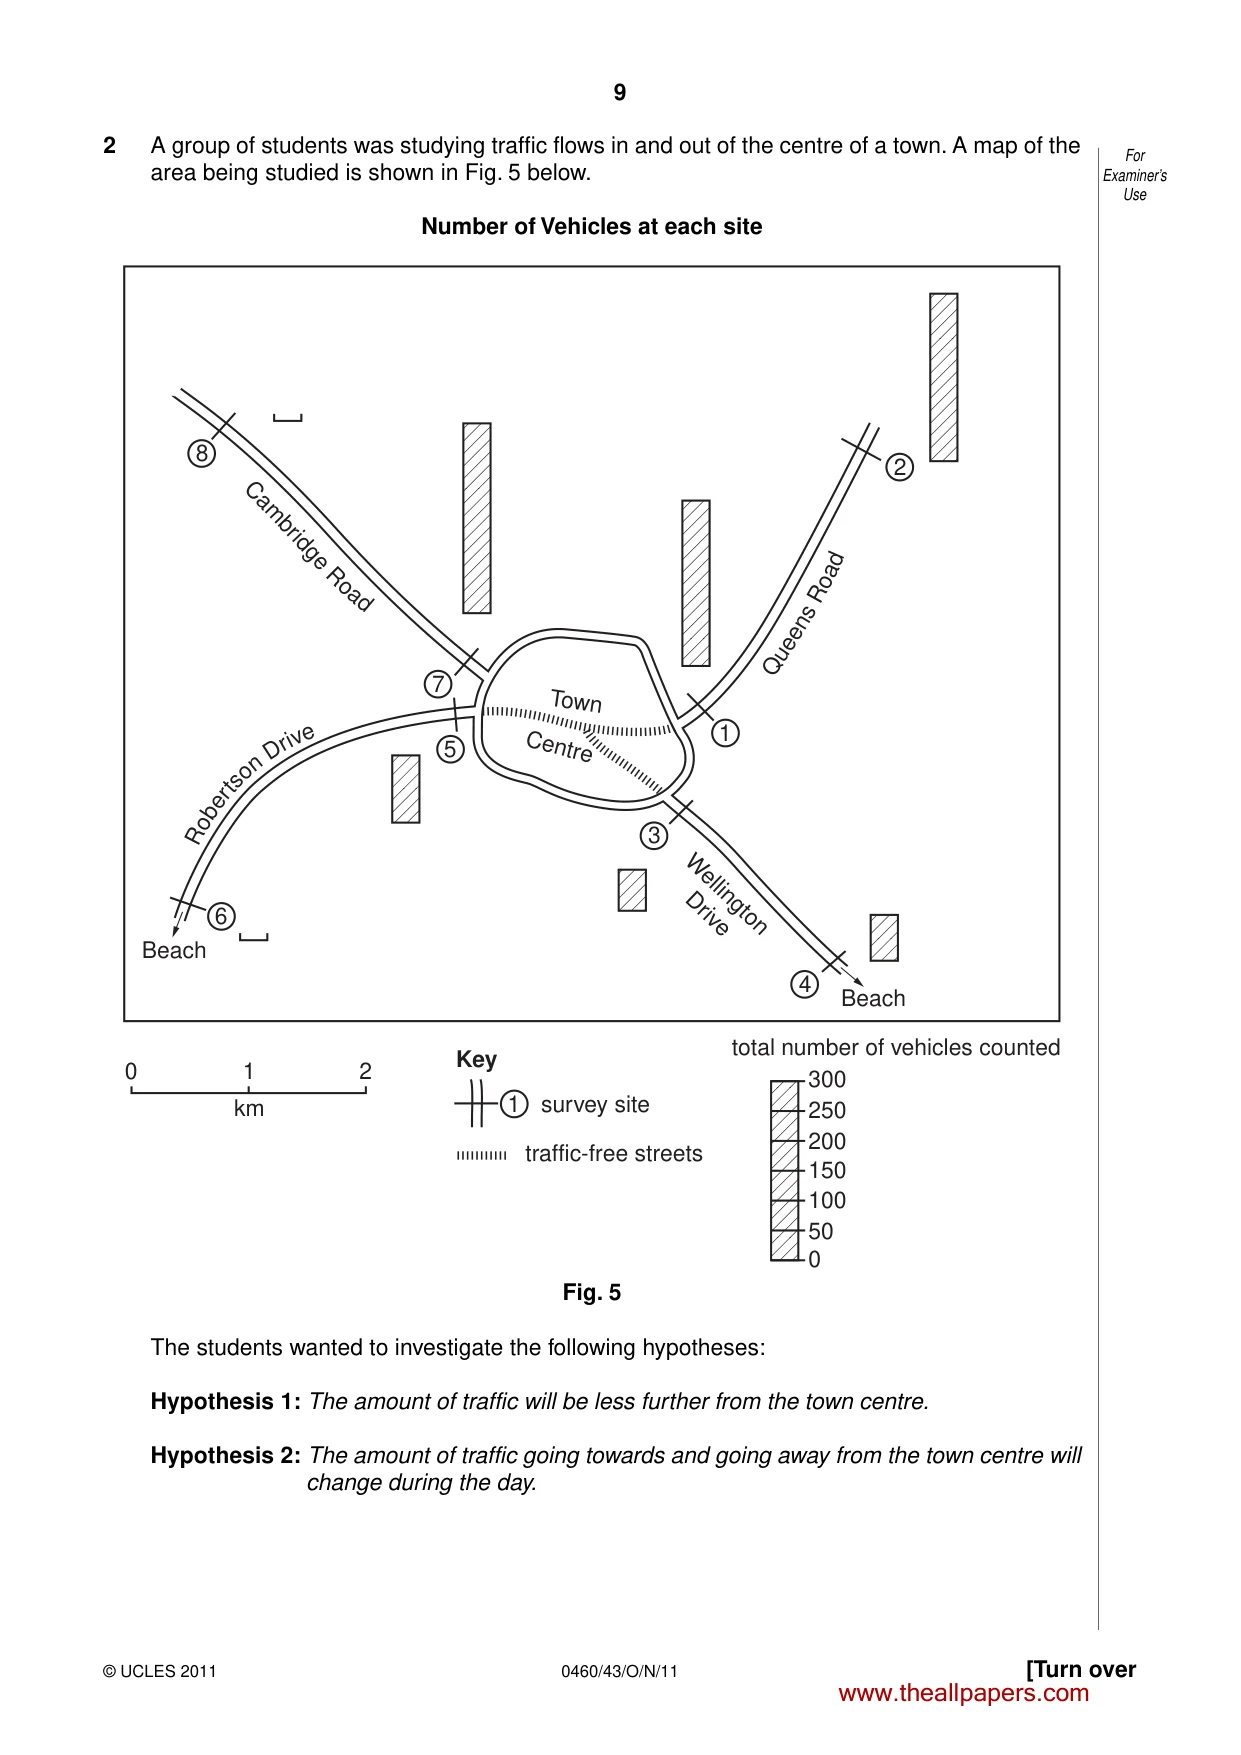
9 0460/43/O/N/11 © UCLES 2011 [Turn over For Examiner’s Use 2 A group of students was studying traffic flows in and out of the centre of a town. A map of the area being studied is shown in Fig. 5 below. Number of Vehicles at each site 300 total number of vehicles counted survey site Key traffic-free streets 250 200 150 100 50 0 0 1 km 2 Cambridge R oa d R o b e rt s o n D ri v e Quee ns R oa d Wellington Drive 8 7 5 3 4 1 2 6 1 Town Centre Beach Beach Fig. 5 The students wanted to investigate the following hypotheses: Hypothesis 1: The amount of traffic will be less further from the town centre. Hypothesis 2: The amount of traffic going towards and going away from the town centre will change during the day. www.theallpapers.com
Question paper, page 10
10 0460/43/O/N/11 © UCLES 2011 For Examiner’s Use The students chose eight sites to do traffic surveys at 08.00 and 17.00. These are shown on Fig. 5. (a) (i) Suggest four things the students would need to do to plan for their traffic count. 1 … … 2 … … 3 … … 4 … … [4] (ii) The students agreed to use a tally method to record vehicles passing each survey point. Give two reasons why this is a suitable recording method. 1 … … 2 … … [2] www.theallpapers.com
Question paper, page 11
11 0460/43/O/N/11 © UCLES 2011 [Turn over For Examiner’s Use (b) The results of the students’ survey are shown in Table 3 (Insert). (i) On which road were the two highest totals? … [1] (ii) Use the data in Table 3 to draw bars on Fig. 5 (page 9) to show the total number of vehicles counted at sites 6 and 8. [2] (iii) What would be the students’ conclusion about Hypothesis 1: The amount of traffic will be less further from the town centre? Support your decision with evidence from Fig. 5 and Table 3. … … … … … … … … [4] (c) (i) To investigate Hypothesis 2: The amount of traffic going towards and going away from the town centre will change during the day, the students decided to use the results from one site on each of the four roads. These results are shown in Table 4 (Insert). Look at Tables 3 and 4 and suggest one reason why they made this decision. … … [1] www.theallpapers.com
Question paper, page 12
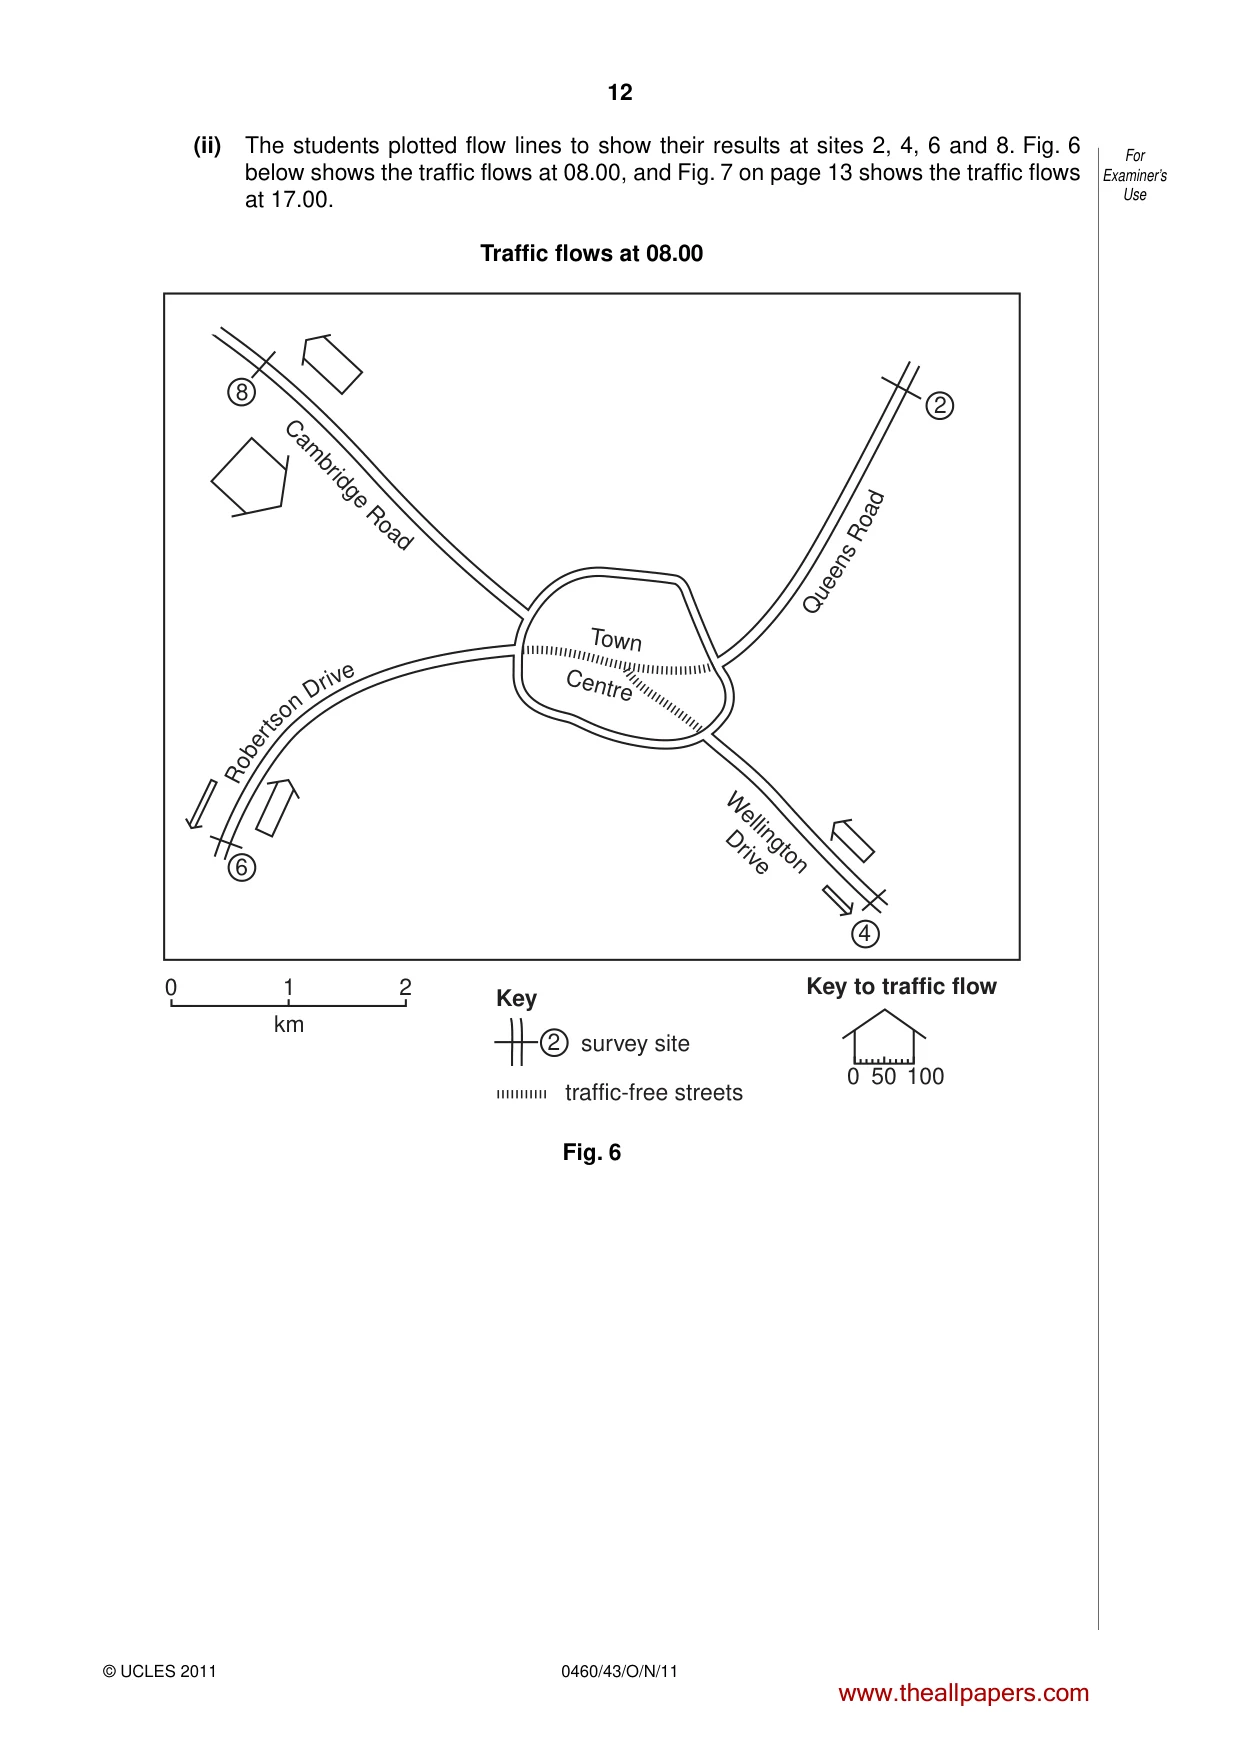
12 0460/43/O/N/11 © UCLES 2011 For Examiner’s Use (ii) The students plotted flow lines to show their results at sites 2, 4, 6 and 8. Fig. 6 below shows the traffic flows at 08.00, and Fig. 7 on page 13 shows the traffic flows at 17.00. Traffic flows at 08.00 Key to traffic flow survey site Key traffic-free streets 0 1 km 2 Cambridge R oa d R o b e rt s o n D ri v e Quee ns R oa d Wellington Drive 8 4 2 6 2 Town Centre 0 50 100 Fig. 6 www.theallpapers.com
Question paper, page 13
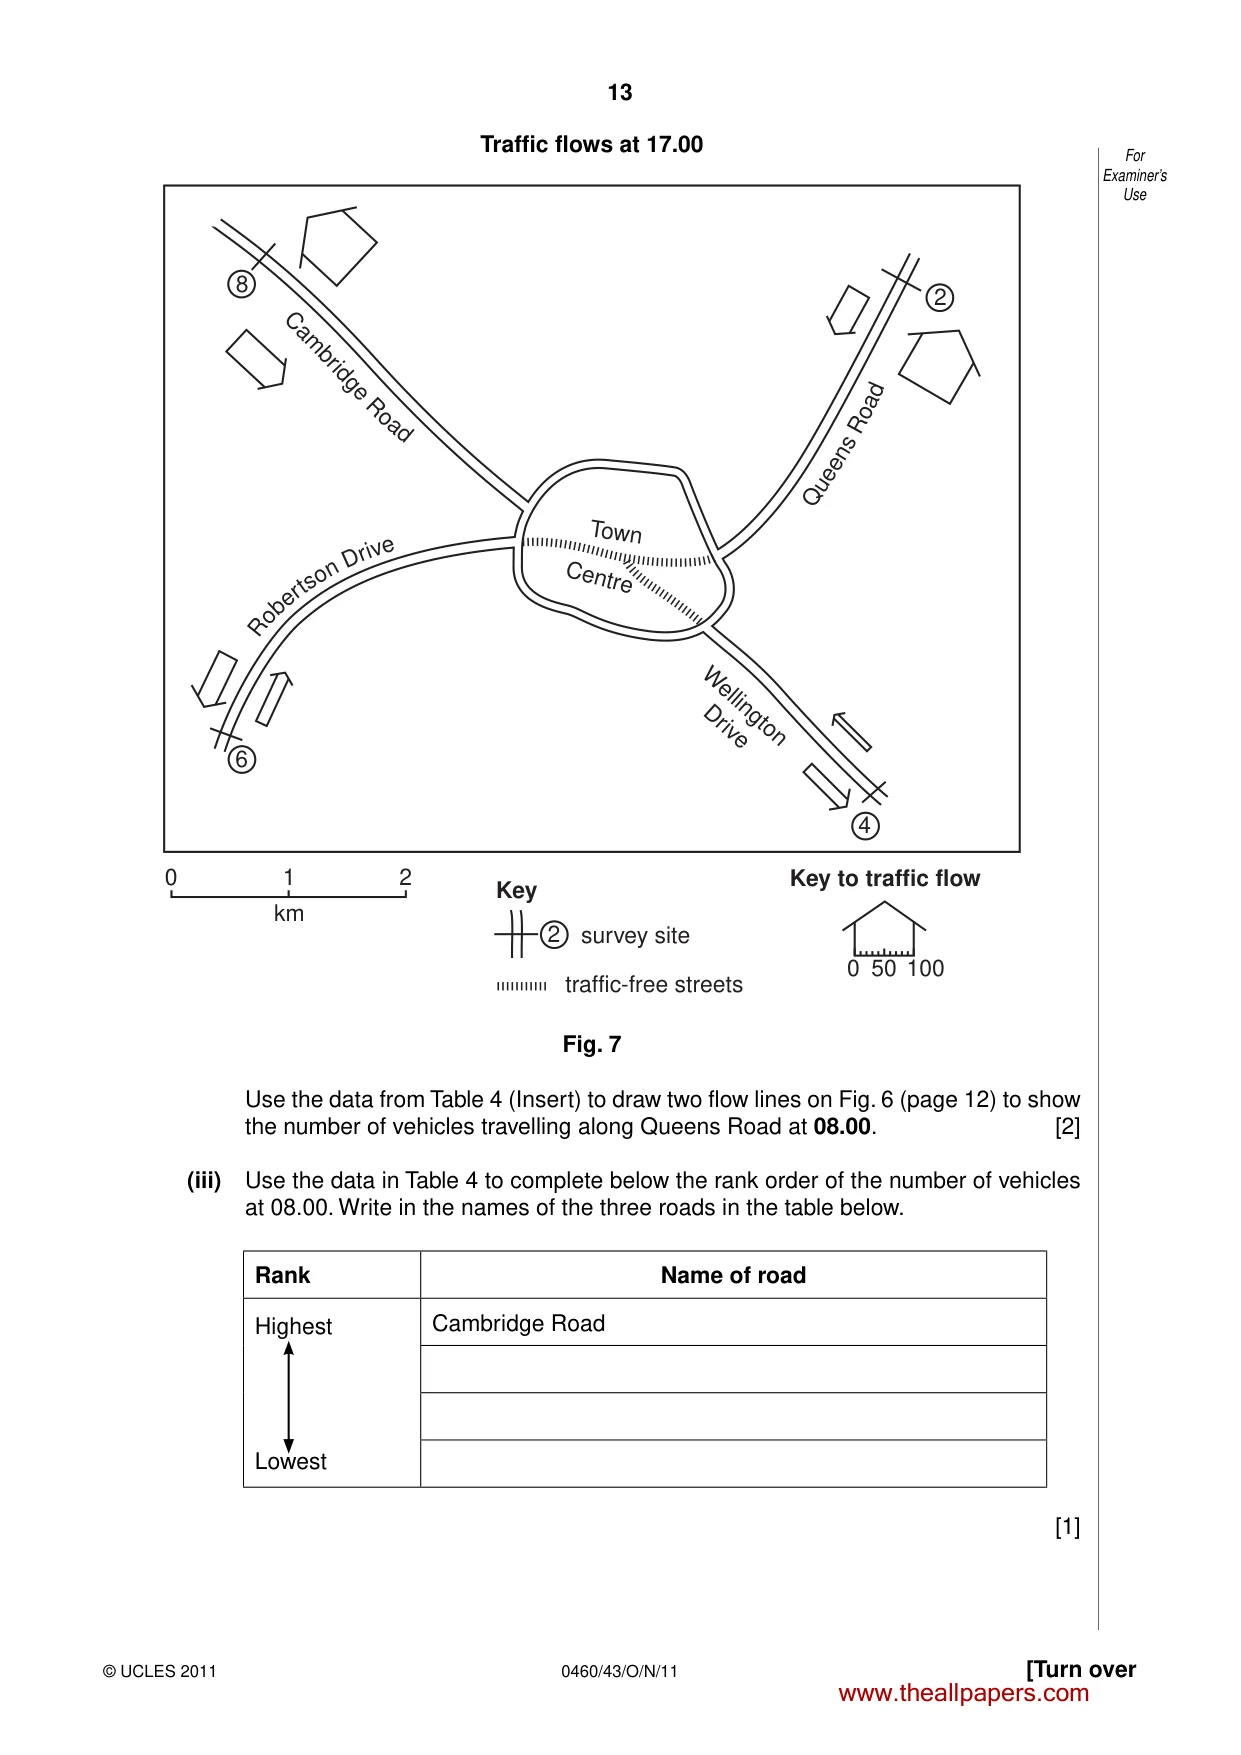
13 0460/43/O/N/11 © UCLES 2011 [Turn over For Examiner’s Use Traffic flows at 17.00 Key to traffic flow survey site Key traffic-free streets 0 1 km 2 Cambridge R oa d R o b er ts o n Dr iv e Quee ns R oa d 8 4 2 6 2 Town Centre 0 50 100 Wellington Drive Fig. 7 Use the data from Table 4 (Insert) to draw two flow lines on Fig. 6 (page 12) to show the number of vehicles travelling along Queens Road at 08.00. [2] (iii) Use the data in Table 4 to complete below the rank order of the number of vehicles at 08.00. Write in the names of the three roads in the table below. Rank Name of road Highest Lowest Cambridge Road [1] www.theallpapers.com
Question paper, page 14
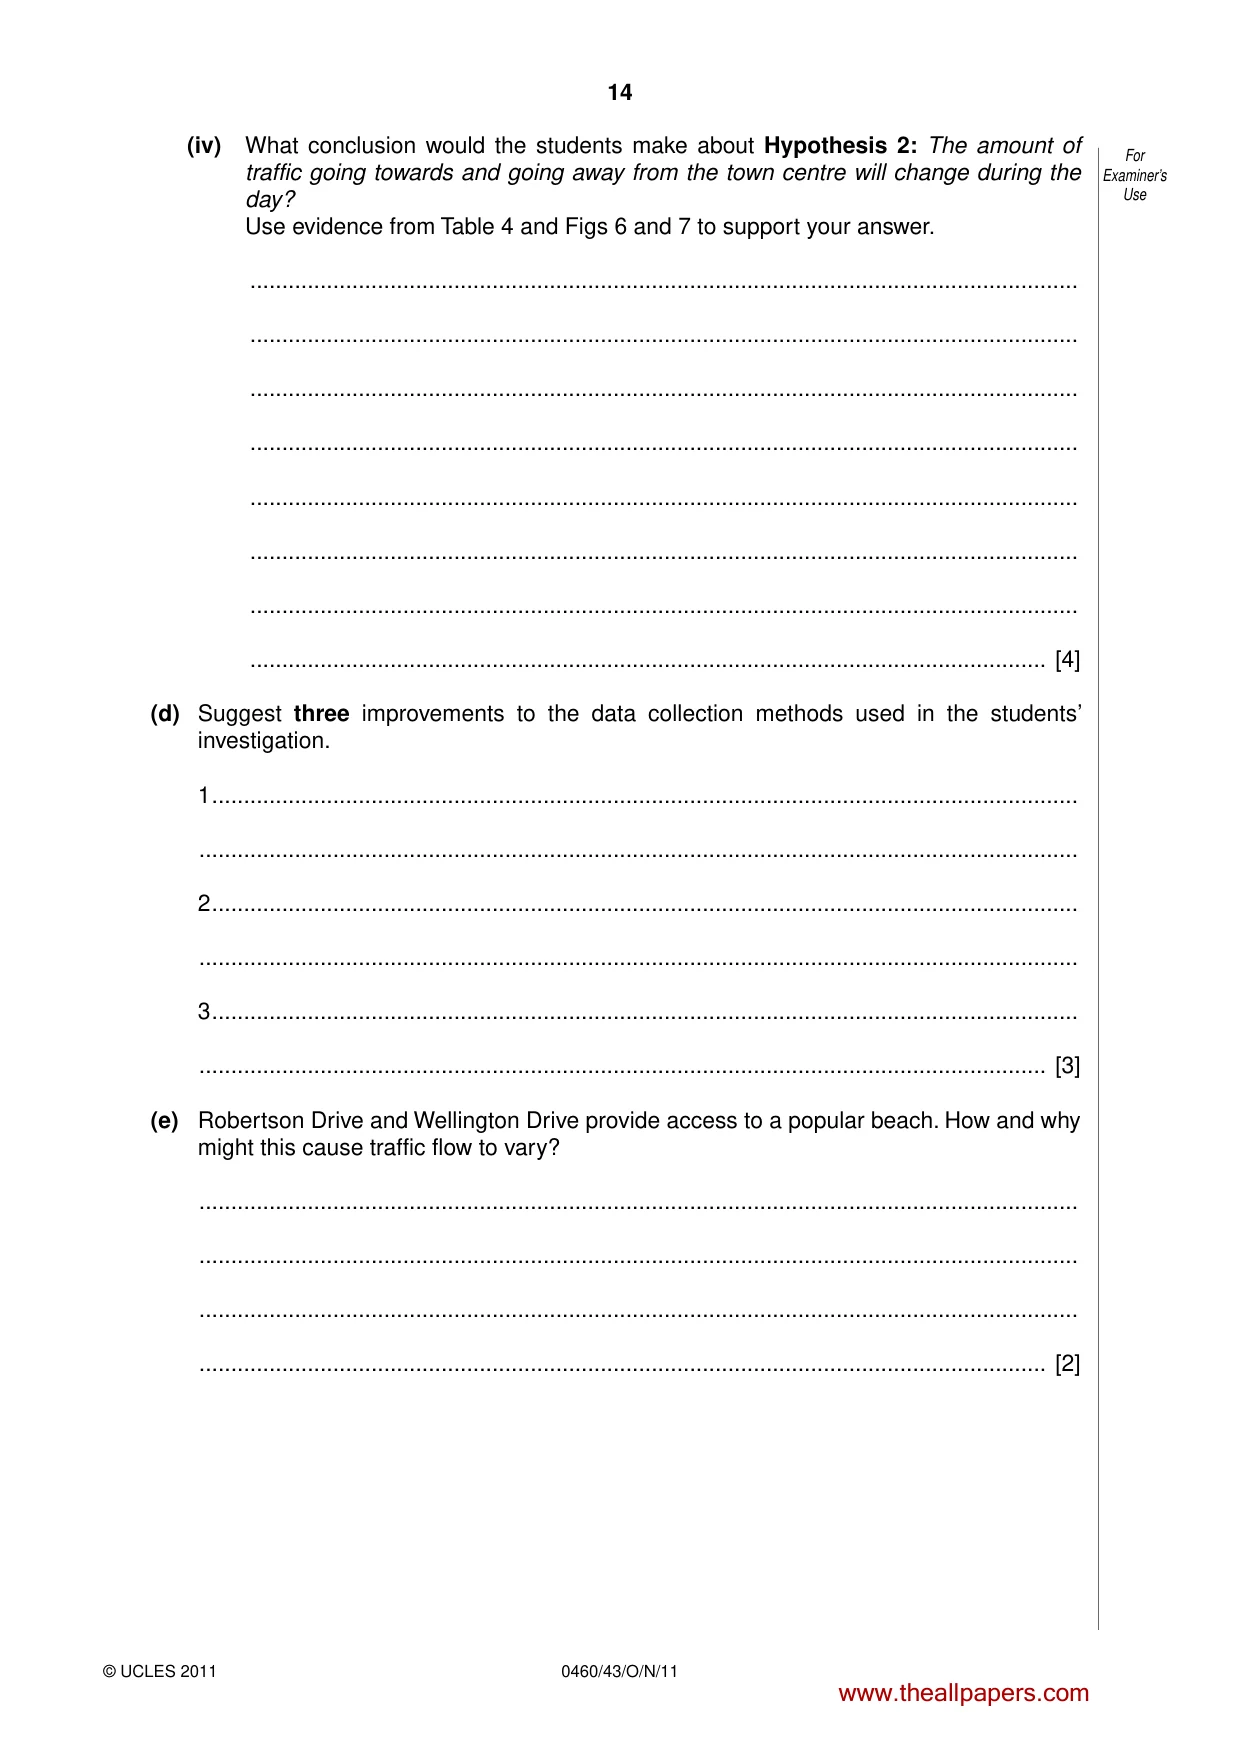
14 0460/43/O/N/11 © UCLES 2011 For Examiner’s Use (iv) What conclusion would the students make about Hypothesis 2: The amount of traffic going towards and going away from the town centre will change during the day? Use evidence from Table 4 and Figs 6 and 7 to support your answer. … … … … … … … … [4] (d) Suggest three improvements to the data collection methods used in the students’ investigation. 1 … … 2 … … 3 … … [3] (e) Robertson Drive and Wellington Drive provide access to a popular beach. How and why might this cause traffic flow to vary? … … … … [2] www.theallpapers.com
Question paper, page 15
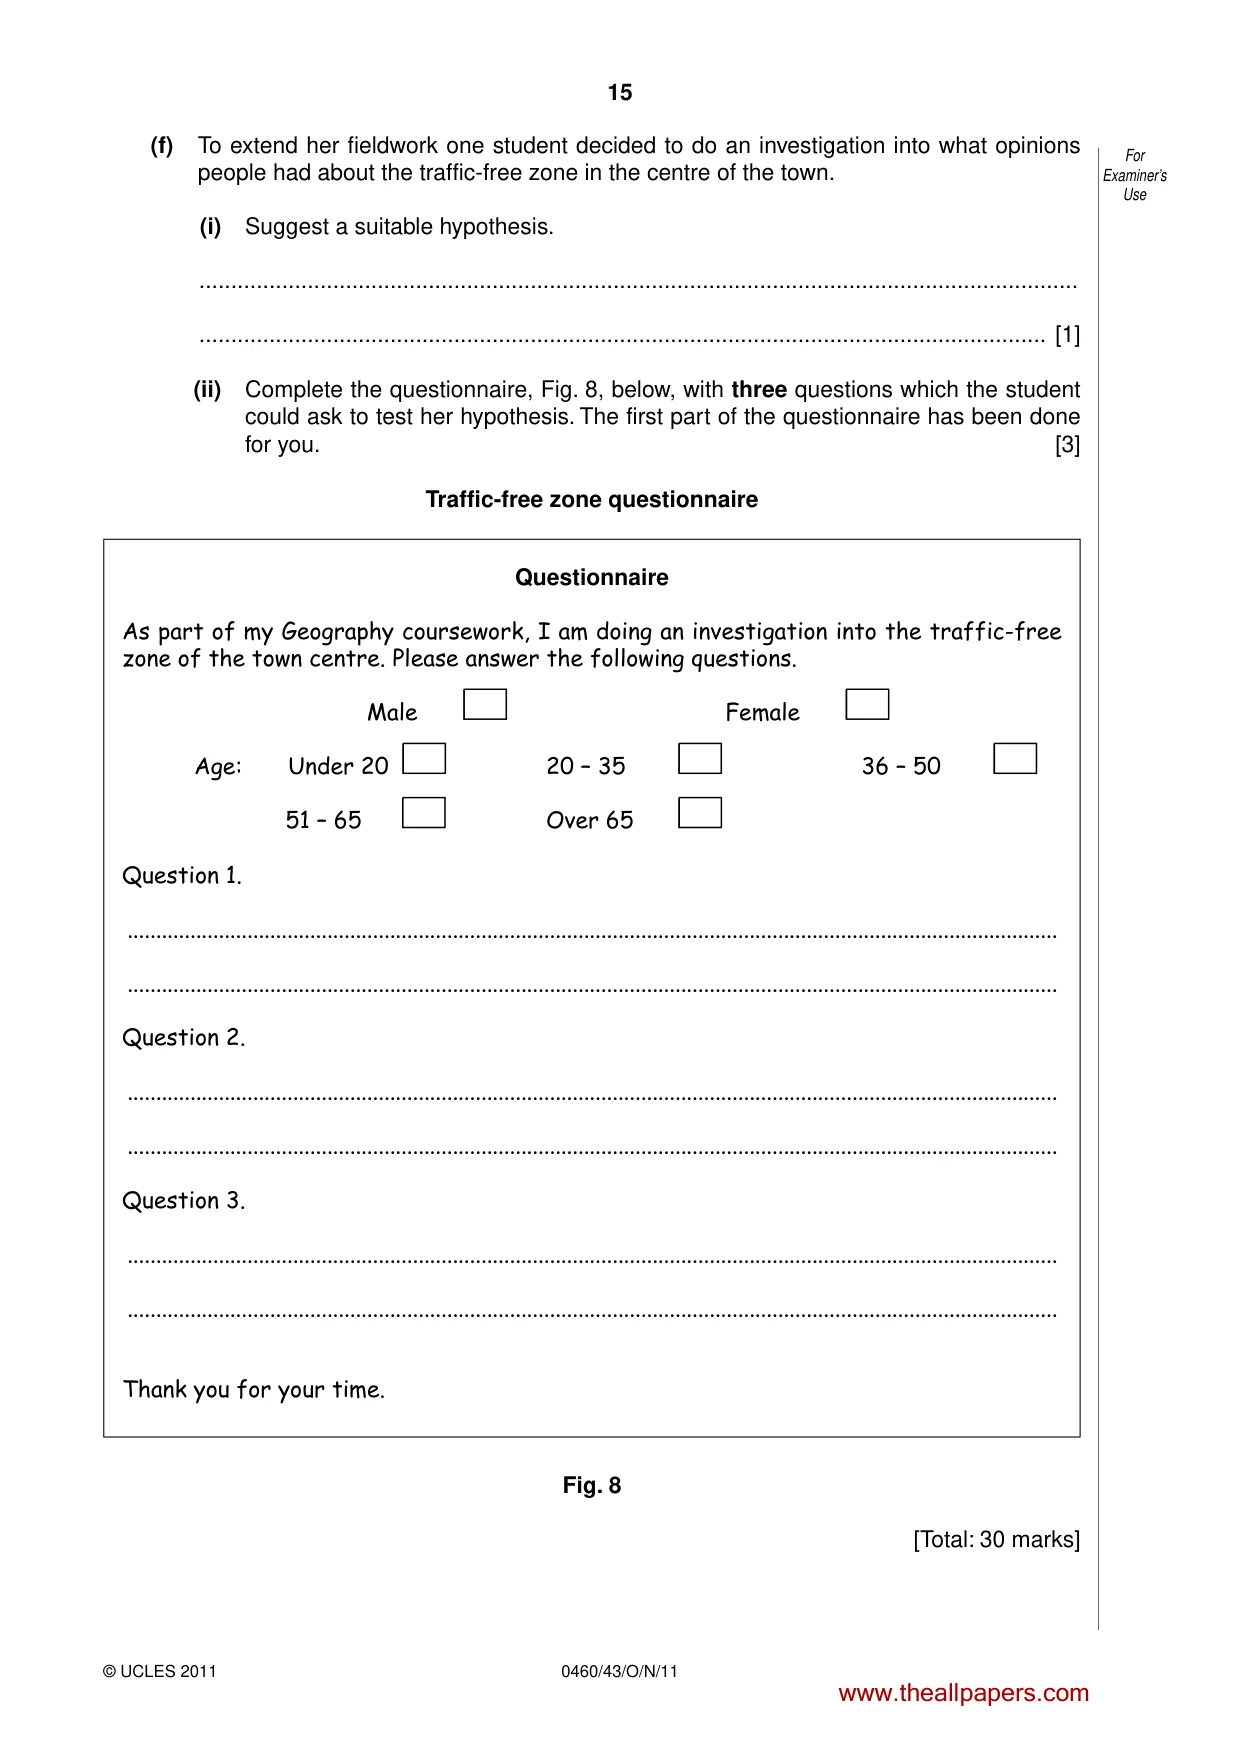
15 0460/43/O/N/11 © UCLES 2011 For Examiner’s Use (f) To extend her fieldwork one student decided to do an investigation into what opinions people had about the traffic-free zone in the centre of the town. (i) Suggest a suitable hypothesis. … … [1] (ii) Complete the questionnaire, Fig. 8, below, with three questions which the student could ask to test her hypothesis. The first part of the questionnaire has been done for you. [3] Traffic-free zone questionnaire Questionnaire As part of my Geography coursework, I am doing an investigation into the traffic-free zone of the town centre. Please answer the following questions. Male Female Age: Under 20 20 – 35 36 – 50 51 – 65 Over 65 Question 1. … … Question 2. … … Question 3. … … Thank you for your time. Fig. 8 [Total: 30 marks] www.theallpapers.com
Question paper, page 16
16 0460/43/O/N/11 © UCLES 2011 Permission to reproduce items where third-party owned material protected by copyright is included has been sought and cleared where possible. Every reasonable effort has been made by the publisher (UCLES) to trace copyright holders, but if any items requiring clearance have unwittingly been included, the publisher will be pleased to make amends at the earliest possible opportunity. University of Cambridge International Examinations is part of the Cambridge Assessment Group. Cambridge Assessment is the brand name of University of Cambridge Local Examinations Syndicate (UCLES), which is itself a department of the University of Cambridge. BLANK PAGE www.theallpapers.com
Mark scheme, page 1
UNIVERSITY OF CAMBRIDGE INTERNATIONAL EXAMINATIONS International General Certificate of Secondary Education MARK SCHEME for the October/November 2011 question paper for the guidance of teachers 0460 GEOGRAPHY 0460/43 Paper 4 (Alternative to Coursework), maximum raw mark 60 This mark scheme is published as an aid to teachers and candidates, to indicate the requirements of the examination. It shows the basis on which Examiners were instructed to award marks. It does not indicate the details of the discussions that took place at an Examiners’ meeting before marking began, which would have considered the acceptability of alternative answers. Mark schemes must be read in conjunction with the question papers and the report on the examination. • Cambridge will not enter into discussions or correspondence in connection with these mark schemes. Cambridge is publishing the mark schemes for the October/November 2011 question papers for most IGCSE, GCE Advanced Level and Advanced Subsidiary Level syllabuses and some Ordinary Level syllabuses. www.theallpapers.com
Mark scheme, page 2
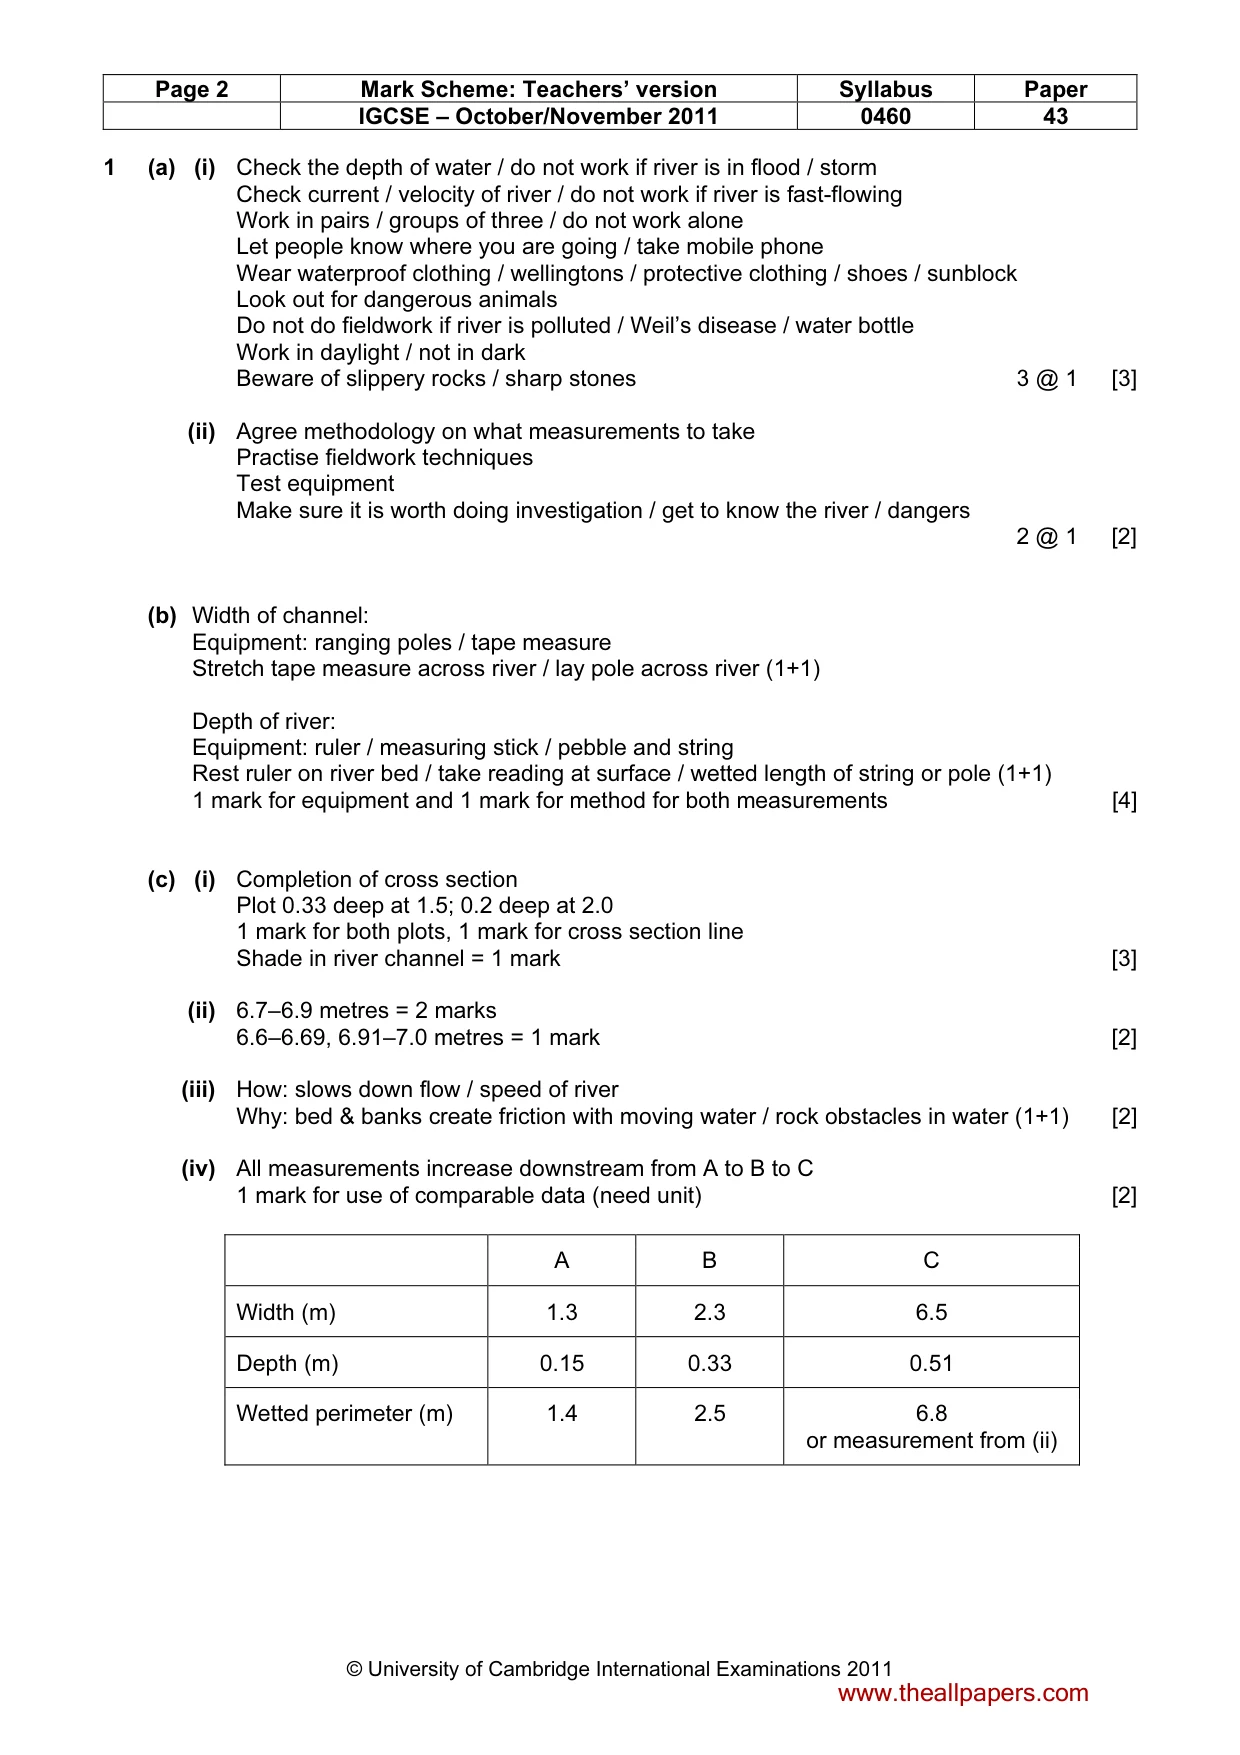
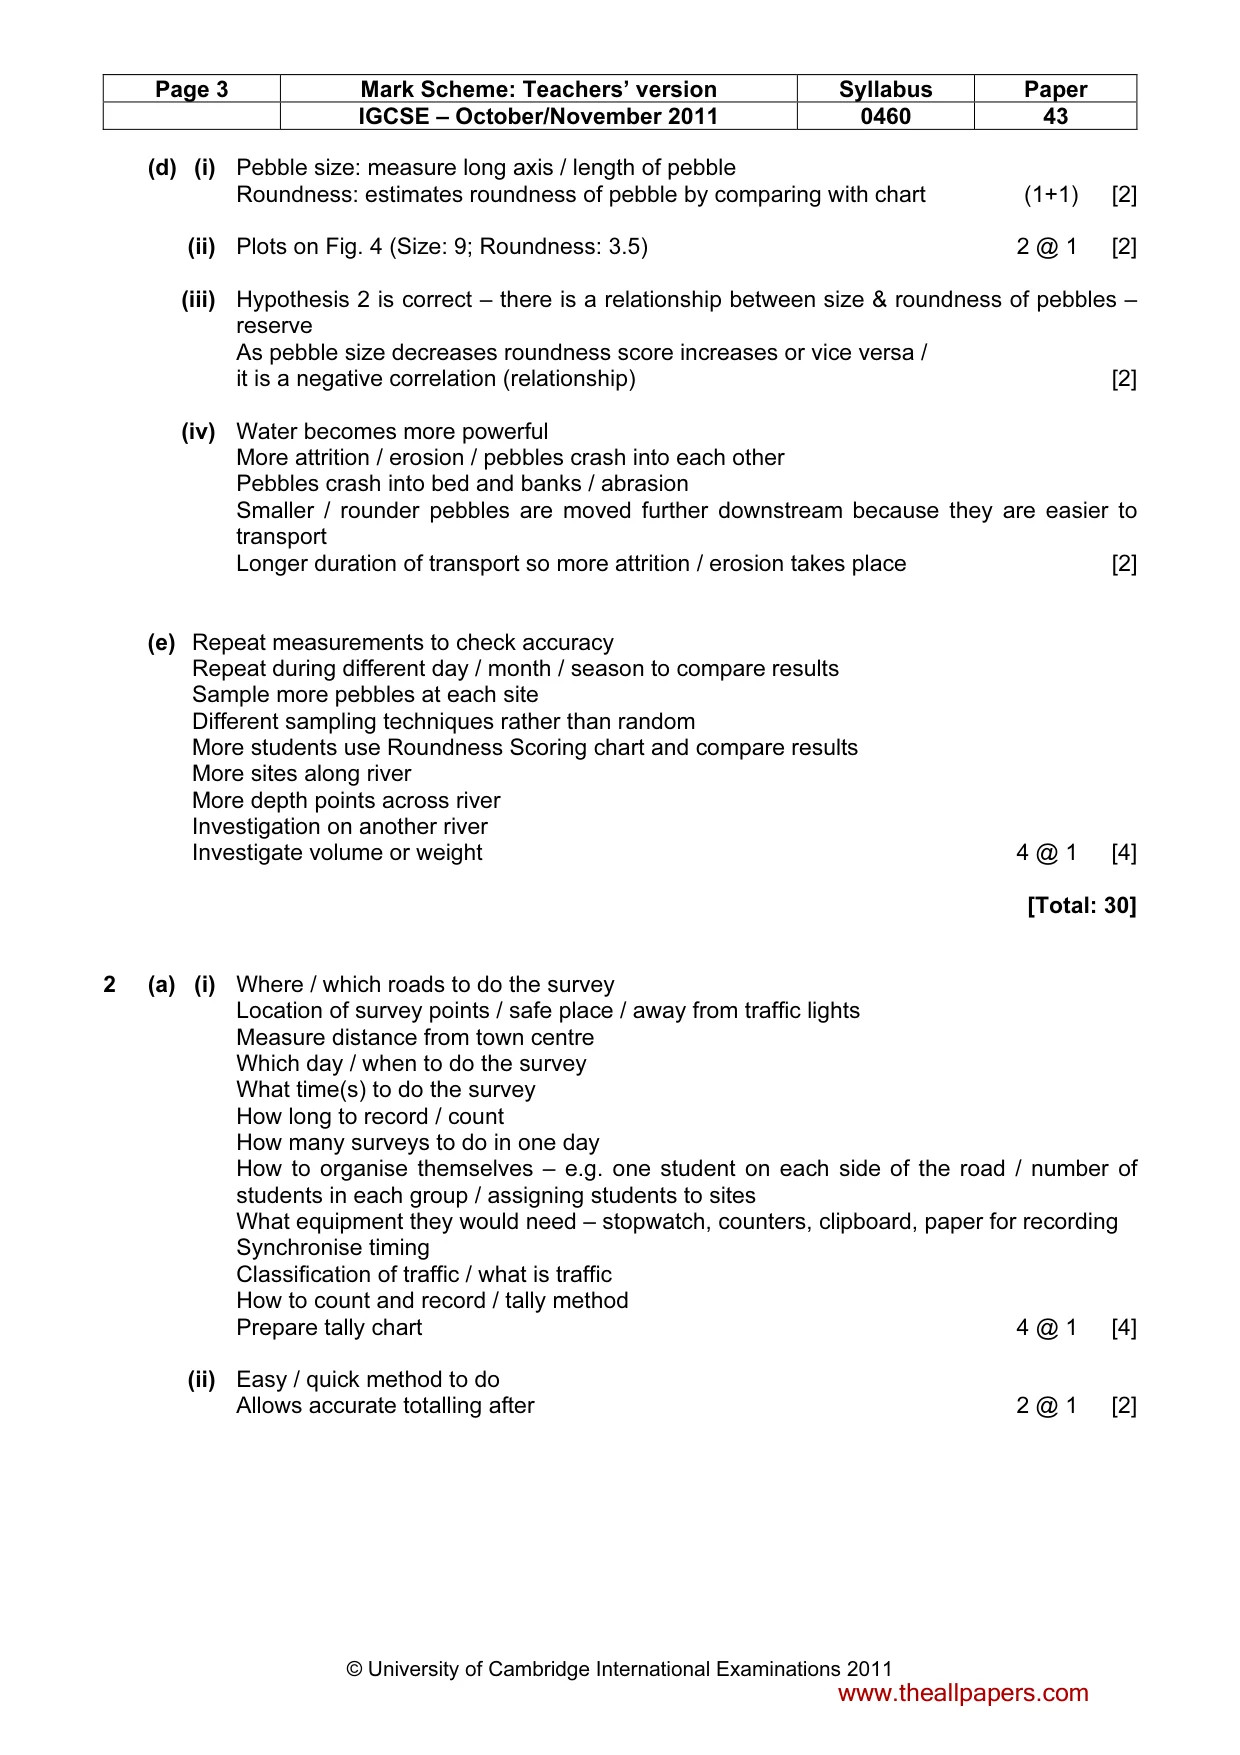
Page 2 Mark Scheme: Teachers’ version Syllabus Paper IGCSE – October/November 2011 0460 43 © University of Cambridge International Examinations 2011 1 (a) (i) Check the depth of water / do not work if river is in flood / storm Check current / velocity of river / do not work if river is fast-flowing Work in pairs / groups of three / do not work alone Let people know where you are going / take mobile phone Wear waterproof clothing / wellingtons / protective clothing / shoes / sunblock Look out for dangerous animals Do not do fieldwork if river is polluted / Weil’s disease / water bottle Work in daylight / not in dark Beware of slippery rocks / sharp stones 3 @ 1 [3] (ii) Agree methodology on what measurements to take Practise fieldwork techniques Test equipment Make sure it is worth doing investigation / get to know the river / dangers 2 @ 1 [2] (b) Width of channel: Equipment: ranging poles / tape measure Stretch tape measure across river / lay pole across river (1+1) Depth of river: Equipment: ruler / measuring stick / pebble and string Rest ruler on river bed / take reading at surface / wetted length of string or pole (1+1) 1 mark for equipment and 1 mark for method for both measurements [4] (c) (i) Completion of cross section Plot 0.33 deep at 1.5; 0.2 deep at 2.0 1 mark for both plots, 1 mark for cross section line Shade in river channel = 1 mark [3] (ii) 6.7–6.9 metres = 2 marks 6.6–6.69, 6.91–7.0 metres = 1 mark [2] (iii) How: slows down flow / speed of river Why: bed & banks create friction with moving water / rock obstacles in water (1+1) [2] (iv) All measurements increase downstream from A to B to C 1 mark for use of comparable data (need unit) [2] A B C Width (m) 1.3 2.3 6.5 Depth (m) 0.15 0.33 0.51 Wetted perimeter (m) 1.4 2.5 6.8 or measurement from (ii) www.theallpapers.com
Mark scheme, page 3
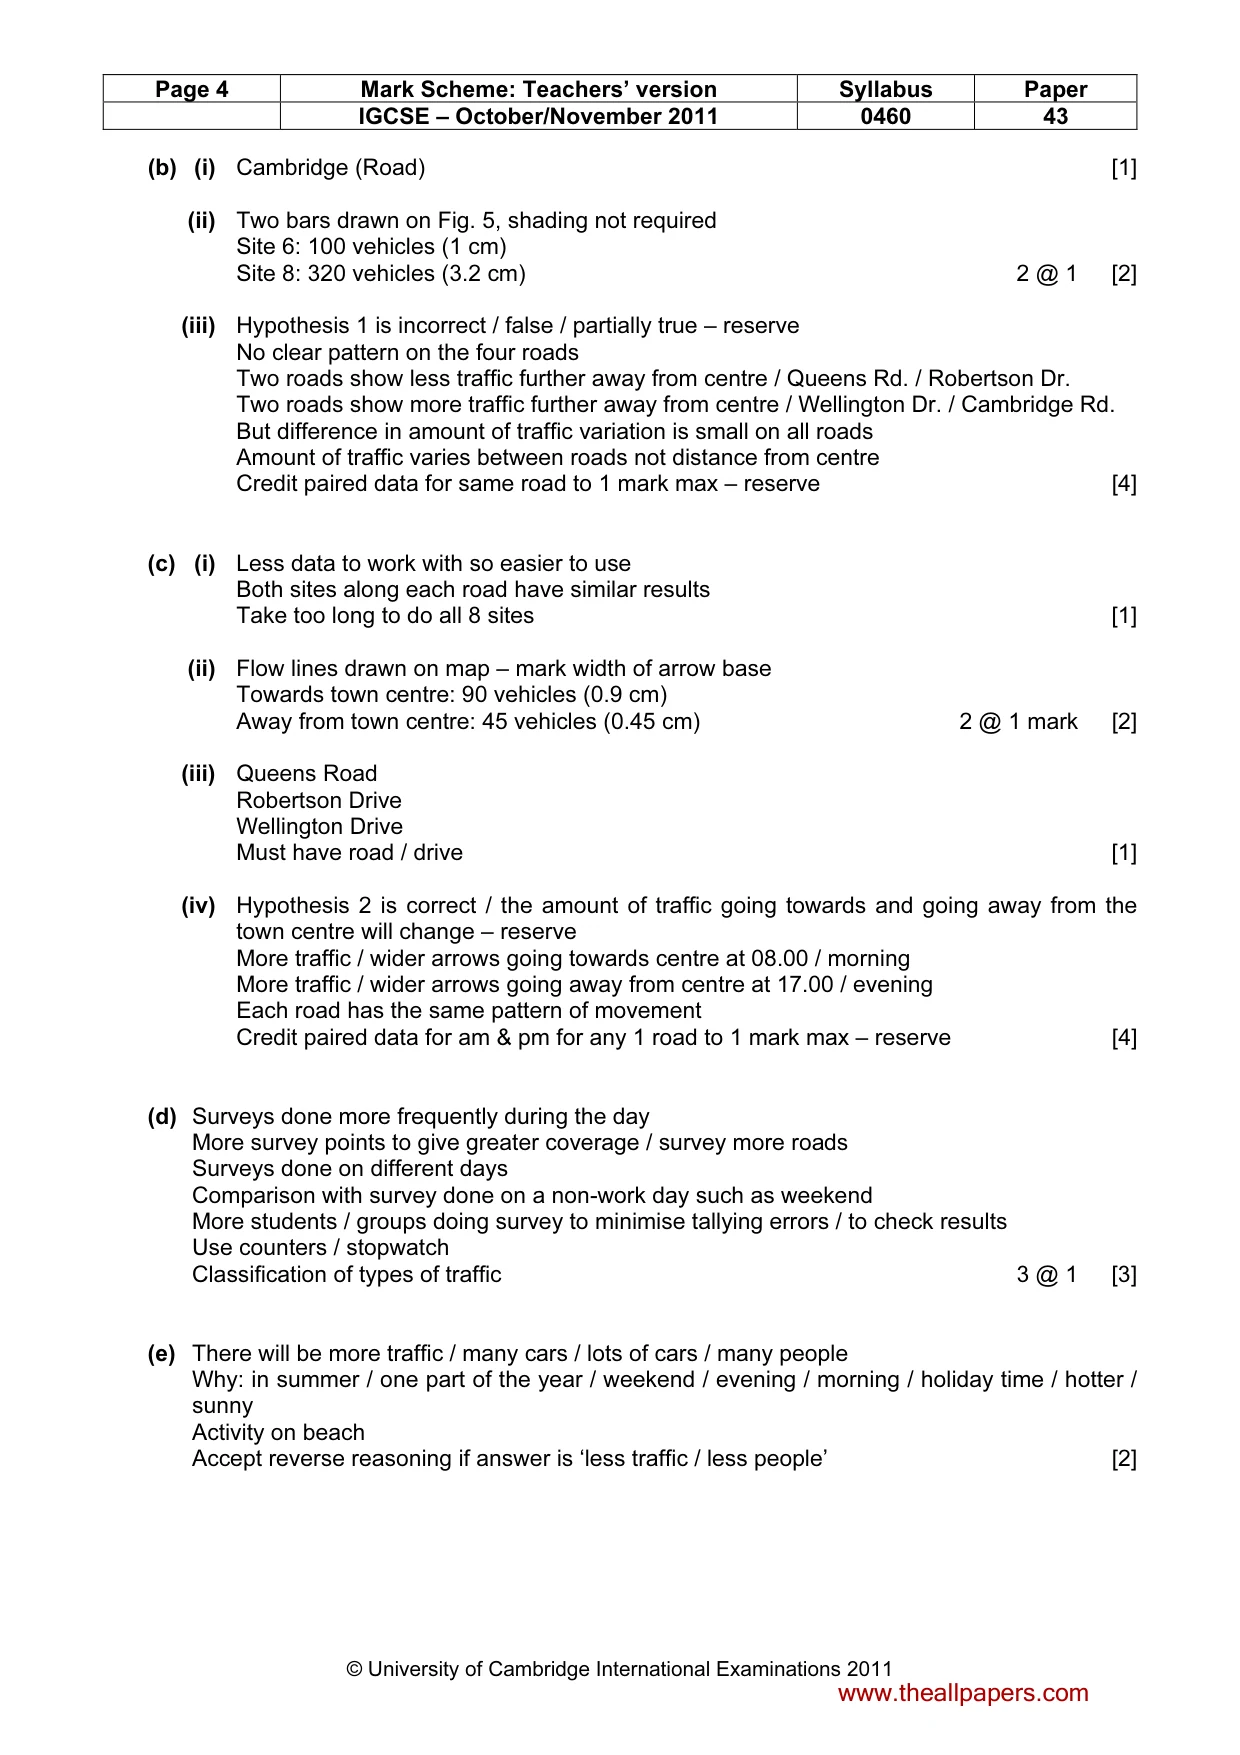
Page 3 Mark Scheme: Teachers’ version Syllabus Paper IGCSE – October/November 2011 0460 43 © University of Cambridge International Examinations 2011 (d) (i) Pebble size: measure long axis / length of pebble Roundness: estimates roundness of pebble by comparing with chart (1+1) [2] (ii) Plots on Fig. 4 (Size: 9; Roundness: 3.5) 2 @ 1 [2] (iii) Hypothesis 2 is correct – there is a relationship between size & roundness of pebbles – reserve As pebble size decreases roundness score increases or vice versa / it is a negative correlation (relationship) [2] (iv) Water becomes more powerful More attrition / erosion / pebbles crash into each other Pebbles crash into bed and banks / abrasion Smaller / rounder pebbles are moved further downstream because they are easier to transport Longer duration of transport so more attrition / erosion takes place [2] (e) Repeat measurements to check accuracy Repeat during different day / month / season to compare results Sample more pebbles at each site Different sampling techniques rather than random More students use Roundness Scoring chart and compare results More sites along river More depth points across river Investigation on another river Investigate volume or weight 4 @ 1 [4] [Total: 30] 2 (a) (i) Where / which roads to do the survey Location of survey points / safe place / away from traffic lights Measure distance from town centre Which day / when to do the survey What time(s) to do the survey How long to record / count How many surveys to do in one day How to organise themselves – e.g. one student on each side of the road / number of students in each group / assigning students to sites What equipment they would need – stopwatch, counters, clipboard, paper for recording Synchronise timing Classification of traffic / what is traffic How to count and record / tally method Prepare tally chart 4 @ 1 [4] (ii) Easy / quick method to do Allows accurate totalling after 2 @ 1 [2] www.theallpapers.com
Mark scheme, page 4
Page 4 Mark Scheme: Teachers’ version Syllabus Paper IGCSE – October/November 2011 0460 43 © University of Cambridge International Examinations 2011 (b) (i) Cambridge (Road) [1] (ii) Two bars drawn on Fig. 5, shading not required Site 6: 100 vehicles (1 cm) Site 8: 320 vehicles (3.2 cm) 2 @ 1 [2] (iii) Hypothesis 1 is incorrect / false / partially true – reserve No clear pattern on the four roads Two roads show less traffic further away from centre / Queens Rd. / Robertson Dr. Two roads show more traffic further away from centre / Wellington Dr. / Cambridge Rd. But difference in amount of traffic variation is small on all roads Amount of traffic varies between roads not distance from centre Credit paired data for same road to 1 mark max – reserve [4] (c) (i) Less data to work with so easier to use Both sites along each road have similar results Take too long to do all 8 sites [1] (ii) Flow lines drawn on map – mark width of arrow base Towards town centre: 90 vehicles (0.9 cm) Away from town centre: 45 vehicles (0.45 cm) 2 @ 1 mark [2] (iii) Queens Road Robertson Drive Wellington Drive Must have road / drive [1] (iv) Hypothesis 2 is correct / the amount of traffic going towards and going away from the town centre will change – reserve More traffic / wider arrows going towards centre at 08.00 / morning More traffic / wider arrows going away from centre at 17.00 / evening Each road has the same pattern of movement Credit paired data for am & pm for any 1 road to 1 mark max – reserve [4] (d) Surveys done more frequently during the day More survey points to give greater coverage / survey more roads Surveys done on different days Comparison with survey done on a non-work day such as weekend More students / groups doing survey to minimise tallying errors / to check results Use counters / stopwatch Classification of types of traffic 3 @ 1 [3] (e) There will be more traffic / many cars / lots of cars / many people Why: in summer / one part of the year / weekend / evening / morning / holiday time / hotter / sunny Activity on beach Accept reverse reasoning if answer is ‘less traffic / less people’ [2] www.theallpapers.com
Mark scheme, page 5
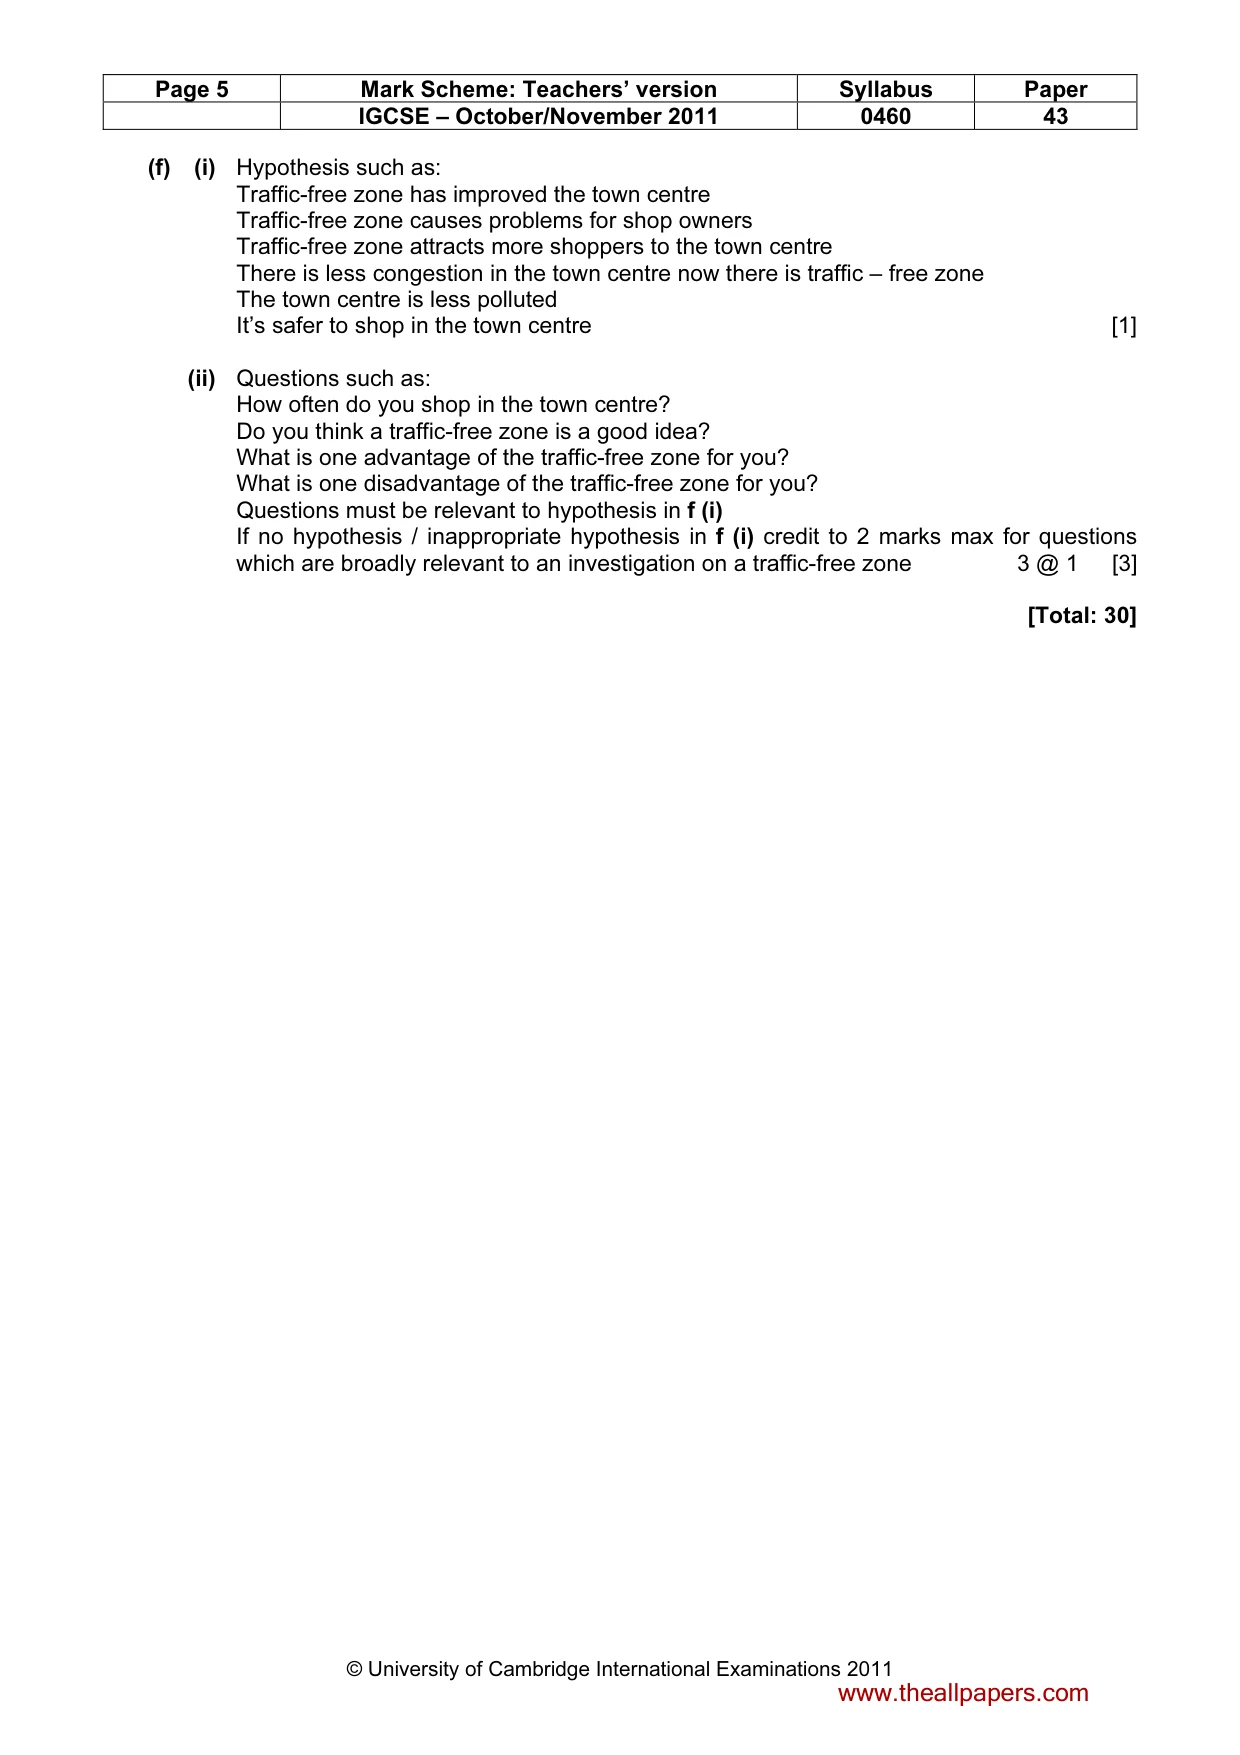
Page 5 Mark Scheme: Teachers’ version Syllabus Paper IGCSE – October/November 2011 0460 43 © University of Cambridge International Examinations 2011 (f) (i) Hypothesis such as: Traffic-free zone has improved the town centre Traffic-free zone causes problems for shop owners Traffic-free zone attracts more shoppers to the town centre There is less congestion in the town centre now there is traffic – free zone The town centre is less polluted It’s safer to shop in the town centre [1] (ii) Questions such as: How often do you shop in the town centre? Do you think a traffic-free zone is a good idea? What is one advantage of the traffic-free zone for you? What is one disadvantage of the traffic-free zone for you? Questions must be relevant to hypothesis in f (i) If no hypothesis / inappropriate hypothesis in f (i) credit to 2 marks max for questions which are broadly relevant to an investigation on a traffic-free zone 3 @ 1 [3] [Total: 30] www.theallpapers.com
What you needed in this session
Cambridge’s own grade thresholds for 2011 Oct/Nov, Paper 4 · Variant 3. A higher threshold means an easier paper — the bar moves with how the cohort did.