Cambridge IGCSE Geography 0460 — 2011 Oct/Nov Paper 4 · Variant 2
0460/42/O/N/11 · 60 marks · ≈68 min
The question paper and its mark scheme, free to read here and free to download. This is Cambridge’s own paper, exactly as it was sat.
Question paper16 pages




Mark scheme7 pages
Answers below. Sit the paper first if you are practising.
Paper as text
Question paper, page 1
This document consists of 12 printed pages, 4 blank pages, and 1 Insert. DC (LEO/SW) 33709/4 © UCLES 2011 [Turn over UNIVERSITY OF CAMBRIDGE INTERNATIONAL EXAMINATIONS International General Certificate of Secondary Education READ THESE INSTRUCTIONS FIRST Write your Centre number, candidate number and name on all the work you hand in. Write in dark blue or black pen. You may use a soft pencil for any diagrams, graphs or rough working. Do not use staples, paper clips, highlighters, glue or correction fluid. DO NOT WRITE ON ANY BARCODES. Answer all questions. The Insert contains Figs 1, 3 and 4 for Question 1 and Table 3 for Question 2. The Insert is not required by the Examiner. Sketch maps and diagrams should be drawn whenever they serve to illustrate an answer. At the end of the examination, fasten all your work securely together. The number of marks is given in brackets [ ] at the end of each question or part question. GEOGRAPHY 0460/42 Paper 4 Alternative to Coursework October/November 2011 1 hour 30 minutes Candidates answer on the Question Paper. Additional Materials: Ruler * 1 4 2 6 5 6 2 8 3 9 * www.theallpapers.com
Question paper, page 2
2 0460/42/O/N/11 © UCLES 2011 BLANK PAGE www.theallpapers.com
Question paper, page 3
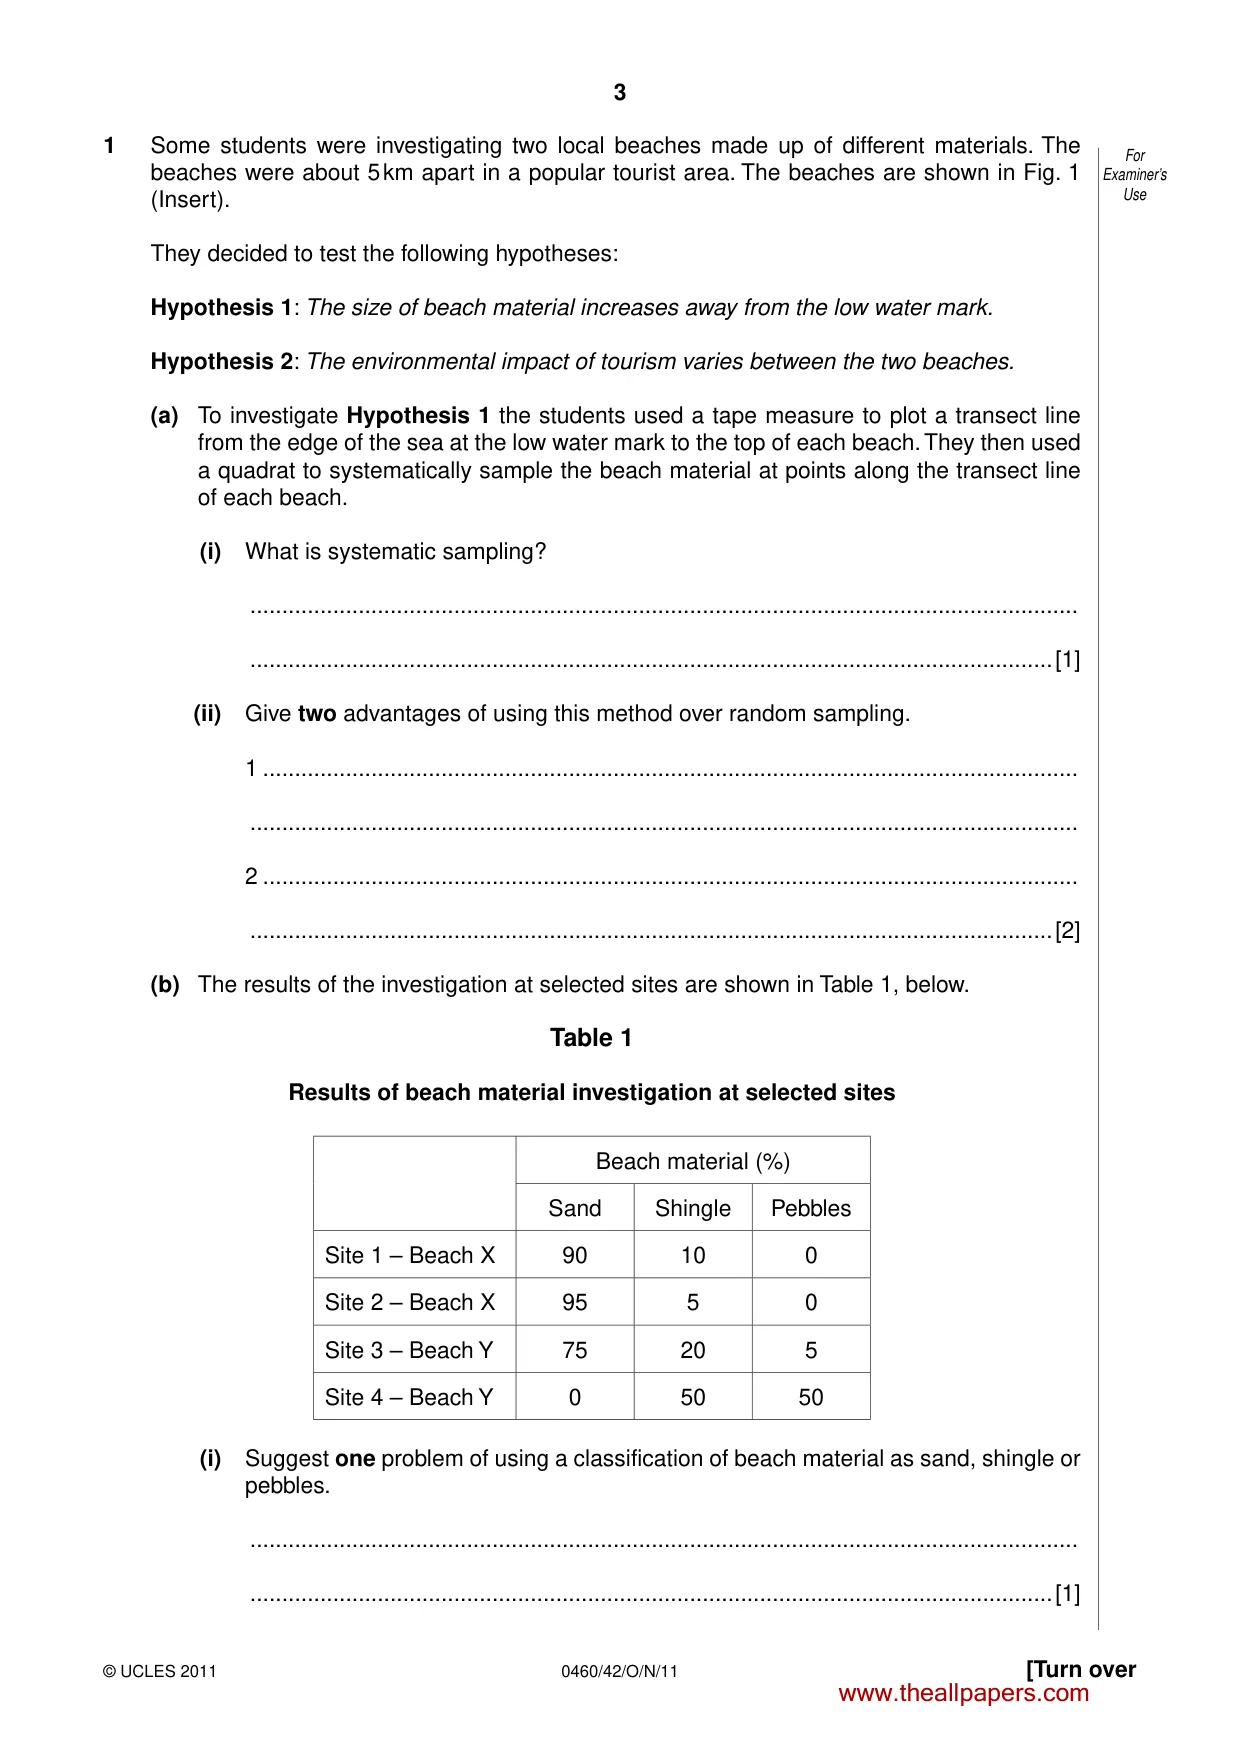
3 0460/42/O/N/11 © UCLES 2011 [Turn over For Examiner’s Use 1 Some students were investigating two local beaches made up of different materials. The beaches were about 5 km apart in a popular tourist area. The beaches are shown in Fig. 1 (Insert). They decided to test the following hypotheses: Hypothesis 1: The size of beach material increases away from the low water mark. Hypothesis 2: The environmental impact of tourism varies between the two beaches. (a) To investigate Hypothesis 1 the students used a tape measure to plot a transect line from the edge of the sea at the low water mark to the top of each beach. They then used a quadrat to systematically sample the beach material at points along the transect line of each beach. (i) What is systematic sampling? … …[1] (ii) Give two advantages of using this method over random sampling. 1 … … 2 … …[2] (b) The results of the investigation at selected sites are shown in Table 1, below. Table 1 Results of beach material investigation at selected sites Beach material (%) Sand Shingle Pebbles Site 1 – Beach X 90 10 0 Site 2 – Beach X 95 5 0 Site 3 – Beach Y 75 20 5 Site 4 – Beach Y 0 50 50 (i) Suggest one problem of using a classification of beach material as sand, shingle or pebbles. … …[1] www.theallpapers.com
Question paper, page 4
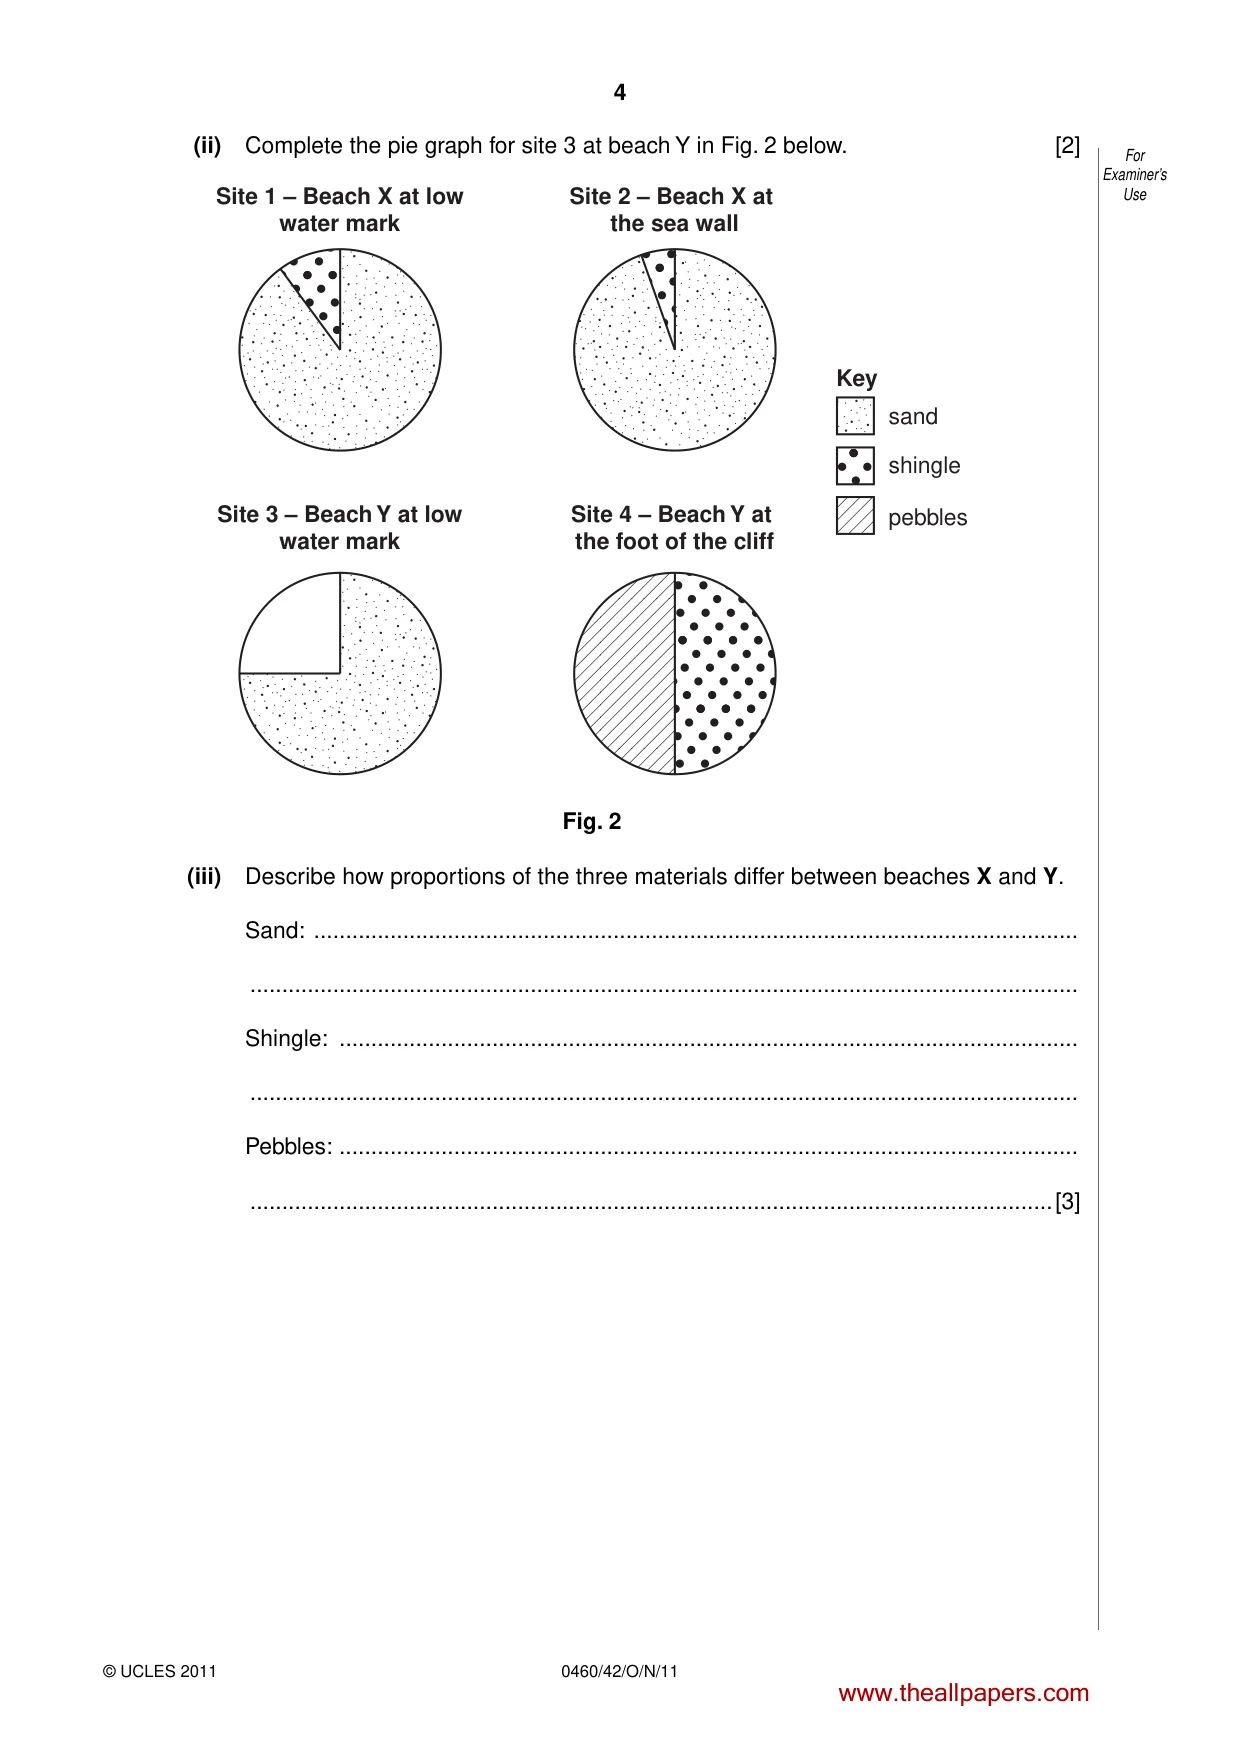
4 0460/42/O/N/11 © UCLES 2011 For Examiner’s Use (ii) Complete the pie graph for site 3 at beach Y in Fig. 2 below. [2] Site 1 – Beach X at low water mark Site 2 – Beach X at the sea wall Site 3 – Beach Y at low water mark Site 4 – Beach Y at the foot of the cliff sand Key shingle pebbles Fig. 2 (iii) Describe how proportions of the three materials differ between beaches X and Y. Sand: … … Shingle: … … Pebbles: … …[3] www.theallpapers.com
Question paper, page 5
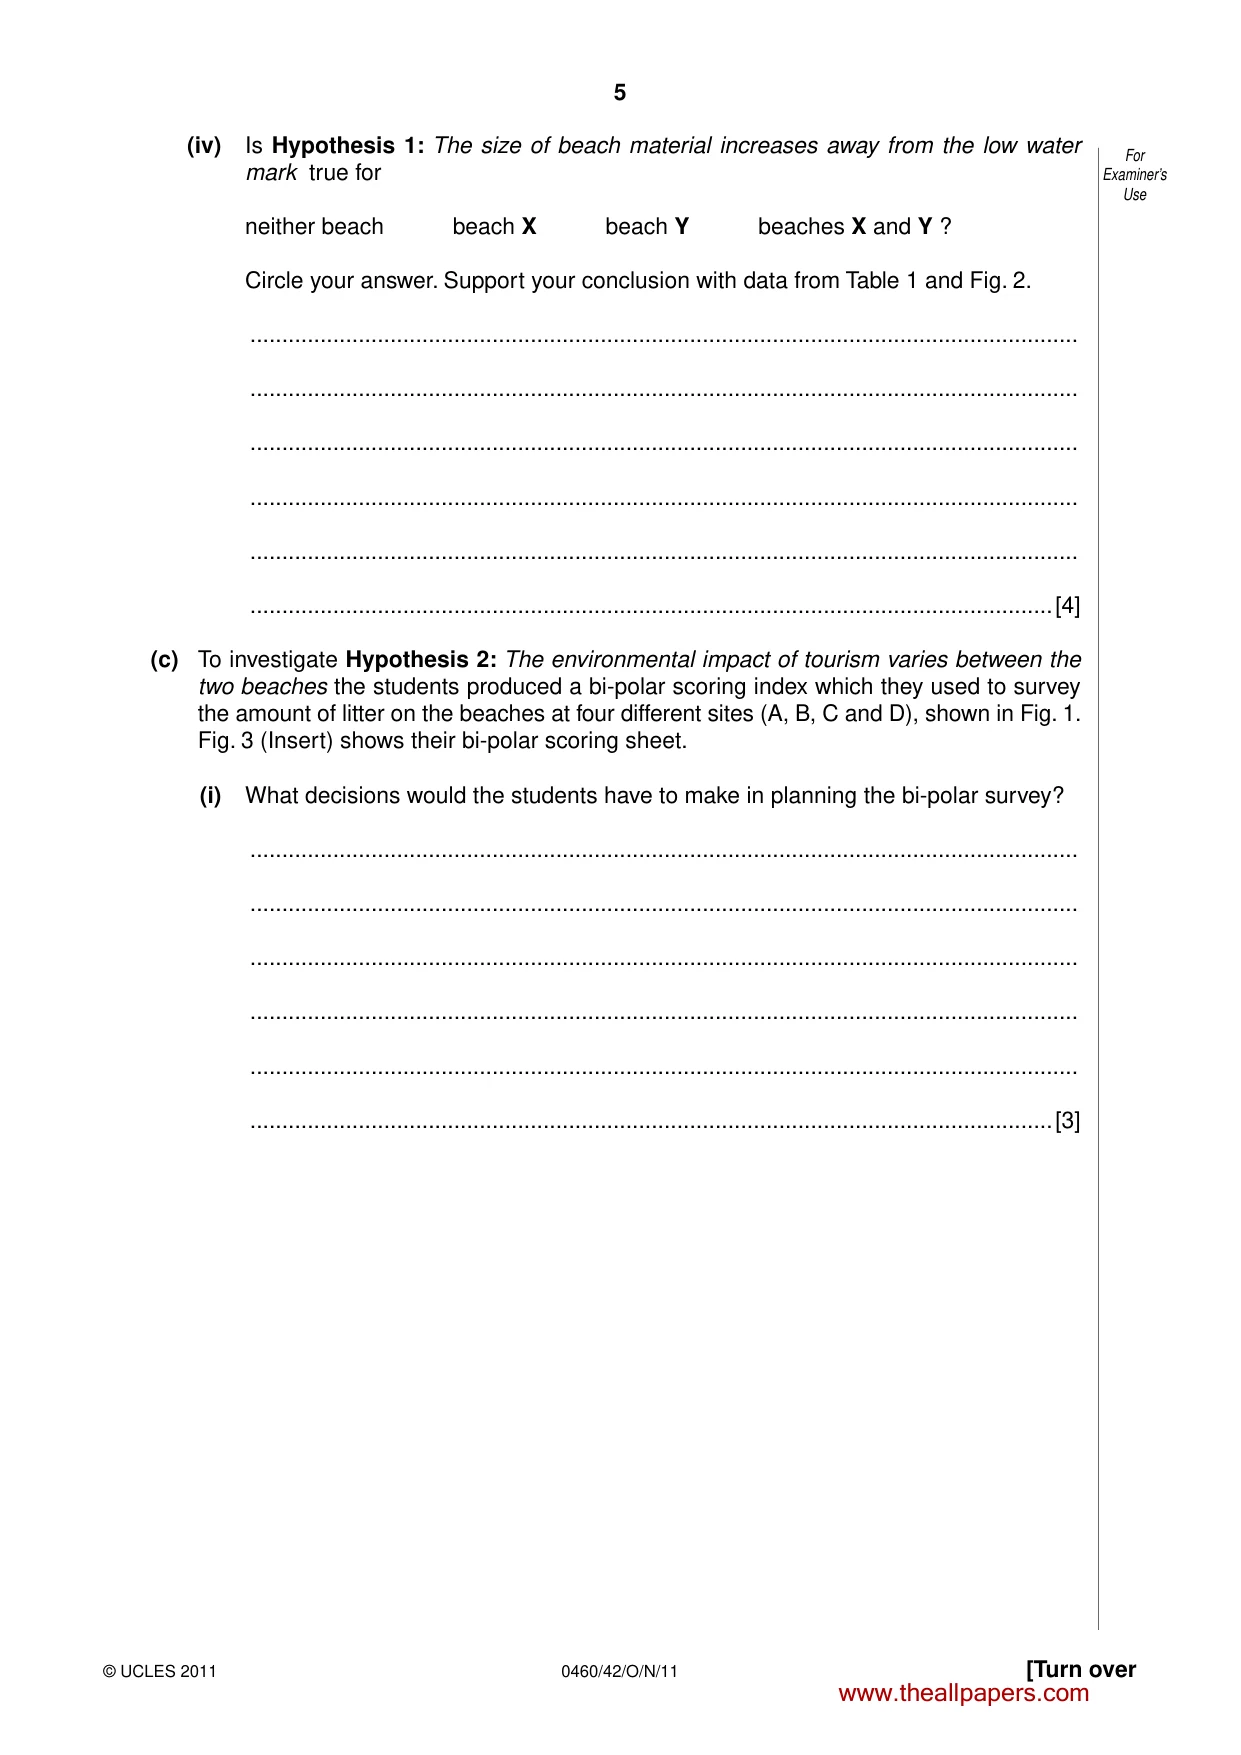
5 0460/42/O/N/11 © UCLES 2011 [Turn over For Examiner’s Use (iv) Is Hypothesis 1: The size of beach material increases away from the low water mark true for neither beach beach X beach Y beaches X and Y ? Circle your answer. Support your conclusion with data from Table 1 and Fig. 2. … … … … … …[4] (c) To investigate Hypothesis 2: The environmental impact of tourism varies between the two beaches the students produced a bi-polar scoring index which they used to survey the amount of litter on the beaches at four different sites (A, B, C and D), shown in Fig. 1. Fig. 3 (Insert) shows their bi-polar scoring sheet. (i) What decisions would the students have to make in planning the bi-polar survey? … … … … … …[3] www.theallpapers.com
Question paper, page 6
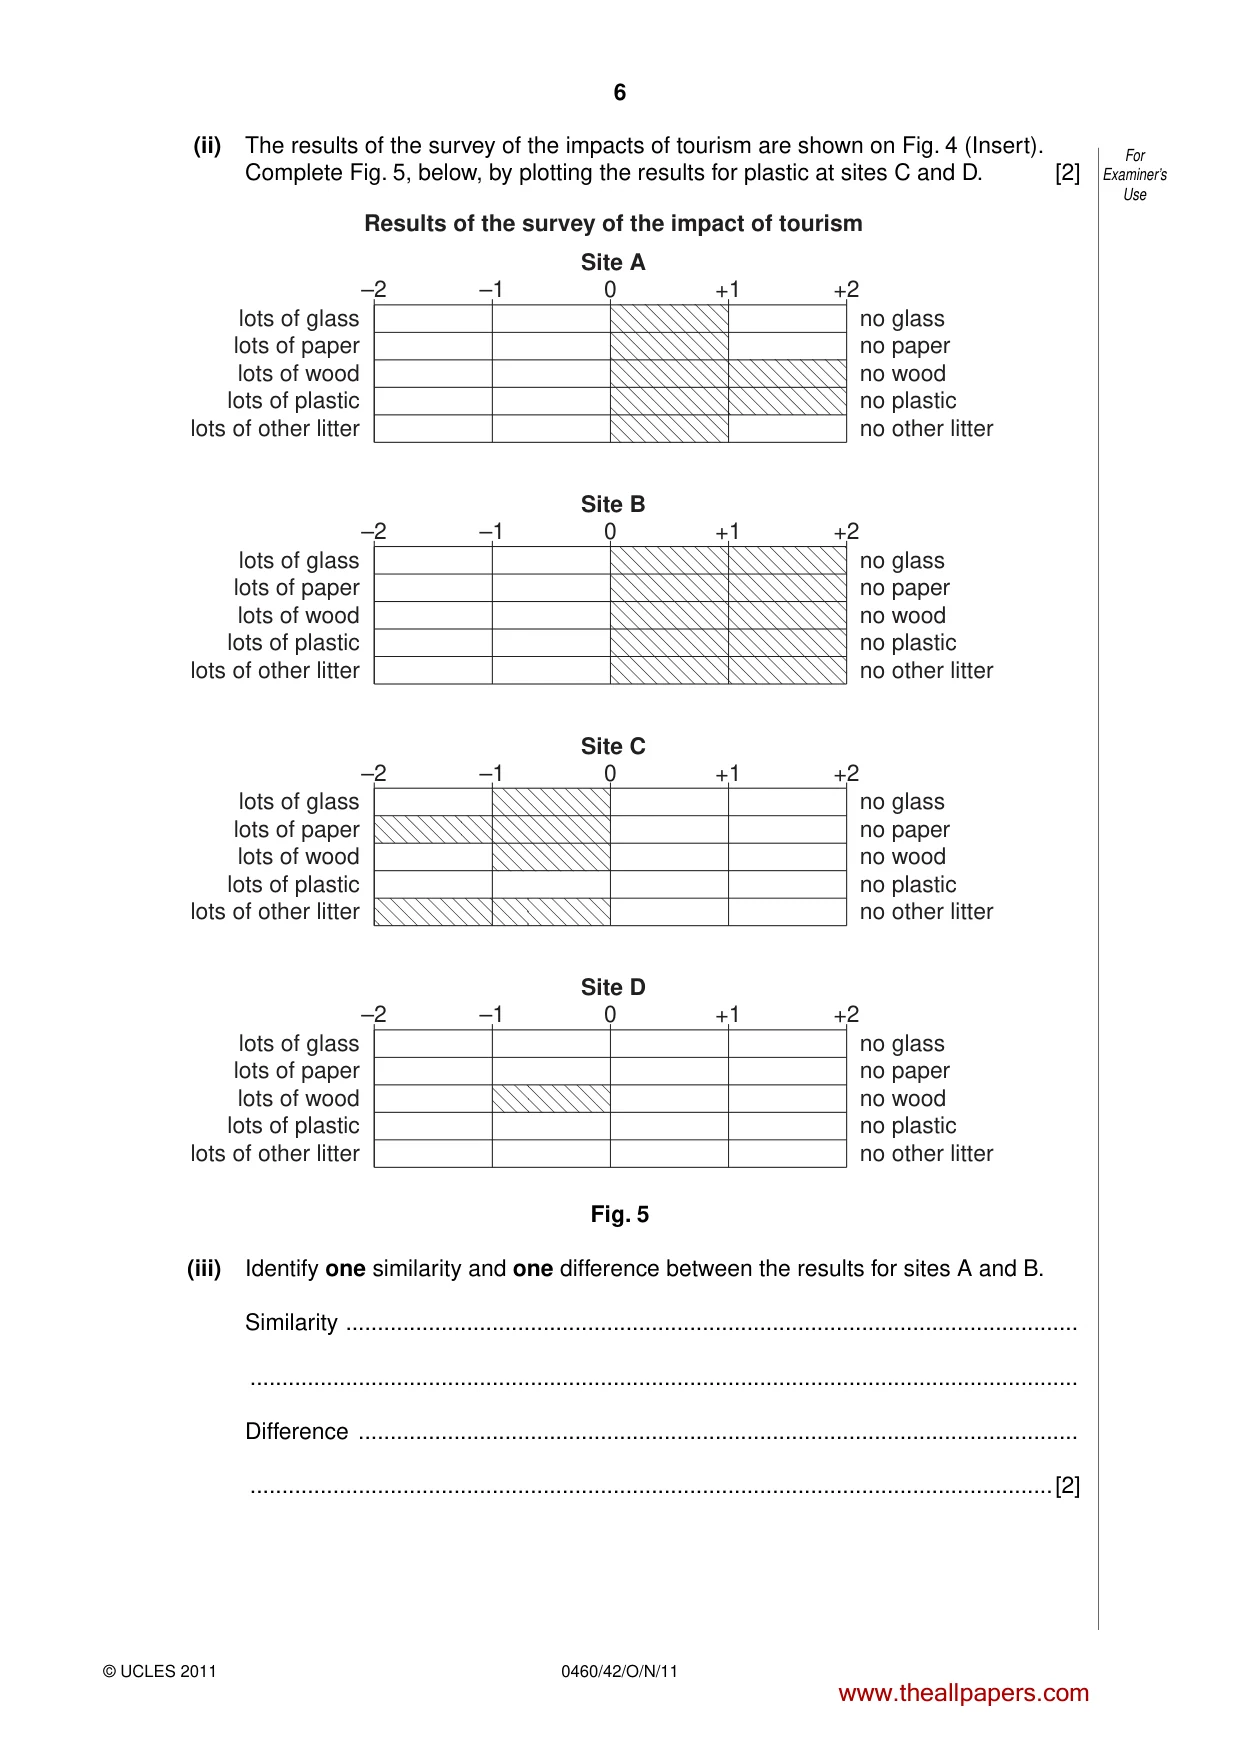
6 0460/42/O/N/11 © UCLES 2011 For Examiner’s Use (ii) The results of the survey of the impacts of tourism are shown on Fig. 4 (Insert). Complete Fig. 5, below, by plotting the results for plastic at sites C and D. [2] lots of glass lots of paper lots of wood lots of plastic lots of other litter no glass no paper no wood no plastic no other litter –2 Site A Results of the survey of the impact of tourism –1 0 +1 +2 lots of glass lots of paper lots of wood lots of plastic lots of other litter no glass no paper no wood no plastic no other litter –2 Site B –1 0 +1 +2 lots of glass lots of paper lots of wood lots of plastic lots of other litter no glass no paper no wood no plastic no other litter –2 Site C –1 0 +1 +2 lots of glass lots of paper lots of wood lots of plastic lots of other litter no glass no paper no wood no plastic no other litter –2 Site D –1 0 +1 +2 Fig. 5 (iii) Identify one similarity and one difference between the results for sites A and B. Similarity … … Difference … …[2] www.theallpapers.com
Question paper, page 7
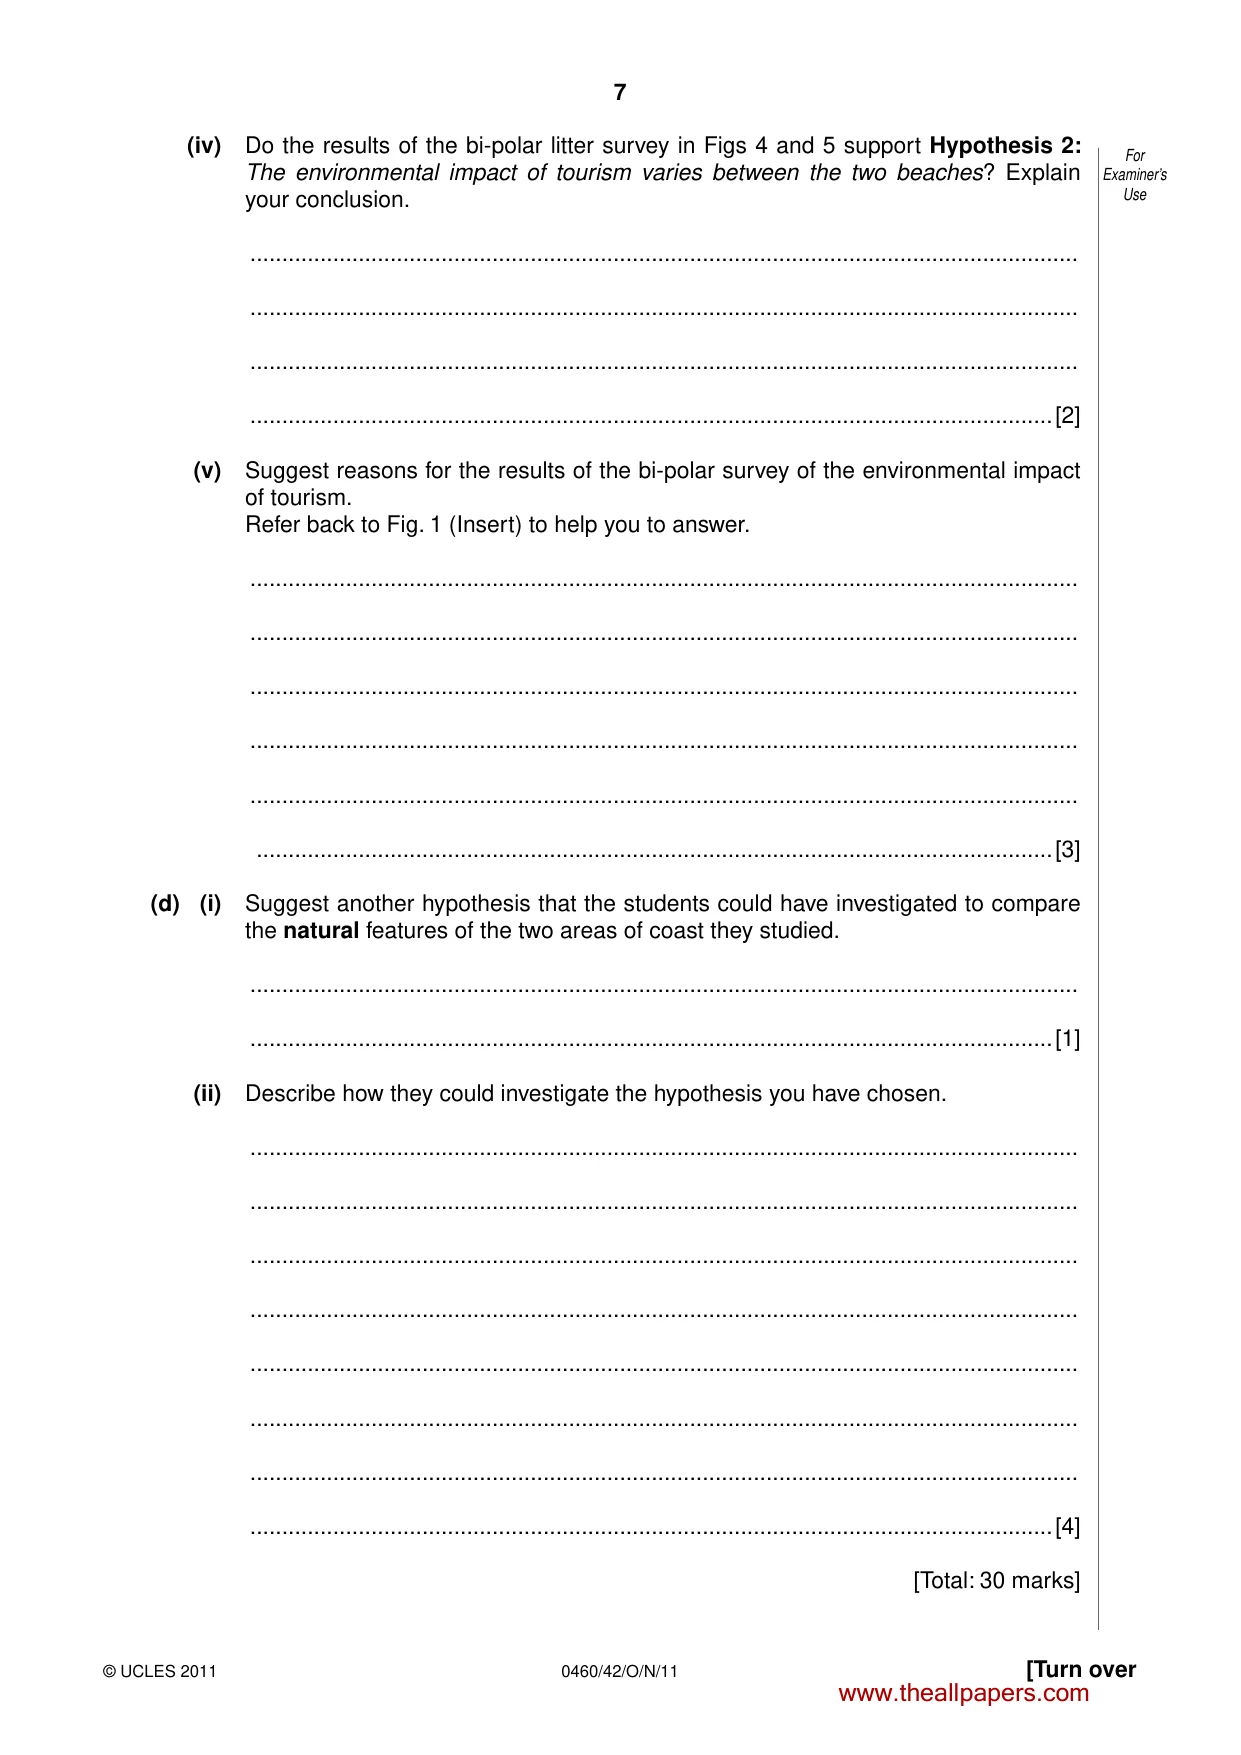
7 0460/42/O/N/11 © UCLES 2011 [Turn over For Examiner’s Use (iv) Do the results of the bi-polar litter survey in Figs 4 and 5 support Hypothesis 2: The environmental impact of tourism varies between the two beaches? Explain your conclusion. … … … …[2] (v) Suggest reasons for the results of the bi-polar survey of the environmental impact of tourism. Refer back to Fig. 1 (Insert) to help you to answer. … … … … … …[3] (d) (i) Suggest another hypothesis that the students could have investigated to compare the natural features of the two areas of coast they studied. … …[1] (ii) Describe how they could investigate the hypothesis you have chosen. … … … … … … … …[4] [Total: 30 marks] www.theallpapers.com
Question paper, page 8
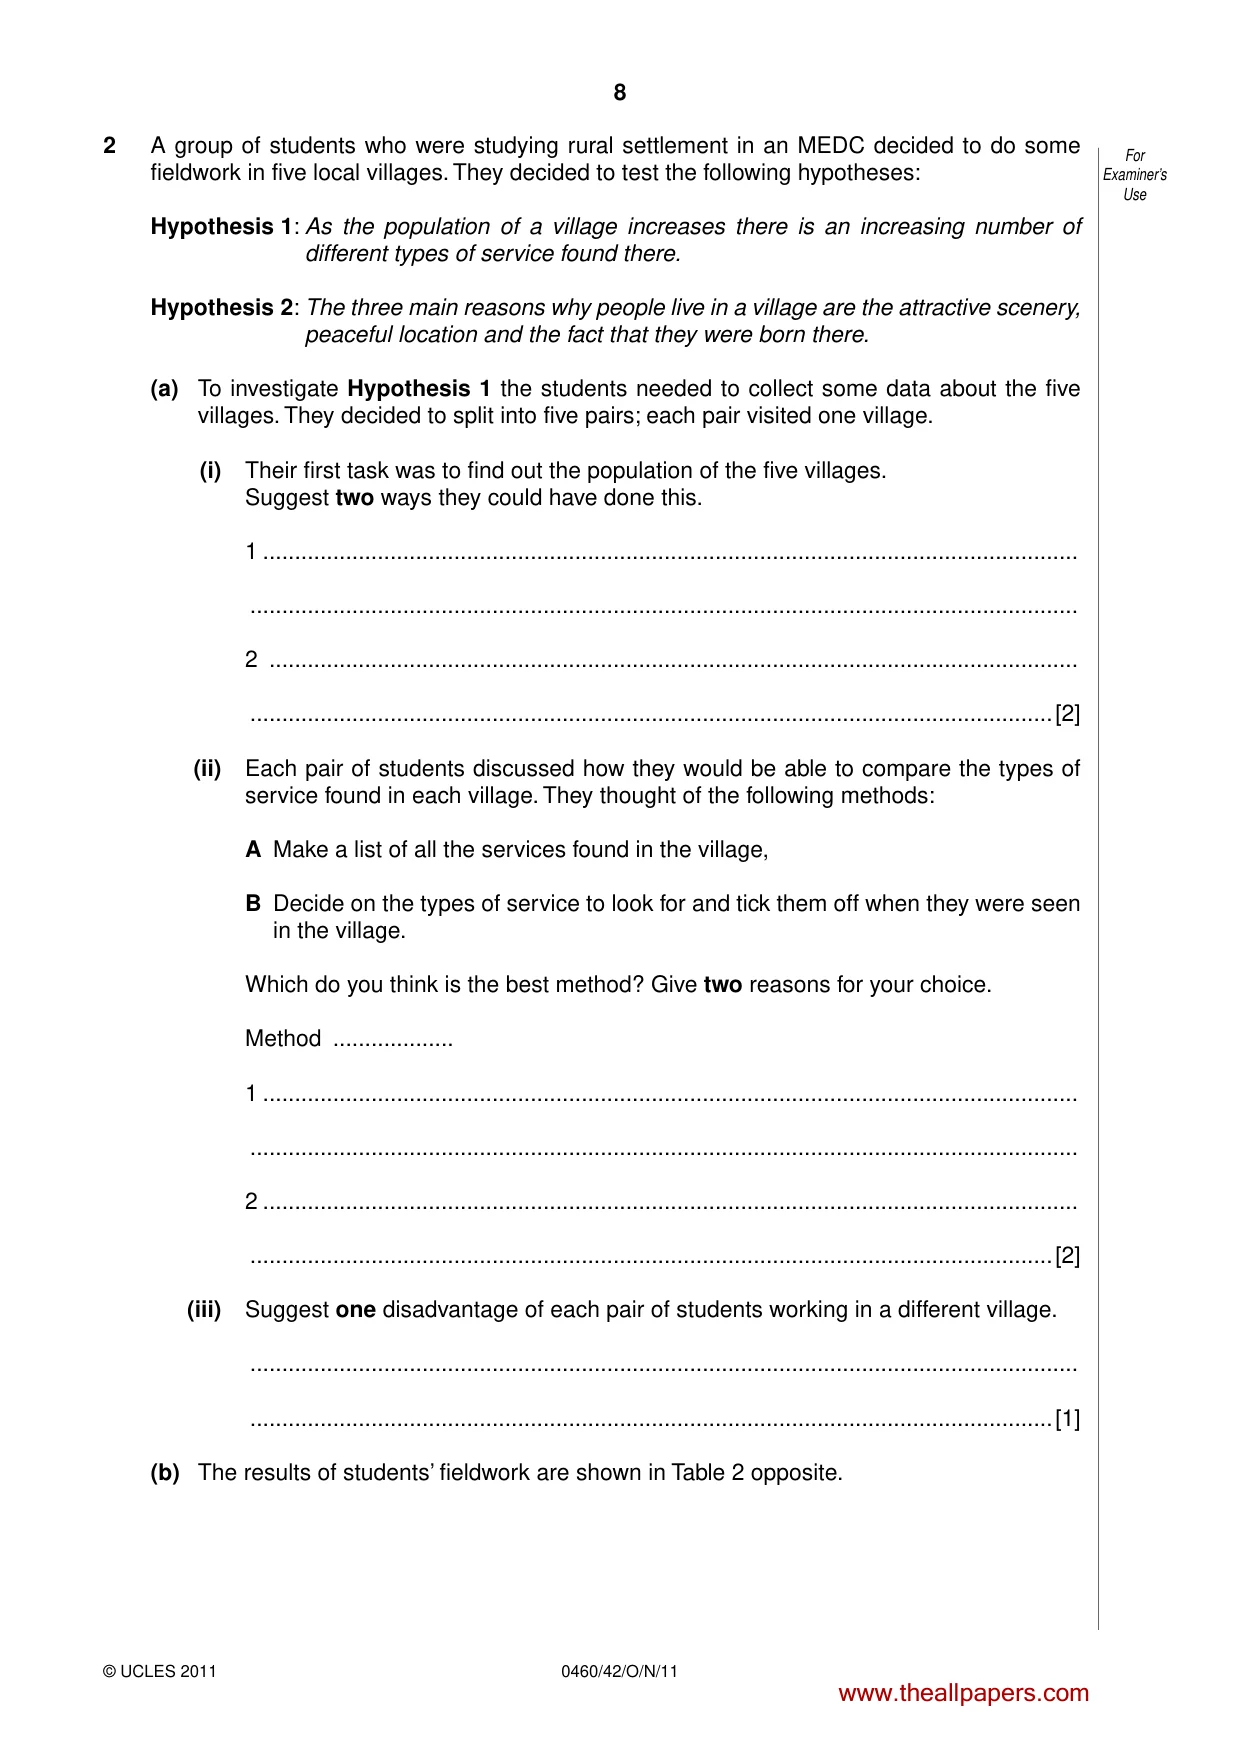
8 0460/42/O/N/11 © UCLES 2011 For Examiner’s Use 2 A group of students who were studying rural settlement in an MEDC decided to do some fieldwork in five local villages. They decided to test the following hypotheses: Hypothesis 1: As the population of a village increases there is an increasing number of different types of service found there. Hypothesis 2: The three main reasons why people live in a village are the attractive scenery, peaceful location and the fact that they were born there. (a) To investigate Hypothesis 1 the students needed to collect some data about the five villages. They decided to split into five pairs; each pair visited one village. (i) Their first task was to find out the population of the five villages. Suggest two ways they could have done this. 1 … … 2 … …[2] (ii) Each pair of students discussed how they would be able to compare the types of service found in each village. They thought of the following methods: A Make a list of all the services found in the village, B Decide on the types of service to look for and tick them off when they were seen in the village. Which do you think is the best method? Give two reasons for your choice. Method … 1 … … 2 … …[2] (iii) Suggest one disadvantage of each pair of students working in a different village. … …[1] (b) The results of students’ fieldwork are shown in Table 2 opposite. www.theallpapers.com
Question paper, page 9
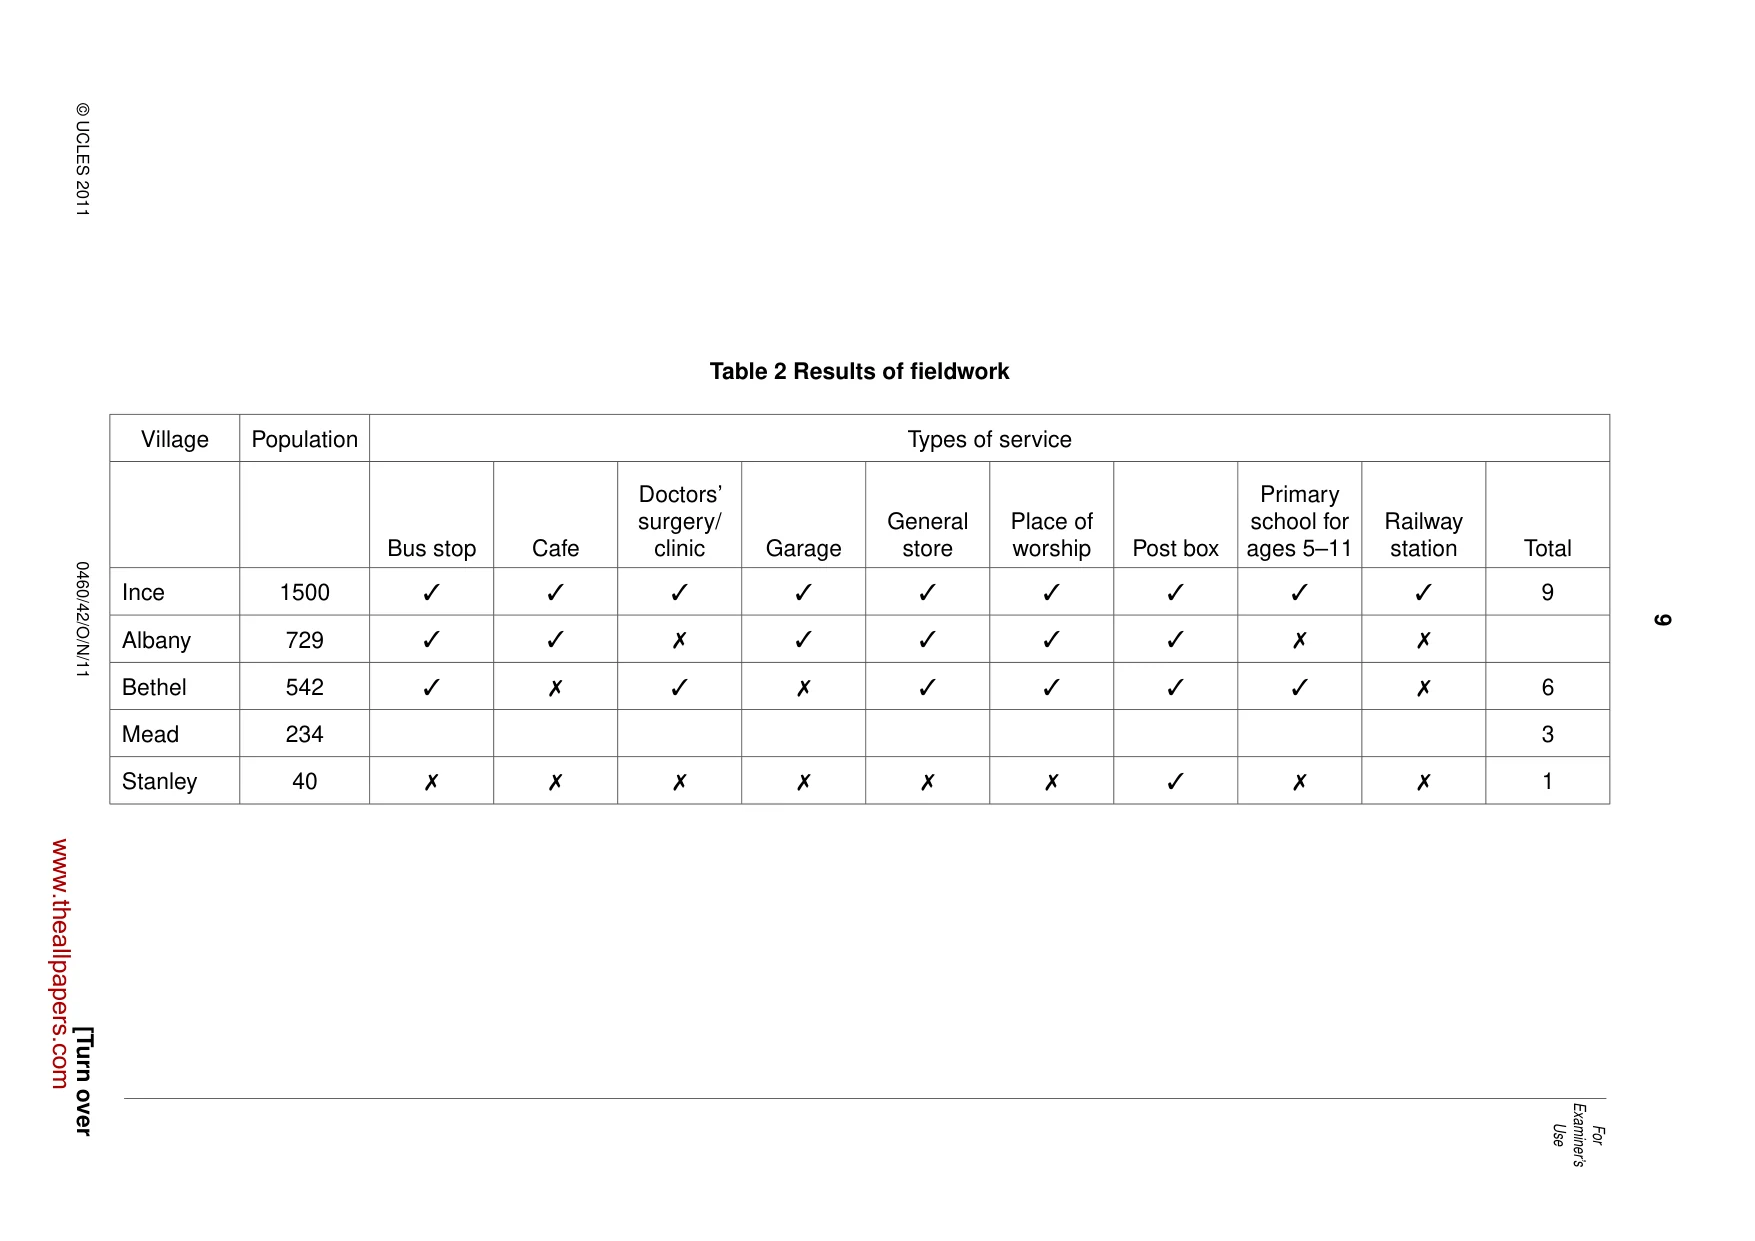
9 0460/42/O/N/11 © UCLES 2011 [Turn over For Examiner’s Use Table 2 Results of fieldwork Village Population Types of service Bus stop Cafe Doctors’ surgery/ clinic Garage General store Place of worship Post box Primary school for ages 5–11 Railway station Total Ince 1500 ✓ ✓ ✓ ✓ ✓ ✓ ✓ ✓ ✓ 9 Albany 729 ✓ ✓ ✗ ✓ ✓ ✓ ✓ ✗ ✗ Bethel 542 ✓ ✗ ✓ ✗ ✓ ✓ ✓ ✓ ✗ 6 Mead 234 3 Stanley 40 ✗ ✗ ✗ ✗ ✗ ✗ ✓ ✗ ✗ 1 www.theallpapers.com
Question paper, page 10
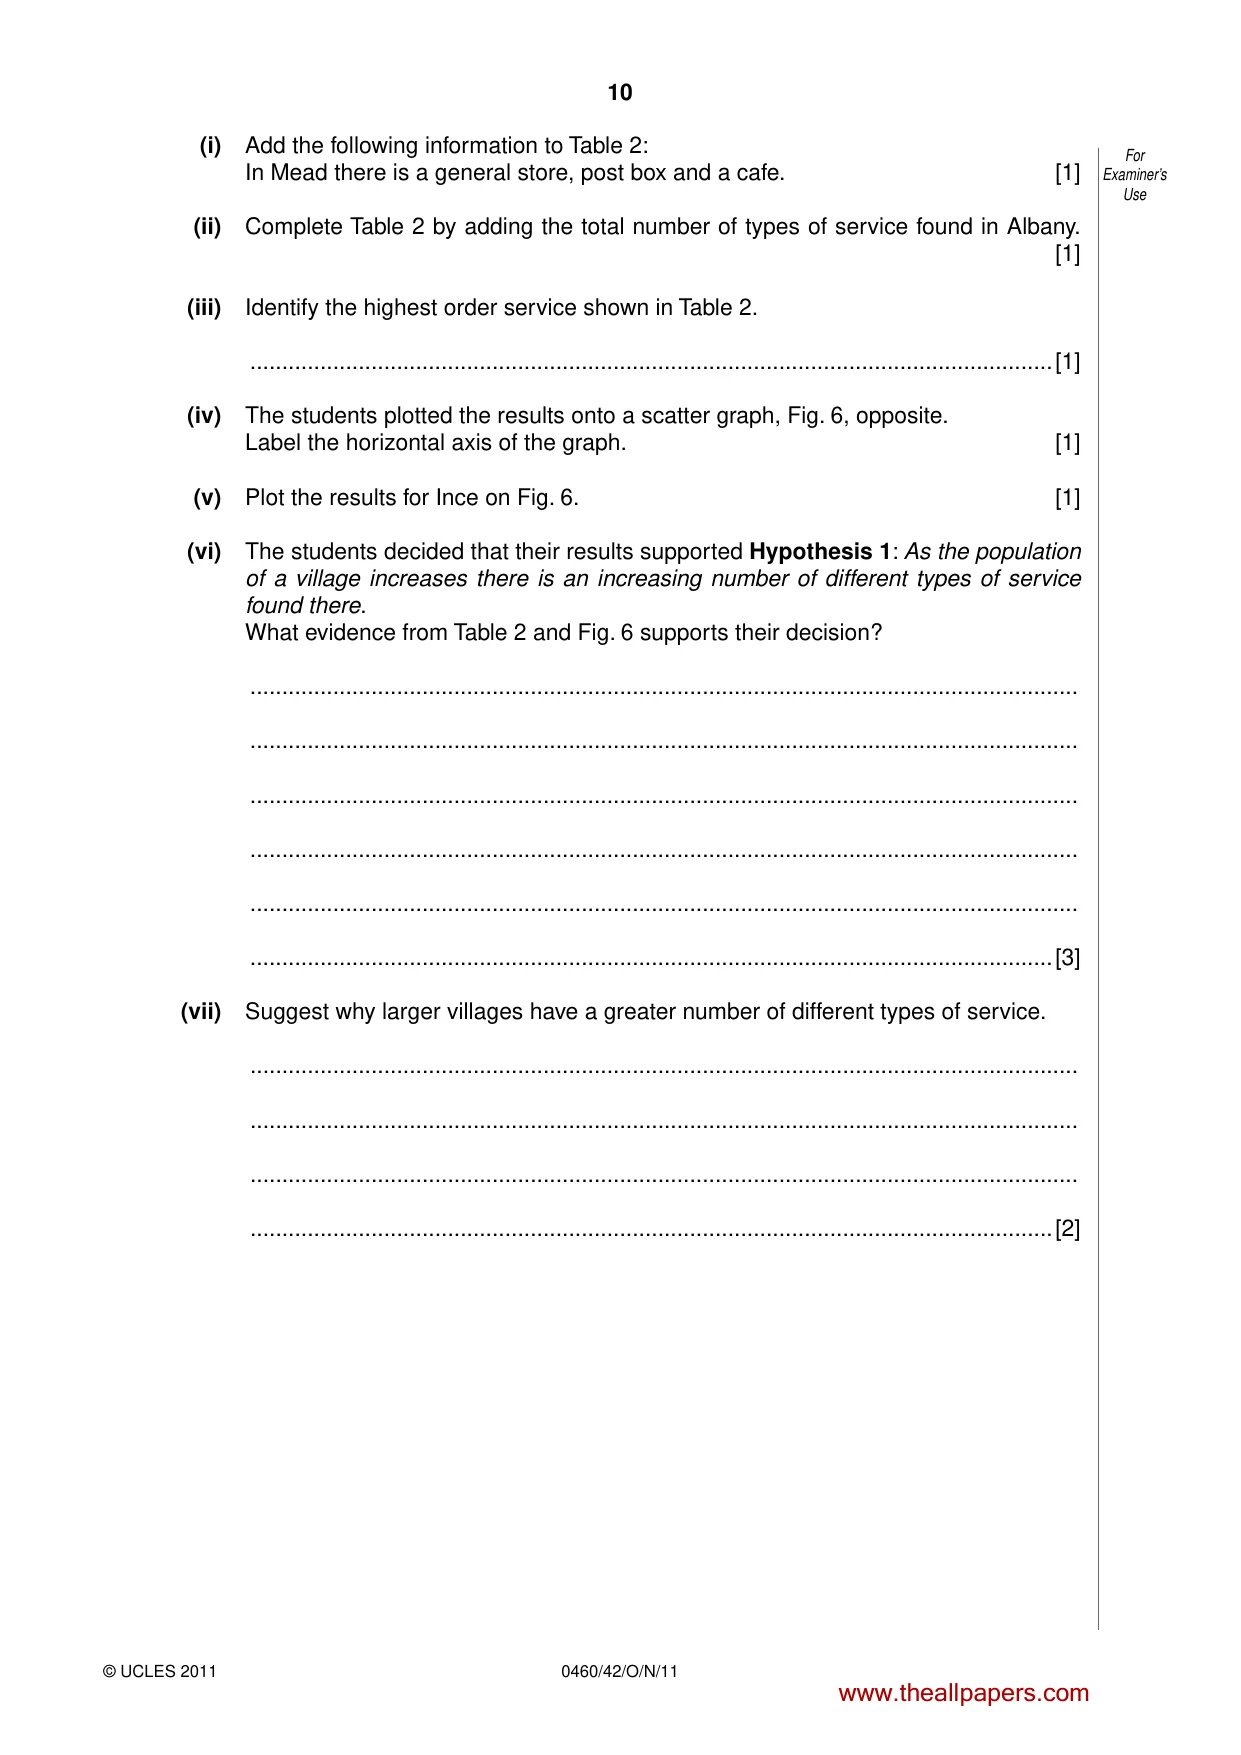
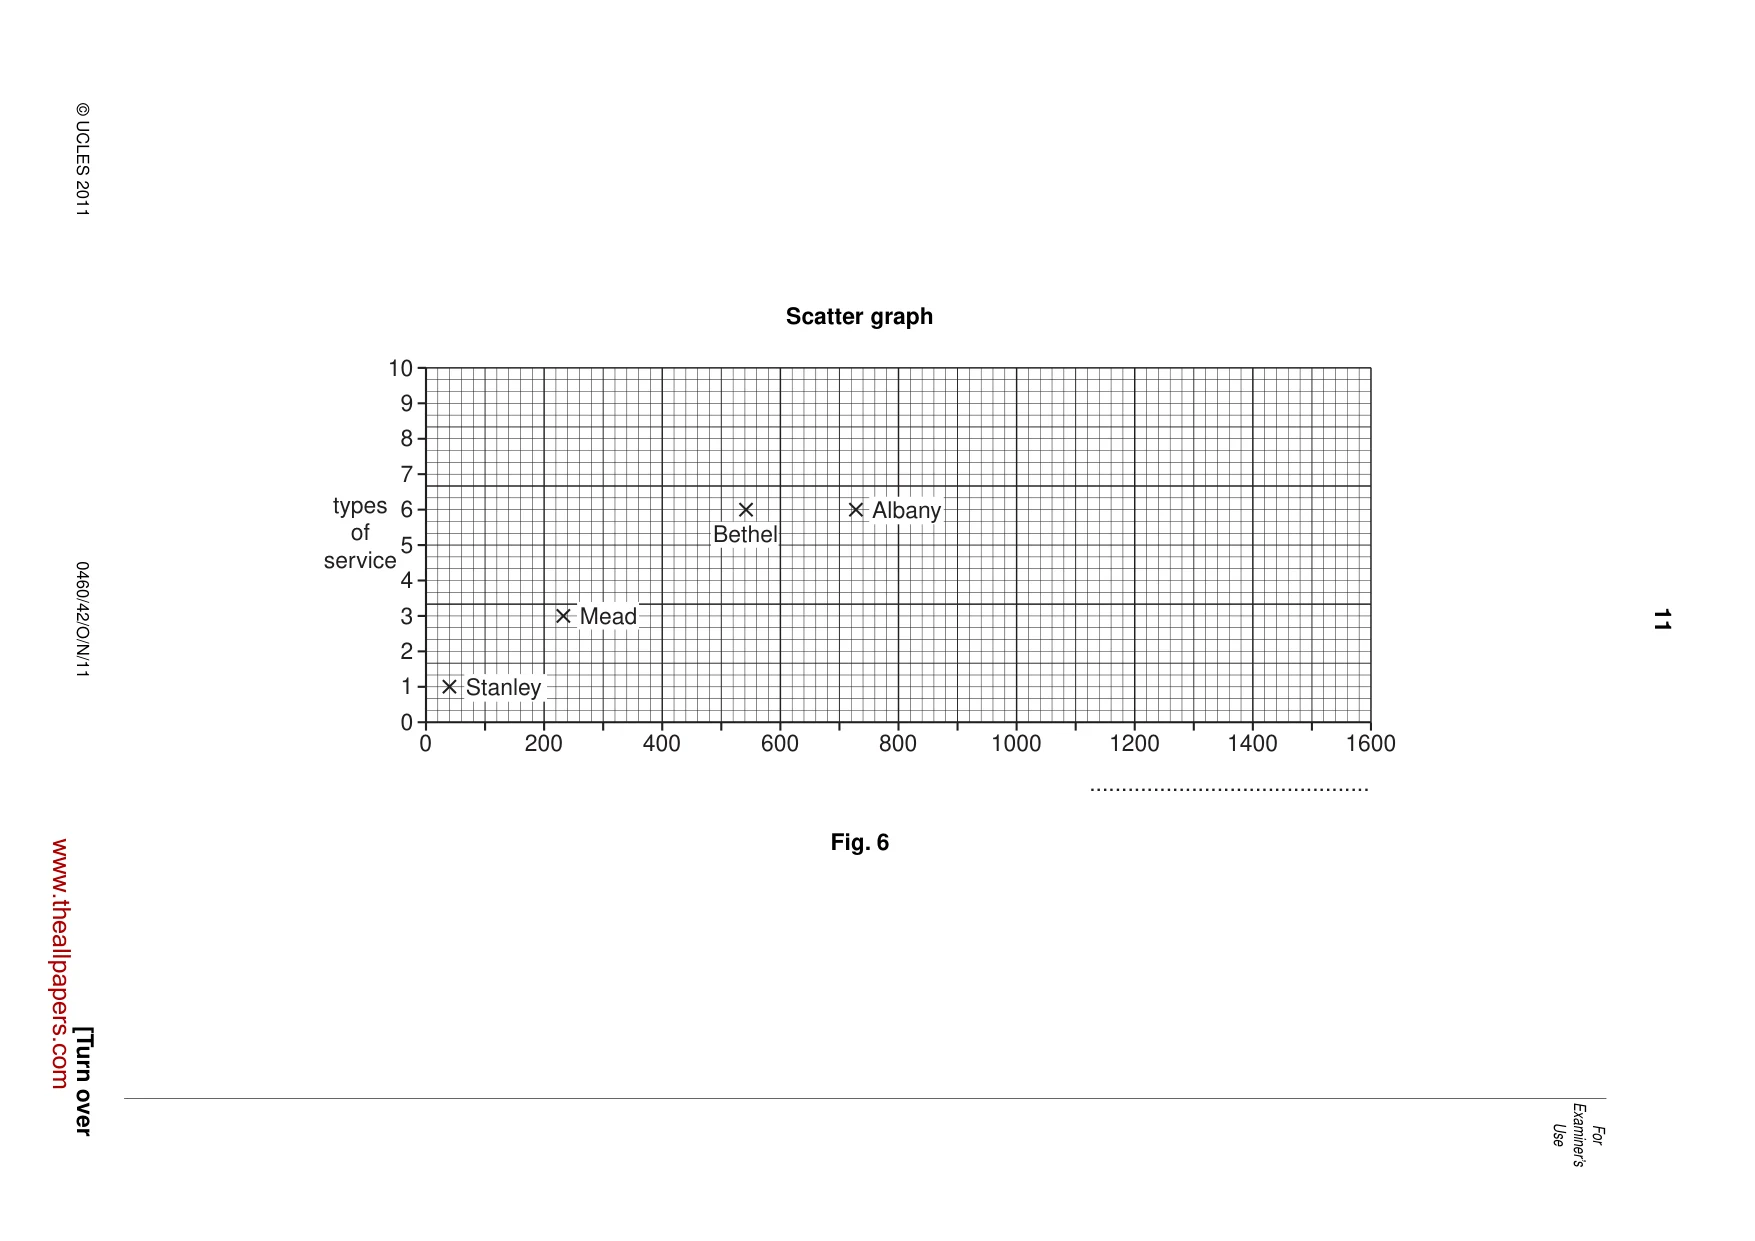
10 0460/42/O/N/11 © UCLES 2011 For Examiner’s Use (i) Add the following information to Table 2: In Mead there is a general store, post box and a cafe. [1] (ii) Complete Table 2 by adding the total number of types of service found in Albany. [1] (iii) Identify the highest order service shown in Table 2. …[1] (iv) The students plotted the results onto a scatter graph, Fig. 6, opposite. Label the horizontal axis of the graph. [1] (v) Plot the results for Ince on Fig. 6. [1] (vi) The students decided that their results supported Hypothesis 1: As the population of a village increases there is an increasing number of different types of service found there. What evidence from Table 2 and Fig. 6 supports their decision? … … … … … …[3] (vii) Suggest why larger villages have a greater number of different types of service. … … … …[2] www.theallpapers.com
Question paper, page 11
11 0460/42/O/N/11 © UCLES 2011 [Turn over For Examiner’s Use Scatter graph 0 0 1 types of service 2 3 4 5 6 7 8 9 10 200 400 600 800 … 1000 1200 1400 1600 Stanley Mead Bethel Albany Fig. 6 www.theallpapers.com
Question paper, page 12
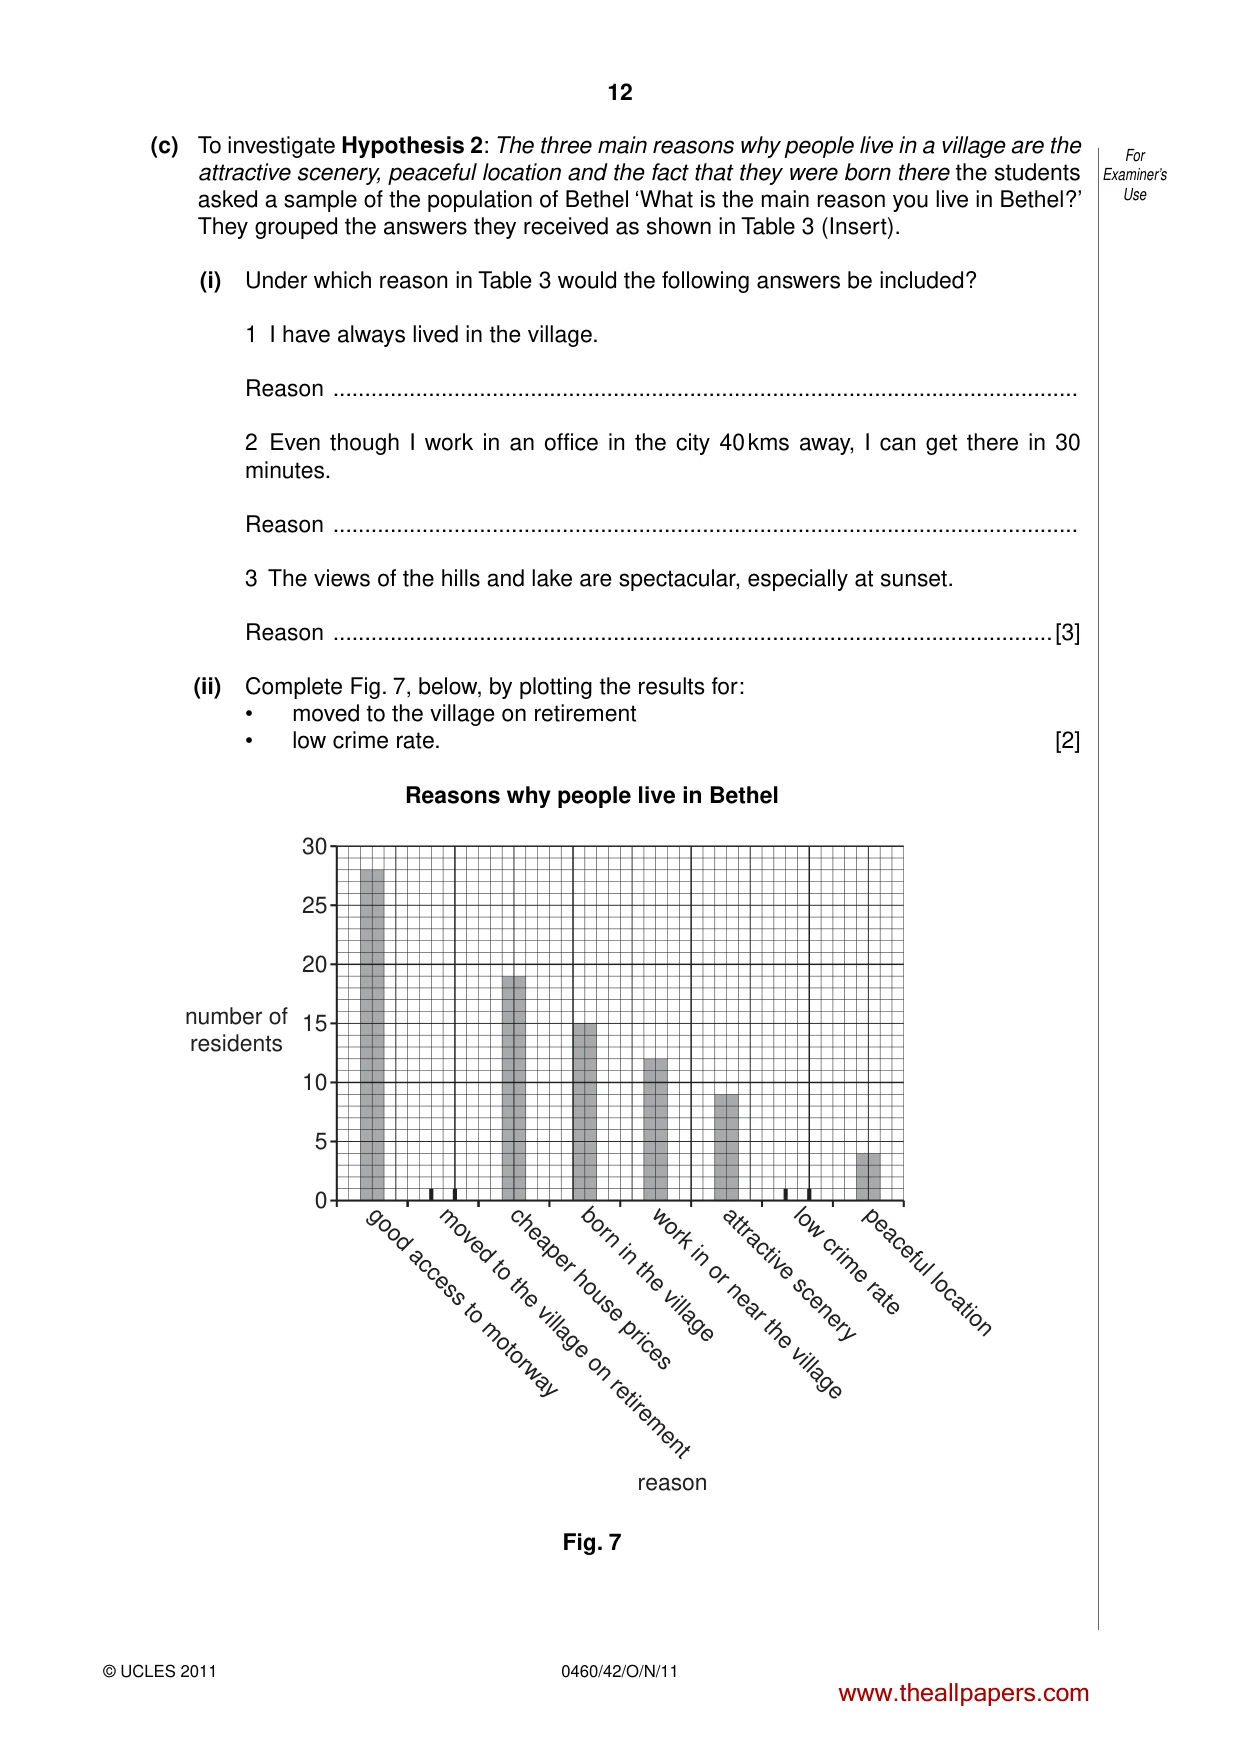
12 0460/42/O/N/11 © UCLES 2011 For Examiner’s Use (c) To investigate Hypothesis 2: The three main reasons why people live in a village are the attractive scenery, peaceful location and the fact that they were born there the students asked a sample of the population of Bethel ‘What is the main reason you live in Bethel?’ They grouped the answers they received as shown in Table 3 (Insert). (i) Under which reason in Table 3 would the following answers be included? 1 I have always lived in the village. Reason … 2 Even though I work in an office in the city 40 kms away, I can get there in 30 minutes. Reason … 3 The views of the hills and lake are spectacular, especially at sunset. Reason …[3] (ii) Complete Fig. 7, below, by plotting the results for: • moved to the village on retirement • low crime rate. [2] Reasons why people live in Bethel 0 5 10 15 20 25 30 good access to motorway moved to the village on retirement cheaper house prices born in the village work in or near the village attractive scenery low crime rate peaceful location reason number of residents Fig. 7 www.theallpapers.com
Question paper, page 13
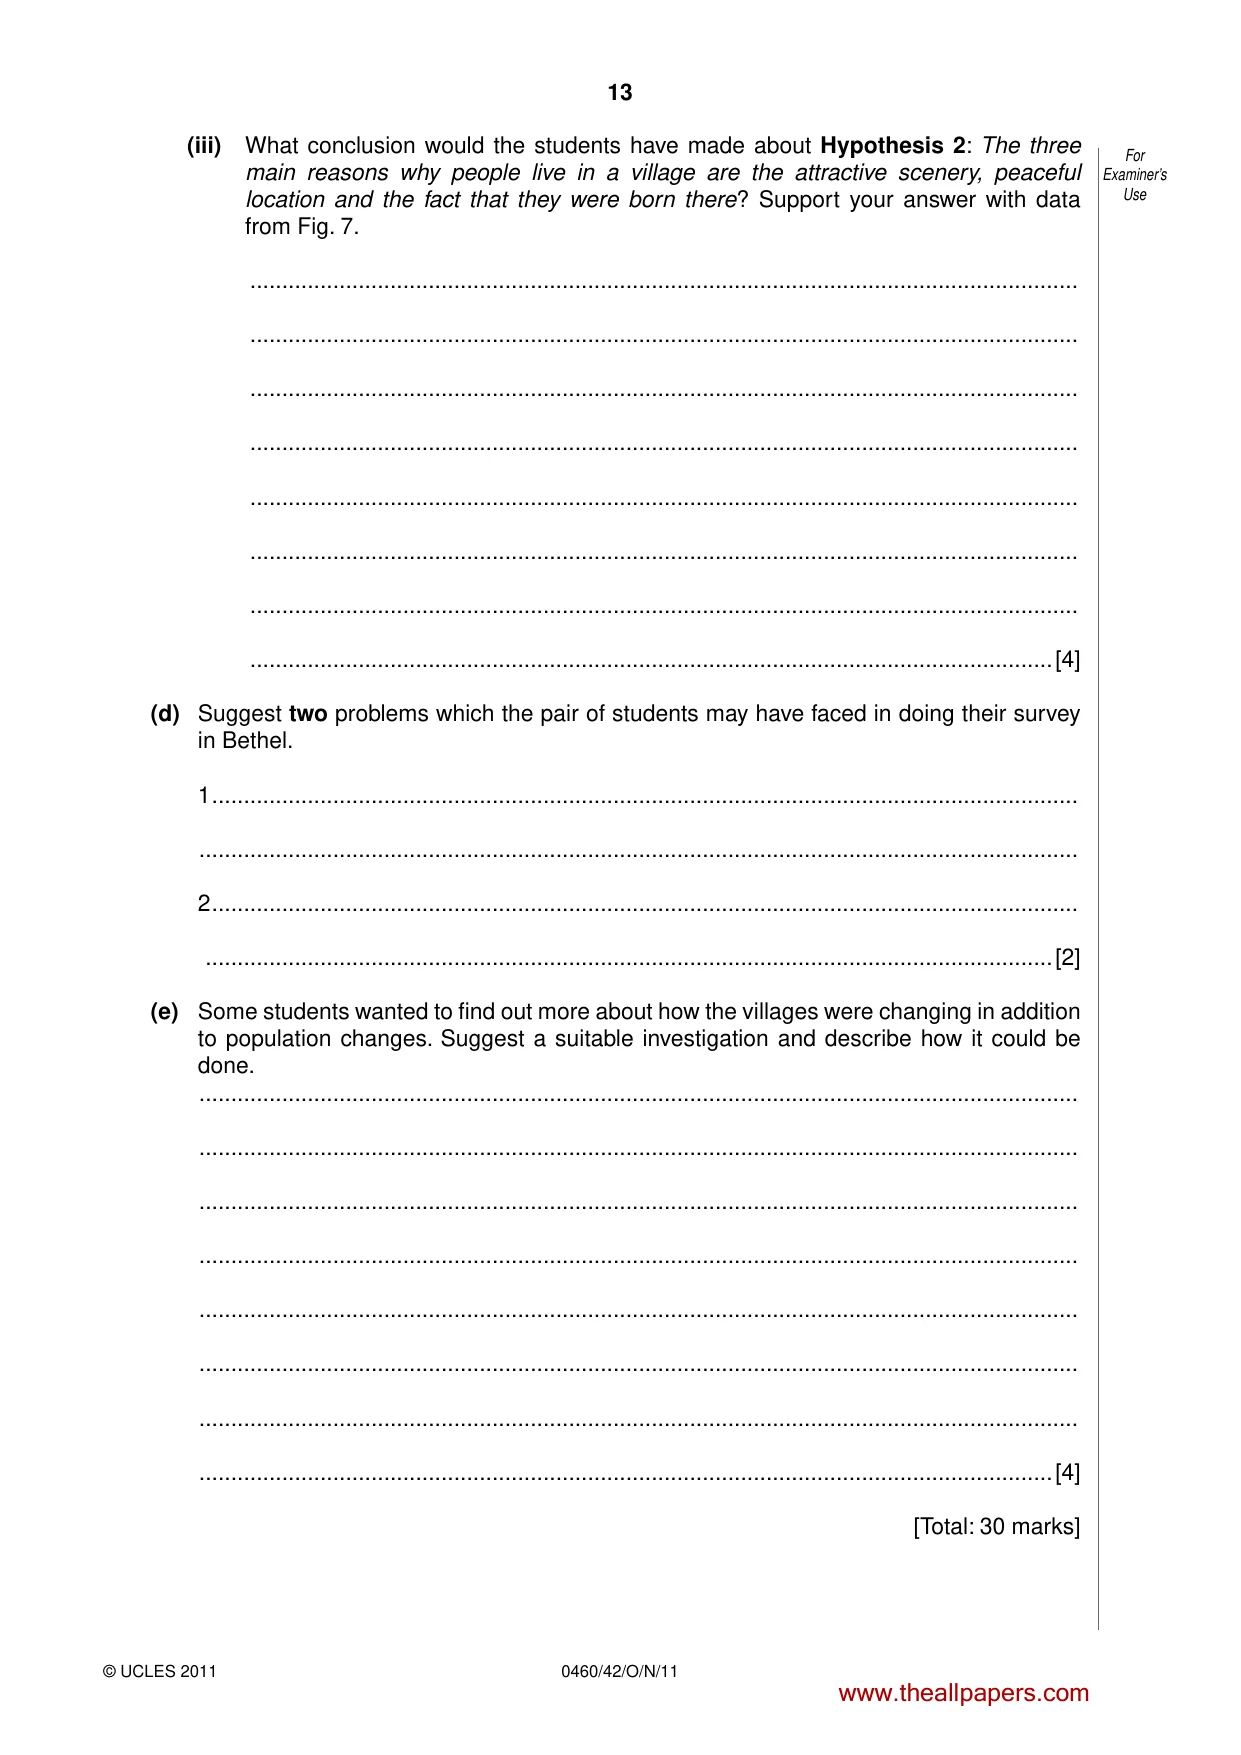
13 0460/42/O/N/11 © UCLES 2011 For Examiner’s Use (iii) What conclusion would the students have made about Hypothesis 2: The three main reasons why people live in a village are the attractive scenery, peaceful location and the fact that they were born there? Support your answer with data from Fig. 7. … … … … … … … …[4] (d) Suggest two problems which the pair of students may have faced in doing their survey in Bethel. 1 … … 2 … …[2] (e) Some students wanted to find out more about how the villages were changing in addition to population changes. Suggest a suitable investigation and describe how it could be done. … … … … … … … …[4] [Total: 30 marks] www.theallpapers.com
Question paper, page 14
14 0460/42/O/N/11 © UCLES 2011 BLANK PAGE www.theallpapers.com
Question paper, page 15
15 0460/42/O/N/11 © UCLES 2011 BLANK PAGE www.theallpapers.com
Question paper, page 16
16 0460/42/O/N/11 © UCLES 2011 BLANK PAGE Permission to reproduce items where third-party owned material protected by copyright is included has been sought and cleared where possible. Every reasonable effort has been made by the publisher (UCLES) to trace copyright holders, but if any items requiring clearance have unwittingly been included, the publisher will be pleased to make amends at the earliest possible opportunity. University of Cambridge International Examinations is part of the Cambridge Assessment Group. Cambridge Assessment is the brand name of University of Cambridge Local Examinations Syndicate (UCLES), which is itself a department of the University of Cambridge. www.theallpapers.com
Mark scheme, page 1
UNIVERSITY OF CAMBRIDGE INTERNATIONAL EXAMINATIONS International General Certificate of Secondary Education MARK SCHEME for the October/November 2011 question paper for the guidance of teachers 0460 GEOGRAPHY 0460/42 Paper 4 (Alternative to Coursework), maximum raw mark 60 This mark scheme is published as an aid to teachers and candidates, to indicate the requirements of the examination. It shows the basis on which Examiners were instructed to award marks. It does not indicate the details of the discussions that took place at an Examiners’ meeting before marking began, which would have considered the acceptability of alternative answers. Mark schemes must be read in conjunction with the question papers and the report on the examination. • Cambridge will not enter into discussions or correspondence in connection with these mark schemes. Cambridge is publishing the mark schemes for the October / November 2011 question papers for most IGCSE, GCE Advanced Level and Advanced Subsidiary Level syllabuses and some Ordinary Level syllabuses. www.theallpapers.com
Mark scheme, page 2
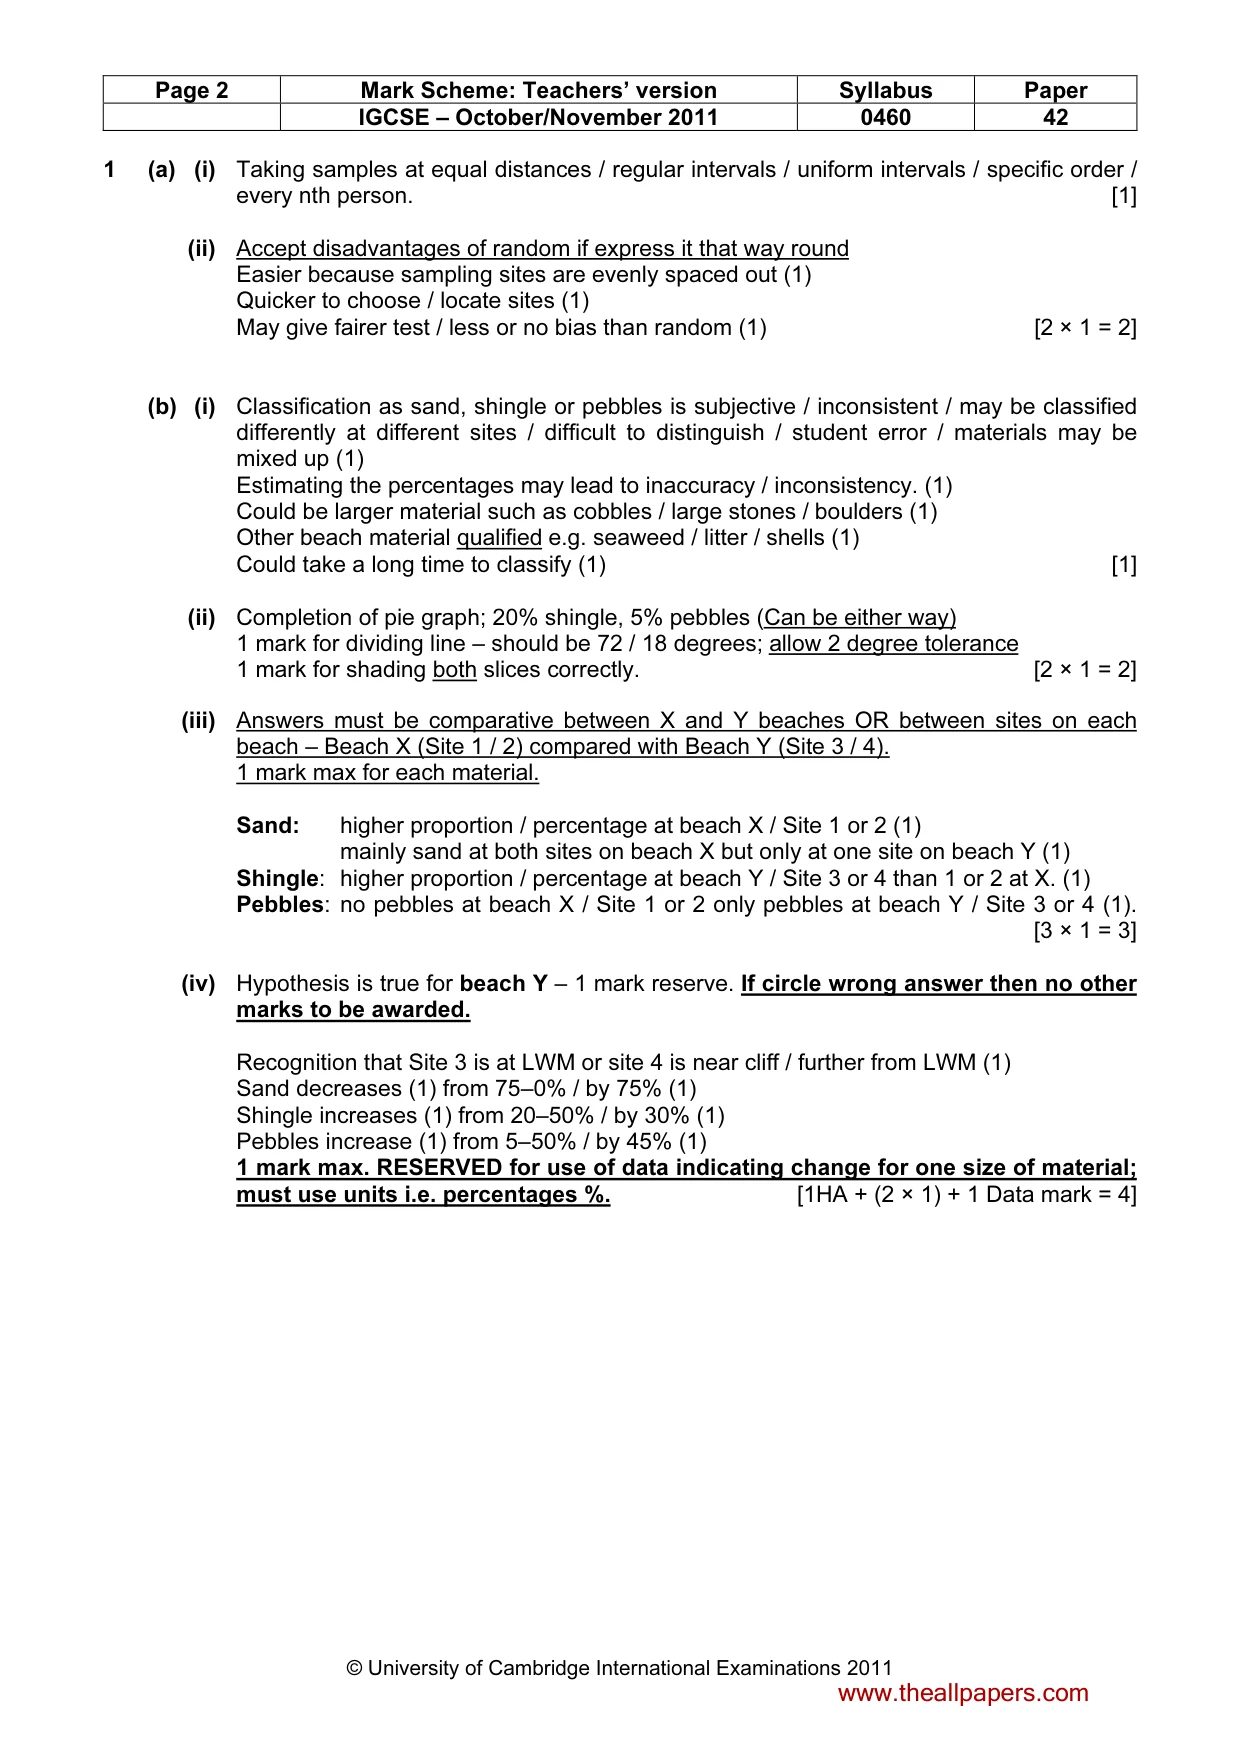
Page 2 Mark Scheme: Teachers’ version Syllabus Paper IGCSE – October/November 2011 0460 42 © University of Cambridge International Examinations 2011 1 (a) (i) Taking samples at equal distances / regular intervals / uniform intervals / specific order / every nth person. [1] (ii) Accept disadvantages of random if express it that way round Easier because sampling sites are evenly spaced out (1) Quicker to choose / locate sites (1) May give fairer test / less or no bias than random (1) [2 × 1 = 2] (b) (i) Classification as sand, shingle or pebbles is subjective / inconsistent / may be classified differently at different sites / difficult to distinguish / student error / materials may be mixed up (1) Estimating the percentages may lead to inaccuracy / inconsistency. (1) Could be larger material such as cobbles / large stones / boulders (1) Other beach material qualified e.g. seaweed / litter / shells (1) Could take a long time to classify (1) [1] (ii) Completion of pie graph; 20% shingle, 5% pebbles (Can be either way) 1 mark for dividing line – should be 72 / 18 degrees; allow 2 degree tolerance 1 mark for shading both slices correctly. [2 × 1 = 2] (iii) Answers must be comparative between X and Y beaches OR between sites on each beach – Beach X (Site 1 / 2) compared with Beach Y (Site 3 / 4). 1 mark max for each material. Sand: higher proportion / percentage at beach X / Site 1 or 2 (1) mainly sand at both sites on beach X but only at one site on beach Y (1) Shingle: higher proportion / percentage at beach Y / Site 3 or 4 than 1 or 2 at X. (1) Pebbles: no pebbles at beach X / Site 1 or 2 only pebbles at beach Y / Site 3 or 4 (1). [3 × 1 = 3] (iv) Hypothesis is true for beach Y – 1 mark reserve. If circle wrong answer then no other marks to be awarded. Recognition that Site 3 is at LWM or site 4 is near cliff / further from LWM (1) Sand decreases (1) from 75–0% / by 75% (1) Shingle increases (1) from 20–50% / by 30% (1) Pebbles increase (1) from 5–50% / by 45% (1) 1 mark max. RESERVED for use of data indicating change for one size of material; must use units i.e. percentages %. [1HA + (2 × 1) + 1 Data mark = 4] www.theallpapers.com
Mark scheme, page 3
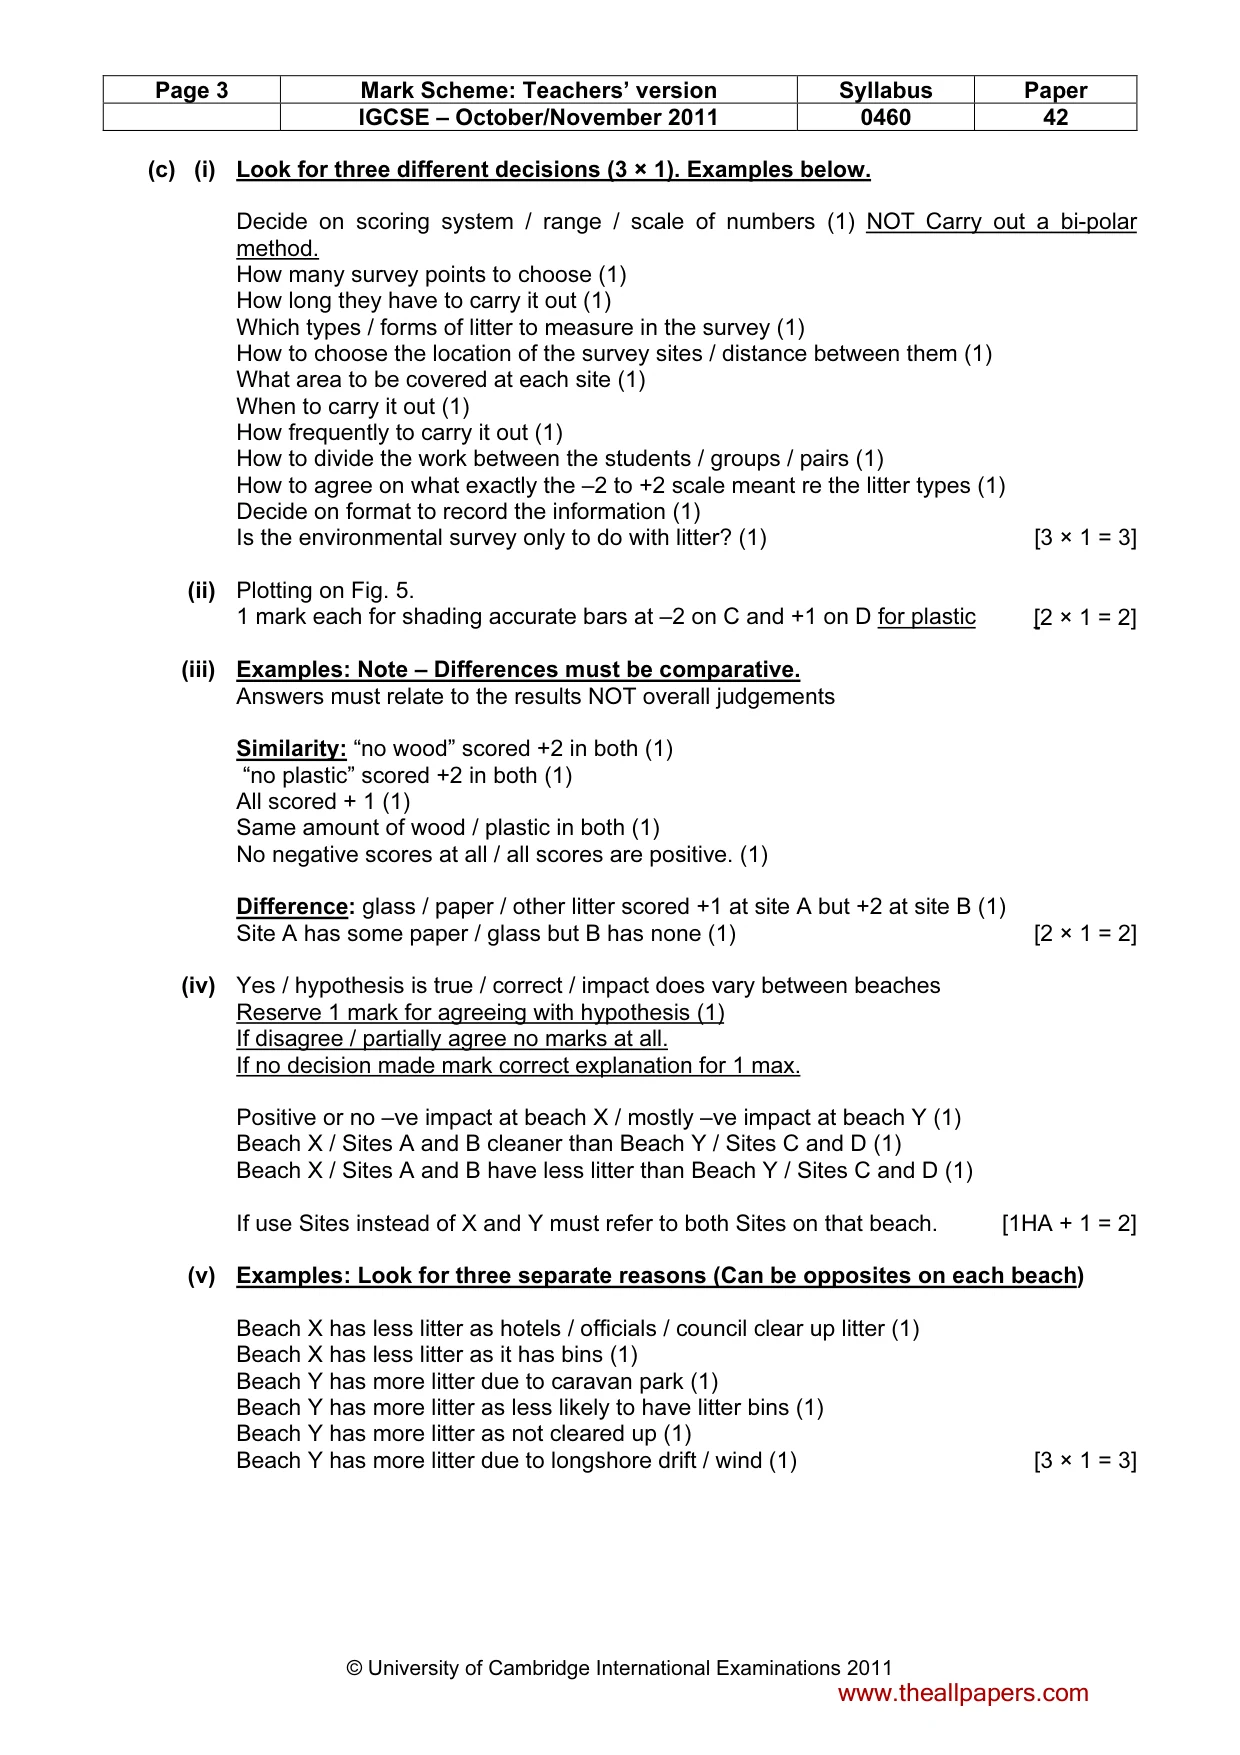
Page 3 Mark Scheme: Teachers’ version Syllabus Paper IGCSE – October/November 2011 0460 42 © University of Cambridge International Examinations 2011 (c) (i) Look for three different decisions (3 × 1). Examples below. Decide on scoring system / range / scale of numbers (1) NOT Carry out a bi-polar method. How many survey points to choose (1) How long they have to carry it out (1) Which types / forms of litter to measure in the survey (1) How to choose the location of the survey sites / distance between them (1) What area to be covered at each site (1) When to carry it out (1) How frequently to carry it out (1) How to divide the work between the students / groups / pairs (1) How to agree on what exactly the –2 to +2 scale meant re the litter types (1) Decide on format to record the information (1) Is the environmental survey only to do with litter? (1) [3 × 1 = 3] (ii) Plotting on Fig. 5. 1 mark each for shading accurate bars at –2 on C and +1 on D for plastic [2 × 1 = 2] (iii) Examples: Note – Differences must be comparative. Answers must relate to the results NOT overall judgements Similarity: “no wood” scored +2 in both (1) “no plastic” scored +2 in both (1) All scored + 1 (1) Same amount of wood / plastic in both (1) No negative scores at all / all scores are positive. (1) Difference: glass / paper / other litter scored +1 at site A but +2 at site B (1) Site A has some paper / glass but B has none (1) [2 × 1 = 2] (iv) Yes / hypothesis is true / correct / impact does vary between beaches Reserve 1 mark for agreeing with hypothesis (1) If disagree / partially agree no marks at all. If no decision made mark correct explanation for 1 max. Positive or no –ve impact at beach X / mostly –ve impact at beach Y (1) Beach X / Sites A and B cleaner than Beach Y / Sites C and D (1) Beach X / Sites A and B have less litter than Beach Y / Sites C and D (1) If use Sites instead of X and Y must refer to both Sites on that beach. [1HA + 1 = 2] (v) Examples: Look for three separate reasons (Can be opposites on each beach) Beach X has less litter as hotels / officials / council clear up litter (1) Beach X has less litter as it has bins (1) Beach Y has more litter due to caravan park (1) Beach Y has more litter as less likely to have litter bins (1) Beach Y has more litter as not cleared up (1) Beach Y has more litter due to longshore drift / wind (1) [3 × 1 = 3] www.theallpapers.com
Mark scheme, page 4
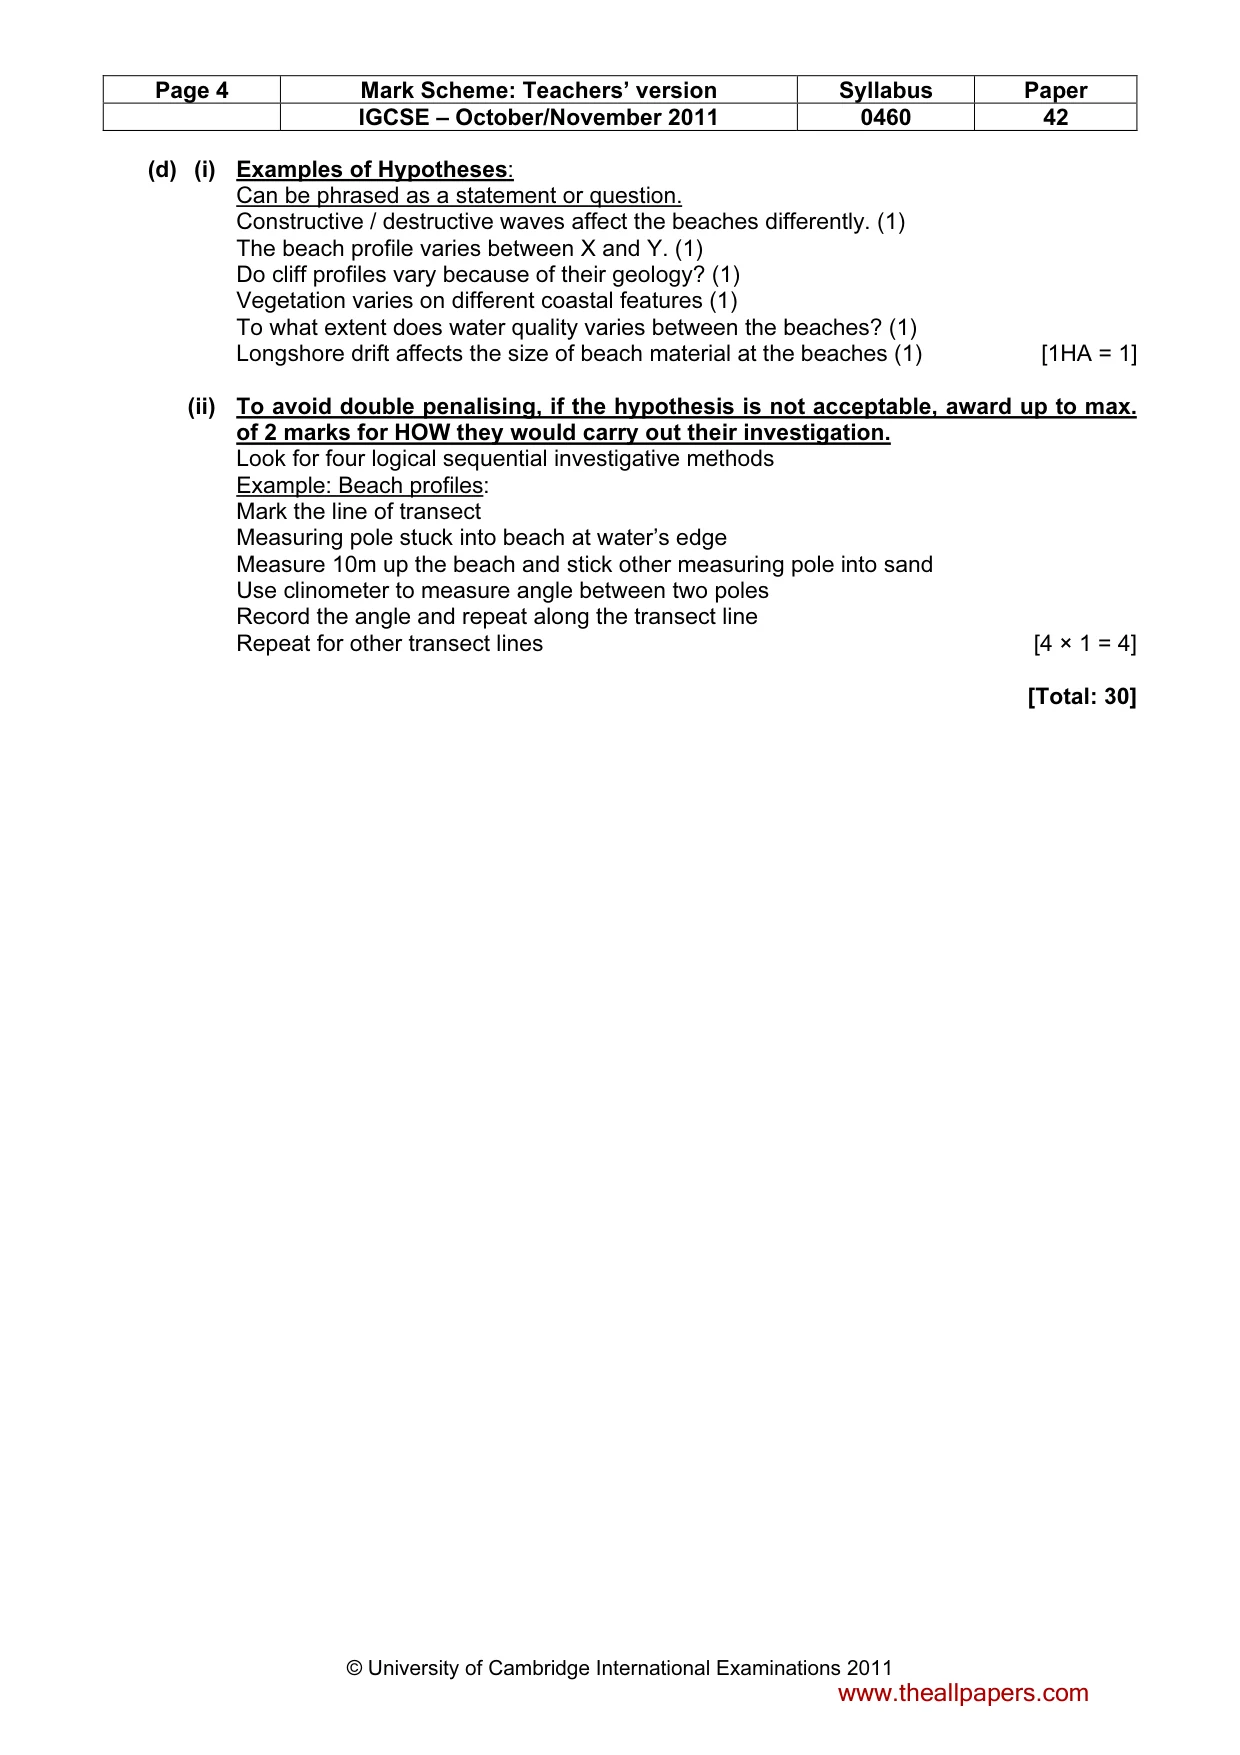
Page 4 Mark Scheme: Teachers’ version Syllabus Paper IGCSE – October/November 2011 0460 42 © University of Cambridge International Examinations 2011 (d) (i) Examples of Hypotheses: Can be phrased as a statement or question. Constructive / destructive waves affect the beaches differently. (1) The beach profile varies between X and Y. (1) Do cliff profiles vary because of their geology? (1) Vegetation varies on different coastal features (1) To what extent does water quality varies between the beaches? (1) Longshore drift affects the size of beach material at the beaches (1) [1HA = 1] (ii) To avoid double penalising, if the hypothesis is not acceptable, award up to max. of 2 marks for HOW they would carry out their investigation. Look for four logical sequential investigative methods Example: Beach profiles: Mark the line of transect Measuring pole stuck into beach at water’s edge Measure 10m up the beach and stick other measuring pole into sand Use clinometer to measure angle between two poles Record the angle and repeat along the transect line Repeat for other transect lines [4 × 1 = 4] [Total: 30] www.theallpapers.com
Mark scheme, page 5
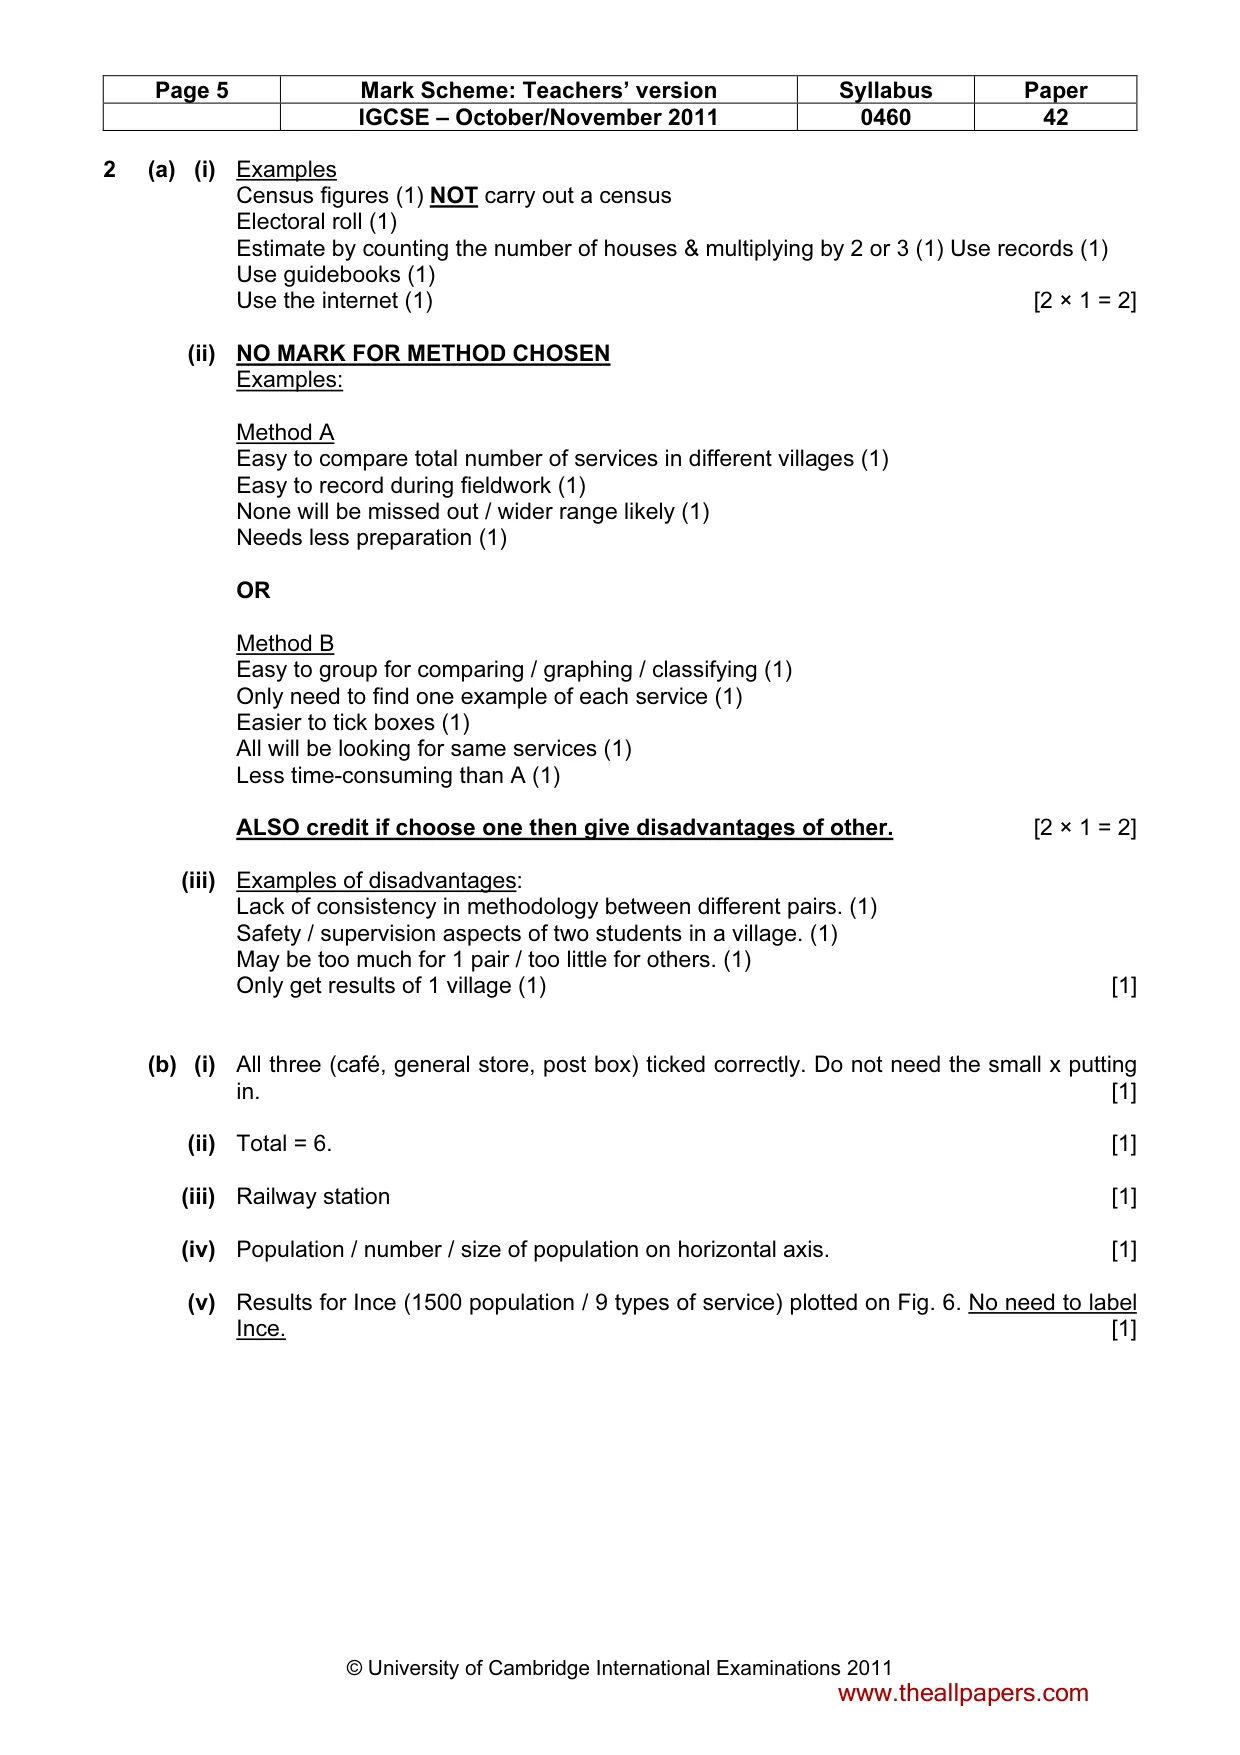
Page 5 Mark Scheme: Teachers’ version Syllabus Paper IGCSE – October/November 2011 0460 42 © University of Cambridge International Examinations 2011 2 (a) (i) Examples Census figures (1) NOT carry out a census Electoral roll (1) Estimate by counting the number of houses & multiplying by 2 or 3 (1) Use records (1) Use guidebooks (1) Use the internet (1) [2 × 1 = 2] (ii) NO MARK FOR METHOD CHOSEN Examples: Method A Easy to compare total number of services in different villages (1) Easy to record during fieldwork (1) None will be missed out / wider range likely (1) Needs less preparation (1) OR Method B Easy to group for comparing / graphing / classifying (1) Only need to find one example of each service (1) Easier to tick boxes (1) All will be looking for same services (1) Less time-consuming than A (1) ALSO credit if choose one then give disadvantages of other. [2 × 1 = 2] (iii) Examples of disadvantages: Lack of consistency in methodology between different pairs. (1) Safety / supervision aspects of two students in a village. (1) May be too much for 1 pair / too little for others. (1) Only get results of 1 village (1) [1] (b) (i) All three (café, general store, post box) ticked correctly. Do not need the small x putting in. [1] (ii) Total = 6. [1] (iii) Railway station [1] (iv) Population / number / size of population on horizontal axis. [1] (v) Results for Ince (1500 population / 9 types of service) plotted on Fig. 6. No need to label Ince. [1] www.theallpapers.com
Mark scheme, page 6
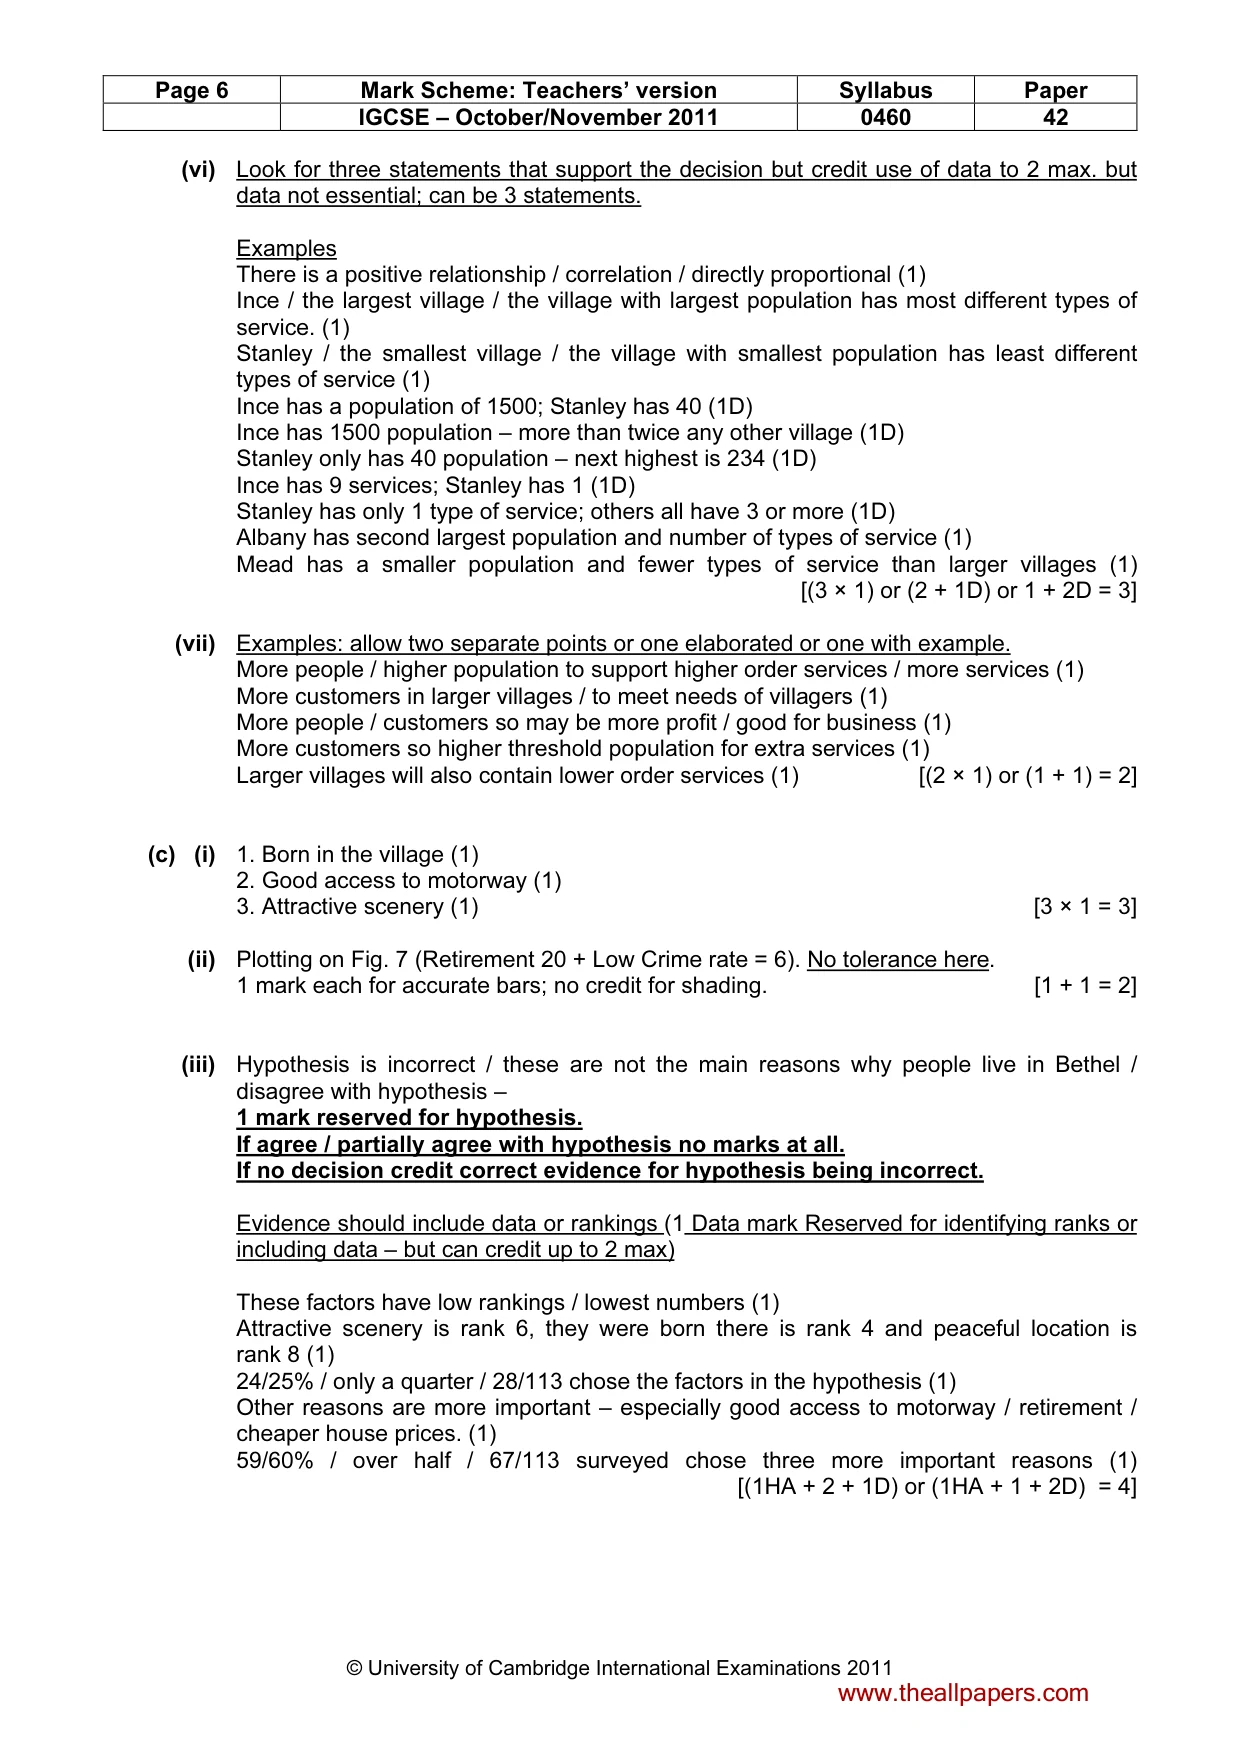
Page 6 Mark Scheme: Teachers’ version Syllabus Paper IGCSE – October/November 2011 0460 42 © University of Cambridge International Examinations 2011 (vi) Look for three statements that support the decision but credit use of data to 2 max. but data not essential; can be 3 statements. Examples There is a positive relationship / correlation / directly proportional (1) Ince / the largest village / the village with largest population has most different types of service. (1) Stanley / the smallest village / the village with smallest population has least different types of service (1) Ince has a population of 1500; Stanley has 40 (1D) Ince has 1500 population – more than twice any other village (1D) Stanley only has 40 population – next highest is 234 (1D) Ince has 9 services; Stanley has 1 (1D) Stanley has only 1 type of service; others all have 3 or more (1D) Albany has second largest population and number of types of service (1) Mead has a smaller population and fewer types of service than larger villages (1) [(3 × 1) or (2 + 1D) or 1 + 2D = 3] (vii) Examples: allow two separate points or one elaborated or one with example. More people / higher population to support higher order services / more services (1) More customers in larger villages / to meet needs of villagers (1) More people / customers so may be more profit / good for business (1) More customers so higher threshold population for extra services (1) Larger villages will also contain lower order services (1) [(2 × 1) or (1 + 1) = 2] (c) (i) 1. Born in the village (1) 2. Good access to motorway (1) 3. Attractive scenery (1) [3 × 1 = 3] (ii) Plotting on Fig. 7 (Retirement 20 + Low Crime rate = 6). No tolerance here. 1 mark each for accurate bars; no credit for shading. [1 + 1 = 2] (iii) Hypothesis is incorrect / these are not the main reasons why people live in Bethel / disagree with hypothesis – 1 mark reserved for hypothesis. If agree / partially agree with hypothesis no marks at all. If no decision credit correct evidence for hypothesis being incorrect. Evidence should include data or rankings (1 Data mark Reserved for identifying ranks or including data – but can credit up to 2 max) These factors have low rankings / lowest numbers (1) Attractive scenery is rank 6, they were born there is rank 4 and peaceful location is rank 8 (1) 24/25% / only a quarter / 28/113 chose the factors in the hypothesis (1) Other reasons are more important – especially good access to motorway / retirement / cheaper house prices. (1) 59/60% / over half / 67/113 surveyed chose three more important reasons (1) [(1HA + 2 + 1D) or (1HA + 1 + 2D) = 4] www.theallpapers.com
Mark scheme, page 7
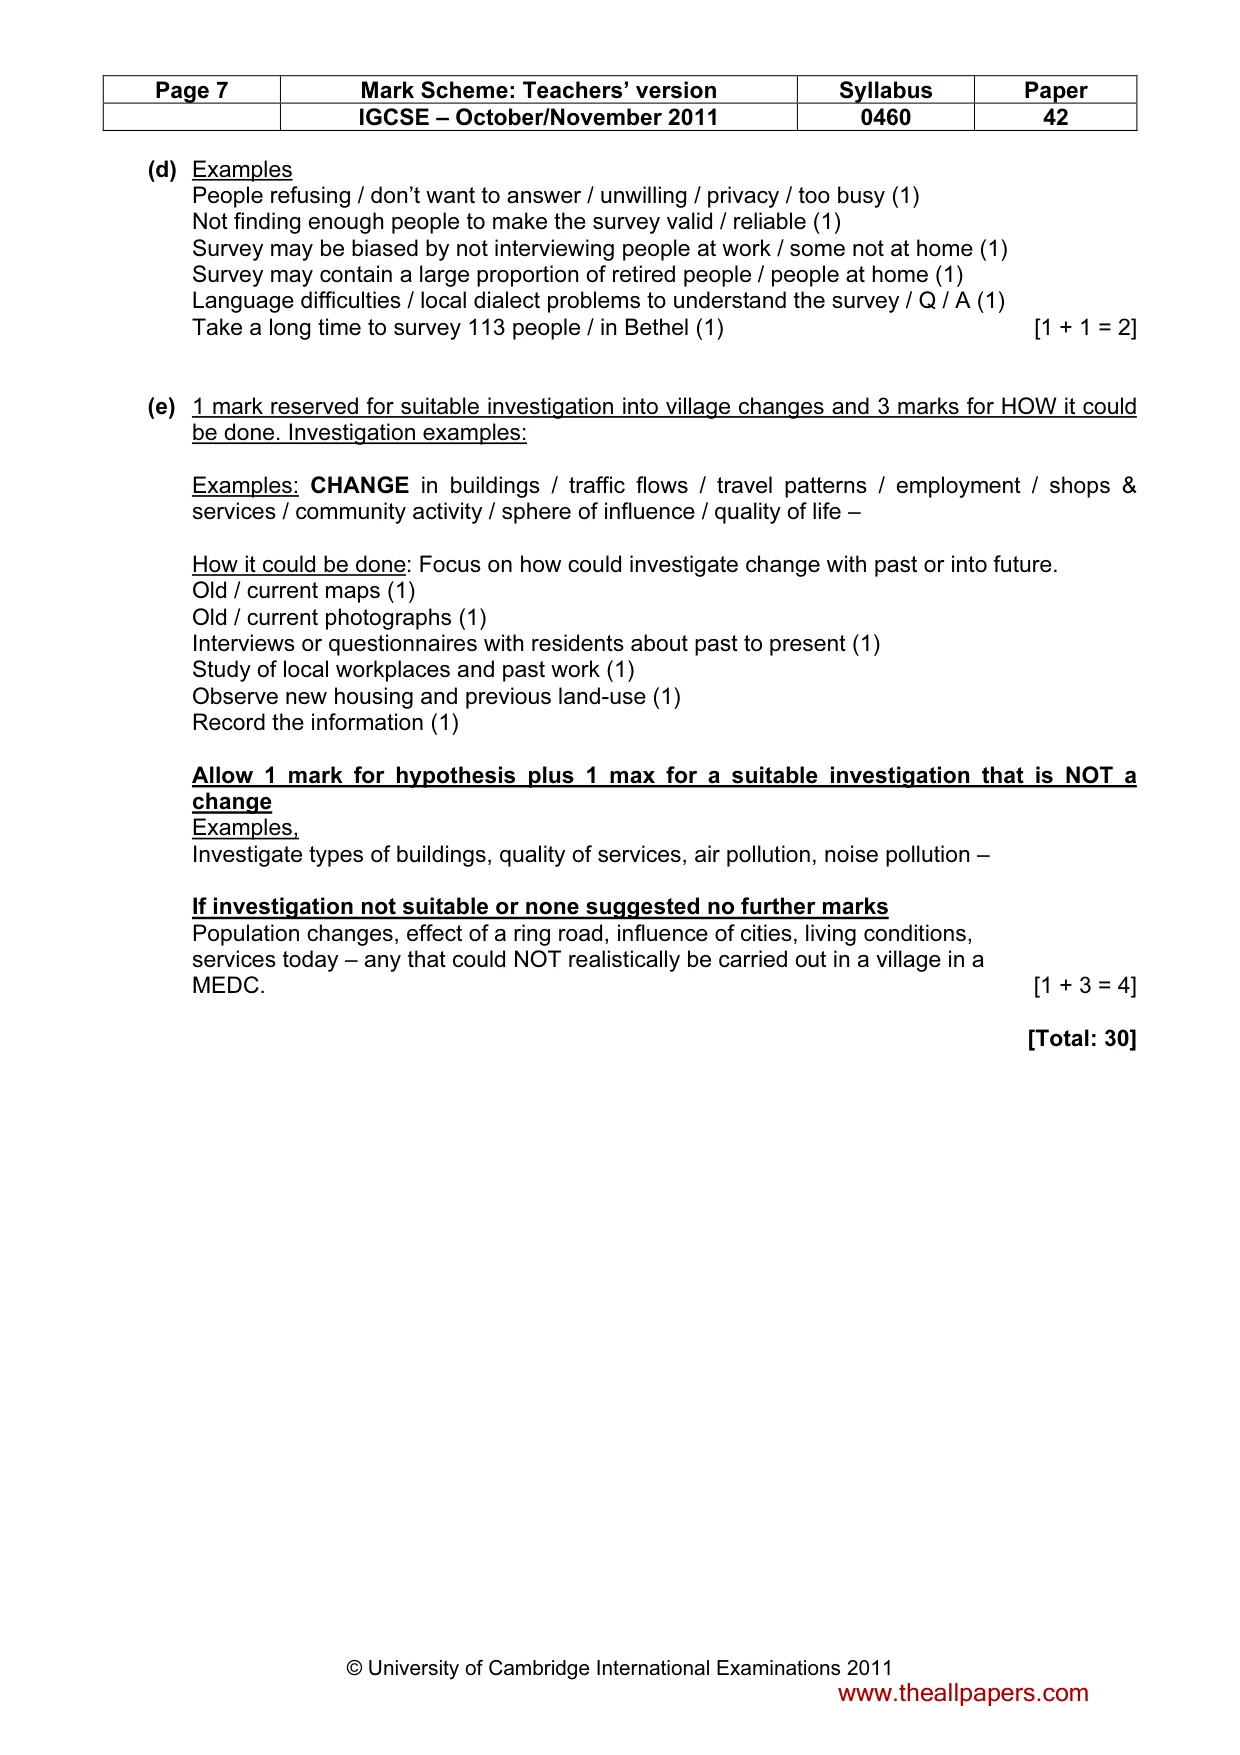
Page 7 Mark Scheme: Teachers’ version Syllabus Paper IGCSE – October/November 2011 0460 42 © University of Cambridge International Examinations 2011 (d) Examples People refusing / don’t want to answer / unwilling / privacy / too busy (1) Not finding enough people to make the survey valid / reliable (1) Survey may be biased by not interviewing people at work / some not at home (1) Survey may contain a large proportion of retired people / people at home (1) Language difficulties / local dialect problems to understand the survey / Q / A (1) Take a long time to survey 113 people / in Bethel (1) [1 + 1 = 2] (e) 1 mark reserved for suitable investigation into village changes and 3 marks for HOW it could be done. Investigation examples: Examples: CHANGE in buildings / traffic flows / travel patterns / employment / shops & services / community activity / sphere of influence / quality of life – How it could be done: Focus on how could investigate change with past or into future. Old / current maps (1) Old / current photographs (1) Interviews or questionnaires with residents about past to present (1) Study of local workplaces and past work (1) Observe new housing and previous land-use (1) Record the information (1) Allow 1 mark for hypothesis plus 1 max for a suitable investigation that is NOT a change Examples, Investigate types of buildings, quality of services, air pollution, noise pollution – If investigation not suitable or none suggested no further marks Population changes, effect of a ring road, influence of cities, living conditions, services today – any that could NOT realistically be carried out in a village in a MEDC. [1 + 3 = 4] [Total: 30] www.theallpapers.com
What you needed in this session
Cambridge’s own grade thresholds for 2011 Oct/Nov, Paper 4 · Variant 2. A higher threshold means an easier paper — the bar moves with how the cohort did.