Cambridge IGCSE Geography 0460 — 2011 Oct/Nov Paper 4 · Variant 1
0460/41/O/N/11 · 60 marks · ≈68 min
The question paper and its mark scheme, free to read here and free to download. This is Cambridge’s own paper, exactly as it was sat.
Question paper16 pages


Mark scheme5 pages
Answers below. Sit the paper first if you are practising.
Paper as text
Question paper, page 1
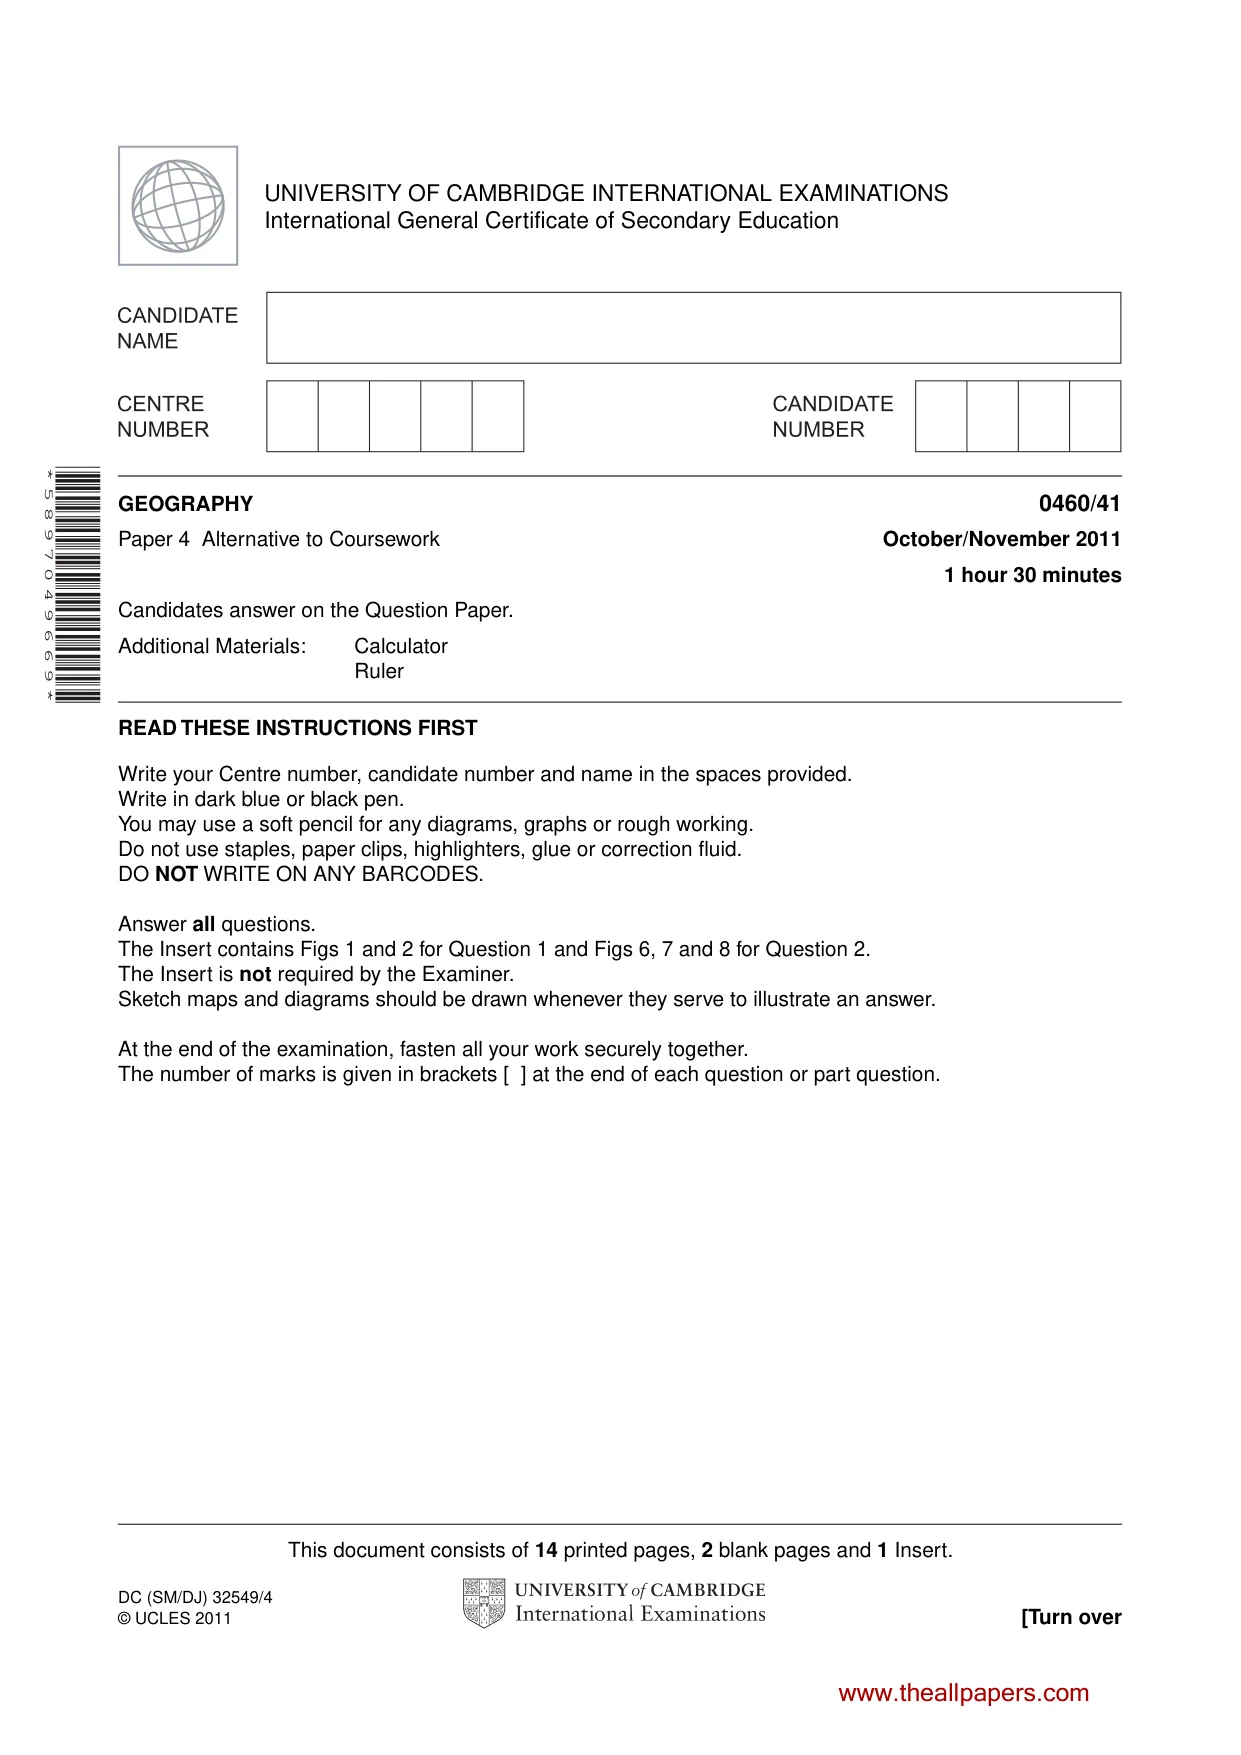
This document consists of 14 printed pages, 2 blank pages and 1 Insert. DC (SM/DJ) 32549/4 © UCLES 2011 [Turn over UNIVERSITY OF CAMBRIDGE INTERNATIONAL EXAMINATIONS International General Certificate of Secondary Education * 5 8 9 7 0 4 9 6 6 9 * GEOGRAPHY 0460/41 Paper 4 Alternative to Coursework October/November 2011 1 hour 30 minutes Candidates answer on the Question Paper. Additional Materials: Calculator Ruler READ THESE INSTRUCTIONS FIRST Write your Centre number, candidate number and name in the spaces provided. Write in dark blue or black pen. You may use a soft pencil for any diagrams, graphs or rough working. Do not use staples, paper clips, highlighters, glue or correction fluid. DO NOT WRITE ON ANY BARCODES. Answer all questions. The Insert contains Figs 1 and 2 for Question 1 and Figs 6, 7 and 8 for Question 2. The Insert is not required by the Examiner. Sketch maps and diagrams should be drawn whenever they serve to illustrate an answer. At the end of the examination, fasten all your work securely together. The number of marks is given in brackets [ ] at the end of each question or part question. www.theallpapers.com
Question paper, page 2
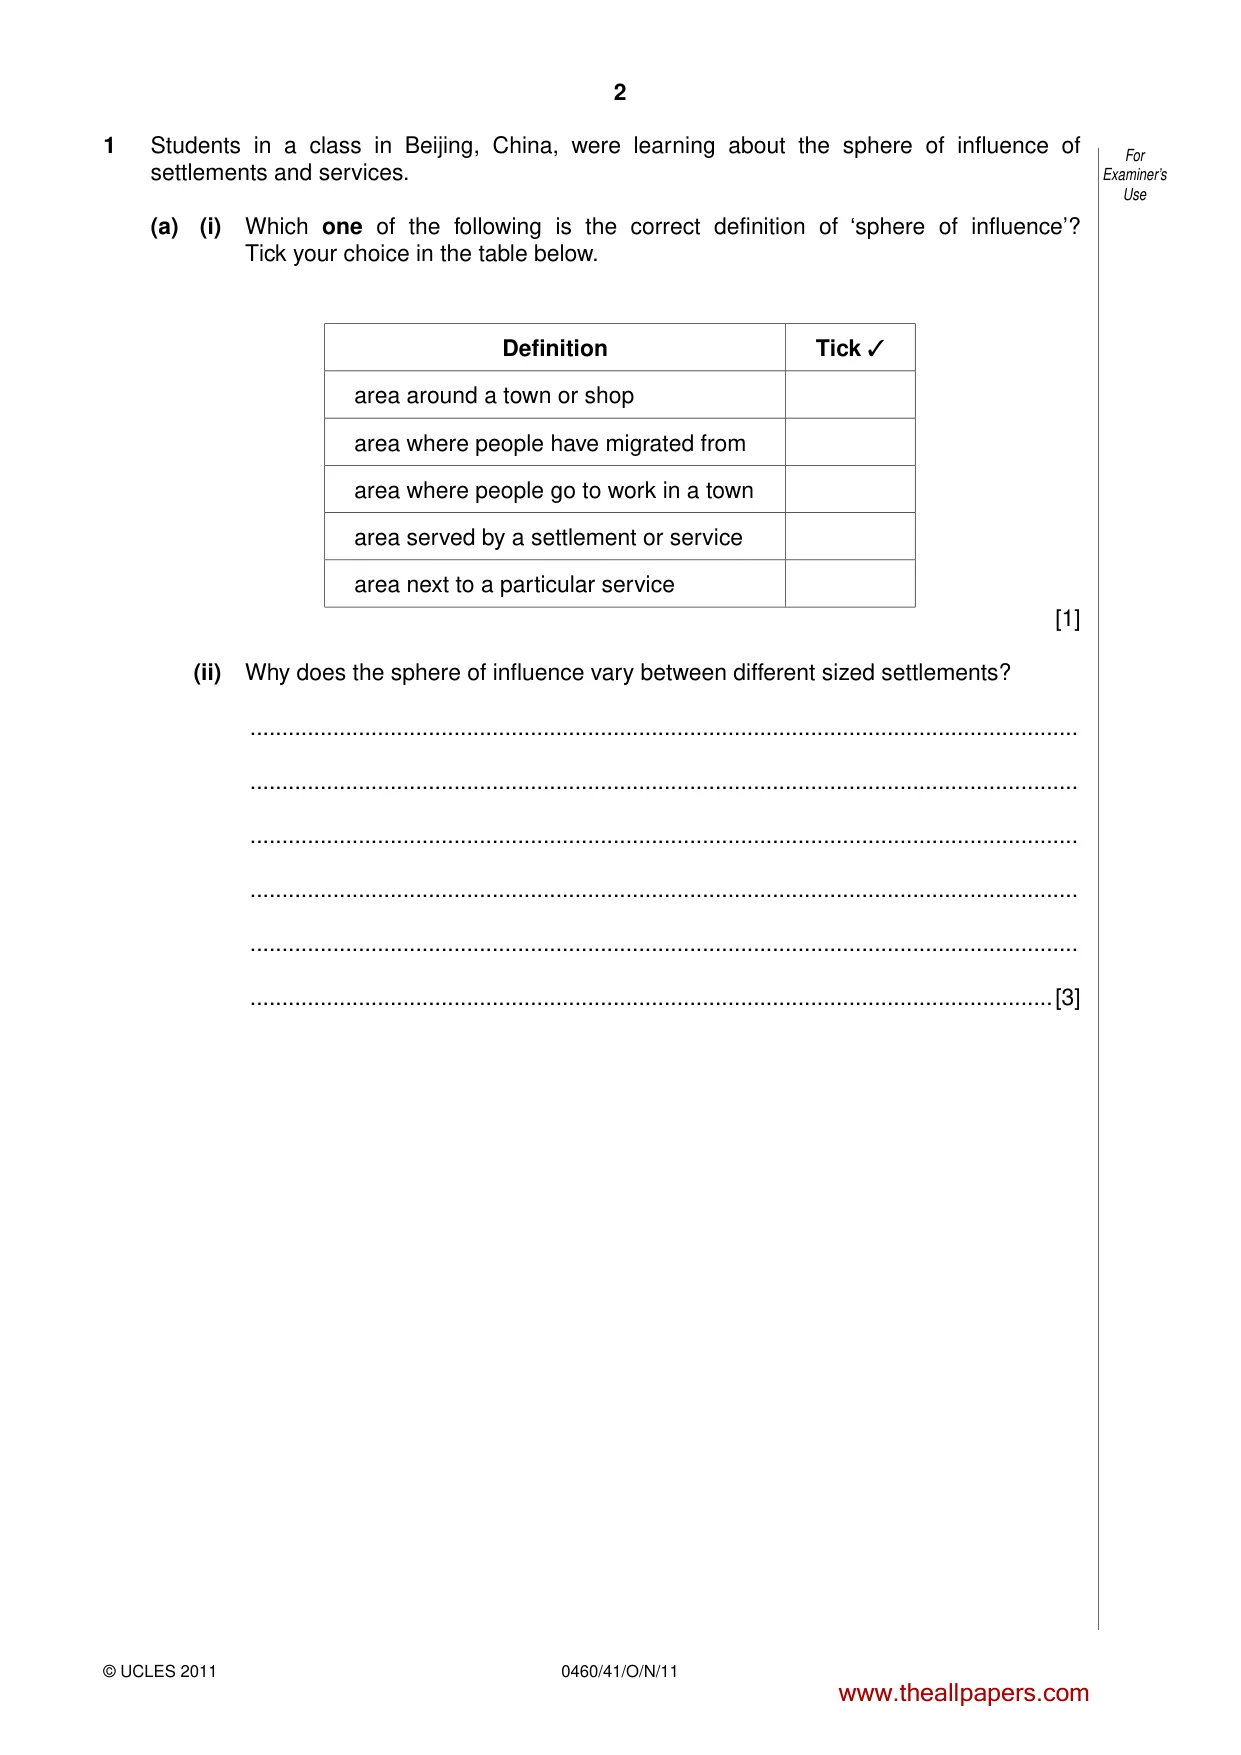
2 0460/41/O/N/11 © UCLES 2011 For Examiner’s Use 1 Students in a class in Beijing, China, were learning about the sphere of influence of settlements and services. (a) (i) Which one of the following is the correct definition of ‘sphere of influence’? Tick your choice in the table below. Definition Tick ✓ area around a town or shop area where people have migrated from area where people go to work in a town area served by a settlement or service area next to a particular service [1] (ii) Why does the sphere of influence vary between different sized settlements? … … … … … …[3] www.theallpapers.com
Question paper, page 3
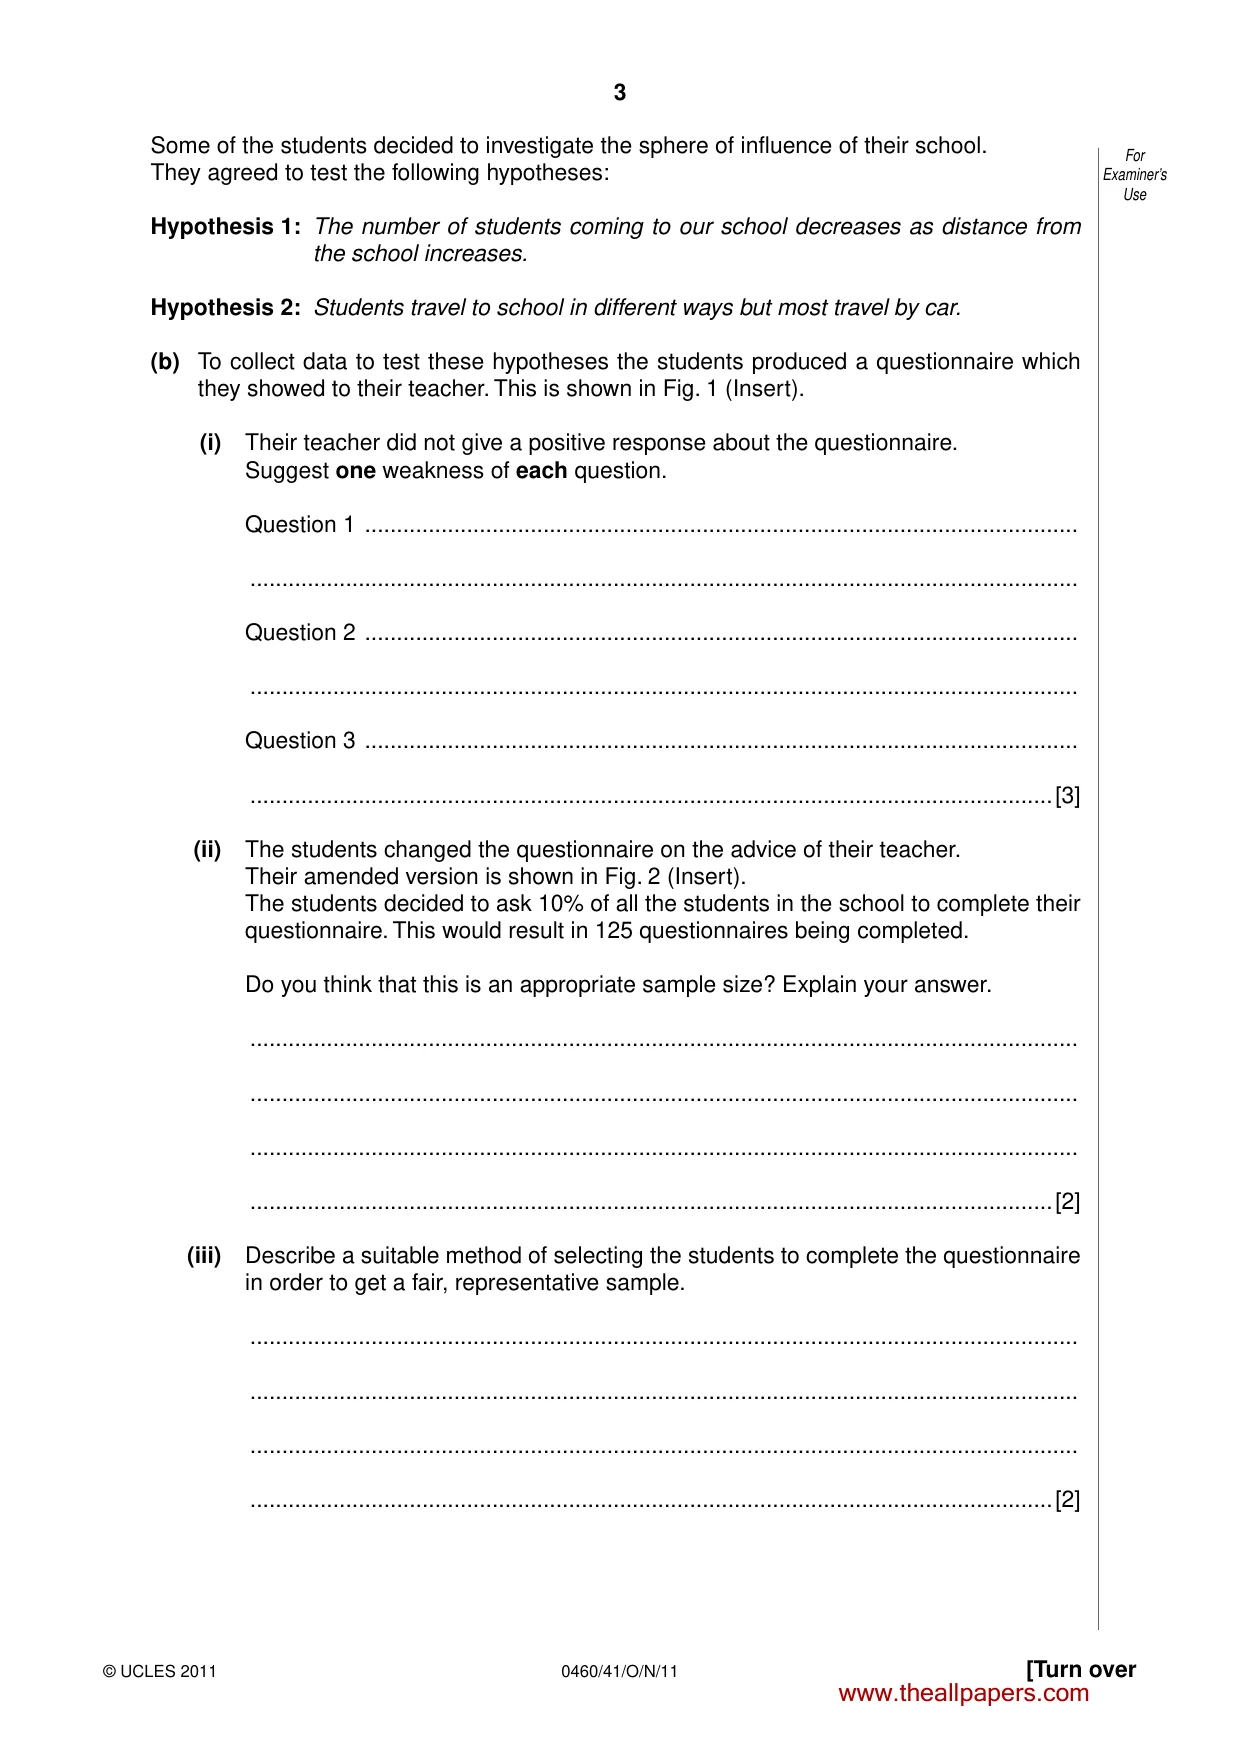
3 0460/41/O/N/11 © UCLES 2011 [Turn over For Examiner’s Use Some of the students decided to investigate the sphere of influence of their school. They agreed to test the following hypotheses: Hypothesis 1: The number of students coming to our school decreases as distance from the school increases. Hypothesis 2: Students travel to school in different ways but most travel by car. (b) To collect data to test these hypotheses the students produced a questionnaire which they showed to their teacher. This is shown in Fig. 1 (Insert). (i) Their teacher did not give a positive response about the questionnaire. Suggest one weakness of each question. Question 1 … … Question 2 … … Question 3 … …[3] (ii) The students changed the questionnaire on the advice of their teacher. Their amended version is shown in Fig. 2 (Insert). The students decided to ask 10% of all the students in the school to complete their questionnaire. This would result in 125 questionnaires being completed. Do you think that this is an appropriate sample size? Explain your answer. … … … …[2] (iii) Describe a suitable method of selecting the students to complete the questionnaire in order to get a fair, representative sample. … … … …[2] www.theallpapers.com
Question paper, page 4
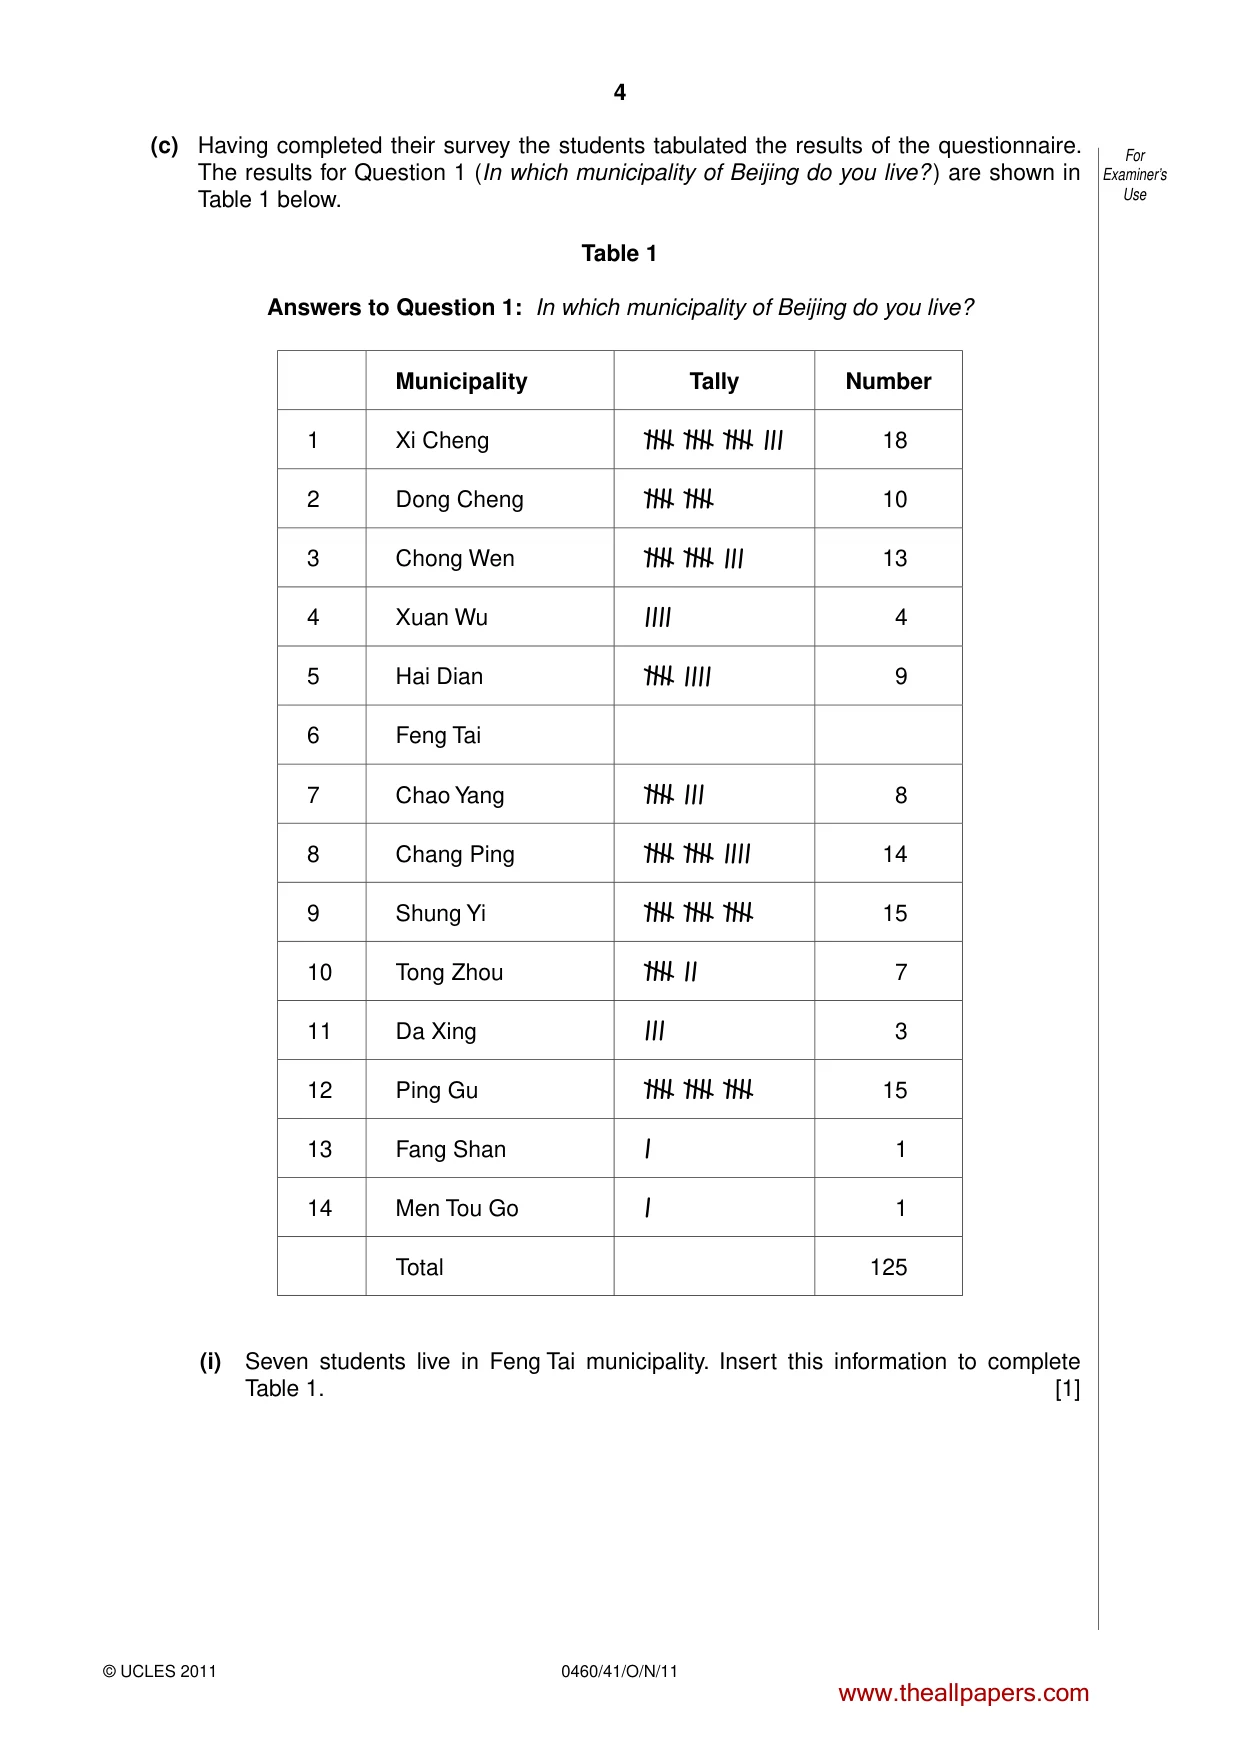
4 0460/41/O/N/11 © UCLES 2011 For Examiner’s Use (c) Having completed their survey the students tabulated the results of the questionnaire. The results for Question 1 (In which municipality of Beijing do you live? ) are shown in Table 1 below. Table 1 Answers to Question 1: In which municipality of Beijing do you live? Municipality Tally Number 1 Xi Cheng llll llll llll lll 18 2 Dong Cheng llll llll 10 3 Chong Wen llll llll lll 13 4 Xuan Wu llll 4 5 Hai Dian llll llll 9 6 Feng Tai 7 Chao Yang llll lll 8 8 Chang Ping llll llll llll 14 9 Shung Yi llll llll llll 15 10 Tong Zhou llll ll 7 11 Da Xing lll 3 12 Ping Gu llll llll llll 15 13 Fang Shan l 1 14 Men Tou Go l 1 Total 125 (i) Seven students live in Feng Tai municipality. Insert this information to complete Table 1. [1] www.theallpapers.com
Question paper, page 5
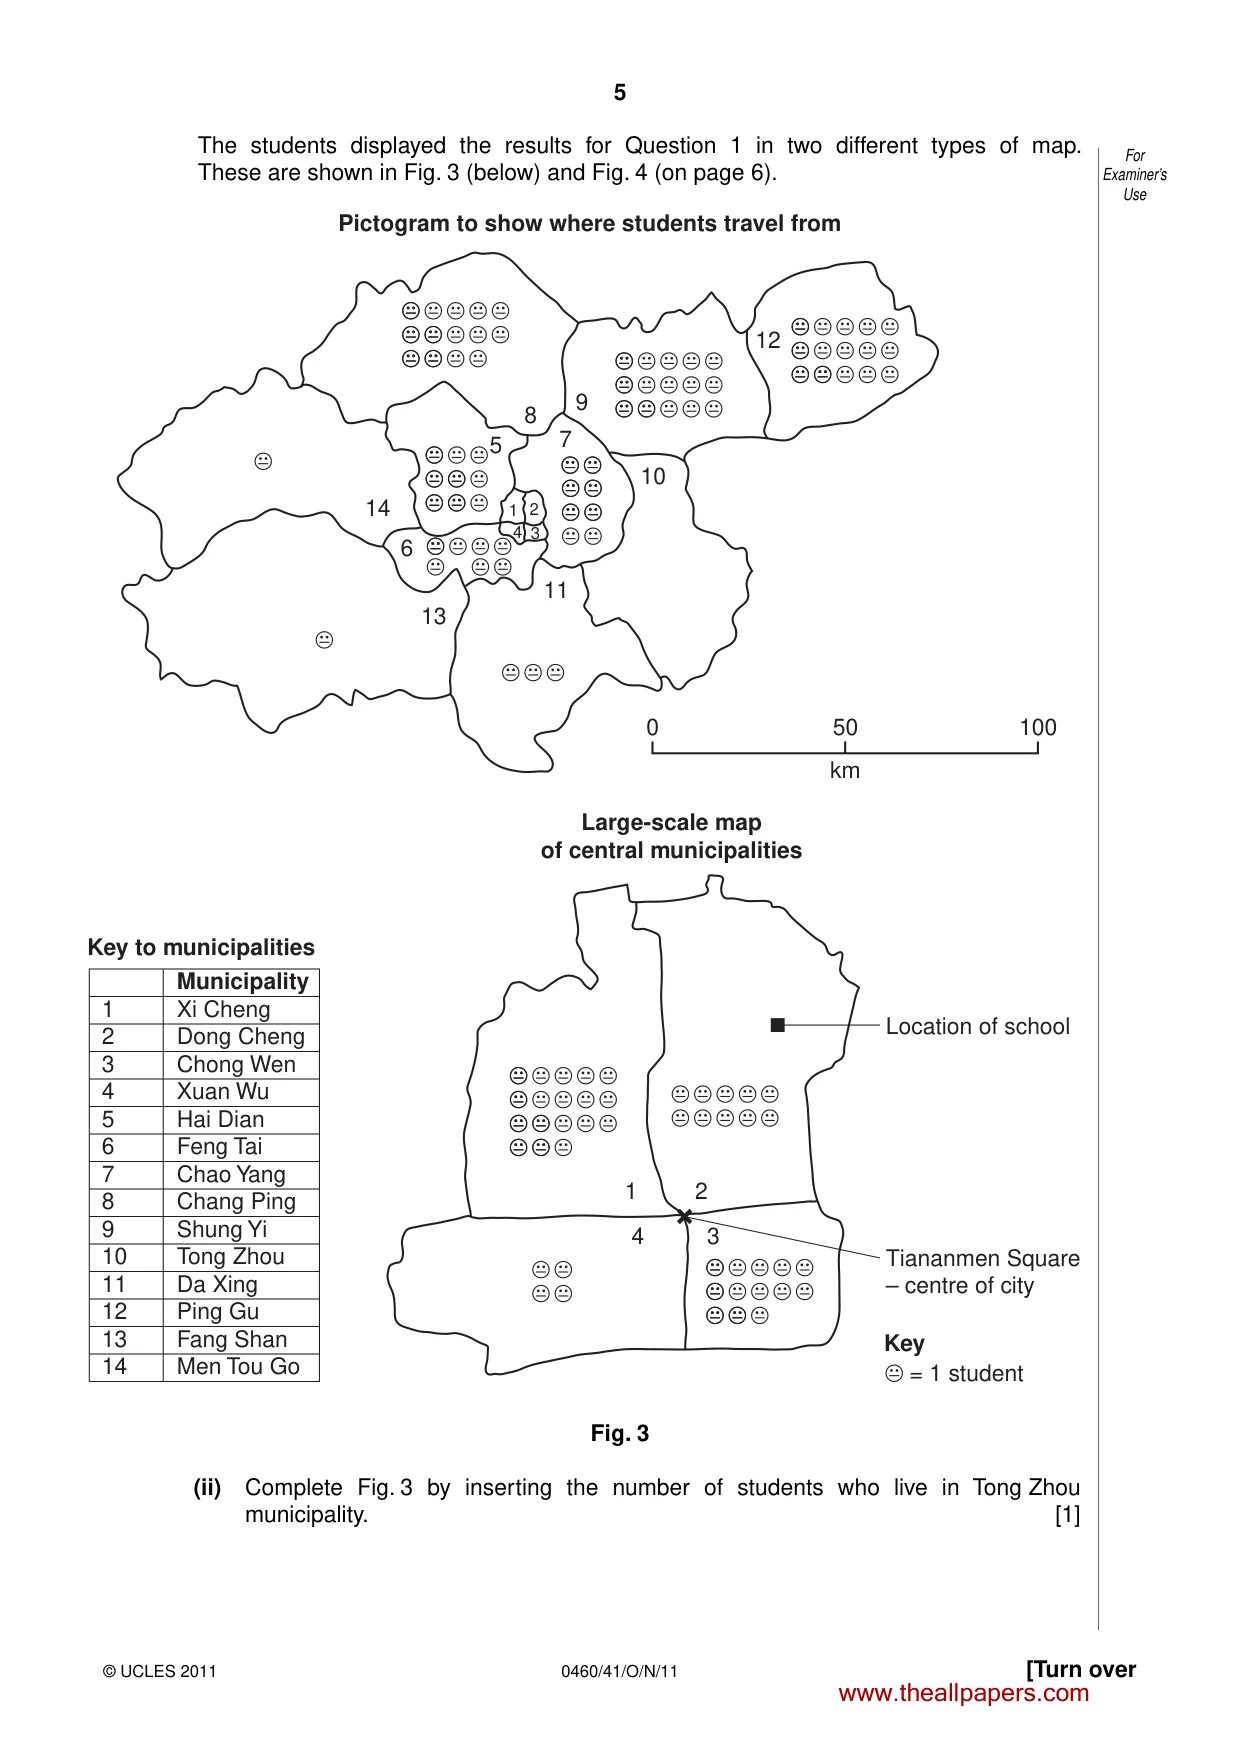
5 0460/41/O/N/11 © UCLES 2011 [Turn over For Examiner’s Use The students displayed the results for Question 1 in two different types of map. These are shown in Fig. 3 (below) and Fig. 4 (on page 6). 14 8 9 12 10 11 13 6 5 7 1 2 3 4 0 50 km Pictogram to show where students travel from Large-scale map of central municipalities Key to municipalities Key Municipality 1 Xi Cheng 2 Dong Cheng 3 Chong Wen 4 Xuan Wu 5 Hai Dian 6 Feng Tai 7 Chao Yang 8 Chang Ping 9 Shung Yi 10 Tong Zhou 11 Da Xing 12 Ping Gu 13 Fang Shan 14 Men Tou Go Location of school Tiananmen Square – centre of city = 1 student 1 2 3 4 100 Fig. 3 (ii) Complete Fig. 3 by inserting the number of students who live in Tong Zhou municipality. [1] www.theallpapers.com
Question paper, page 6
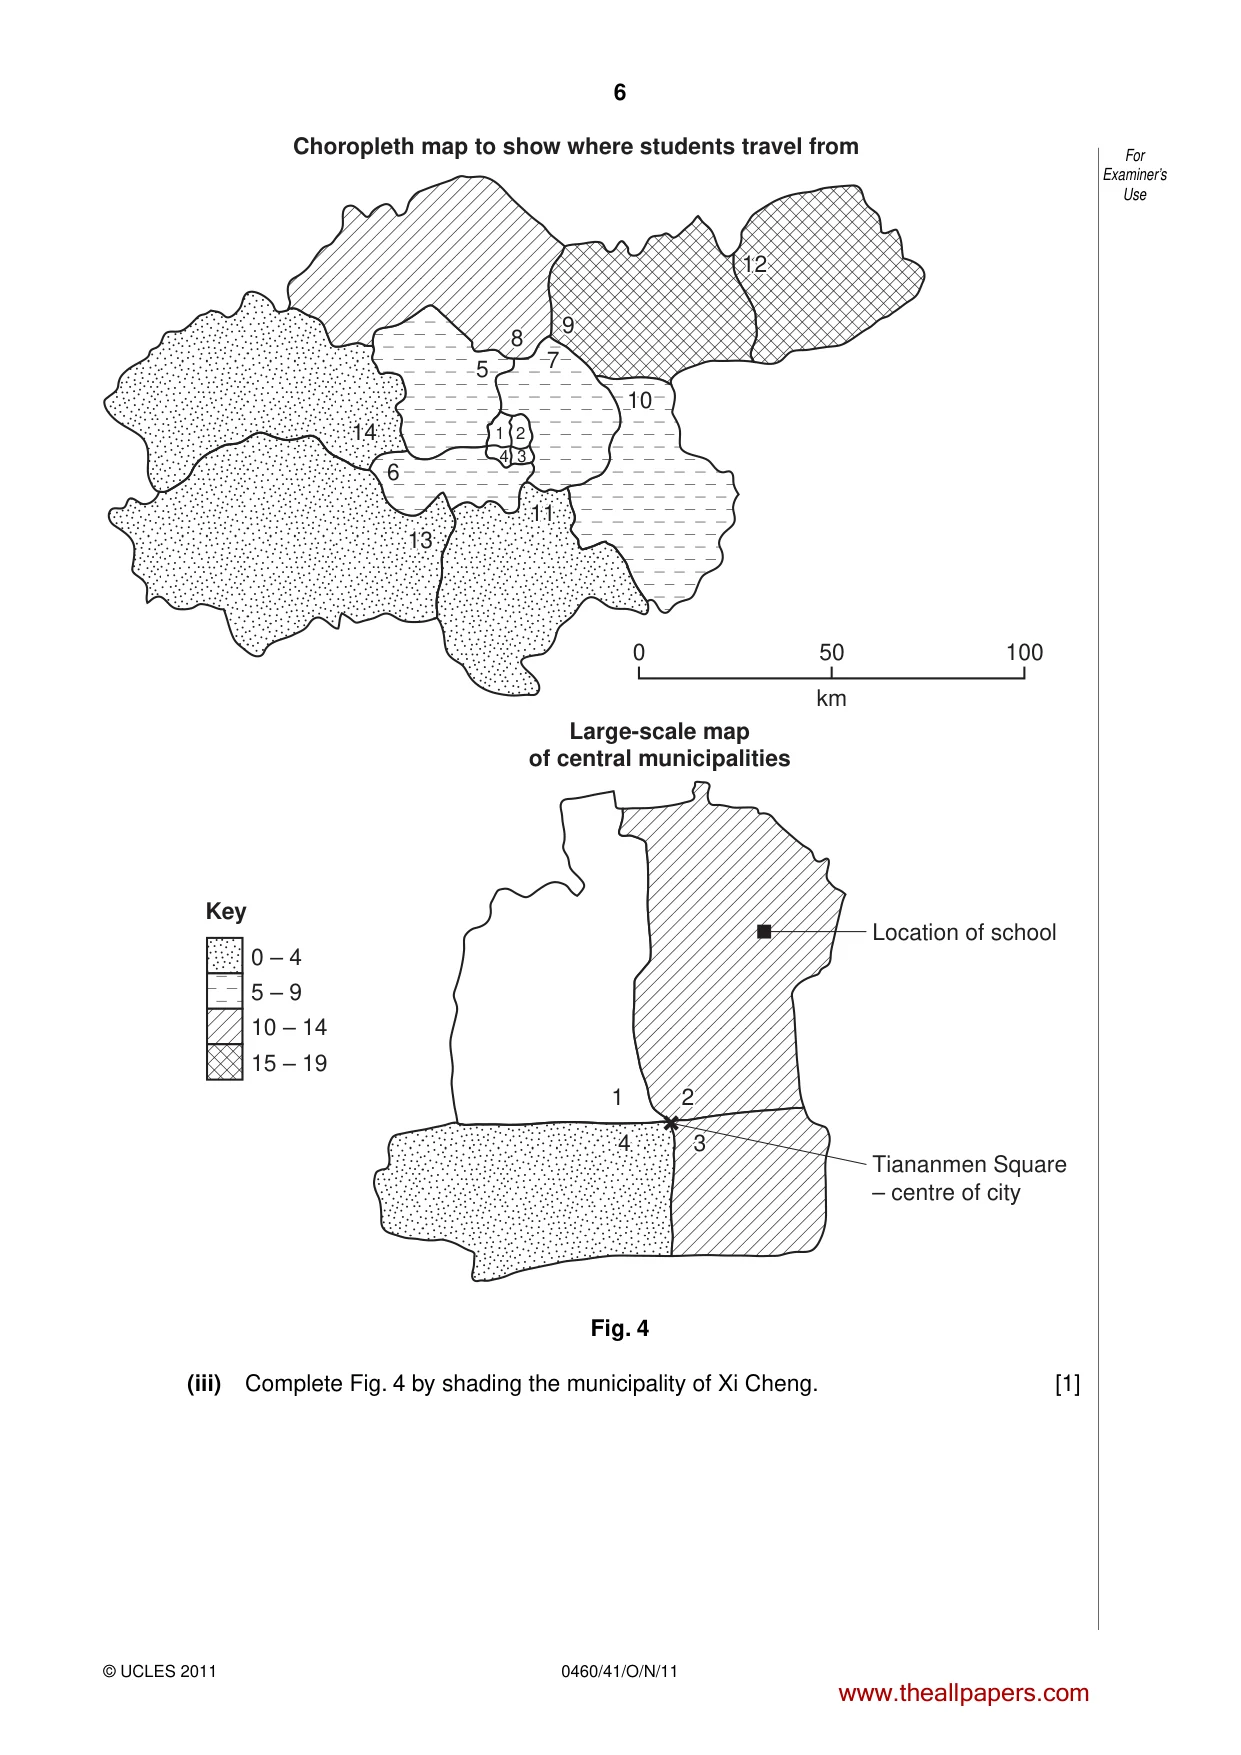
6 0460/41/O/N/11 © UCLES 2011 For Examiner’s Use 14 14 8 9 12 12 10 10 11 11 13 13 5 7 14 8 9 12 10 11 13 6 5 7 1 2 3 4 0 50 km Choropleth map to show where students travel from Large-scale map of central municipalities Location of school Tiananmen Square – centre of city Key 0 – 4 5 – 9 10 – 14 15 – 19 1 2 3 4 2 3 4 100 Fig. 4 (iii) Complete Fig. 4 by shading the municipality of Xi Cheng. [1] www.theallpapers.com
Question paper, page 7
7 0460/41/O/N/11 © UCLES 2011 [Turn over For Examiner’s Use (iv) Give two advantages of each type of map for showing data. Pictogram: Advantage 1: … … Advantage 2: … … Choropleth map: Advantage 1: … … Advantage 2: … …[4] (v) Do you agree with Hypothesis 1: The number of students coming to our school decreases as distance from the school increases? Explain your conclusion and support your answer with data from Figs 3 and 4. … … … … … … … …[4] www.theallpapers.com
Question paper, page 8
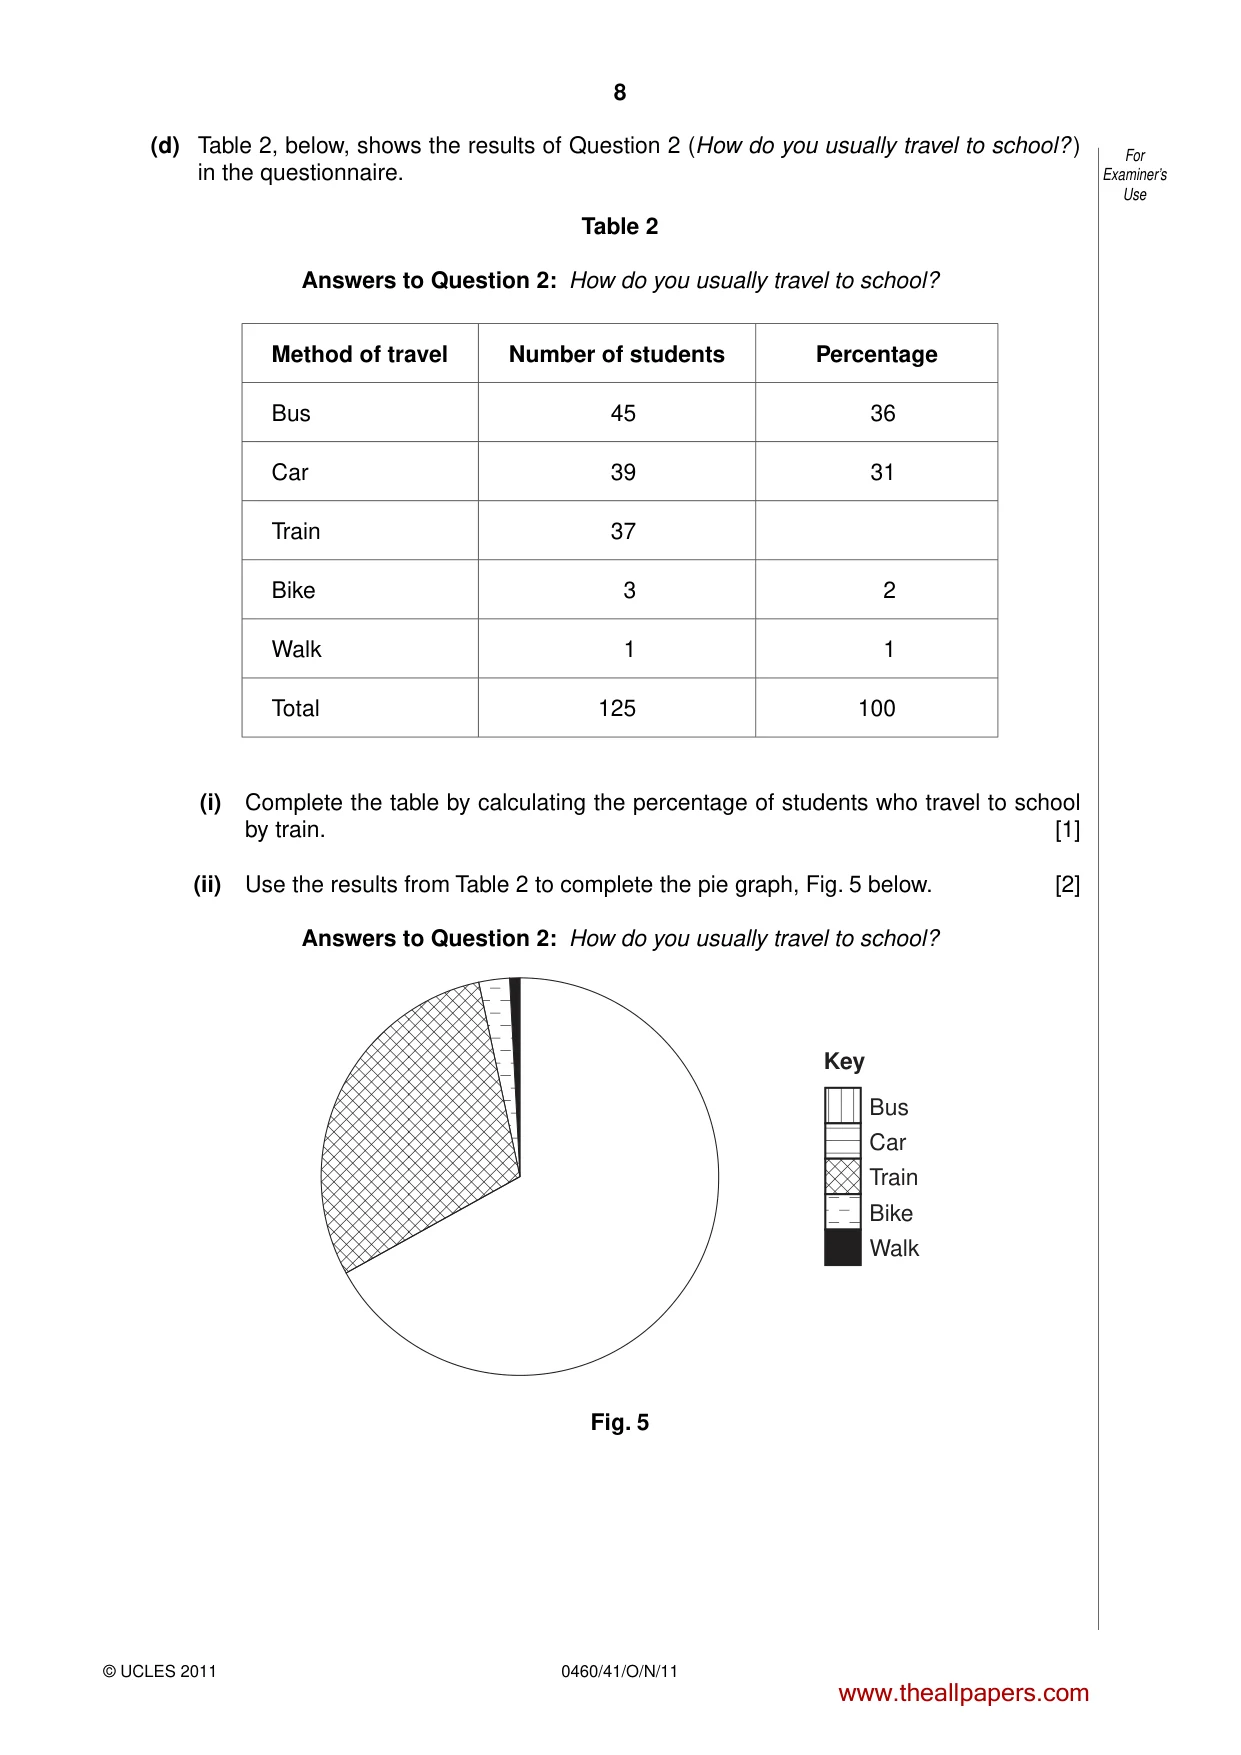
8 0460/41/O/N/11 © UCLES 2011 For Examiner’s Use (d) Table 2, below, shows the results of Question 2 (How do you usually travel to school? ) in the questionnaire. Table 2 Answers to Question 2: How do you usually travel to school? Method of travel Number of students Percentage Bus 45 36 Car 39 31 Train 37 Bike 3 2 Walk 1 1 Total 125 100 (i) Complete the table by calculating the percentage of students who travel to school by train. [1] (ii) Use the results from Table 2 to complete the pie graph, Fig. 5 below. [2] Answers to Question 2: How do you usually travel to school? Key Bus Car Train Bike Walk Fig. 5 www.theallpapers.com
Question paper, page 9
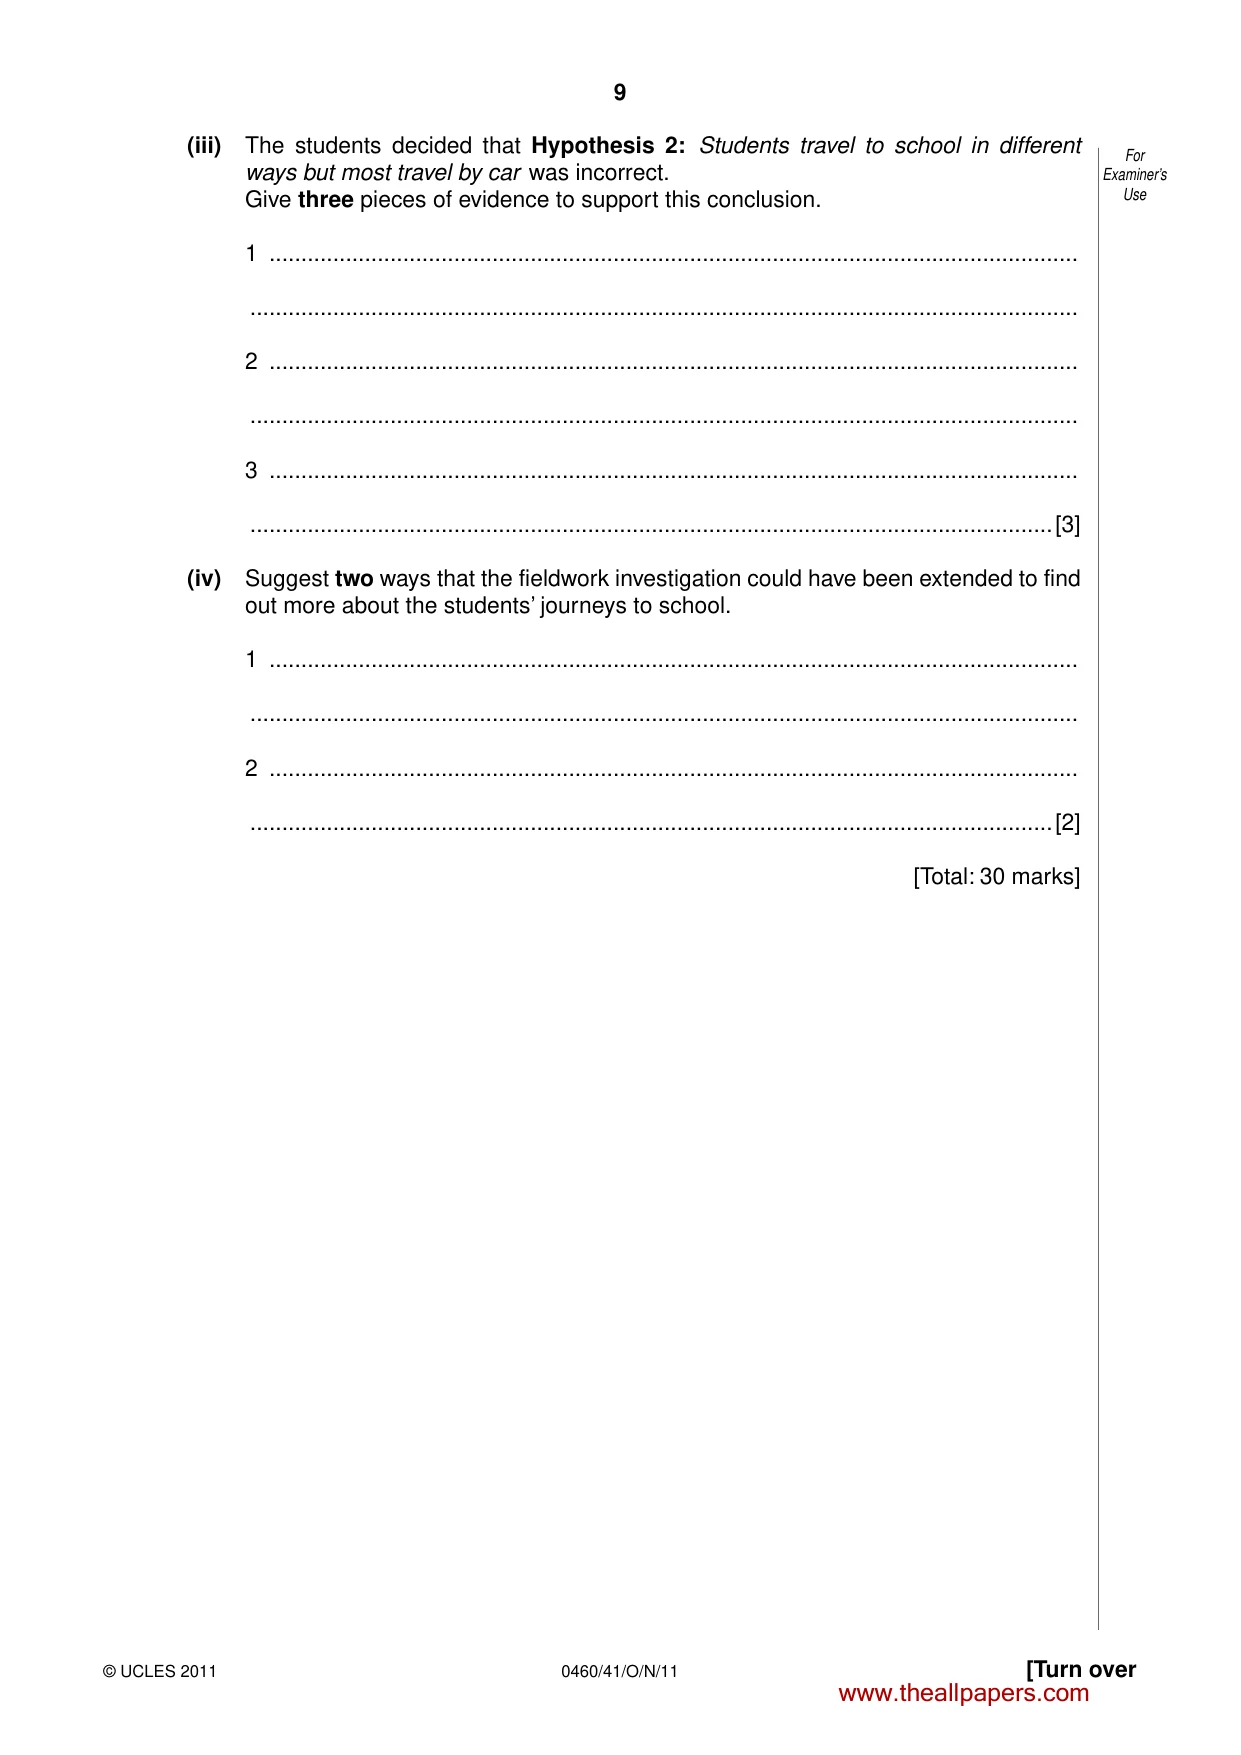
9 0460/41/O/N/11 © UCLES 2011 [Turn over For Examiner’s Use (iii) The students decided that Hypothesis 2: Students travel to school in different ways but most travel by car was incorrect. Give three pieces of evidence to support this conclusion. 1 … … 2 … … 3 … …[3] (iv) Suggest two ways that the fieldwork investigation could have been extended to find out more about the students’ journeys to school. 1 … … 2 … …[2] [Total: 30 marks] www.theallpapers.com
Question paper, page 10
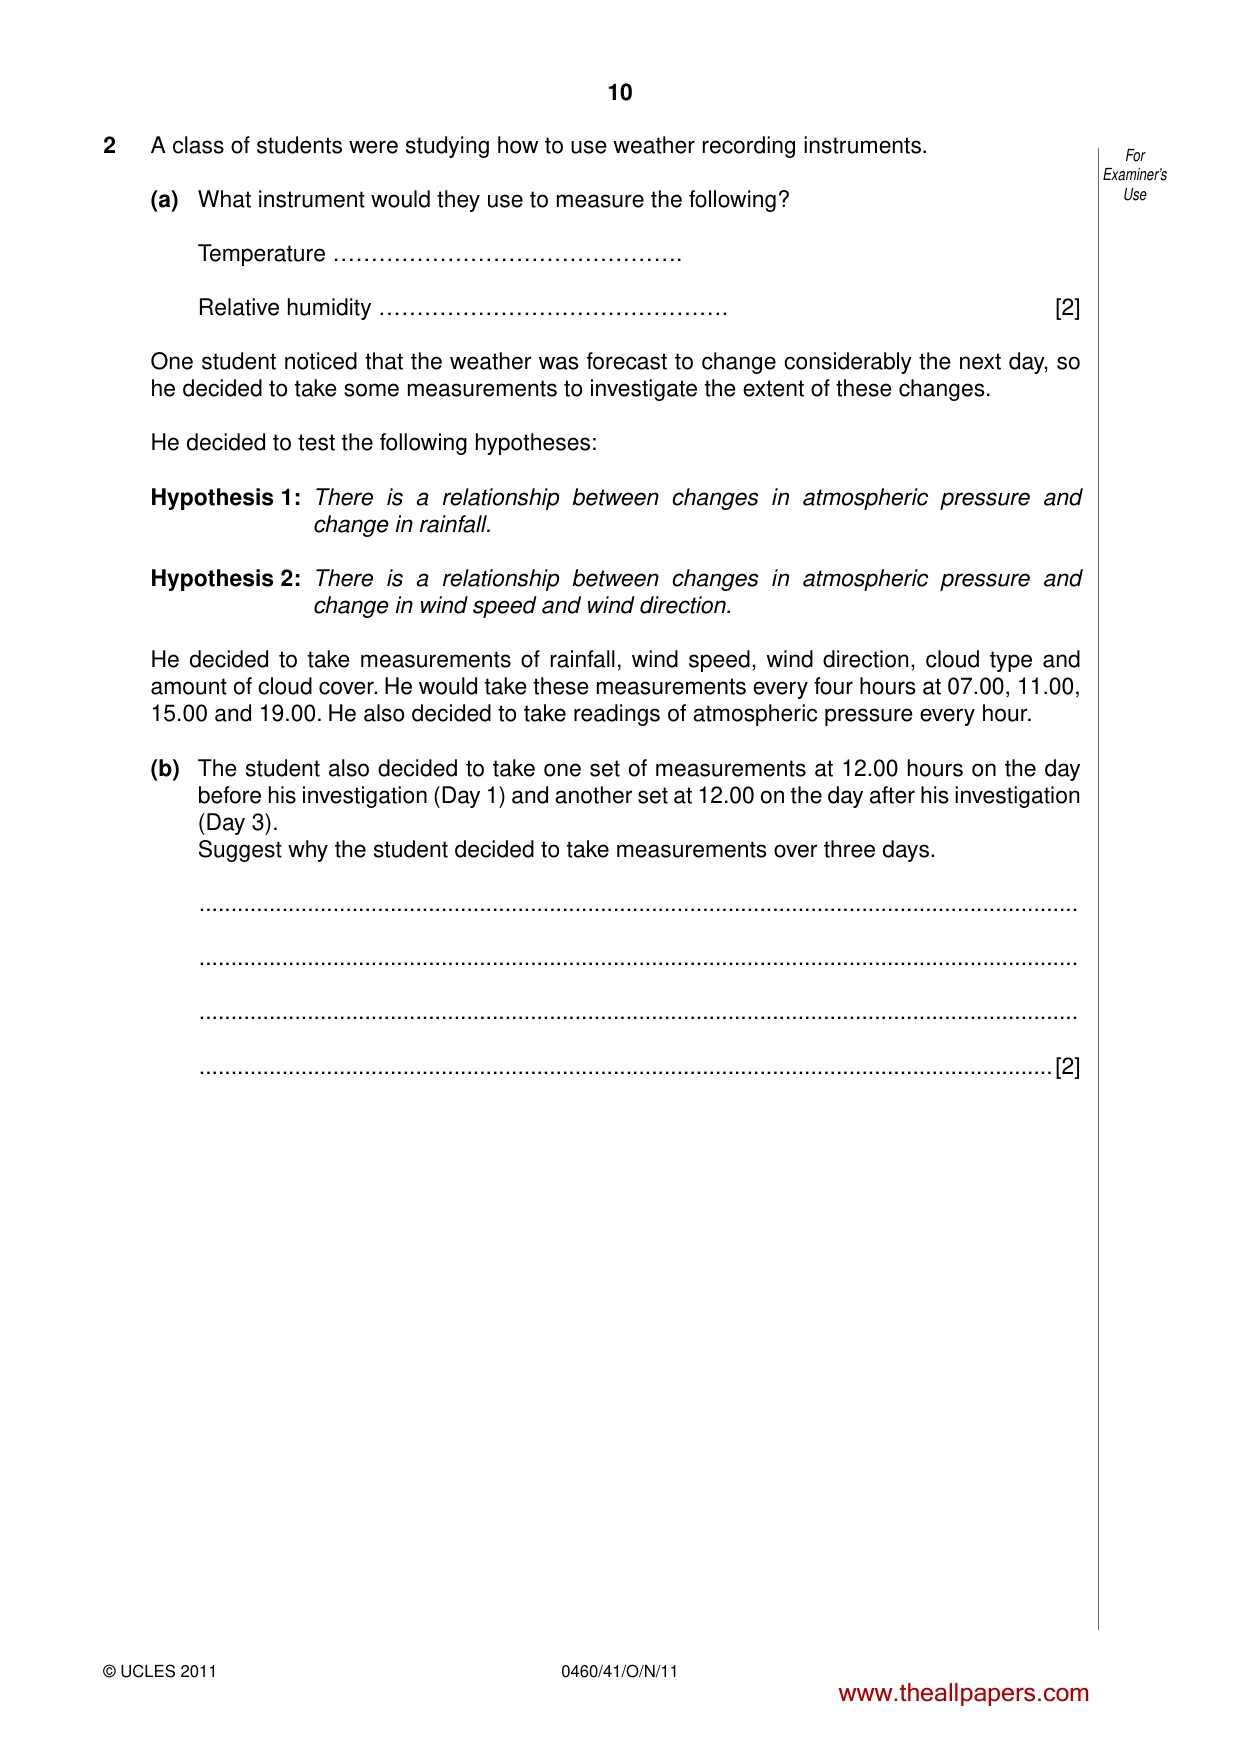
10 0460/41/O/N/11 © UCLES 2011 For Examiner’s Use 2 A class of students were studying how to use weather recording instruments. (a) What instrument would they use to measure the following? Temperature ………………………………………. Relative humidity ………………………………………. [2] One student noticed that the weather was forecast to change considerably the next day, so he decided to take some measurements to investigate the extent of these changes. He decided to test the following hypotheses: Hypothesis 1: There is a relationship between changes in atmospheric pressure and change in rainfall. Hypothesis 2: There is a relationship between changes in atmospheric pressure and change in wind speed and wind direction. He decided to take measurements of rainfall, wind speed, wind direction, cloud type and amount of cloud cover. He would take these measurements every four hours at 07.00, 11.00, 15.00 and 19.00. He also decided to take readings of atmospheric pressure every hour. (b) The student also decided to take one set of measurements at 12.00 hours on the day before his investigation (Day 1) and another set at 12.00 on the day after his investigation (Day 3). Suggest why the student decided to take measurements over three days. … … … …[2] www.theallpapers.com
Question paper, page 11
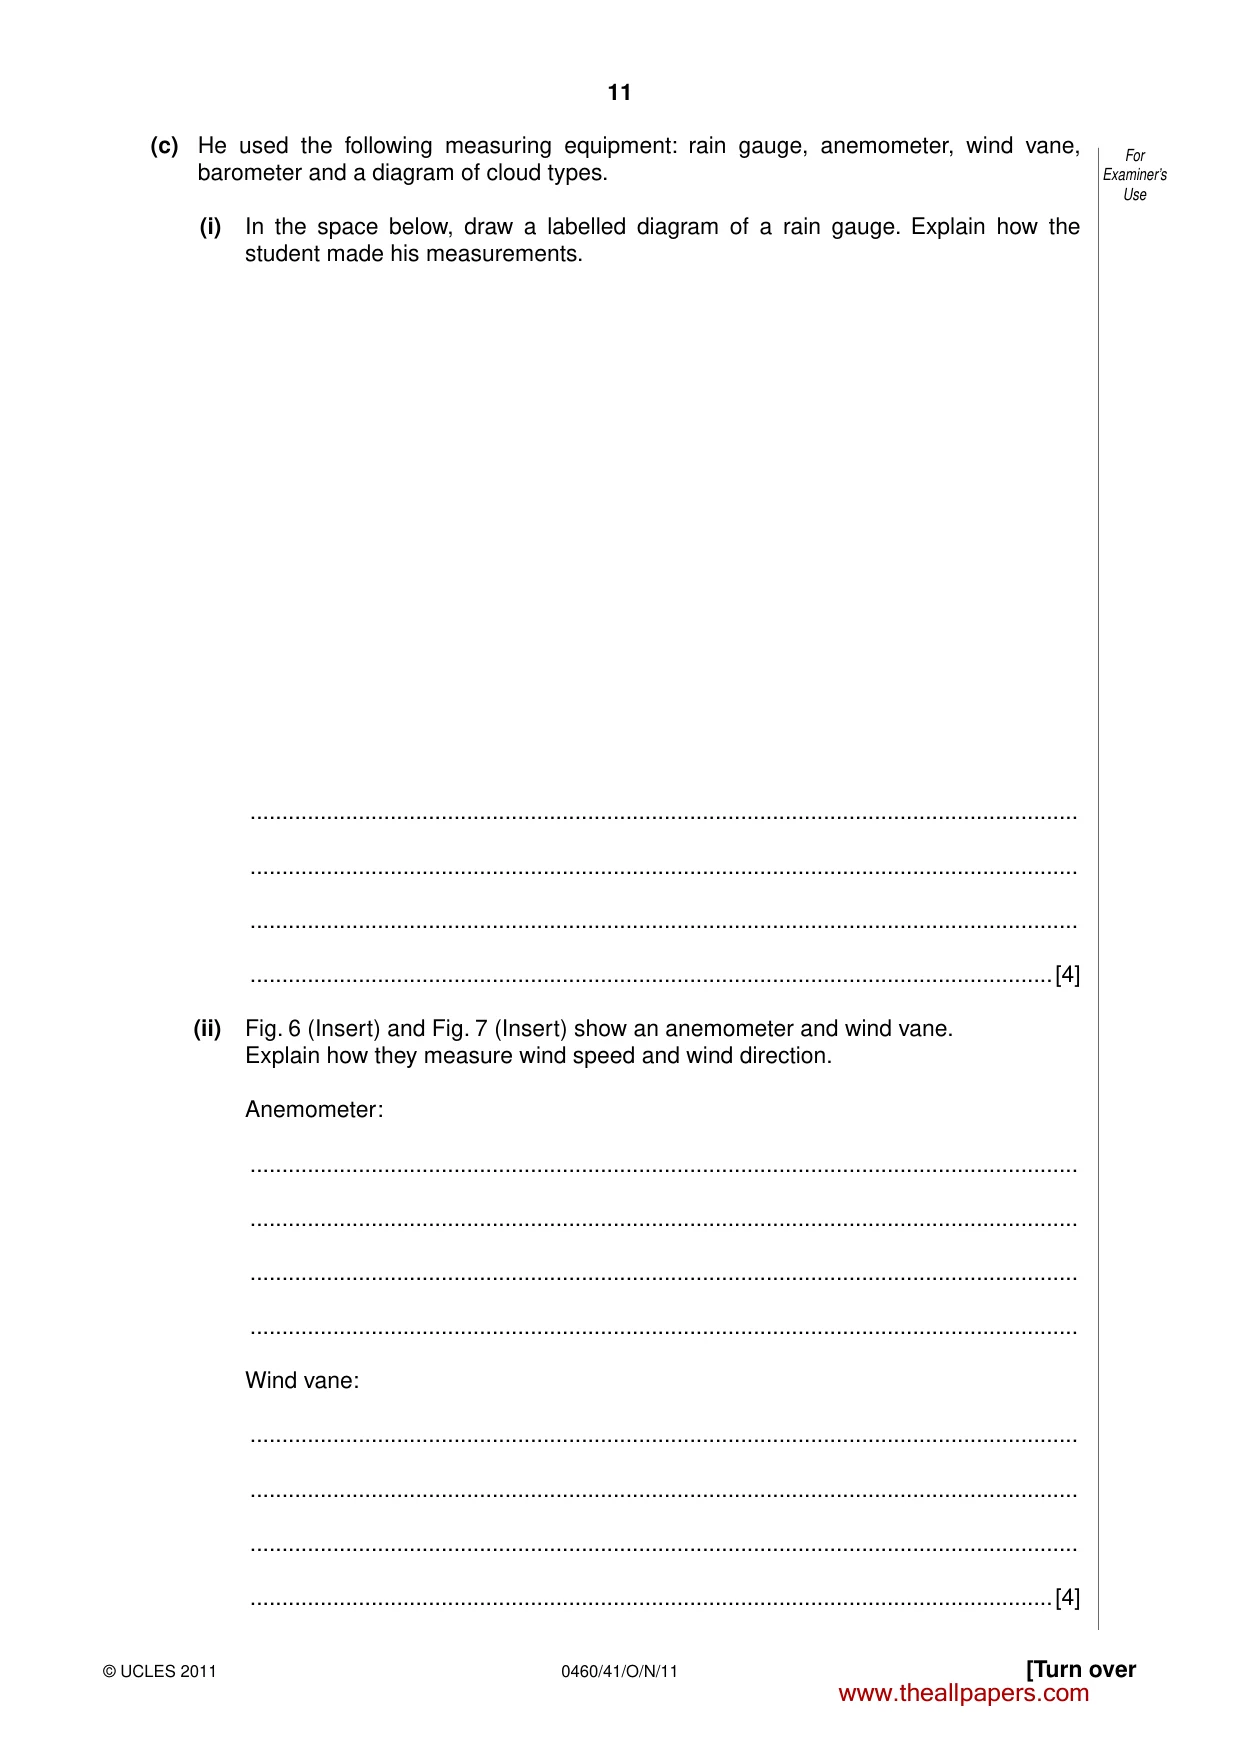
11 0460/41/O/N/11 © UCLES 2011 [Turn over For Examiner’s Use (c) He used the following measuring equipment: rain gauge, anemometer, wind vane, barometer and a diagram of cloud types. (i) In the space below, draw a labelled diagram of a rain gauge. Explain how the student made his measurements. … … … …[4] (ii) Fig. 6 (Insert) and Fig. 7 (Insert) show an anemometer and wind vane. Explain how they measure wind speed and wind direction. Anemometer: … … … … Wind vane: … … … …[4] www.theallpapers.com
Question paper, page 12
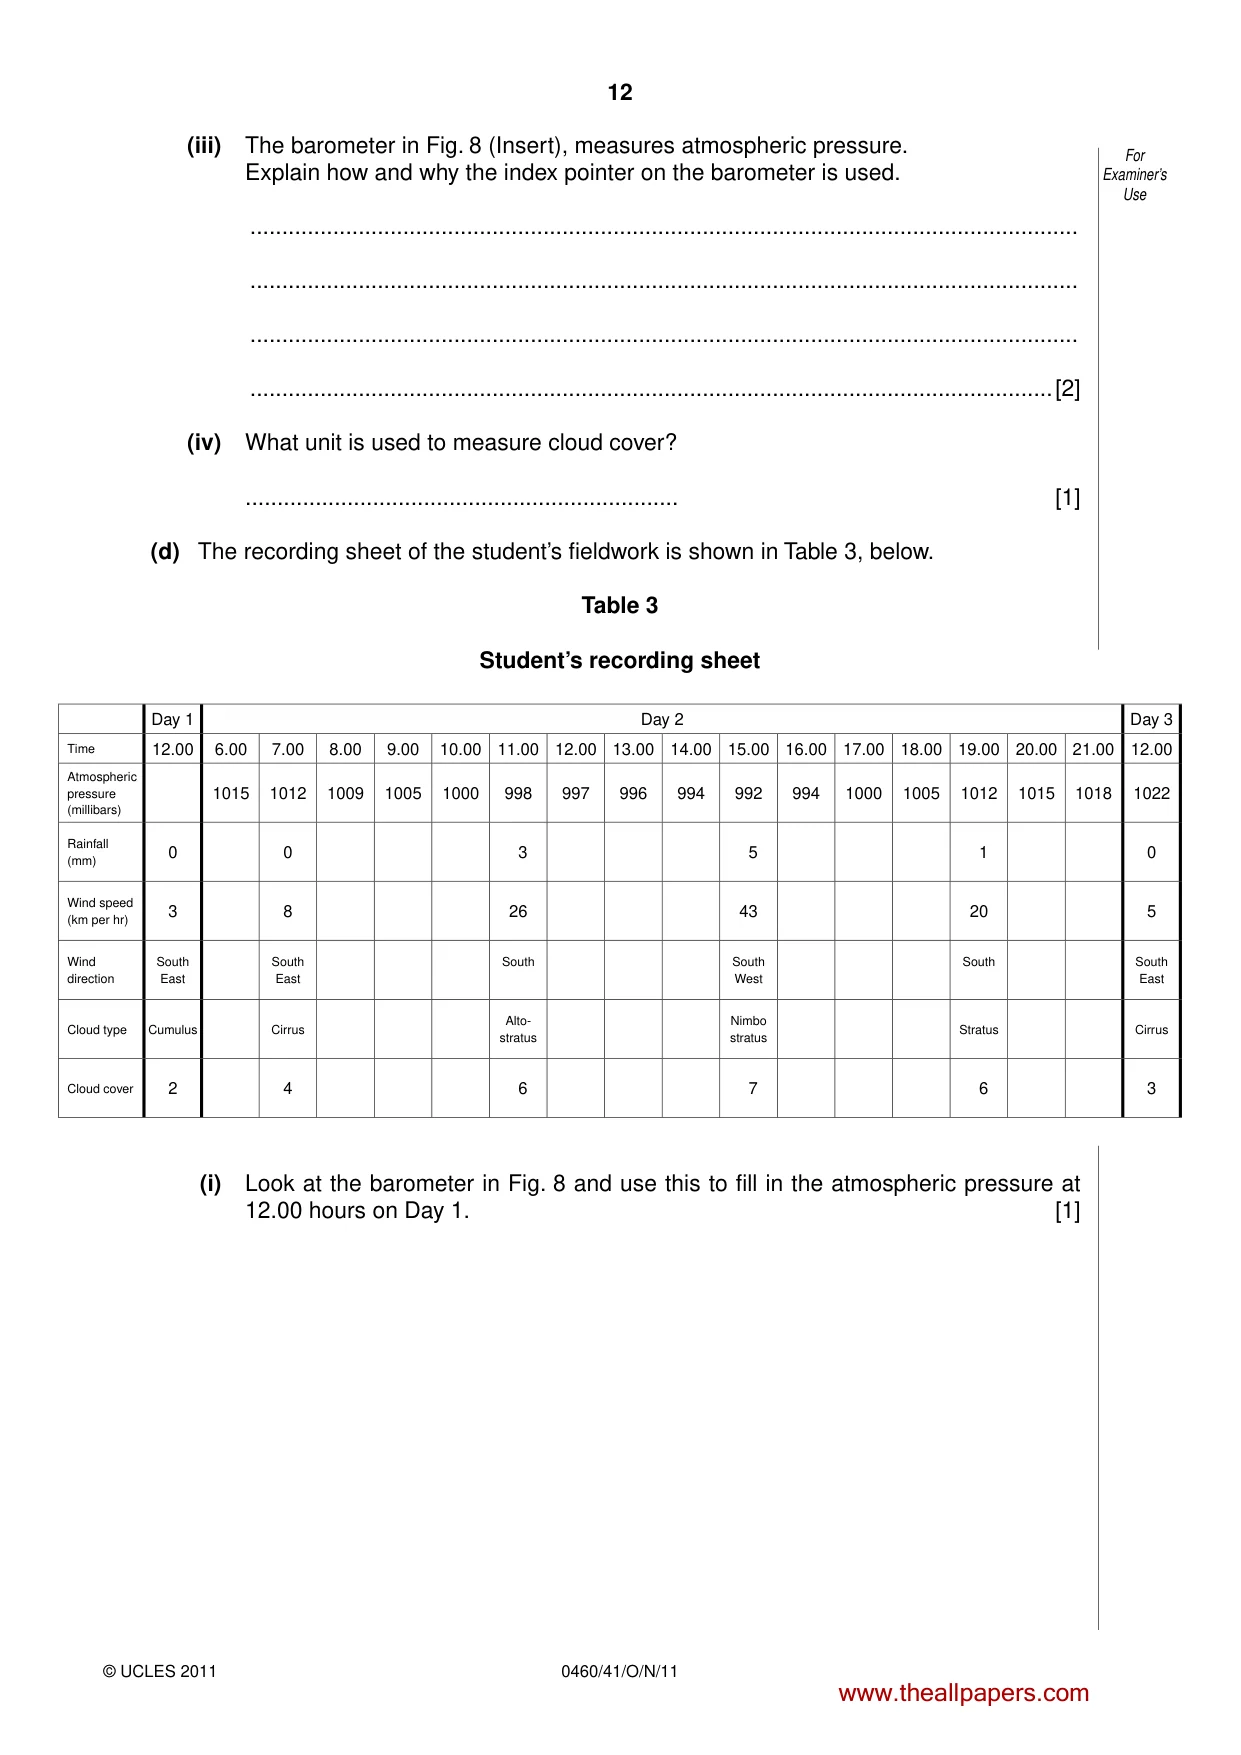
12 0460/41/O/N/11 © UCLES 2011 For Examiner’s Use (iii) The barometer in Fig. 8 (Insert), measures atmospheric pressure. Explain how and why the index pointer on the barometer is used. … … … …[2] (iv) What unit is used to measure cloud cover? … [1] (d) The recording sheet of the student’s fieldwork is shown in Table 3, below. Table 3 Student’s recording sheet Day 1 Day 2 Day 3 Time 12.00 6.00 7.00 8.00 9.00 10.00 11.00 12.00 13.00 14.00 15.00 16.00 17.00 18.00 19.00 20.00 21.00 12.00 Atmospheric pressure (millibars) 1015 1012 1009 1005 1000 998 997 996 994 992 994 1000 1005 1012 1015 1018 1022 Rainfall (mm) 0 0 3 5 1 0 Wind speed (km per hr) 3 8 26 43 20 5 Wind direction South East South East South South West South South East Cloud type Cumulus Cirrus Alto- stratus Nimbo stratus Stratus Cirrus Cloud cover 2 4 6 7 6 3 (i) Look at the barometer in Fig. 8 and use this to fill in the atmospheric pressure at 12.00 hours on Day 1. [1] www.theallpapers.com
Question paper, page 13
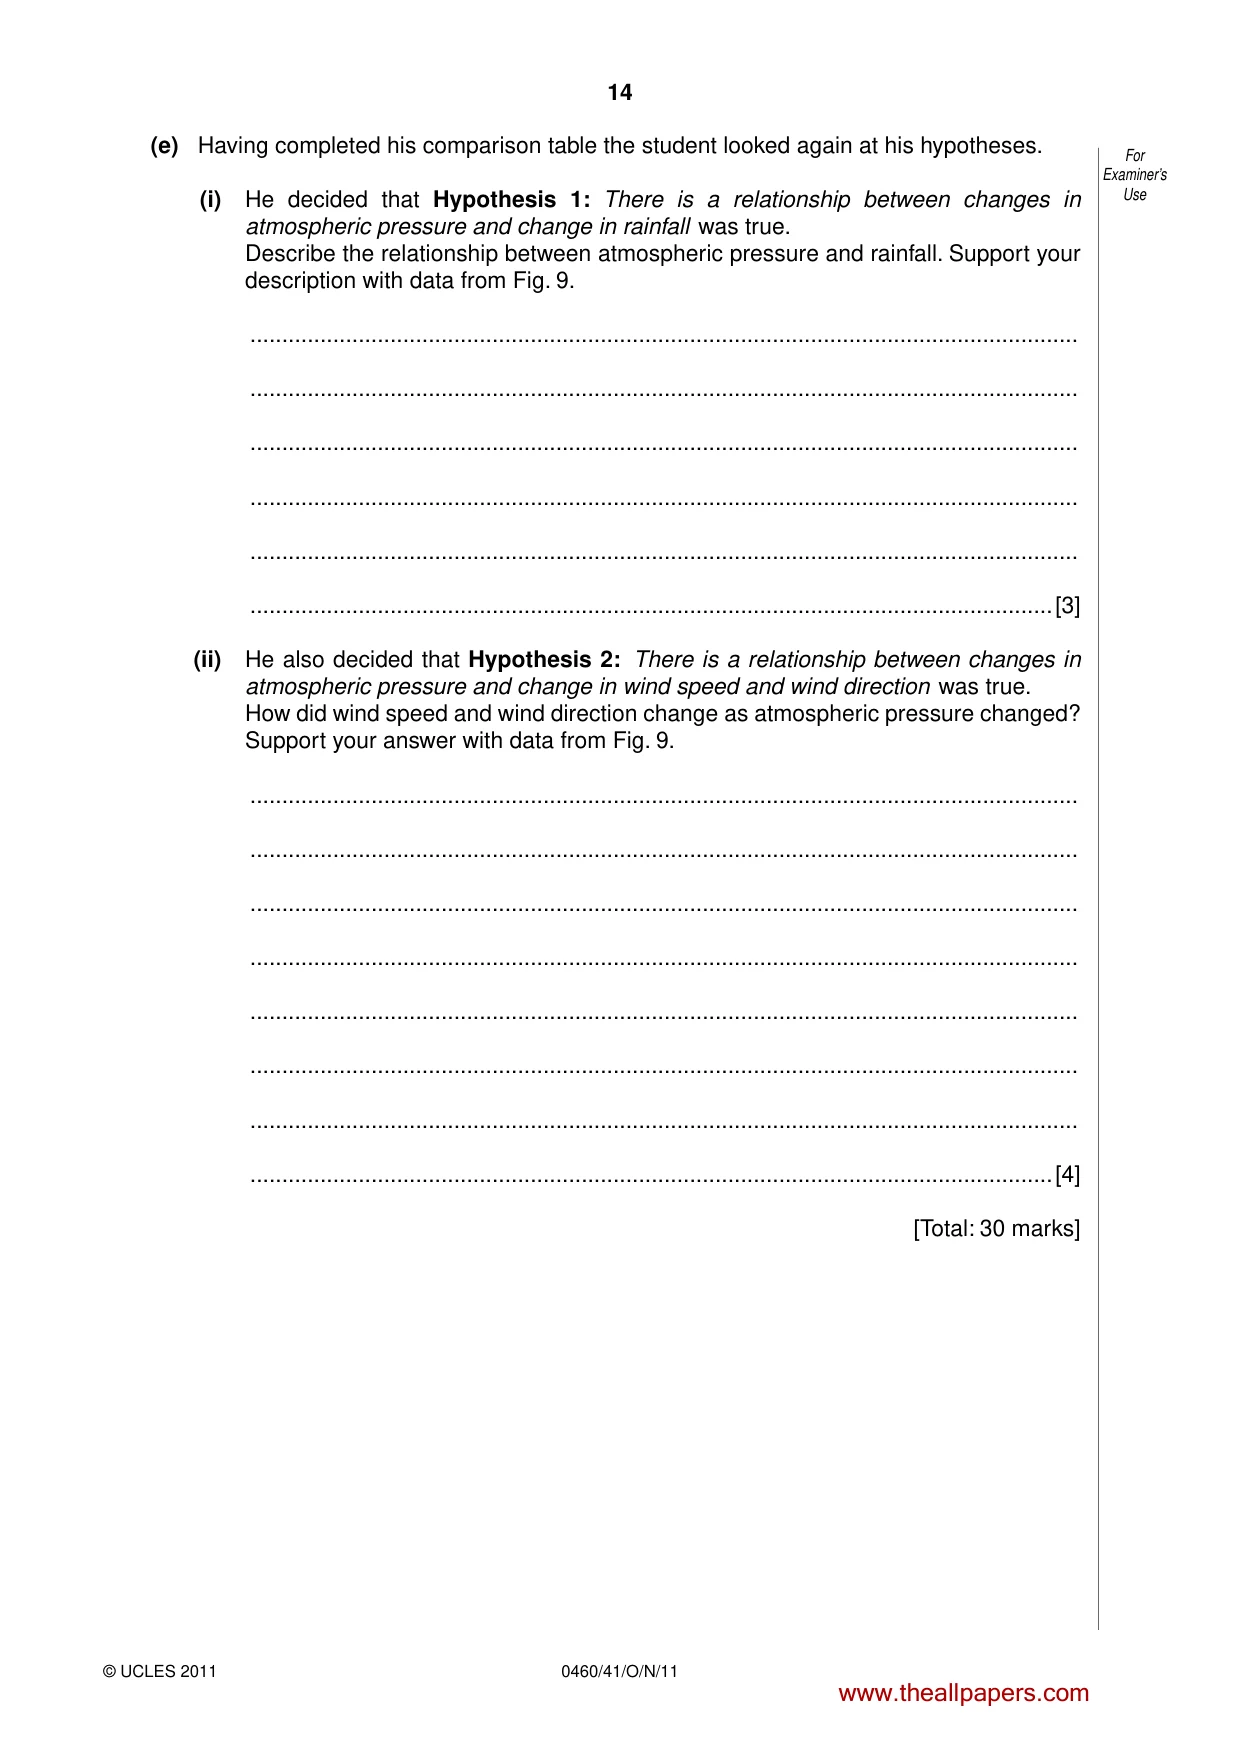
13 0460/41/O/N/11 © UCLES 2011 [Turn over For Examiner’s Use Fig. 9, below, is a summary of the student’s fieldwork. Summary of the student’s fieldwork 990 1000 1010 1020 Atmospheric pressure (millibars – mb) Atmospheric pressure (millibars – mb) 1030 12.00 06.00 07.00 08.00 09.00 10.00 11.00 12.00 13.00 14.00 15.00 16.00 17.00 18.00 19.00 20.00 21.00 12.00 Day 1 Day 3 Day 2 990 1000 1010 1020 1030 0 None None None None None None None N NW W Wind direction and wind speed 1 mm = 2 km per hour Wind direction and wind speed 1 mm = 2 km per hour Cloud type Cloud cover 12.00 Day 1 Day 2 Cloud type Cloud cover E SW NE SE S N NW W E SW NE SE S N NW W E SW NE SE N NW W E NE SE S N NW W E SW NE SE S N NW W E SW NE SE S None None 3 2 1 5 4 Rainfall (mm) Rainfall (mm) 0 3 2 1 4 5 07.00 11.00 19.00 12.00 Day 3 15.00 Fig. 9 Use information from Table 3 to complete the following tasks on Fig. 9. (ii) Draw the rainfall bar at 11.00 hours on Day 2. [1] (iii) Complete the atmospheric pressure line graph at 19.00, 20.00 and 21.00 hours on Day 2. [2] (iv) Draw in the wind direction and speed on the rose diagram at 19.00 hours on Day 2. [2] (v) Draw in the cloud type at 12.00 on Day 1. [1] (vi) Plot the cloud cover at 15.00 hours on Day 2. [1] www.theallpapers.com
Question paper, page 14
14 0460/41/O/N/11 © UCLES 2011 For Examiner’s Use (e) Having completed his comparison table the student looked again at his hypotheses. (i) He decided that Hypothesis 1: There is a relationship between changes in atmospheric pressure and change in rainfall was true. Describe the relationship between atmospheric pressure and rainfall. Support your description with data from Fig. 9. … … … … … …[3] (ii) He also decided that Hypothesis 2: There is a relationship between changes in atmospheric pressure and change in wind speed and wind direction was true. How did wind speed and wind direction change as atmospheric pressure changed? Support your answer with data from Fig. 9. … … … … … … … …[4] [Total: 30 marks] www.theallpapers.com
Question paper, page 15
15 0460/41/O/N/11 © UCLES 2011 BLANK PAGE www.theallpapers.com
Question paper, page 16
16 0460/41/O/N/11 © UCLES 2011 BLANK PAGE Permission to reproduce items where third-party owned material protected by copyright is included has been sought and cleared where possible. Every reasonable effort has been made by the publisher (UCLES) to trace copyright holders, but if any items requiring clearance have unwittingly been included, the publisher will be pleased to make amends at the earliest possible opportunity. University of Cambridge International Examinations is part of the Cambridge Assessment Group. Cambridge Assessment is the brand name of University of Cambridge Local Examinations Syndicate (UCLES), which is itself a department of the University of Cambridge. www.theallpapers.com
Mark scheme, page 1
UNIVERSITY OF CAMBRIDGE INTERNATIONAL EXAMINATIONS International General Certificate of Secondary Education MARK SCHEME for the October/November 2011 question paper for the guidance of teachers 0460 GEOGRAPHY 0460/41 Paper 4 (Alternative to Coursework), maximum raw mark 60 This mark scheme is published as an aid to teachers and candidates, to indicate the requirements of the examination. It shows the basis on which Examiners were instructed to award marks. It does not indicate the details of the discussions that took place at an Examiners’ meeting before marking began, which would have considered the acceptability of alternative answers. Mark schemes must be read in conjunction with the question papers and the report on the examination. • Cambridge will not enter into discussions or correspondence in connection with these mark schemes. Cambridge is publishing the mark schemes for the October / November 2011 question papers for most IGCSE, GCE Advanced Level and Advanced Subsidiary Level syllabuses and some Ordinary Level syllabuses. www.theallpapers.com
Mark scheme, page 2
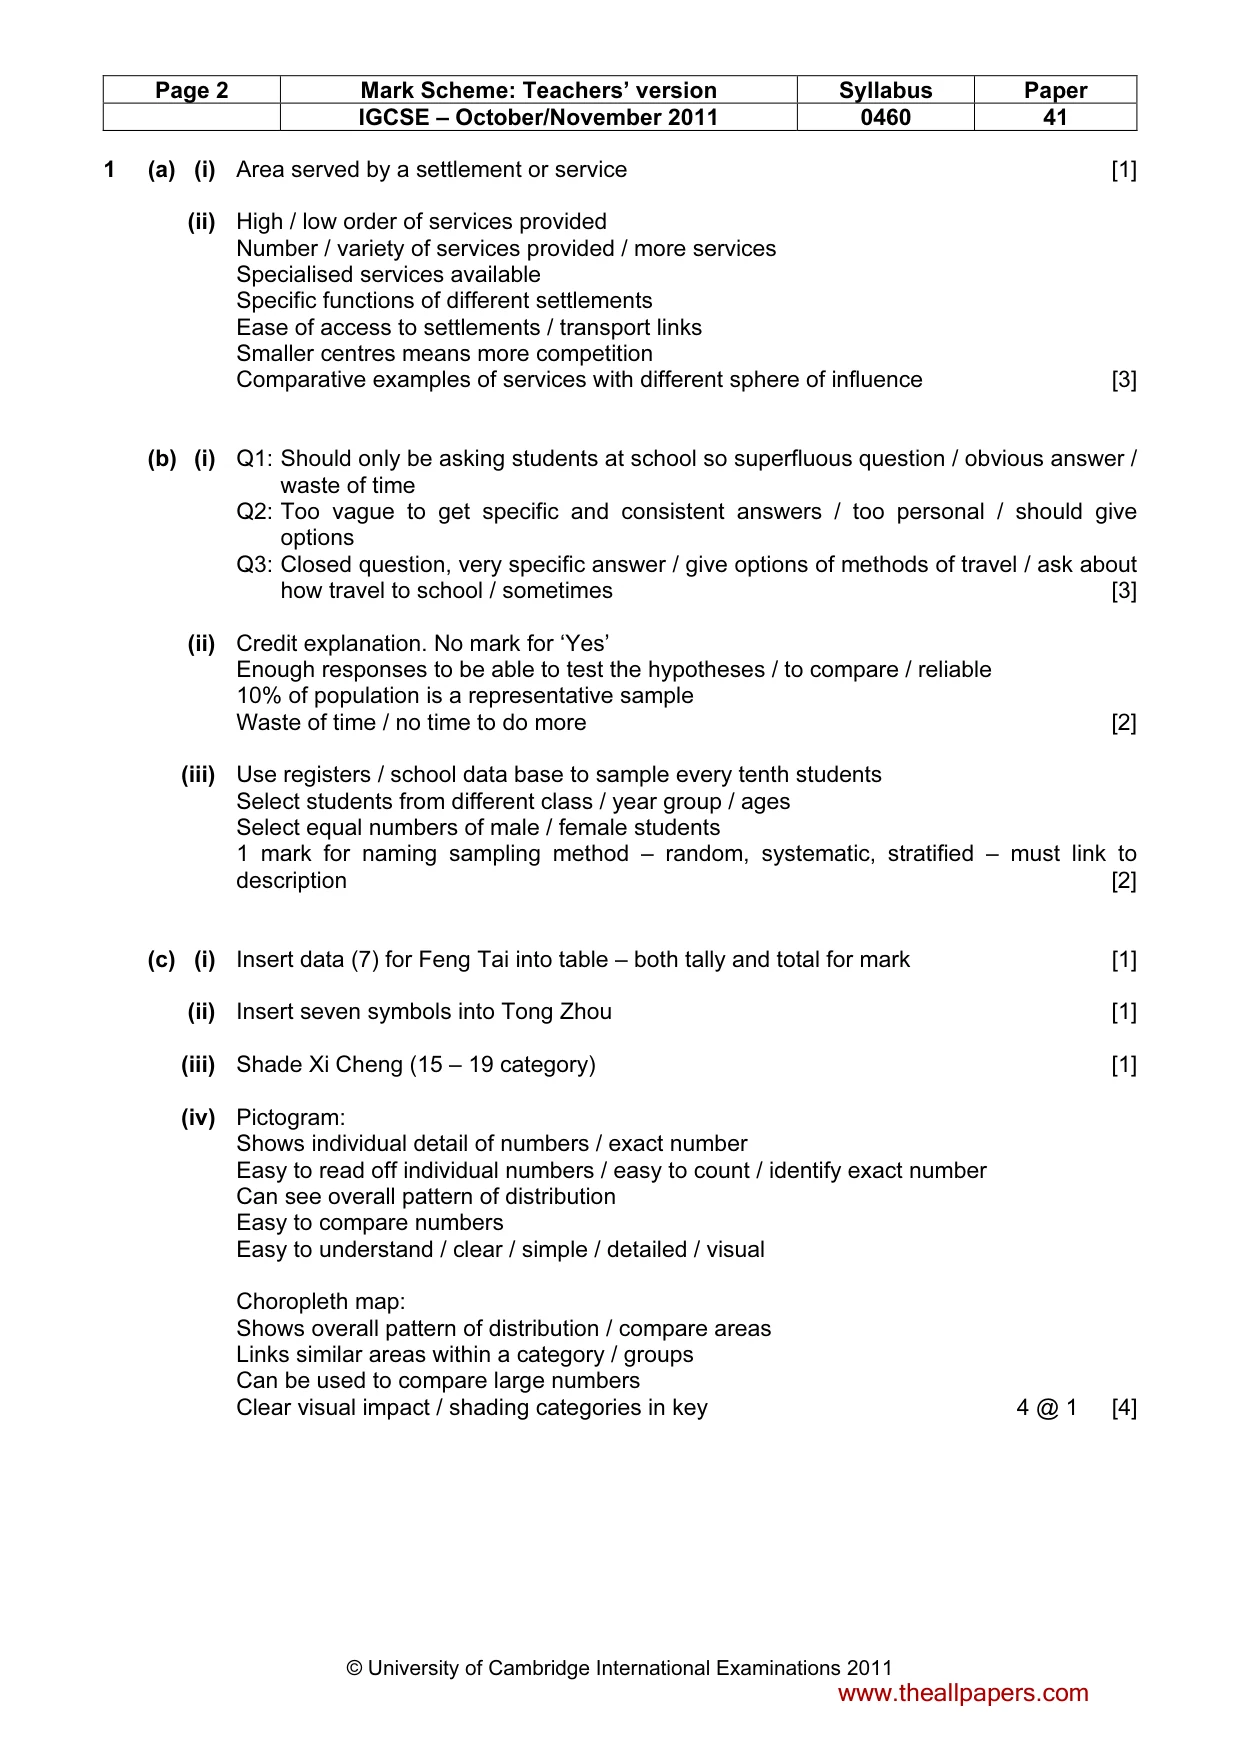
Page 2 Mark Scheme: Teachers’ version Syllabus Paper IGCSE – October/November 2011 0460 41 © University of Cambridge International Examinations 2011 1 (a) (i) Area served by a settlement or service [1] (ii) High / low order of services provided Number / variety of services provided / more services Specialised services available Specific functions of different settlements Ease of access to settlements / transport links Smaller centres means more competition Comparative examples of services with different sphere of influence [3] (b) (i) Q1: Should only be asking students at school so superfluous question / obvious answer / waste of time Q2: Too vague to get specific and consistent answers / too personal / should give options Q3: Closed question, very specific answer / give options of methods of travel / ask about how travel to school / sometimes [3] (ii) Credit explanation. No mark for ‘Yes’ Enough responses to be able to test the hypotheses / to compare / reliable 10% of population is a representative sample Waste of time / no time to do more [2] (iii) Use registers / school data base to sample every tenth students Select students from different class / year group / ages Select equal numbers of male / female students 1 mark for naming sampling method – random, systematic, stratified – must link to description [2] (c) (i) Insert data (7) for Feng Tai into table – both tally and total for mark [1] (ii) Insert seven symbols into Tong Zhou [1] (iii) Shade Xi Cheng (15 – 19 category) [1] (iv) Pictogram: Shows individual detail of numbers / exact number Easy to read off individual numbers / easy to count / identify exact number Can see overall pattern of distribution Easy to compare numbers Easy to understand / clear / simple / detailed / visual Choropleth map: Shows overall pattern of distribution / compare areas Links similar areas within a category / groups Can be used to compare large numbers Clear visual impact / shading categories in key 4 @ 1 [4] www.theallpapers.com
Mark scheme, page 3
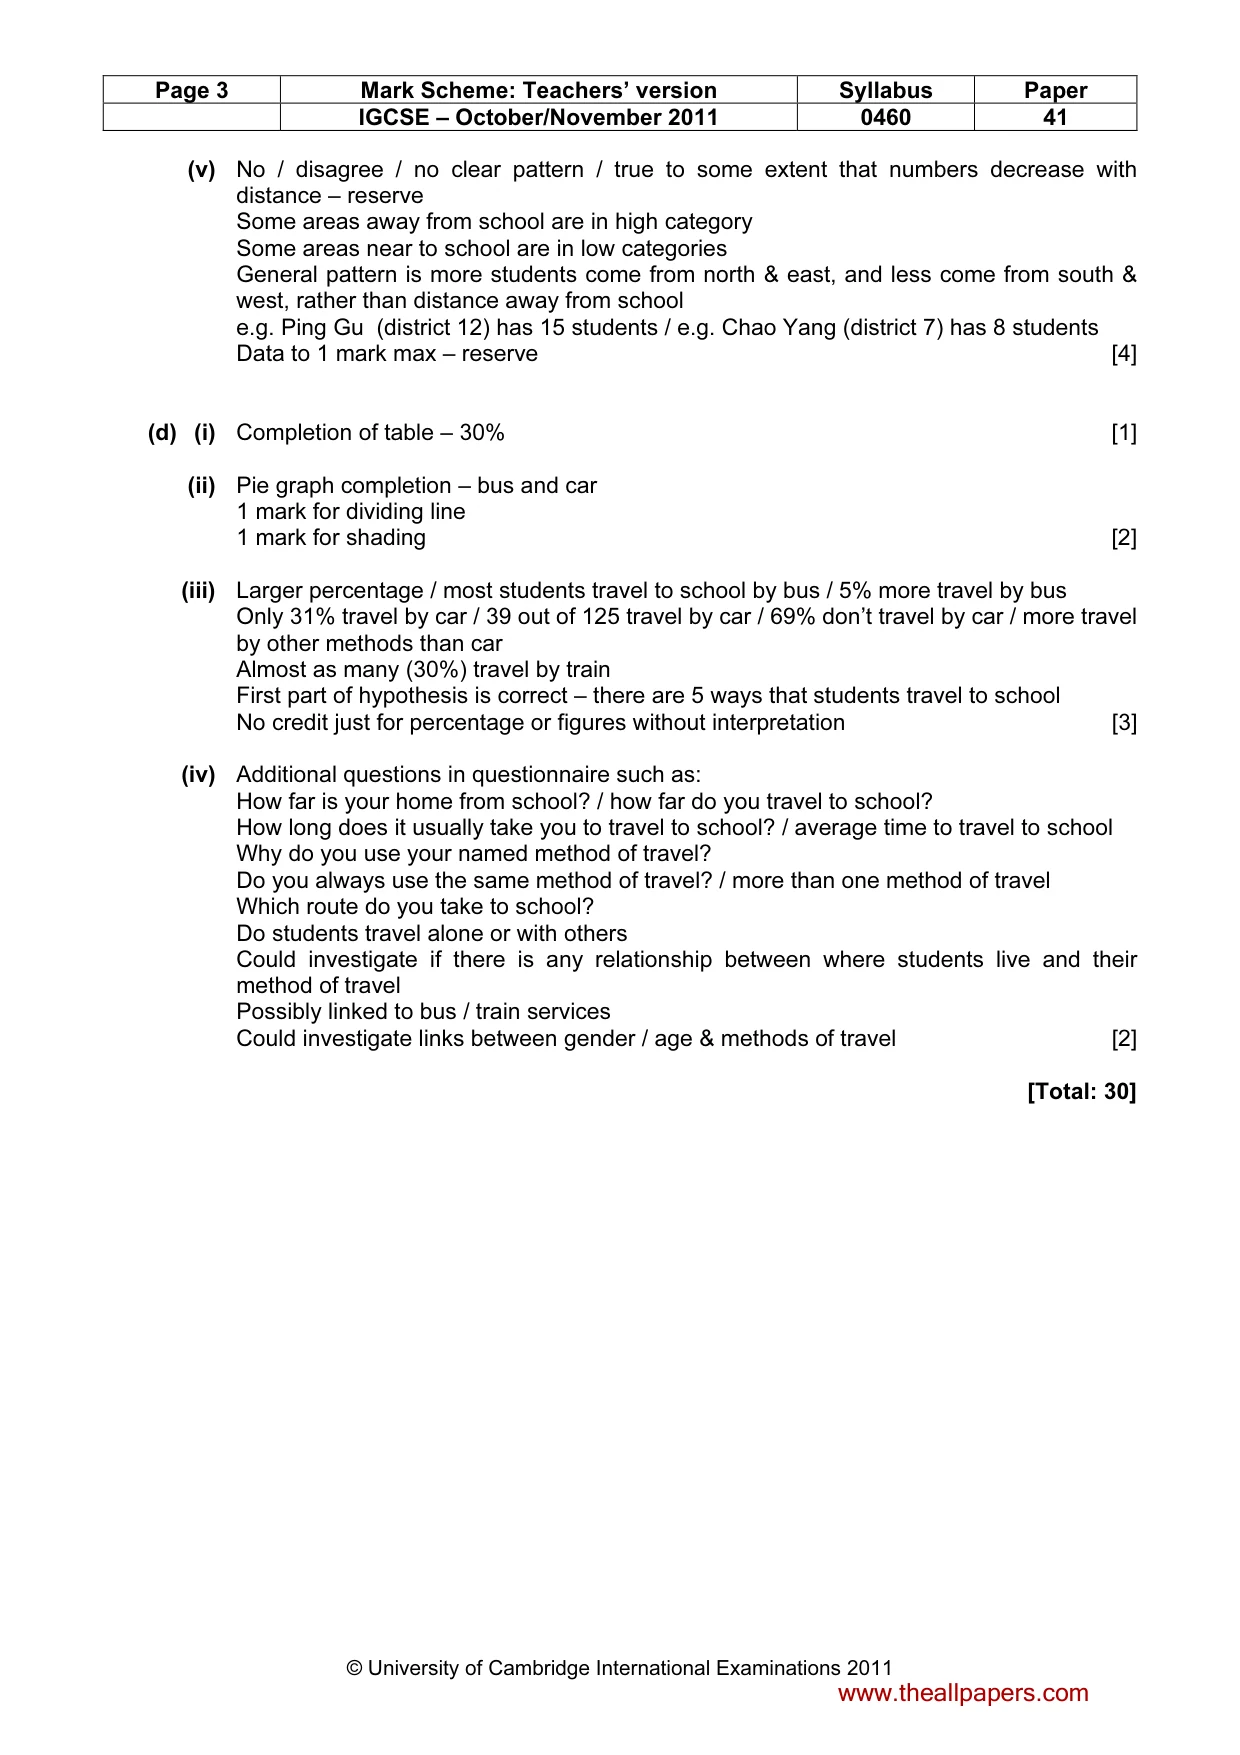
Page 3 Mark Scheme: Teachers’ version Syllabus Paper IGCSE – October/November 2011 0460 41 © University of Cambridge International Examinations 2011 (v) No / disagree / no clear pattern / true to some extent that numbers decrease with distance – reserve Some areas away from school are in high category Some areas near to school are in low categories General pattern is more students come from north & east, and less come from south & west, rather than distance away from school e.g. Ping Gu (district 12) has 15 students / e.g. Chao Yang (district 7) has 8 students Data to 1 mark max – reserve [4] (d) (i) Completion of table – 30% [1] (ii) Pie graph completion – bus and car 1 mark for dividing line 1 mark for shading [2] (iii) Larger percentage / most students travel to school by bus / 5% more travel by bus Only 31% travel by car / 39 out of 125 travel by car / 69% don’t travel by car / more travel by other methods than car Almost as many (30%) travel by train First part of hypothesis is correct – there are 5 ways that students travel to school No credit just for percentage or figures without interpretation [3] (iv) Additional questions in questionnaire such as: How far is your home from school? / how far do you travel to school? How long does it usually take you to travel to school? / average time to travel to school Why do you use your named method of travel? Do you always use the same method of travel? / more than one method of travel Which route do you take to school? Do students travel alone or with others Could investigate if there is any relationship between where students live and their method of travel Possibly linked to bus / train services Could investigate links between gender / age & methods of travel [2] [Total: 30] www.theallpapers.com
Mark scheme, page 4
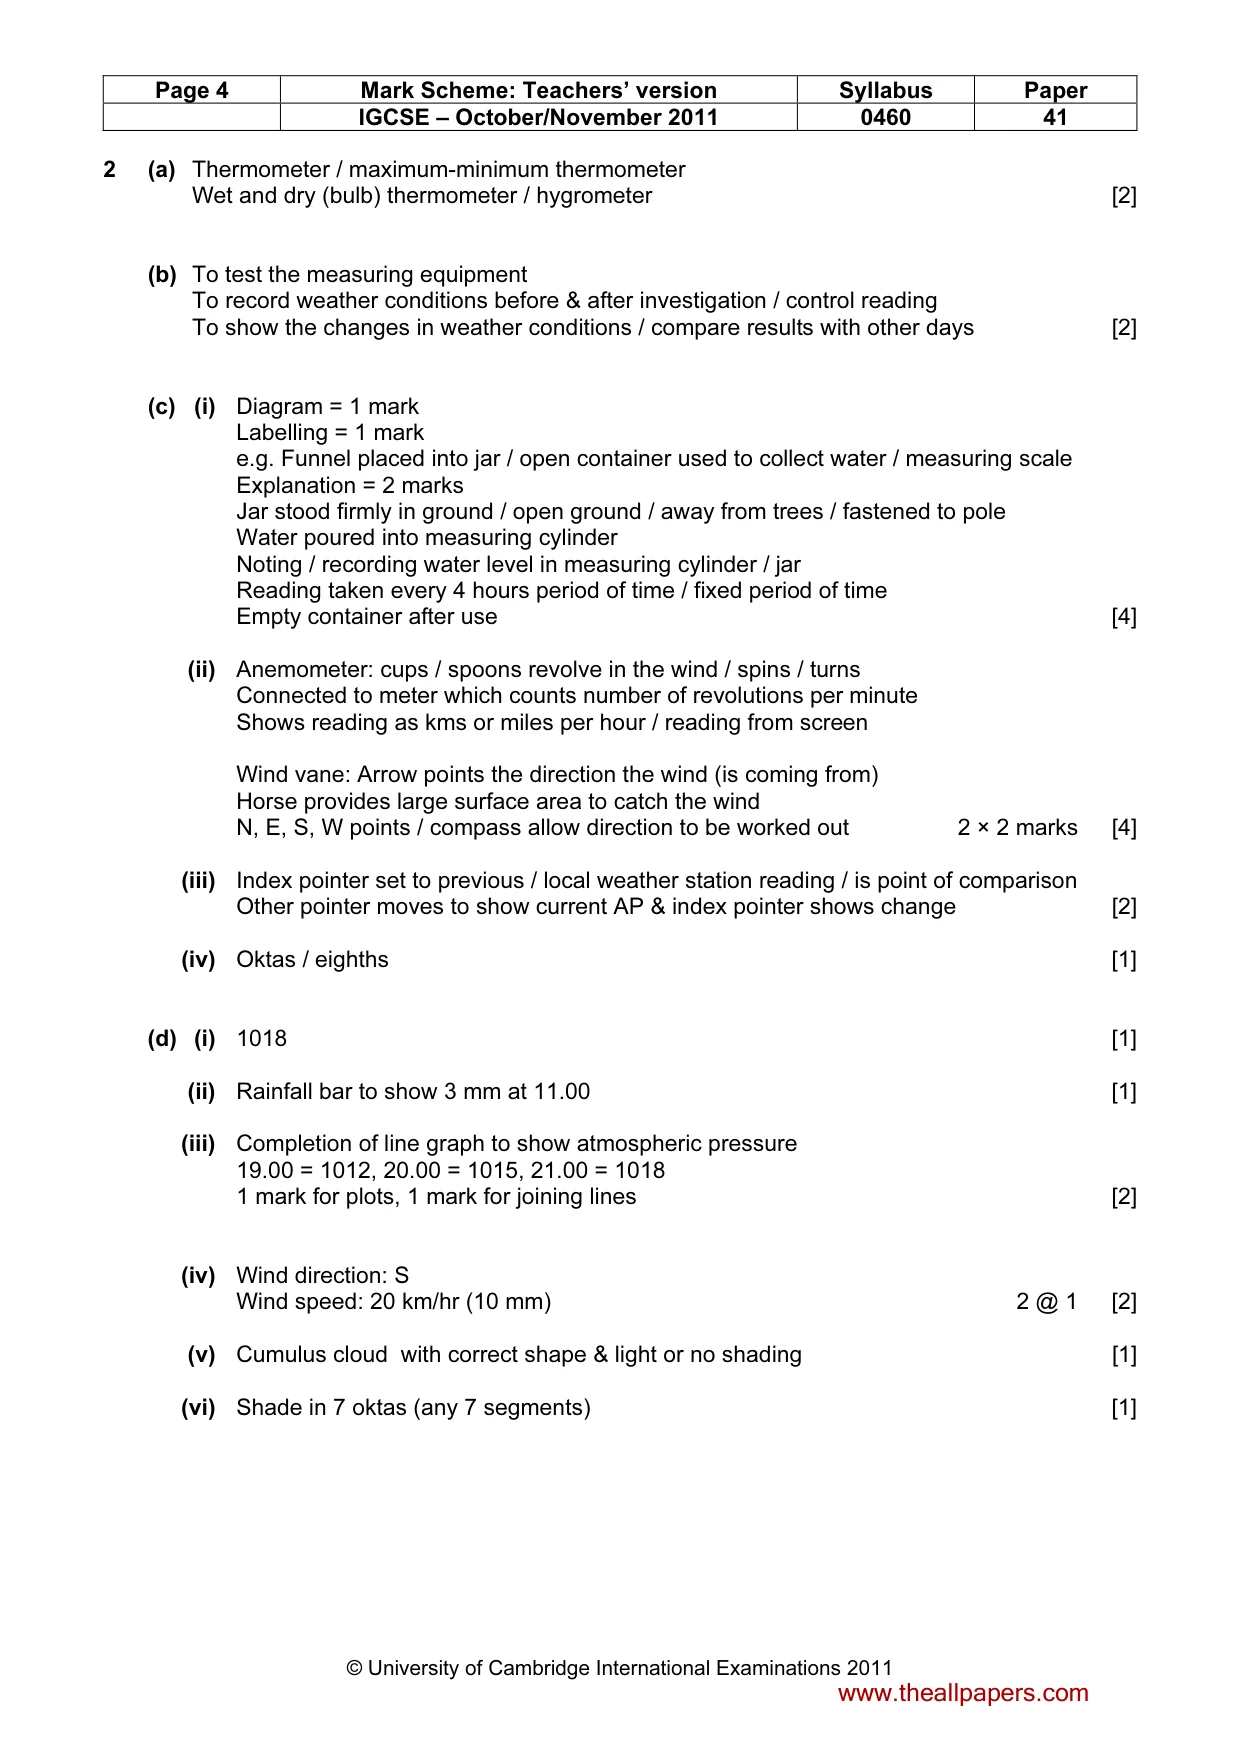
Page 4 Mark Scheme: Teachers’ version Syllabus Paper IGCSE – October/November 2011 0460 41 © University of Cambridge International Examinations 2011 2 (a) Thermometer / maximum-minimum thermometer Wet and dry (bulb) thermometer / hygrometer [2] (b) To test the measuring equipment To record weather conditions before & after investigation / control reading To show the changes in weather conditions / compare results with other days [2] (c) (i) Diagram = 1 mark Labelling = 1 mark e.g. Funnel placed into jar / open container used to collect water / measuring scale Explanation = 2 marks Jar stood firmly in ground / open ground / away from trees / fastened to pole Water poured into measuring cylinder Noting / recording water level in measuring cylinder / jar Reading taken every 4 hours period of time / fixed period of time Empty container after use [4] (ii) Anemometer: cups / spoons revolve in the wind / spins / turns Connected to meter which counts number of revolutions per minute Shows reading as kms or miles per hour / reading from screen Wind vane: Arrow points the direction the wind (is coming from) Horse provides large surface area to catch the wind N, E, S, W points / compass allow direction to be worked out 2 × 2 marks [4] (iii) Index pointer set to previous / local weather station reading / is point of comparison Other pointer moves to show current AP & index pointer shows change [2] (iv) Oktas / eighths [1] (d) (i) 1018 [1] (ii) Rainfall bar to show 3 mm at 11.00 [1] (iii) Completion of line graph to show atmospheric pressure 19.00 = 1012, 20.00 = 1015, 21.00 = 1018 1 mark for plots, 1 mark for joining lines [2] (iv) Wind direction: S Wind speed: 20 km/hr (10 mm) 2 @ 1 [2] (v) Cumulus cloud with correct shape & light or no shading [1] (vi) Shade in 7 oktas (any 7 segments) [1] www.theallpapers.com
Mark scheme, page 5
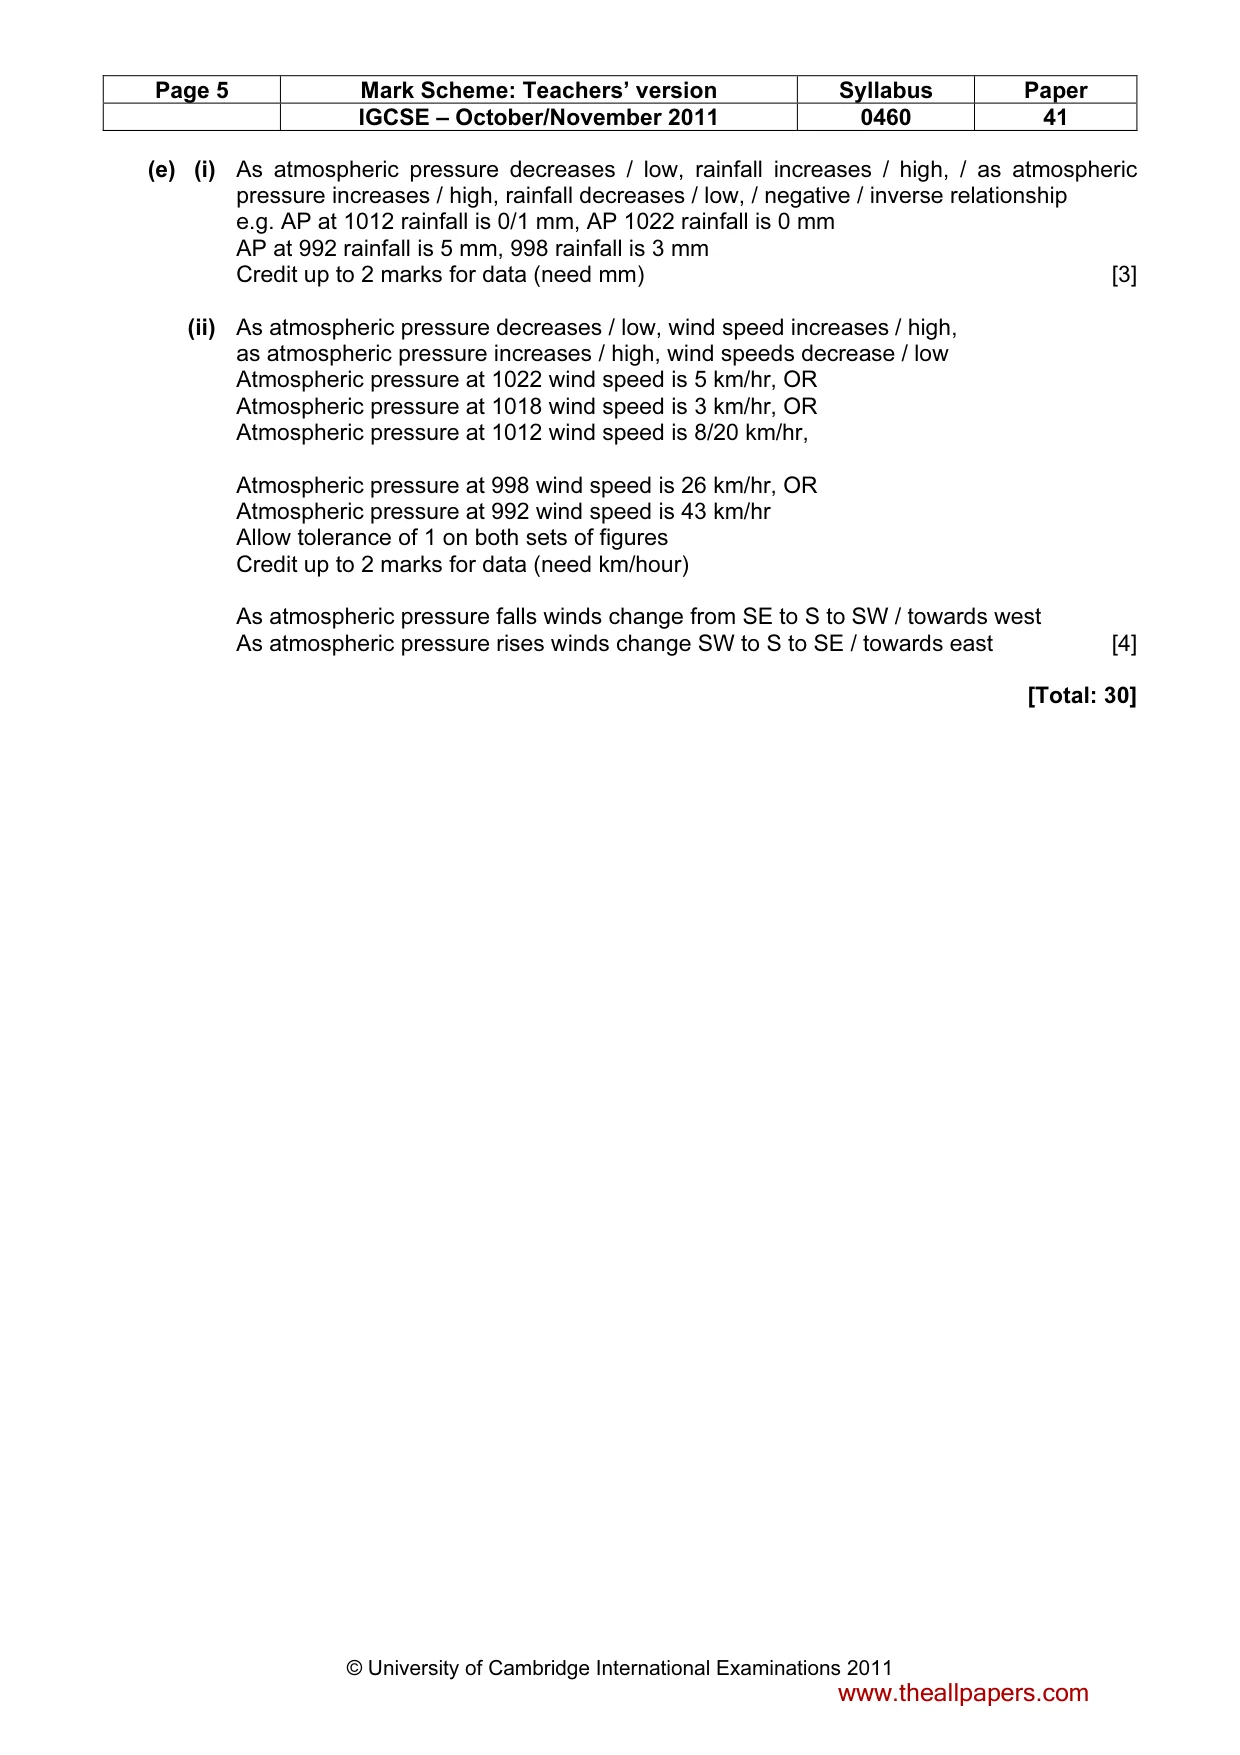
Page 5 Mark Scheme: Teachers’ version Syllabus Paper IGCSE – October/November 2011 0460 41 © University of Cambridge International Examinations 2011 (e) (i) As atmospheric pressure decreases / low, rainfall increases / high, / as atmospheric pressure increases / high, rainfall decreases / low, / negative / inverse relationship e.g. AP at 1012 rainfall is 0/1 mm, AP 1022 rainfall is 0 mm AP at 992 rainfall is 5 mm, 998 rainfall is 3 mm Credit up to 2 marks for data (need mm) [3] (ii) As atmospheric pressure decreases / low, wind speed increases / high, as atmospheric pressure increases / high, wind speeds decrease / low Atmospheric pressure at 1022 wind speed is 5 km/hr, OR Atmospheric pressure at 1018 wind speed is 3 km/hr, OR Atmospheric pressure at 1012 wind speed is 8/20 km/hr, Atmospheric pressure at 998 wind speed is 26 km/hr, OR Atmospheric pressure at 992 wind speed is 43 km/hr Allow tolerance of 1 on both sets of figures Credit up to 2 marks for data (need km/hour) As atmospheric pressure falls winds change from SE to S to SW / towards west As atmospheric pressure rises winds change SW to S to SE / towards east [4] [Total: 30] www.theallpapers.com
What you needed in this session
Cambridge’s own grade thresholds for 2011 Oct/Nov, Paper 4 · Variant 1. A higher threshold means an easier paper — the bar moves with how the cohort did.