Cambridge IGCSE Geography 0460 — 2011 Oct/Nov Paper 2 · Variant 3
0460/23/O/N/11 · 60 marks · ≈68 min
The question paper and its mark scheme, free to read here and free to download. This is Cambridge’s own paper, exactly as it was sat.
Question paper16 pages

Mark scheme5 pages
Answers below. Sit the paper first if you are practising.
Paper as text
Question paper, page 1
This document consists of 15 printed pages, 1 blank page and 1 Insert. DC (LEO/SW) 32280/8 © UCLES 2011 [Turn over UNIVERSITY OF CAMBRIDGE INTERNATIONAL EXAMINATIONS International General Certificate of Secondary Education READ THESE INSTRUCTIONS FIRST Write your Centre number, candidate number and name in the spaces provided. Write in dark blue or black pen. You may use a soft pencil for any diagrams, graphs or rough working. Do not use staples, paper clips, highlighters, glue or correction fluid. DO NOT WRITE IN ANY BARCODES. Answer all questions. The Insert contains Photograph A for Question 2 and Photograph B for Question 5. Sketch maps and diagrams should be drawn whenever they serve to illustrate an answer. The Survey Map Extract and the Insert are not required by the Examiner. At the end of the examination, fasten all your work securely together. The number of marks is given in brackets [ ] at the end of each question or part question. * 9 7 5 1 5 4 1 5 7 5 * GEOGRAPHY 0460/23 Paper 2 October/November 2011 1 hour 30 minutes Candidates answer on the Question Paper. Additional Materials: Ruler Protractor Plain paper 1:25 000 Survey Map Extract is enclosed with this Question Paper. www.theallpapers.com
Question paper, page 2
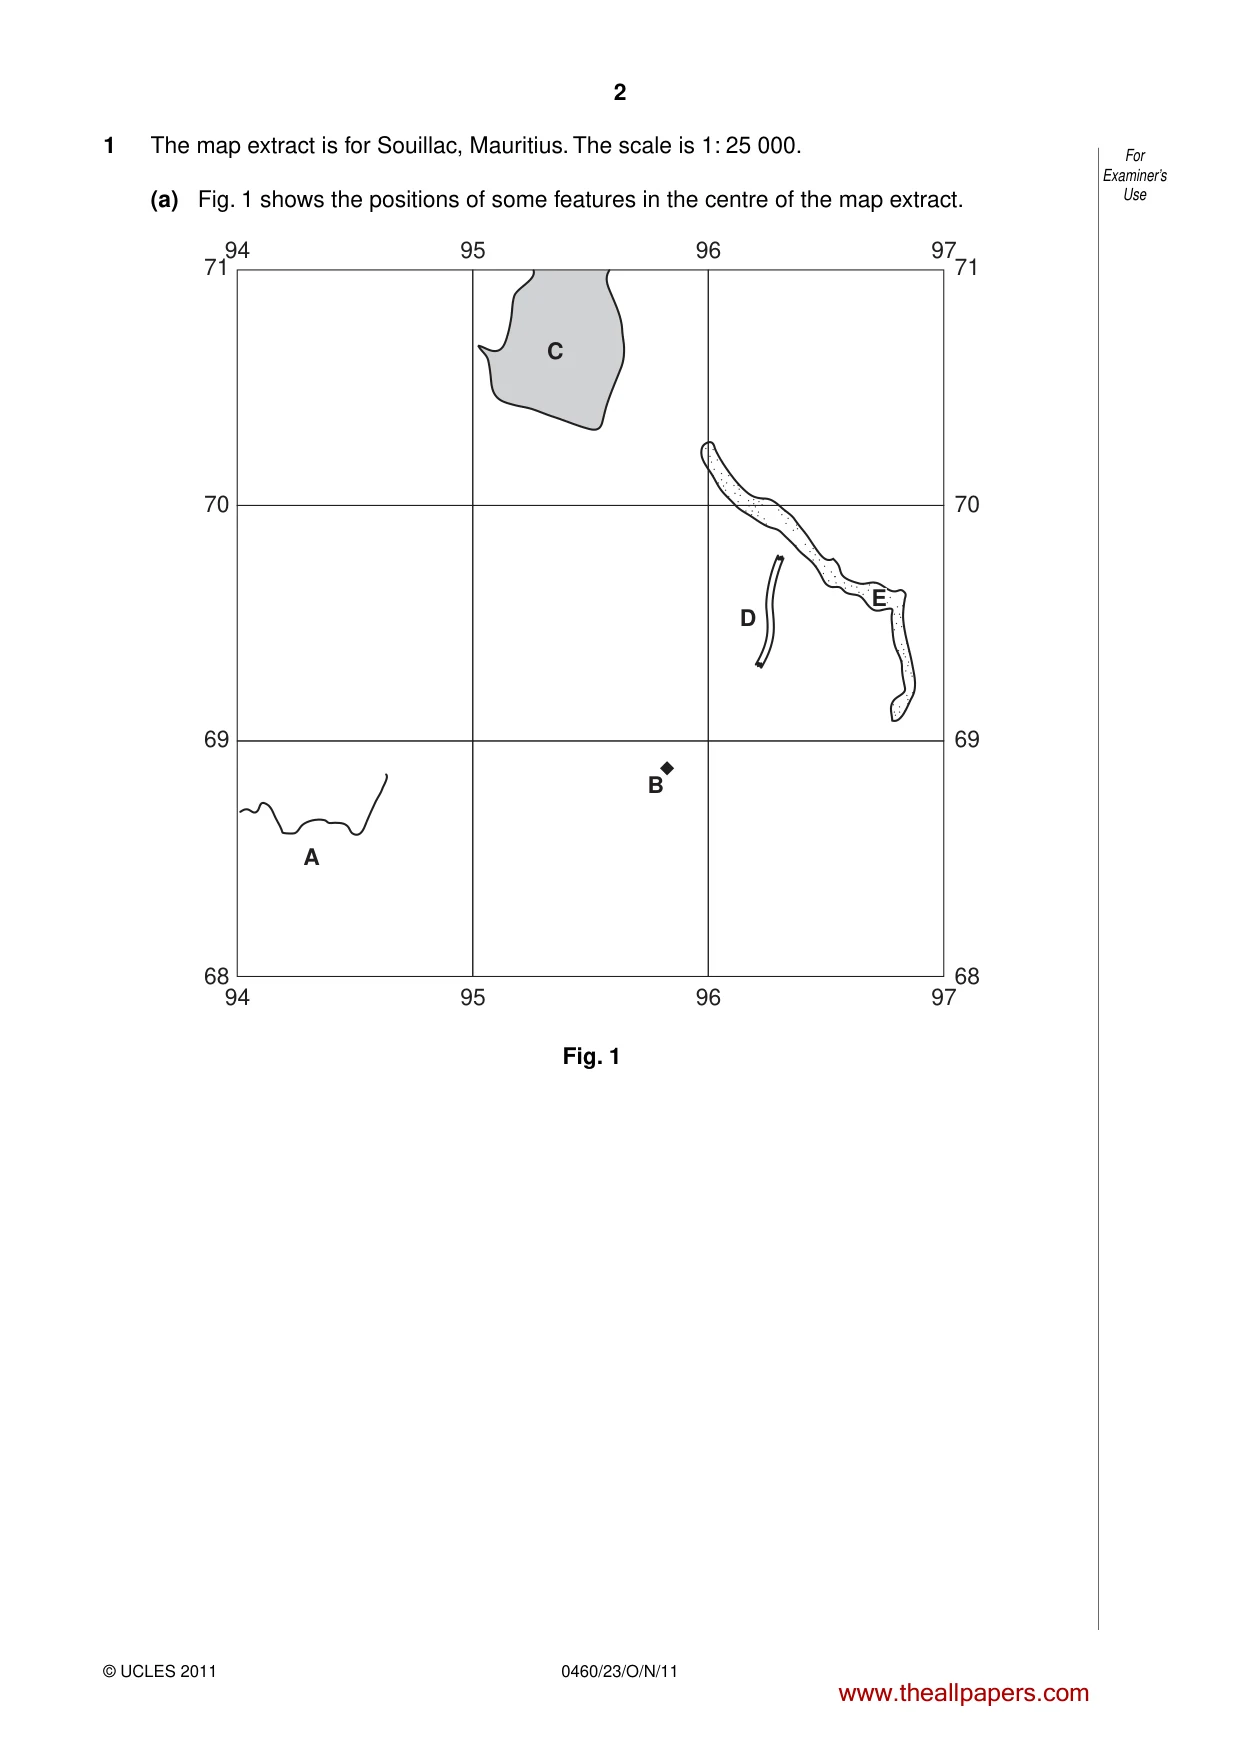
2 For Examiner’s Use 0460/23/O/N/11 © UCLES 2011 1 The map extract is for Souillac, Mauritius. The scale is 1: 25 000. (a) Fig. 1 shows the positions of some features in the centre of the map extract. 71 95 94 96 97 95 94 A B D C E 96 97 70 69 68 71 70 69 68 Fig. 1 www.theallpapers.com
Question paper, page 3
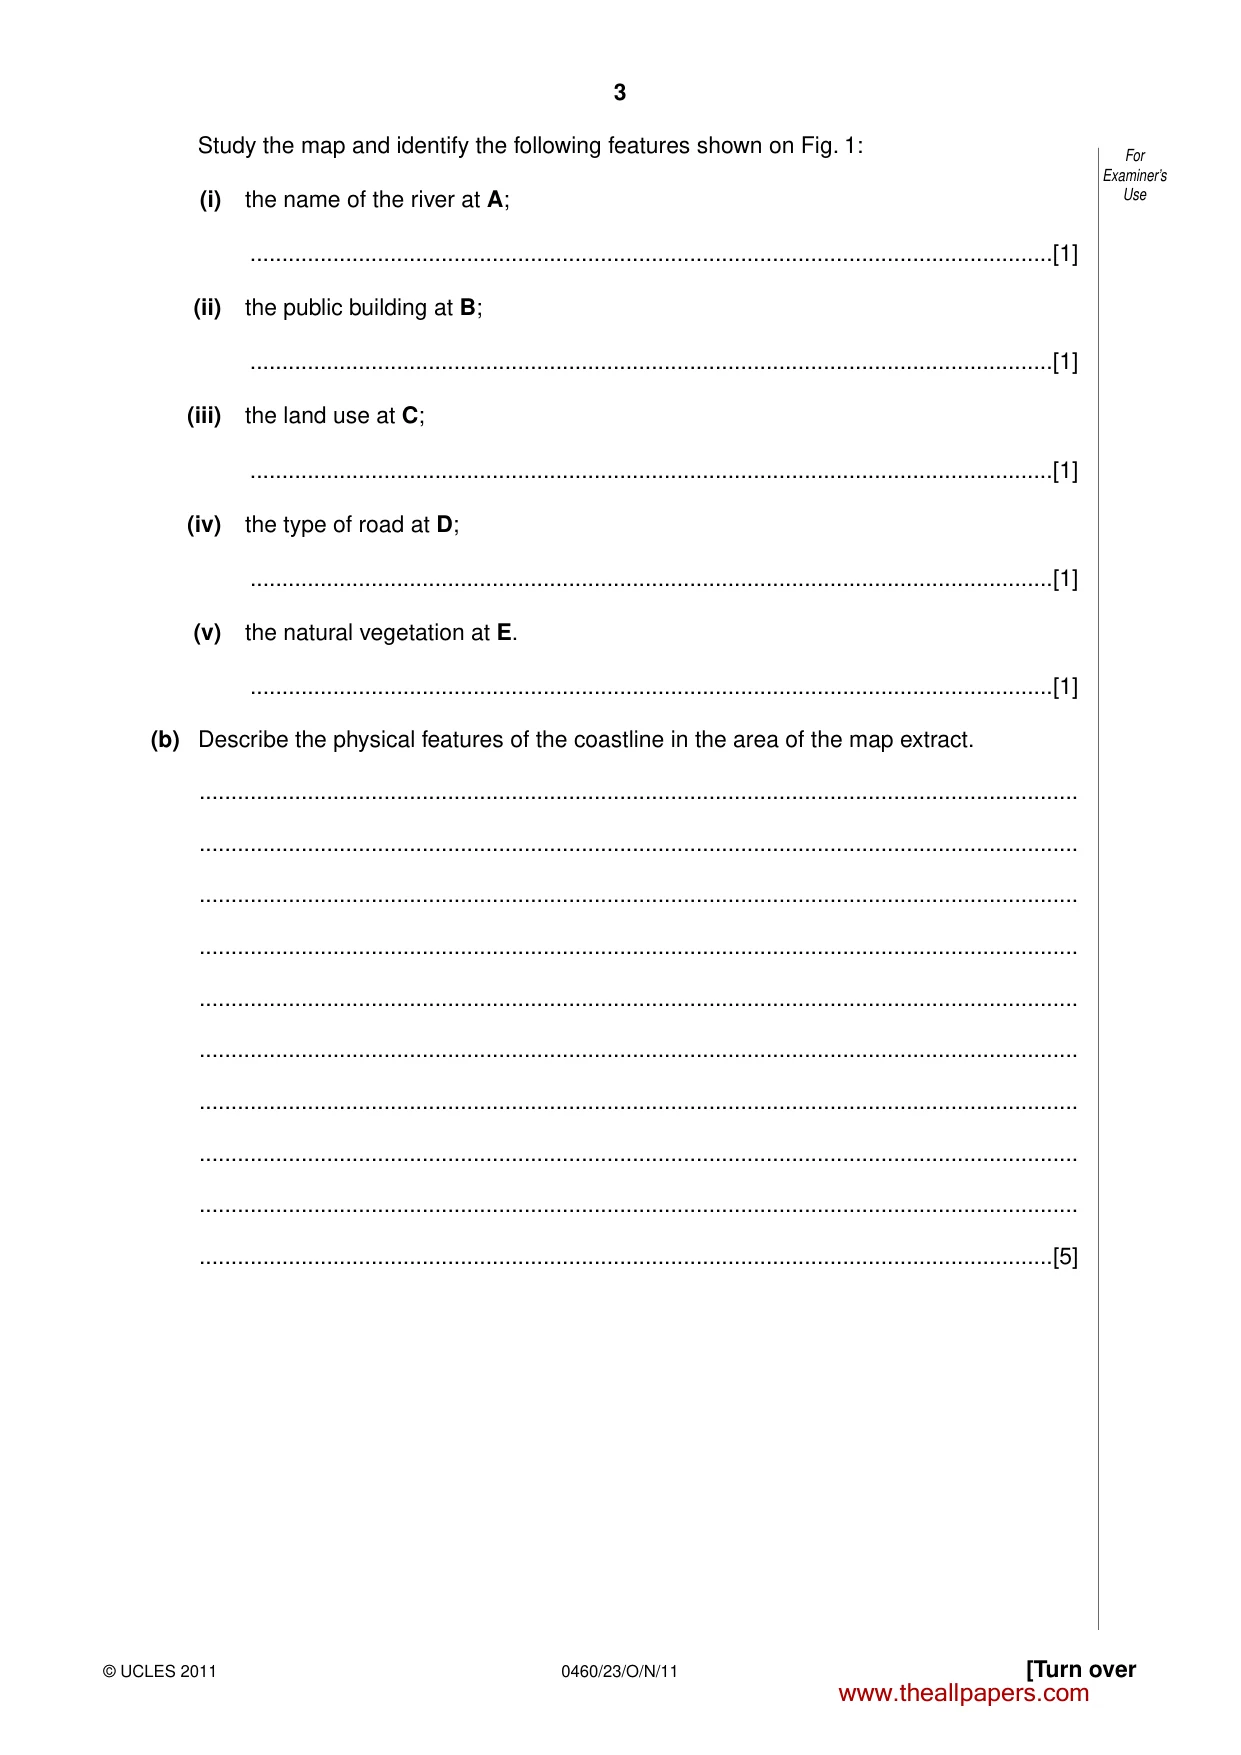
3 [Turn over For Examiner’s Use © UCLES 2011 0460/23/O/N/11 Study the map and identify the following features shown on Fig. 1: (i) the name of the river at A; …[1] (ii) the public building at B; …[1] (iii) the land use at C; …[1] (iv) the type of road at D; …[1] (v) the natural vegetation at E. …[1] (b) Describe the physical features of the coastline in the area of the map extract. … … … … … … … … … …[5] www.theallpapers.com
Question paper, page 4
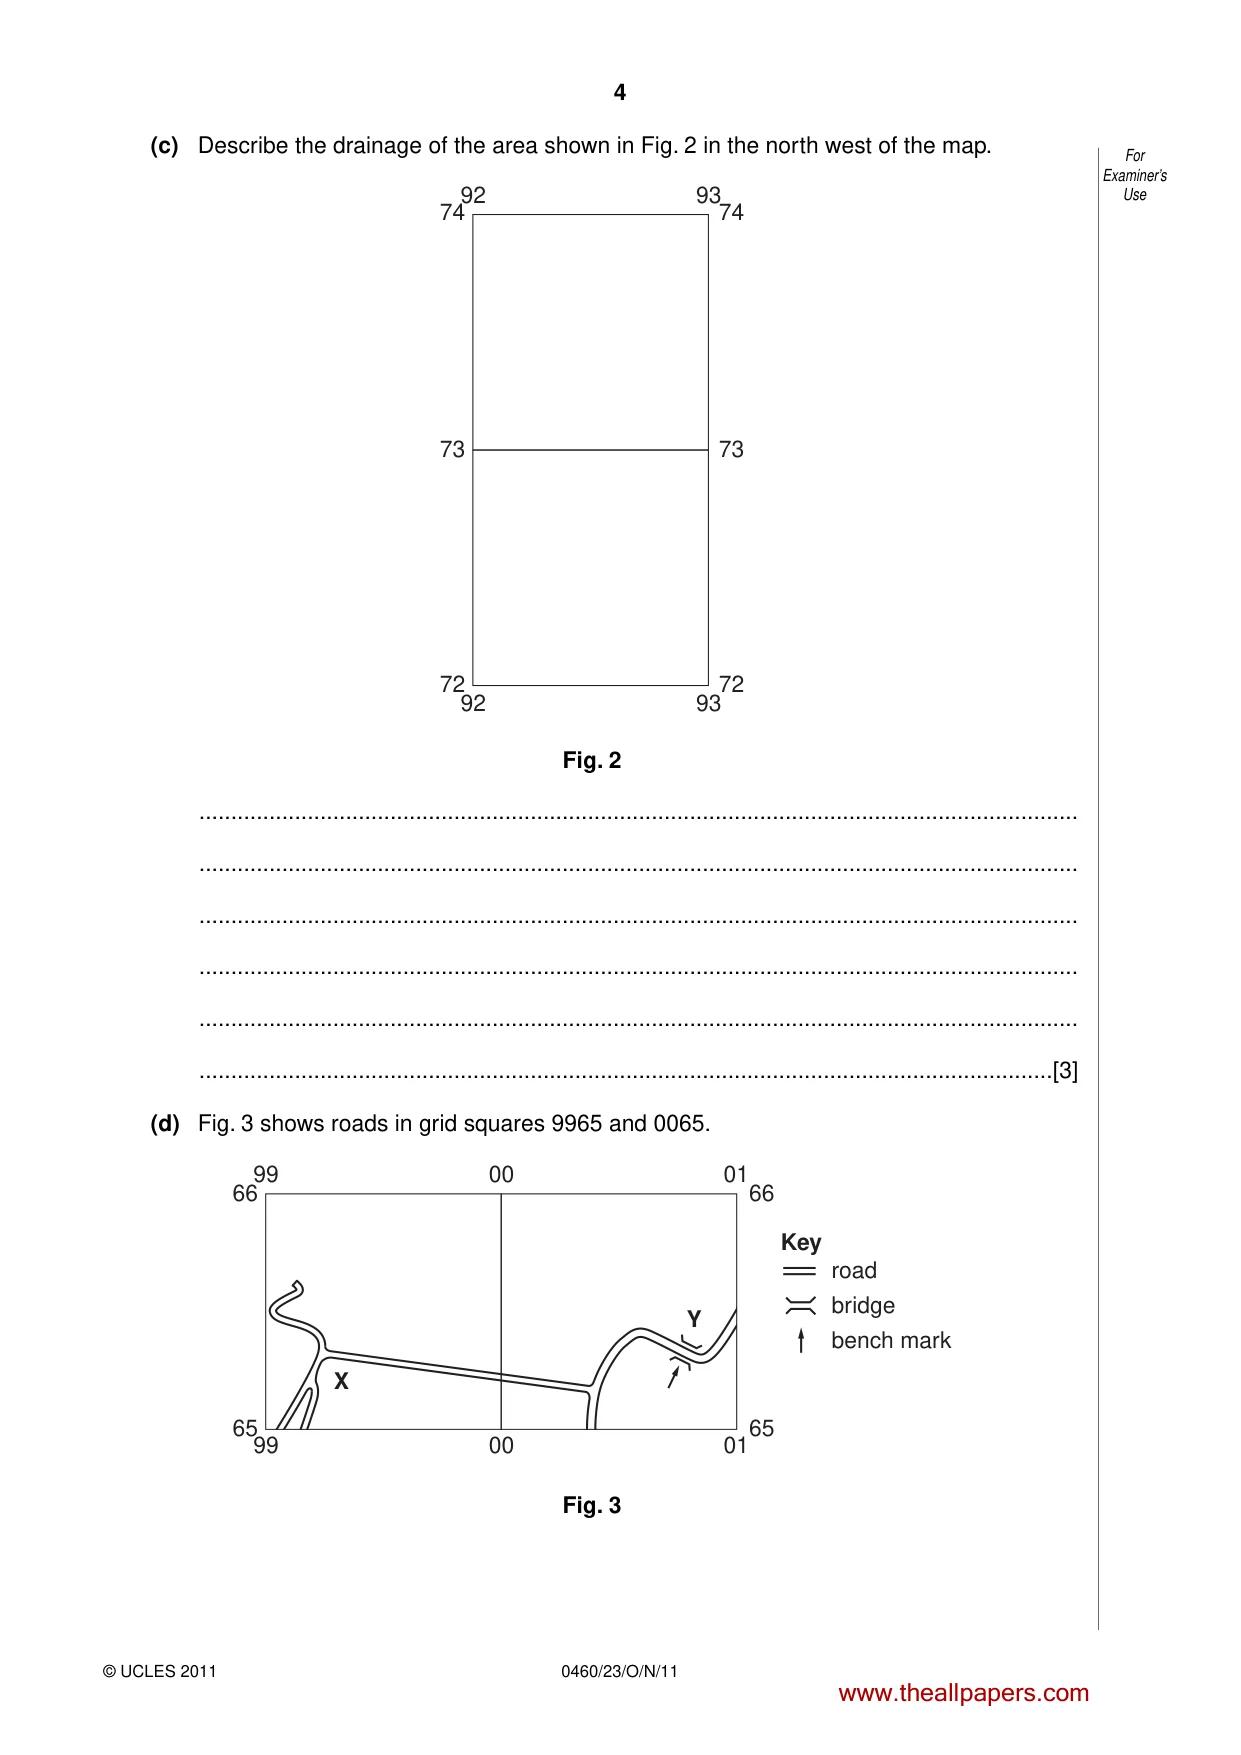
4 For Examiner’s Use 0460/23/O/N/11 © UCLES 2011 (c) Describe the drainage of the area shown in Fig. 2 in the north west of the map. 74 93 92 93 92 73 72 74 73 72 Fig. 2 … … … … … …[3] (d) Fig. 3 shows roads in grid squares 9965 and 0065. 00 01 99 00 01 99 66 65 66 65 road bridge bench mark Key X Y Fig. 3 www.theallpapers.com
Question paper, page 5
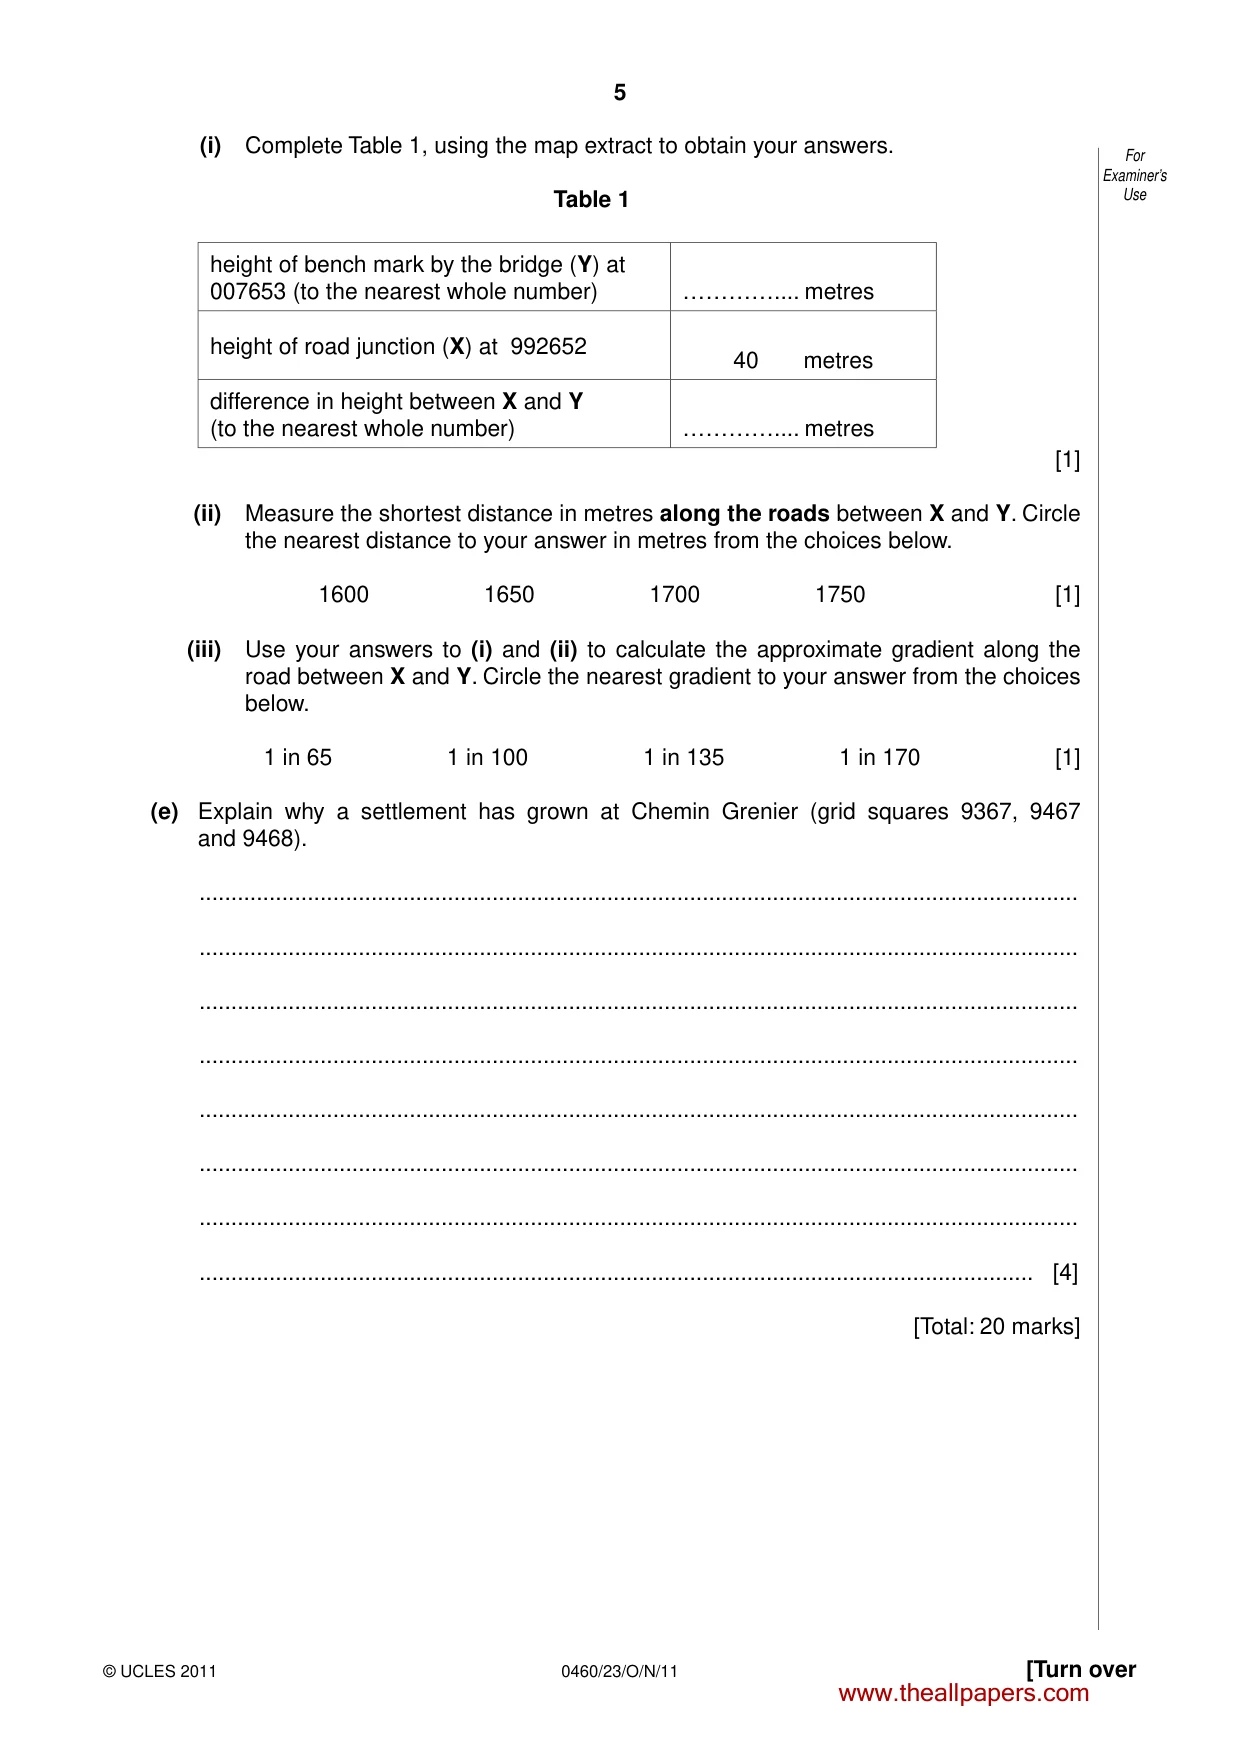
5 [Turn over For Examiner’s Use © UCLES 2011 0460/23/O/N/11 (i) Complete Table 1, using the map extract to obtain your answers. Table 1 height of bench mark by the bridge (Y) at 007653 (to the nearest whole number) …………… metres height of road junction (X) at 992652 40 metres difference in height between X and Y (to the nearest whole number) …………… metres [1] (ii) Measure the shortest distance in metres along the roads between X and Y. Circle the nearest distance to your answer in metres from the choices below. 1600 1650 1700 1750 [1] (iii) Use your answers to (i) and (ii) to calculate the approximate gradient along the road between X and Y. Circle the nearest gradient to your answer from the choices below. 1 in 65 1 in 100 1 in 135 1 in 170 [1] (e) Explain why a settlement has grown at Chemin Grenier (grid squares 9367, 9467 and 9468). … … … … … … … … [4] [Total: 20 marks] www.theallpapers.com
Question paper, page 6
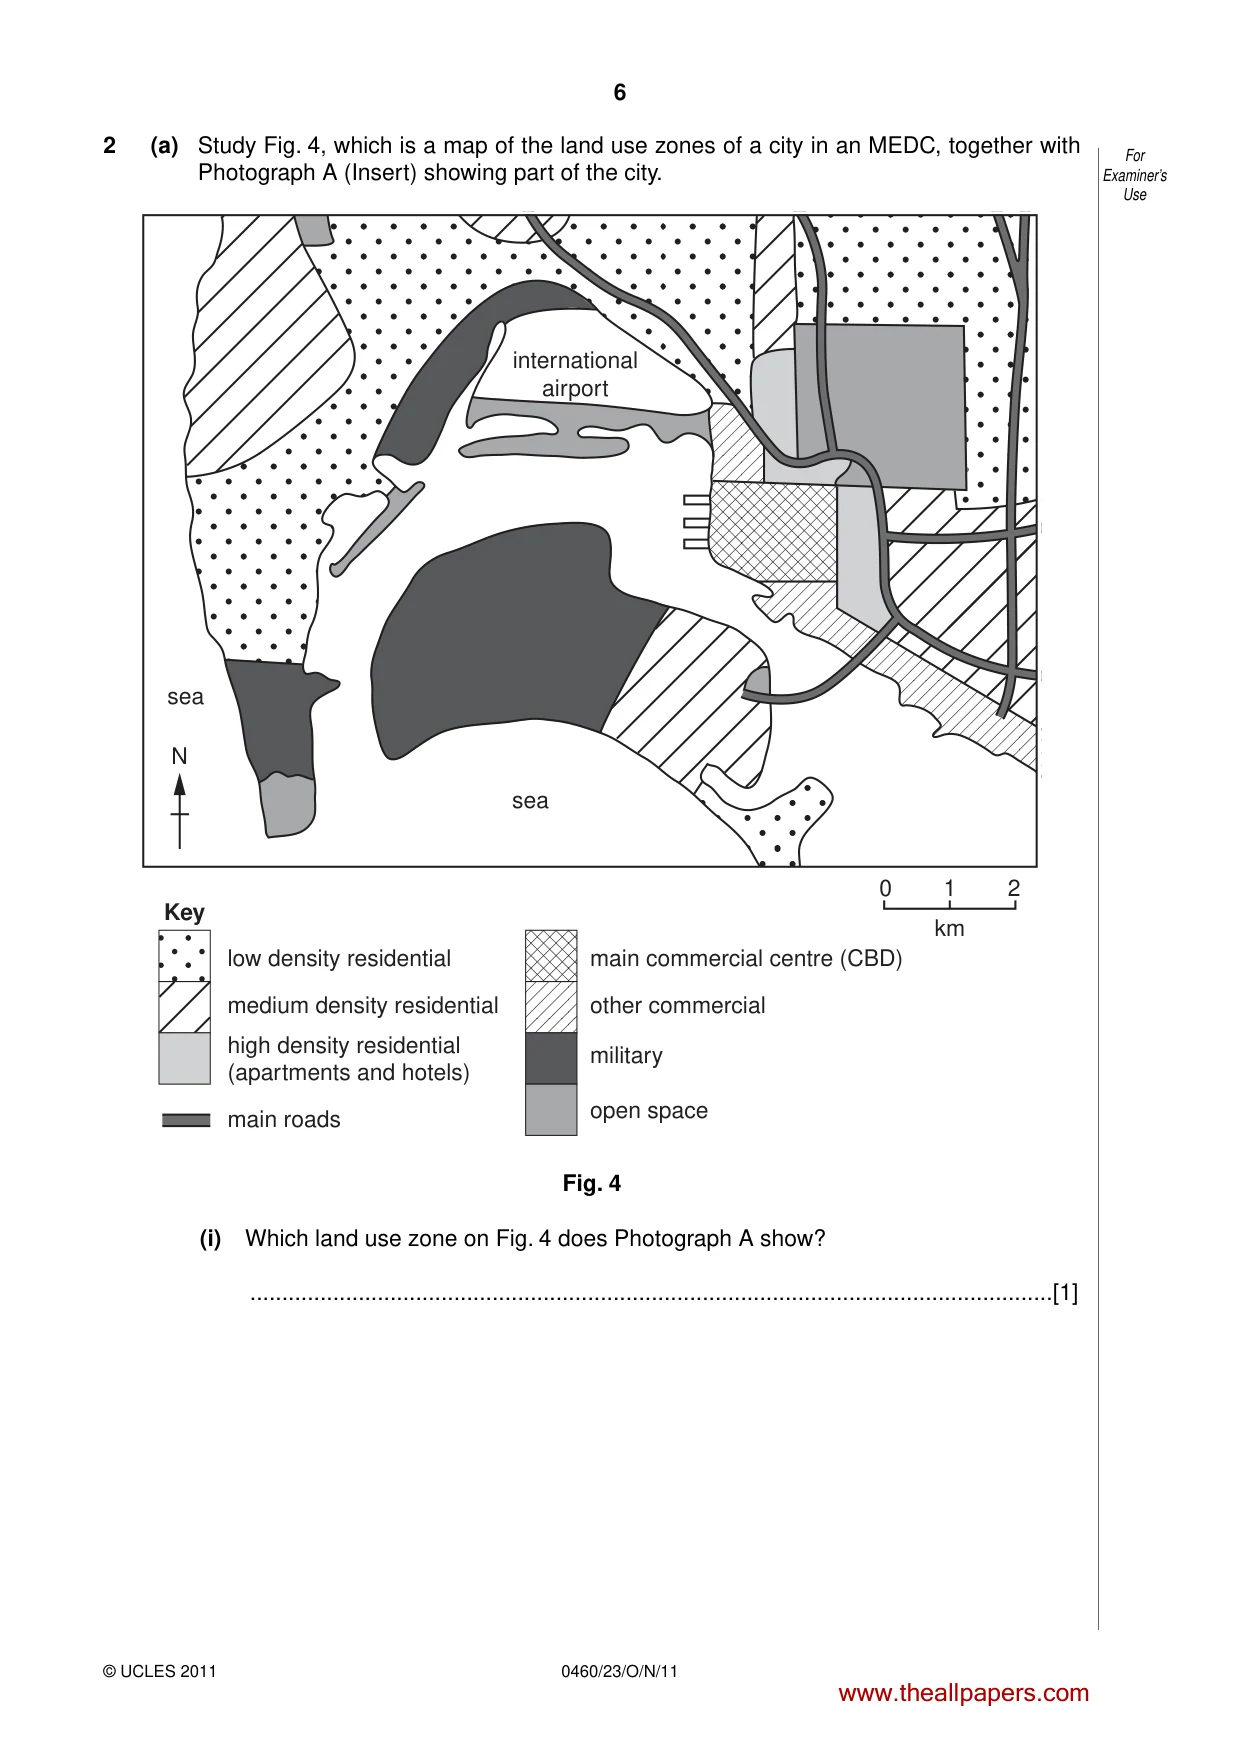
6 For Examiner’s Use 0460/23/O/N/11 © UCLES 2011 2 (a) Study Fig. 4, which is a map of the land use zones of a city in an MEDC, together with Photograph A (Insert) showing part of the city. 0 1 km 2 N sea sea international airport low density residential medium density residential high density residential (apartments and hotels) main roads main commercial centre (CBD) Key other commercial military open space Fig. 4 (i) Which land use zone on Fig. 4 does Photograph A show? …[1] www.theallpapers.com
Question paper, page 7
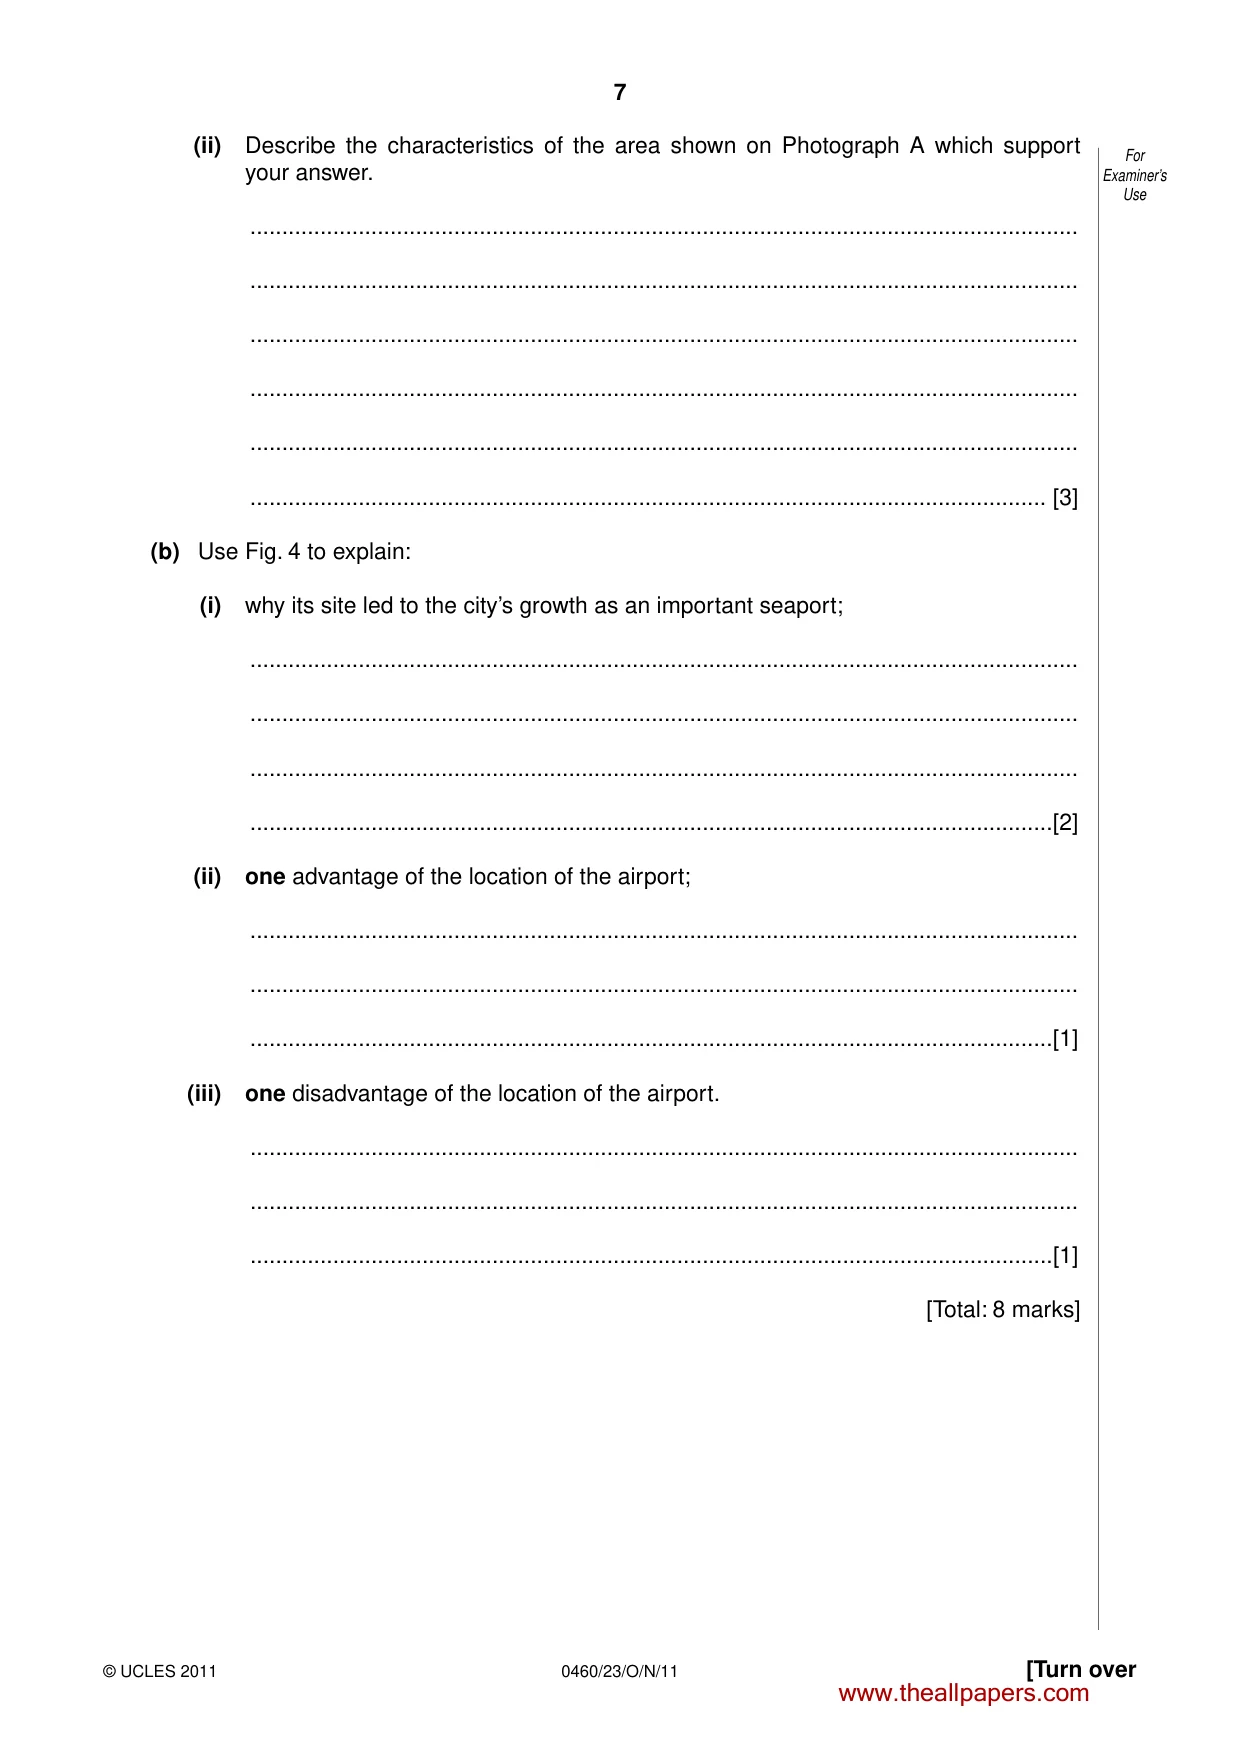
7 [Turn over For Examiner’s Use © UCLES 2011 0460/23/O/N/11 (ii) Describe the characteristics of the area shown on Photograph A which support your answer. … … … … … … [3] (b) Use Fig. 4 to explain: (i) why its site led to the city’s growth as an important seaport; … … … …[2] (ii) one advantage of the location of the airport; … … …[1] (iii) one disadvantage of the location of the airport. … … …[1] [Total: 8 marks] www.theallpapers.com
Question paper, page 8
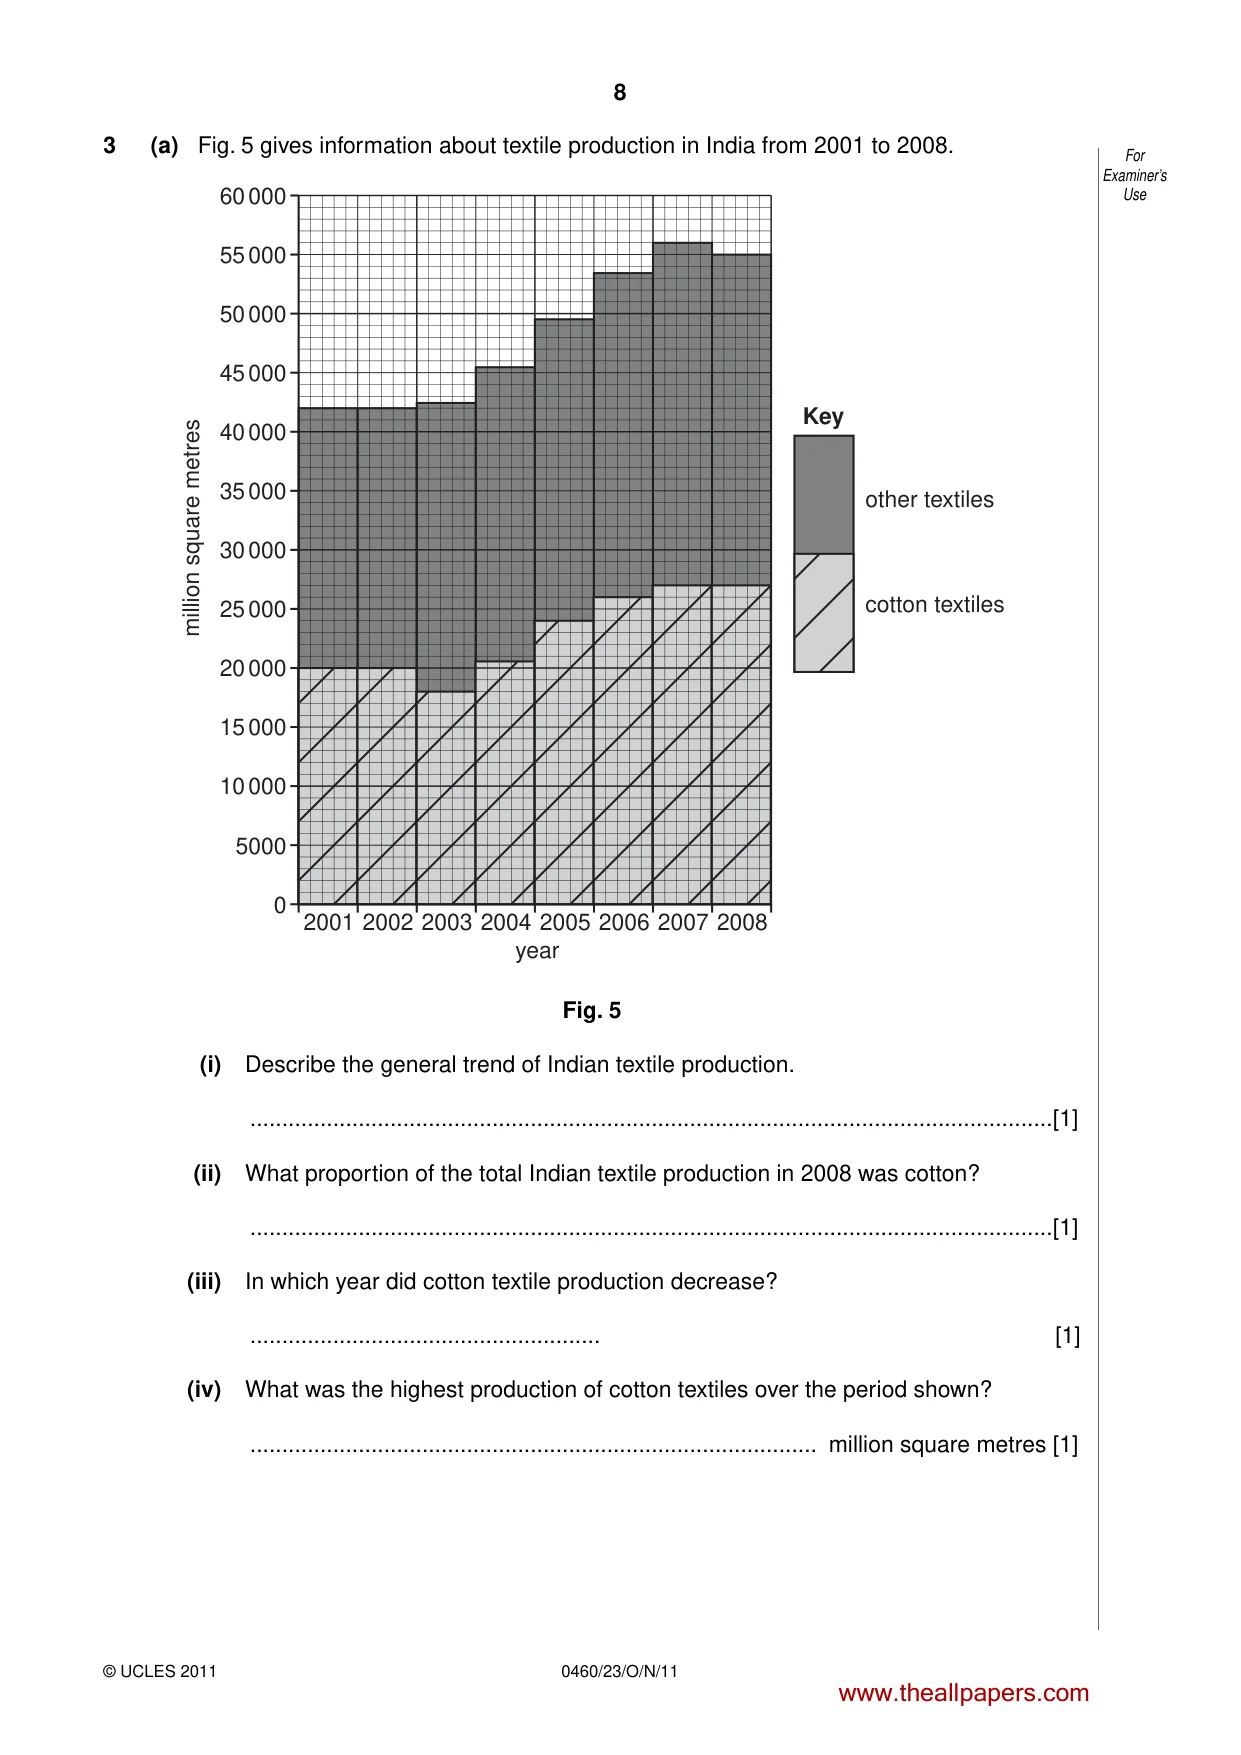
8 For Examiner’s Use 0460/23/O/N/11 © UCLES 2011 3 (a) Fig. 5 gives information about textile production in India from 2001 to 2008. other textiles Key cotton textiles 0 5000 10 000 15 000 20 000 25 000 million square metres 30 000 35 000 40 000 45 000 50 000 55 000 60 000 2001 2002 2003 2004 2005 year 2006 2007 2008 Fig. 5 (i) Describe the general trend of Indian textile production. …[1] (ii) What proportion of the total Indian textile production in 2008 was cotton? …[1] (iii) In which year did cotton textile production decrease? … [1] (iv) What was the highest production of cotton textiles over the period shown? … million square metres [1] www.theallpapers.com
Question paper, page 9
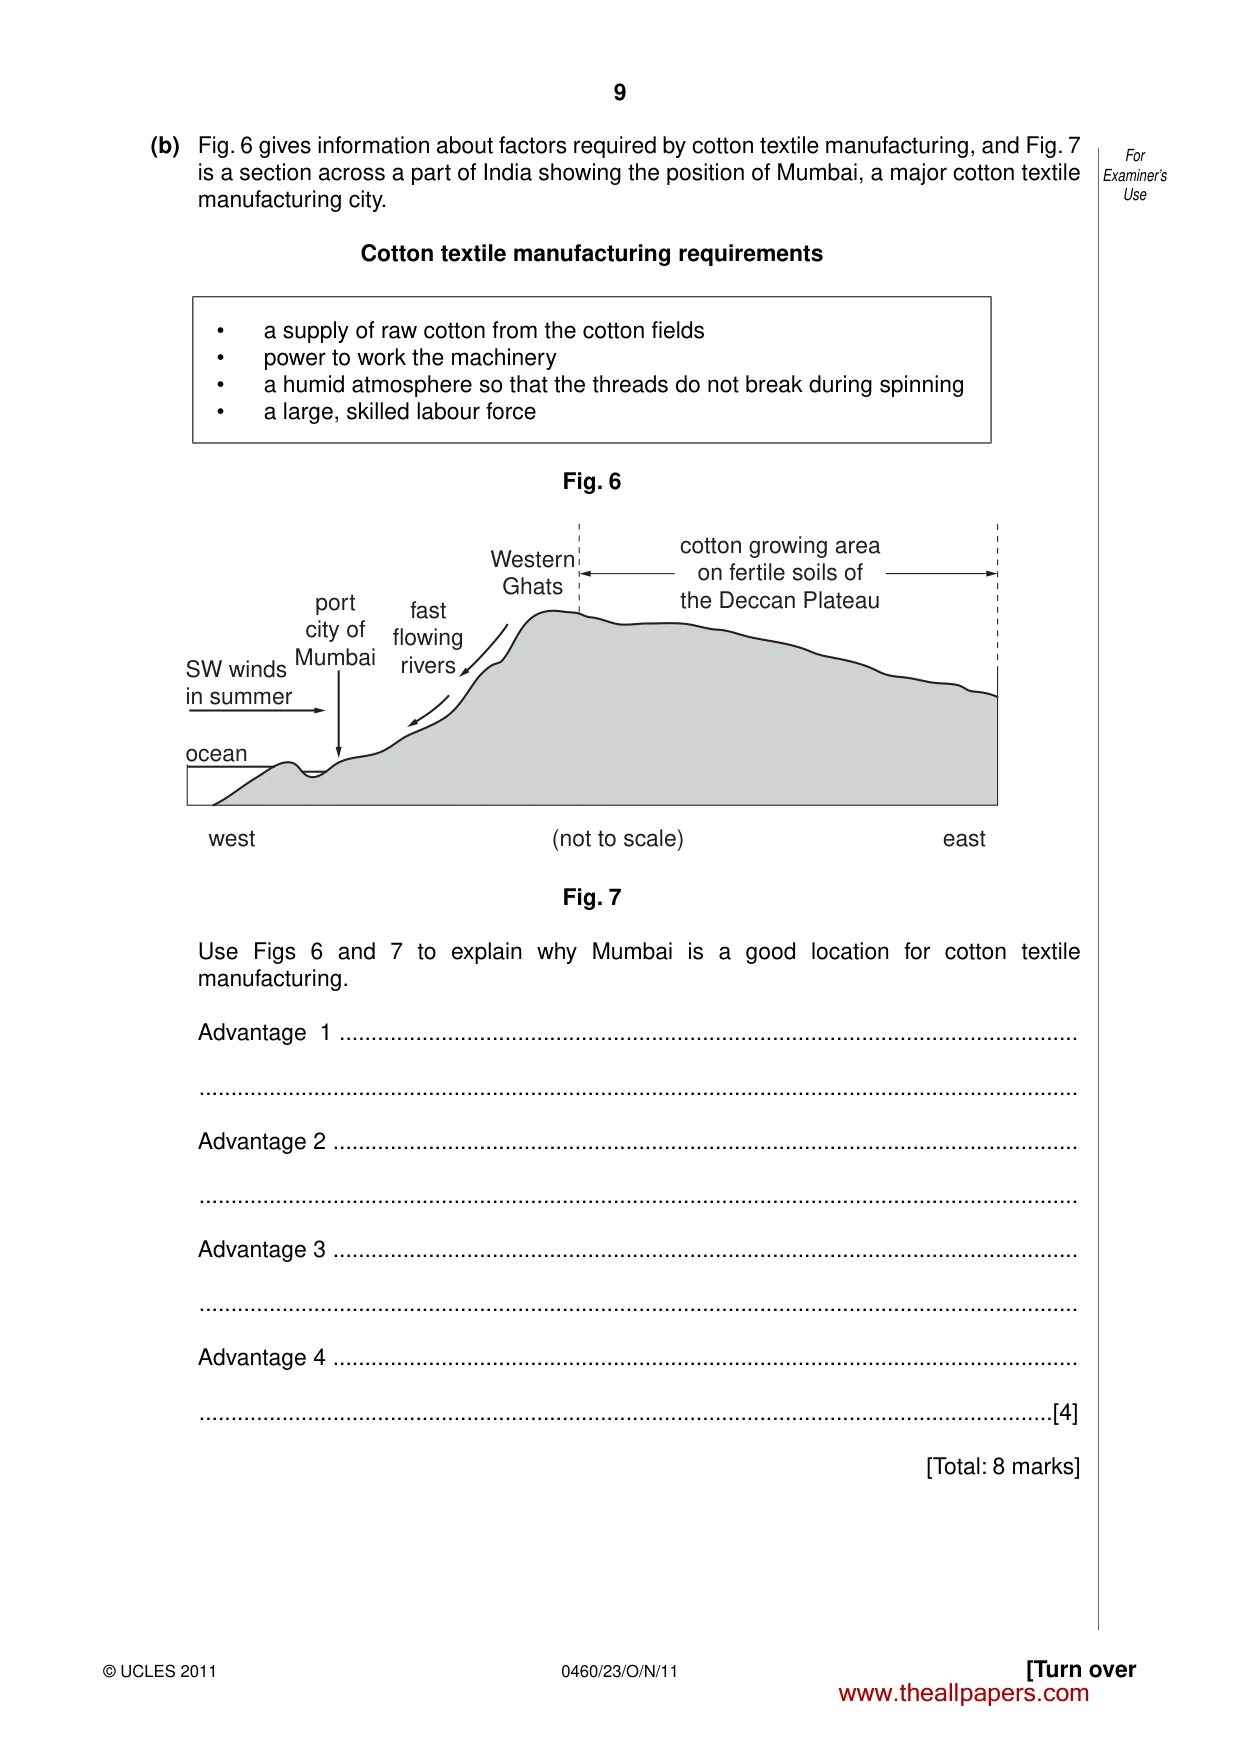
9 [Turn over For Examiner’s Use © UCLES 2011 0460/23/O/N/11 (b) Fig. 6 gives information about factors required by cotton textile manufacturing, and Fig. 7 is a section across a part of India showing the position of Mumbai, a major cotton textile manufacturing city. Cotton textile manufacturing requirements • a supply of raw cotton from the cotton fields • power to work the machinery • a humid atmosphere so that the threads do not break during spinning • a large, skilled labour force Fig. 6 Western Ghats port city of Mumbai SW winds in summer ocean west east (not to scale) fast flowing rivers cotton growing area on fertile soils of the Deccan Plateau Fig. 7 Use Figs 6 and 7 to explain why Mumbai is a good location for cotton textile manufacturing. Advantage 1 … … Advantage 2 … … Advantage 3 … … Advantage 4 … …[4] [Total: 8 marks] www.theallpapers.com
Question paper, page 10
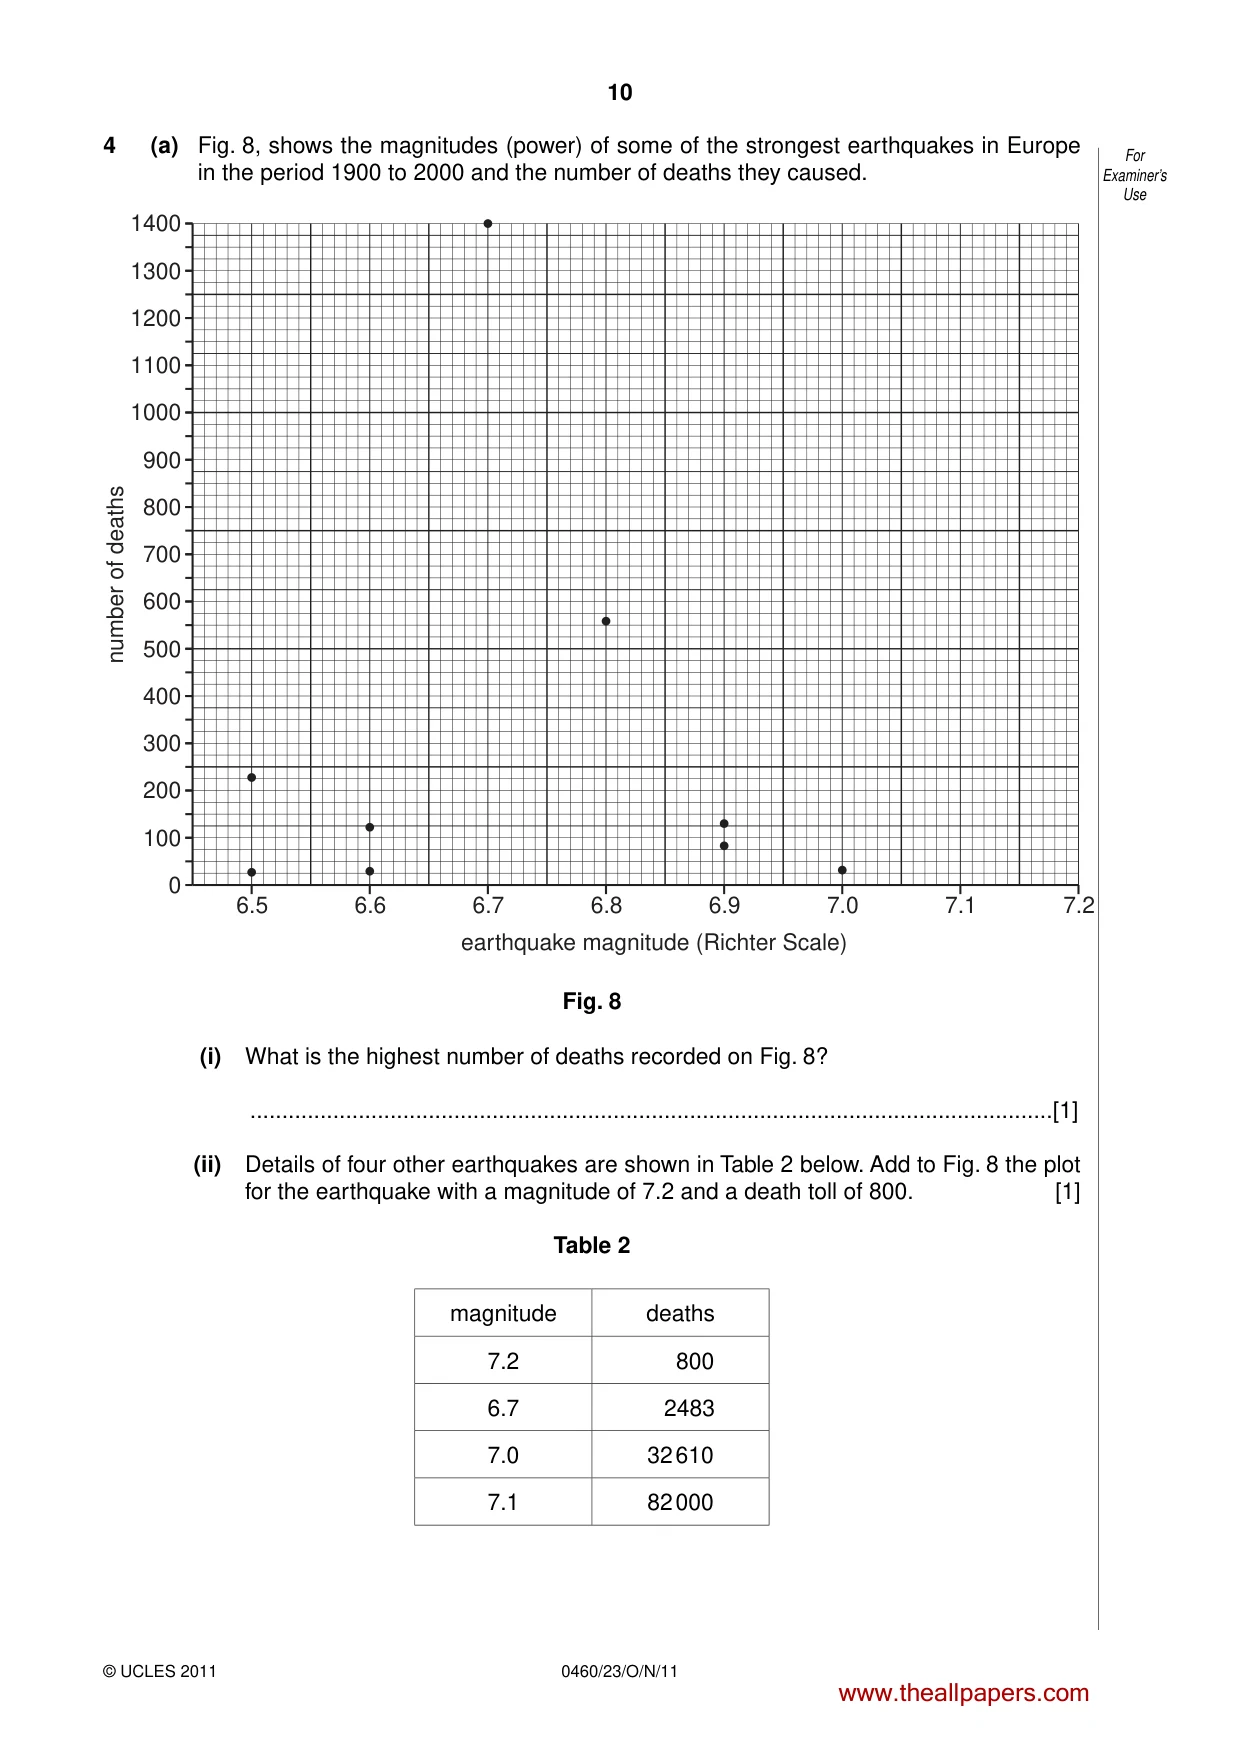
10 For Examiner’s Use 0460/23/O/N/11 © UCLES 2011 4 (a) Fig. 8, shows the magnitudes (power) of some of the strongest earthquakes in Europe in the period 1900 to 2000 and the number of deaths they caused. 6.5 6.6 6.7 6.8 6.9 earthquake magnitude (Richter Scale) number of deaths 7.0 7.1 7.2 0 100 200 300 400 500 600 700 800 900 1000 1100 1200 1300 1400 Fig. 8 (i) What is the highest number of deaths recorded on Fig. 8? …[1] (ii) Details of four other earthquakes are shown in Table 2 below. Add to Fig. 8 the plot for the earthquake with a magnitude of 7.2 and a death toll of 800. [1] Table 2 magnitude deaths 7.2 800 6.7 2483 7.0 32 610 7.1 82 000 www.theallpapers.com
Question paper, page 11
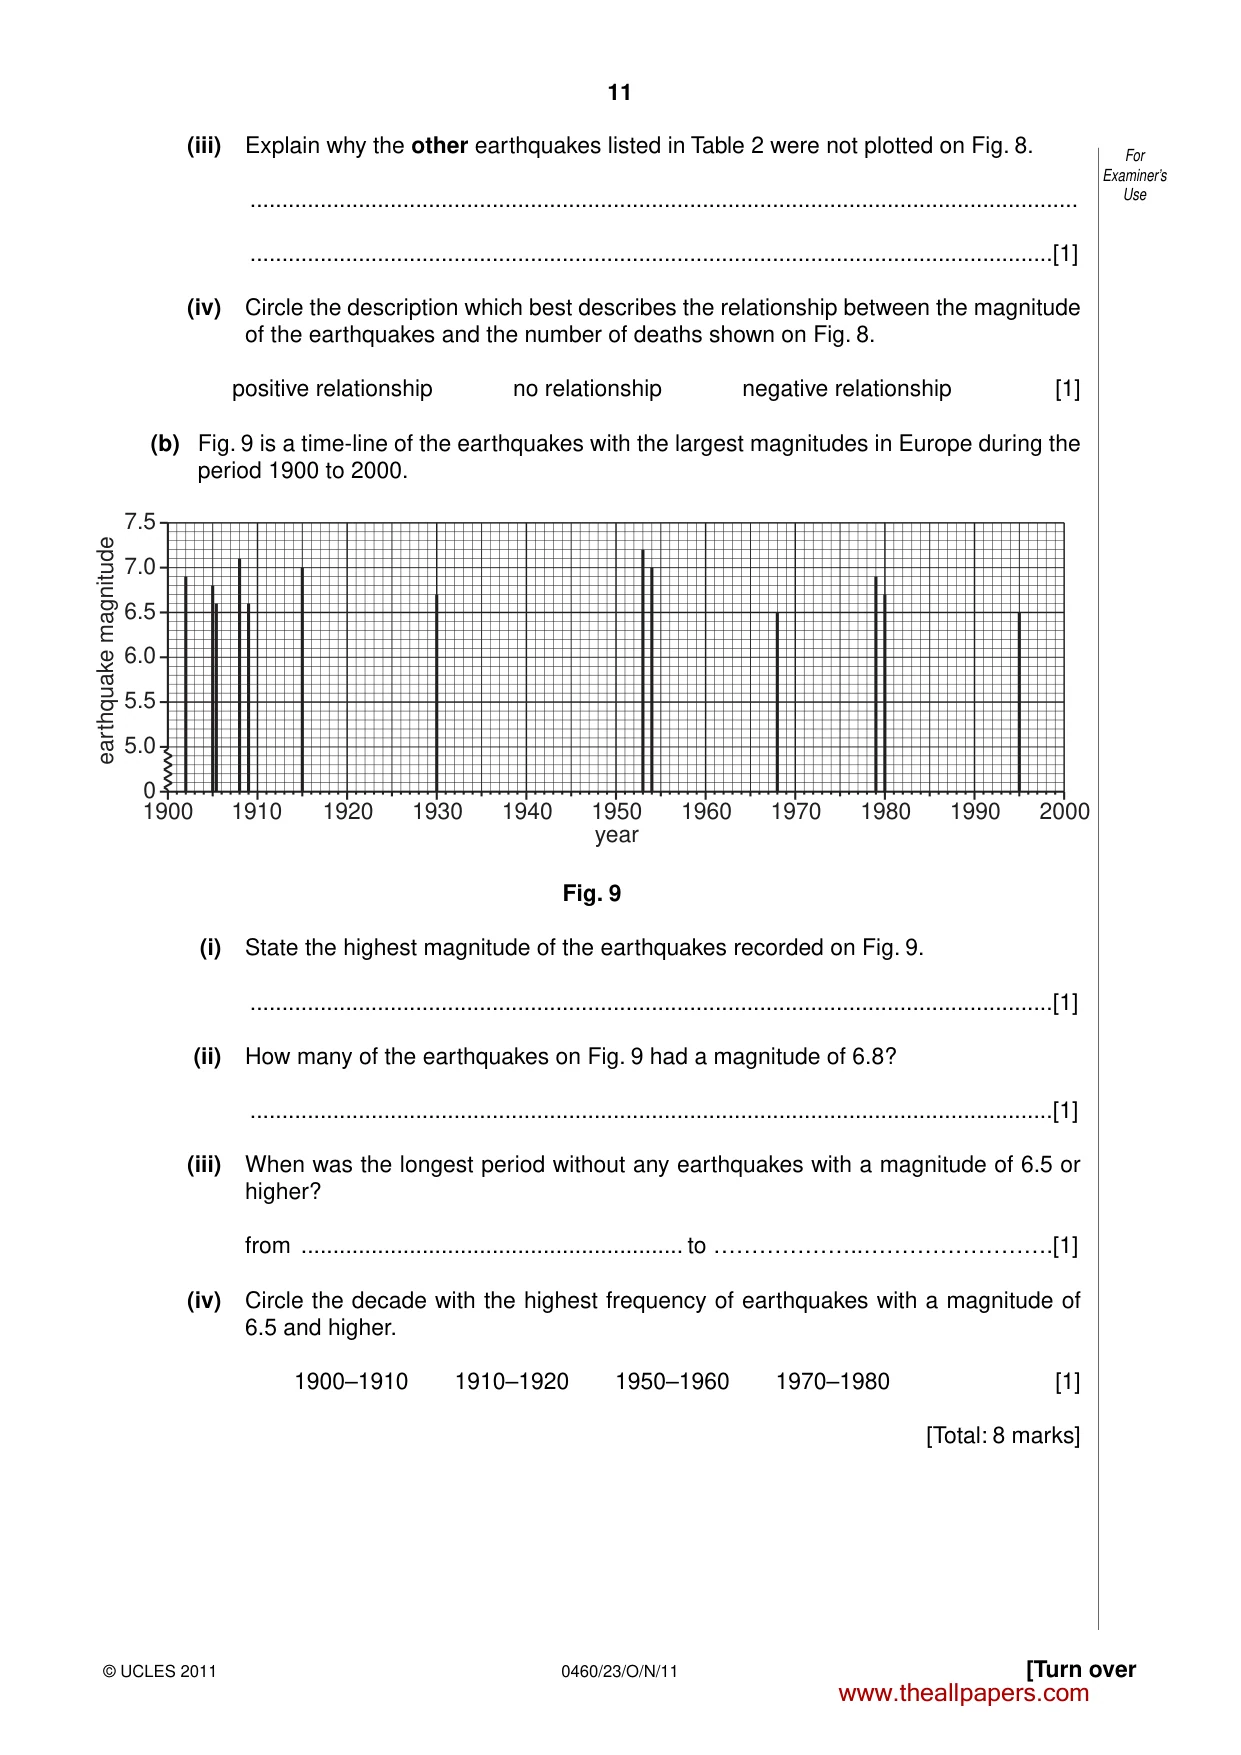
11 [Turn over For Examiner’s Use © UCLES 2011 0460/23/O/N/11 (iii) Explain why the other earthquakes listed in Table 2 were not plotted on Fig. 8. … …[1] (iv) Circle the description which best describes the relationship between the magnitude of the earthquakes and the number of deaths shown on Fig. 8. positive relationship no relationship negative relationship [1] (b) Fig. 9 is a time-line of the earthquakes with the largest magnitudes in Europe during the period 1900 to 2000. 1900 1920 1910 1930 1940 1950 year earthquake magnitude 1960 1970 1980 1990 2000 0 5.0 5.5 6.0 6.5 7.0 7.5 Fig. 9 (i) State the highest magnitude of the earthquakes recorded on Fig. 9. …[1] (ii) How many of the earthquakes on Fig. 9 had a magnitude of 6.8? …[1] (iii) When was the longest period without any earthquakes with a magnitude of 6.5 or higher? from … to ………………..…………………….[1] (iv) Circle the decade with the highest frequency of earthquakes with a magnitude of 6.5 and higher. 1900–1910 1910–1920 1950–1960 1970–1980 [1] [Total: 8 marks] www.theallpapers.com
Question paper, page 12
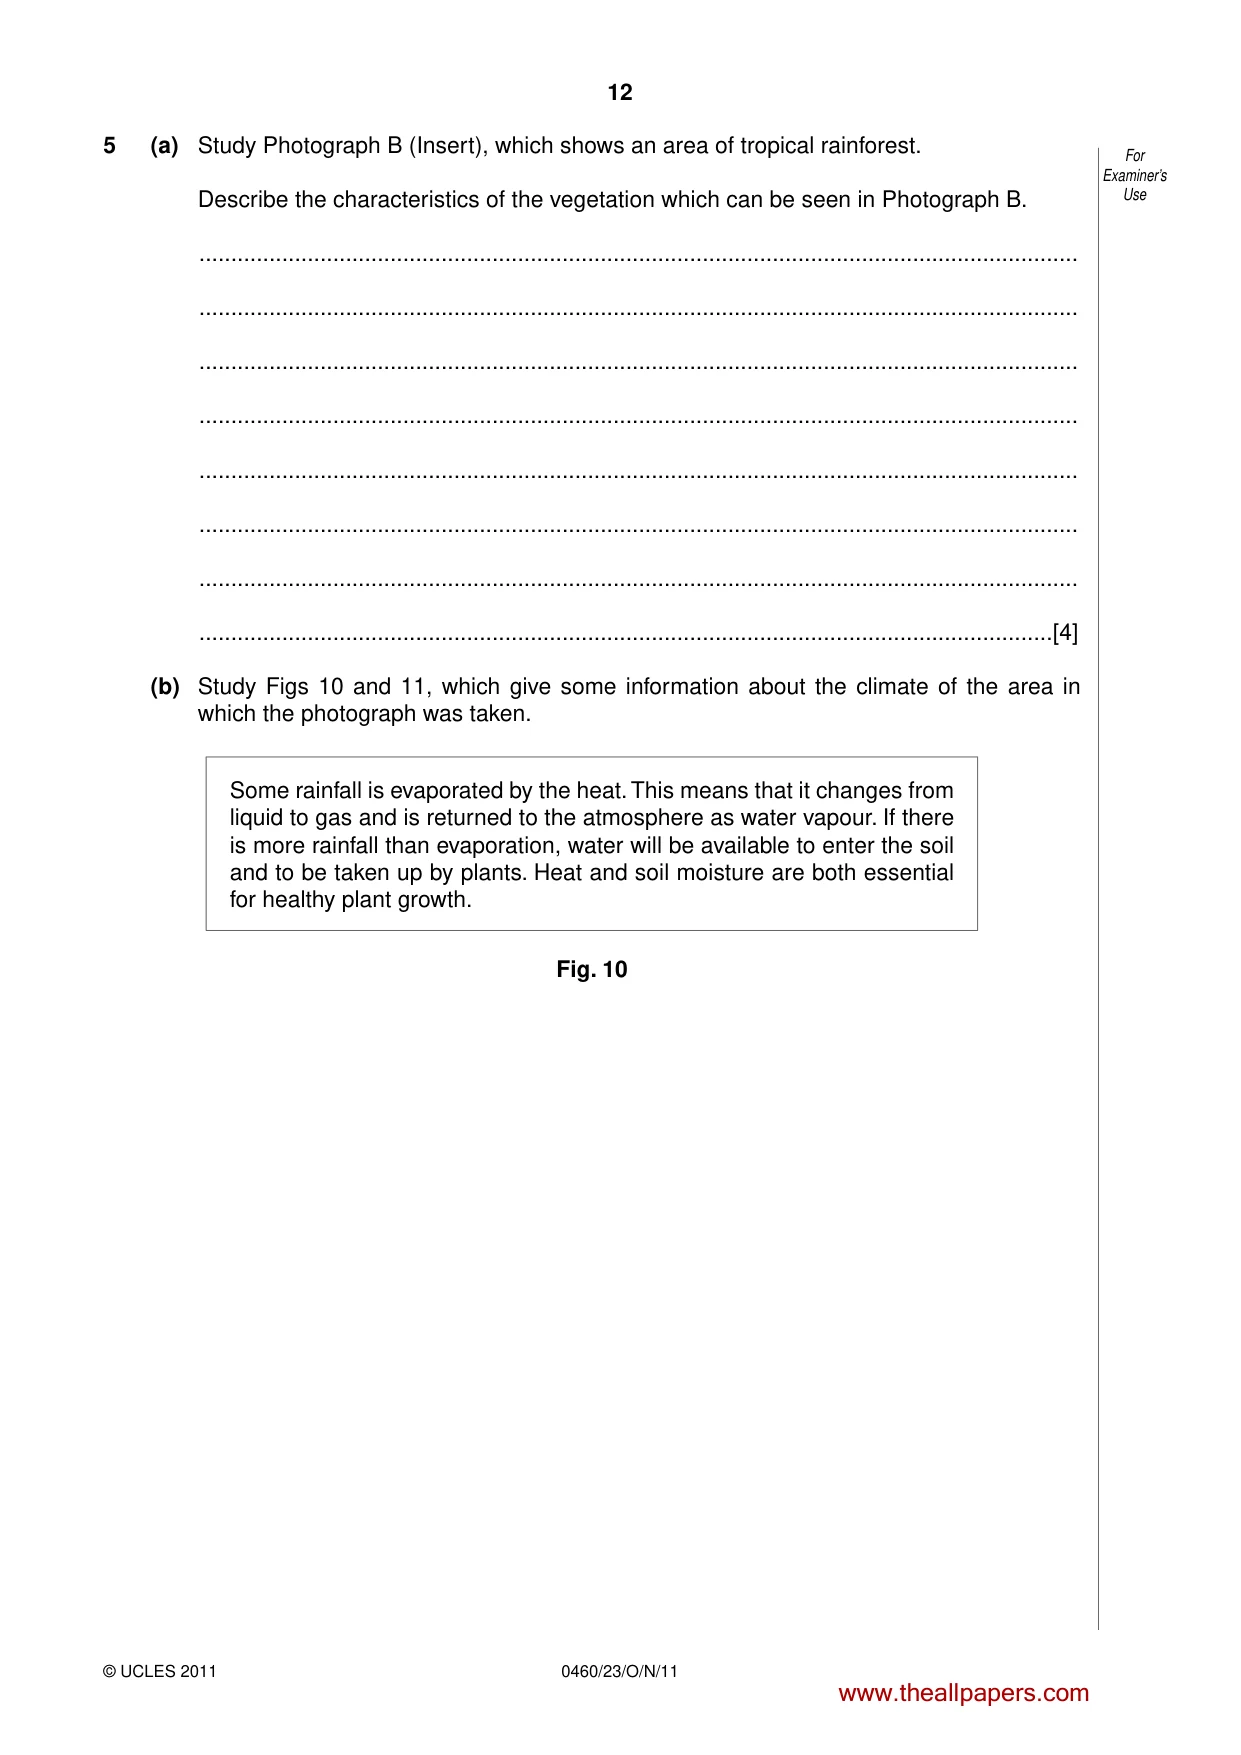
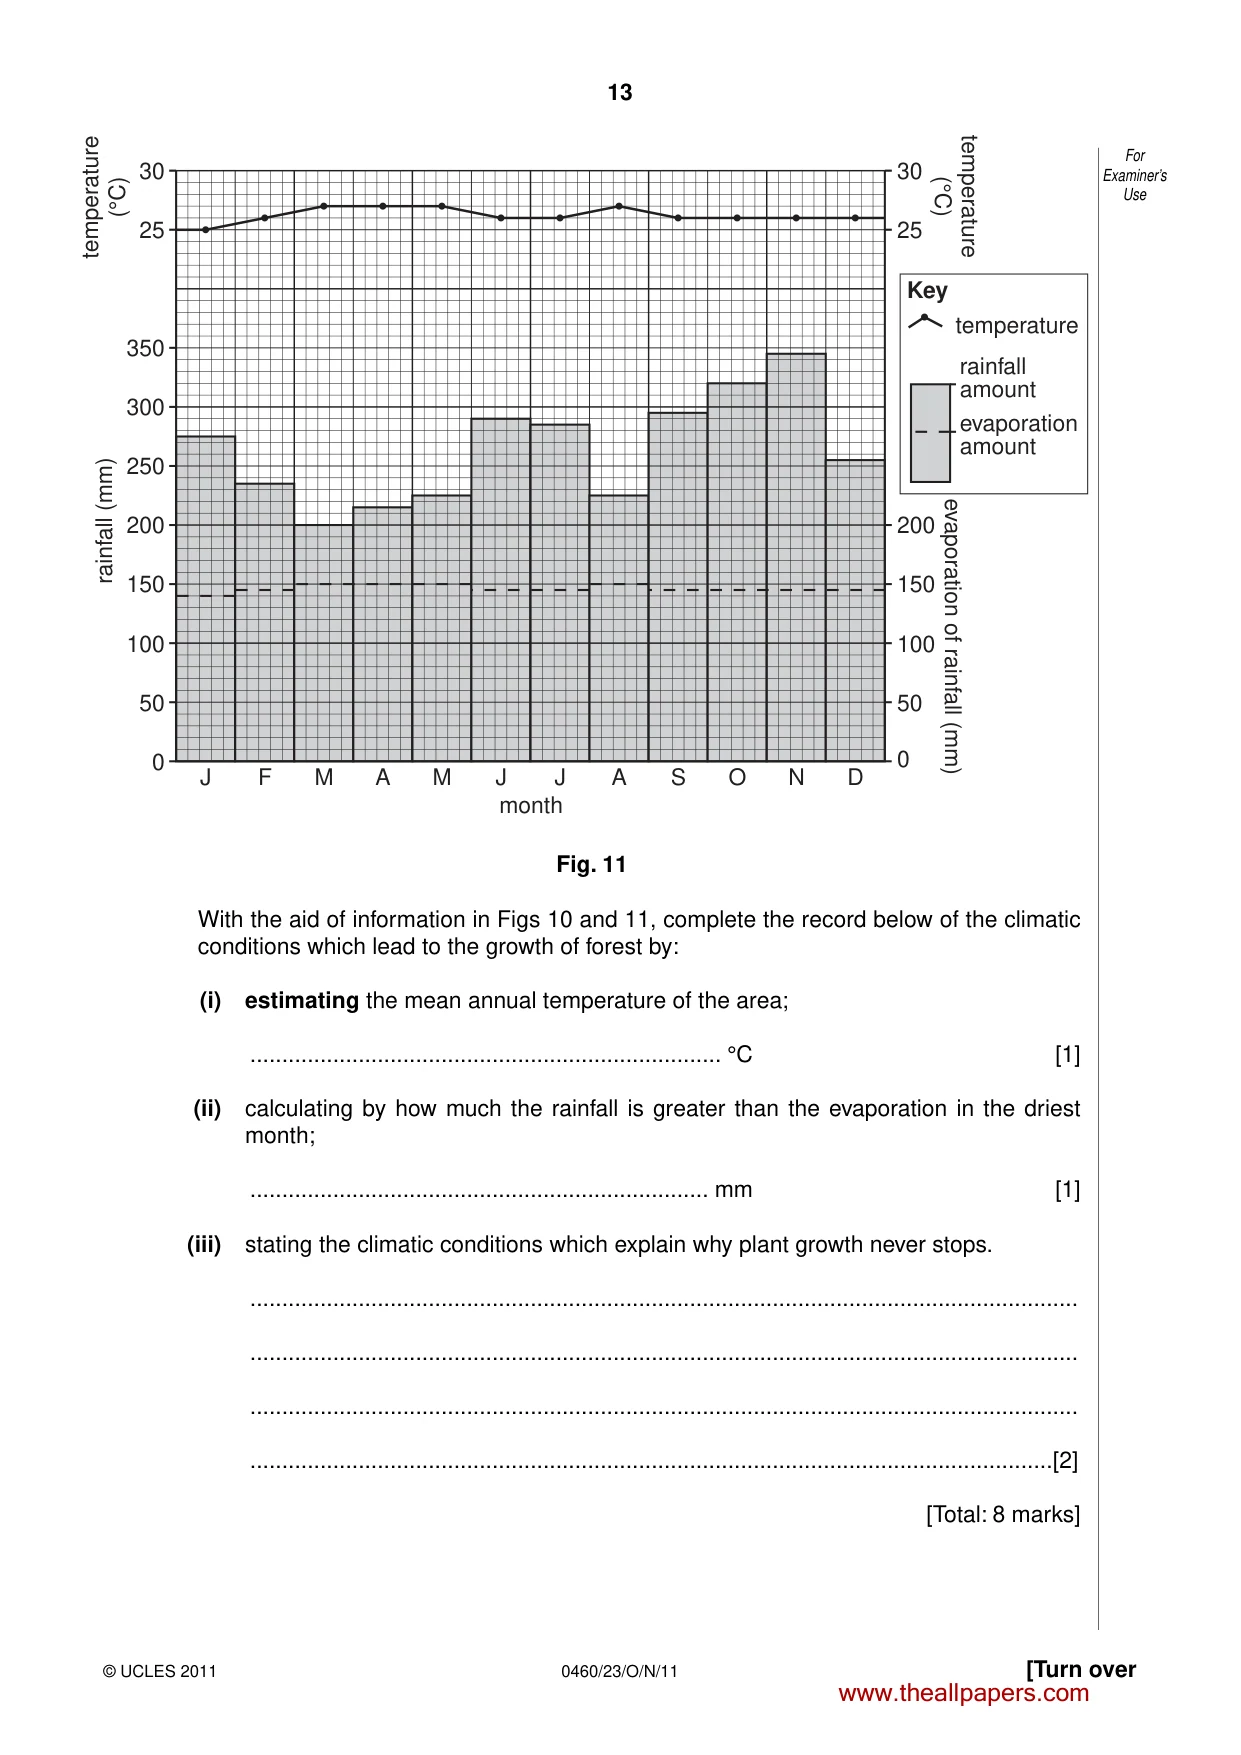
12 For Examiner’s Use 0460/23/O/N/11 © UCLES 2011 5 (a) Study Photograph B (Insert), which shows an area of tropical rainforest. Describe the characteristics of the vegetation which can be seen in Photograph B. … … … … … … … …[4] (b) Study Figs 10 and 11, which give some information about the climate of the area in which the photograph was taken. Some rainfall is evaporated by the heat. This means that it changes from liquid to gas and is returned to the atmosphere as water vapour. If there is more rainfall than evaporation, water will be available to enter the soil and to be taken up by plants. Heat and soil moisture are both essential for healthy plant growth. Fig. 10 www.theallpapers.com
Question paper, page 13
13 [Turn over For Examiner’s Use © UCLES 2011 0460/23/O/N/11 rainfall amount temperature Key evaporation amount J F M A M J J month rainfall (mm) evaporation of rainfall (mm) temperature (°C) temperature (°C) A S O N D 0 50 100 150 200 50 0 100 150 200 250 300 350 25 30 25 30 Fig. 11 With the aid of information in Figs 10 and 11, complete the record below of the climatic conditions which lead to the growth of forest by: (i) estimating the mean annual temperature of the area; … °C [1] (ii) calculating by how much the rainfall is greater than the evaporation in the driest month; … mm [1] (iii) stating the climatic conditions which explain why plant growth never stops. … … … …[2] [Total: 8 marks] www.theallpapers.com
Question paper, page 14
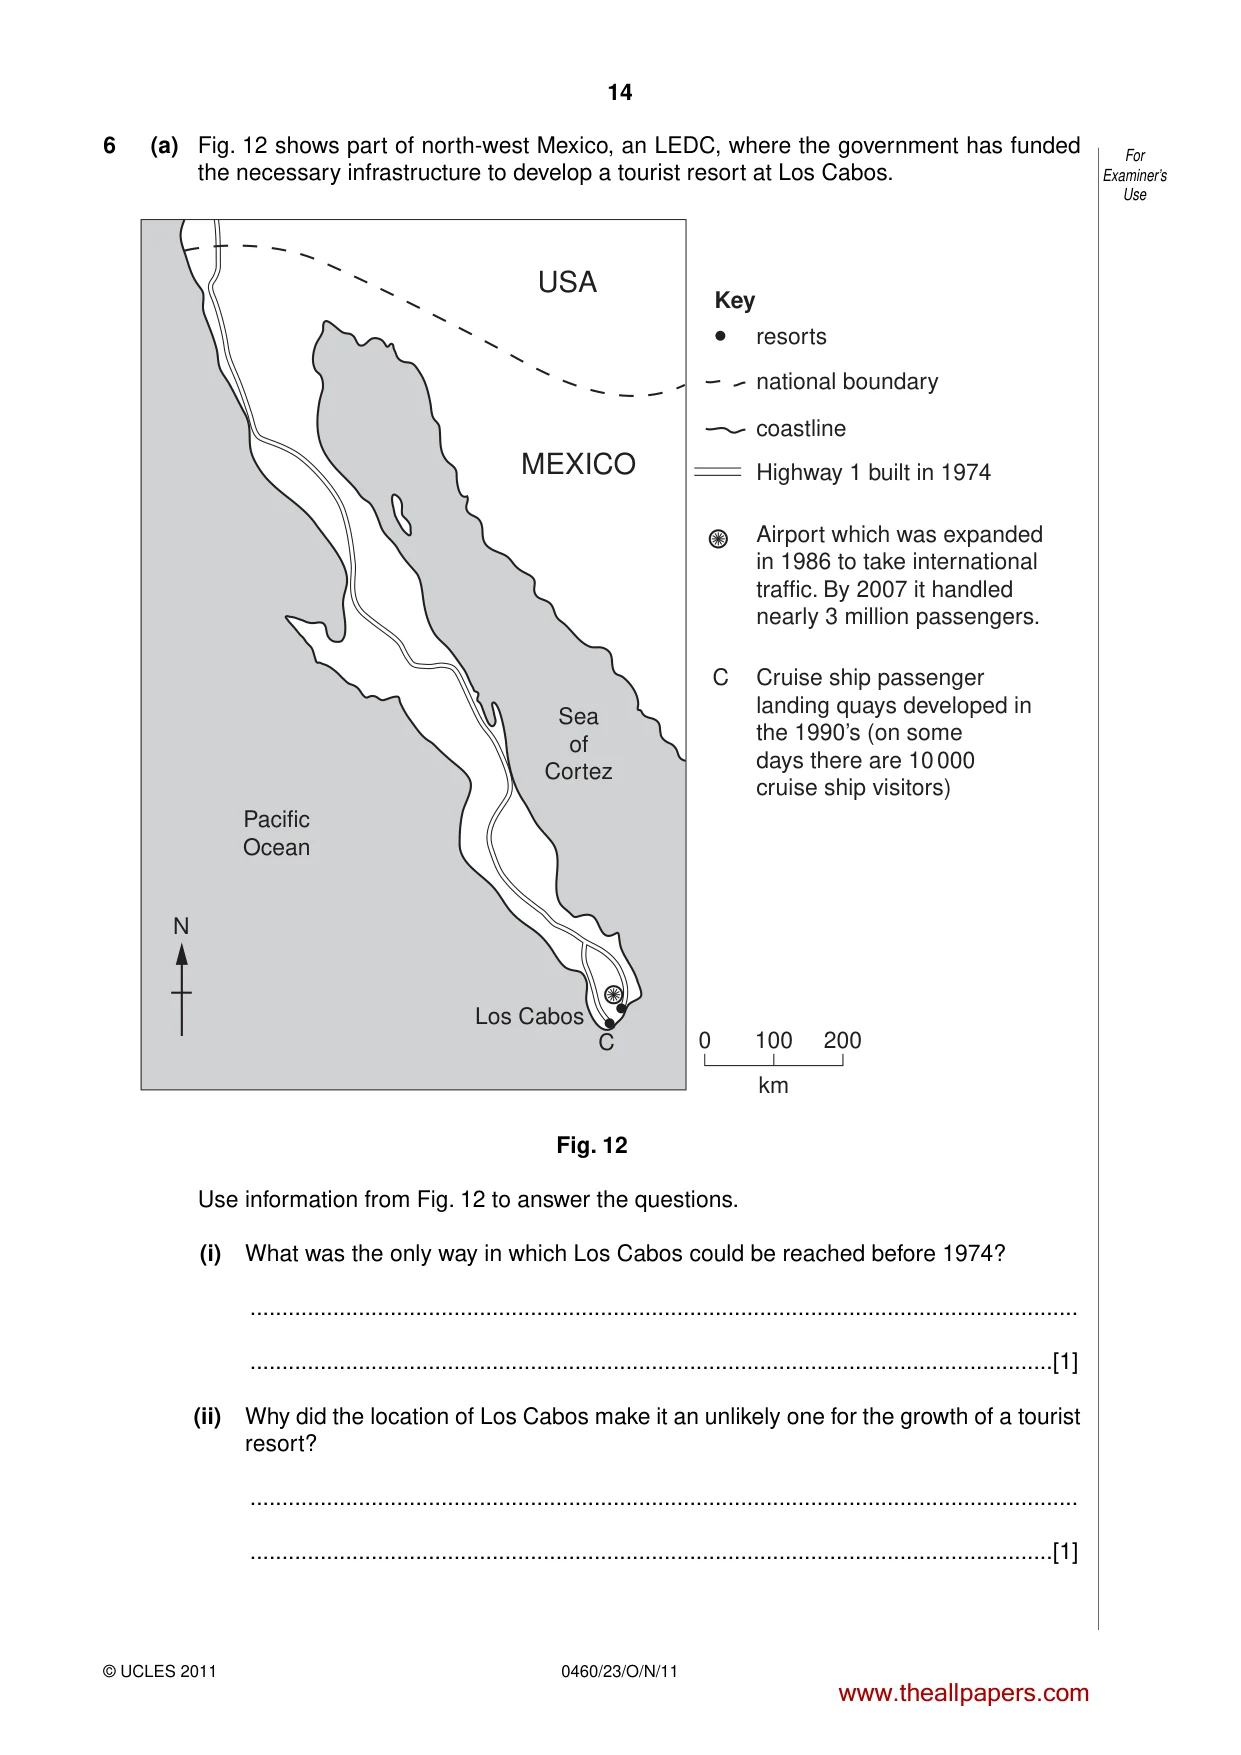
14 For Examiner’s Use 0460/23/O/N/11 © UCLES 2011 6 (a) Fig. 12 shows part of north-west Mexico, an LEDC, where the government has funded the necessary infrastructure to develop a tourist resort at Los Cabos. 0 national boundary resorts Key coastline Highway 1 built in 1974 Airport which was expanded in 1986 to take international traffic. By 2007 it handled nearly 3 million passengers. Cruise ship passenger landing quays developed in the 1990’s (on some days there are 10 000 cruise ship visitors) C 100 km Los Cabos C MEXICO USA Pacific Ocean Sea of Cortez 200 N Fig. 12 Use information from Fig. 12 to answer the questions. (i) What was the only way in which Los Cabos could be reached before 1974? … …[1] (ii) Why did the location of Los Cabos make it an unlikely one for the growth of a tourist resort? … …[1] www.theallpapers.com
Question paper, page 15
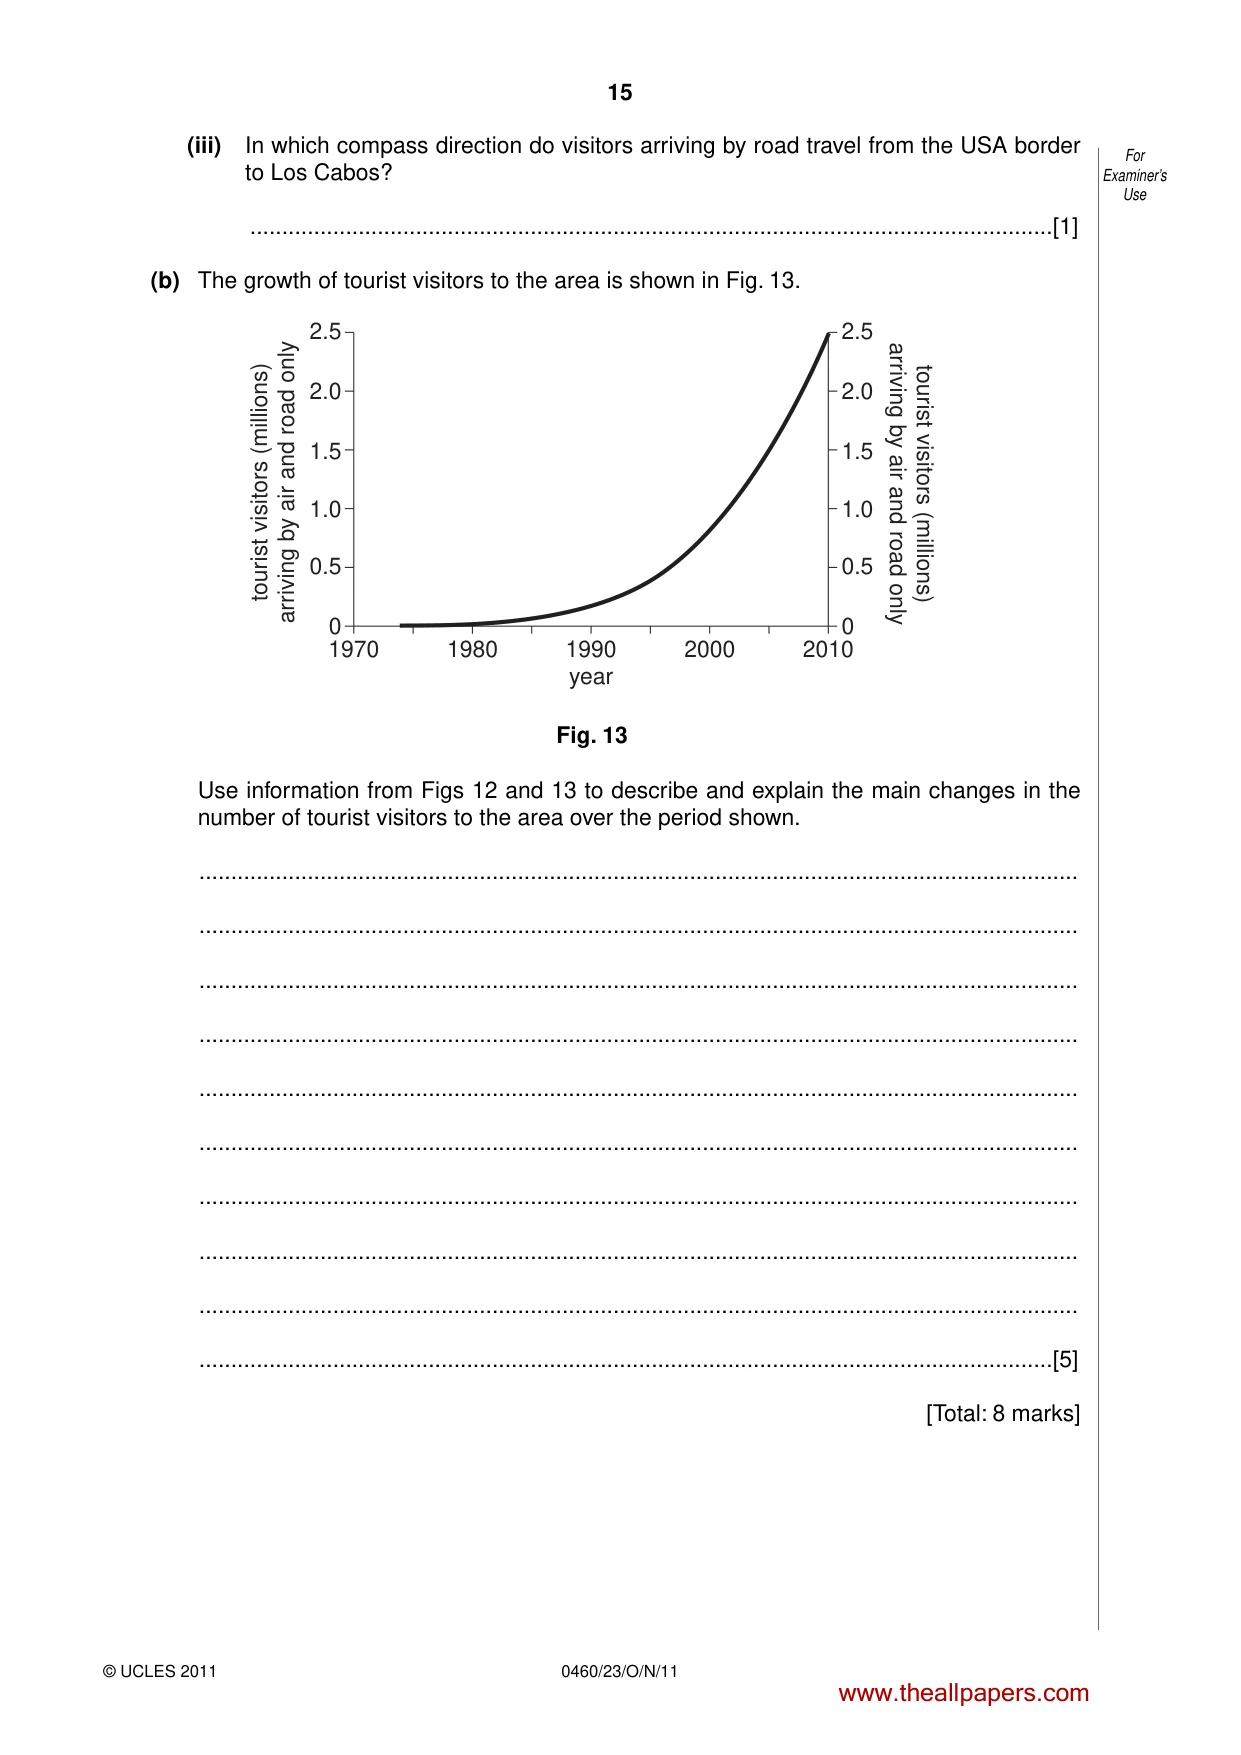
15 For Examiner’s Use © UCLES 2011 0460/23/O/N/11 (iii) In which compass direction do visitors arriving by road travel from the USA border to Los Cabos? …[1] (b) The growth of tourist visitors to the area is shown in Fig. 13. 2.5 2.0 1.5 1.0 tourist visitors (millions) arriving by air and road only tourist visitors (millions) arriving by air and road only 0.5 0 2.5 2.0 1.5 1.0 0.5 0 1970 1980 1990 year 2000 2010 Fig. 13 Use information from Figs 12 and 13 to describe and explain the main changes in the number of tourist visitors to the area over the period shown. … … … … … … … … … …[5] [Total: 8 marks] www.theallpapers.com
Question paper, page 16
16 0460/23/O/N/11 © UCLES 2011 BLANK PAGE Copyright Acknowledgements: Question 2 Photograph A Muriel Fretwell © UCLES. Question 3 Fig. 5 © http://www.txcindia.com/html/fabrics. Question 4 Figs 8 and 9, Table 2 © http://www.emsc-csem.org/index. Question 5 Photograph B Muriel Fretwell © UCLES. Permission to reproduce items where third-party owned material protected by copyright is included has been sought and cleared where possible. Every reasonable effort has been made by the publisher (UCLES) to trace copyright holders, but if any items requiring clearance have unwittingly been included, the publisher will be pleased to make amends at the earliest possible opportunity. University of Cambridge International Examinations is part of the Cambridge Assessment Group. Cambridge Assessment is the brand name of University of Cambridge Local Examinations Syndicate (UCLES), which is itself a department of the University of Cambridge. www.theallpapers.com
Mark scheme, page 1
UNIVERSITY OF CAMBRIDGE INTERNATIONAL EXAMINATIONS International General Certificate of Secondary Education MARK SCHEME for the October/November 2011 question paper for the guidance of teachers 0460 GEOGRAPHY 0460/23 Paper 2, maximum raw mark 60 This mark scheme is published as an aid to teachers and candidates, to indicate the requirements of the examination. It shows the basis on which Examiners were instructed to award marks. It does not indicate the details of the discussions that took place at an Examiners’ meeting before marking began, which would have considered the acceptability of alternative answers. Mark schemes must be read in conjunction with the question papers and the report on the examination. • Cambridge will not enter into discussions or correspondence in connection with these mark schemes. Cambridge is publishing the mark schemes for the October/November 2011 question papers for most IGCSE, GCE Advanced Level and Advanced Subsidiary Level syllabuses and some Ordinary Level syllabuses. www.theallpapers.com
Mark scheme, page 2
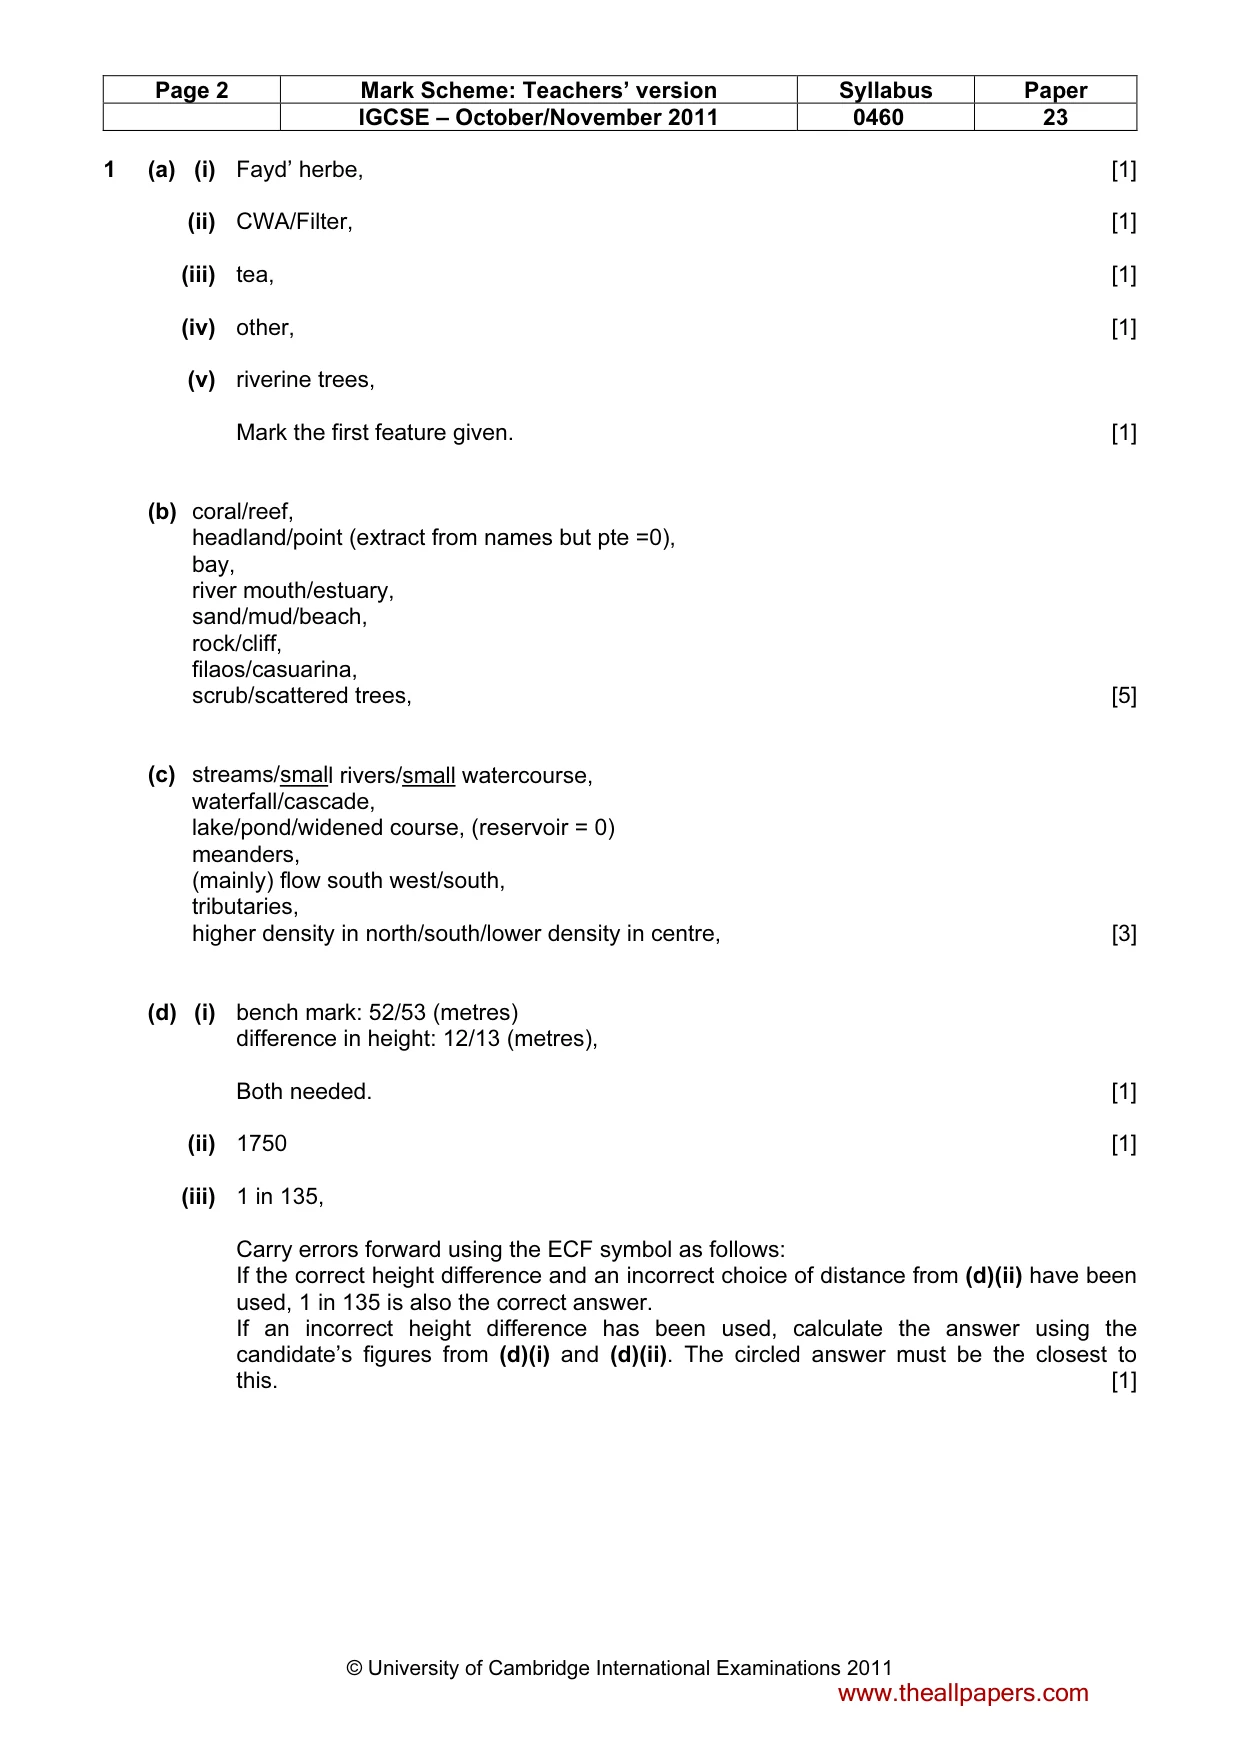
Page 2 Mark Scheme: Teachers’ version Syllabus Paper IGCSE – October/November 2011 0460 23 © University of Cambridge International Examinations 2011 1 (a) (i) Fayd’ herbe, [1] (ii) CWA/Filter, [1] (iii) tea, [1] (iv) other, [1] (v) riverine trees, Mark the first feature given. [1] (b) coral/reef, headland/point (extract from names but pte =0), bay, river mouth/estuary, sand/mud/beach, rock/cliff, filaos/casuarina, scrub/scattered trees, [5] (c) streams/small rivers/small watercourse, waterfall/cascade, lake/pond/widened course, (reservoir = 0) meanders, (mainly) flow south west/south, tributaries, higher density in north/south/lower density in centre, [3] (d) (i) bench mark: 52/53 (metres) difference in height: 12/13 (metres), Both needed. [1] (ii) 1750 [1] (iii) 1 in 135, Carry errors forward using the ECF symbol as follows: If the correct height difference and an incorrect choice of distance from (d)(ii) have been used, 1 in 135 is also the correct answer. If an incorrect height difference has been used, calculate the answer using the candidate’s figures from (d)(i) and (d)(ii). The circled answer must be the closest to this. [1] www.theallpapers.com
Mark scheme, page 3
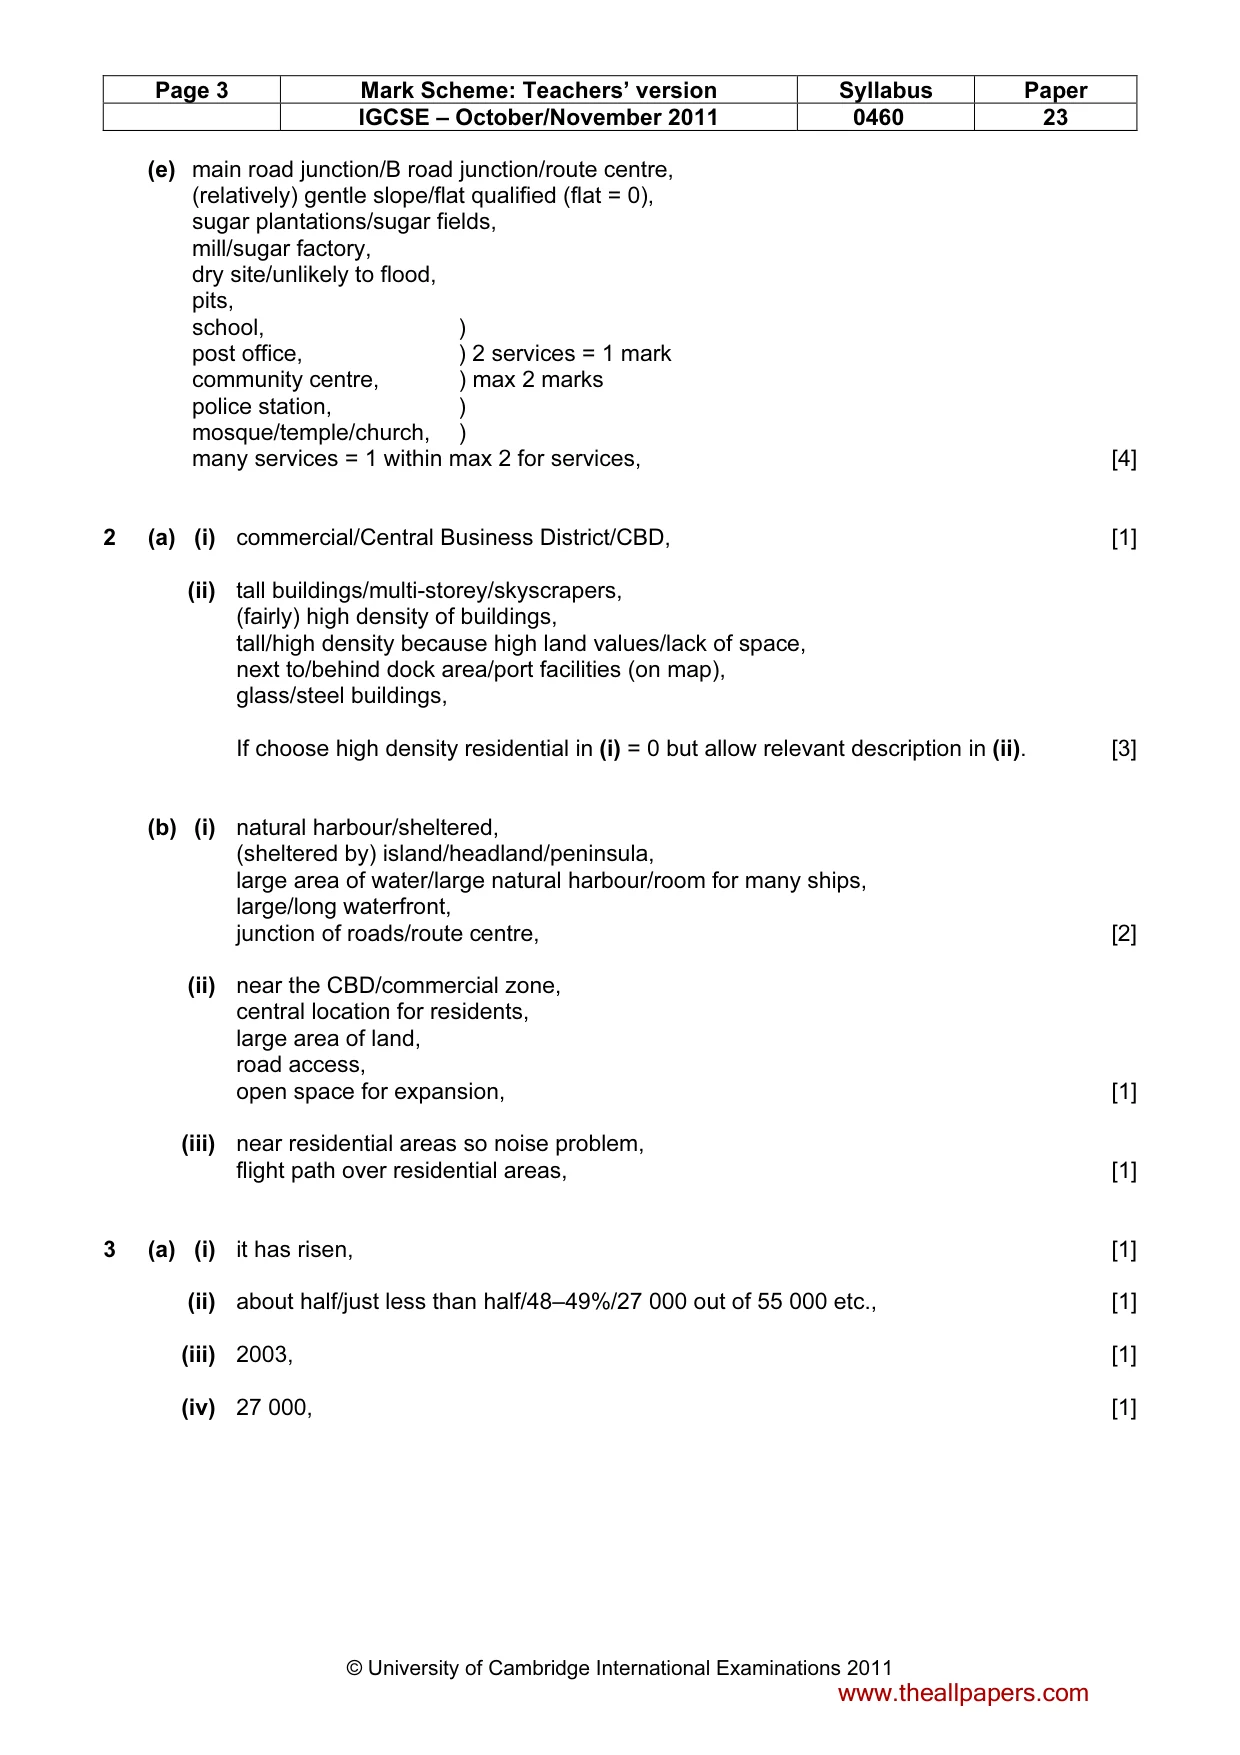
Page 3 Mark Scheme: Teachers’ version Syllabus Paper IGCSE – October/November 2011 0460 23 © University of Cambridge International Examinations 2011 (e) main road junction/B road junction/route centre, (relatively) gentle slope/flat qualified (flat = 0), sugar plantations/sugar fields, mill/sugar factory, dry site/unlikely to flood, pits, school, ) post office, ) 2 services = 1 mark community centre, ) max 2 marks police station, ) mosque/temple/church, ) many services = 1 within max 2 for services, [4] 2 (a) (i) commercial/Central Business District/CBD, [1] (ii) tall buildings/multi-storey/skyscrapers, (fairly) high density of buildings, tall/high density because high land values/lack of space, next to/behind dock area/port facilities (on map), glass/steel buildings, If choose high density residential in (i) = 0 but allow relevant description in (ii). [3] (b) (i) natural harbour/sheltered, (sheltered by) island/headland/peninsula, large area of water/large natural harbour/room for many ships, large/long waterfront, junction of roads/route centre, [2] (ii) near the CBD/commercial zone, central location for residents, large area of land, road access, open space for expansion, [1] (iii) near residential areas so noise problem, flight path over residential areas, [1] 3 (a) (i) it has risen, [1] (ii) about half/just less than half/48–49%/27 000 out of 55 000 etc., [1] (iii) 2003, [1] (iv) 27 000, [1] www.theallpapers.com
Mark scheme, page 4
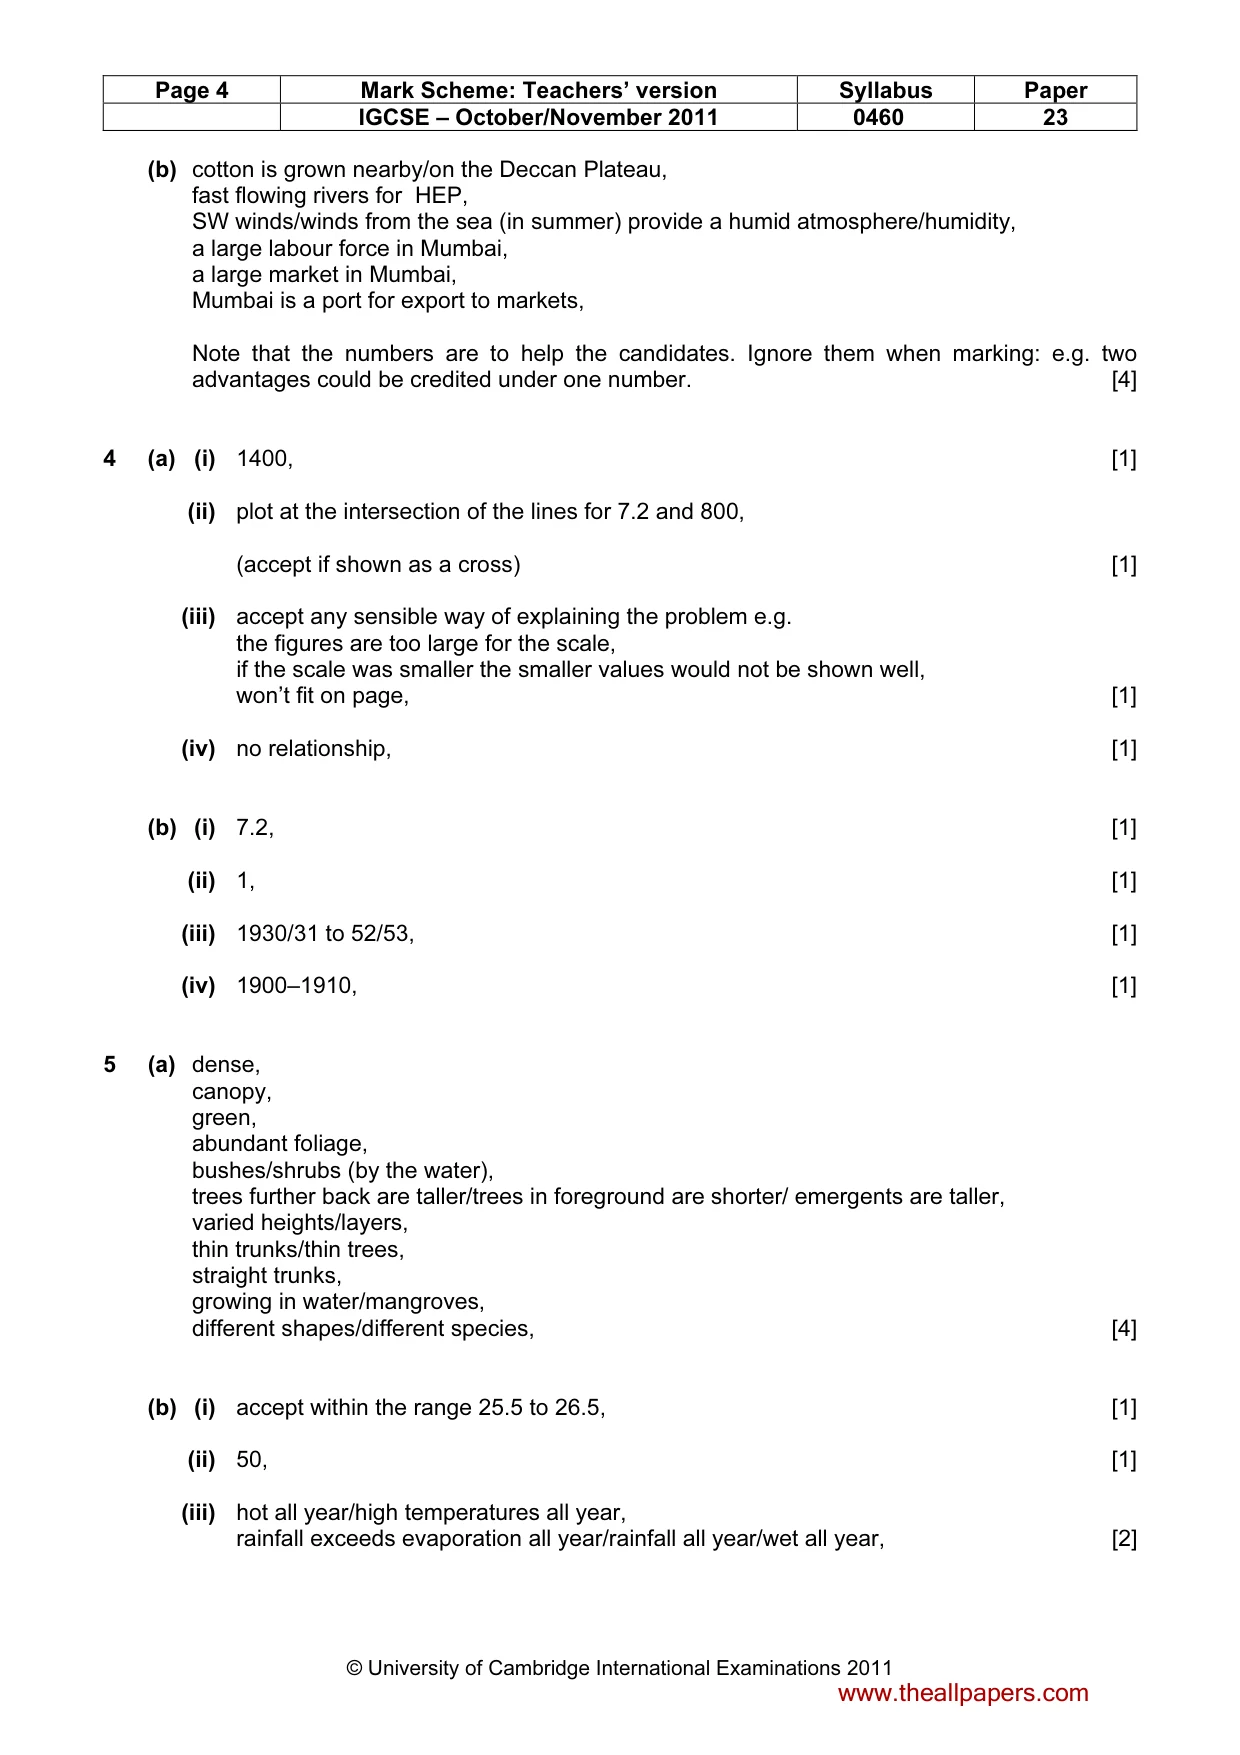
Page 4 Mark Scheme: Teachers’ version Syllabus Paper IGCSE – October/November 2011 0460 23 © University of Cambridge International Examinations 2011 (b) cotton is grown nearby/on the Deccan Plateau, fast flowing rivers for HEP, SW winds/winds from the sea (in summer) provide a humid atmosphere/humidity, a large labour force in Mumbai, a large market in Mumbai, Mumbai is a port for export to markets, Note that the numbers are to help the candidates. Ignore them when marking: e.g. two advantages could be credited under one number. [4] 4 (a) (i) 1400, [1] (ii) plot at the intersection of the lines for 7.2 and 800, (accept if shown as a cross) [1] (iii) accept any sensible way of explaining the problem e.g. the figures are too large for the scale, if the scale was smaller the smaller values would not be shown well, won’t fit on page, [1] (iv) no relationship, [1] (b) (i) 7.2, [1] (ii) 1, [1] (iii) 1930/31 to 52/53, [1] (iv) 1900–1910, [1] 5 (a) dense, canopy, green, abundant foliage, bushes/shrubs (by the water), trees further back are taller/trees in foreground are shorter/ emergents are taller, varied heights/layers, thin trunks/thin trees, straight trunks, growing in water/mangroves, different shapes/different species, [4] (b) (i) accept within the range 25.5 to 26.5, [1] (ii) 50, [1] (iii) hot all year/high temperatures all year, rainfall exceeds evaporation all year/rainfall all year/wet all year, [2] www.theallpapers.com
Mark scheme, page 5
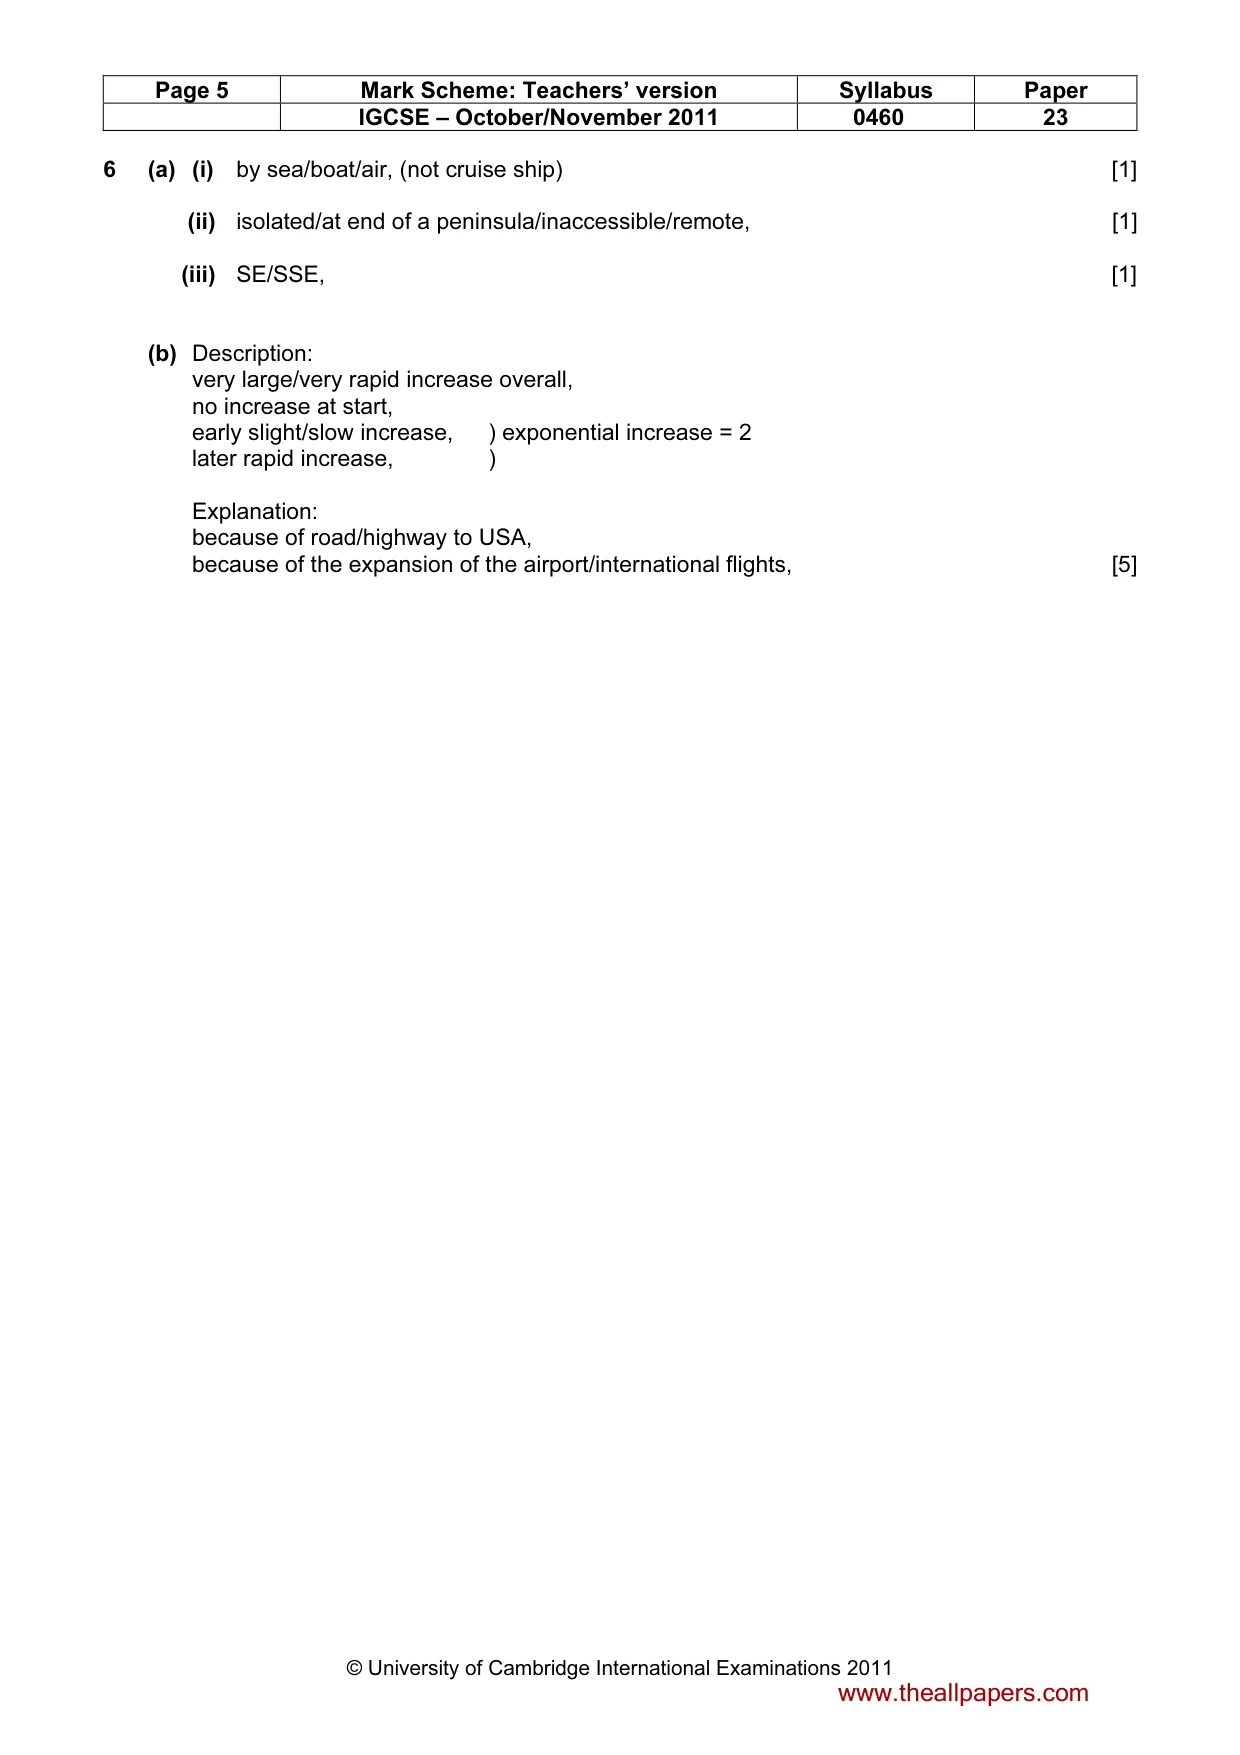
Page 5 Mark Scheme: Teachers’ version Syllabus Paper IGCSE – October/November 2011 0460 23 © University of Cambridge International Examinations 2011 6 (a) (i) by sea/boat/air, (not cruise ship) [1] (ii) isolated/at end of a peninsula/inaccessible/remote, [1] (iii) SE/SSE, [1] (b) Description: very large/very rapid increase overall, no increase at start, early slight/slow increase, ) exponential increase = 2 later rapid increase, ) Explanation: because of road/highway to USA, because of the expansion of the airport/international flights, [5] www.theallpapers.com
What you needed in this session
Cambridge’s own grade thresholds for 2011 Oct/Nov, Paper 2 · Variant 3. A higher threshold means an easier paper — the bar moves with how the cohort did.