Cambridge IGCSE Geography 0460 — 2011 May/June Paper 4 · Variant 1
0460/41/M/J/11 · 60 marks · ≈68 min
The question paper and its mark scheme, free to read here and free to download. This is Cambridge’s own paper, exactly as it was sat.
Question paper16 pages

Mark scheme5 pages
Answers below. Sit the paper first if you are practising.
Paper as text
Question paper, page 1
This document consists of 14 printed pages, 2 blank pages and 1 Insert. DC (SM/DJ) 32335/6 © UCLES 2011 [Turn over UNIVERSITY OF CAMBRIDGE INTERNATIONAL EXAMINATIONS International General Certificate of Secondary Education * 5 5 7 2 3 6 2 8 2 3 * GEOGRAPHY 0460/41 Paper 4 Alternative to Coursework May/June 2011 1 hour 30 minutes Candidates answer on the Question Paper. Additional Materials: Calculator Ruler READ THESE INSTRUCTIONS FIRST Write your Centre number, candidate number and name in the spaces provided. Write in dark blue or black pen. You may use a soft pencil for any diagrams, graphs or rough working. Do not use staples, paper clips, highlighters, glue or correction fluid. DO NOT WRITE ON ANY BARCODES. Answer all questions. The Insert contains Figs 1 and 2 for Question 1 and Figs 4 and 6 and Tables 3 and 4 for Question 2. The Insert is not required by the Examiner. Sketch maps and diagrams should be drawn whenever they serve to illustrate an answer. The number of marks is given in brackets [ ] at the end of each question or part question. www.theallpapers.com
Question paper, page 2
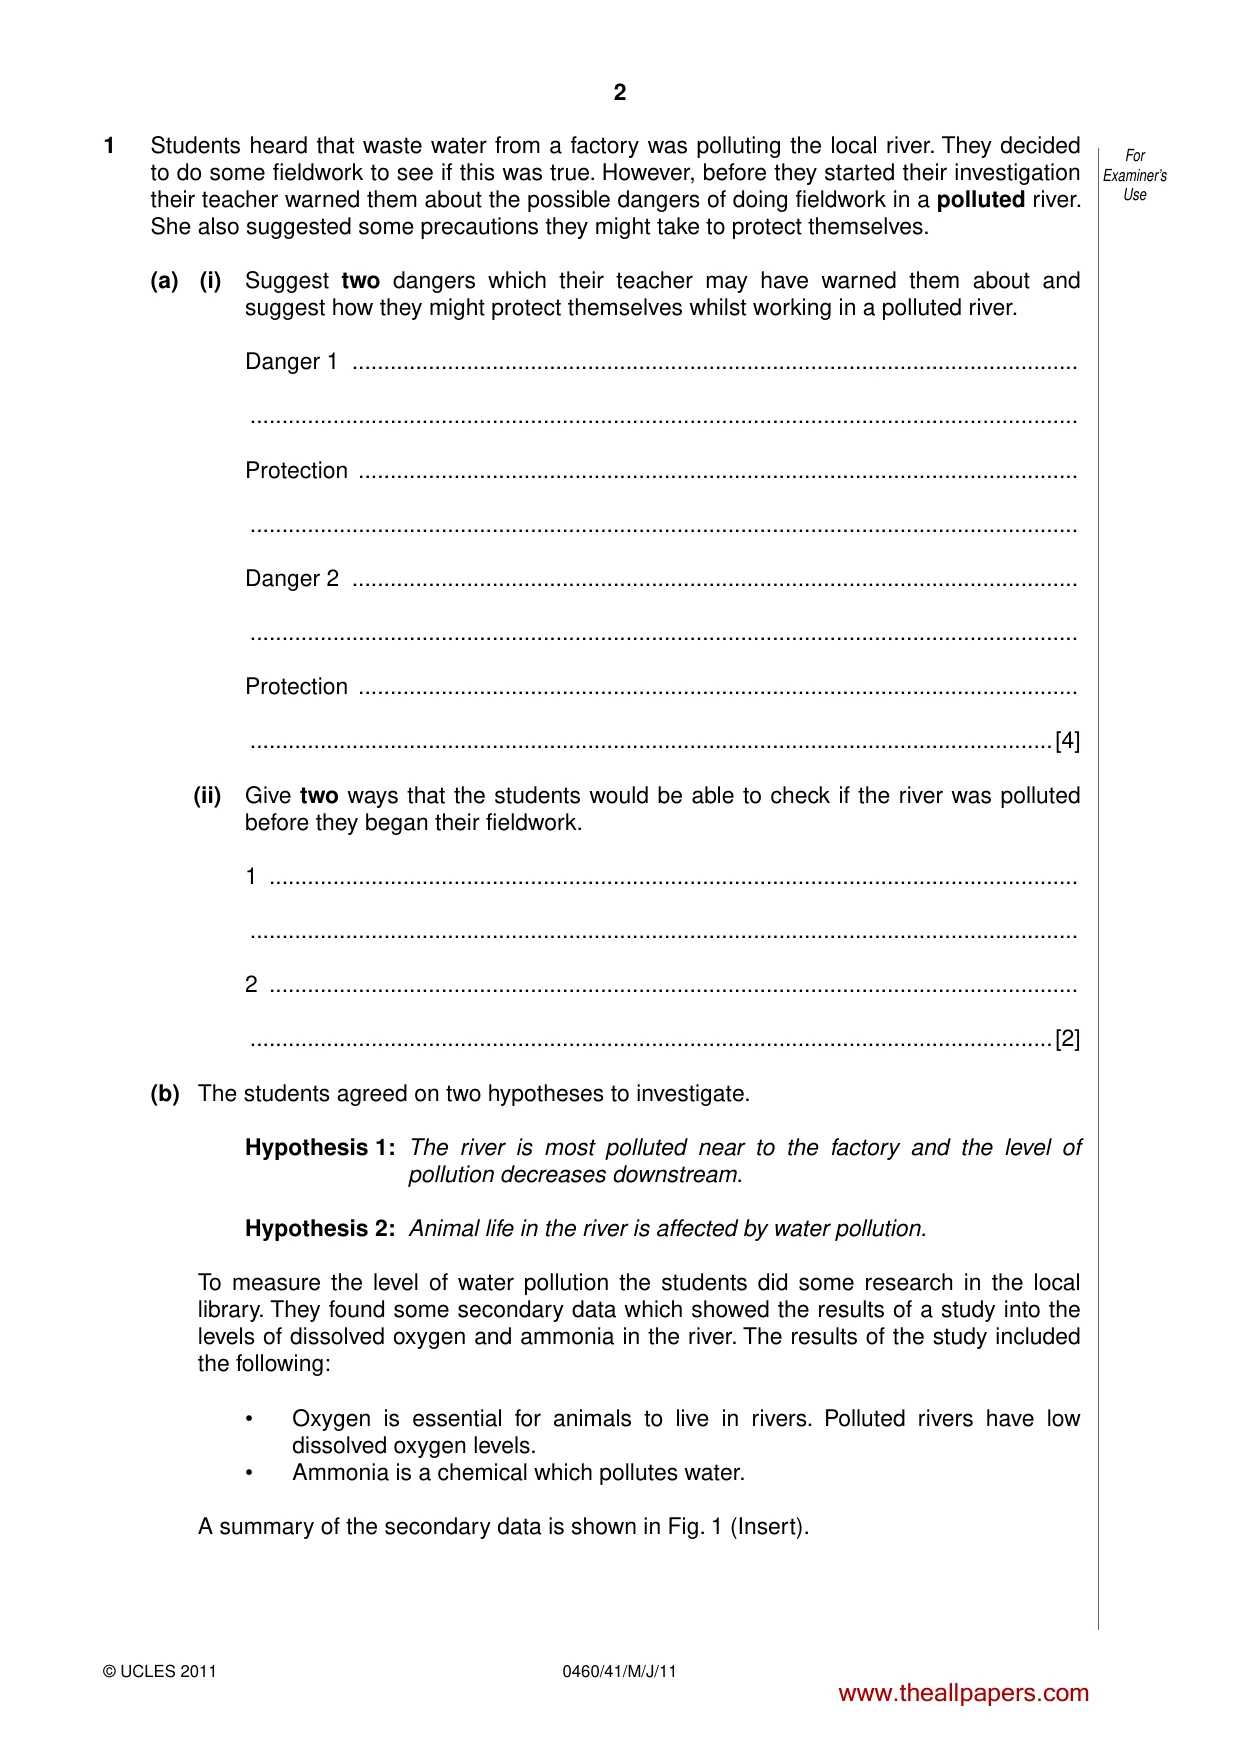
2 0460/41/M/J/11 © UCLES 2011 For Examiner’s Use 1 Students heard that waste water from a factory was polluting the local river. They decided to do some fieldwork to see if this was true. However, before they started their investigation their teacher warned them about the possible dangers of doing fieldwork in a polluted river. She also suggested some precautions they might take to protect themselves. (a) (i) Suggest two dangers which their teacher may have warned them about and suggest how they might protect themselves whilst working in a polluted river. Danger 1 … … Protection … … Danger 2 … … Protection … …[4] (ii) Give two ways that the students would be able to check if the river was polluted before they began their fieldwork. 1 … … 2 … …[2] (b) The students agreed on two hypotheses to investigate. Hypothesis 1: The river is most polluted near to the factory and the level of pollution decreases downstream. Hypothesis 2: Animal life in the river is affected by water pollution. To measure the level of water pollution the students did some research in the local library. They found some secondary data which showed the results of a study into the levels of dissolved oxygen and ammonia in the river. The results of the study included the following: • Oxygen is essential for animals to live in rivers. Polluted rivers have low dissolved oxygen levels. • Ammonia is a chemical which pollutes water. A summary of the secondary data is shown in Fig. 1 (Insert). www.theallpapers.com
Question paper, page 3
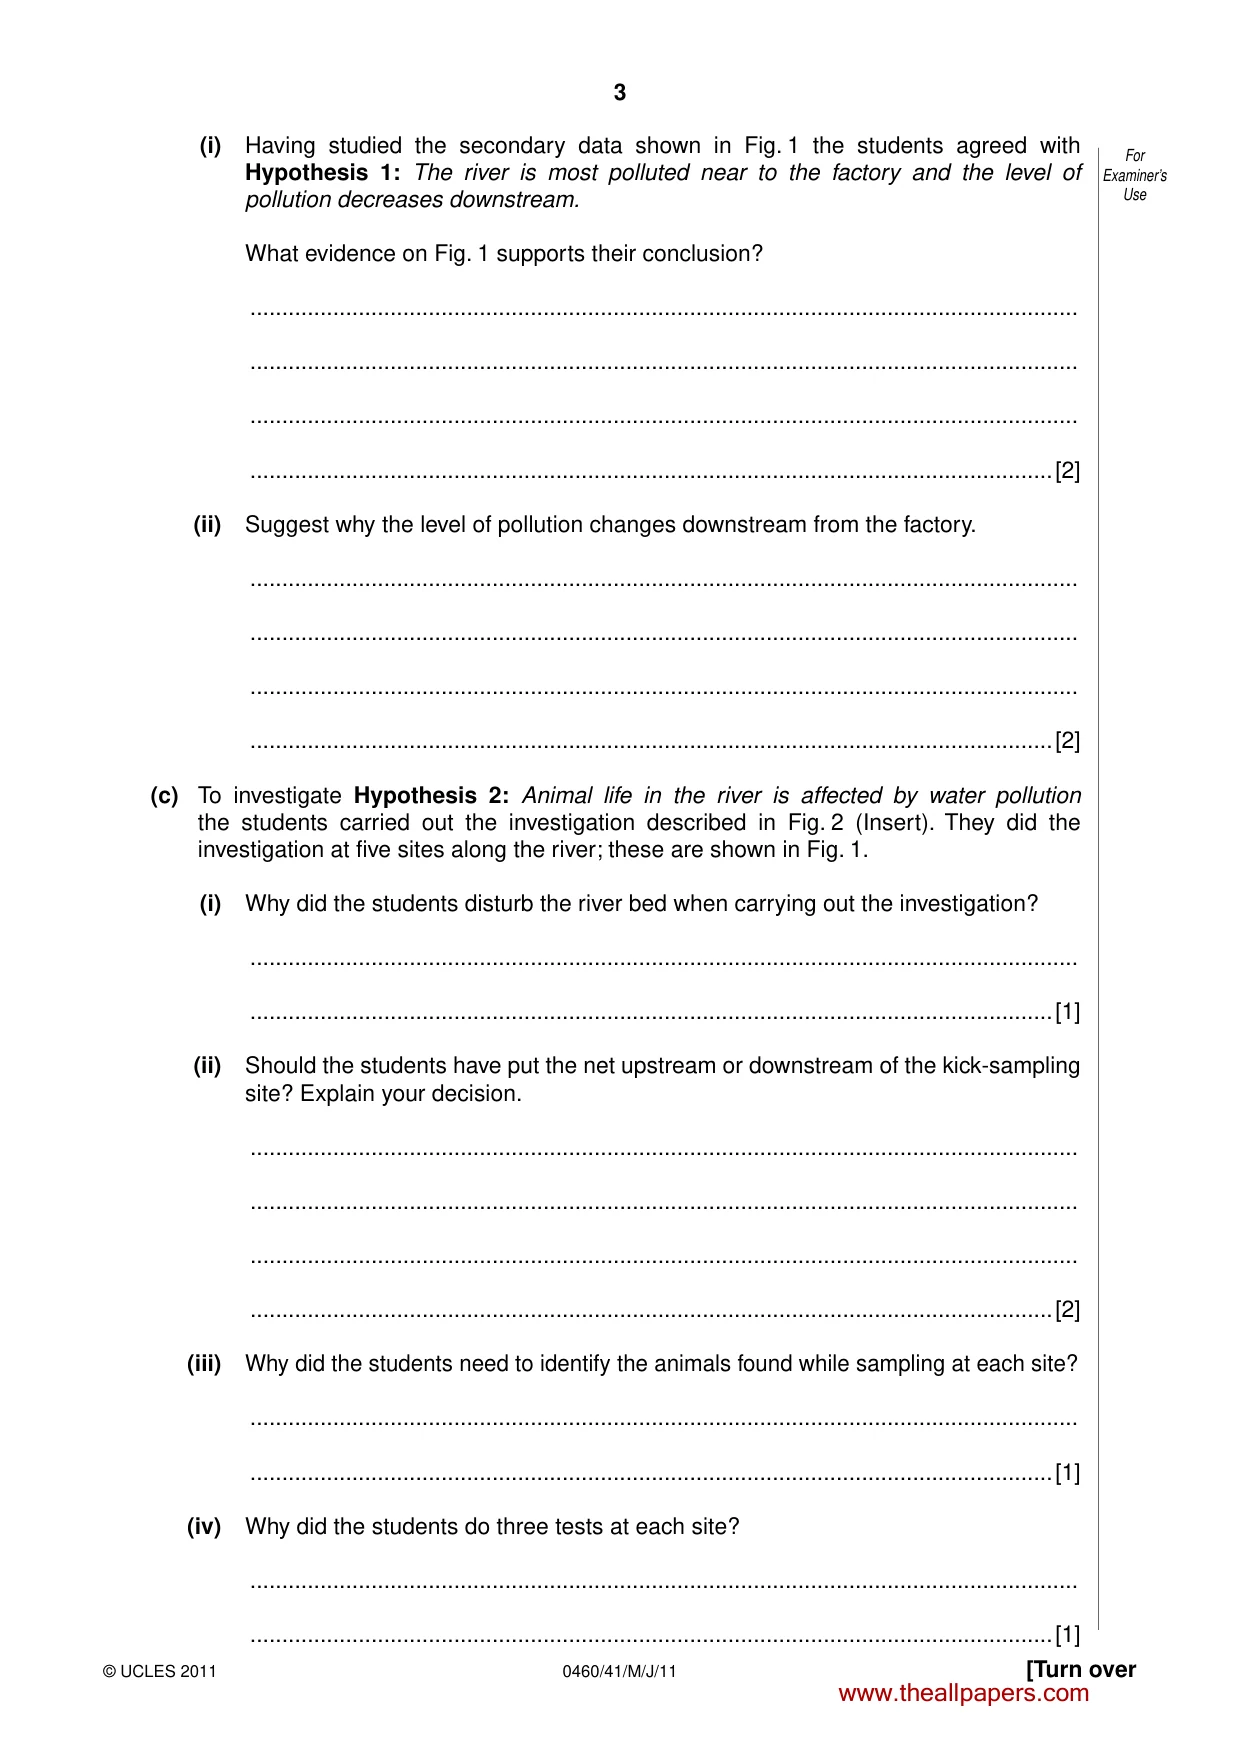
3 [Turn over © UCLES 2011 0460/41/M/J/11 For Examiner’s Use (i) Having studied the secondary data shown in Fig. 1 the students agreed with Hypothesis 1: The river is most polluted near to the factory and the level of pollution decreases downstream. What evidence on Fig. 1 supports their conclusion? … … … …[2] (ii) Suggest why the level of pollution changes downstream from the factory. … … … …[2] (c) To investigate Hypothesis 2: Animal life in the river is affected by water pollution the students carried out the investigation described in Fig. 2 (Insert). They did the investigation at five sites along the river; these are shown in Fig. 1. (i) Why did the students disturb the river bed when carrying out the investigation? … …[1] (ii) Should the students have put the net upstream or downstream of the kick-sampling site? Explain your decision. … … … …[2] (iii) Why did the students need to identify the animals found while sampling at each site? … …[1] (iv) Why did the students do three tests at each site? … …[1] www.theallpapers.com
Question paper, page 4
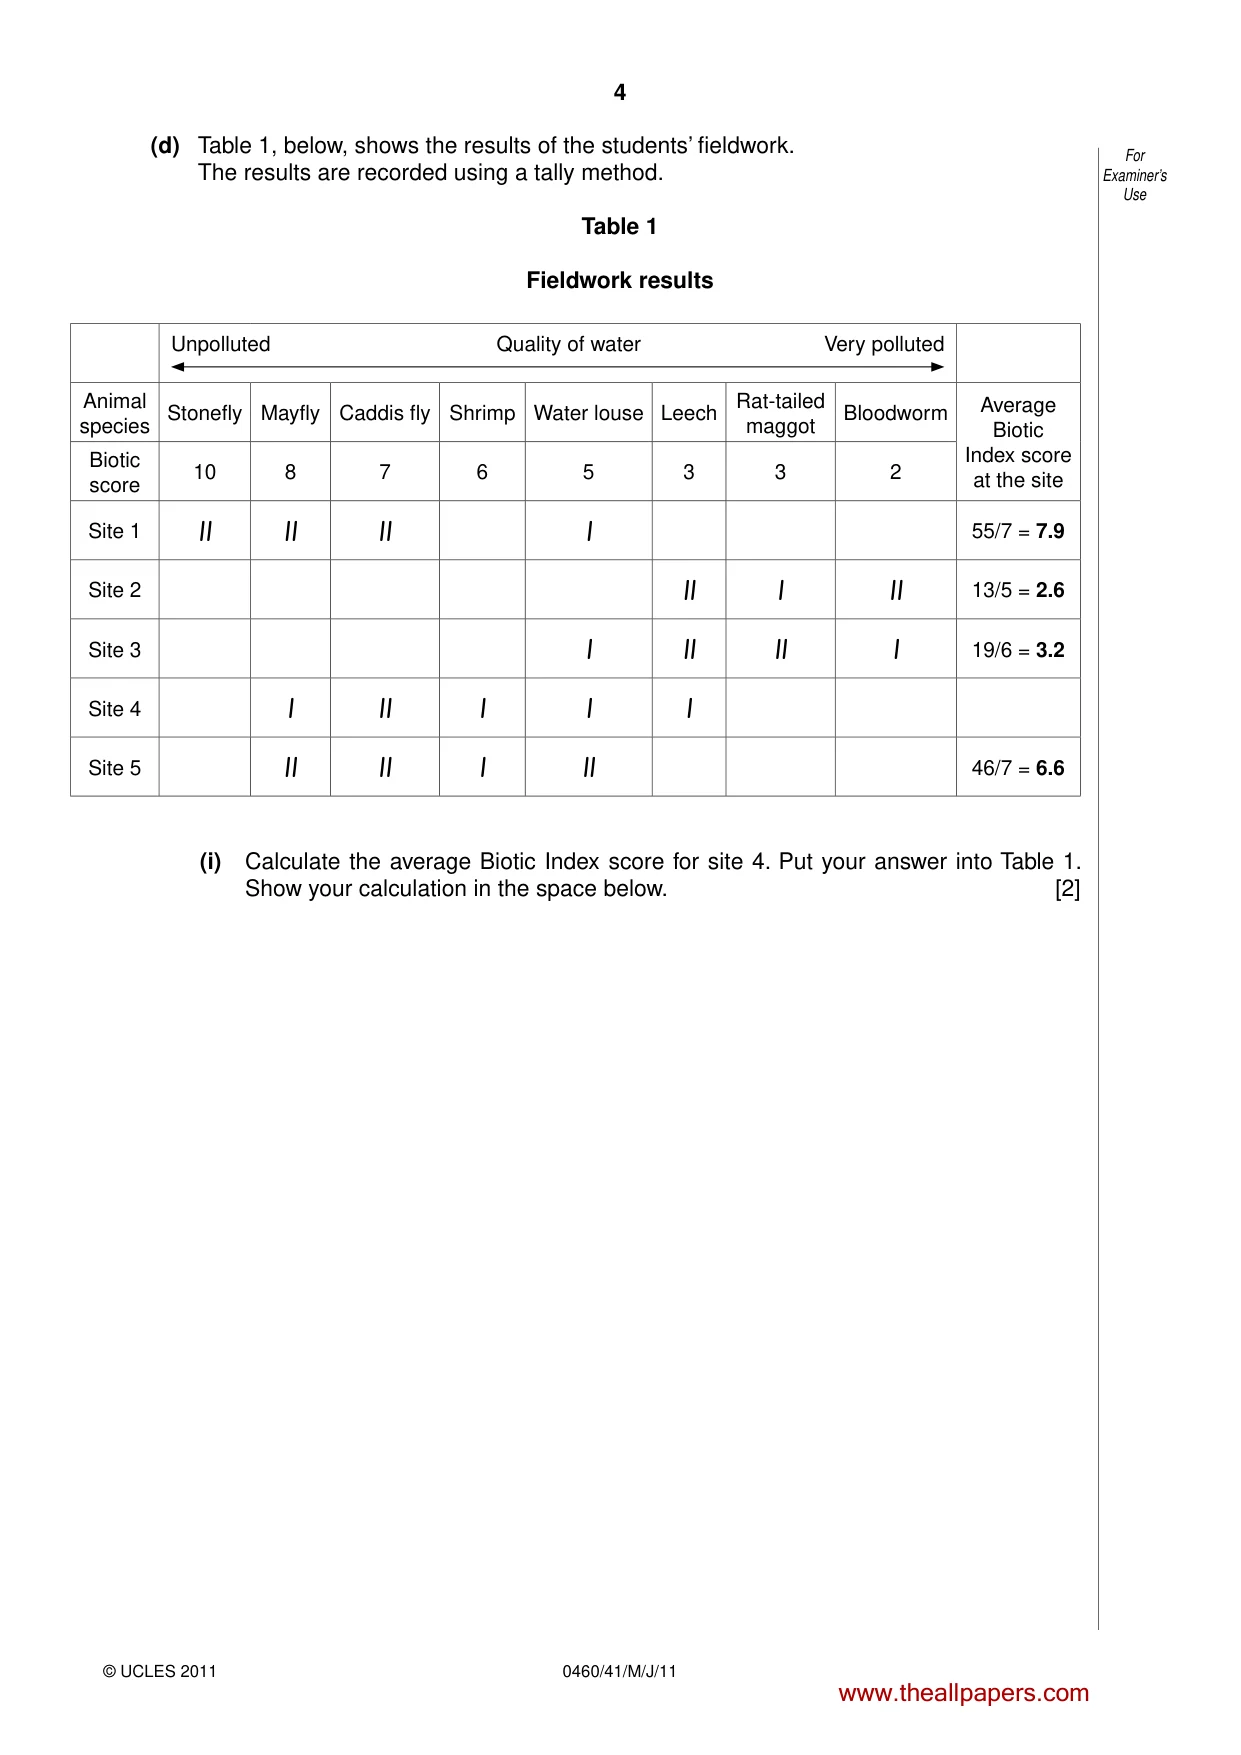
4 0460/41/M/J/11 © UCLES 2011 For Examiner’s Use (d) Table 1, below, shows the results of the students’ fieldwork. The results are recorded using a tally method. Table 1 Fieldwork results Unpolluted Quality of water Very polluted Animal species Stonefly Mayfly Caddis fly Shrimp Water louse Leech Rat-tailed maggot Bloodworm Average Biotic Index score at the site Biotic score 10 8 7 6 5 3 3 2 Site 1 ll ll ll l 55/7 = 7.9 Site 2 ll l ll 13/5 = 2.6 Site 3 l ll ll l 19/6 = 3.2 Site 4 l ll l l l Site 5 ll ll l ll 46/7 = 6.6 (i) Calculate the average Biotic Index score for site 4. Put your answer into Table 1. Show your calculation in the space below. [2] www.theallpapers.com
Question paper, page 5
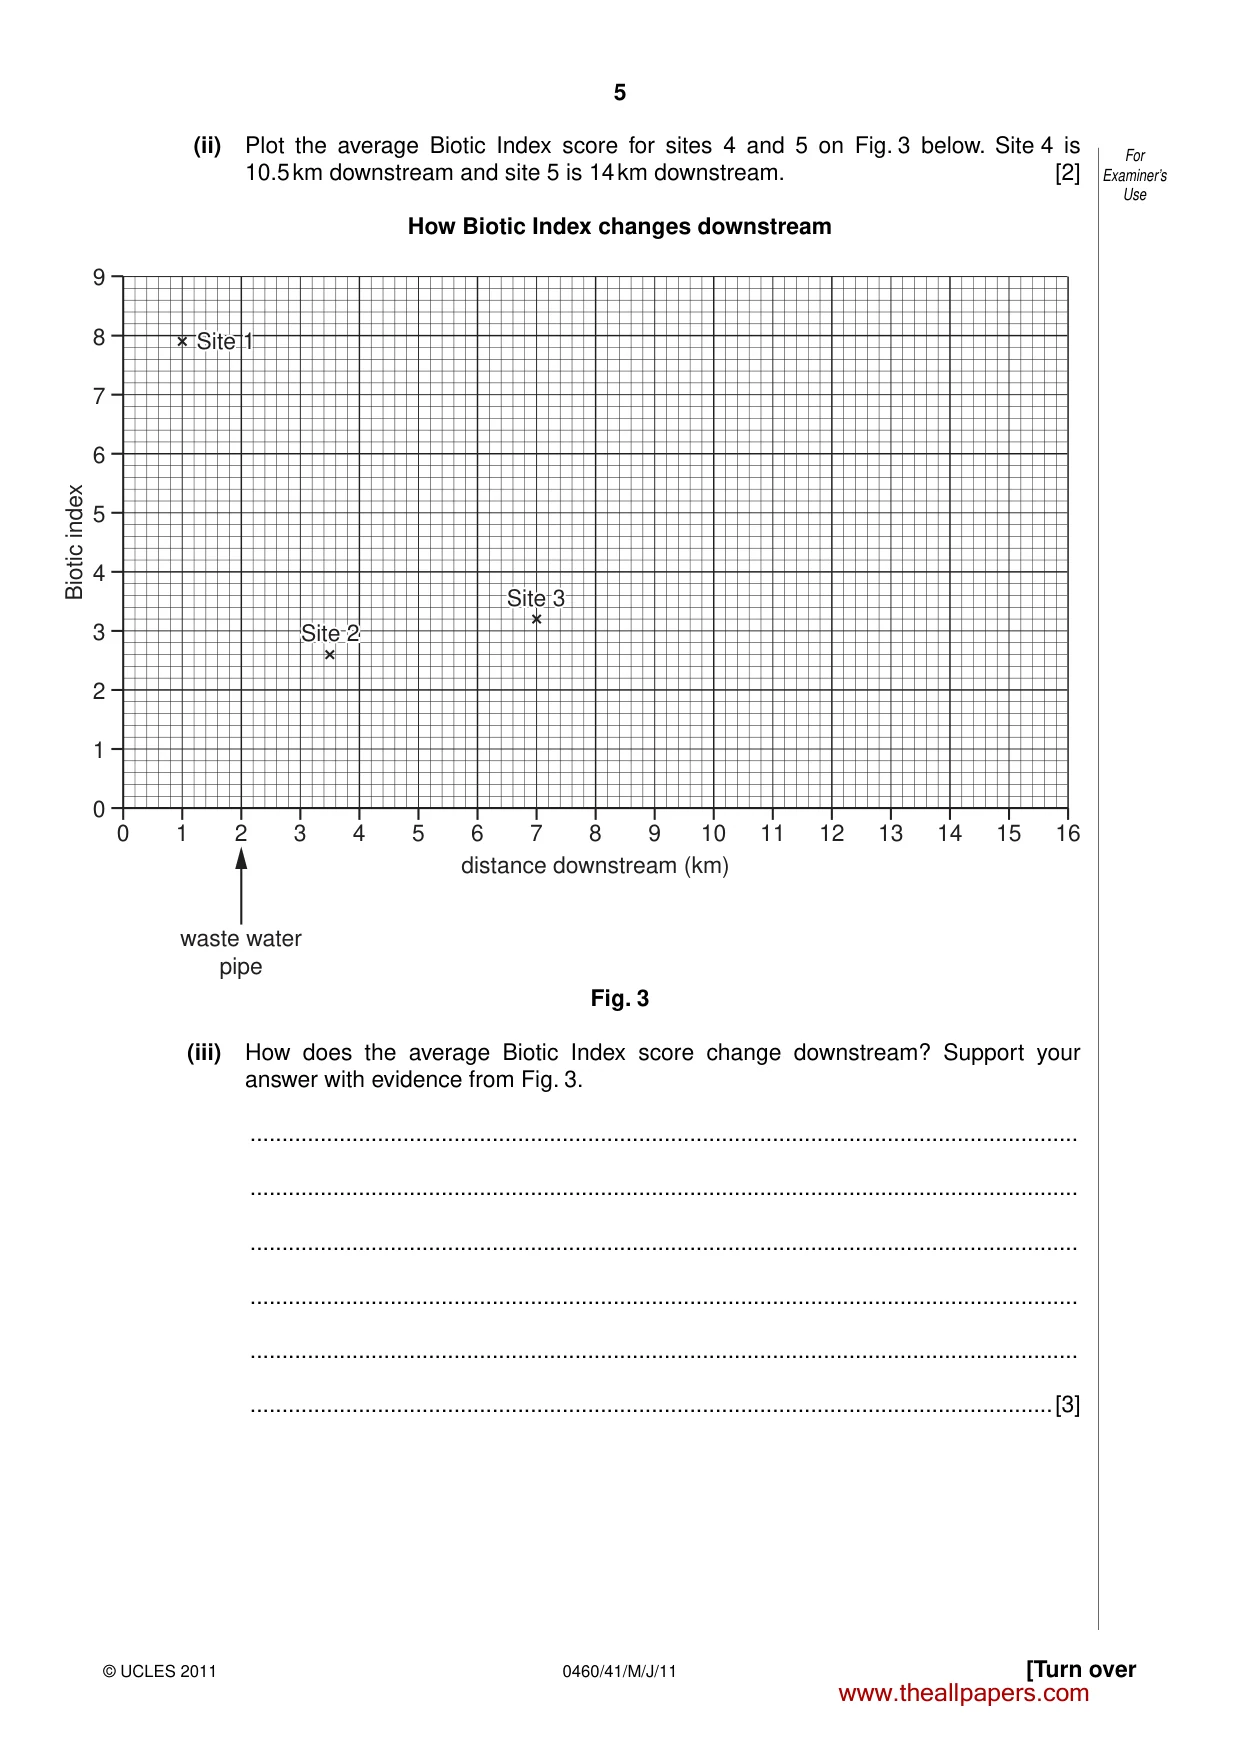
5 [Turn over © UCLES 2011 0460/41/M/J/11 For Examiner’s Use (ii) Plot the average Biotic Index score for sites 4 and 5 on Fig. 3 below. Site 4 is 10.5 km downstream and site 5 is 14 km downstream. [2] How Biotic Index changes downstream 9 8 7 6 5 4 3 2 1 0 0 1 2 waste water pipe 3 4 5 6 7 8 distance downstream (km) Biotic index 9 10 11 12 13 14 15 16 Site 1 Site 1 Site 2 Site 2 Site 3 Site 3 Site 1 Site 2 Site 3 Fig. 3 (iii) How does the average Biotic Index score change downstream? Support your answer with evidence from Fig. 3. … … … … … …[3] www.theallpapers.com
Question paper, page 6
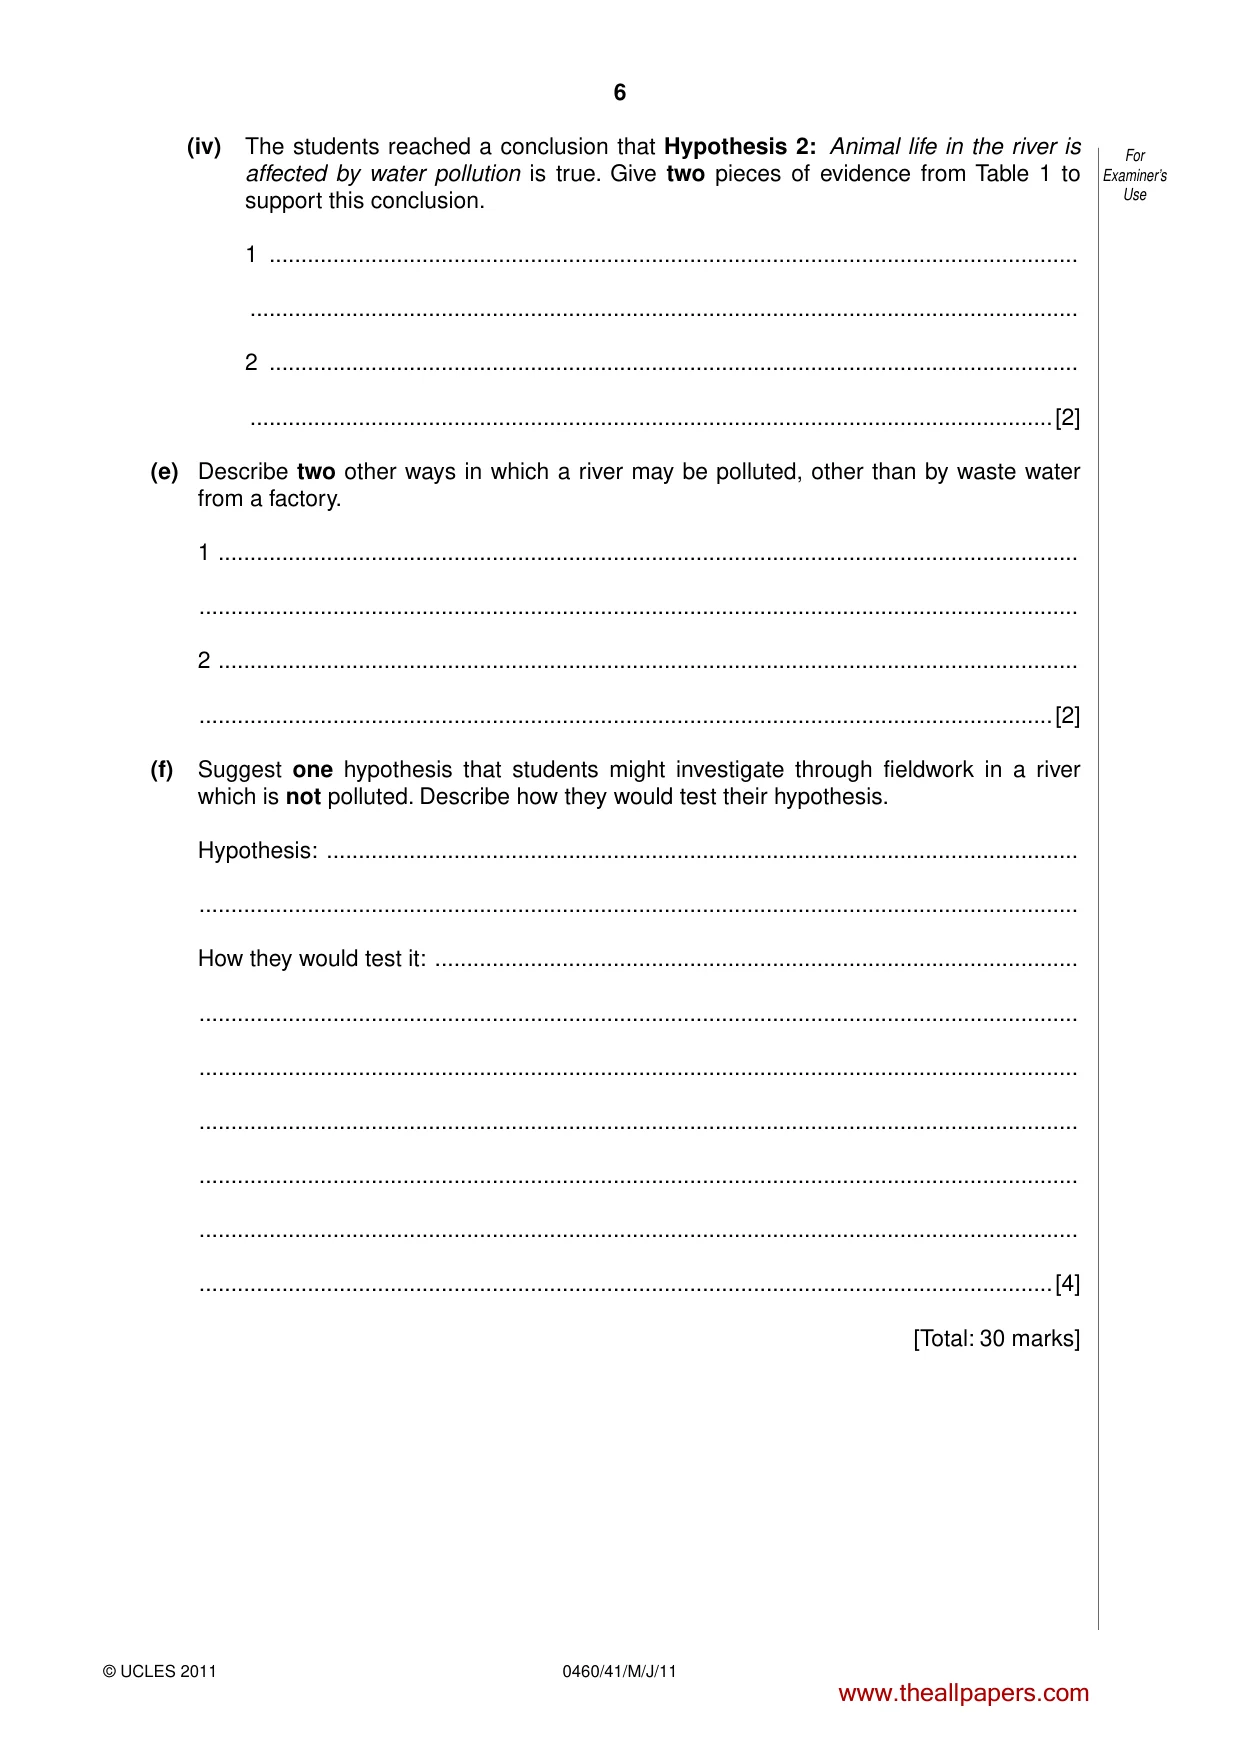
6 0460/41/M/J/11 © UCLES 2011 For Examiner’s Use (iv) The students reached a conclusion that Hypothesis 2: Animal life in the river is affected by water pollution is true. Give two pieces of evidence from Table 1 to support this conclusion. 1 … … 2 … …[2] (e) Describe two other ways in which a river may be polluted, other than by waste water from a factory. 1 … … 2 … …[2] (f) Suggest one hypothesis that students might investigate through fieldwork in a river which is not polluted. Describe how they would test their hypothesis. Hypothesis: … … How they would test it: … … … … … … …[4] [Total: 30 marks] www.theallpapers.com
Question paper, page 7
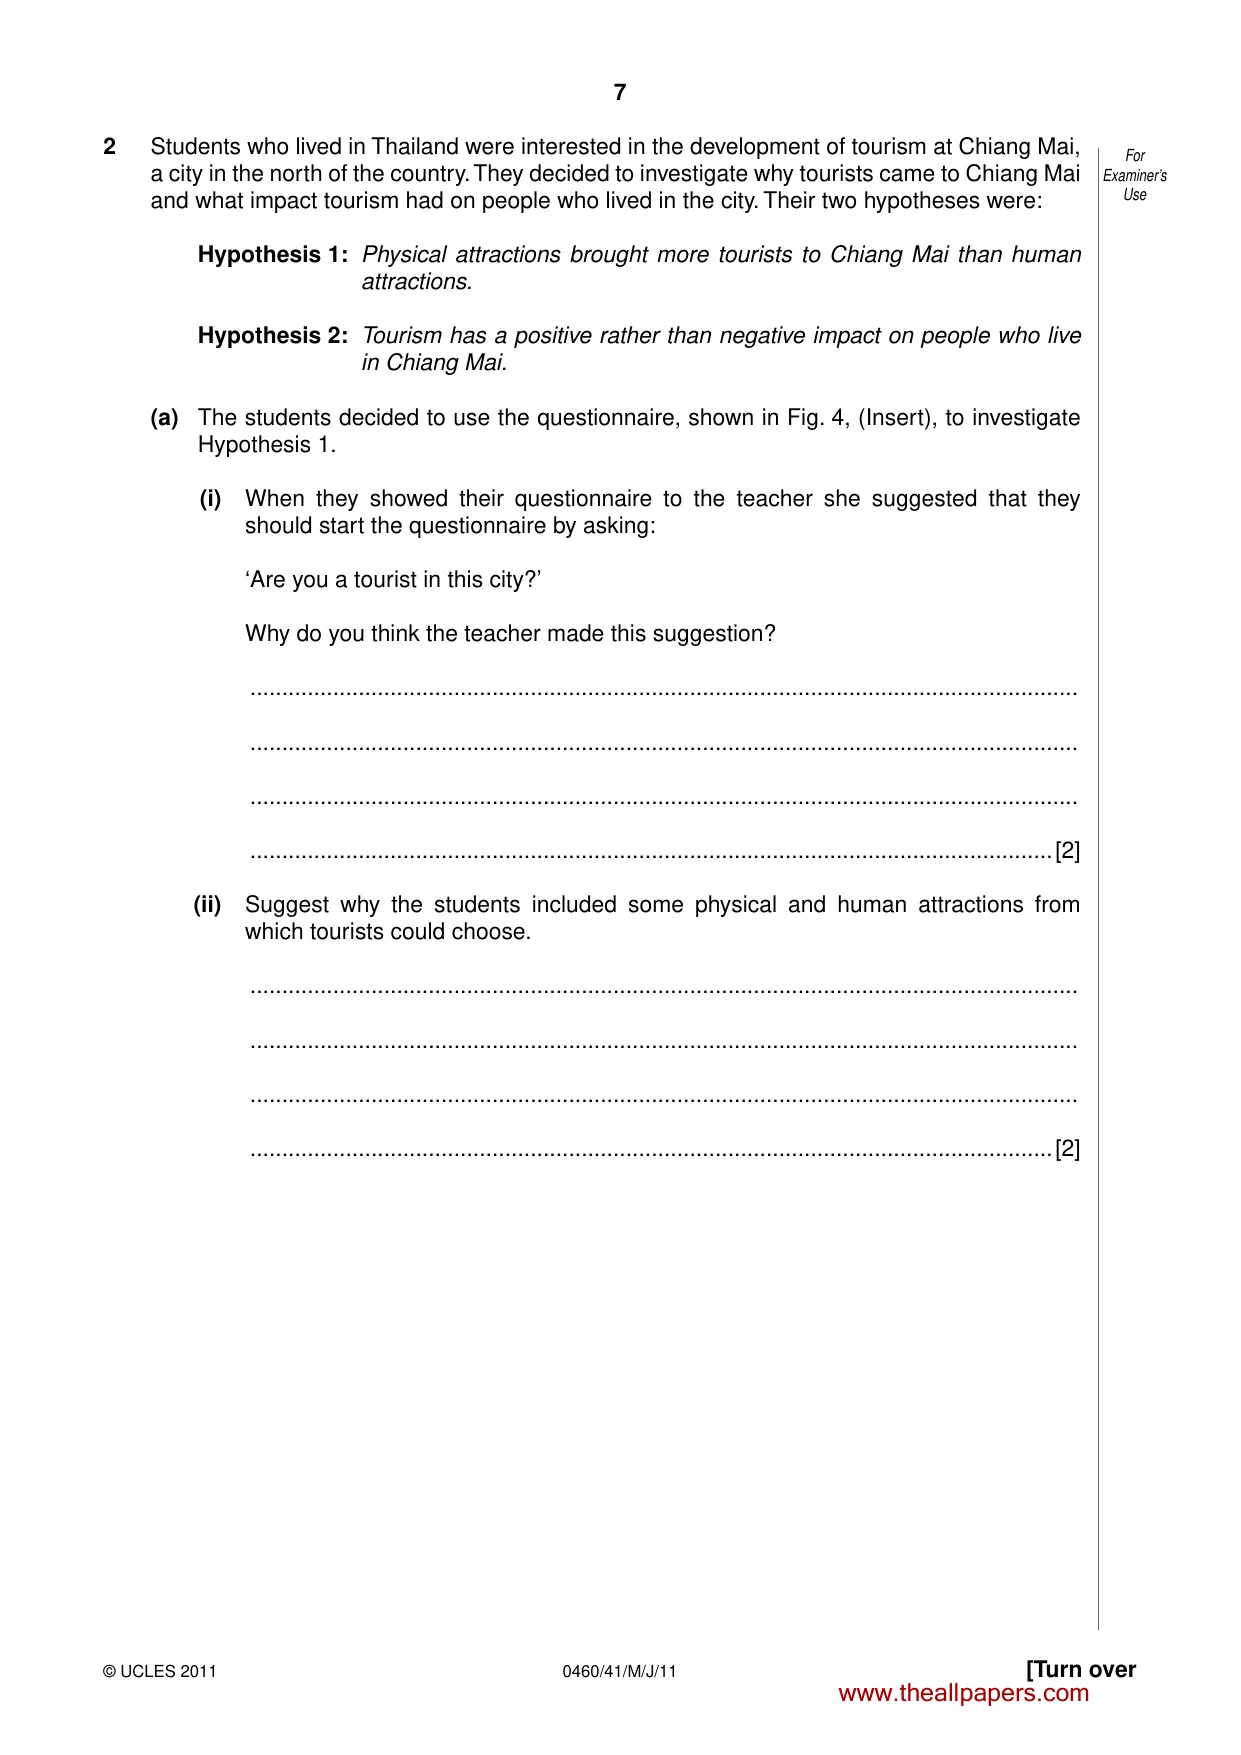
7 [Turn over © UCLES 2011 0460/41/M/J/11 For Examiner’s Use 2 Students who lived in Thailand were interested in the development of tourism at Chiang Mai, a city in the north of the country. They decided to investigate why tourists came to Chiang Mai and what impact tourism had on people who lived in the city. Their two hypotheses were: Hypothesis 1: Physical attractions brought more tourists to Chiang Mai than human attractions. Hypothesis 2: Tourism has a positive rather than negative impact on people who live in Chiang Mai. (a) The students decided to use the questionnaire, shown in Fig. 4, (Insert), to investigate Hypothesis 1. (i) When they showed their questionnaire to the teacher she suggested that they should start the questionnaire by asking: ‘Are you a tourist in this city?’ Why do you think the teacher made this suggestion? … … … …[2] (ii) Suggest why the students included some physical and human attractions from which tourists could choose. … … … …[2] www.theallpapers.com
Question paper, page 8
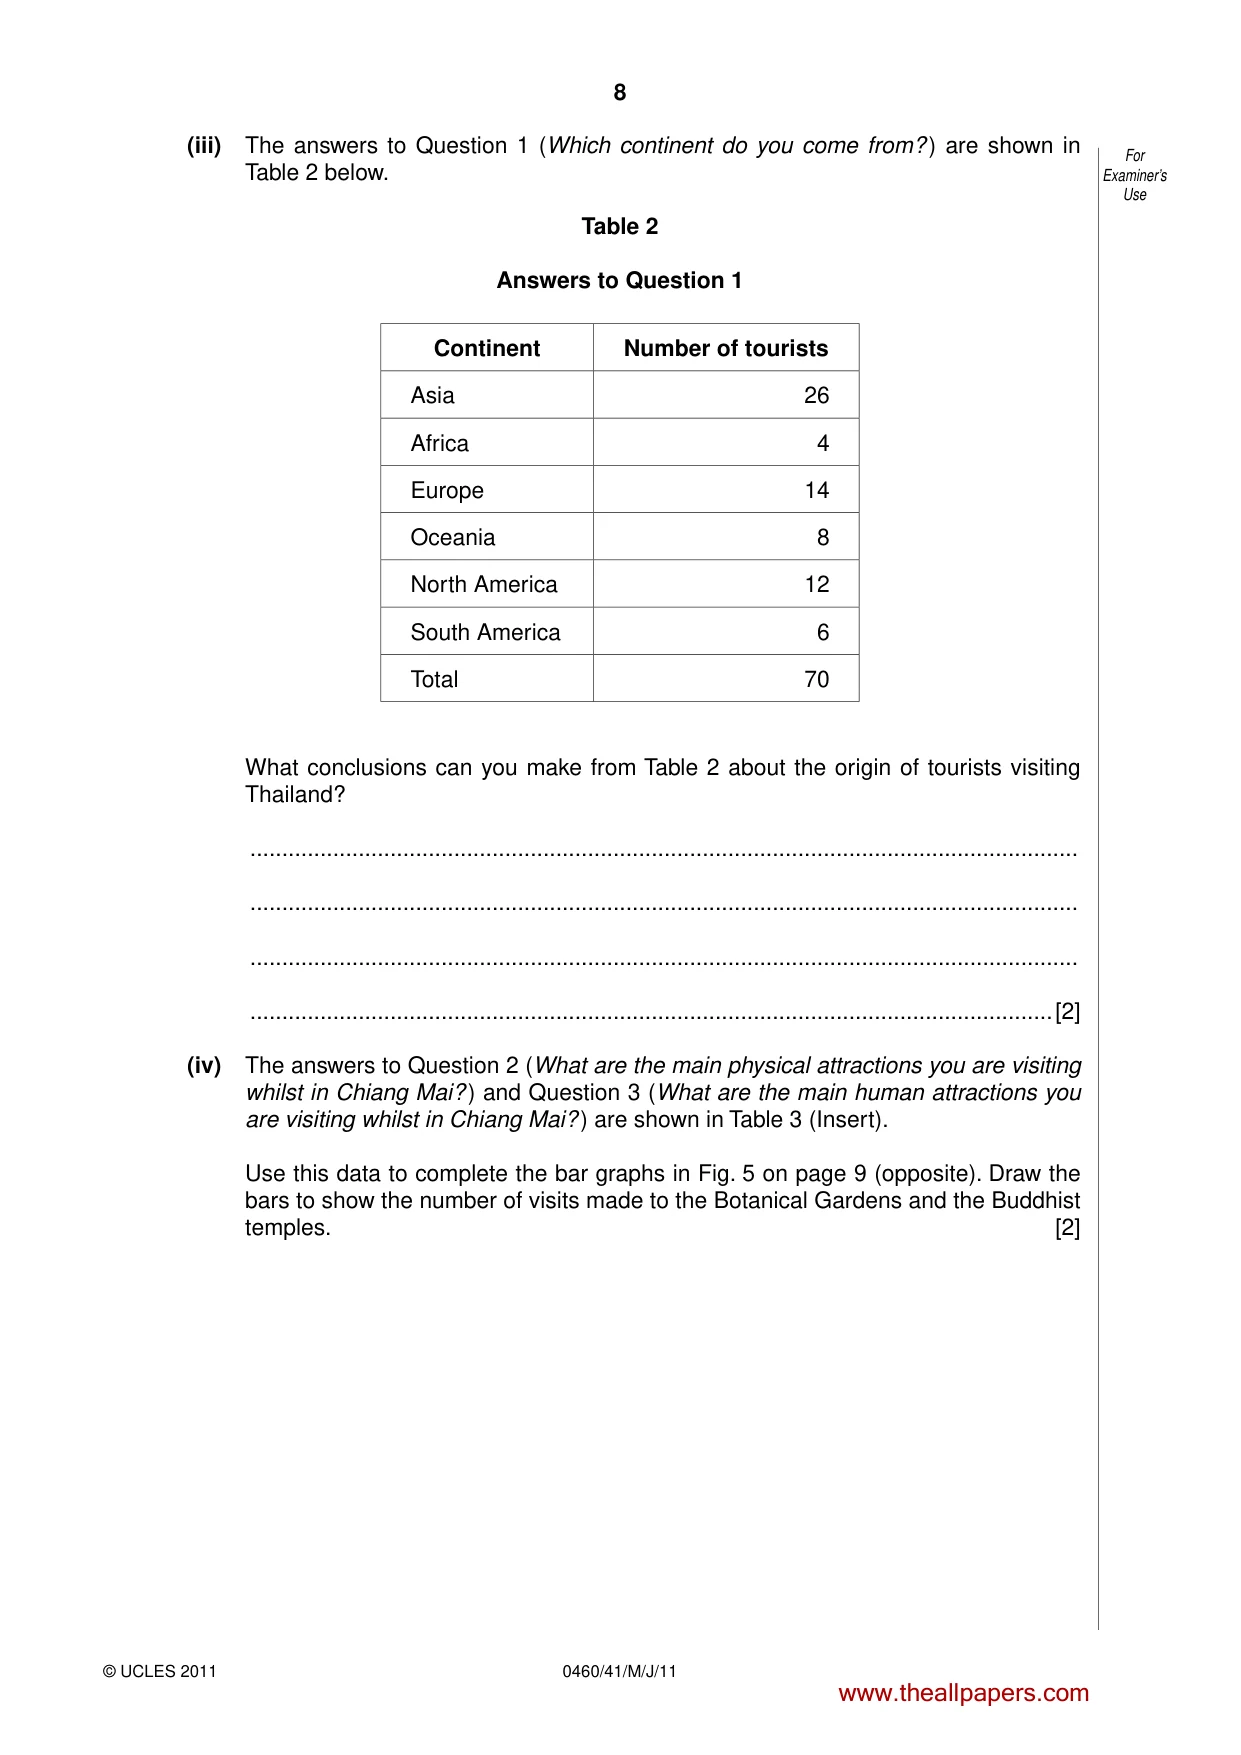
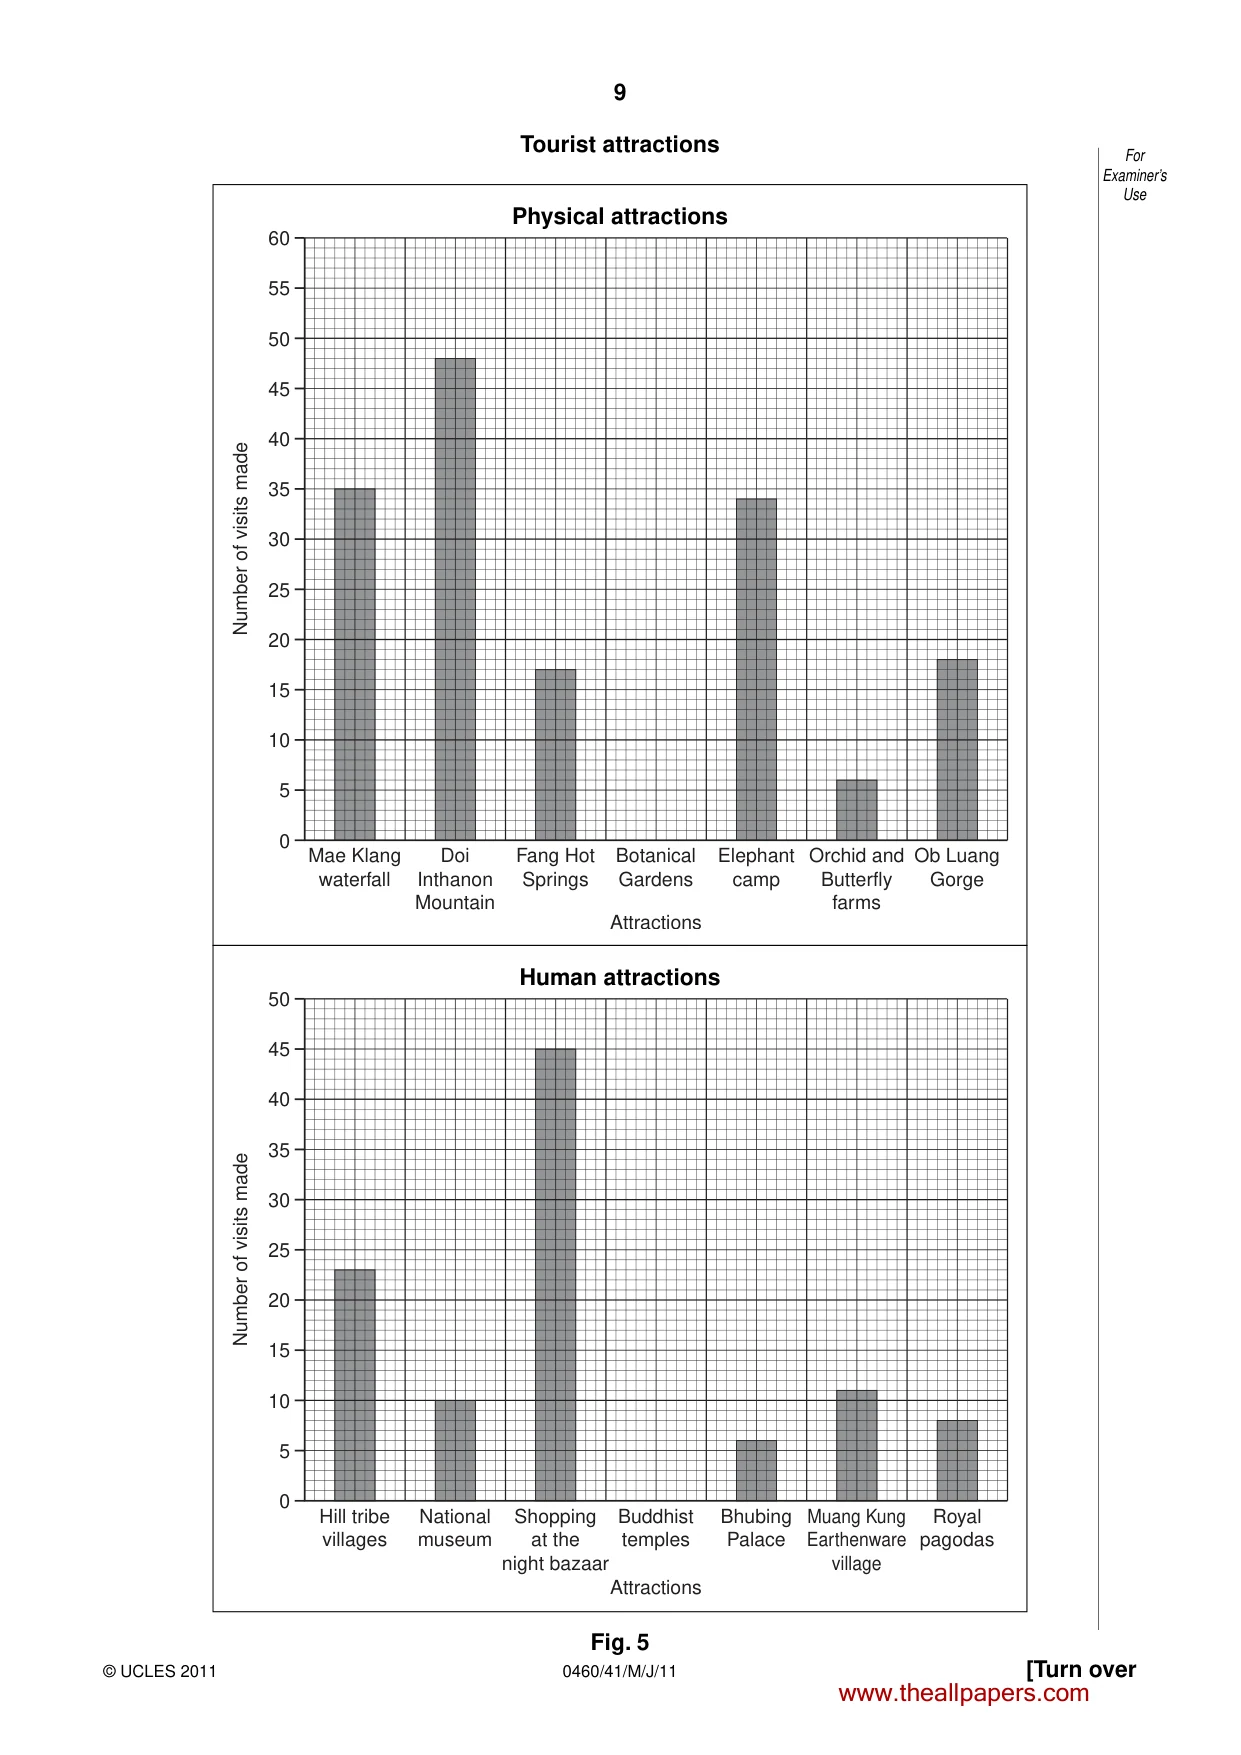
8 0460/41/M/J/11 © UCLES 2011 For Examiner’s Use (iii) The answers to Question 1 (Which continent do you come from? ) are shown in Table 2 below. Table 2 Answers to Question 1 Continent Number of tourists Asia 26 Africa 4 Europe 14 Oceania 8 North America 12 South America 6 Total 70 What conclusions can you make from Table 2 about the origin of tourists visiting Thailand? … … … …[2] (iv) The answers to Question 2 (What are the main physical attractions you are visiting whilst in Chiang Mai? ) and Question 3 (What are the main human attractions you are visiting whilst in Chiang Mai? ) are shown in Table 3 (Insert). Use this data to complete the bar graphs in Fig. 5 on page 9 (opposite). Draw the bars to show the number of visits made to the Botanical Gardens and the Buddhist temples. [2] www.theallpapers.com
Question paper, page 9
9 [Turn over © UCLES 2011 0460/41/M/J/11 For Examiner’s Use Tourist attractions Physical attractions 30 Mae Klang waterfall Doi Inthanon Mountain Fang Hot Springs Botanical Gardens Attractions Elephant camp Orchid and Butterfly farms Ob Luang Gorge 25 20 15 50 45 60 55 40 35 Number of visits made 10 5 0 Human attractions 30 Hill tribe villages National museum Shopping at the night bazaar Buddhist temples Attractions Bhubing Palace Muang Kung Earthenware village Royal pagodas 25 20 15 50 45 40 35 Number of visits made 10 5 0 Fig. 5 www.theallpapers.com
Question paper, page 10
10 0460/41/M/J/11 © UCLES 2011 For Examiner’s Use (v) In the space below draw and label a different type of graph that could be used to show the answers from Question 4 (Overall which attracted you most to Chiang Mai? ) which are also shown in Table 3 (Insert). [3] www.theallpapers.com
Question paper, page 11
11 [Turn over © UCLES 2011 0460/41/M/J/11 For Examiner’s Use (vi) The students reached the conclusion that Hypothesis 1: Physical attractions brought more tourists to Chiang Mai than human attractions was false. Do you agree with them? Support your decision with evidence from Table 3 (Insert). … … … … … … … …[4] (b) The students used a different questionnaire to investigate the impact of tourism on people who lived in Chiang Mai. The questionnaire is shown in Fig. 6 (Insert). (i) The students used a systematic sampling technique to obtain answers to their questionnaire. Suggest how they might have done this. … …[1] (ii) Do you think that it was a good idea to ask people for their first and second choices? Explain your decision. … … … …[2] www.theallpapers.com
Question paper, page 12
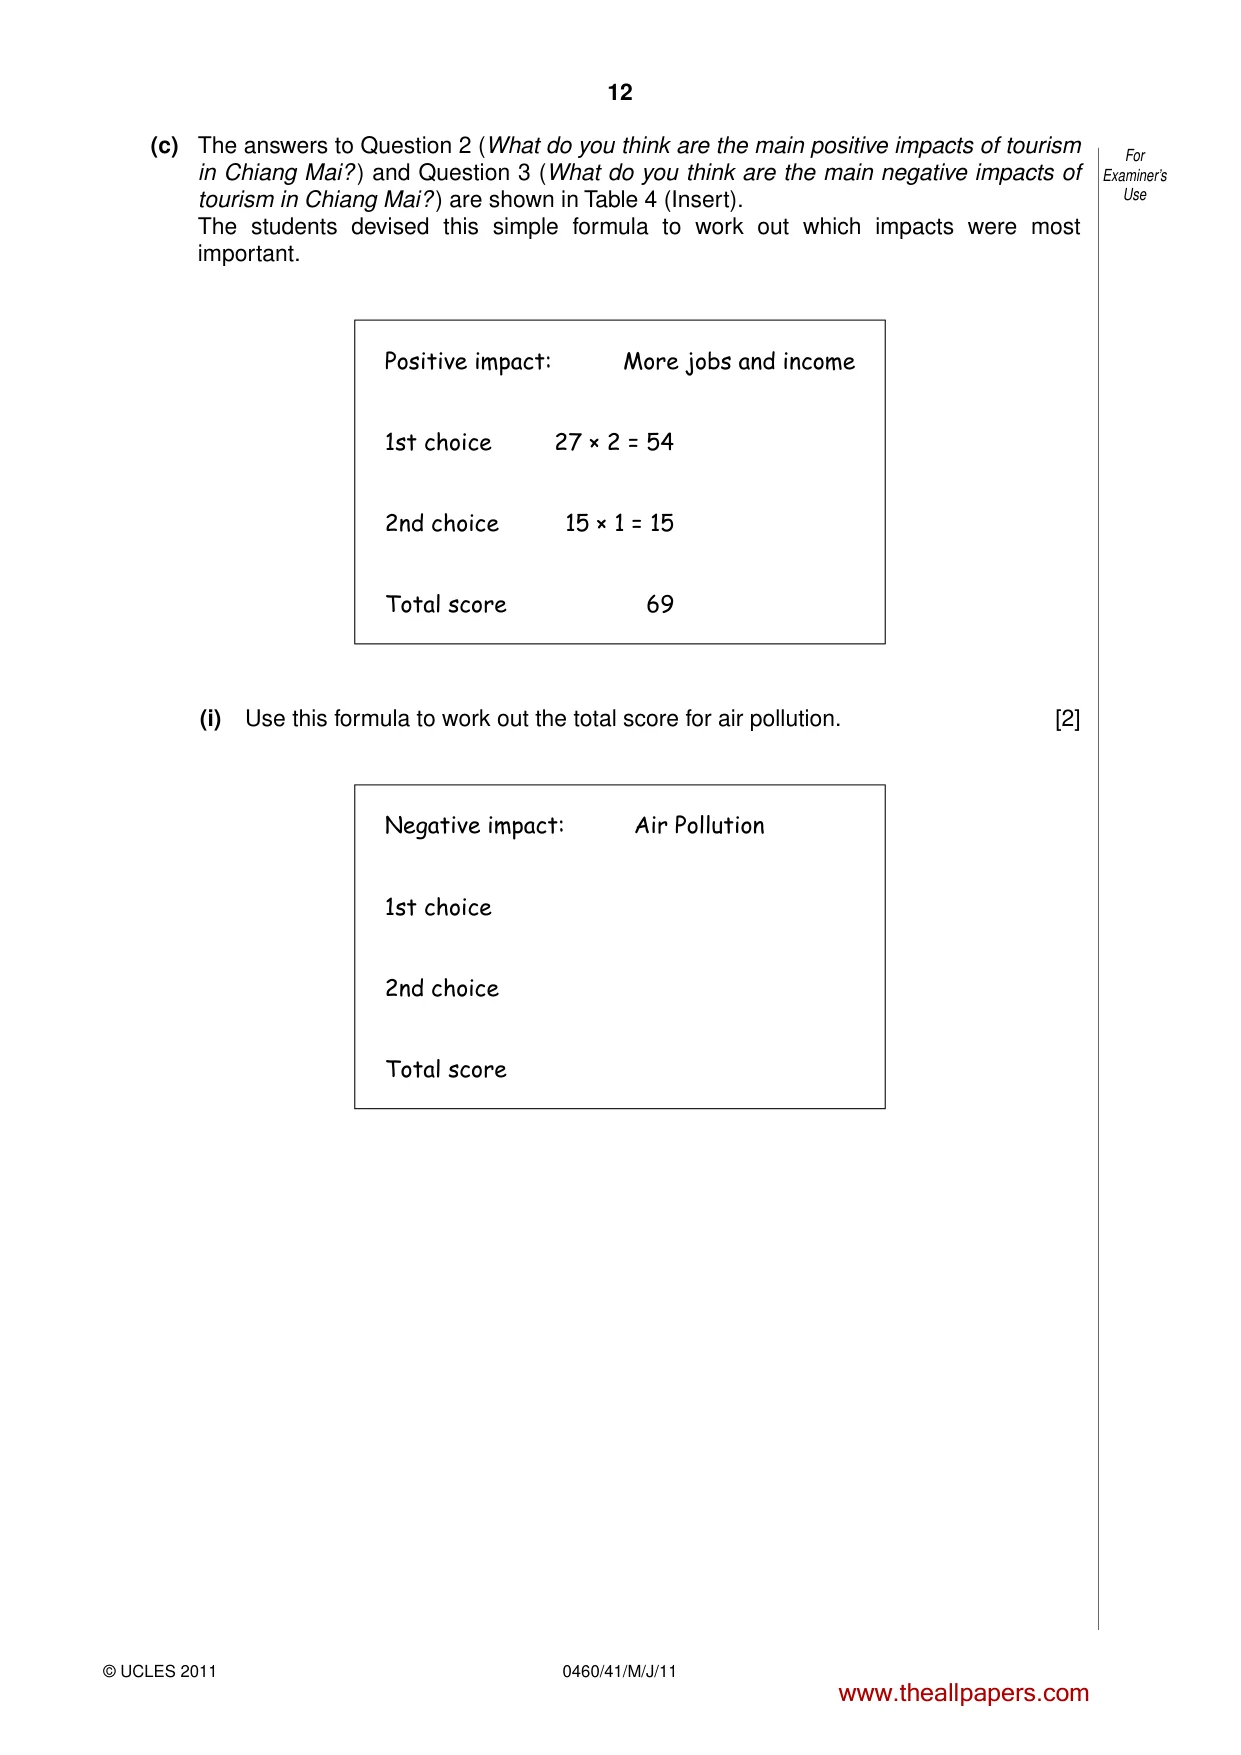
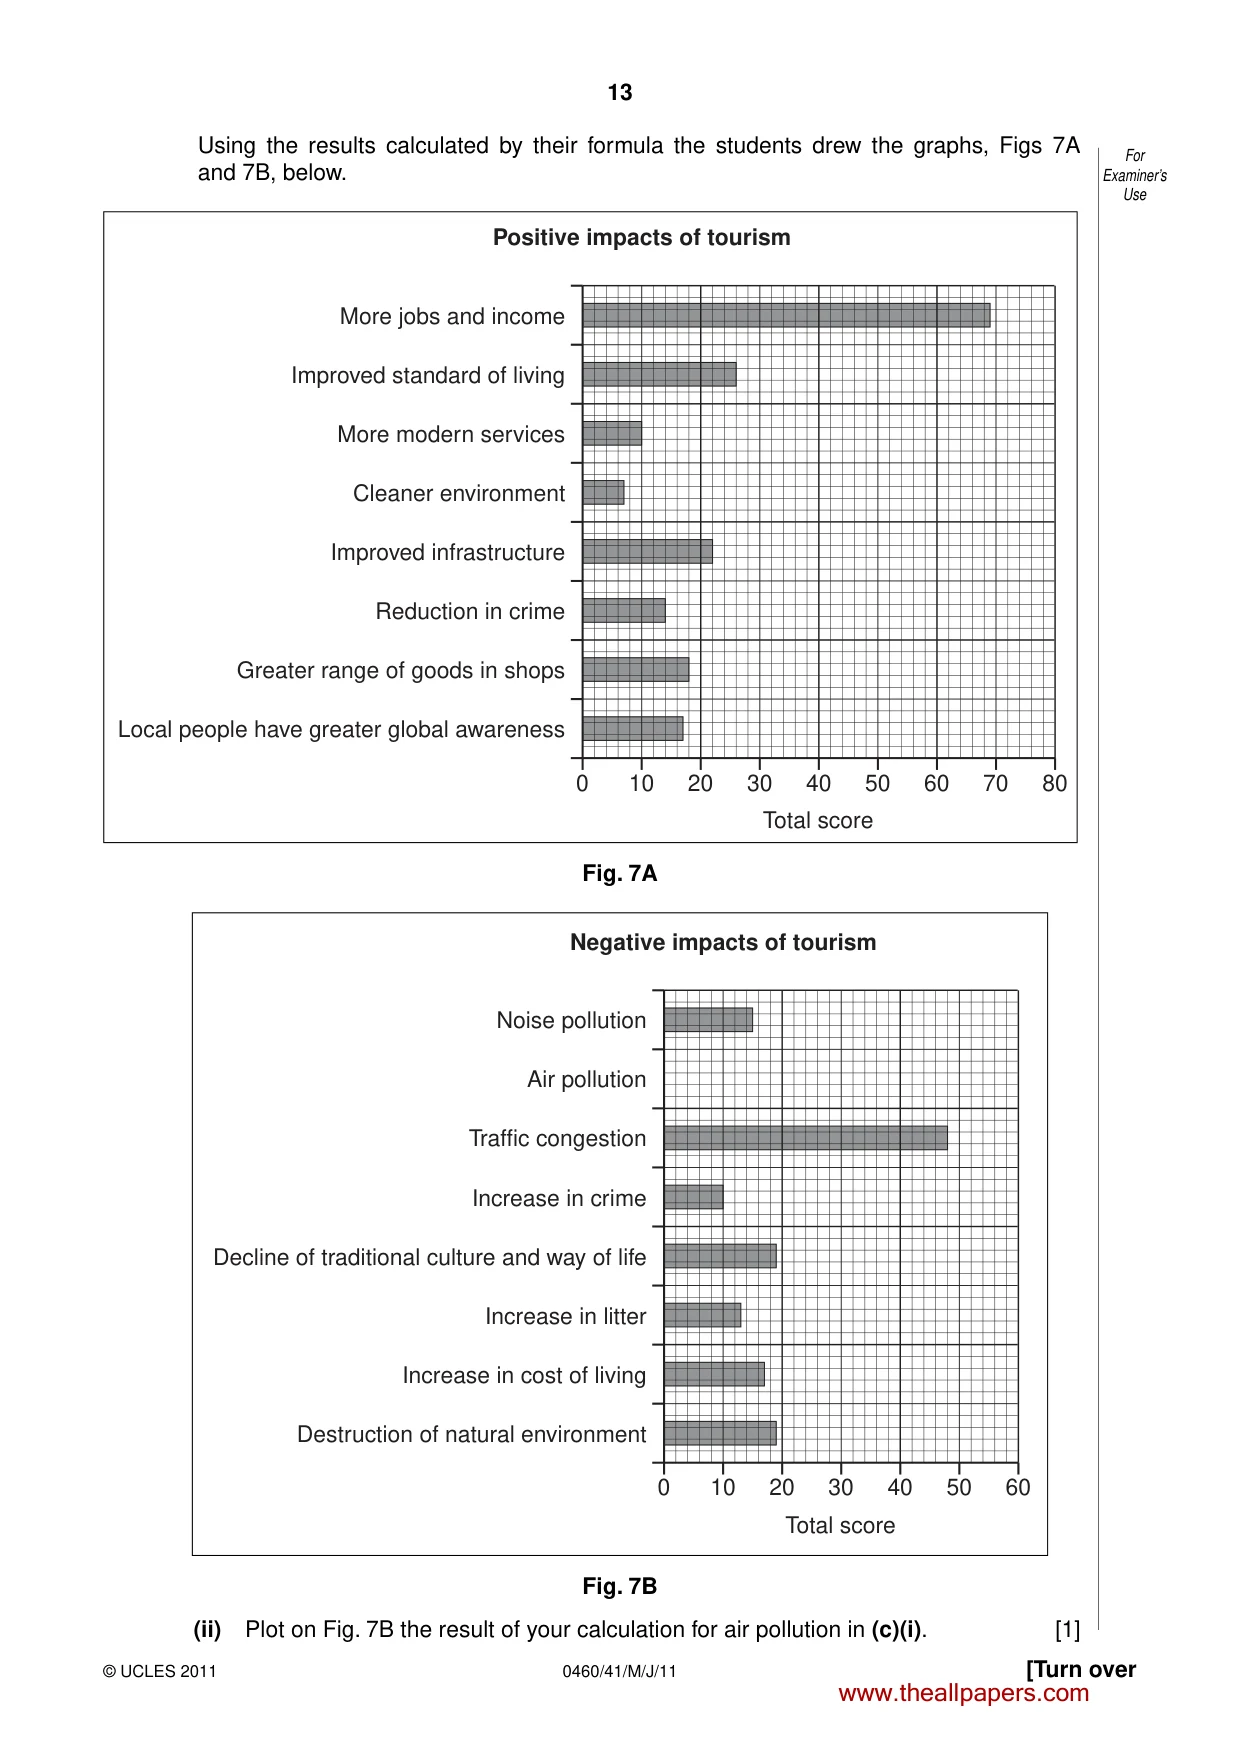
12 0460/41/M/J/11 © UCLES 2011 For Examiner’s Use (c) The answers to Question 2 (What do you think are the main positive impacts of tourism in Chiang Mai? ) and Question 3 (What do you think are the main negative impacts of tourism in Chiang Mai? ) are shown in Table 4 (Insert). The students devised this simple formula to work out which impacts were most important. Positive impact: More jobs and income 1st choice 27 × 2 = 54 2nd choice 15 × 1 = 15 Total score 69 (i) Use this formula to work out the total score for air pollution. [2] Negative impact: Air Pollution 1st choice 2nd choice Total score www.theallpapers.com
Question paper, page 13
13 [Turn over © UCLES 2011 0460/41/M/J/11 For Examiner’s Use Using the results calculated by their formula the students drew the graphs, Figs 7A and 7B, below. More modern services Total score Positive impacts of tourism Cleaner environment Improved infrastructure Reduction in crime More jobs and income Improved standard of living Greater range of goods in shops Local people have greater global awareness 0 10 20 30 40 50 60 70 80 Fig. 7A Traffic congestion Total score Negative impacts of tourism Increase in crime Decline of traditional culture and way of life Increase in litter Noise pollution Air pollution Increase in cost of living Destruction of natural environment 0 10 20 30 40 50 60 Fig. 7B (ii) Plot on Fig. 7B the result of your calculation for air pollution in (c)(i). [1] www.theallpapers.com
Question paper, page 14
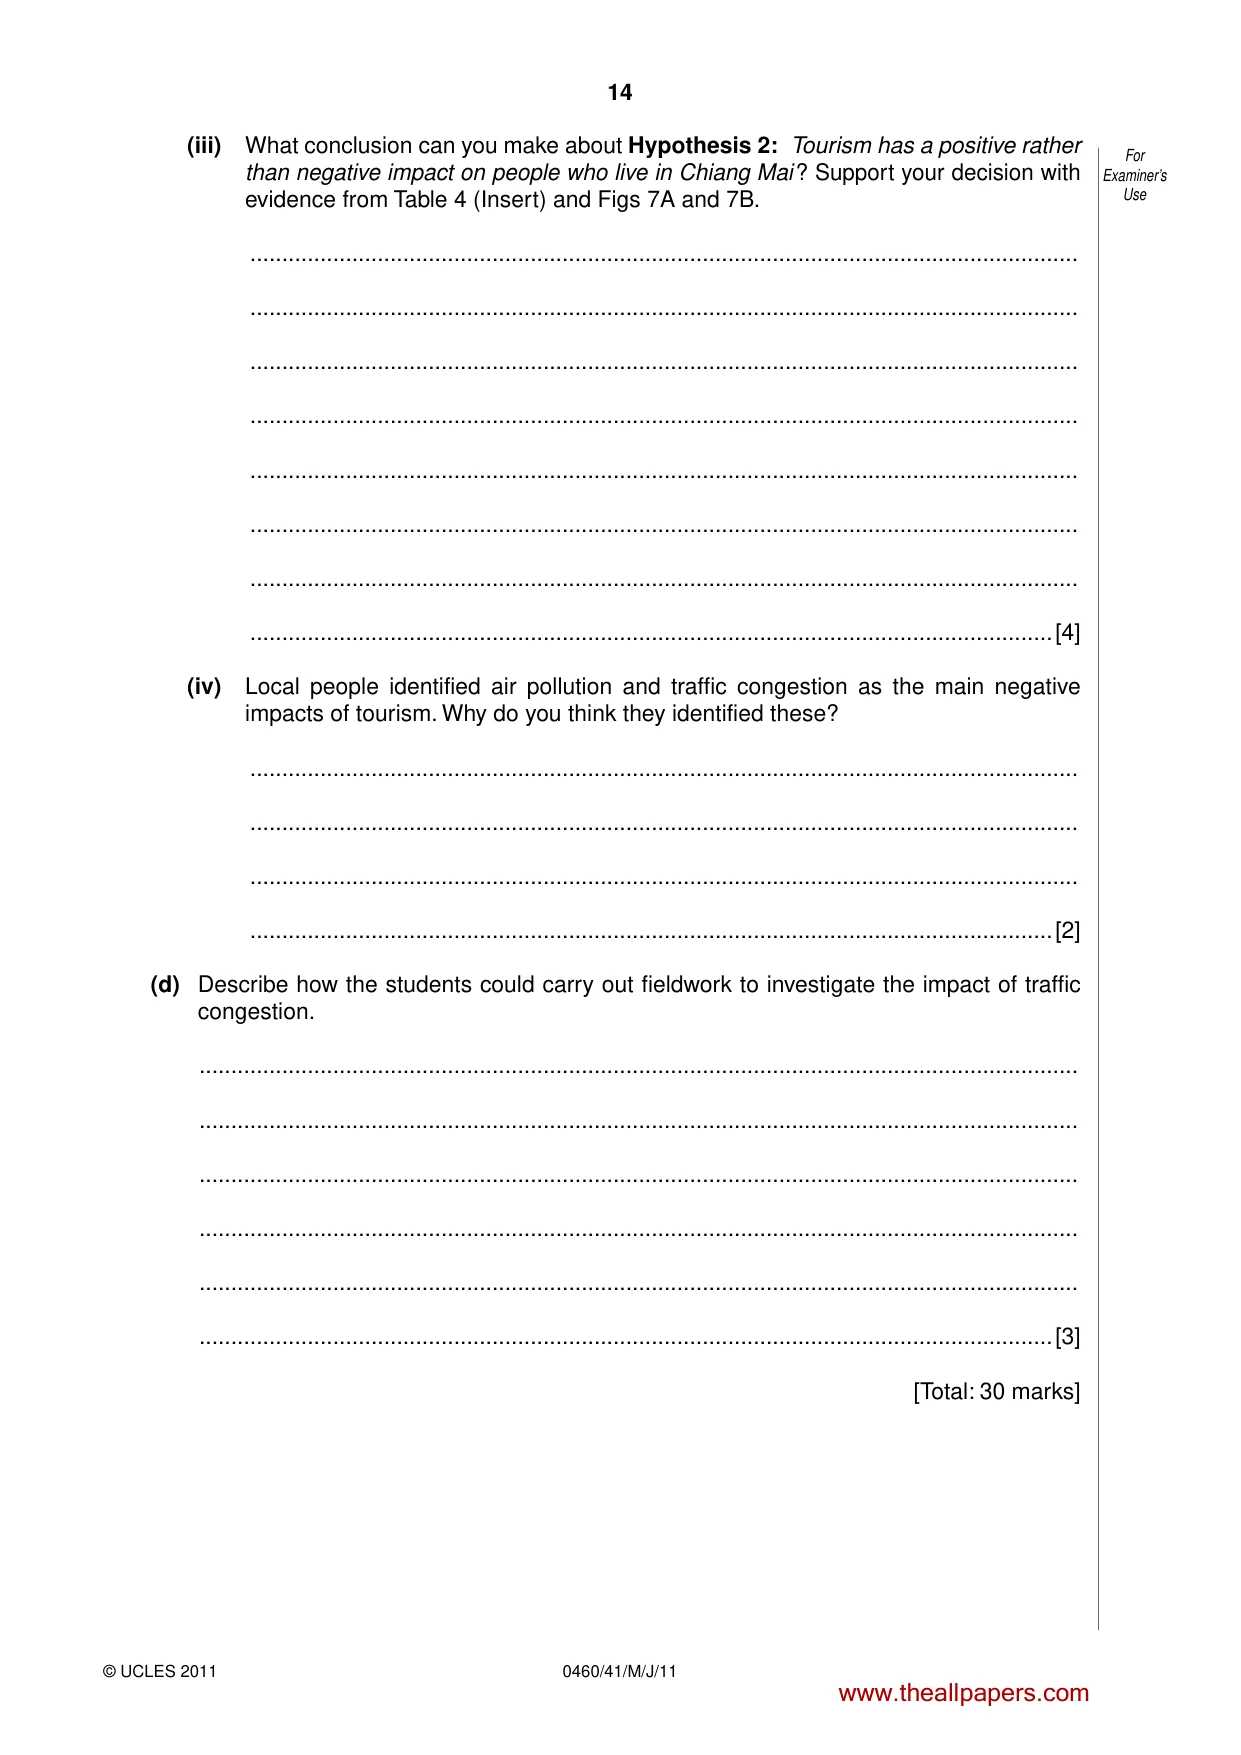
14 0460/41/M/J/11 © UCLES 2011 For Examiner’s Use (iii) What conclusion can you make about Hypothesis 2: Tourism has a positive rather than negative impact on people who live in Chiang Mai ? Support your decision with evidence from Table 4 (Insert) and Figs 7A and 7B. … … … … … … … …[4] (iv) Local people identified air pollution and traffic congestion as the main negative impacts of tourism. Why do you think they identified these? … … … …[2] (d) Describe how the students could carry out fieldwork to investigate the impact of traffic congestion. … … … … … …[3] [Total: 30 marks] www.theallpapers.com
Question paper, page 15
15 0460/41/M/J/11 © UCLES 2011 BLANK PAGE www.theallpapers.com
Question paper, page 16
16 0460/41/M/J/11 © UCLES 2011 BLANK PAGE Copyright Acknowledgements: Question 1 Fig. 2 Photograph © Wideworld GCSE Geography Review; Vol. 13.3 ; Philip Allen; February 2002. Permission to reproduce items where third-party owned material protected by copyright is included has been sought and cleared where possible. Every reasonable effort has been made by the publisher (UCLES) to trace copyright holders, but if any items requiring clearance have unwittingly been included, the publisher will be pleased to make amends at the earliest possible opportunity. University of Cambridge International Examinations is part of the Cambridge Assessment Group. Cambridge Assessment is the brand name of University of Cambridge Local Examinations Syndicate (UCLES), which is itself a department of the University of Cambridge. www.theallpapers.com
Mark scheme, page 1
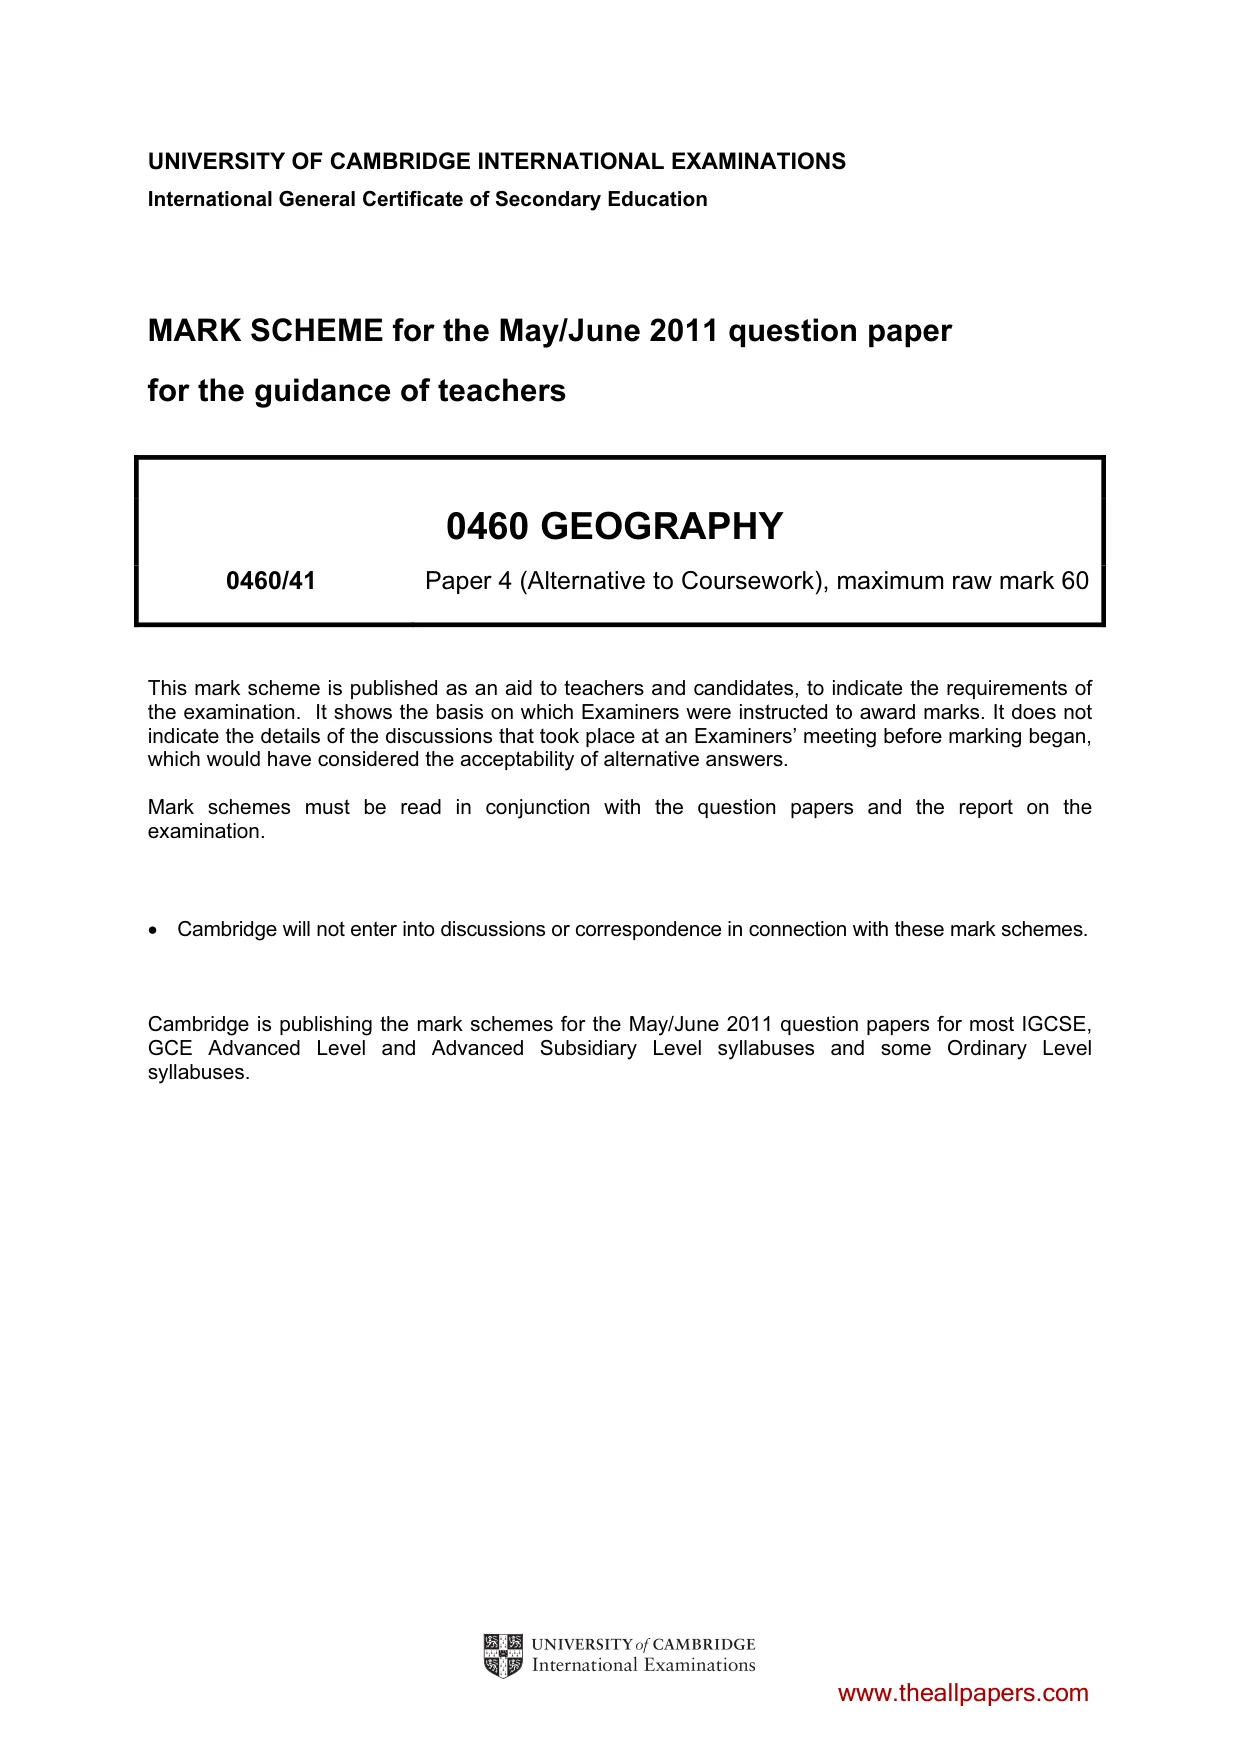
UNIVERSITY OF CAMBRIDGE INTERNATIONAL EXAMINATIONS International General Certificate of Secondary Education MARK SCHEME for the May/June 2011 question paper for the guidance of teachers 0460 GEOGRAPHY 0460/41 Paper 4 (Alternative to Coursework), maximum raw mark 60 This mark scheme is published as an aid to teachers and candidates, to indicate the requirements of the examination. It shows the basis on which Examiners were instructed to award marks. It does not indicate the details of the discussions that took place at an Examiners’ meeting before marking began, which would have considered the acceptability of alternative answers. Mark schemes must be read in conjunction with the question papers and the report on the examination. • Cambridge will not enter into discussions or correspondence in connection with these mark schemes. Cambridge is publishing the mark schemes for the May/June 2011 question papers for most IGCSE, GCE Advanced Level and Advanced Subsidiary Level syllabuses and some Ordinary Level syllabuses. www.theallpapers.com
Mark scheme, page 2
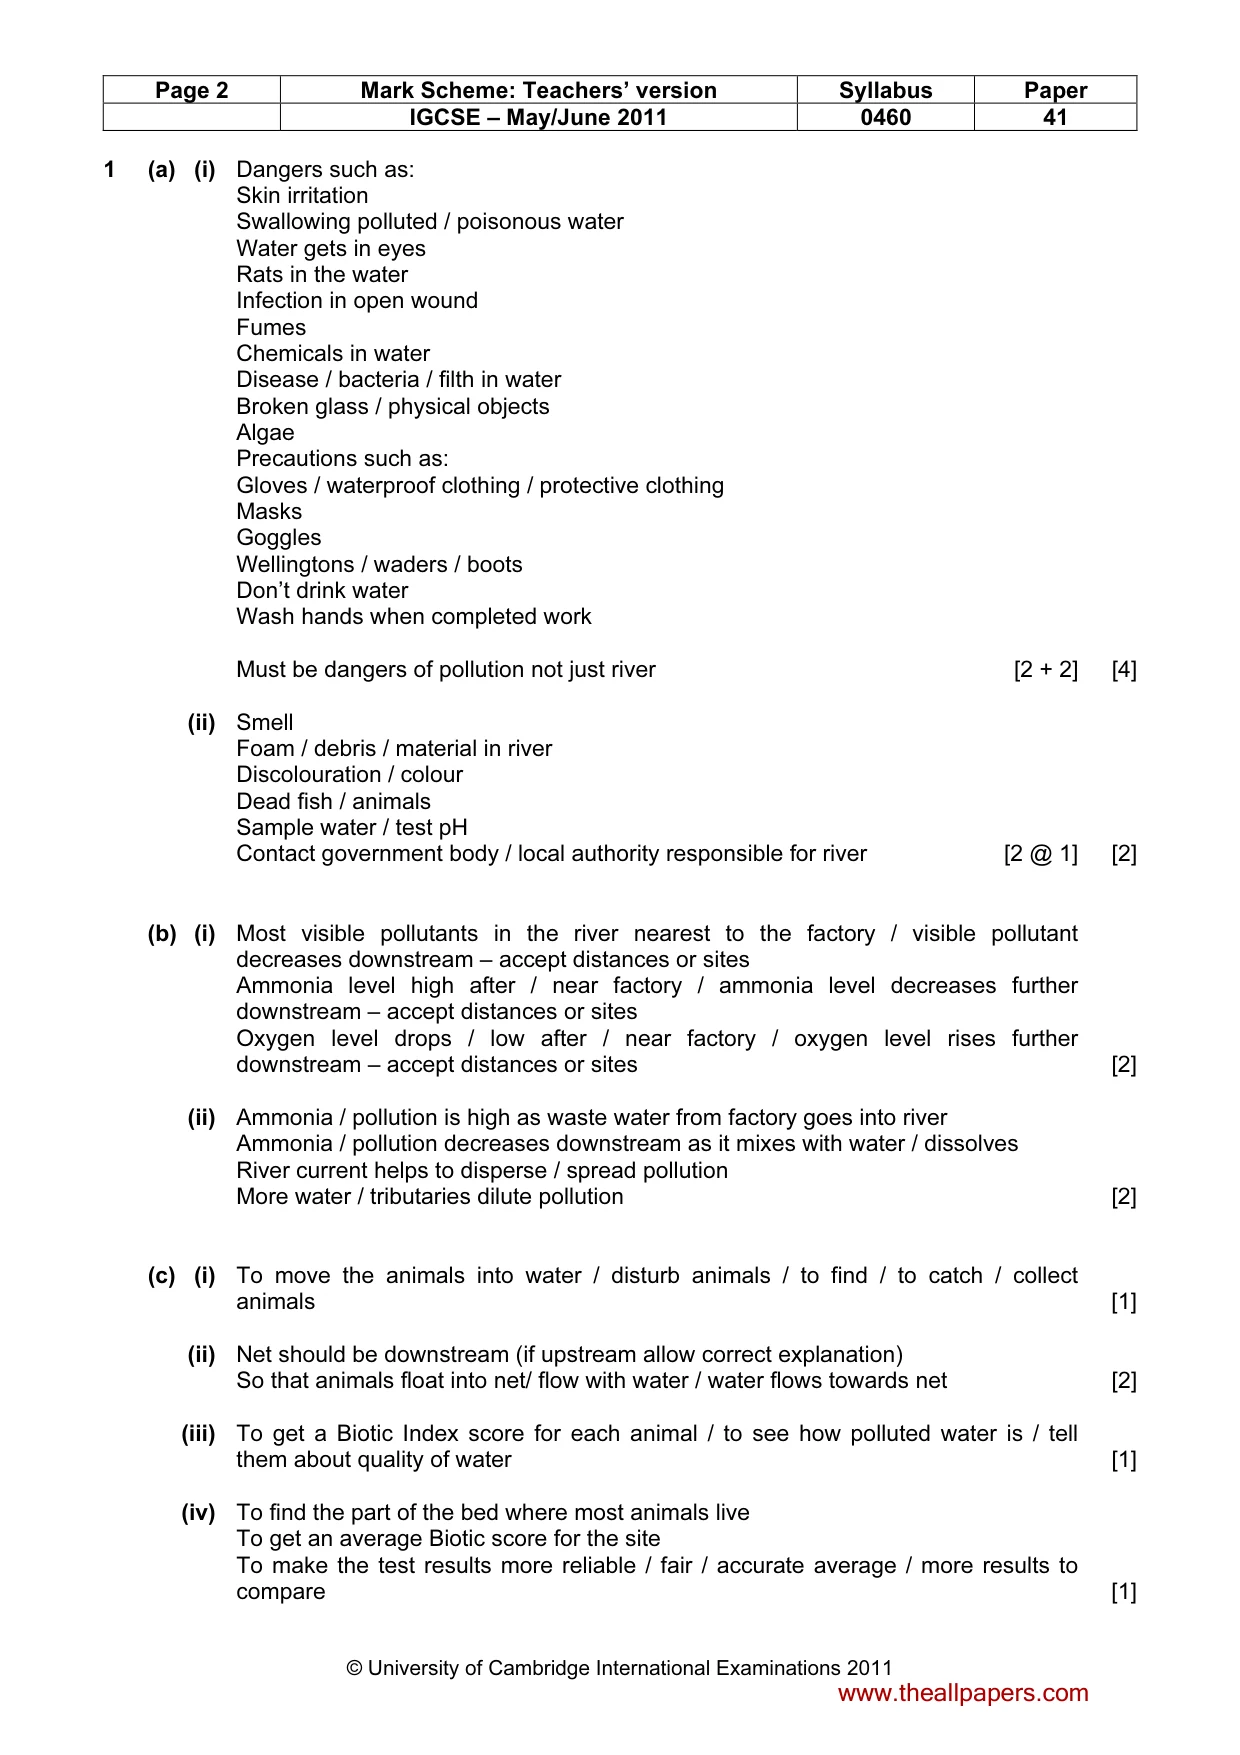
Page 2 Mark Scheme: Teachers’ version Syllabus Paper IGCSE – May/June 2011 0460 41 © University of Cambridge International Examinations 2011 1 (a) (i) Dangers such as: Skin irritation Swallowing polluted / poisonous water Water gets in eyes Rats in the water Infection in open wound Fumes Chemicals in water Disease / bacteria / filth in water Broken glass / physical objects Algae Precautions such as: Gloves / waterproof clothing / protective clothing Masks Goggles Wellingtons / waders / boots Don’t drink water Wash hands when completed work Must be dangers of pollution not just river [2 + 2] [4] (ii) Smell Foam / debris / material in river Discolouration / colour Dead fish / animals Sample water / test pH Contact government body / local authority responsible for river [2 @ 1] [2] (b) (i) Most visible pollutants in the river nearest to the factory / visible pollutant decreases downstream – accept distances or sites Ammonia level high after / near factory / ammonia level decreases further downstream – accept distances or sites Oxygen level drops / low after / near factory / oxygen level rises further downstream – accept distances or sites [2] (ii) Ammonia / pollution is high as waste water from factory goes into river Ammonia / pollution decreases downstream as it mixes with water / dissolves River current helps to disperse / spread pollution More water / tributaries dilute pollution [2] (c) (i) To move the animals into water / disturb animals / to find / to catch / collect animals [1] (ii) Net should be downstream (if upstream allow correct explanation) So that animals float into net/ flow with water / water flows towards net [2] (iii) To get a Biotic Index score for each animal / to see how polluted water is / tell them about quality of water [1] (iv) To find the part of the bed where most animals live To get an average Biotic score for the site To make the test results more reliable / fair / accurate average / more results to compare [1] www.theallpapers.com
Mark scheme, page 3
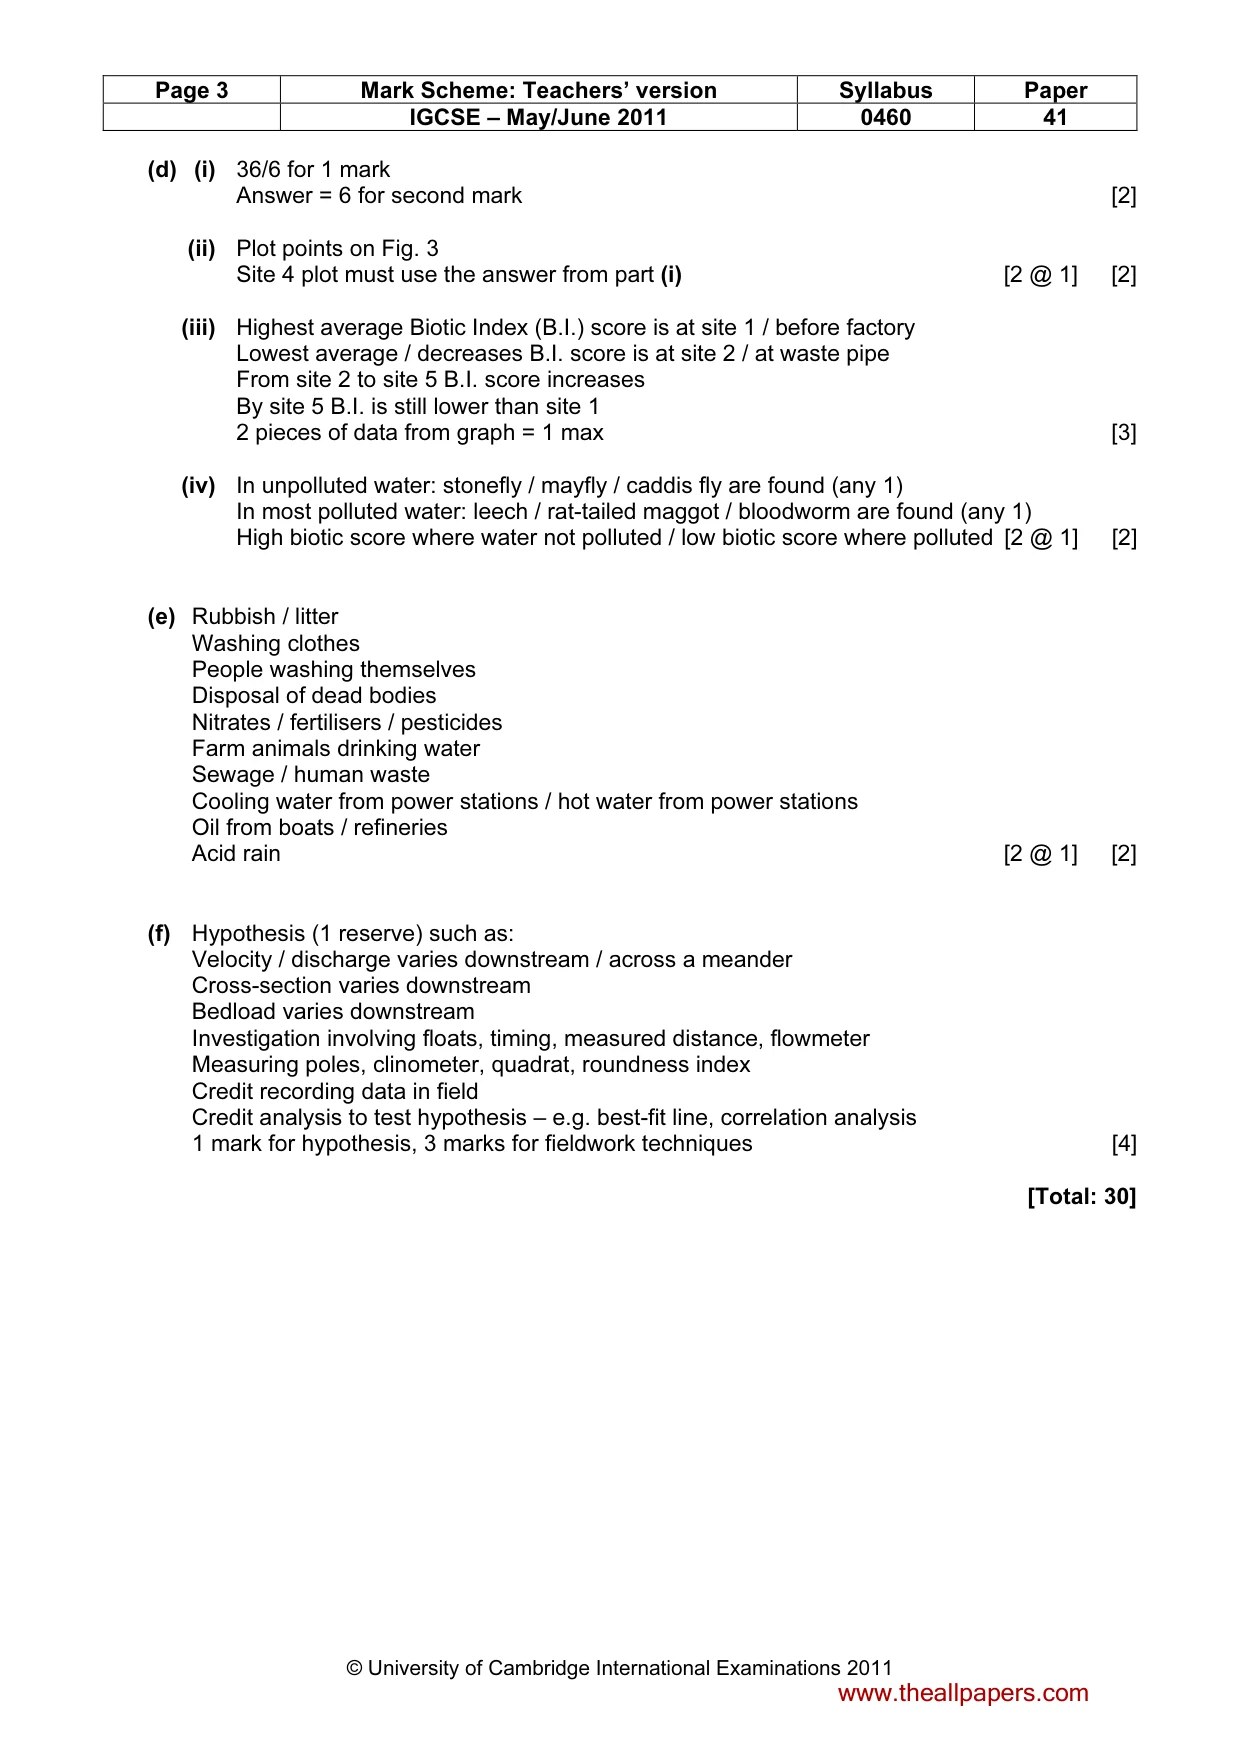
Page 3 Mark Scheme: Teachers’ version Syllabus Paper IGCSE – May/June 2011 0460 41 © University of Cambridge International Examinations 2011 (d) (i) 36/6 for 1 mark Answer = 6 for second mark [2] (ii) Plot points on Fig. 3 Site 4 plot must use the answer from part (i) [2 @ 1] [2] (iii) Highest average Biotic Index (B.I.) score is at site 1 / before factory Lowest average / decreases B.I. score is at site 2 / at waste pipe From site 2 to site 5 B.I. score increases By site 5 B.I. is still lower than site 1 2 pieces of data from graph = 1 max [3] (iv) In unpolluted water: stonefly / mayfly / caddis fly are found (any 1) In most polluted water: leech / rat-tailed maggot / bloodworm are found (any 1) High biotic score where water not polluted / low biotic score where polluted [2 @ 1] [2] (e) Rubbish / litter Washing clothes People washing themselves Disposal of dead bodies Nitrates / fertilisers / pesticides Farm animals drinking water Sewage / human waste Cooling water from power stations / hot water from power stations Oil from boats / refineries Acid rain [2 @ 1] [2] (f) Hypothesis (1 reserve) such as: Velocity / discharge varies downstream / across a meander Cross-section varies downstream Bedload varies downstream Investigation involving floats, timing, measured distance, flowmeter Measuring poles, clinometer, quadrat, roundness index Credit recording data in field Credit analysis to test hypothesis – e.g. best-fit line, correlation analysis 1 mark for hypothesis, 3 marks for fieldwork techniques [4] [Total: 30] www.theallpapers.com
Mark scheme, page 4
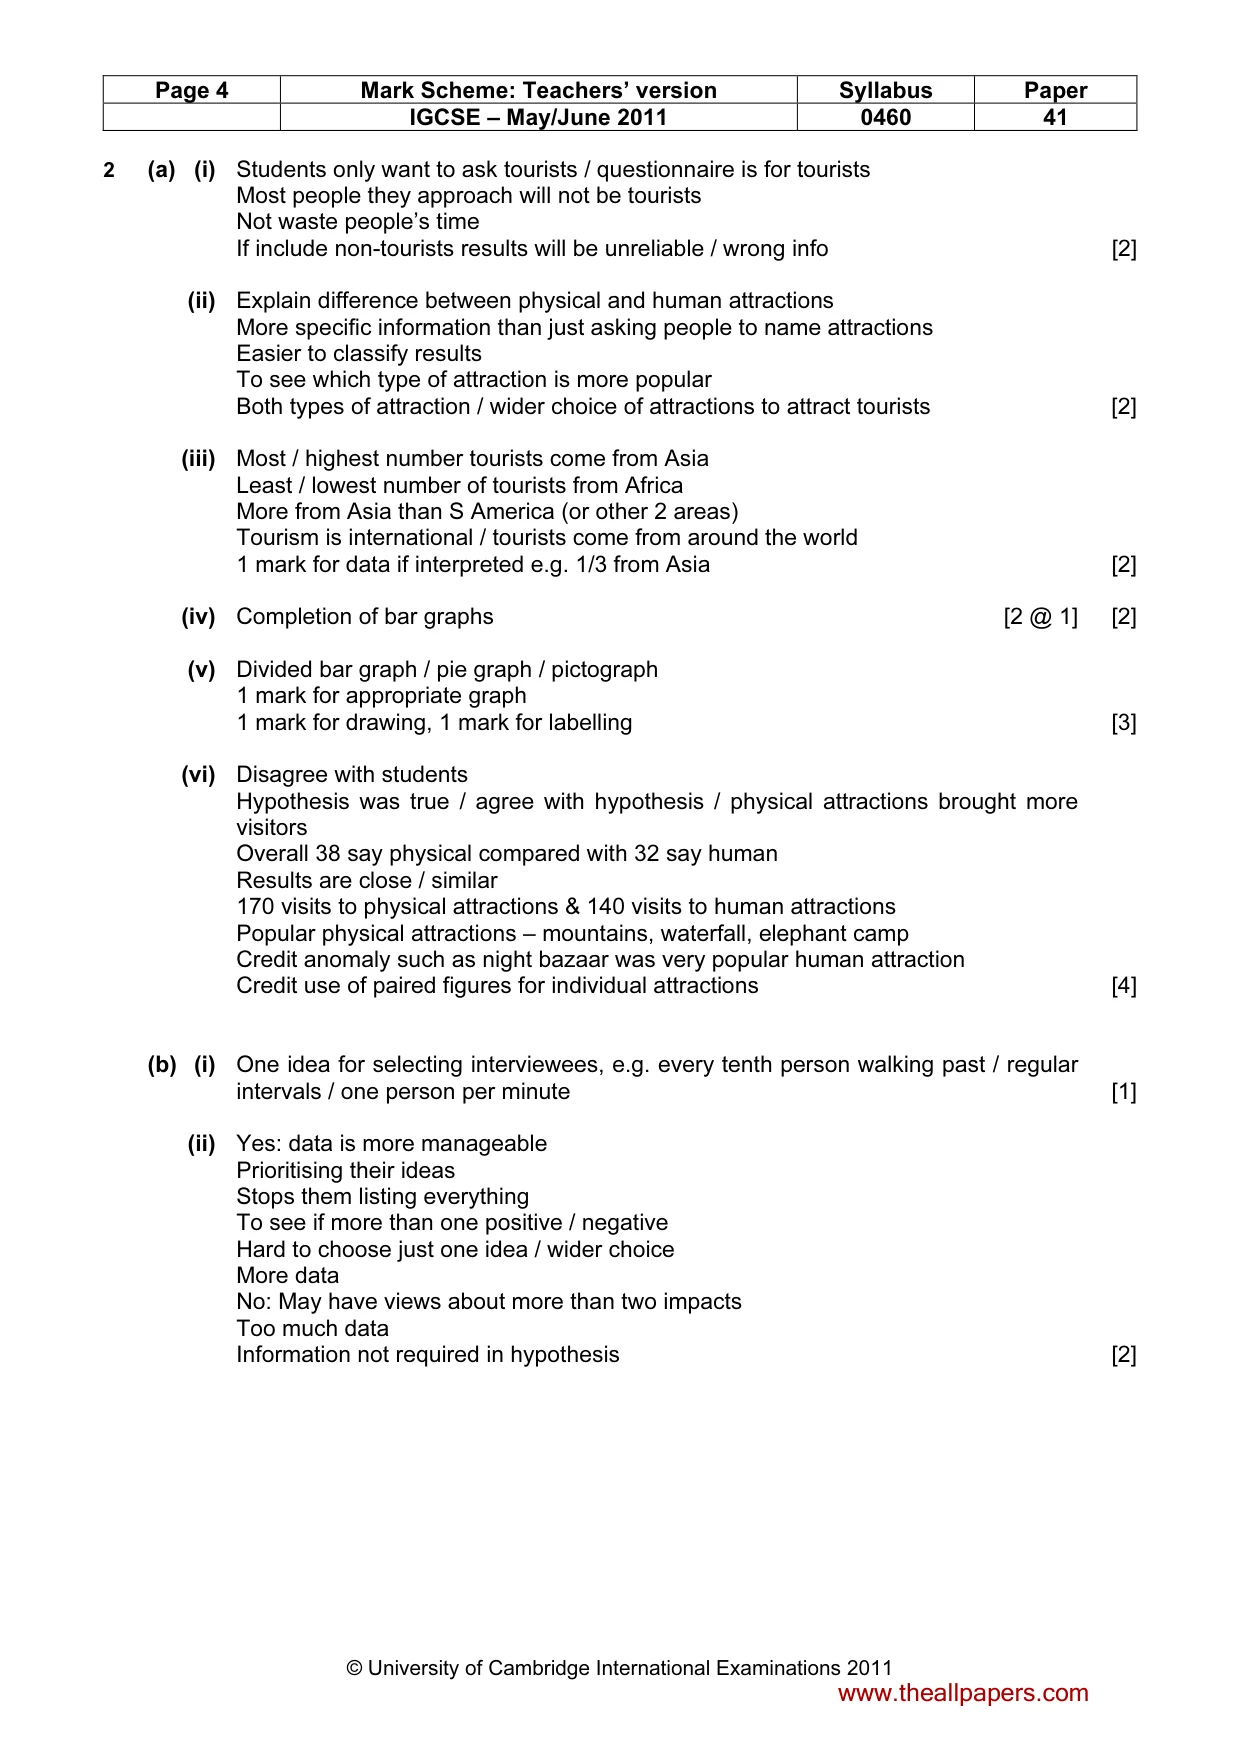
Page 4 Mark Scheme: Teachers’ version Syllabus Paper IGCSE – May/June 2011 0460 41 © University of Cambridge International Examinations 2011 2 (a) (i) Students only want to ask tourists / questionnaire is for tourists Most people they approach will not be tourists Not waste people’s time If include non-tourists results will be unreliable / wrong info [2] (ii) Explain difference between physical and human attractions More specific information than just asking people to name attractions Easier to classify results To see which type of attraction is more popular Both types of attraction / wider choice of attractions to attract tourists [2] (iii) Most / highest number tourists come from Asia Least / lowest number of tourists from Africa More from Asia than S America (or other 2 areas) Tourism is international / tourists come from around the world 1 mark for data if interpreted e.g. 1/3 from Asia [2] (iv) Completion of bar graphs [2 @ 1] [2] (v) Divided bar graph / pie graph / pictograph 1 mark for appropriate graph 1 mark for drawing, 1 mark for labelling [3] (vi) Disagree with students Hypothesis was true / agree with hypothesis / physical attractions brought more visitors Overall 38 say physical compared with 32 say human Results are close / similar 170 visits to physical attractions & 140 visits to human attractions Popular physical attractions – mountains, waterfall, elephant camp Credit anomaly such as night bazaar was very popular human attraction Credit use of paired figures for individual attractions [4] (b) (i) One idea for selecting interviewees, e.g. every tenth person walking past / regular intervals / one person per minute [1] (ii) Yes: data is more manageable Prioritising their ideas Stops them listing everything To see if more than one positive / negative Hard to choose just one idea / wider choice More data No: May have views about more than two impacts Too much data Information not required in hypothesis [2] www.theallpapers.com
Mark scheme, page 5
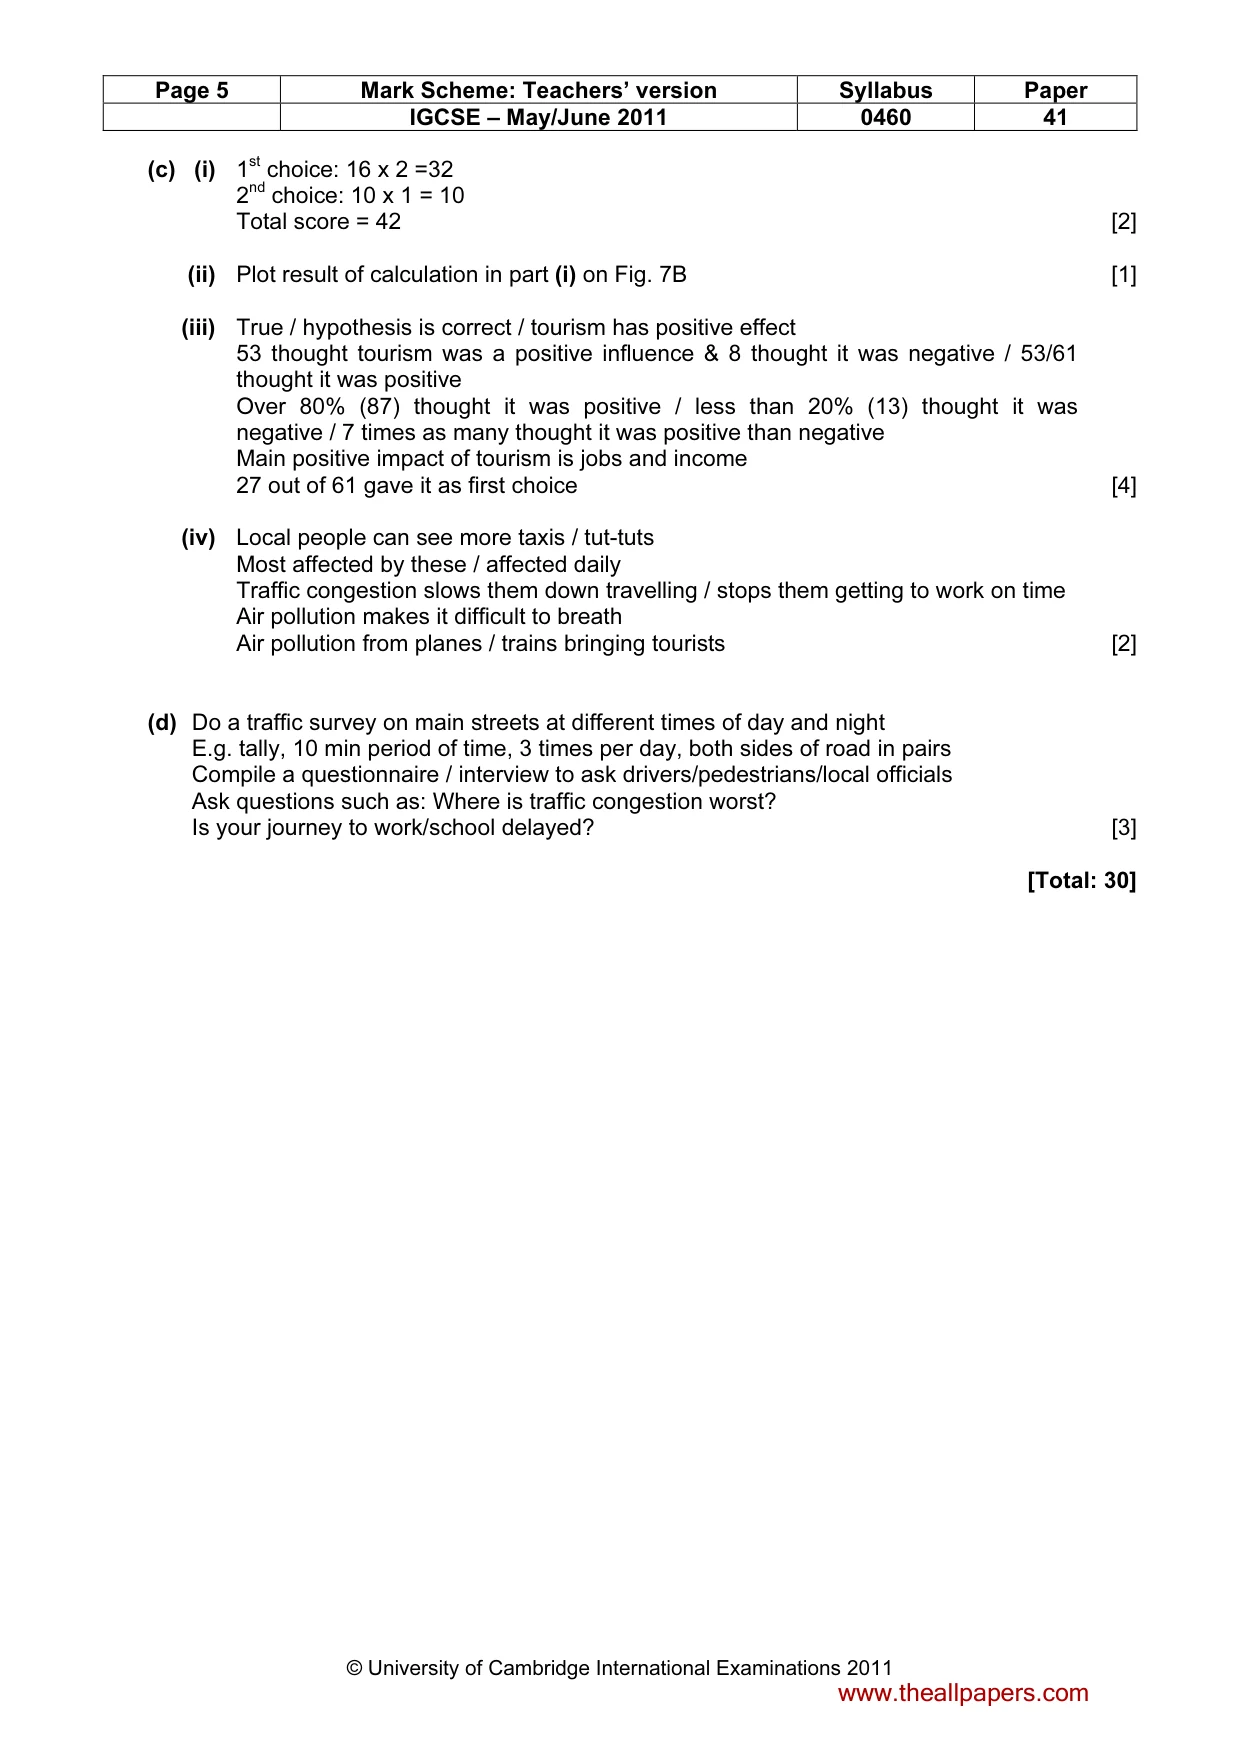
Page 5 Mark Scheme: Teachers’ version Syllabus Paper IGCSE – May/June 2011 0460 41 © University of Cambridge International Examinations 2011 (c) (i) 1st choice: 16 x 2 =32 2nd choice: 10 x 1 = 10 Total score = 42 [2] (ii) Plot result of calculation in part (i) on Fig. 7B [1] (iii) True / hypothesis is correct / tourism has positive effect 53 thought tourism was a positive influence & 8 thought it was negative / 53/61 thought it was positive Over 80% (87) thought it was positive / less than 20% (13) thought it was negative / 7 times as many thought it was positive than negative Main positive impact of tourism is jobs and income 27 out of 61 gave it as first choice [4] (iv) Local people can see more taxis / tut-tuts Most affected by these / affected daily Traffic congestion slows them down travelling / stops them getting to work on time Air pollution makes it difficult to breath Air pollution from planes / trains bringing tourists [2] (d) Do a traffic survey on main streets at different times of day and night E.g. tally, 10 min period of time, 3 times per day, both sides of road in pairs Compile a questionnaire / interview to ask drivers/pedestrians/local officials Ask questions such as: Where is traffic congestion worst? Is your journey to work/school delayed? [3] [Total: 30] www.theallpapers.com
What you needed in this session
Cambridge’s own grade thresholds for 2011 May/June, Paper 4 · Variant 1. A higher threshold means an easier paper — the bar moves with how the cohort did.