Cambridge IGCSE Geography 0460 — 2011 May/June Paper 4 · Variant 2
0460/42/M/J/11 · 60 marks · ≈68 min
The question paper and its mark scheme, free to read here and free to download. This is Cambridge’s own paper, exactly as it was sat.
Question paper12 pages
Mark scheme6 pages
Answers below. Sit the paper first if you are practising.
Paper as text
Question paper, page 1
This document consists of 12 printed pages and 1 Insert. DC (SM/DJ) 32333/5 © UCLES 2011 [Turn over UNIVERSITY OF CAMBRIDGE INTERNATIONAL EXAMINATIONS International General Certificate of Secondary Education * 2 5 3 5 7 5 8 6 2 4 * GEOGRAPHY 0460/42 Paper 4 Alternative to Coursework May/June 2011 1 hour 30 minutes Candidates answer on the Question Paper. Additional Materials: Calculator Ruler READ THESE INSTRUCTIONS FIRST Write your Centre number, candidate number and name in the spaces provided. Write in dark blue or black pen. You may use a soft pencil for any diagrams, graphs or rough working. Do not use staples, paper clips, highlighters, glue or correction fluid. DO NOT WRITE ON ANY BARCODES. Answer all questions. The Insert contains Figs 1 and 2, Photograph A and Table 1 for Question 1, and Fig. 4 and Table 2 for Question 2. The Insert is not required by the Examiner. Sketch maps and diagrams should be drawn whenever they serve to illustrate an answer. The number of marks is given in brackets [ ] at the end of each question or part question. www.theallpapers.com
Question paper, page 2
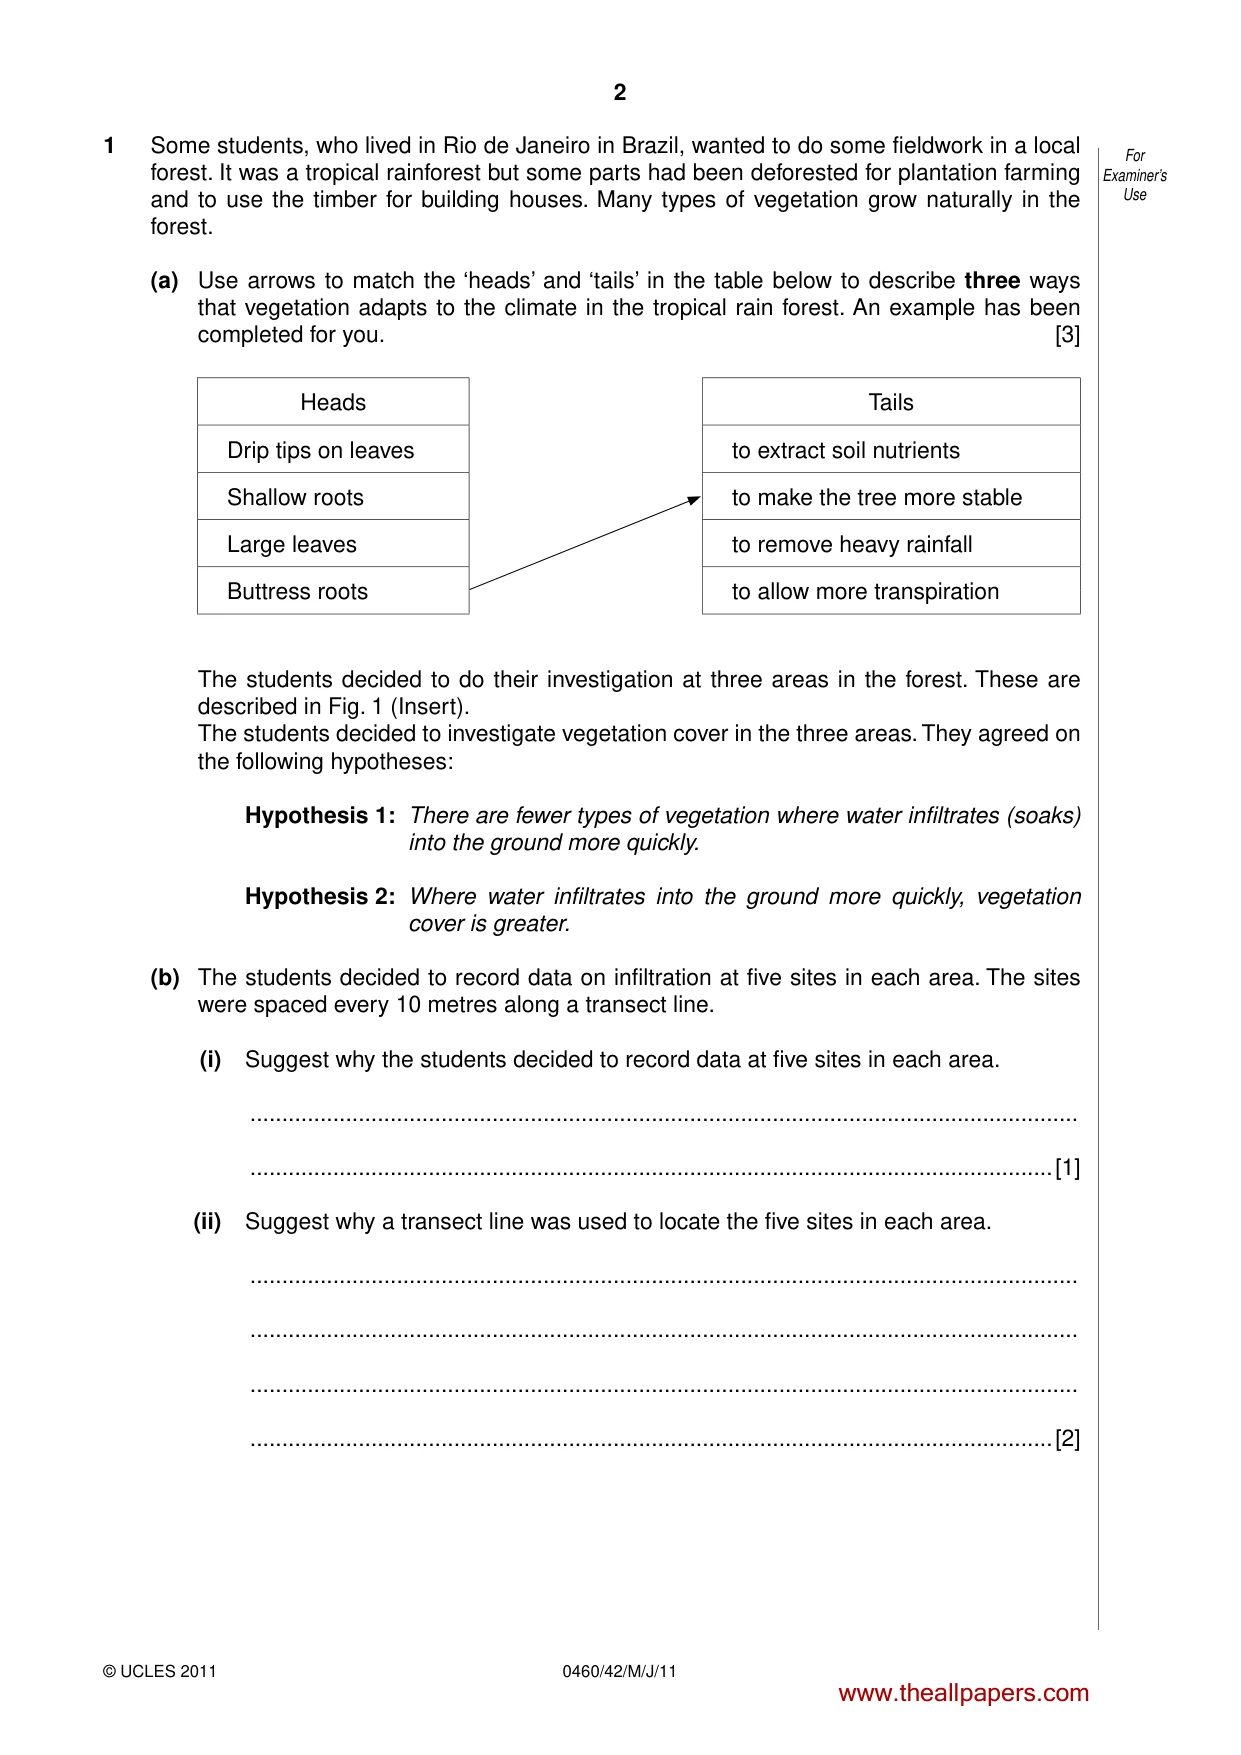
2 0460/42/M/J/11 © UCLES 2011 For Examiner’s Use 1 Some students, who lived in Rio de Janeiro in Brazil, wanted to do some fieldwork in a local forest. It was a tropical rainforest but some parts had been deforested for plantation farming and to use the timber for building houses. Many types of vegetation grow naturally in the forest. (a) Use arrows to match the ‘heads’ and ‘tails’ in the table below to describe three ways that vegetation adapts to the climate in the tropical rain forest. An example has been completed for you. [3] Heads Tails Drip tips on leaves to extract soil nutrients Shallow roots to make the tree more stable Large leaves to remove heavy rainfall Buttress roots to allow more transpiration The students decided to do their investigation at three areas in the forest. These are described in Fig. 1 (Insert). The students decided to investigate vegetation cover in the three areas. They agreed on the following hypotheses: Hypothesis 1: There are fewer types of vegetation where water infiltrates (soaks) into the ground more quickly. Hypothesis 2: Where water infiltrates into the ground more quickly, vegetation cover is greater. (b) The students decided to record data on infiltration at five sites in each area. The sites were spaced every 10 metres along a transect line. (i) Suggest why the students decided to record data at five sites in each area. … …[1] (ii) Suggest why a transect line was used to locate the five sites in each area. … … … …[2] www.theallpapers.com
Question paper, page 3
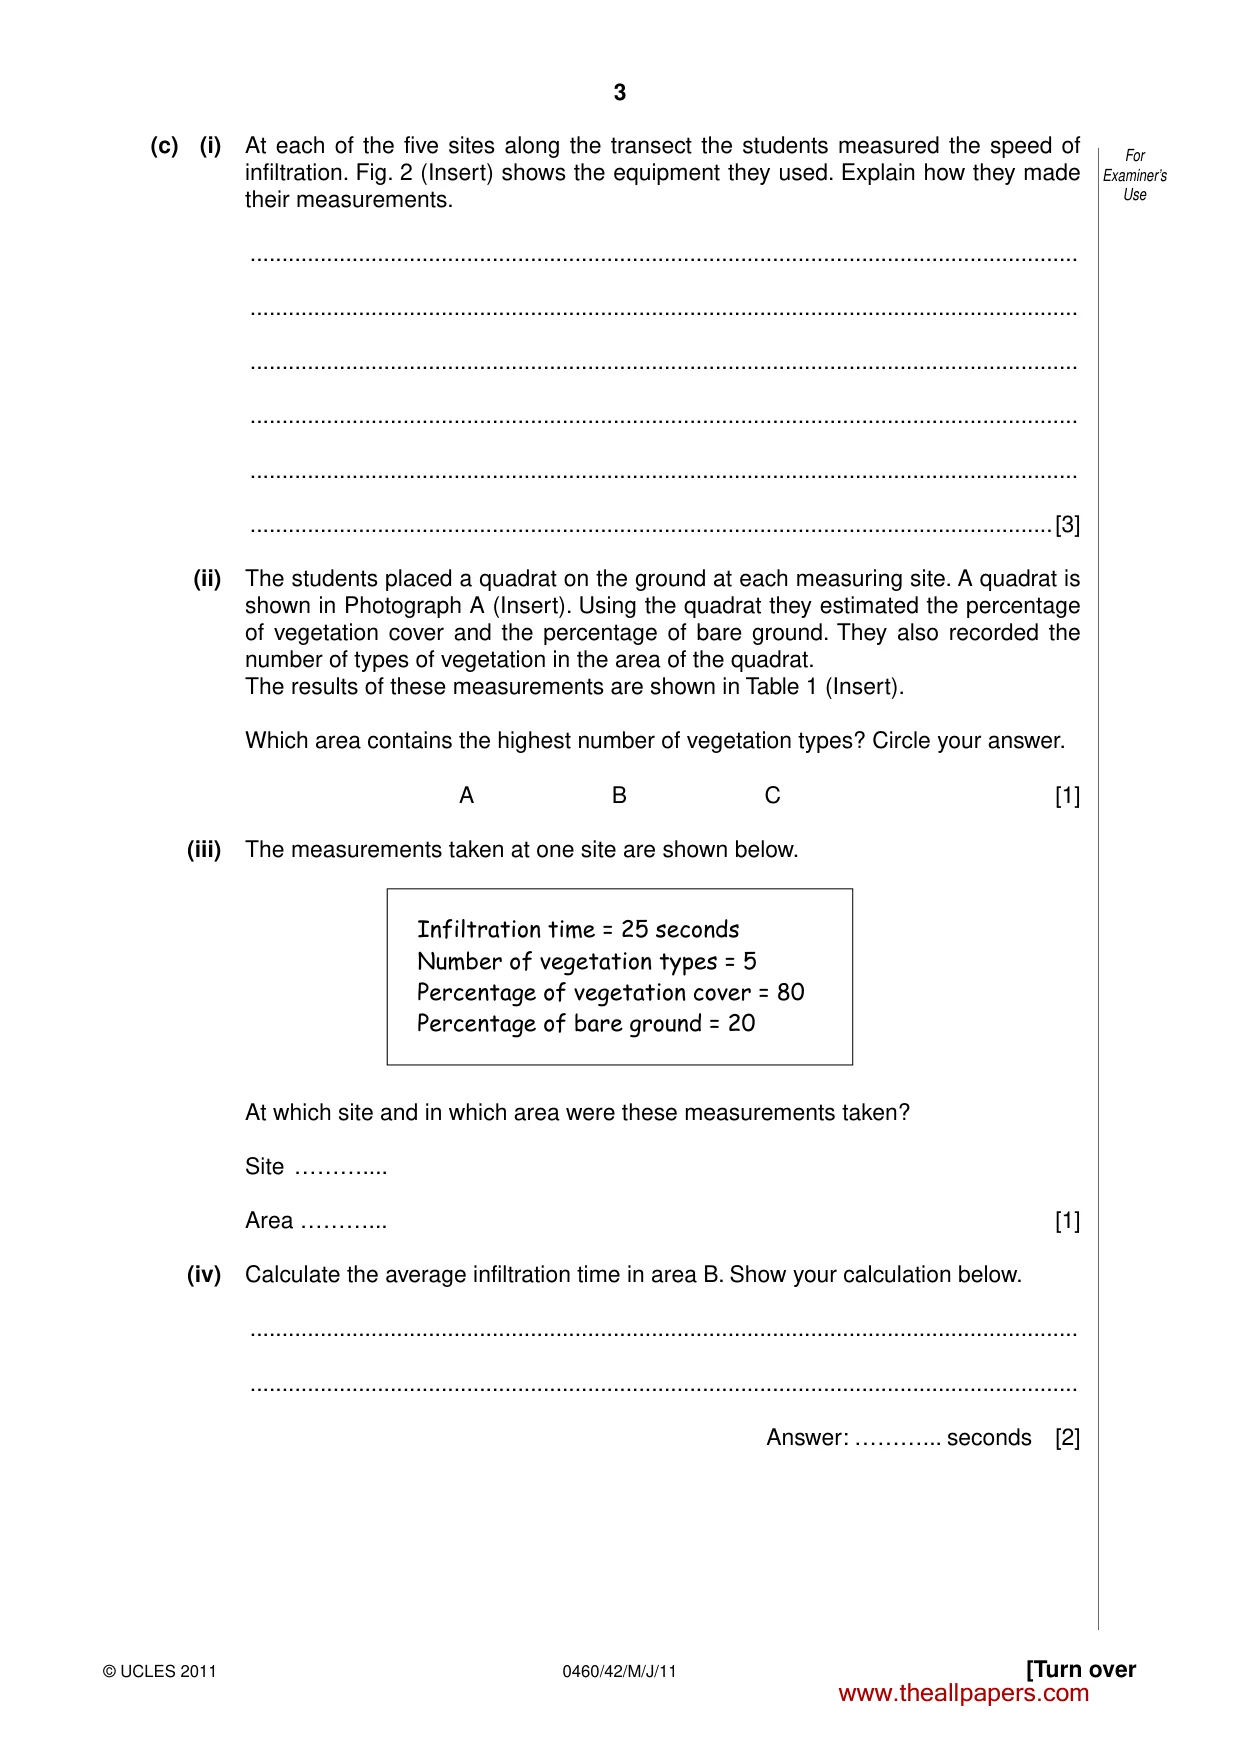
3 [Turn over © UCLES 2011 0460/42/M/J/11 For Examiner’s Use (c) (i) At each of the five sites along the transect the students measured the speed of infiltration. Fig. 2 (Insert) shows the equipment they used. Explain how they made their measurements. … … … … … …[3] (ii) The students placed a quadrat on the ground at each measuring site. A quadrat is shown in Photograph A (Insert). Using the quadrat they estimated the percentage of vegetation cover and the percentage of bare ground. They also recorded the number of types of vegetation in the area of the quadrat. The results of these measurements are shown in Table 1 (Insert). Which area contains the highest number of vegetation types? Circle your answer. A B C [1] (iii) The measurements taken at one site are shown below. Infiltration time = 25 seconds Number of vegetation types = 5 Percentage of vegetation cover = 80 Percentage of bare ground = 20 At which site and in which area were these measurements taken? Site ………… Area ………... [1] (iv) Calculate the average infiltration time in area B. Show your calculation below. … … Answer: ………... seconds [2] www.theallpapers.com
Question paper, page 4
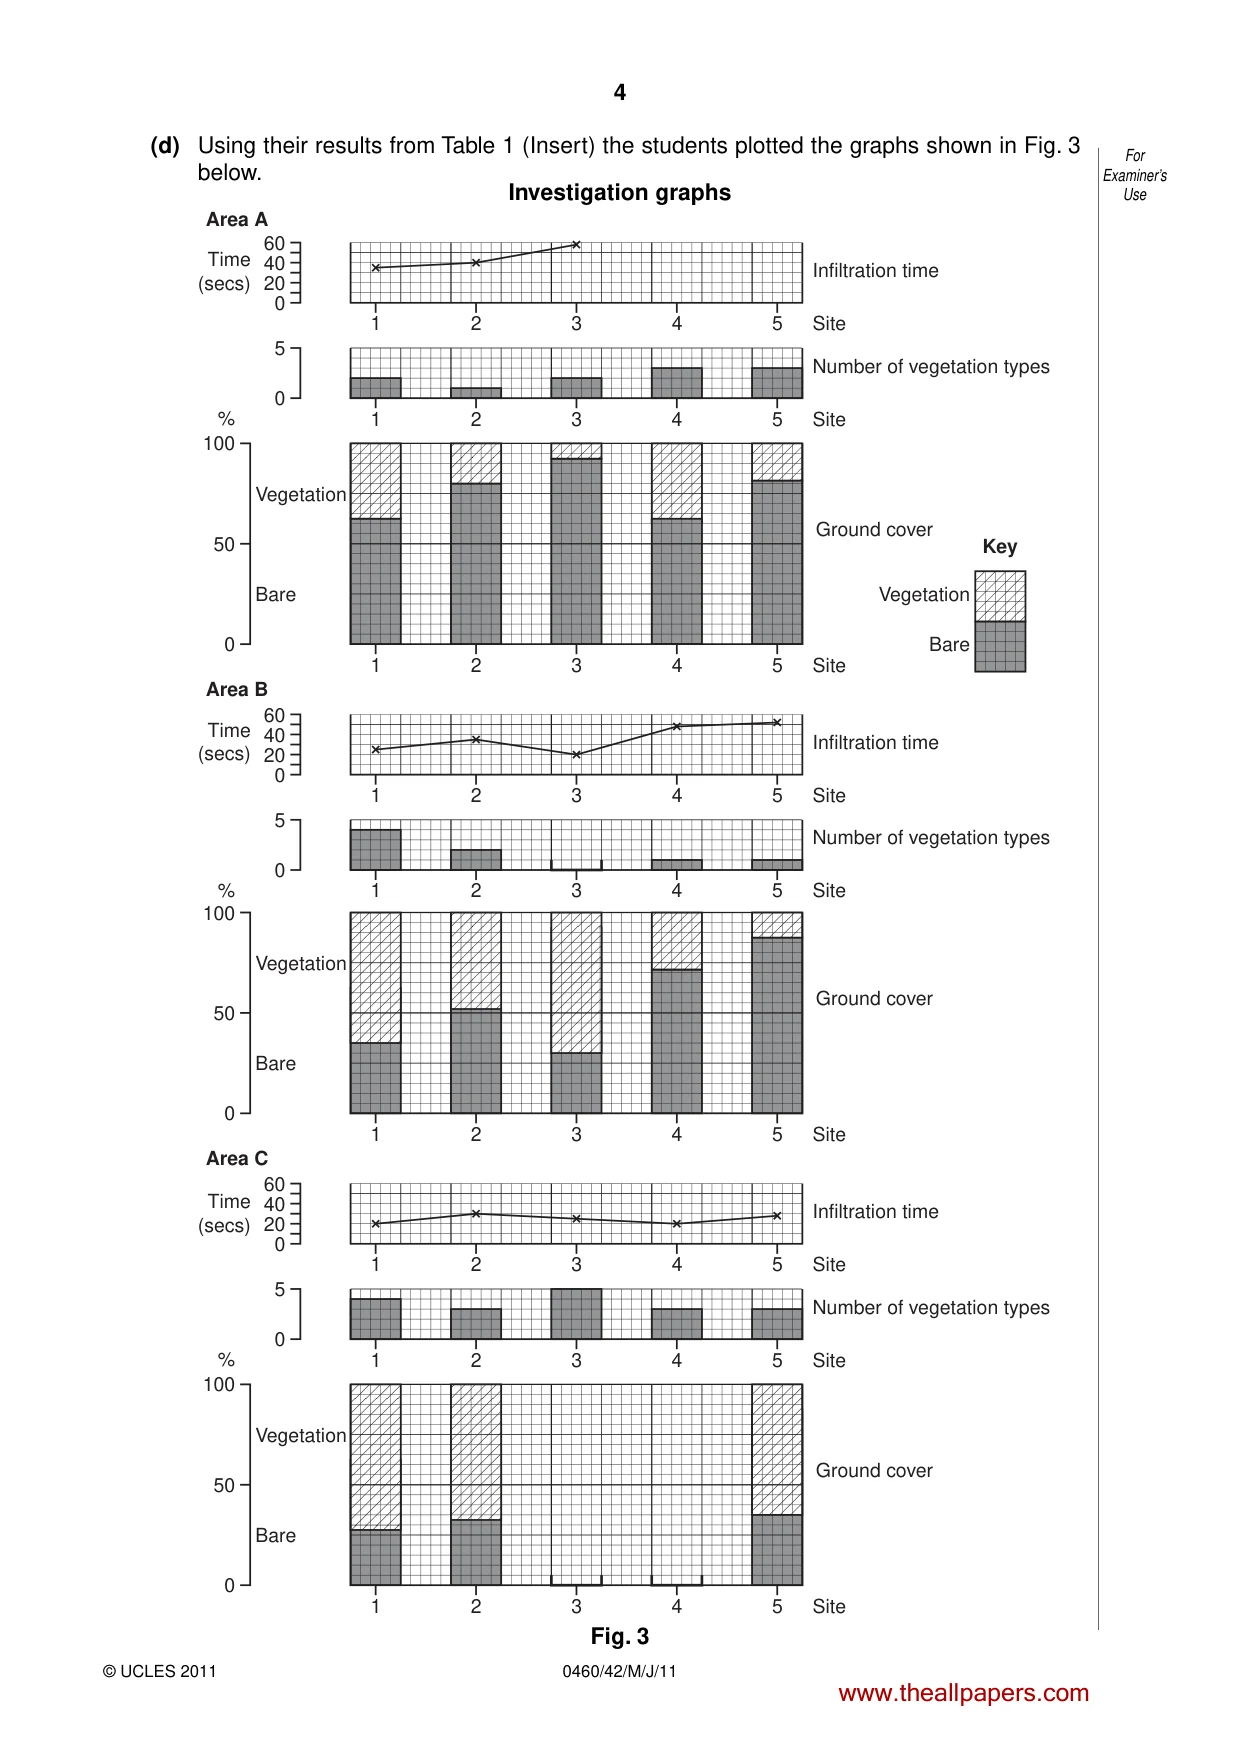
4 0460/42/M/J/11 © UCLES 2011 For Examiner’s Use (d) Using their results from Table 1 (Insert) the students plotted the graphs shown in Fig. 3 below. Investigation graphs 60 40 Time (secs) Area A Infiltration time 20 0 1 2 3 4 5 Site 5 Number of vegetation types 0 1 2 3 4 5 Site 100 Vegetation Ground cover Key Bare Vegetation Bare % 50 0 1 2 3 4 5 Site 60 40 Time (secs) Area B Infiltration time 20 0 1 2 3 4 5 Site 5 Number of vegetation types 0 1 2 3 4 5 Site 100 Vegetation Ground cover Bare % 50 0 1 2 3 4 5 Site 60 40 Time (secs) Area C Infiltration time 20 0 1 2 3 4 5 Site 5 Number of vegetation types 0 1 2 3 4 5 Site 100 Vegetation Ground cover Bare % 50 0 1 2 3 4 5 Site Fig. 3 www.theallpapers.com
Question paper, page 5
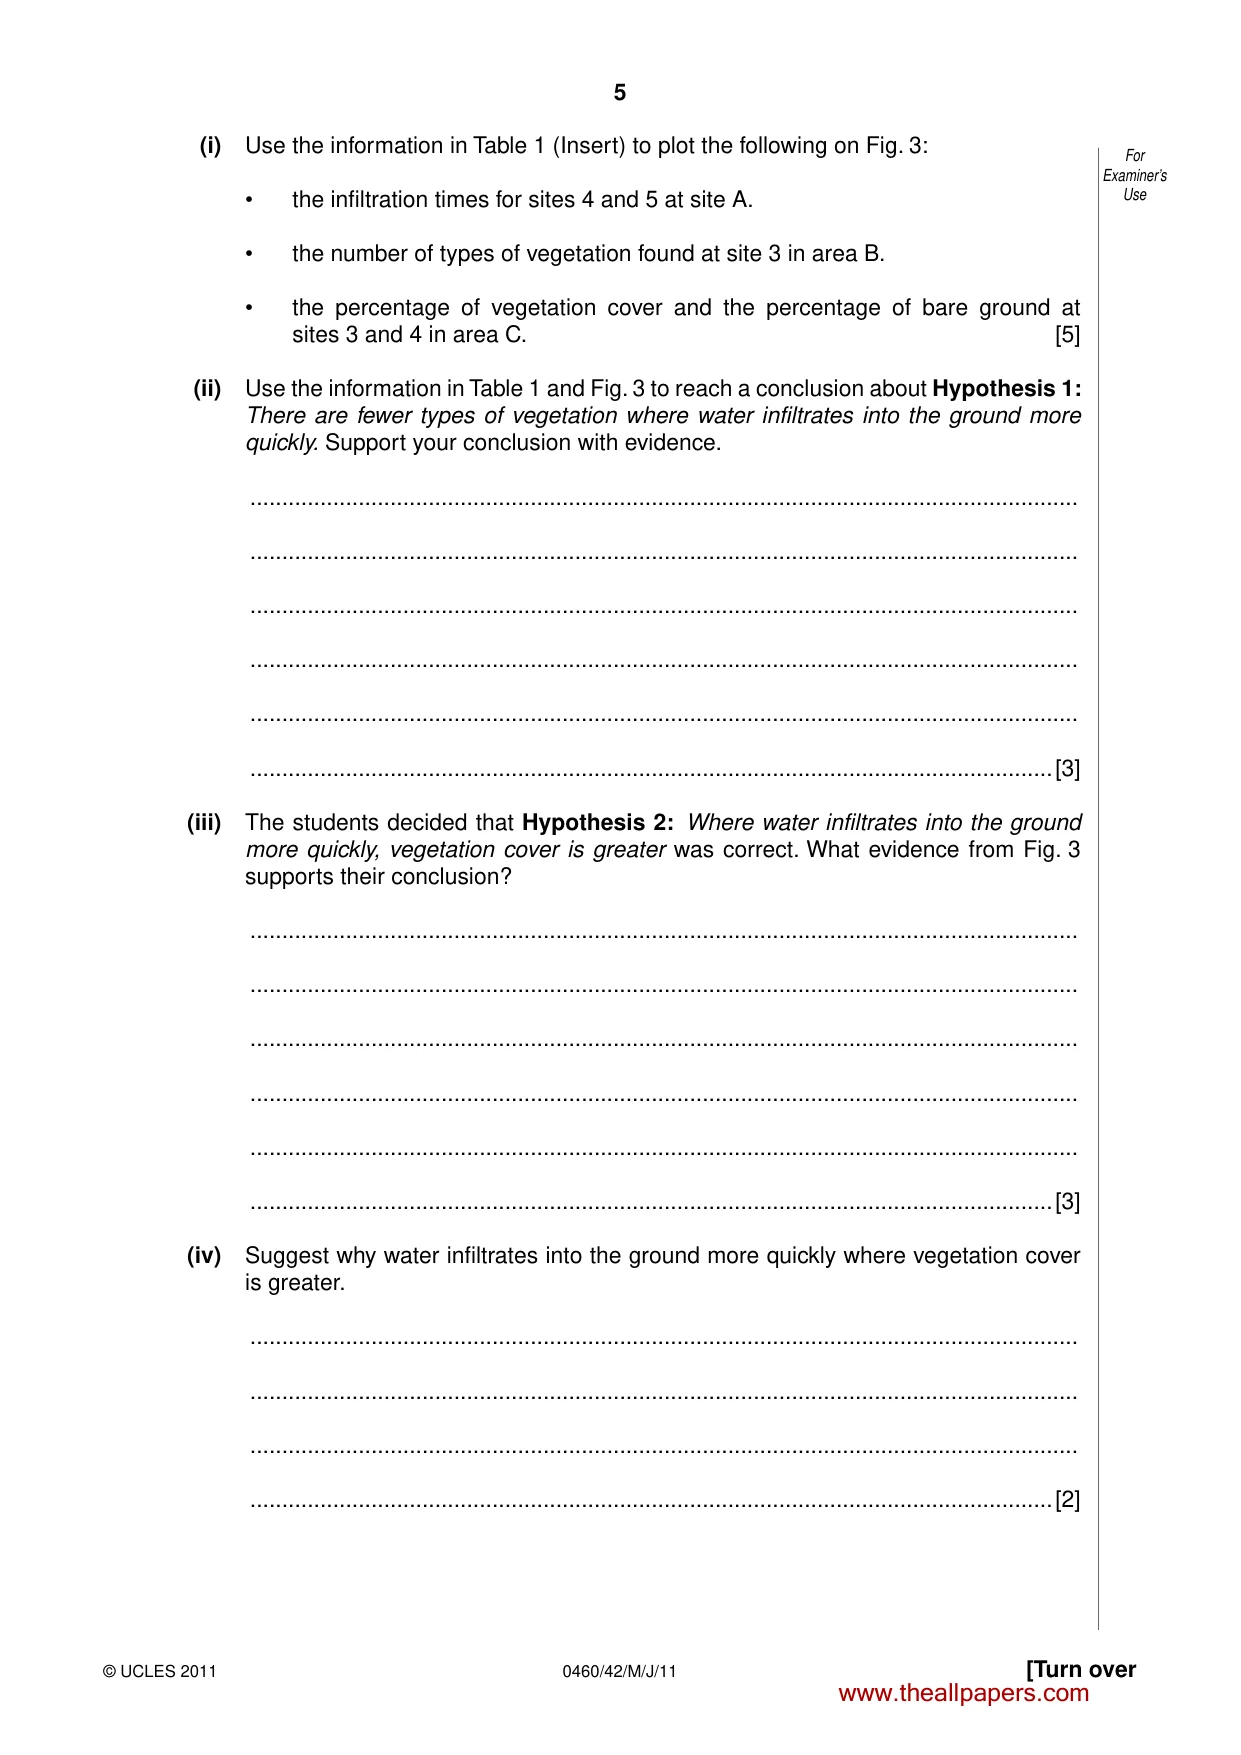
5 [Turn over © UCLES 2011 0460/42/M/J/11 For Examiner’s Use (i) Use the information in Table 1 (Insert) to plot the following on Fig. 3: • the infiltration times for sites 4 and 5 at site A. • the number of types of vegetation found at site 3 in area B. • the percentage of vegetation cover and the percentage of bare ground at sites 3 and 4 in area C. [5] (ii) Use the information in Table 1 and Fig. 3 to reach a conclusion about Hypothesis 1: There are fewer types of vegetation where water infiltrates into the ground more quickly. Support your conclusion with evidence. … … … … … …[3] (iii) The students decided that Hypothesis 2: Where water infiltrates into the ground more quickly, vegetation cover is greater was correct. What evidence from Fig. 3 supports their conclusion? … … … … … …[3] (iv) Suggest why water infiltrates into the ground more quickly where vegetation cover is greater. … … … …[2] www.theallpapers.com
Question paper, page 6
6 0460/42/M/J/11 © UCLES 2011 For Examiner’s Use (e) Suggest why infiltration times are different between the three areas A, B and C in Fig. 1. … … … … … … … …[4] [Total: 30 marks] www.theallpapers.com
Question paper, page 7
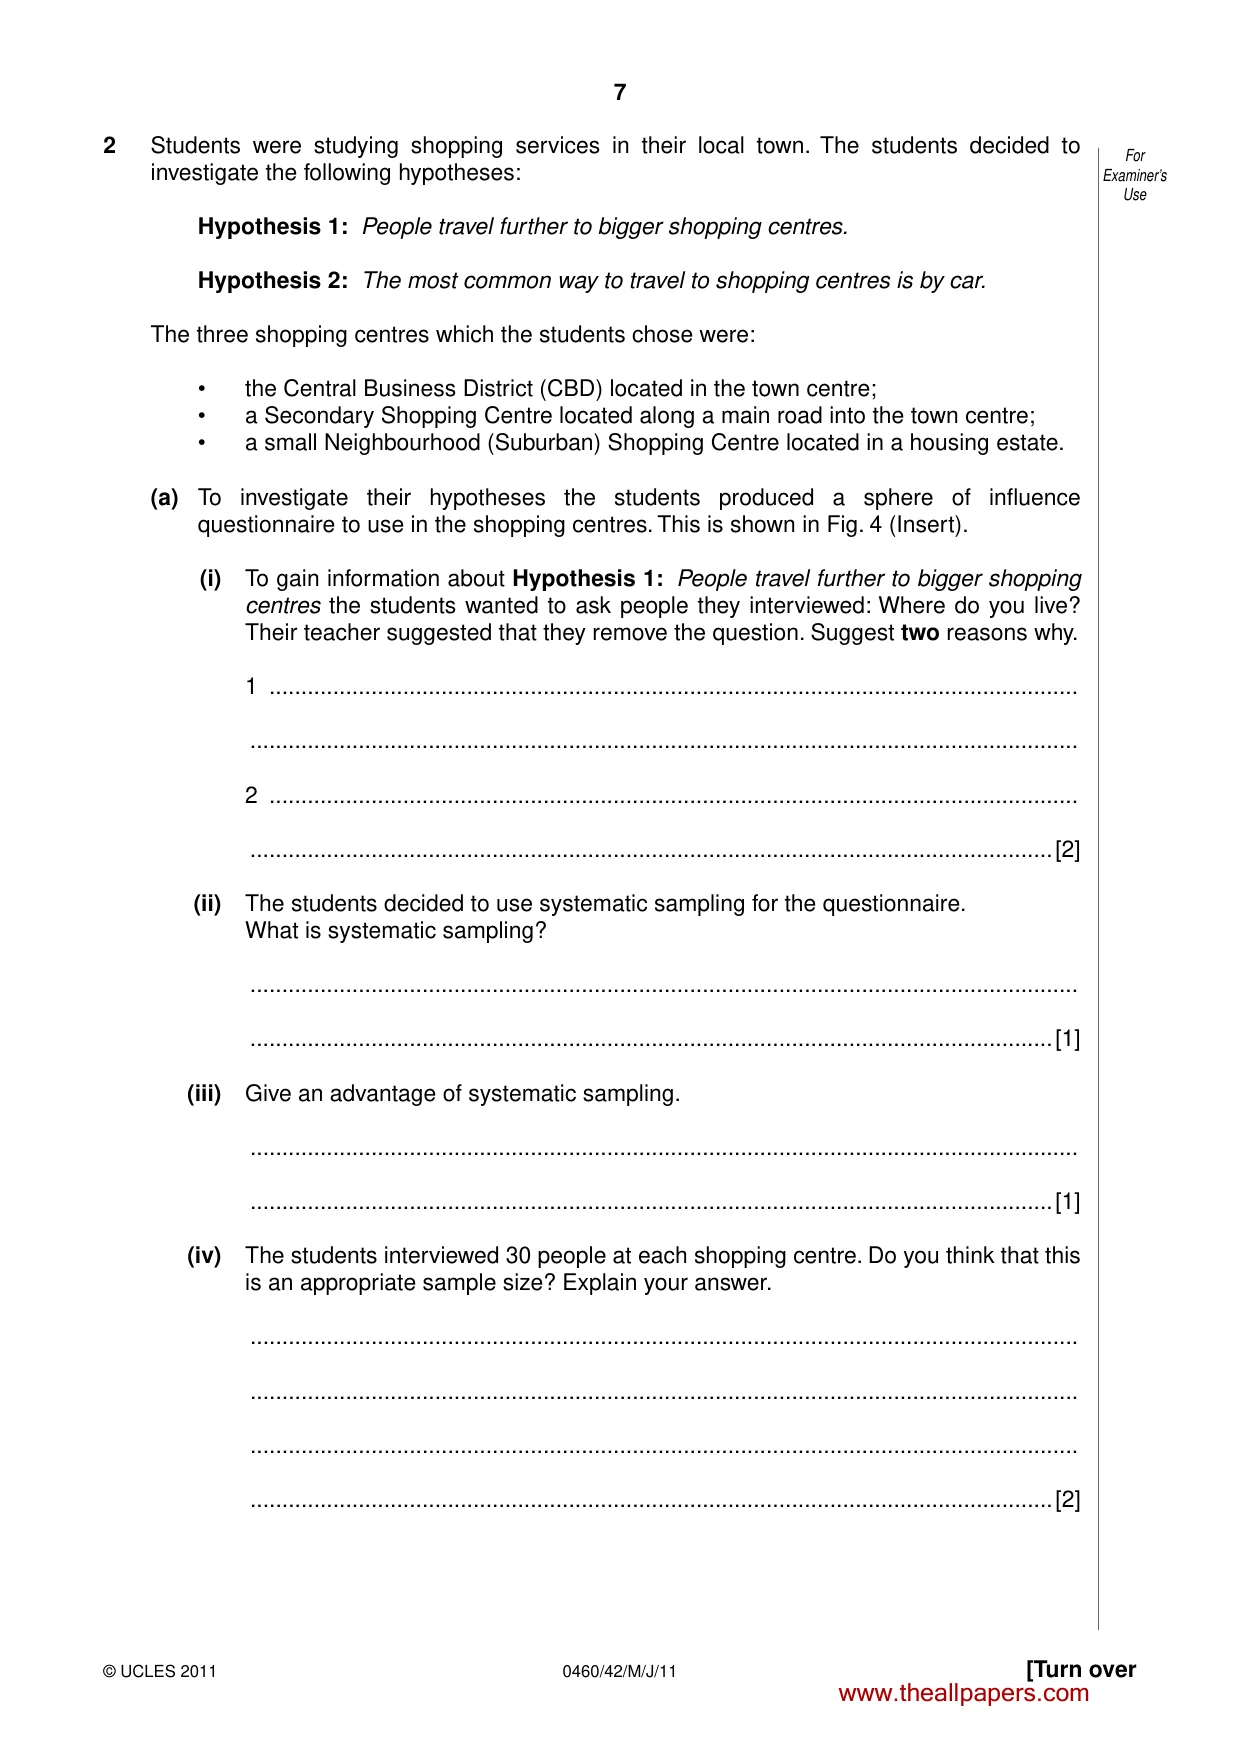
7 [Turn over © UCLES 2011 0460/42/M/J/11 For Examiner’s Use 2 Students were studying shopping services in their local town. The students decided to investigate the following hypotheses: Hypothesis 1: People travel further to bigger shopping centres. Hypothesis 2: The most common way to travel to shopping centres is by car. The three shopping centres which the students chose were: • the Central Business District (CBD) located in the town centre; • a Secondary Shopping Centre located along a main road into the town centre; • a small Neighbourhood (Suburban) Shopping Centre located in a housing estate. (a) To investigate their hypotheses the students produced a sphere of influence questionnaire to use in the shopping centres. This is shown in Fig. 4 (Insert). (i) To gain information about Hypothesis 1: People travel further to bigger shopping centres the students wanted to ask people they interviewed: Where do you live? Their teacher suggested that they remove the question. Suggest two reasons why. 1 … … 2 … …[2] (ii) The students decided to use systematic sampling for the questionnaire. What is systematic sampling? … …[1] (iii) Give an advantage of systematic sampling. … …[1] (iv) The students interviewed 30 people at each shopping centre. Do you think that this is an appropriate sample size? Explain your answer. … … … …[2] www.theallpapers.com
Question paper, page 8
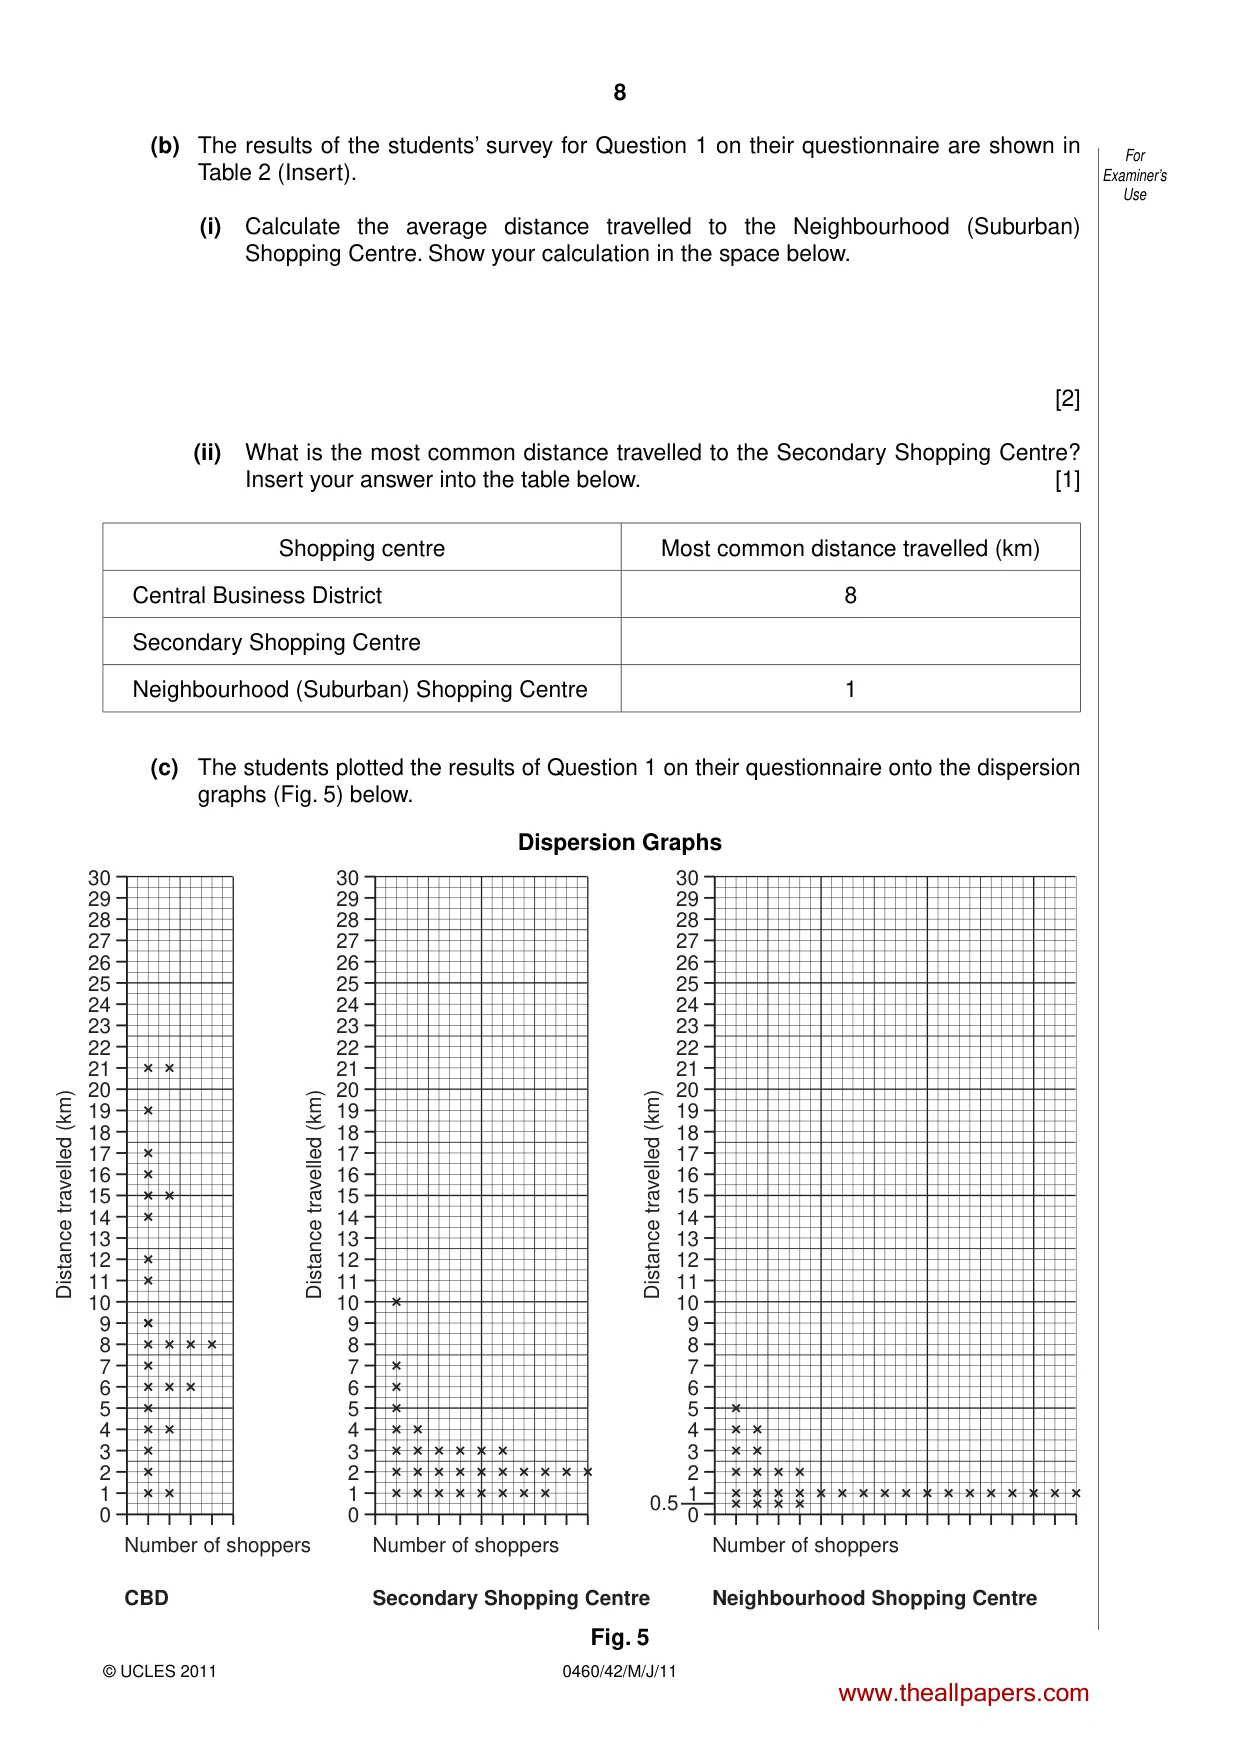
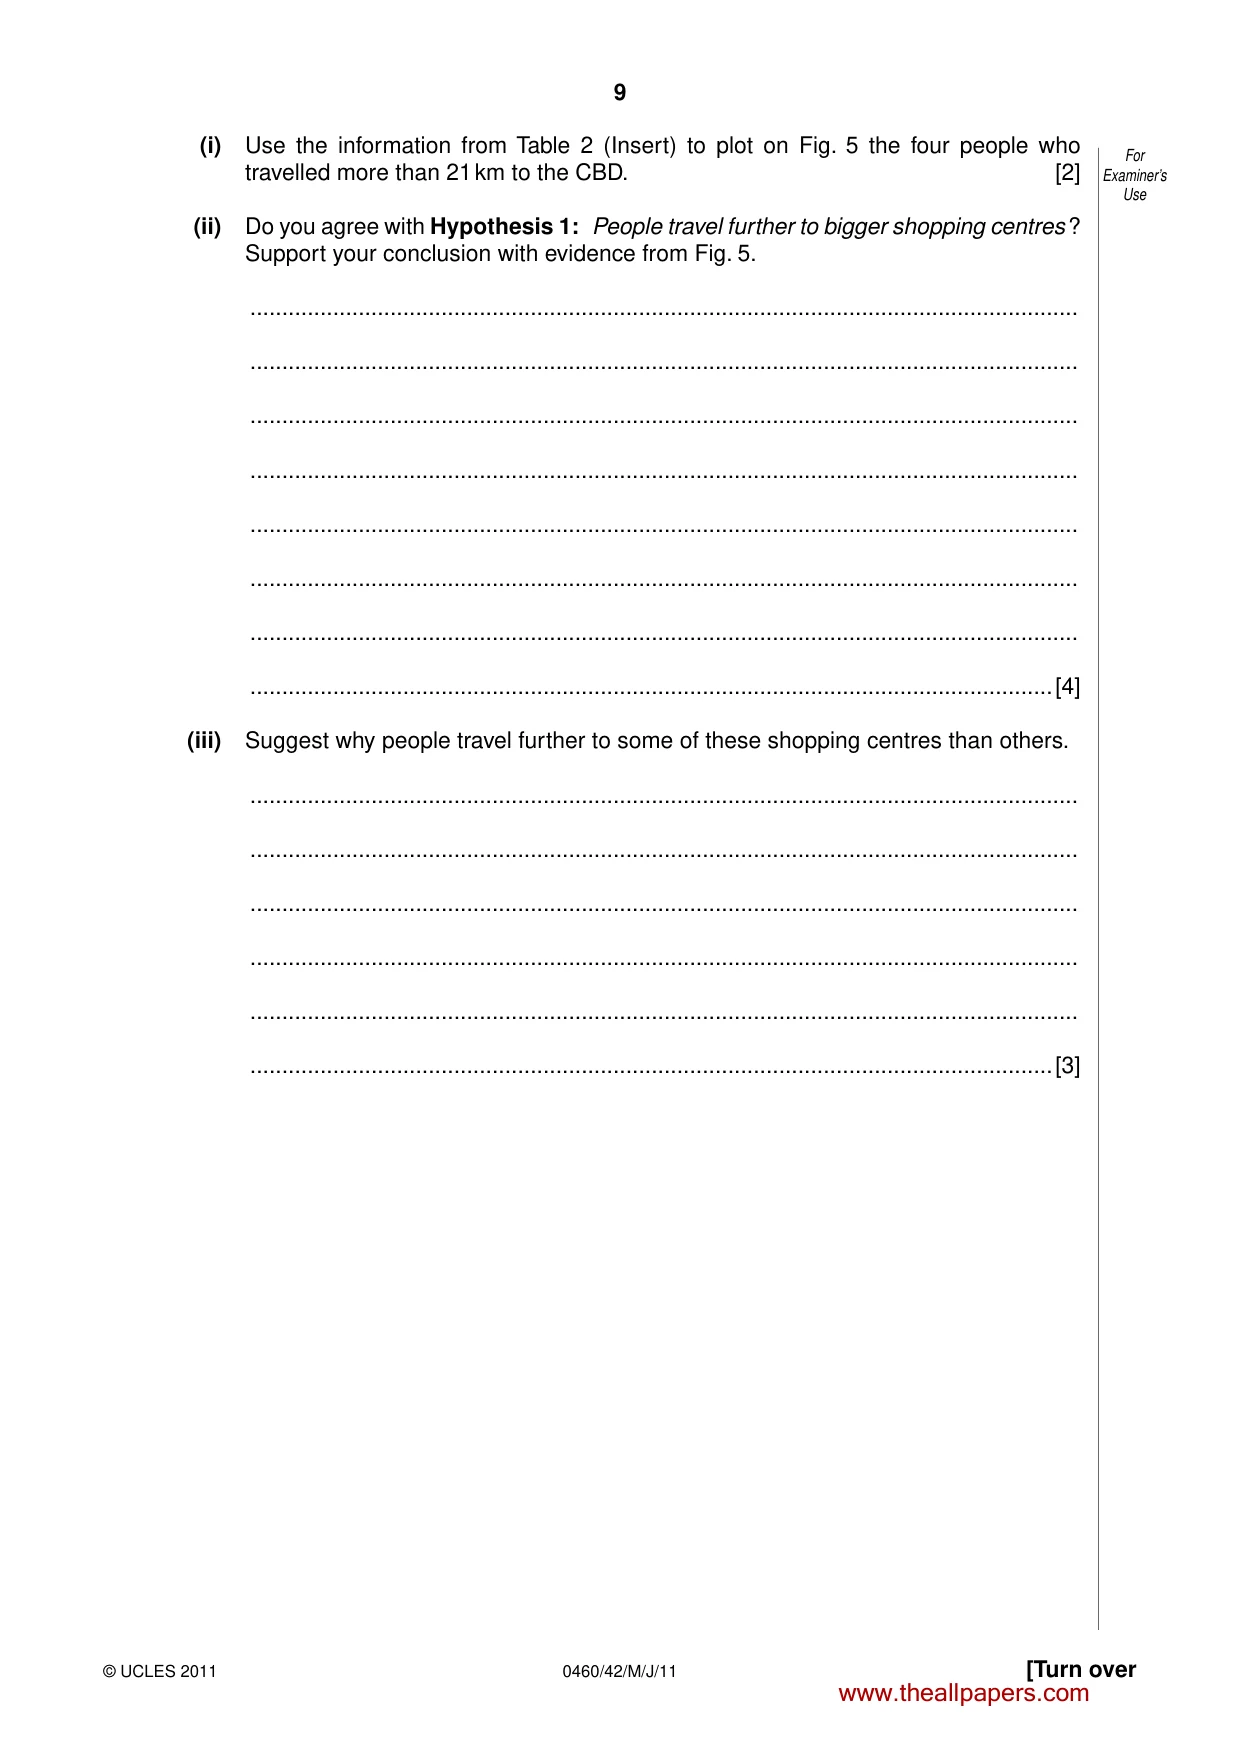
8 0460/42/M/J/11 © UCLES 2011 For Examiner’s Use (b) The results of the students’ survey for Question 1 on their questionnaire are shown in Table 2 (Insert). (i) Calculate the average distance travelled to the Neighbourhood (Suburban) Shopping Centre. Show your calculation in the space below. [2] (ii) What is the most common distance travelled to the Secondary Shopping Centre? Insert your answer into the table below. [1] Shopping centre Most common distance travelled (km) Central Business District 8 Secondary Shopping Centre Neighbourhood (Suburban) Shopping Centre 1 (c) The students plotted the results of Question 1 on their questionnaire onto the dispersion graphs (Fig. 5) below. Dispersion Graphs 0 Number of shoppers 1 2 3 4 5 6 7 8 9 10 11 12 13 14 15 16 17 18 19 20 21 22 23 24 25 26 27 28 29 30 Distance travelled (km) Distance travelled (km) Distance travelled (km) 0 Number of shoppers 1 2 3 4 5 6 7 8 9 10 11 12 13 14 15 16 17 18 19 20 21 22 23 24 25 26 27 28 29 30 0 0.5 Number of shoppers CBD Secondary Shopping Centre Neighbourhood Shopping Centre 1 2 3 4 5 6 7 8 9 10 11 12 13 14 15 16 17 18 19 20 21 22 23 24 25 26 27 28 29 30 Fig. 5 www.theallpapers.com
Question paper, page 9
9 [Turn over © UCLES 2011 0460/42/M/J/11 For Examiner’s Use (i) Use the information from Table 2 (Insert) to plot on Fig. 5 the four people who travelled more than 21 km to the CBD. [2] (ii) Do you agree with Hypothesis 1: People travel further to bigger shopping centres ? Support your conclusion with evidence from Fig. 5. … … … … … … … …[4] (iii) Suggest why people travel further to some of these shopping centres than others. … … … … … …[3] www.theallpapers.com
Question paper, page 10
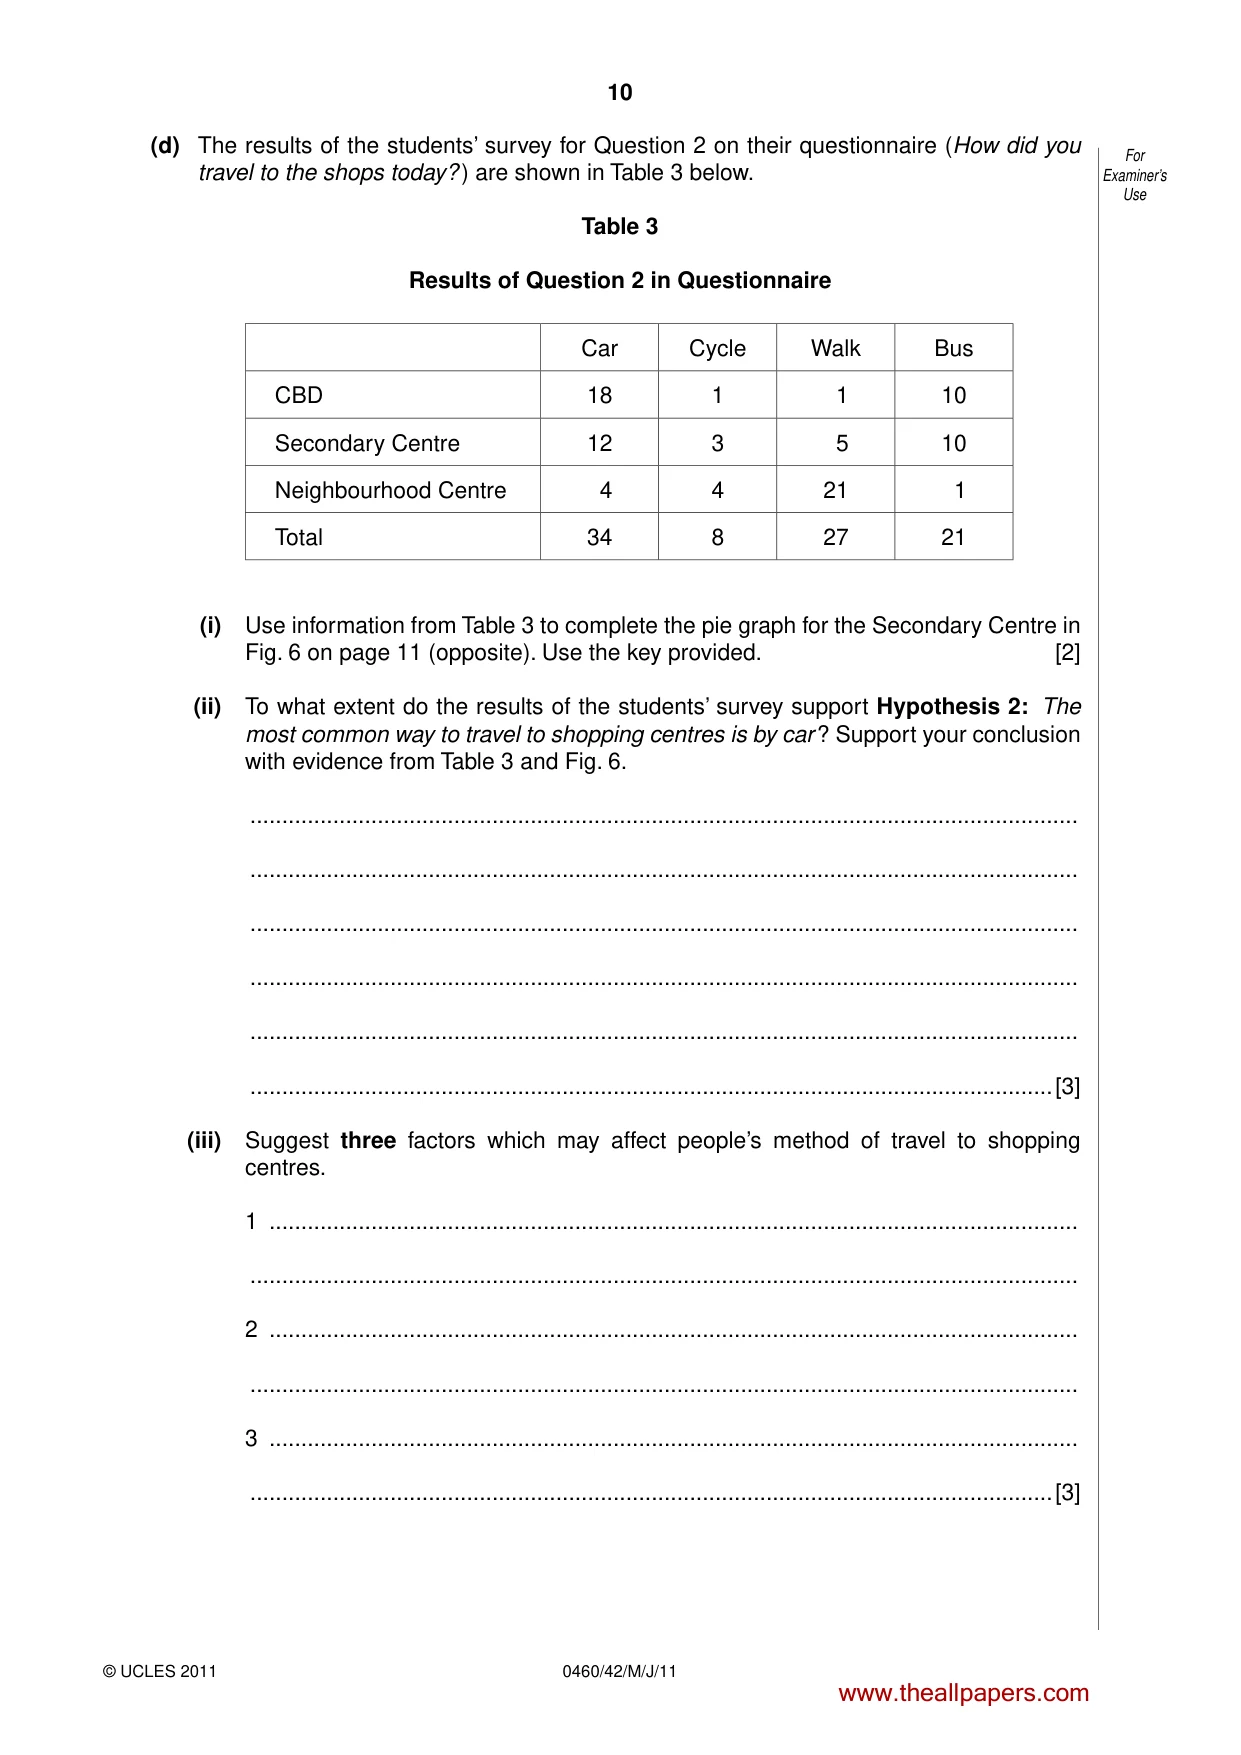
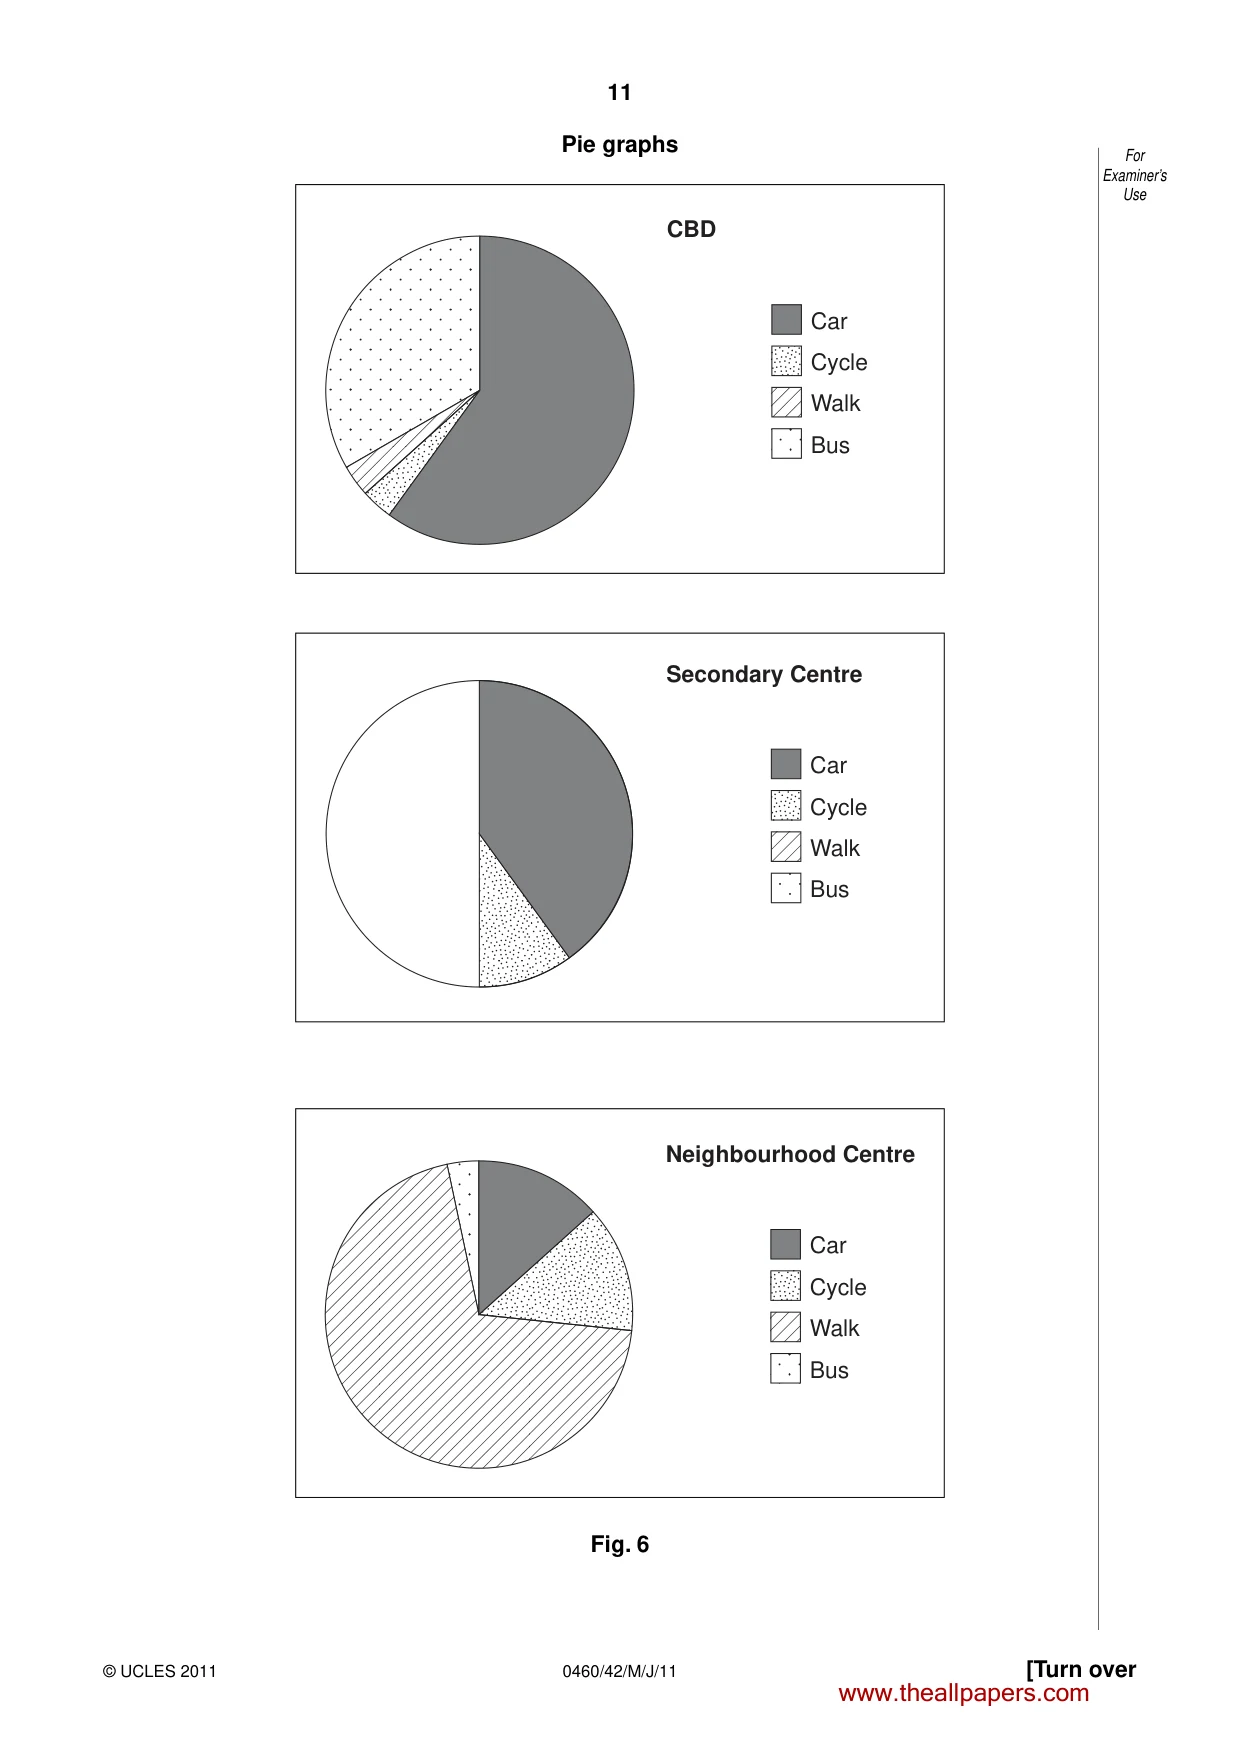
10 0460/42/M/J/11 © UCLES 2011 For Examiner’s Use (d) The results of the students’ survey for Question 2 on their questionnaire (How did you travel to the shops today? ) are shown in Table 3 below. Table 3 Results of Question 2 in Questionnaire Car Cycle Walk Bus CBD 18 1 1 10 Secondary Centre 12 3 5 10 Neighbourhood Centre 4 4 21 1 Total 34 8 27 21 (i) Use information from Table 3 to complete the pie graph for the Secondary Centre in Fig. 6 on page 11 (opposite). Use the key provided. [2] (ii) To what extent do the results of the students’ survey support Hypothesis 2: The most common way to travel to shopping centres is by car ? Support your conclusion with evidence from Table 3 and Fig. 6. … … … … … …[3] (iii) Suggest three factors which may affect people’s method of travel to shopping centres. 1 … … 2 … … 3 … …[3] www.theallpapers.com
Question paper, page 11
11 [Turn over © UCLES 2011 0460/42/M/J/11 For Examiner’s Use Pie graphs CBD Car Cycle Walk Bus Secondary Centre Car Cycle Walk Bus Neighbourhood Centre Car Cycle Walk Bus Fig. 6 www.theallpapers.com
Question paper, page 12
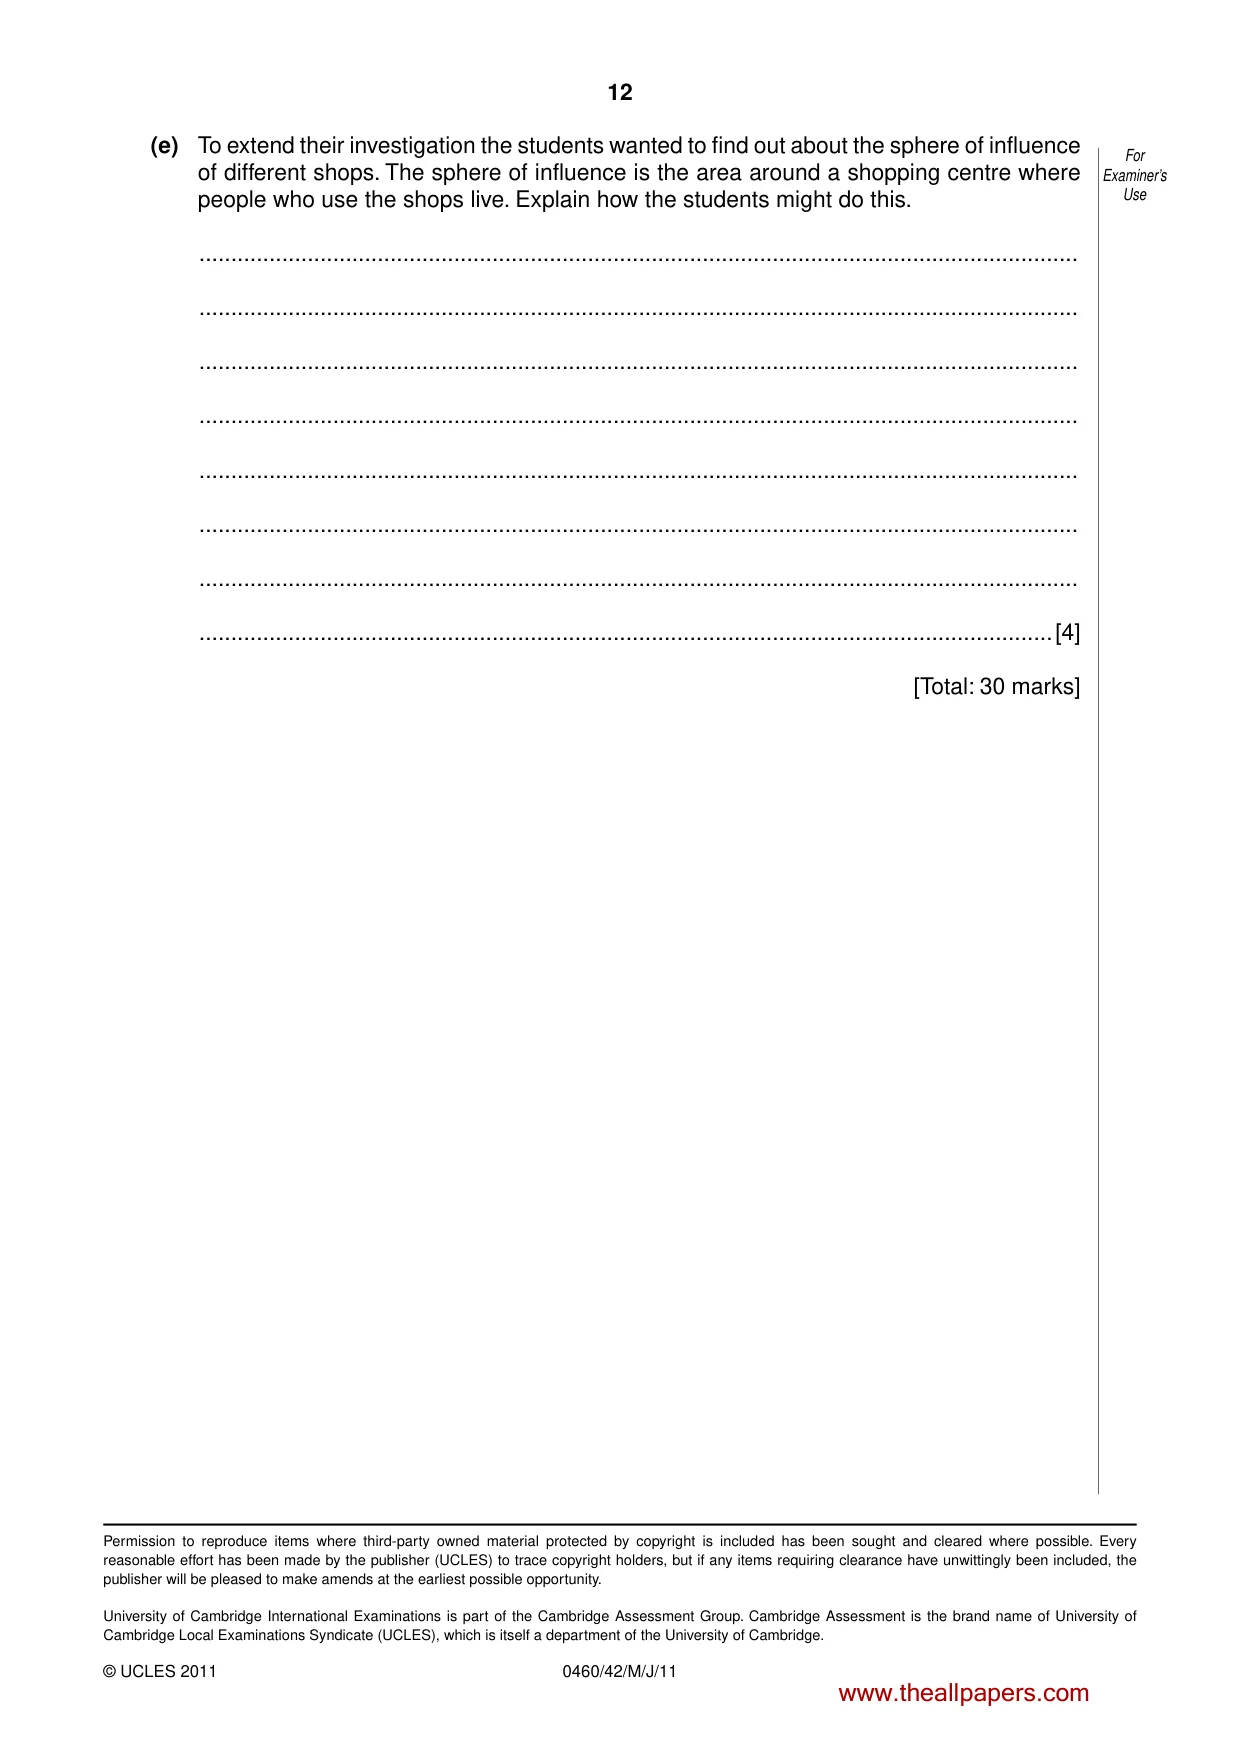
12 0460/42/M/J/11 © UCLES 2011 For Examiner’s Use (e) To extend their investigation the students wanted to find out about the sphere of influence of different shops. The sphere of influence is the area around a shopping centre where people who use the shops live. Explain how the students might do this. … … … … … … … …[4] [Total: 30 marks] Permission to reproduce items where third-party owned material protected by copyright is included has been sought and cleared where possible. Every reasonable effort has been made by the publisher (UCLES) to trace copyright holders, but if any items requiring clearance have unwittingly been included, the publisher will be pleased to make amends at the earliest possible opportunity. University of Cambridge International Examinations is part of the Cambridge Assessment Group. Cambridge Assessment is the brand name of University of Cambridge Local Examinations Syndicate (UCLES), which is itself a department of the University of Cambridge. www.theallpapers.com
Mark scheme, page 1
UNIVERSITY OF CAMBRIDGE INTERNATIONAL EXAMINATIONS International General Certificate of Secondary Education MARK SCHEME for the May/June 2011 question paper for the guidance of teachers 0460 GEOGRAPHY 0460/42 Paper 4 (Alternative to Coursework), maximum raw mark 60 This mark scheme is published as an aid to teachers and candidates, to indicate the requirements of the examination. It shows the basis on which Examiners were instructed to award marks. It does not indicate the details of the discussions that took place at an Examiners’ meeting before marking began, which would have considered the acceptability of alternative answers. Mark schemes must be read in conjunction with the question papers and the report on the examination. • Cambridge will not enter into discussions or correspondence in connection with these mark schemes. Cambridge is publishing the mark schemes for the May/June 2011 question papers for most IGCSE, GCE Advanced Level and Advanced Subsidiary Level syllabuses and some Ordinary Level syllabuses. www.theallpapers.com
Mark scheme, page 2
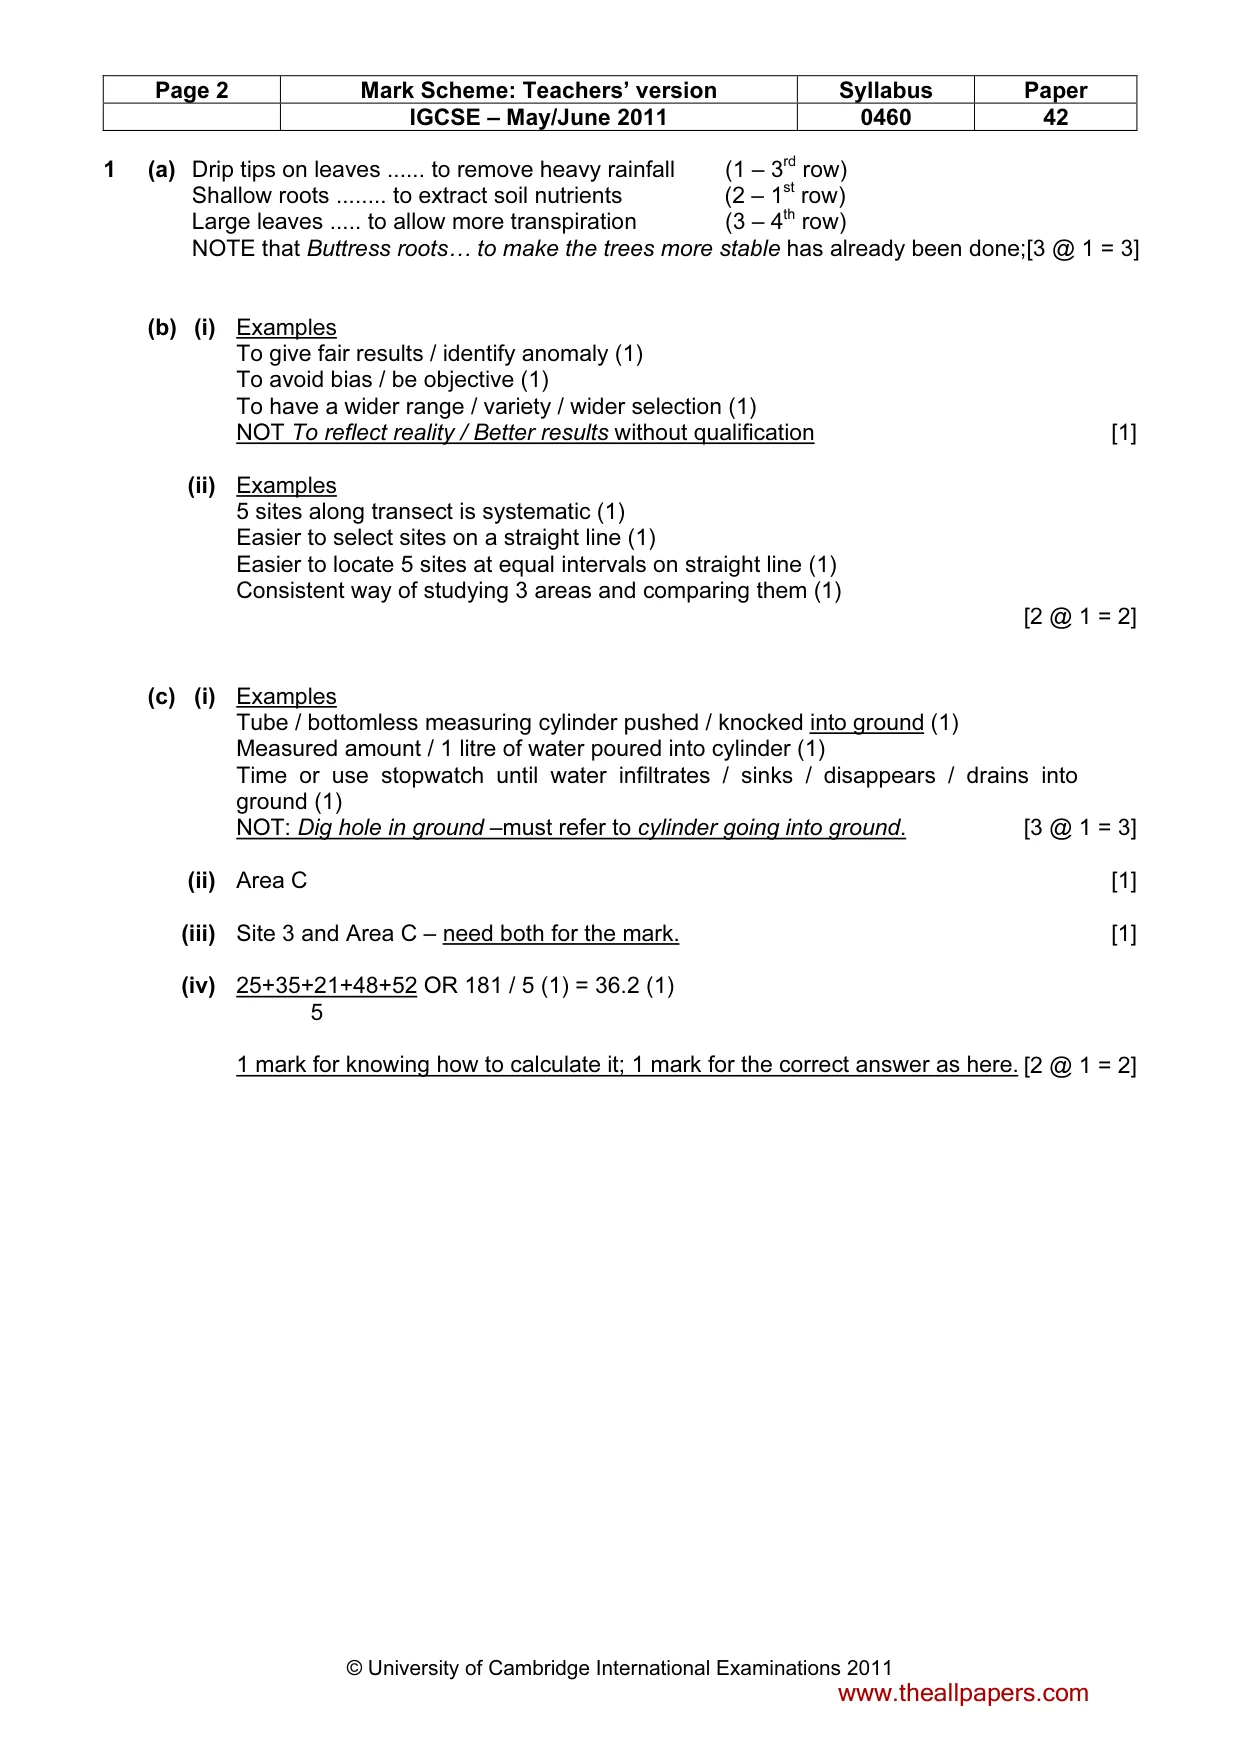
Page 2 Mark Scheme: Teachers’ version Syllabus Paper IGCSE – May/June 2011 0460 42 © University of Cambridge International Examinations 2011 1 (a) Drip tips on leaves … to remove heavy rainfall (1 – 3rd row) Shallow roots … to extract soil nutrients (2 – 1st row) Large leaves … to allow more transpiration (3 – 4th row) NOTE that Buttress roots… to make the trees more stable has already been done;[3 @ 1 = 3] (b) (i) Examples To give fair results / identify anomaly (1) To avoid bias / be objective (1) To have a wider range / variety / wider selection (1) NOT To reflect reality / Better results without qualification [1] (ii) Examples 5 sites along transect is systematic (1) Easier to select sites on a straight line (1) Easier to locate 5 sites at equal intervals on straight line (1) Consistent way of studying 3 areas and comparing them (1) [2 @ 1 = 2] (c) (i) Examples Tube / bottomless measuring cylinder pushed / knocked into ground (1) Measured amount / 1 litre of water poured into cylinder (1) Time or use stopwatch until water infiltrates / sinks / disappears / drains into ground (1) NOT: Dig hole in ground –must refer to cylinder going into ground. [3 @ 1 = 3] (ii) Area C [1] (iii) Site 3 and Area C – need both for the mark. [1] (iv) 25+35+21+48+52 OR 181 / 5 (1) = 36.2 (1) 5 1 mark for knowing how to calculate it; 1 mark for the correct answer as here. [2 @ 1 = 2] www.theallpapers.com
Mark scheme, page 3
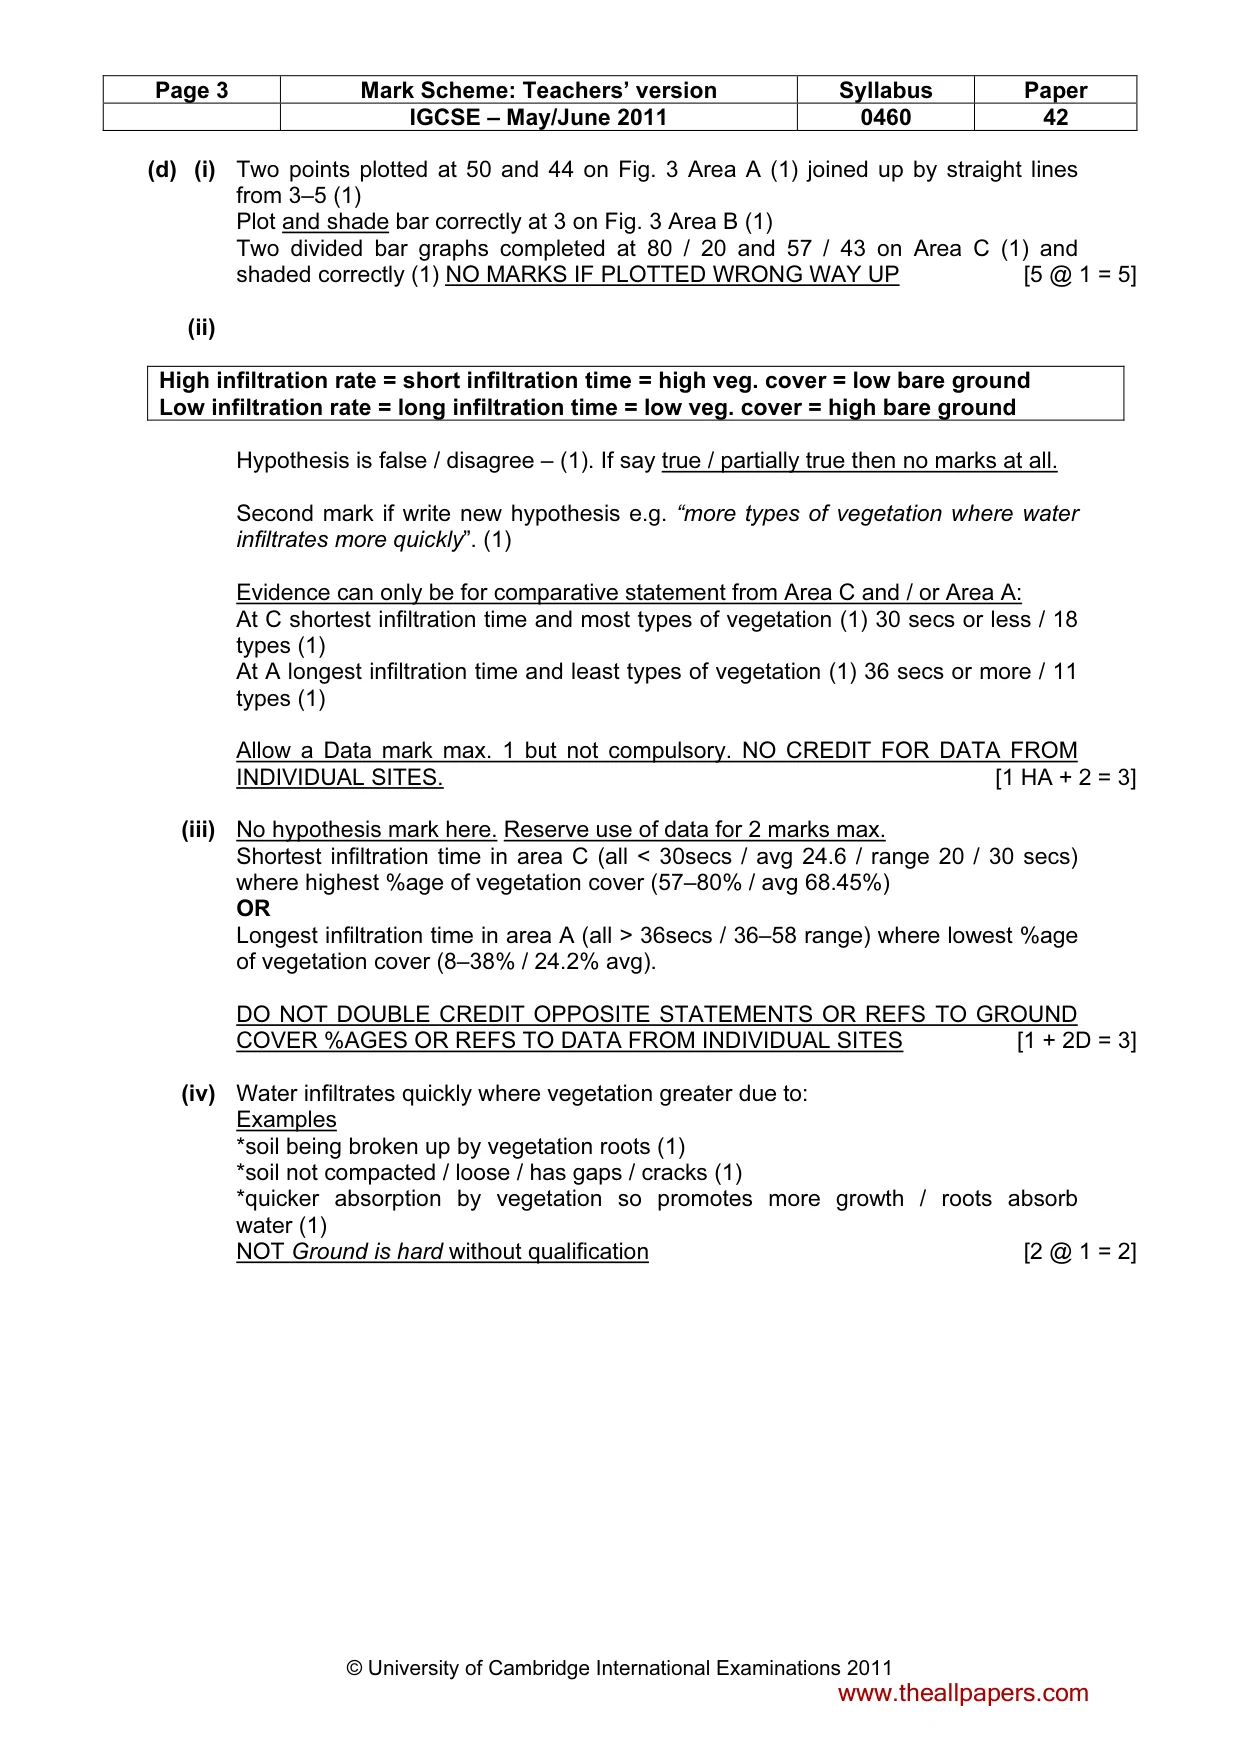
Page 3 Mark Scheme: Teachers’ version Syllabus Paper IGCSE – May/June 2011 0460 42 © University of Cambridge International Examinations 2011 (d) (i) Two points plotted at 50 and 44 on Fig. 3 Area A (1) joined up by straight lines from 3–5 (1) Plot and shade bar correctly at 3 on Fig. 3 Area B (1) Two divided bar graphs completed at 80 / 20 and 57 / 43 on Area C (1) and shaded correctly (1) NO MARKS IF PLOTTED WRONG WAY UP [5 @ 1 = 5] (ii) High infiltration rate = short infiltration time = high veg. cover = low bare ground Low infiltration rate = long infiltration time = low veg. cover = high bare ground Hypothesis is false / disagree – (1). If say true / partially true then no marks at all. Second mark if write new hypothesis e.g. “more types of vegetation where water infiltrates more quickly”. (1) Evidence can only be for comparative statement from Area C and / or Area A: At C shortest infiltration time and most types of vegetation (1) 30 secs or less / 18 types (1) At A longest infiltration time and least types of vegetation (1) 36 secs or more / 11 types (1) Allow a Data mark max. 1 but not compulsory. NO CREDIT FOR DATA FROM INDIVIDUAL SITES. [1 HA + 2 = 3] (iii) No hypothesis mark here. Reserve use of data for 2 marks max. Shortest infiltration time in area C (all < 30secs / avg 24.6 / range 20 / 30 secs) where highest %age of vegetation cover (57–80% / avg 68.45%) OR Longest infiltration time in area A (all > 36secs / 36–58 range) where lowest %age of vegetation cover (8–38% / 24.2% avg). DO NOT DOUBLE CREDIT OPPOSITE STATEMENTS OR REFS TO GROUND COVER %AGES OR REFS TO DATA FROM INDIVIDUAL SITES [1 + 2D = 3] (iv) Water infiltrates quickly where vegetation greater due to: Examples *soil being broken up by vegetation roots (1) *soil not compacted / loose / has gaps / cracks (1) *quicker absorption by vegetation so promotes more growth / roots absorb water (1) NOT Ground is hard without qualification [2 @ 1 = 2] www.theallpapers.com
Mark scheme, page 4
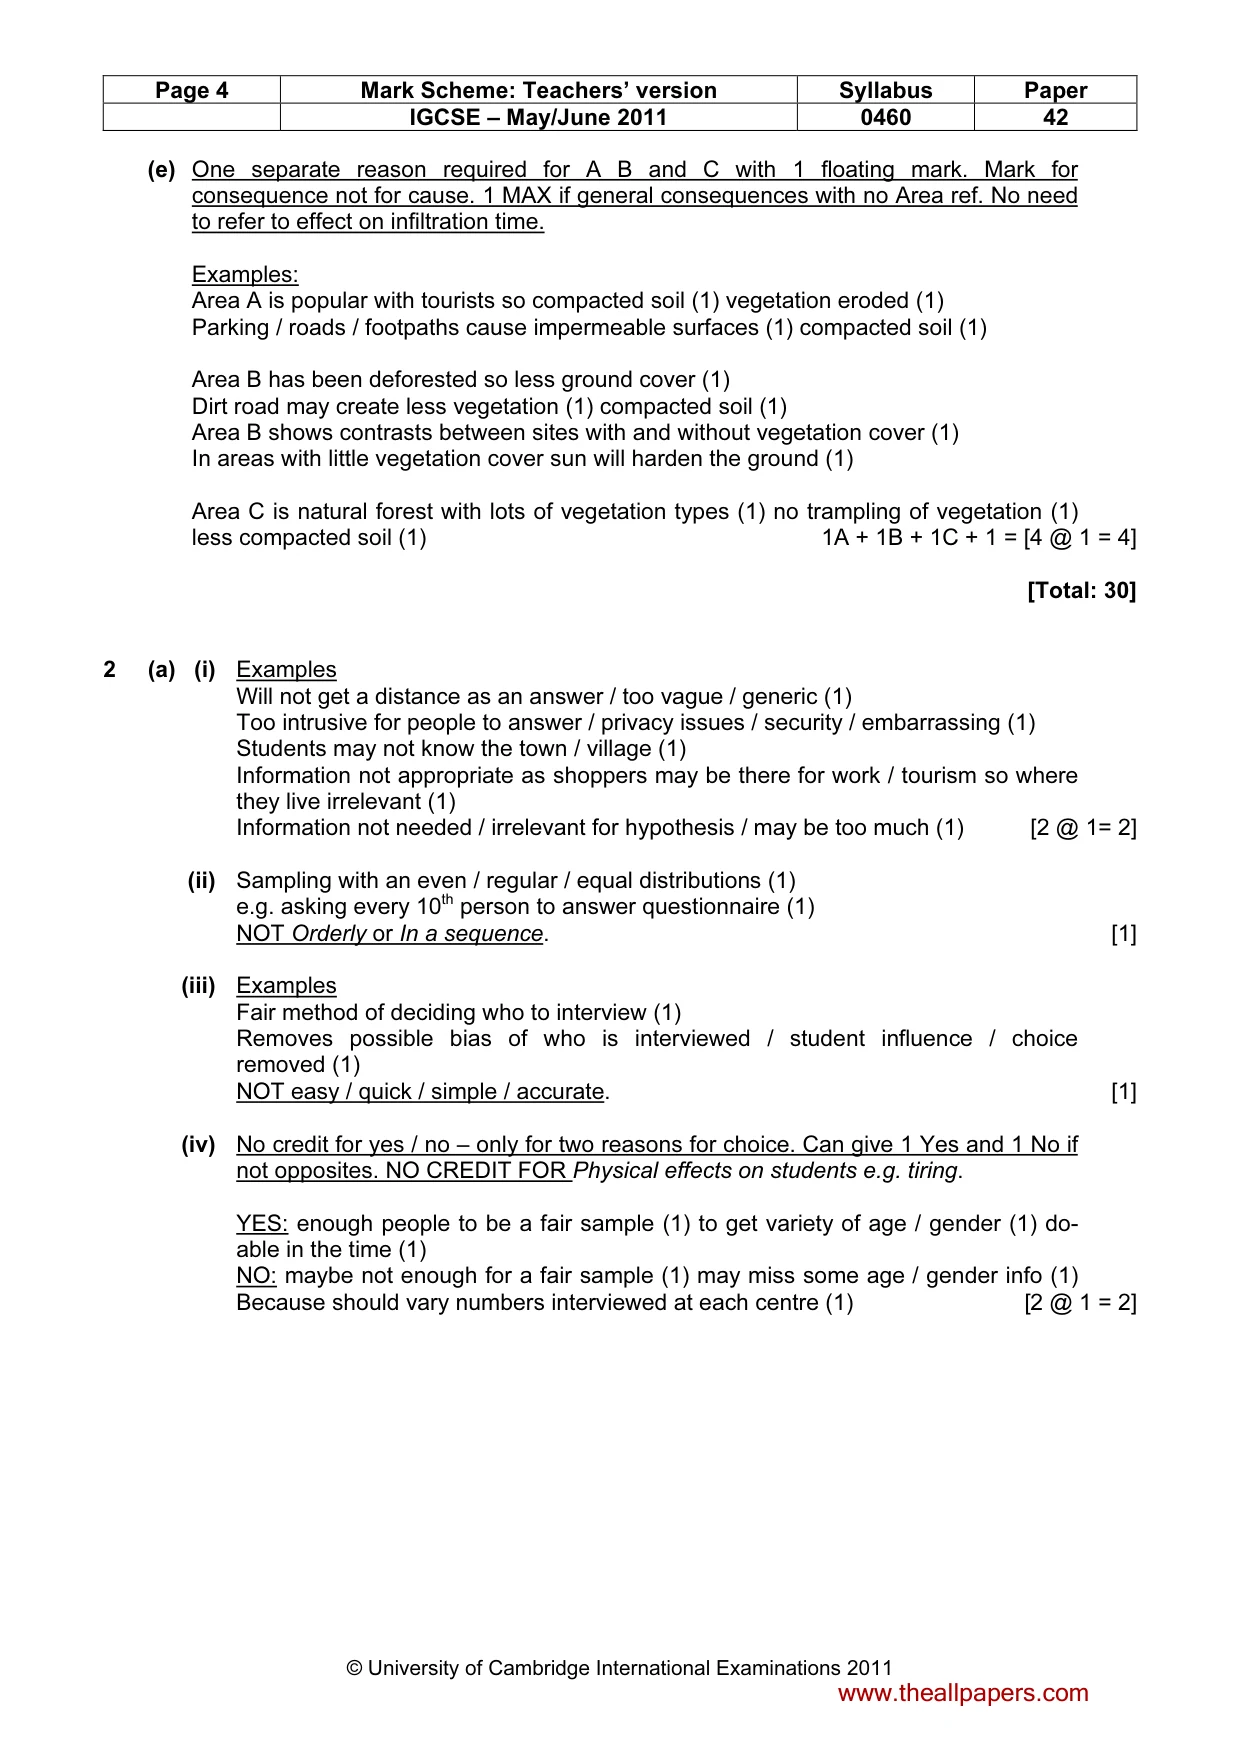
Page 4 Mark Scheme: Teachers’ version Syllabus Paper IGCSE – May/June 2011 0460 42 © University of Cambridge International Examinations 2011 (e) One separate reason required for A B and C with 1 floating mark. Mark for consequence not for cause. 1 MAX if general consequences with no Area ref. No need to refer to effect on infiltration time. Examples: Area A is popular with tourists so compacted soil (1) vegetation eroded (1) Parking / roads / footpaths cause impermeable surfaces (1) compacted soil (1) Area B has been deforested so less ground cover (1) Dirt road may create less vegetation (1) compacted soil (1) Area B shows contrasts between sites with and without vegetation cover (1) In areas with little vegetation cover sun will harden the ground (1) Area C is natural forest with lots of vegetation types (1) no trampling of vegetation (1) less compacted soil (1) 1A + 1B + 1C + 1 = [4 @ 1 = 4] [Total: 30] 2 (a) (i) Examples Will not get a distance as an answer / too vague / generic (1) Too intrusive for people to answer / privacy issues / security / embarrassing (1) Students may not know the town / village (1) Information not appropriate as shoppers may be there for work / tourism so where they live irrelevant (1) Information not needed / irrelevant for hypothesis / may be too much (1) [2 @ 1= 2] (ii) Sampling with an even / regular / equal distributions (1) e.g. asking every 10th person to answer questionnaire (1) NOT Orderly or In a sequence. [1] (iii) Examples Fair method of deciding who to interview (1) Removes possible bias of who is interviewed / student influence / choice removed (1) NOT easy / quick / simple / accurate. [1] (iv) No credit for yes / no – only for two reasons for choice. Can give 1 Yes and 1 No if not opposites. NO CREDIT FOR Physical effects on students e.g. tiring. YES: enough people to be a fair sample (1) to get variety of age / gender (1) do- able in the time (1) NO: maybe not enough for a fair sample (1) may miss some age / gender info (1) Because should vary numbers interviewed at each centre (1) [2 @ 1 = 2] www.theallpapers.com
Mark scheme, page 5
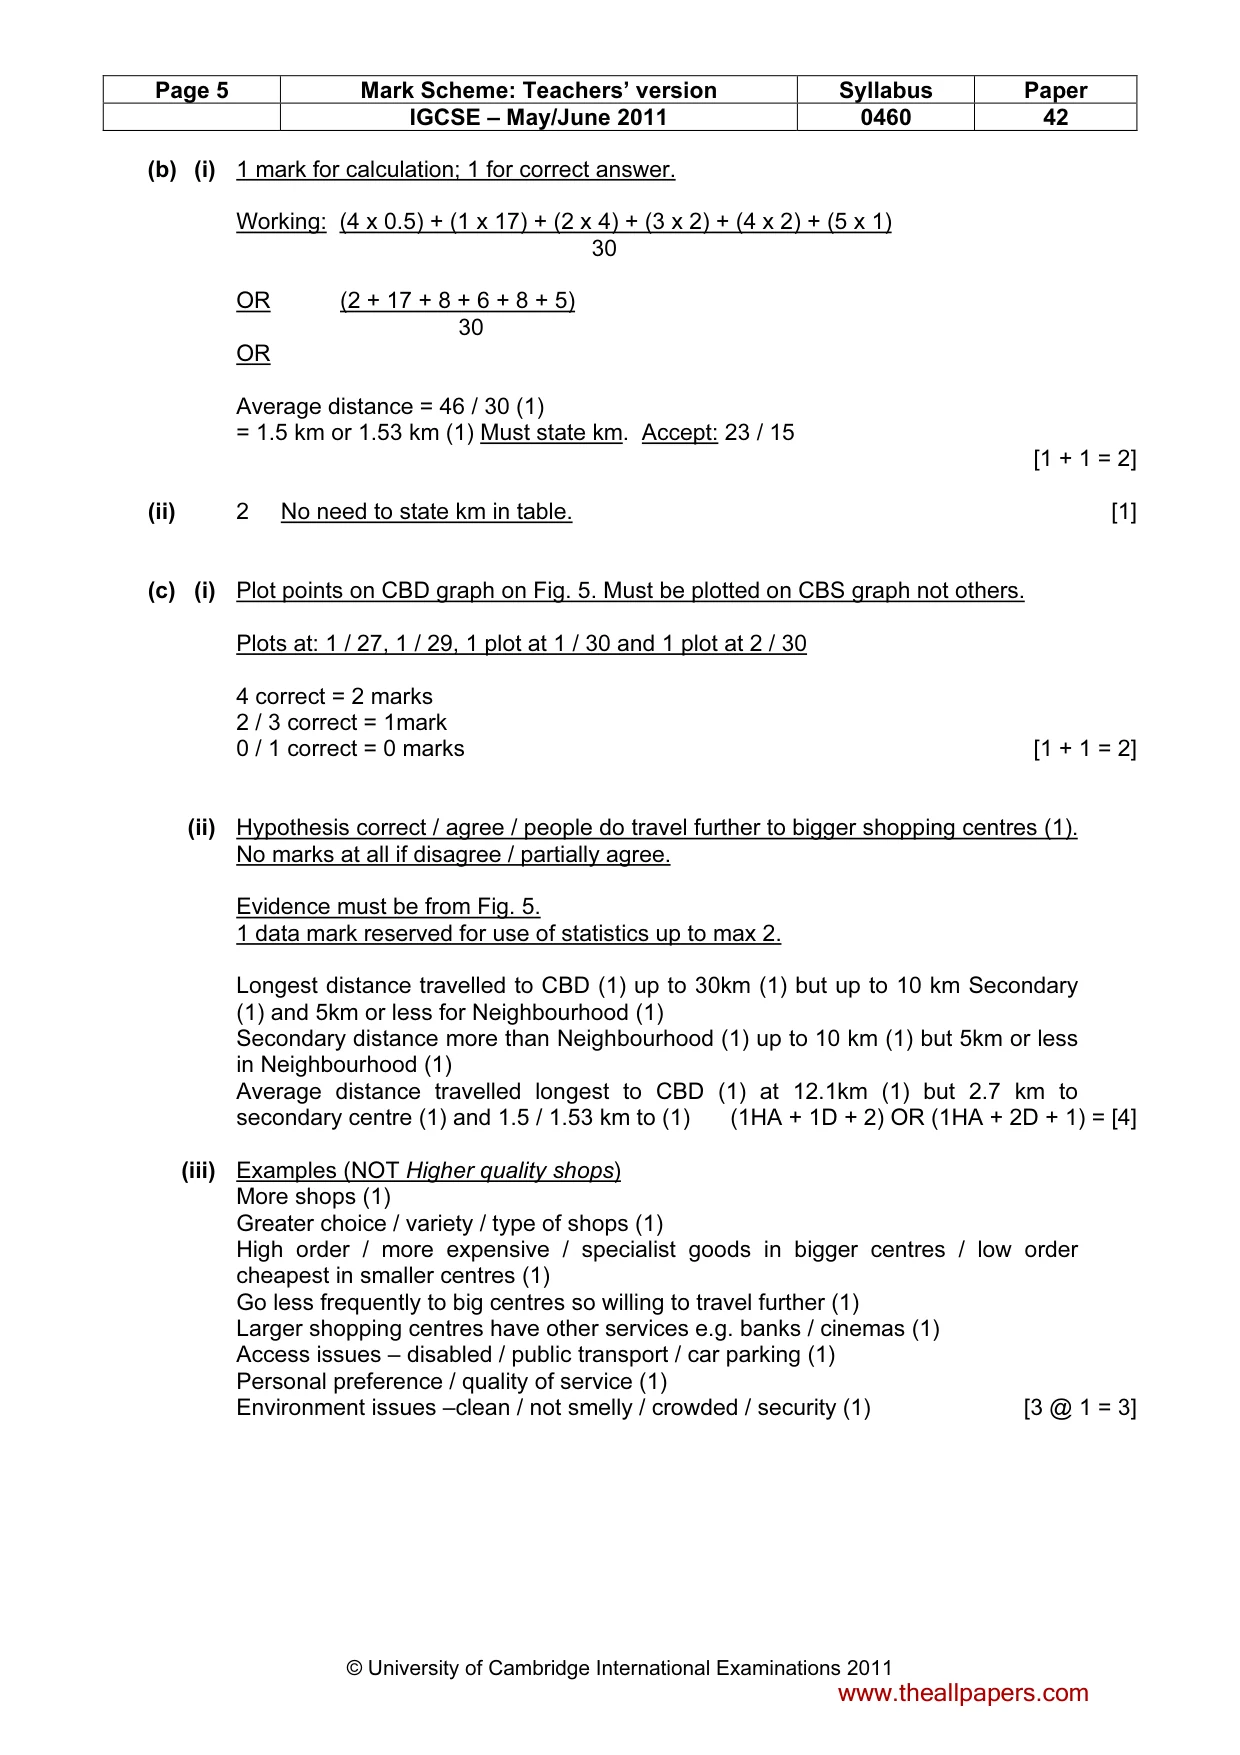
Page 5 Mark Scheme: Teachers’ version Syllabus Paper IGCSE – May/June 2011 0460 42 © University of Cambridge International Examinations 2011 (b) (i) 1 mark for calculation; 1 for correct answer. Working: (4 x 0.5) + (1 x 17) + (2 x 4) + (3 x 2) + (4 x 2) + (5 x 1) 30 OR (2 + 17 + 8 + 6 + 8 + 5) 30 OR Average distance = 46 / 30 (1) = 1.5 km or 1.53 km (1) Must state km. Accept: 23 / 15 [1 + 1 = 2] (ii) 2 No need to state km in table. [1] (c) (i) Plot points on CBD graph on Fig. 5. Must be plotted on CBS graph not others. Plots at: 1 / 27, 1 / 29, 1 plot at 1 / 30 and 1 plot at 2 / 30 4 correct = 2 marks 2 / 3 correct = 1mark 0 / 1 correct = 0 marks [1 + 1 = 2] (ii) Hypothesis correct / agree / people do travel further to bigger shopping centres (1). No marks at all if disagree / partially agree. Evidence must be from Fig. 5. 1 data mark reserved for use of statistics up to max 2. Longest distance travelled to CBD (1) up to 30km (1) but up to 10 km Secondary (1) and 5km or less for Neighbourhood (1) Secondary distance more than Neighbourhood (1) up to 10 km (1) but 5km or less in Neighbourhood (1) Average distance travelled longest to CBD (1) at 12.1km (1) but 2.7 km to secondary centre (1) and 1.5 / 1.53 km to (1) (1HA + 1D + 2) OR (1HA + 2D + 1) = [4] (iii) Examples (NOT Higher quality shops) More shops (1) Greater choice / variety / type of shops (1) High order / more expensive / specialist goods in bigger centres / low order cheapest in smaller centres (1) Go less frequently to big centres so willing to travel further (1) Larger shopping centres have other services e.g. banks / cinemas (1) Access issues – disabled / public transport / car parking (1) Personal preference / quality of service (1) Environment issues –clean / not smelly / crowded / security (1) [3 @ 1 = 3] www.theallpapers.com
Mark scheme, page 6
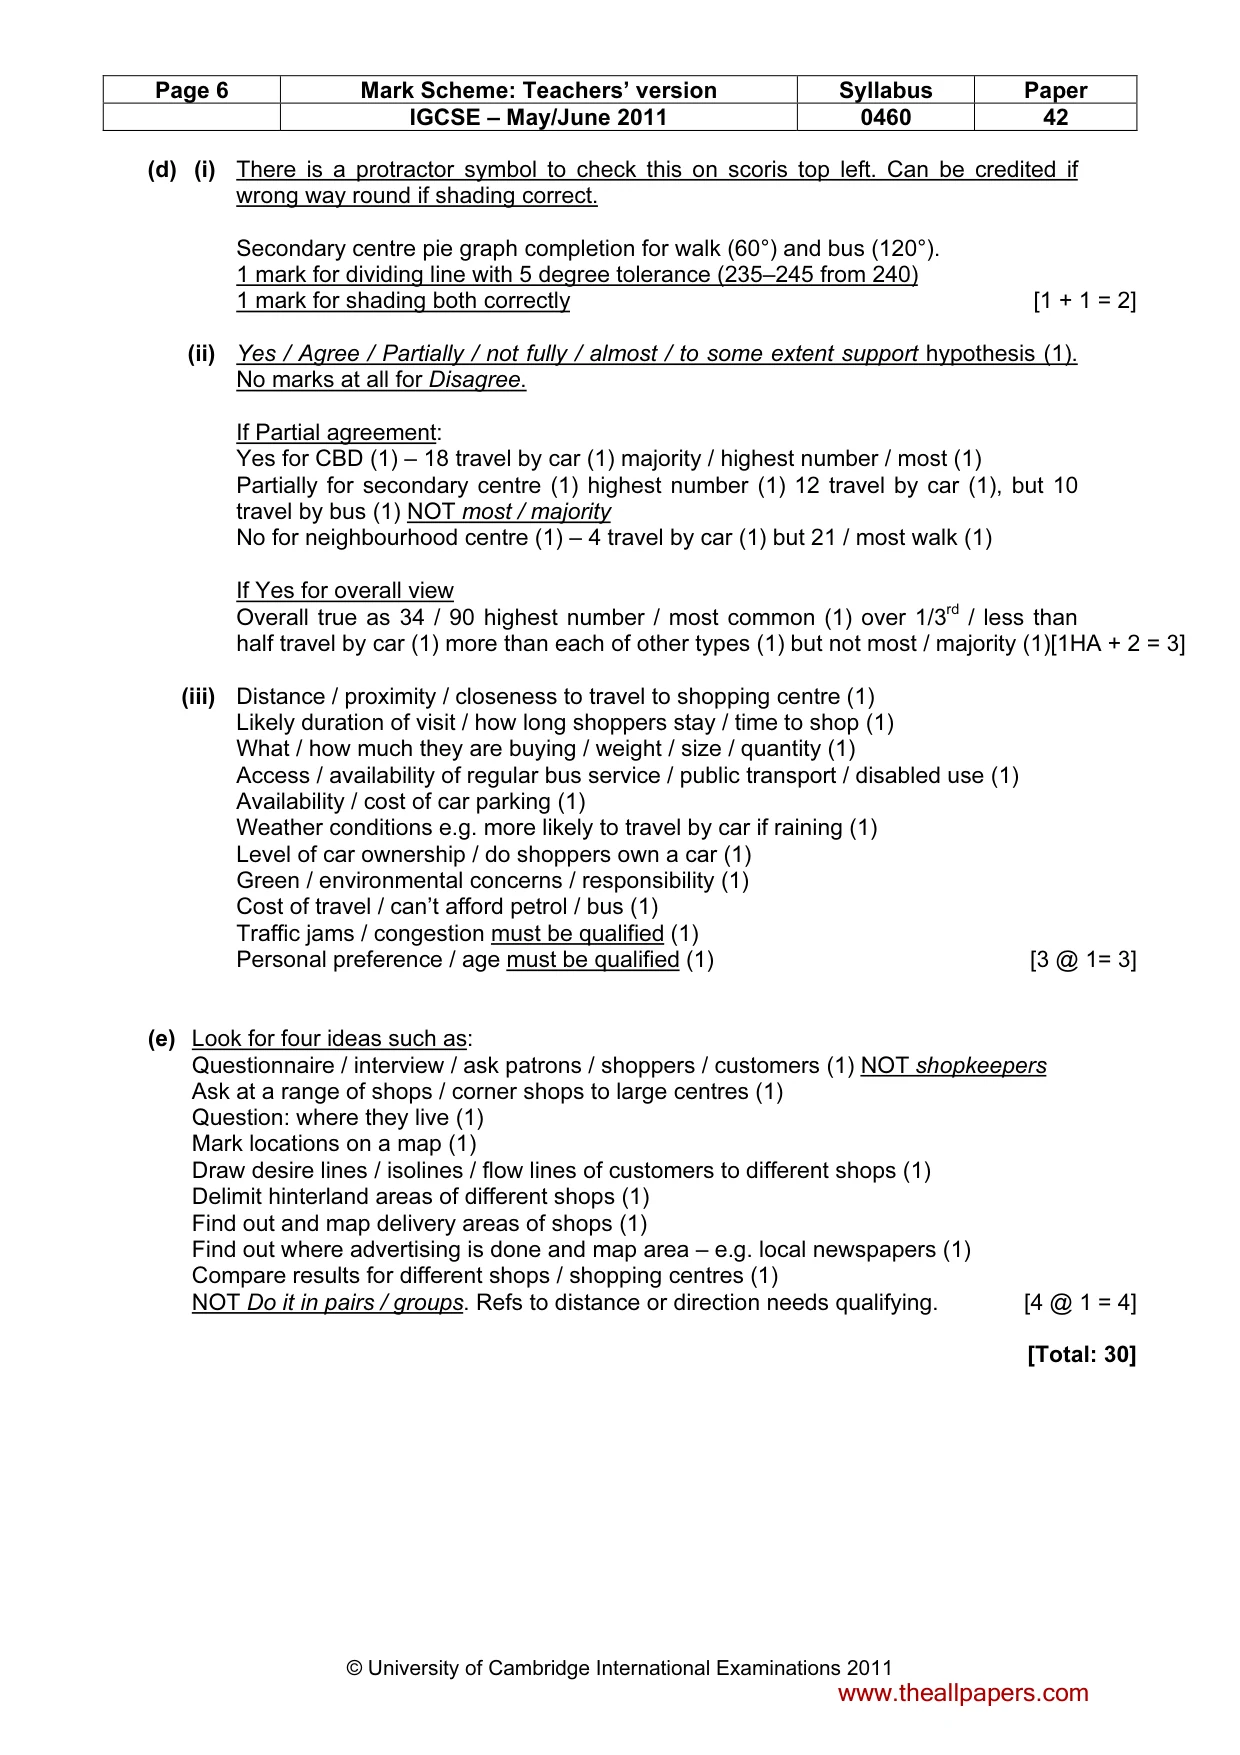
Page 6 Mark Scheme: Teachers’ version Syllabus Paper IGCSE – May/June 2011 0460 42 © University of Cambridge International Examinations 2011 (d) (i) There is a protractor symbol to check this on scoris top left. Can be credited if wrong way round if shading correct. Secondary centre pie graph completion for walk (60°) and bus (120°). 1 mark for dividing line with 5 degree tolerance (235–245 from 240) 1 mark for shading both correctly [1 + 1 = 2] (ii) Yes / Agree / Partially / not fully / almost / to some extent support hypothesis (1). No marks at all for Disagree. If Partial agreement: Yes for CBD (1) – 18 travel by car (1) majority / highest number / most (1) Partially for secondary centre (1) highest number (1) 12 travel by car (1), but 10 travel by bus (1) NOT most / majority No for neighbourhood centre (1) – 4 travel by car (1) but 21 / most walk (1) If Yes for overall view Overall true as 34 / 90 highest number / most common (1) over 1/3rd / less than half travel by car (1) more than each of other types (1) but not most / majority (1)[1HA + 2 = 3] (iii) Distance / proximity / closeness to travel to shopping centre (1) Likely duration of visit / how long shoppers stay / time to shop (1) What / how much they are buying / weight / size / quantity (1) Access / availability of regular bus service / public transport / disabled use (1) Availability / cost of car parking (1) Weather conditions e.g. more likely to travel by car if raining (1) Level of car ownership / do shoppers own a car (1) Green / environmental concerns / responsibility (1) Cost of travel / can’t afford petrol / bus (1) Traffic jams / congestion must be qualified (1) Personal preference / age must be qualified (1) [3 @ 1= 3] (e) Look for four ideas such as: Questionnaire / interview / ask patrons / shoppers / customers (1) NOT shopkeepers Ask at a range of shops / corner shops to large centres (1) Question: where they live (1) Mark locations on a map (1) Draw desire lines / isolines / flow lines of customers to different shops (1) Delimit hinterland areas of different shops (1) Find out and map delivery areas of shops (1) Find out where advertising is done and map area – e.g. local newspapers (1) Compare results for different shops / shopping centres (1) NOT Do it in pairs / groups. Refs to distance or direction needs qualifying. [4 @ 1 = 4] [Total: 30] www.theallpapers.com
What you needed in this session
Cambridge’s own grade thresholds for 2011 May/June, Paper 4 · Variant 2. A higher threshold means an easier paper — the bar moves with how the cohort did.