Cambridge IGCSE Geography 0460 — 2010 May/June Paper 4 · Variant 3
0460/43/M/J/10 · 60 marks · ≈68 min
The question paper and its mark scheme, free to read here and free to download. This is Cambridge’s own paper, exactly as it was sat.
Question paper16 pages


Mark scheme5 pages
Answers below. Sit the paper first if you are practising.
Paper as text
Question paper, page 1
This document consists of 14 printed pages, 2 blank pages and 1 Insert. DC (LEO/CGW) 23543/6 © UCLES 2010 [Turn over UNIVERSITY OF CAMBRIDGE INTERNATIONAL EXAMINATIONS International General Certificate of Secondary Education READ THESE INSTRUCTIONS FIRST Write your Centre number, candidate number and name in the spaces provided. Write in dark blue or black pen. You may use a soft pencil for any diagrams, graphs or rough working. Do not use staples, paper clips, highlighters, glue or correction fluid. DO NOT WRITE IN ANY BARCODES. Answer all questions. The Insert contains Figs 1 and 2 for Question 1 and Fig. 6 and Photograph A for Question 2. The Insert is not required by the Examiner. Sketch maps and diagrams should be drawn whenever they serve to illustrate an answer. At the end of the examination, fasten all your work securely together. The number of marks is given in brackets [ ] at the end of each question or part question. * 2 4 9 3 9 5 8 0 9 9 * GEOGRAPHY 0460/43 Paper 4 Alternative to Coursework May/June 2010 1 hour 30 minutes Candidates answer on the Question Paper. Additional Materials: Calculator Ruler For Examiner’s Use Q1 Q2 Total www.theallpapers.com
Question paper, page 2
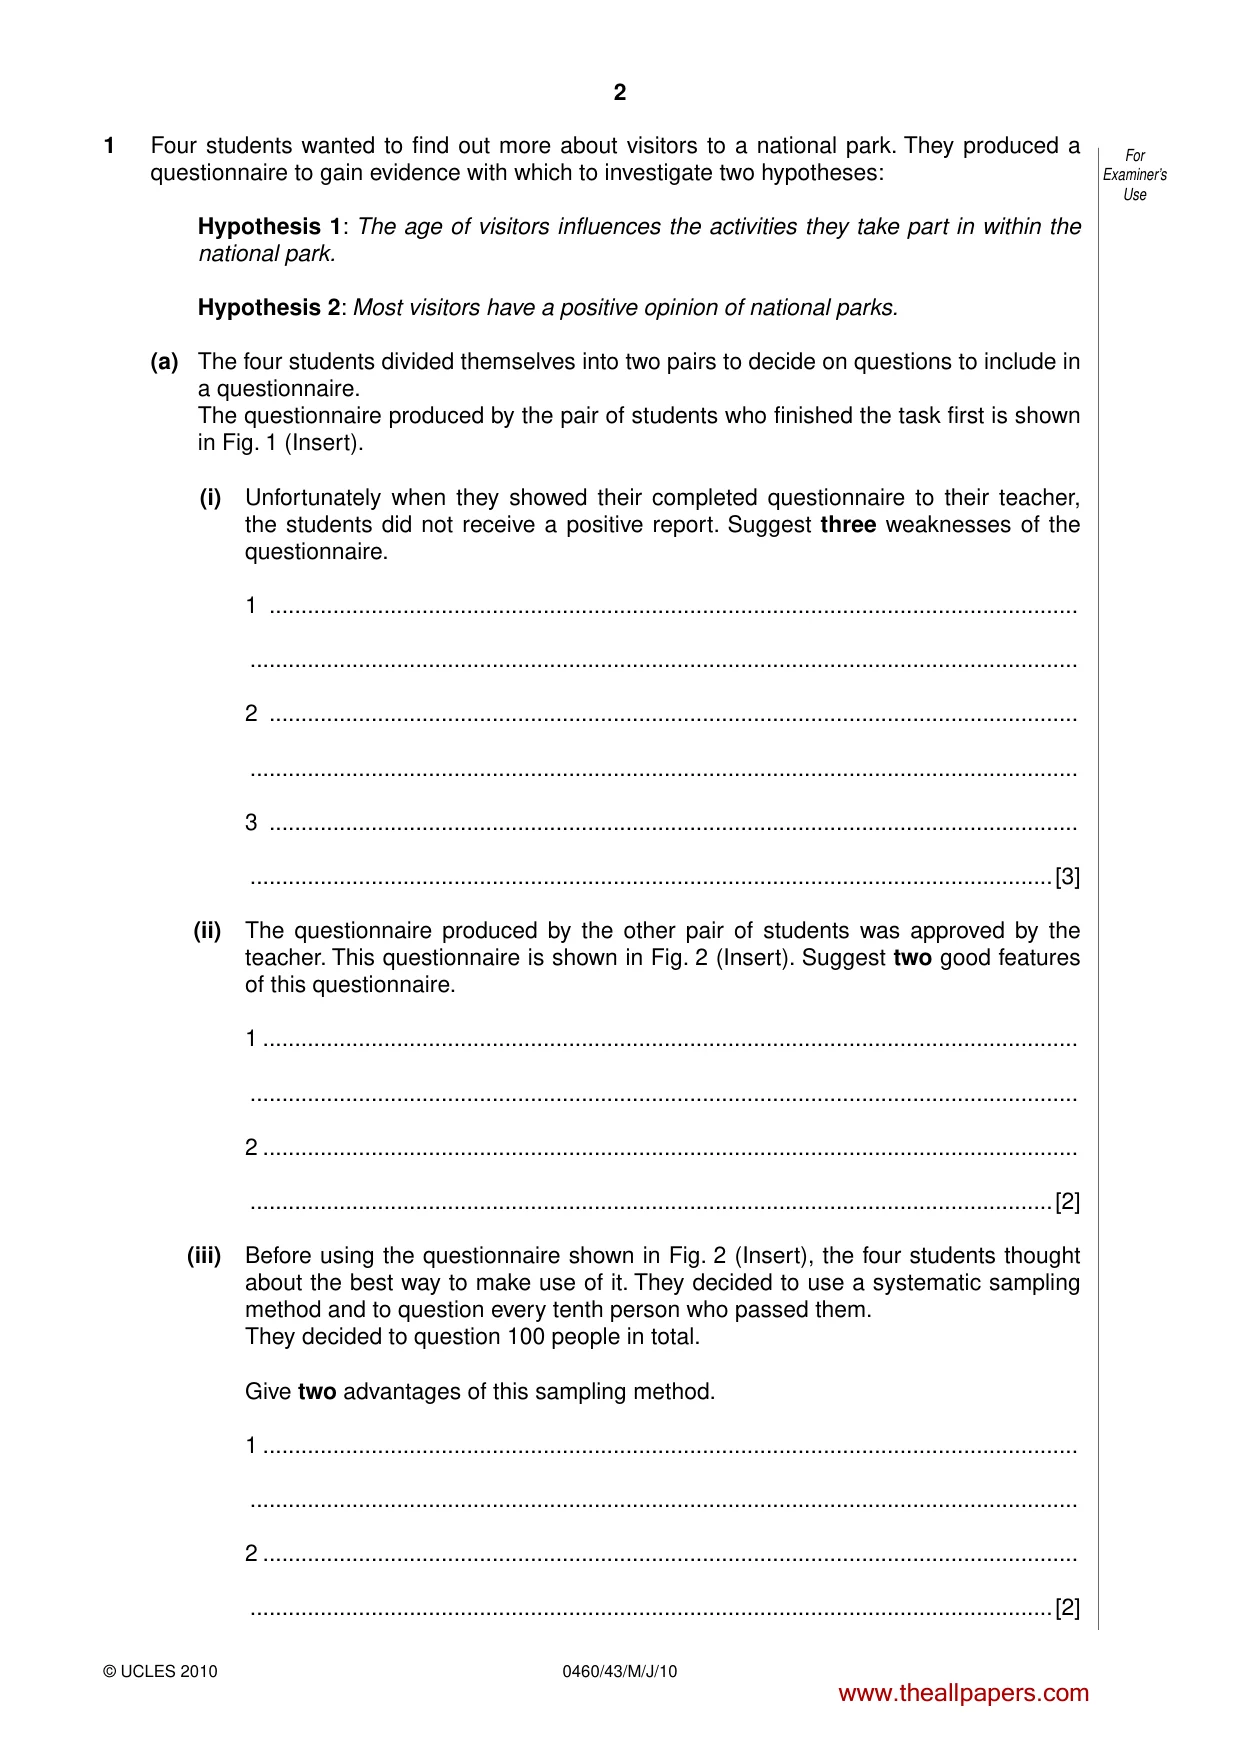
2 0460/43/M/J/10 For Examiner’s Use © UCLES 2010 1 Four students wanted to find out more about visitors to a national park. They produced a questionnaire to gain evidence with which to investigate two hypotheses: Hypothesis 1: The age of visitors influences the activities they take part in within the national park. Hypothesis 2: Most visitors have a positive opinion of national parks. (a) The four students divided themselves into two pairs to decide on questions to include in a questionnaire. The questionnaire produced by the pair of students who finished the task first is shown in Fig. 1 (Insert). (i) Unfortunately when they showed their completed questionnaire to their teacher, the students did not receive a positive report. Suggest three weaknesses of the questionnaire. 1 … … 2 … … 3 … …[3] (ii) The questionnaire produced by the other pair of students was approved by the teacher. This questionnaire is shown in Fig. 2 (Insert). Suggest two good features of this questionnaire. 1 … … 2 … …[2] (iii) Before using the questionnaire shown in Fig. 2 (Insert), the four students thought about the best way to make use of it. They decided to use a systematic sampling method and to question every tenth person who passed them. They decided to question 100 people in total. Give two advantages of this sampling method. 1 … … 2 … …[2] www.theallpapers.com
Question paper, page 3
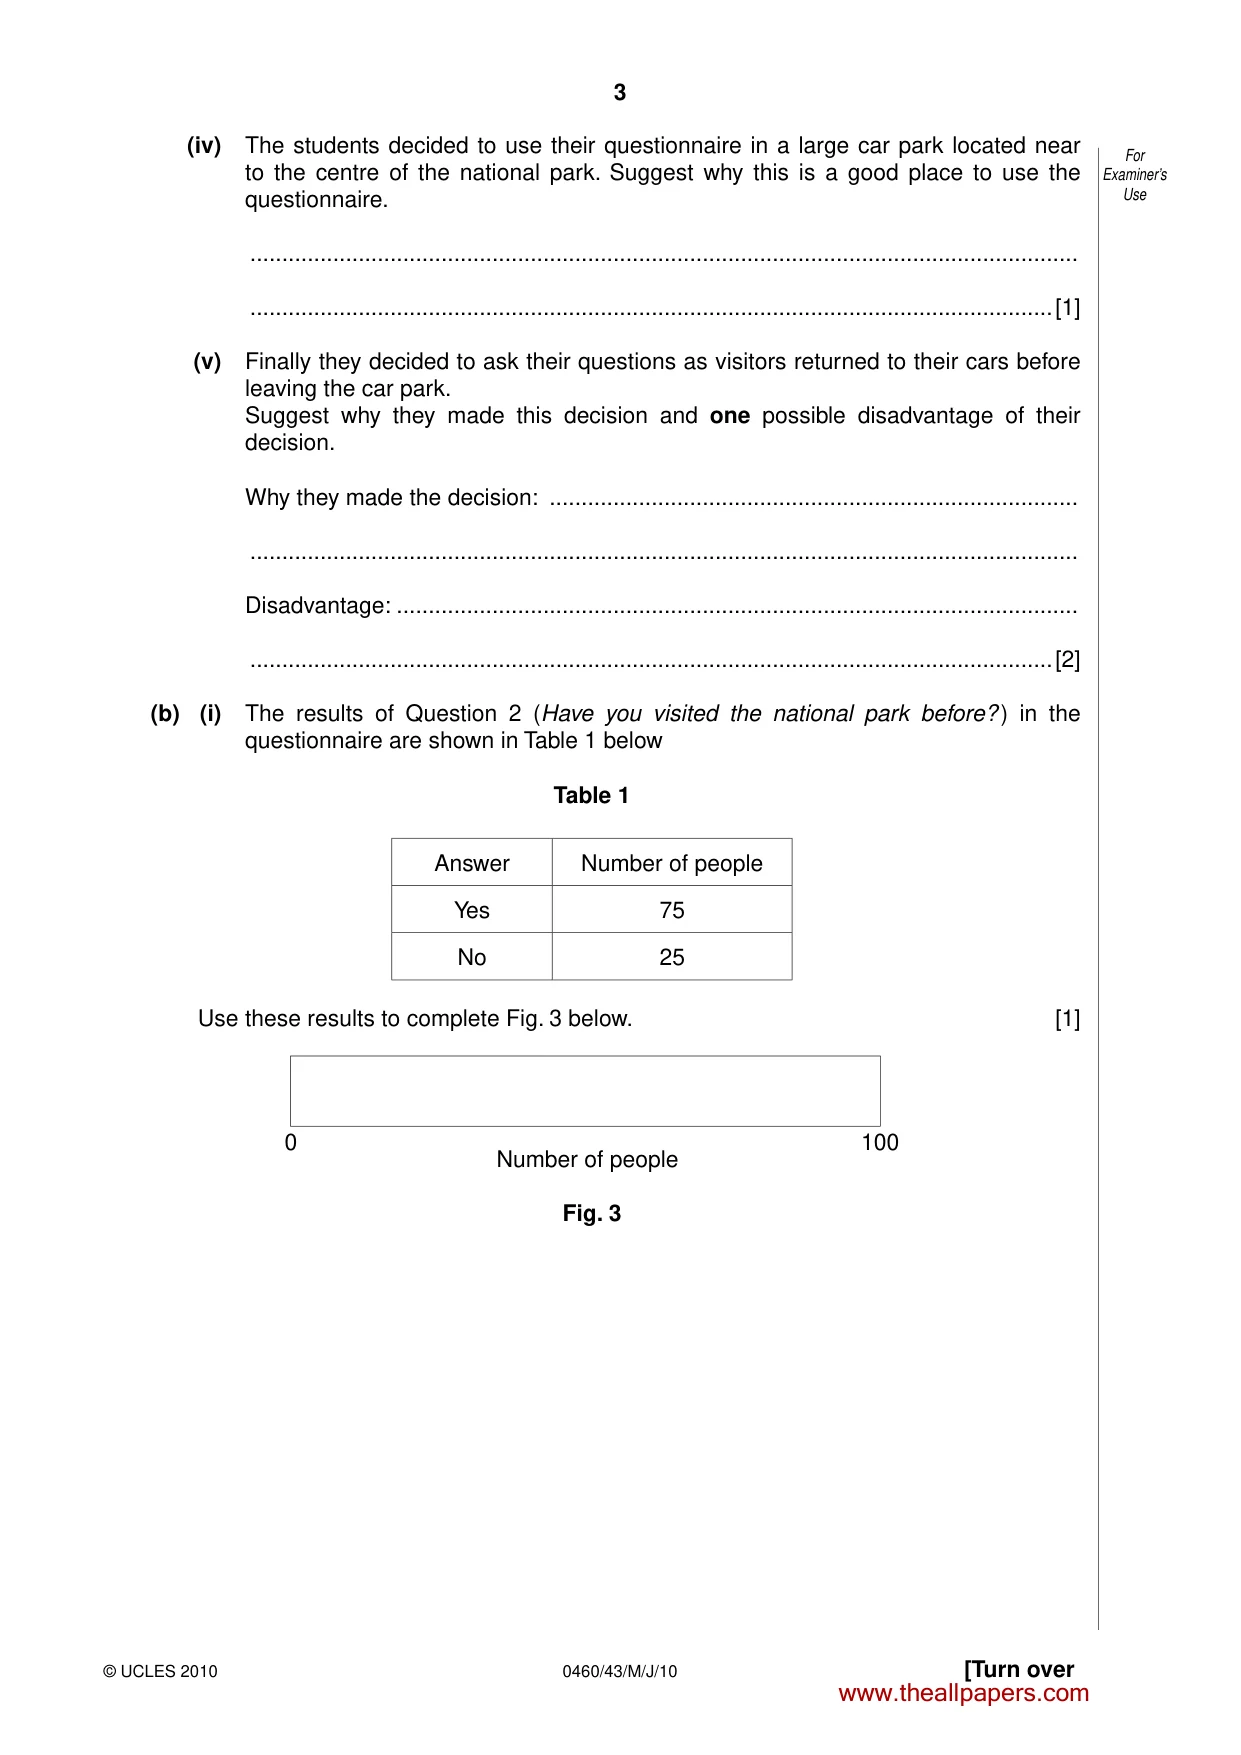
3 0460/43/M/J/10 [Turn over For Examiner’s Use © UCLES 2010 (iv) The students decided to use their questionnaire in a large car park located near to the centre of the national park. Suggest why this is a good place to use the questionnaire. … …[1] (v) Finally they decided to ask their questions as visitors returned to their cars before leaving the car park. Suggest why they made this decision and one possible disadvantage of their decision. Why they made the decision: … … Disadvantage: … …[2] (b) (i) The results of Question 2 (Have you visited the national park before? ) in the questionnaire are shown in Table 1 below Table 1 Answer Number of people Yes 75 No 25 Use these results to complete Fig. 3 below. [1] 0 100 Number of people Fig. 3 www.theallpapers.com
Question paper, page 4
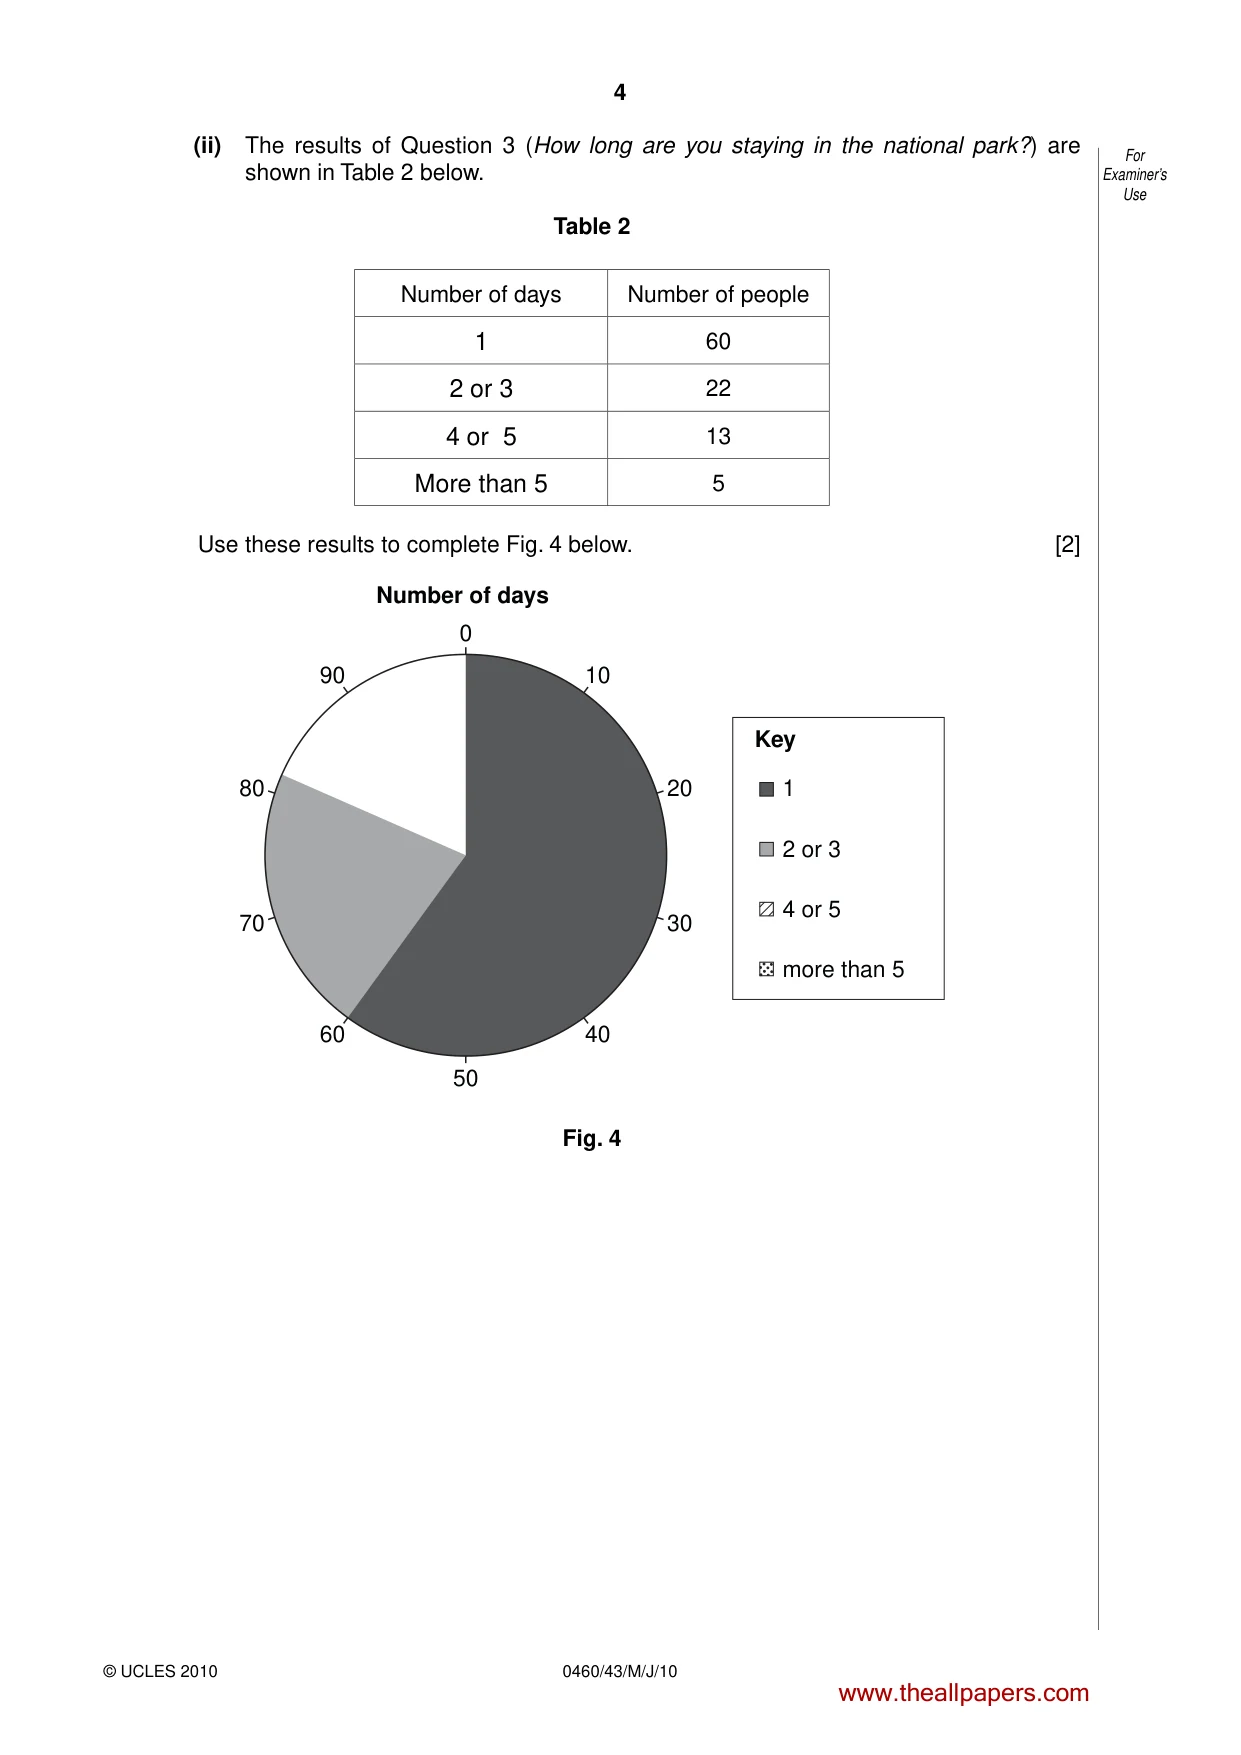
4 0460/43/M/J/10 For Examiner’s Use © UCLES 2010 (ii) The results of Question 3 (How long are you staying in the national park?) are shown in Table 2 below. Table 2 Number of days Number of people 1 60 2 or 3 22 4 or 5 13 More than 5 5 Use these results to complete Fig. 4 below. [2] 0 50 40 30 Number of days Key 20 70 80 10 1 2 or 3 4 or 5 more than 5 60 90 Fig. 4 www.theallpapers.com
Question paper, page 5
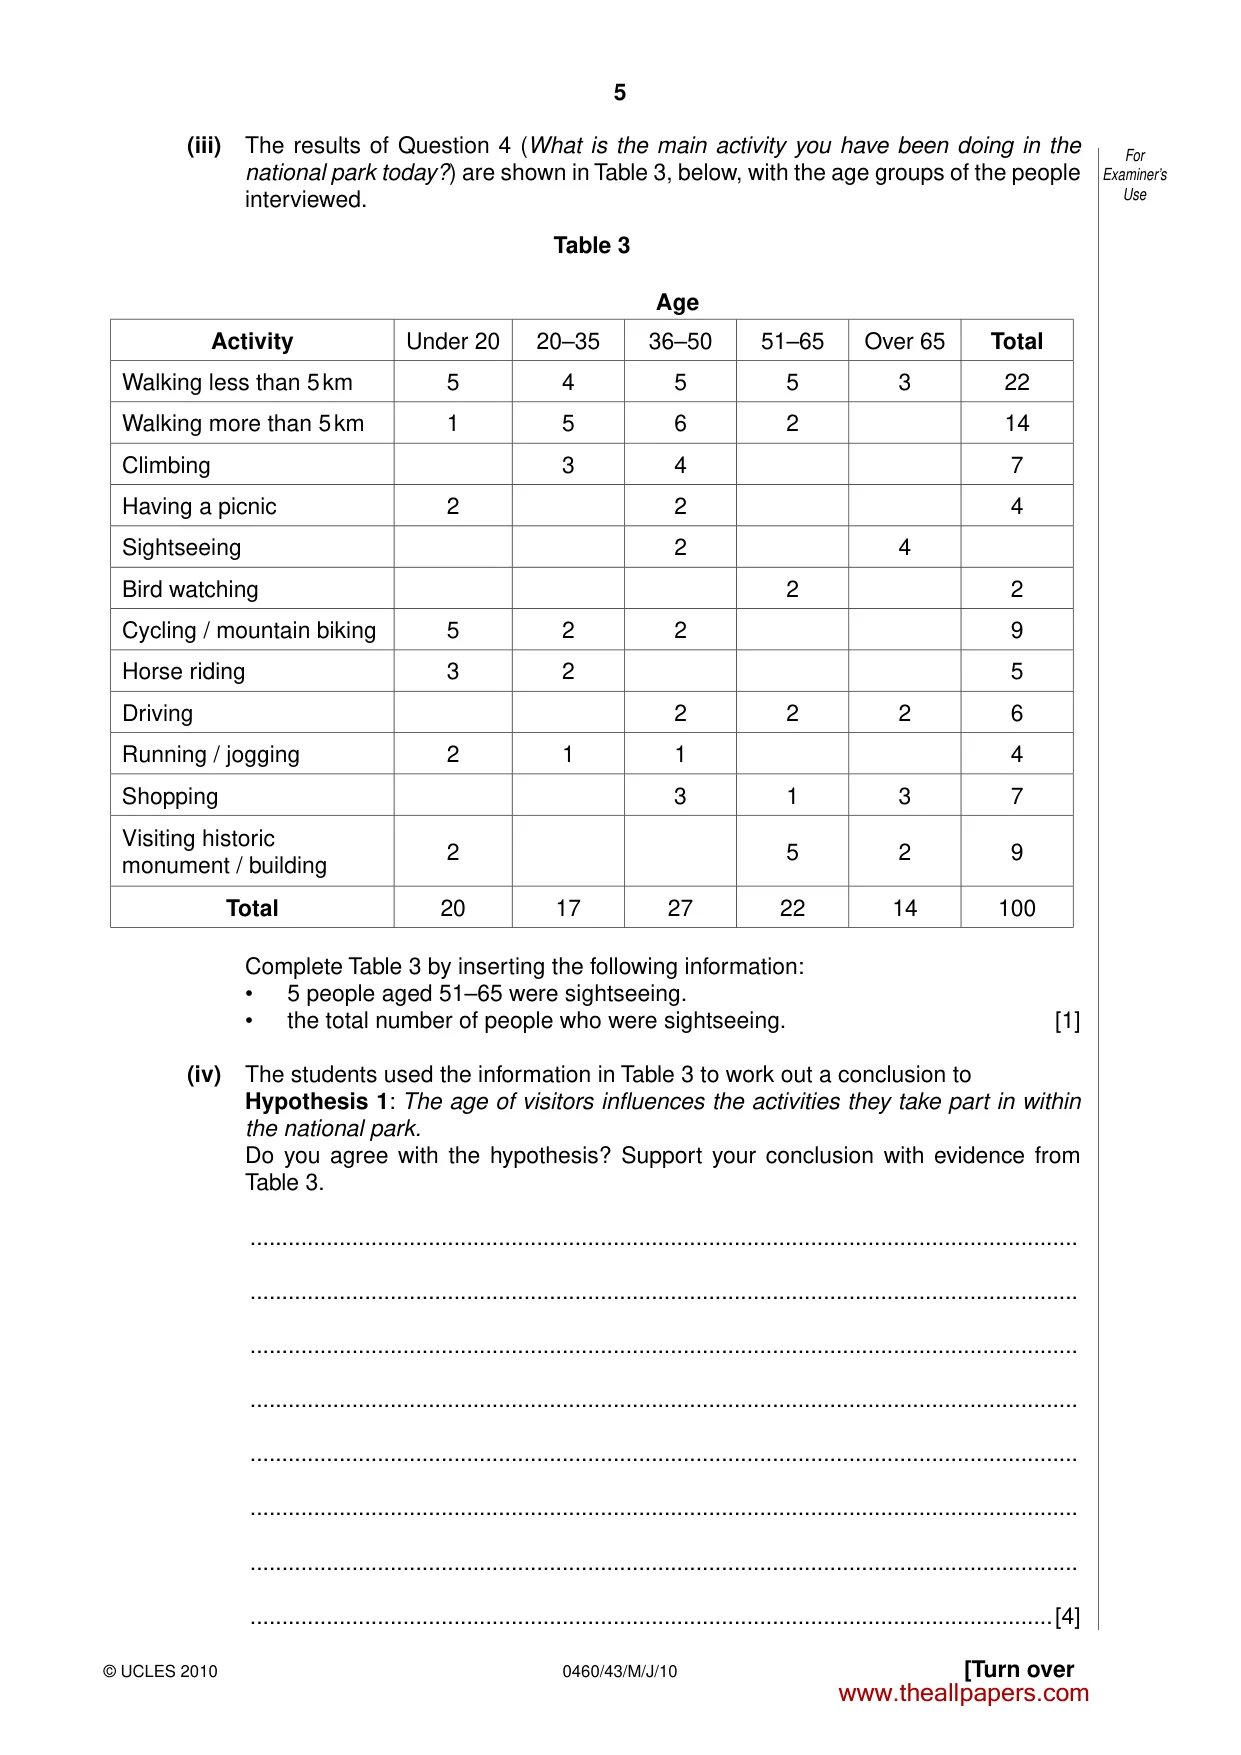
5 0460/43/M/J/10 [Turn over For Examiner’s Use © UCLES 2010 (iii) The results of Question 4 (What is the main activity you have been doing in the national park today?) are shown in Table 3, below, with the age groups of the people interviewed. Table 3 Age Activity Under 20 20–35 36–50 51–65 Over 65 Total Walking less than 5 km 5 4 5 5 3 22 Walking more than 5 km 1 5 6 2 14 Climbing 3 4 7 Having a picnic 2 2 4 Sightseeing 2 4 Bird watching 2 2 Cycling / mountain biking 5 2 2 9 Horse riding 3 2 5 Driving 2 2 2 6 Running / jogging 2 1 1 4 Shopping 3 1 3 7 Visiting historic monument / building 2 5 2 9 Total 20 17 27 22 14 100 Complete Table 3 by inserting the following information: • 5 people aged 51–65 were sightseeing. • the total number of people who were sightseeing. [1] (iv) The students used the information in Table 3 to work out a conclusion to Hypothesis 1: The age of visitors influences the activities they take part in within the national park. Do you agree with the hypothesis? Support your conclusion with evidence from Table 3. … … … … … … … …[4] www.theallpapers.com
Question paper, page 6
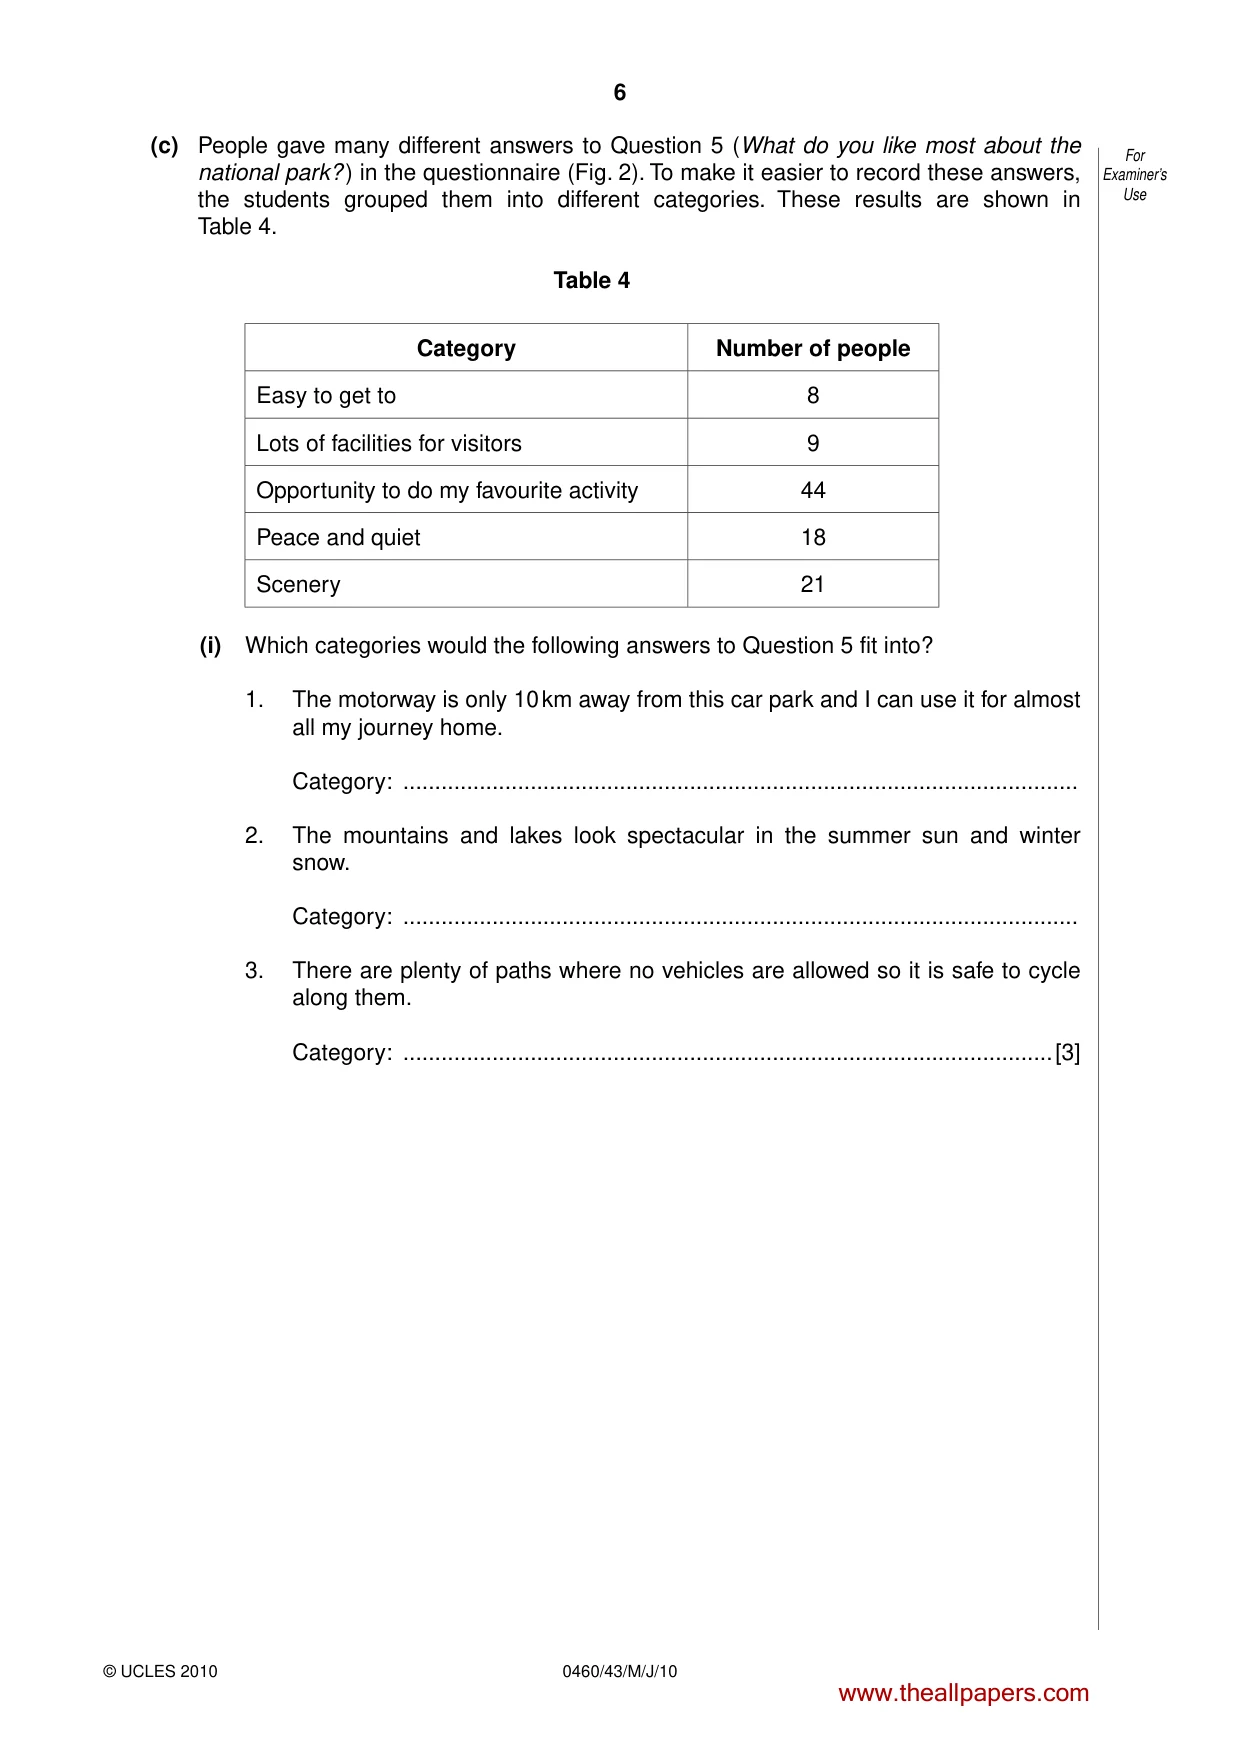
6 0460/43/M/J/10 For Examiner’s Use © UCLES 2010 (c) People gave many different answers to Question 5 (What do you like most about the national park? ) in the questionnaire (Fig. 2). To make it easier to record these answers, the students grouped them into different categories. These results are shown in Table 4. Table 4 Category Number of people Easy to get to 8 Lots of facilities for visitors 9 Opportunity to do my favourite activity 44 Peace and quiet 18 Scenery 21 (i) Which categories would the following answers to Question 5 fit into? 1. The motorway is only 10 km away from this car park and I can use it for almost all my journey home. Category: … 2. The mountains and lakes look spectacular in the summer sun and winter snow. Category: … 3. There are plenty of paths where no vehicles are allowed so it is safe to cycle along them. Category: …[3] www.theallpapers.com
Question paper, page 7
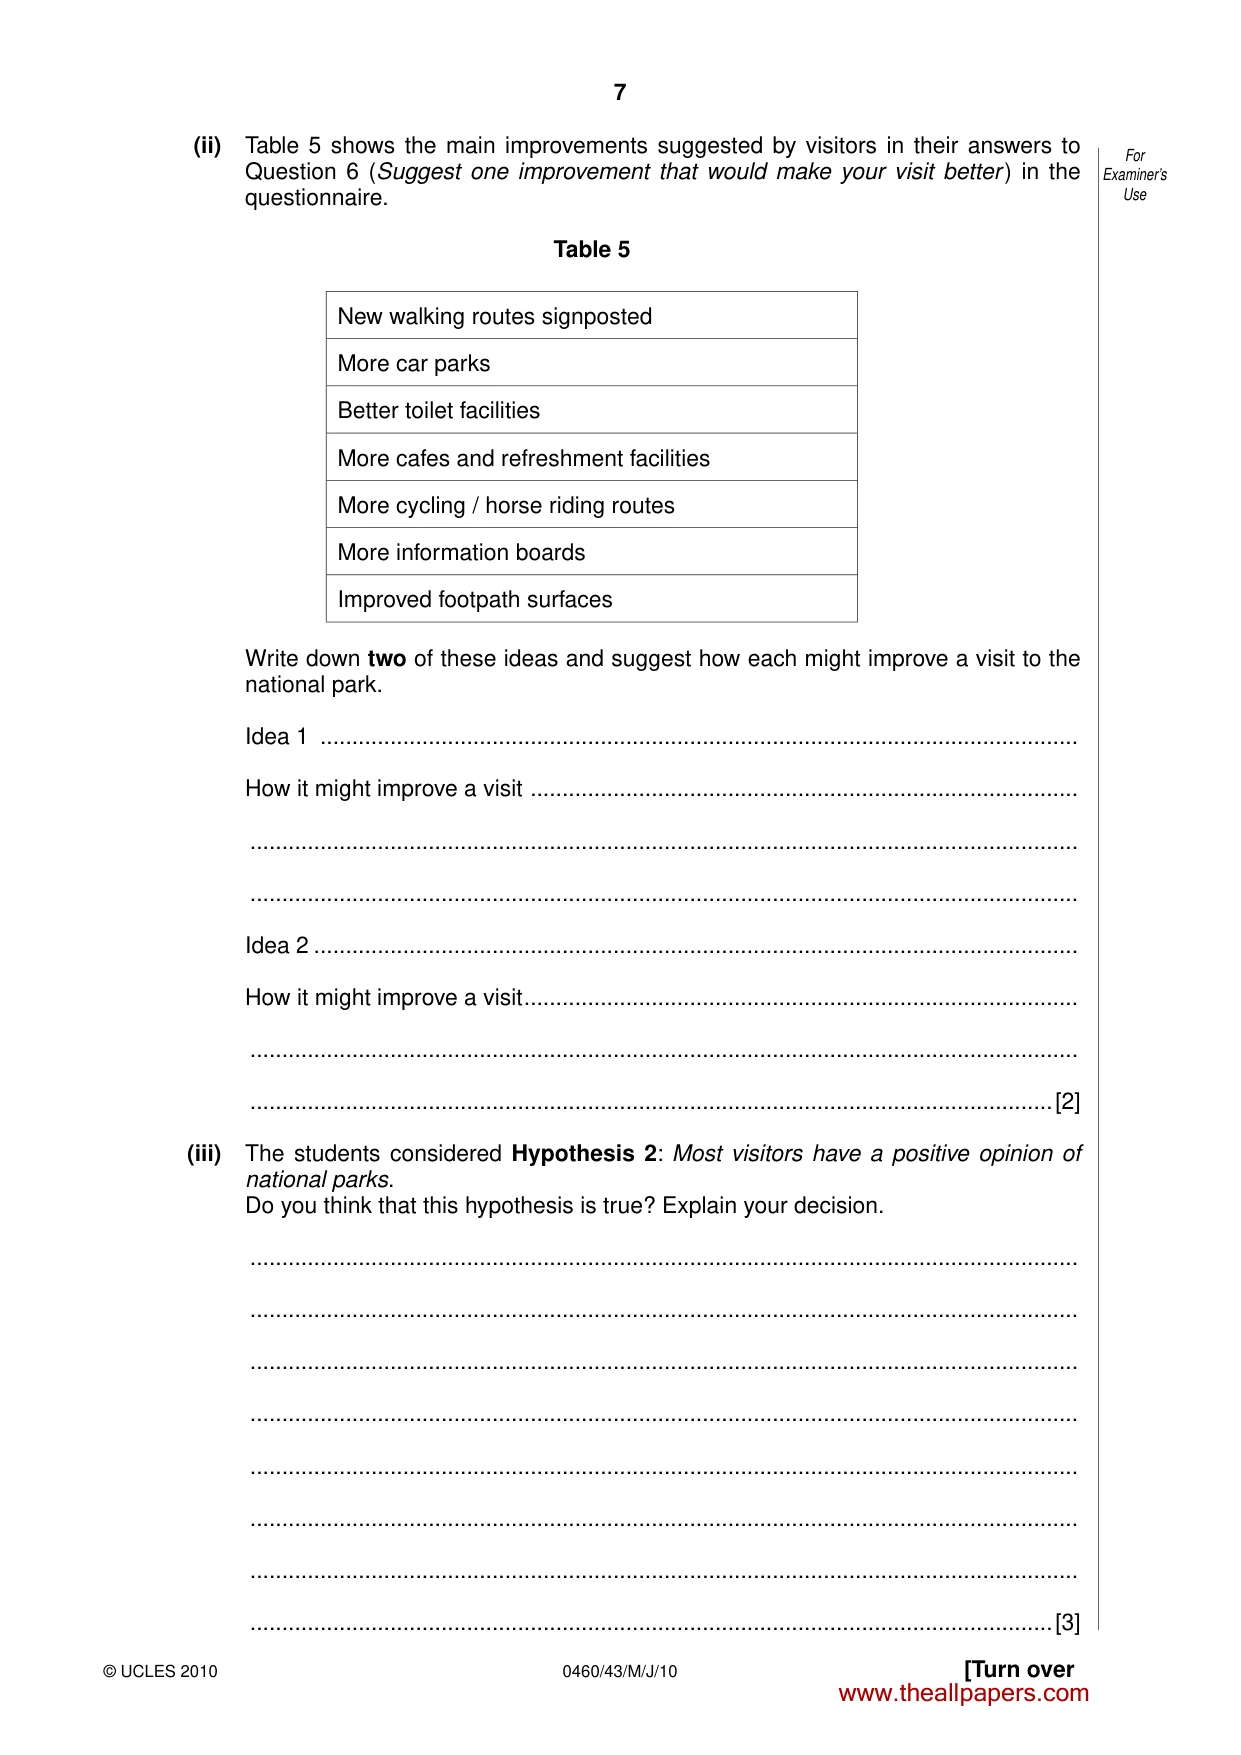
7 0460/43/M/J/10 [Turn over For Examiner’s Use © UCLES 2010 (ii) Table 5 shows the main improvements suggested by visitors in their answers to Question 6 (Suggest one improvement that would make your visit better ) in the questionnaire. Table 5 New walking routes signposted More car parks Better toilet facilities More cafes and refreshment facilities More cycling / horse riding routes More information boards Improved footpath surfaces Write down two of these ideas and suggest how each might improve a visit to the national park. Idea 1 … How it might improve a visit … … … Idea 2 … How it might improve a visit … … …[2] (iii) The students considered Hypothesis 2: Most visitors have a positive opinion of national parks. Do you think that this hypothesis is true? Explain your decision. … … … … … … … …[3] www.theallpapers.com
Question paper, page 8
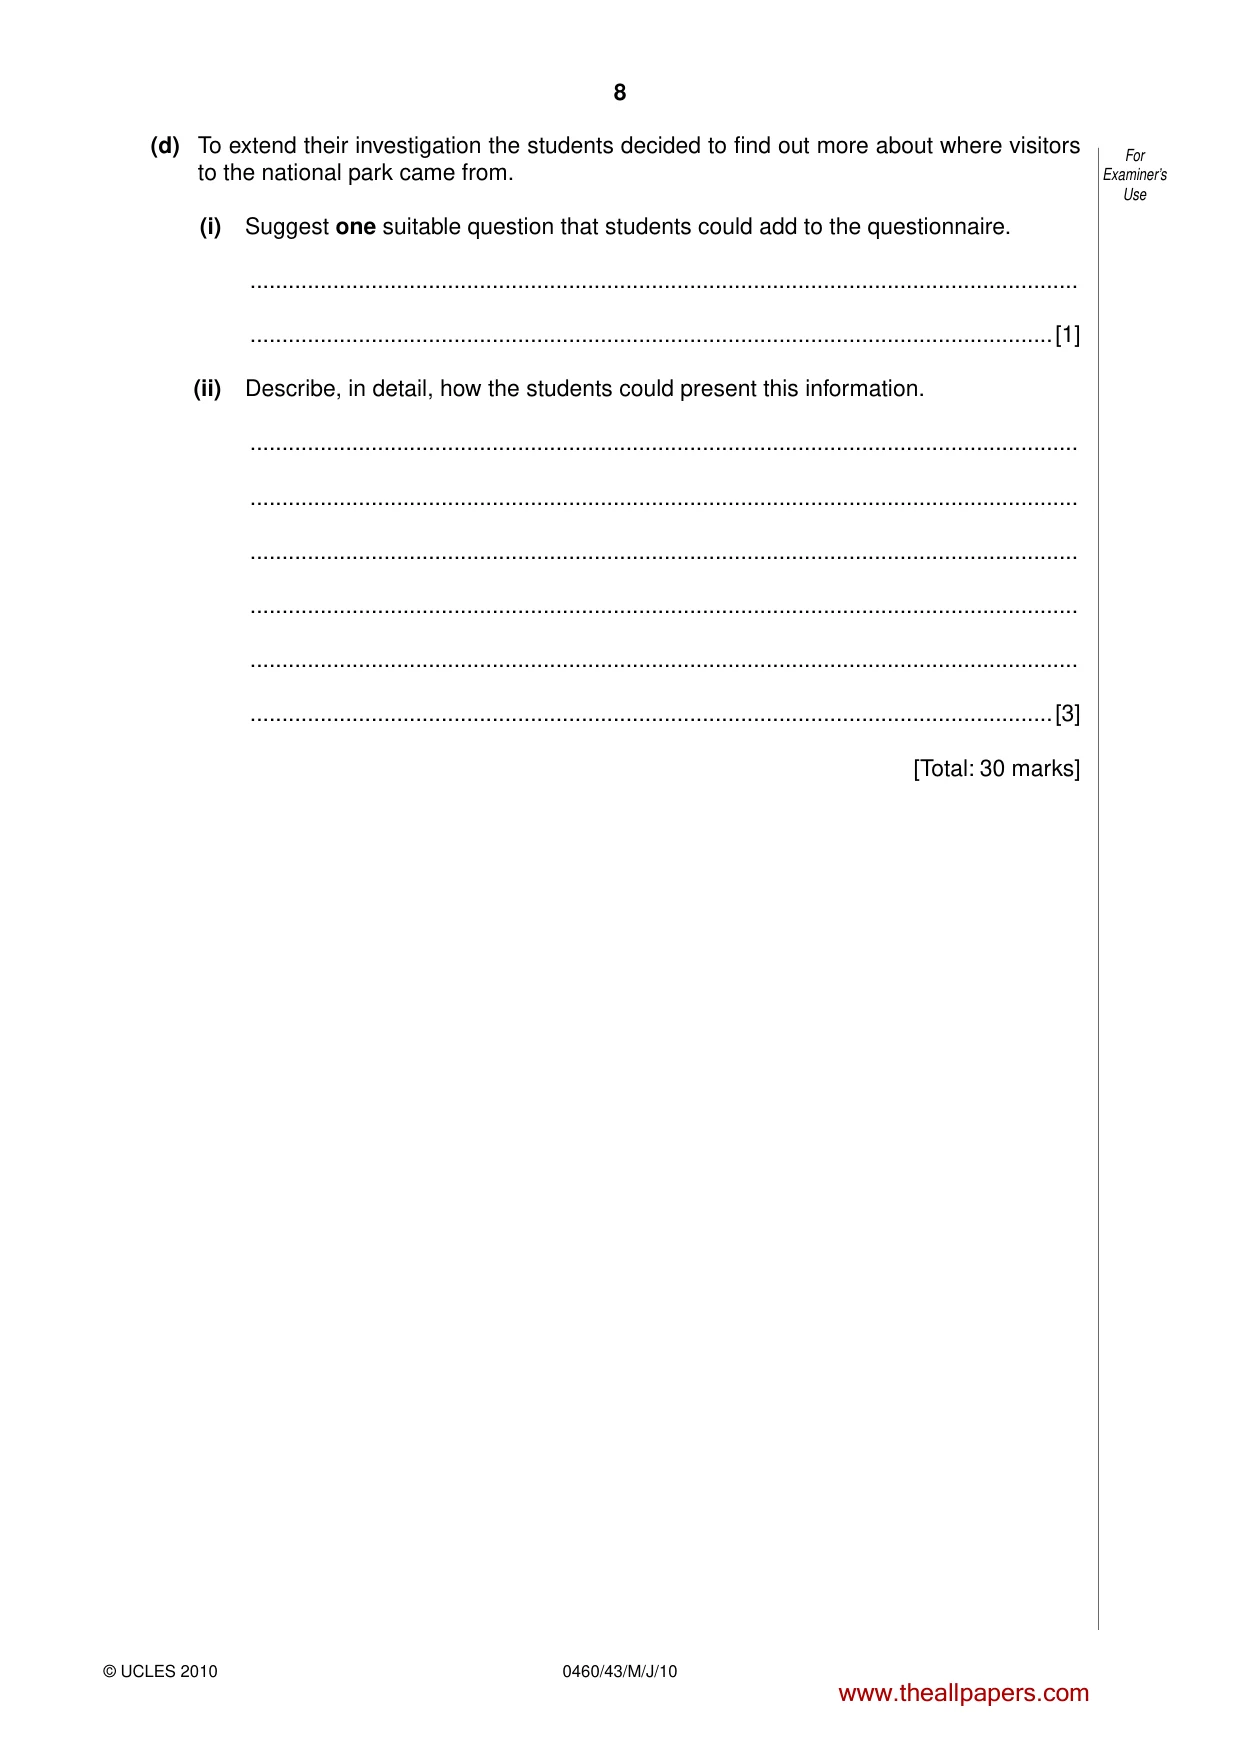
8 0460/43/M/J/10 For Examiner’s Use © UCLES 2010 (d) To extend their investigation the students decided to find out more about where visitors to the national park came from. (i) Suggest one suitable question that students could add to the questionnaire. … …[1] (ii) Describe, in detail, how the students could present this information. … … … … … …[3] [Total: 30 marks] www.theallpapers.com
Question paper, page 9
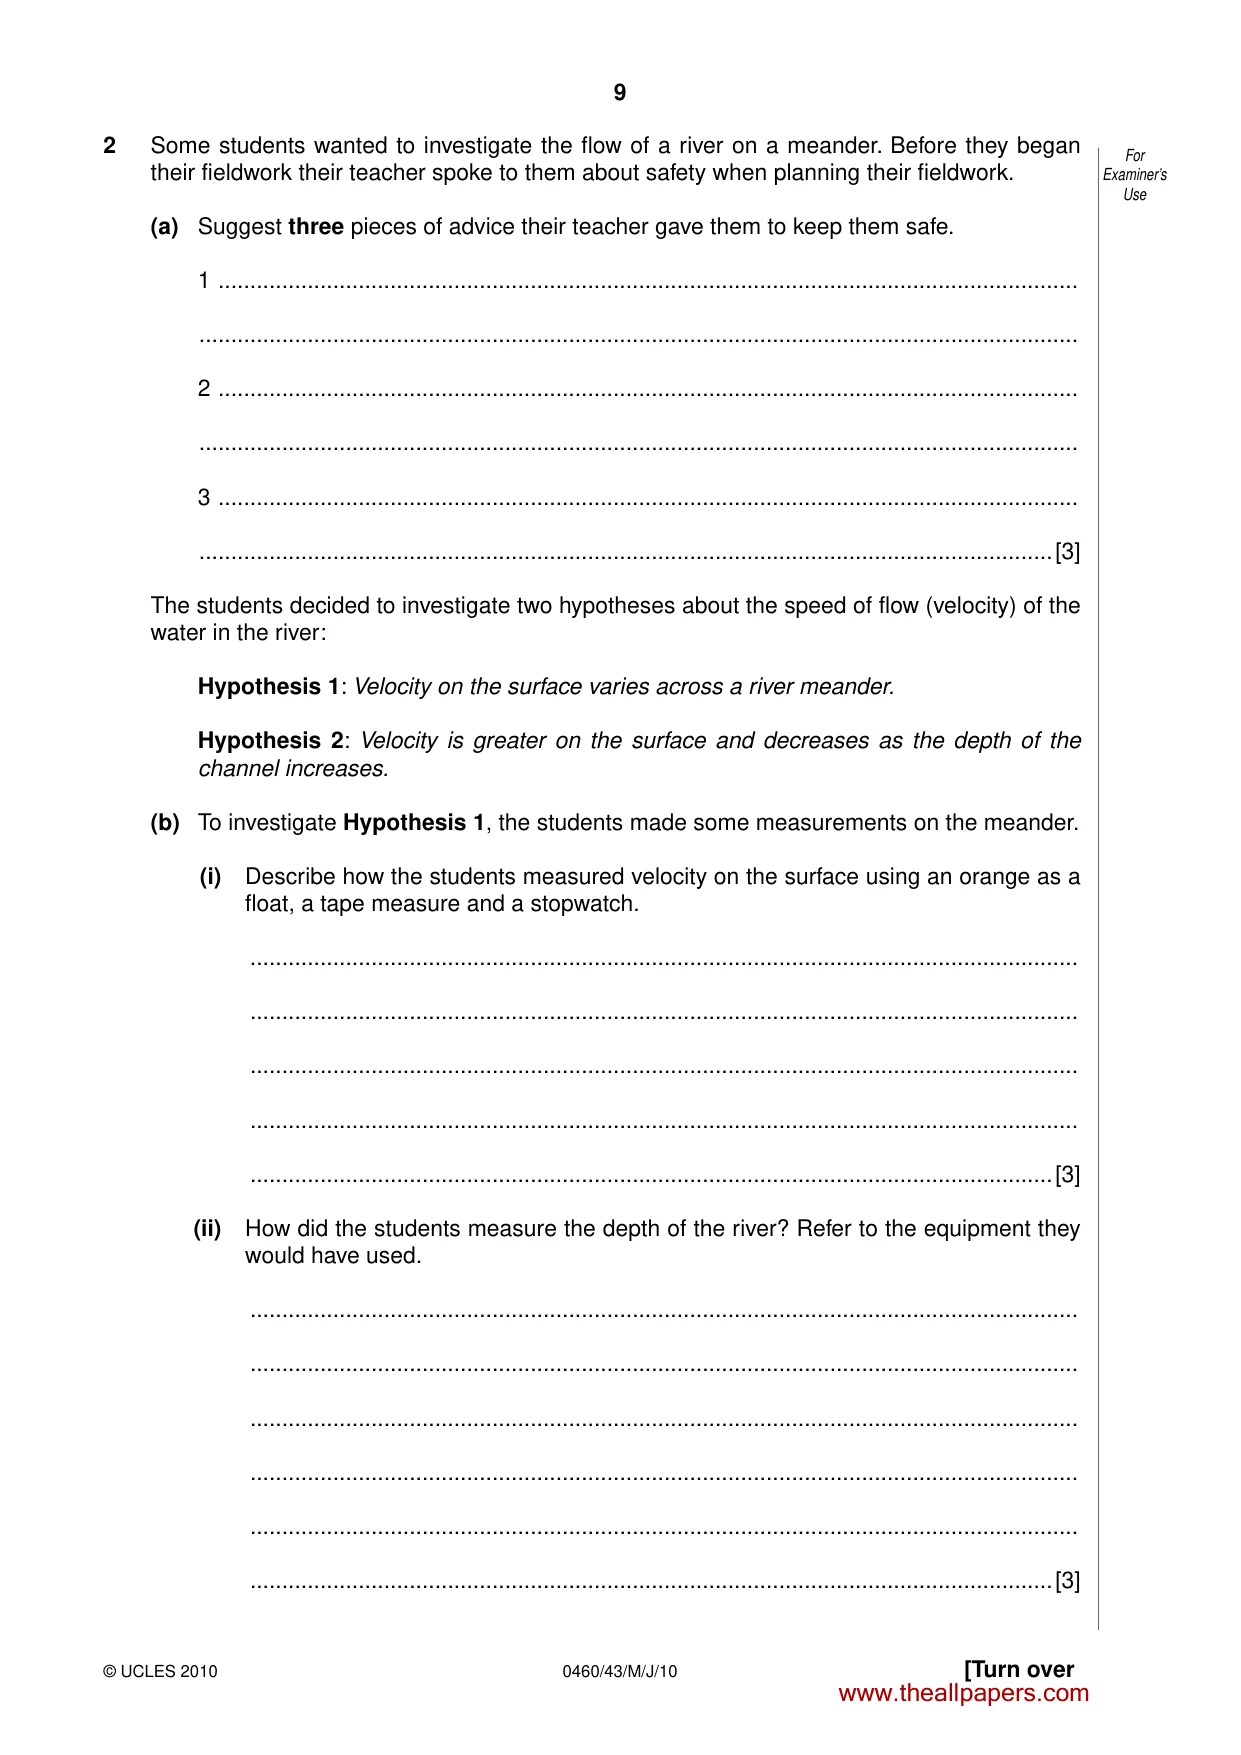
9 0460/43/M/J/10 [Turn over For Examiner’s Use © UCLES 2010 2 Some students wanted to investigate the flow of a river on a meander. Before they began their fieldwork their teacher spoke to them about safety when planning their fieldwork. (a) Suggest three pieces of advice their teacher gave them to keep them safe. 1 … … 2 … … 3 … …[3] The students decided to investigate two hypotheses about the speed of flow (velocity) of the water in the river: Hypothesis 1: Velocity on the surface varies across a river meander. Hypothesis 2: Velocity is greater on the surface and decreases as the depth of the channel increases. (b) To investigate Hypothesis 1, the students made some measurements on the meander. (i) Describe how the students measured velocity on the surface using an orange as a float, a tape measure and a stopwatch. … … … … …[3] (ii) How did the students measure the depth of the river? Refer to the equipment they would have used. … … … … … …[3] www.theallpapers.com
Question paper, page 10
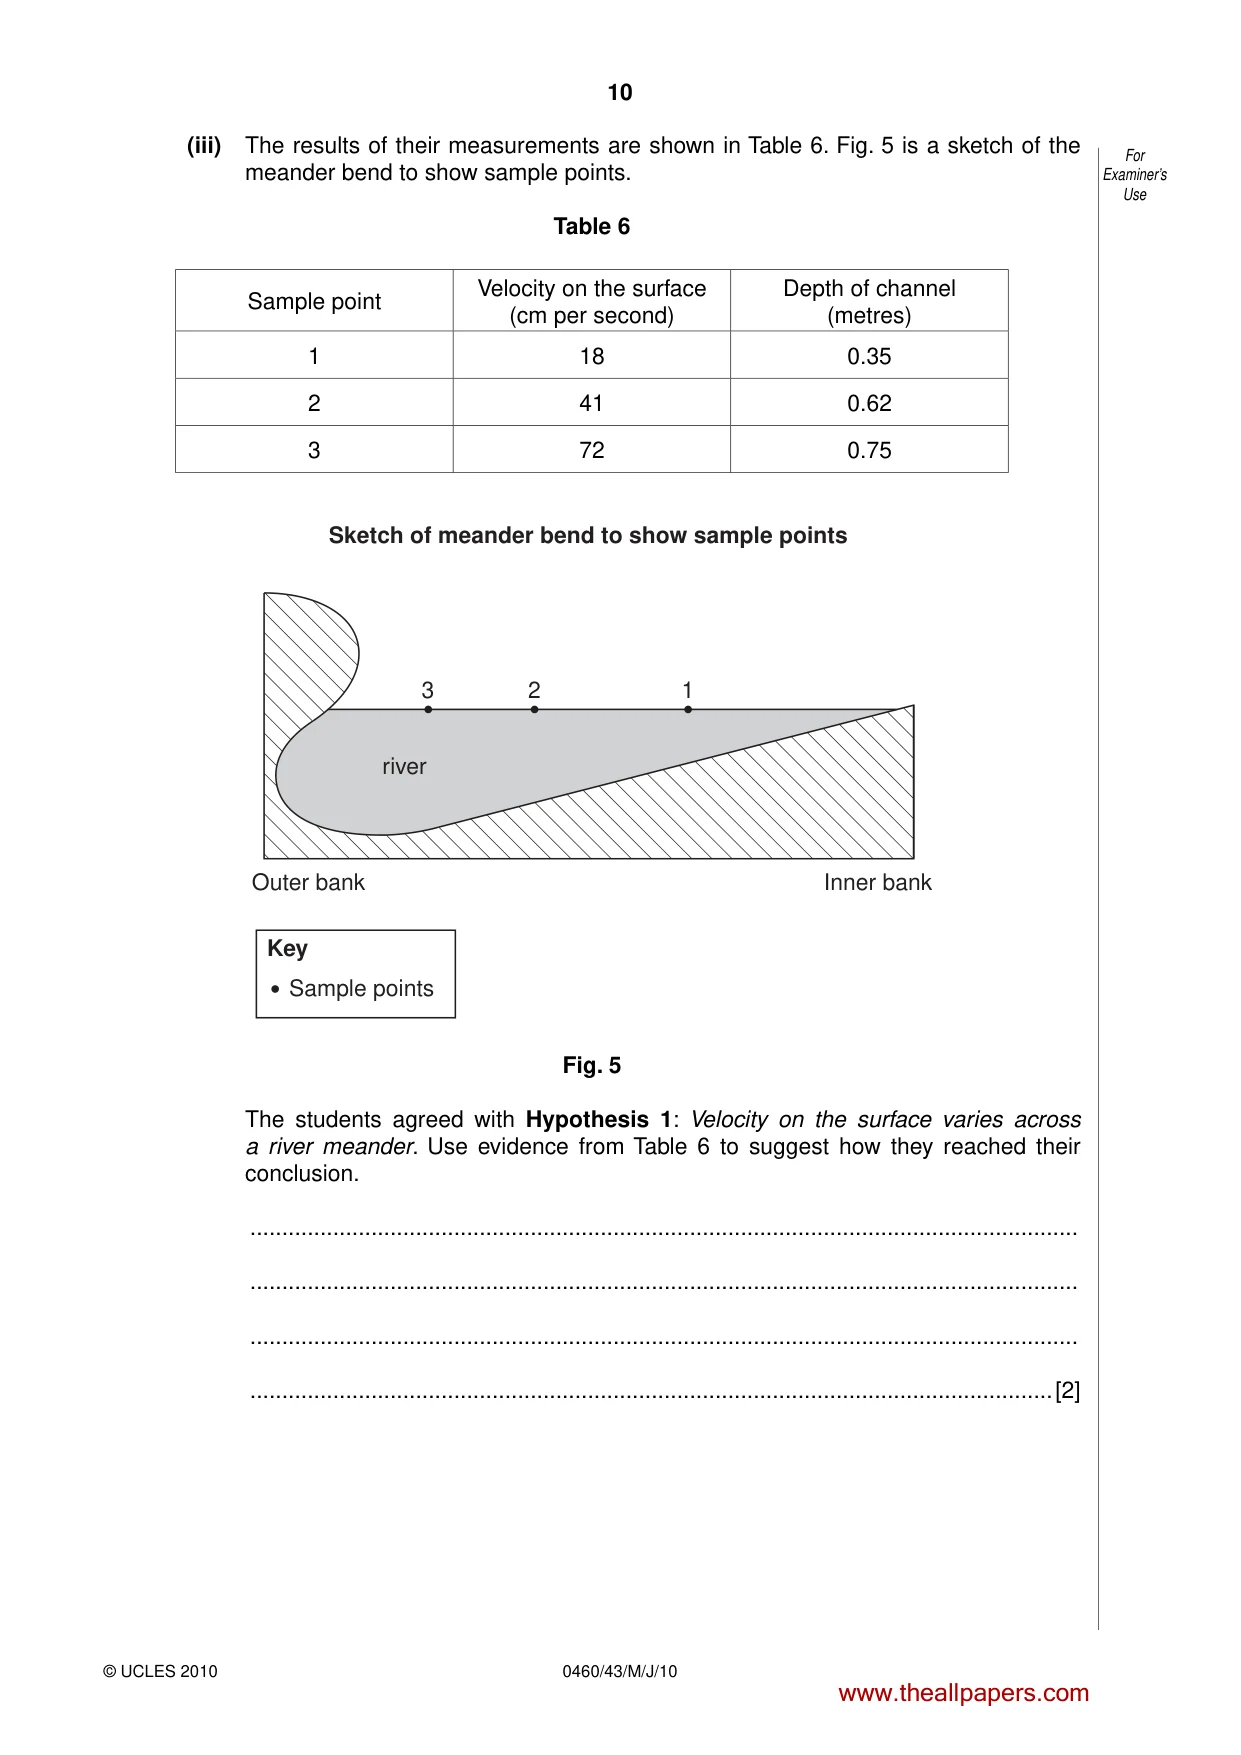
10 0460/43/M/J/10 For Examiner’s Use © UCLES 2010 (iii) The results of their measurements are shown in Table 6. Fig. 5 is a sketch of the meander bend to show sample points. Table 6 Sample point Velocity on the surface (cm per second) Depth of channel (metres) 1 18 0.35 2 41 0.62 3 72 0.75 3 2 river Outer bank Key Sample points Inner bank Sketch of meander bend to show sample points 1 Fig. 5 The students agreed with Hypothesis 1: Velocity on the surface varies across a river meander. Use evidence from Table 6 to suggest how they reached their conclusion. … … … …[2] www.theallpapers.com
Question paper, page 11
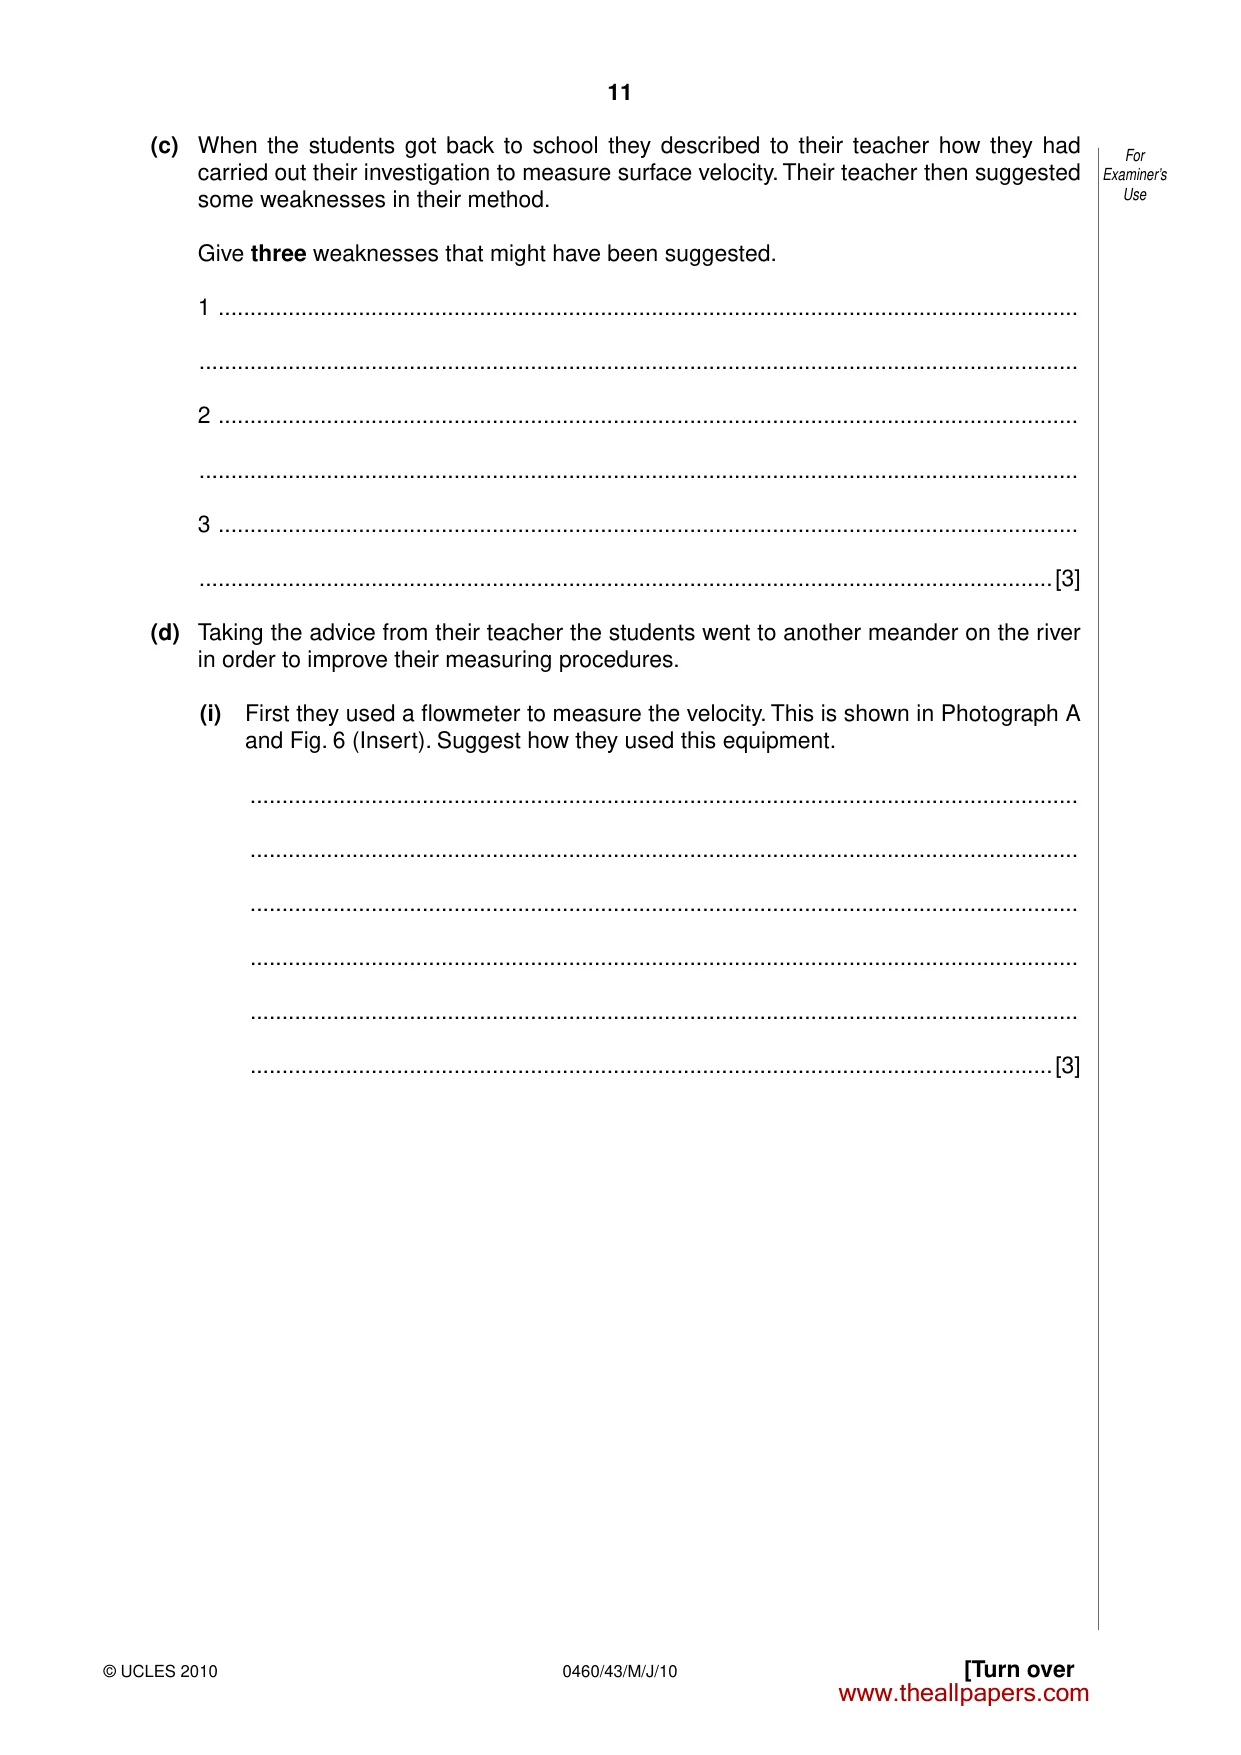
11 0460/43/M/J/10 [Turn over For Examiner’s Use © UCLES 2010 (c) When the students got back to school they described to their teacher how they had carried out their investigation to measure surface velocity. Their teacher then suggested some weaknesses in their method. Give three weaknesses that might have been suggested. 1 … … 2 … … 3 … …[3] (d) Taking the advice from their teacher the students went to another meander on the river in order to improve their measuring procedures. (i) First they used a flowmeter to measure the velocity. This is shown in Photograph A and Fig. 6 (Insert). Suggest how they used this equipment. … … … … … …[3] www.theallpapers.com
Question paper, page 12
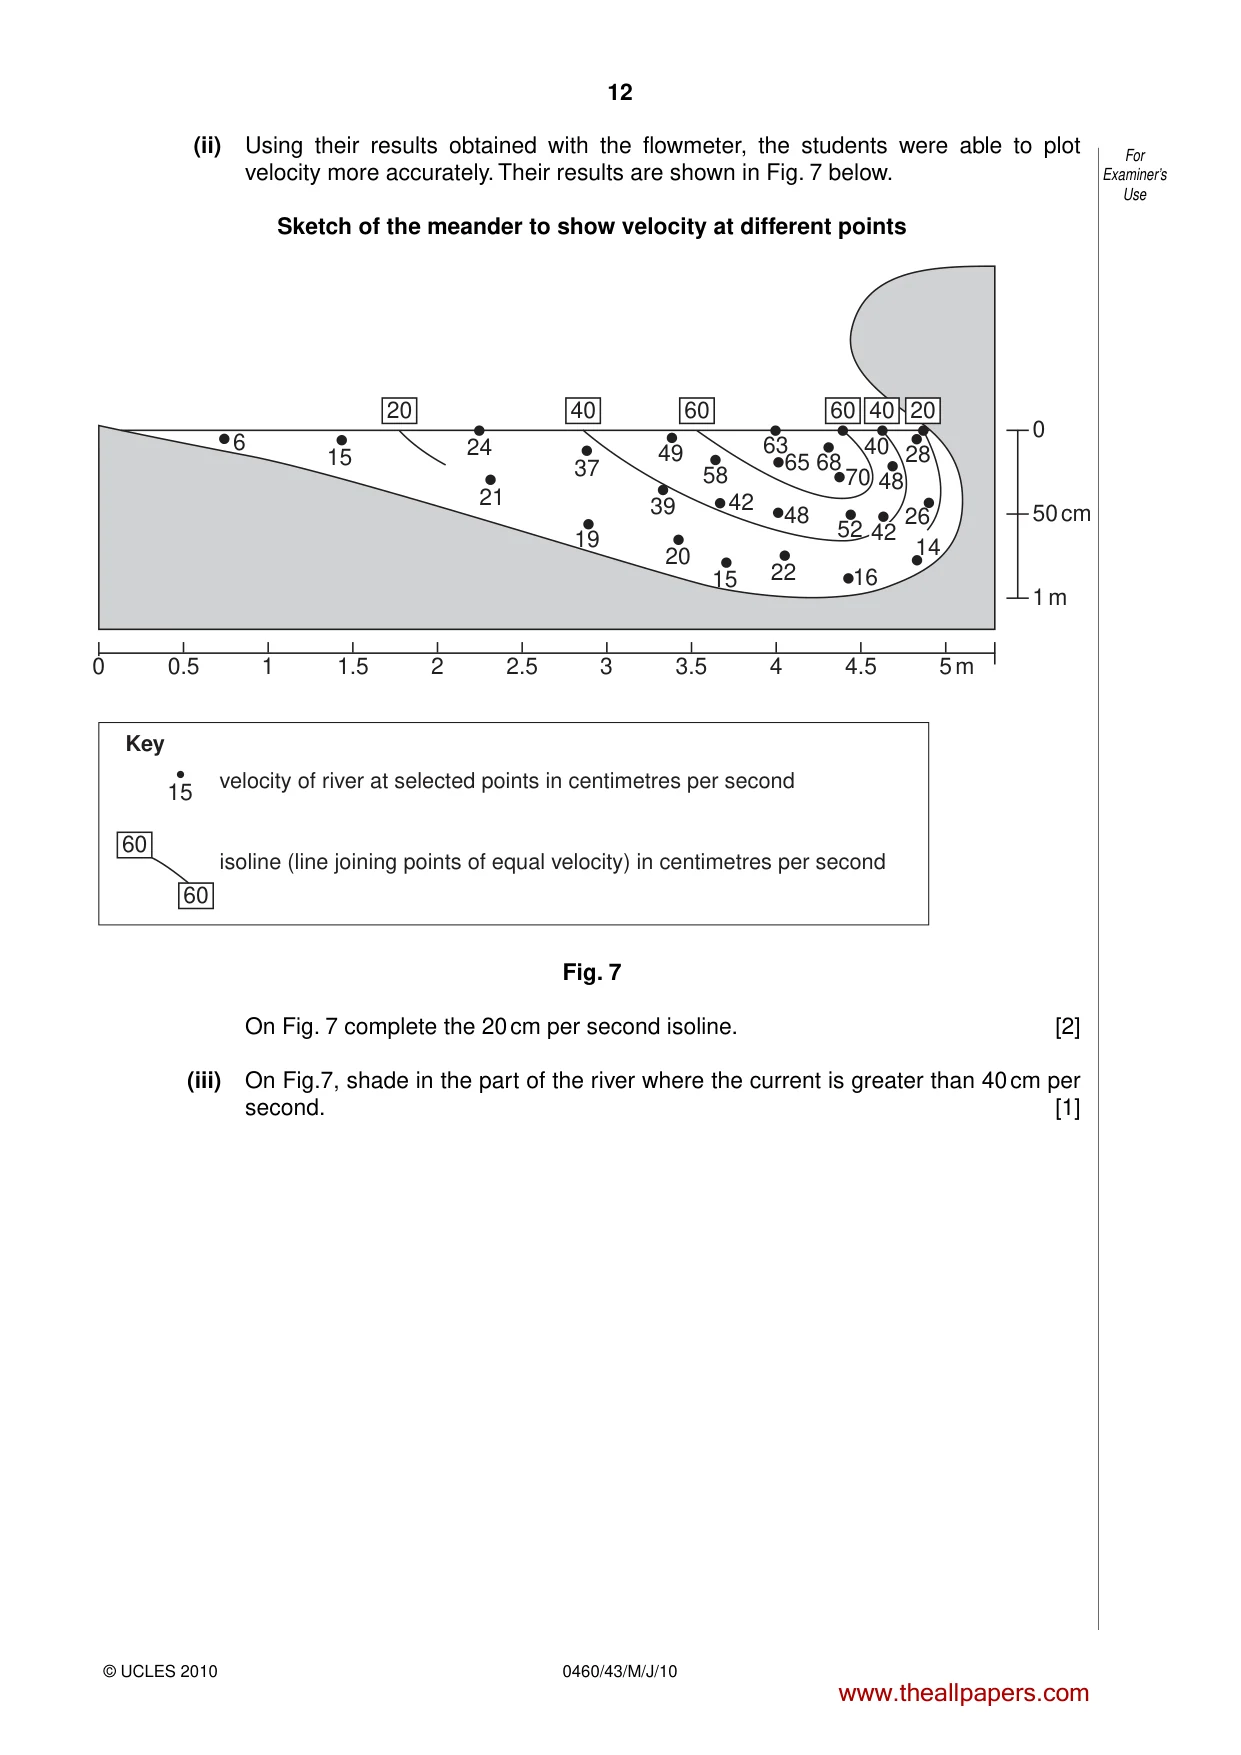
12 0460/43/M/J/10 For Examiner’s Use © UCLES 2010 (ii) Using their results obtained with the flowmeter, the students were able to plot velocity more accurately. Their results are shown in Fig. 7 below. Sketch of the meander to show velocity at different points 20 Key velocity of river at selected points in centimetres per second isoline (line joining points of equal velocity) in centimetres per second 60 60 40 60 60 6 15 24 15 21 37 19 20 15 22 16 14 26 52 48 42 58 49 39 65 63 6870 48 40 28 0 50 cm 1 m 5 m 4.5 4 3.5 3 2.5 2 1.5 1 0.5 0 40 20 42 Fig. 7 On Fig. 7 complete the 20 cm per second isoline. [2] (iii) On Fig.7, shade in the part of the river where the current is greater than 40 cm per second. [1] www.theallpapers.com
Question paper, page 13
13 0460/43/M/J/10 [Turn over For Examiner’s Use © UCLES 2010 (iv) Use the information on Fig. 7 to decide whether you agree with Hypothesis 2: Velocity is greater on the surface and decreases as the depth of the channel increases. Support your conclusion with figures from Fig. 7. … … … … … … … …[4] (v) Explain why the velocity of the river on the meander varies as shown in Fig. 7. … … … …[2] www.theallpapers.com
Question paper, page 14
14 0460/43/M/J/10 For Examiner’s Use © UCLES 2010 (e) In order to extend their fieldwork the students decided to compare their results from the meander with a straight section of river 100 metres further downstream. Suggest what similarities and differences the students would find between the velocity in the two sections of river. You may draw a diagram as part of your answer. … … … … … … … …[4] [Total: 30 marks] www.theallpapers.com
Question paper, page 15
15 0460/43/M/J/10 © UCLES 2010 BLANK PAGE www.theallpapers.com
Question paper, page 16
16 0460/43/M/J/10 © UCLES 2010 BLANK PAGE Permission to reproduce items where third-party owned material protected by copyright is included has been sought and cleared where possible. Every reasonable effort has been made by the publisher (UCLES) to trace copyright holders, but if any items requiring clearance have unwittingly been included, the publisher will be pleased to make amends at the earliest possible opportunity. University of Cambridge International Examinations is part of the Cambridge Assessment Group. Cambridge Assessment is the brand name of University of Cambridge Local Examinations Syndicate (UCLES), which is itself a department of the University of Cambridge. www.theallpapers.com
Mark scheme, page 1
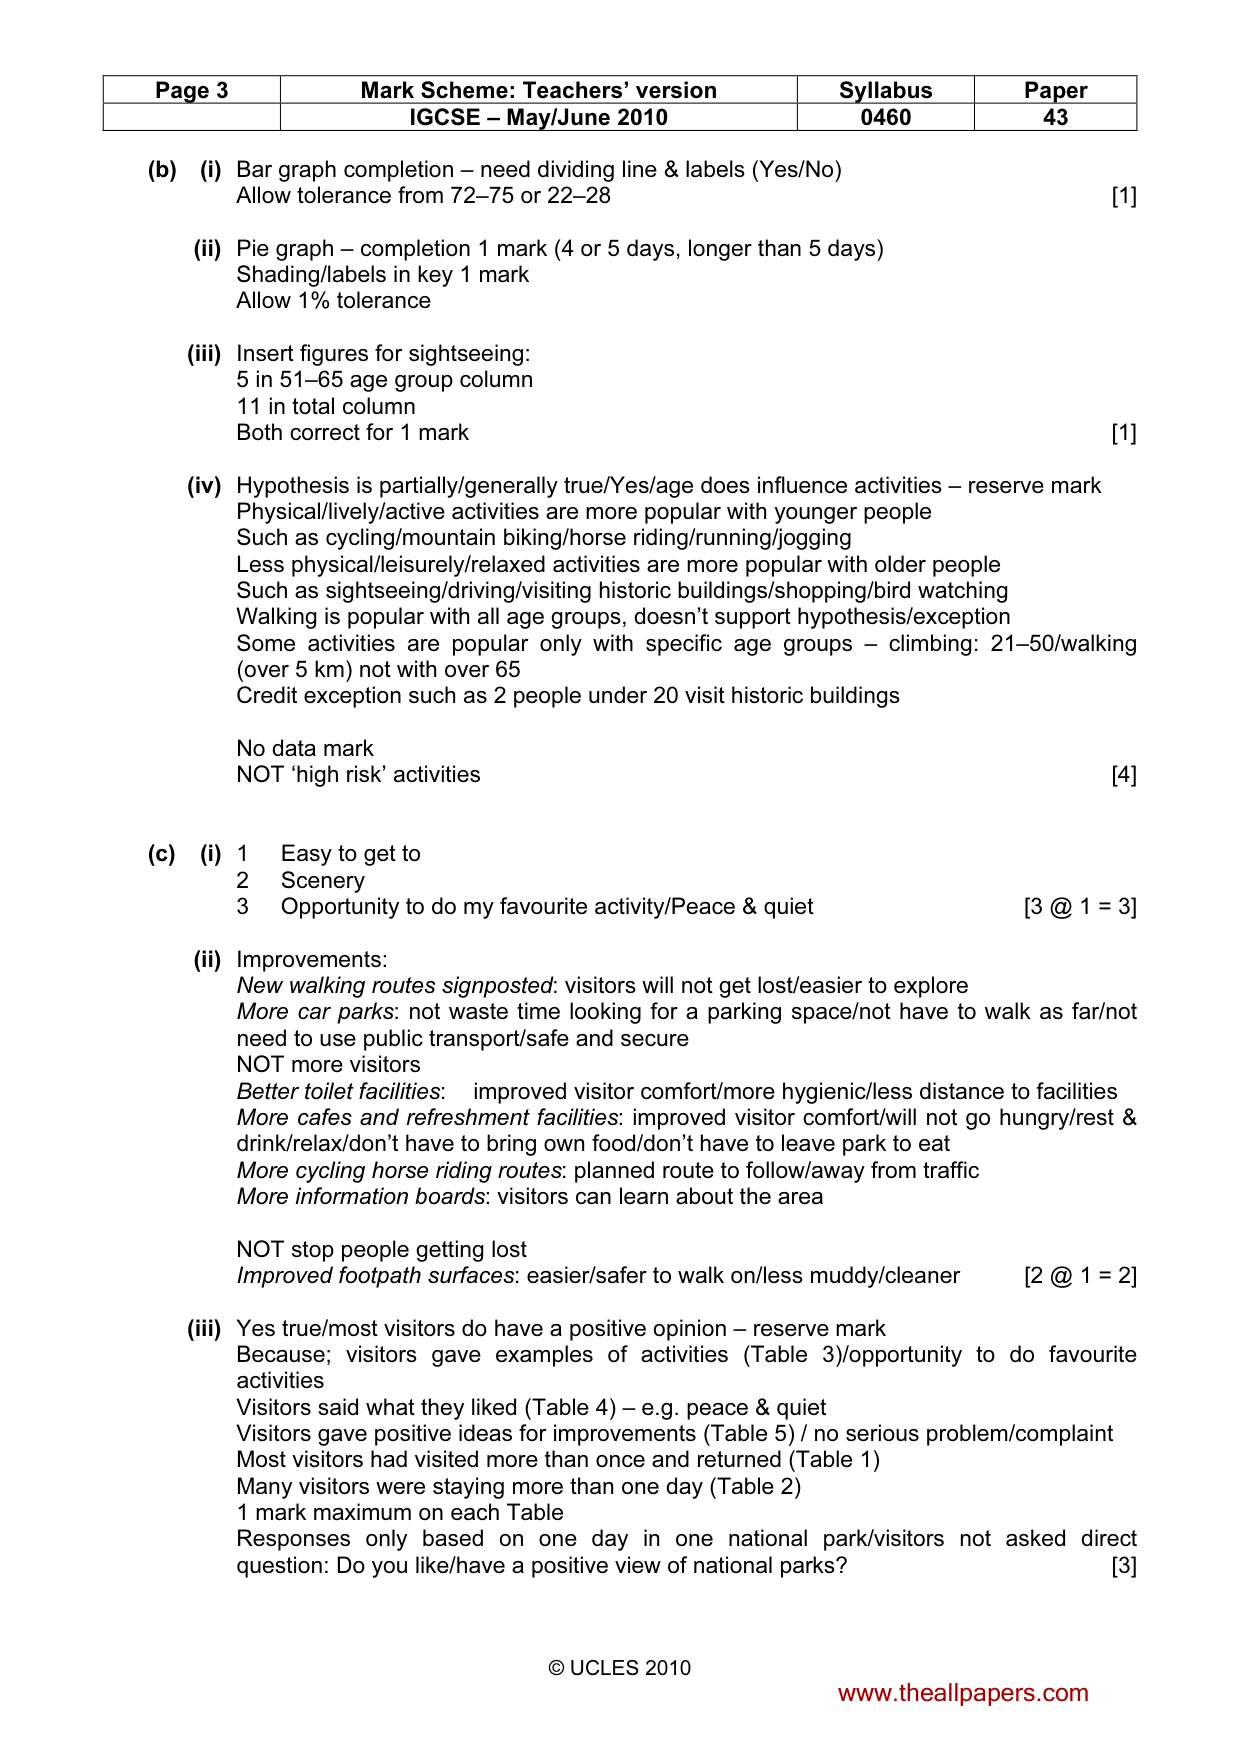
UNIVERSITY OF CAMBRIDGE INTERNATIONAL EXAMINATIONS International General Certificate of Secondary Education MARK SCHEME for the May/June 2010 question paper for the guidance of teachers 0460 GEOGRAPHY 0460/43 Paper 43 (Alternative to Coursework), maximum raw mark 60 This mark scheme is published as an aid to teachers and candidates, to indicate the requirements of the examination. It shows the basis on which Examiners were instructed to award marks. It does not indicate the details of the discussions that took place at an Examiners’ meeting before marking began, which would have considered the acceptability of alternative answers. Mark schemes must be read in conjunction with the question papers and the report on the examination. • CIE will not enter into discussions or correspondence in connection with these mark schemes. CIE is publishing the mark schemes for the May/June 2010 question papers for most IGCSE, GCE Advanced Level and Advanced Subsidiary Level syllabuses and some Ordinary Level syllabuses. www.theallpapers.com
Mark scheme, page 2
Page 2 Mark Scheme: Teachers’ version Syllabus Paper IGCSE – May/June 2010 0460 43 © UCLES 2010 1 (a) (i) Introduction gives no context to questionnaire Q1 is too vague – need town/city/country or is too personal Qs 2 & 3 are irrelevant to hypotheses Q4 repeats idea of Q1/answers wont be accurate Q5 is a closed question and gives no extra information Q6 is negative Q7 is personal Final comment is abrupt/no thanks/informal/impolite/unfriendly No multiple choice alternatives/tick boxes Will have to write down full answers/no space to write answers Difficult to analyse/collate results No question about activities which people did/key question for hypothesis 1 Illogical order of questions/age question is last Answers don’t need to refer to specific questions in questionnaire NOT question is unacceptable – must say why NOT questionnaire is too short [3 @ 1 = 3] (ii) Introduction explains who is doing questionnaire & why/friendly Positive introduction – won’t take up much time Qs 1, 2 & 3 ask for precise/quick responses/choices for people to tick Qs 4 & 5 are open/positive/ask for opinions Thanks at the end Gender information is recorded without questioning Questions are relevant to hypotheses Answers are easy to collate/graph Can credit opposites to (i) Answers don’t need to refer to specific questions in questionnaire NOT clear/easy to understand – must say why [2 @ 1 =2] (iii) Simple to organise/clear rationale Reduces bias in sample/fair test Respondents cannot influence each other/discuss answers [2 @ 1 = 2] (iv) Lots of people to ask/many people park there In middle of national park so more likely to be used by tourists Accept negative comment about other locations [1] (v) Why: People would be better equipped to answer questions about time spent in park/ activities/what they liked Waited until people had enjoyed the day’s activities Disadvantage: People are tired at end of a busy day/cannot be bothered to answer questions People in a rush to set off for home May not get enough answers and too late to do anything about it Will only question people in cars/miss out people who don’t come by car [1 + 1 = 2] www.theallpapers.com
Mark scheme, page 3
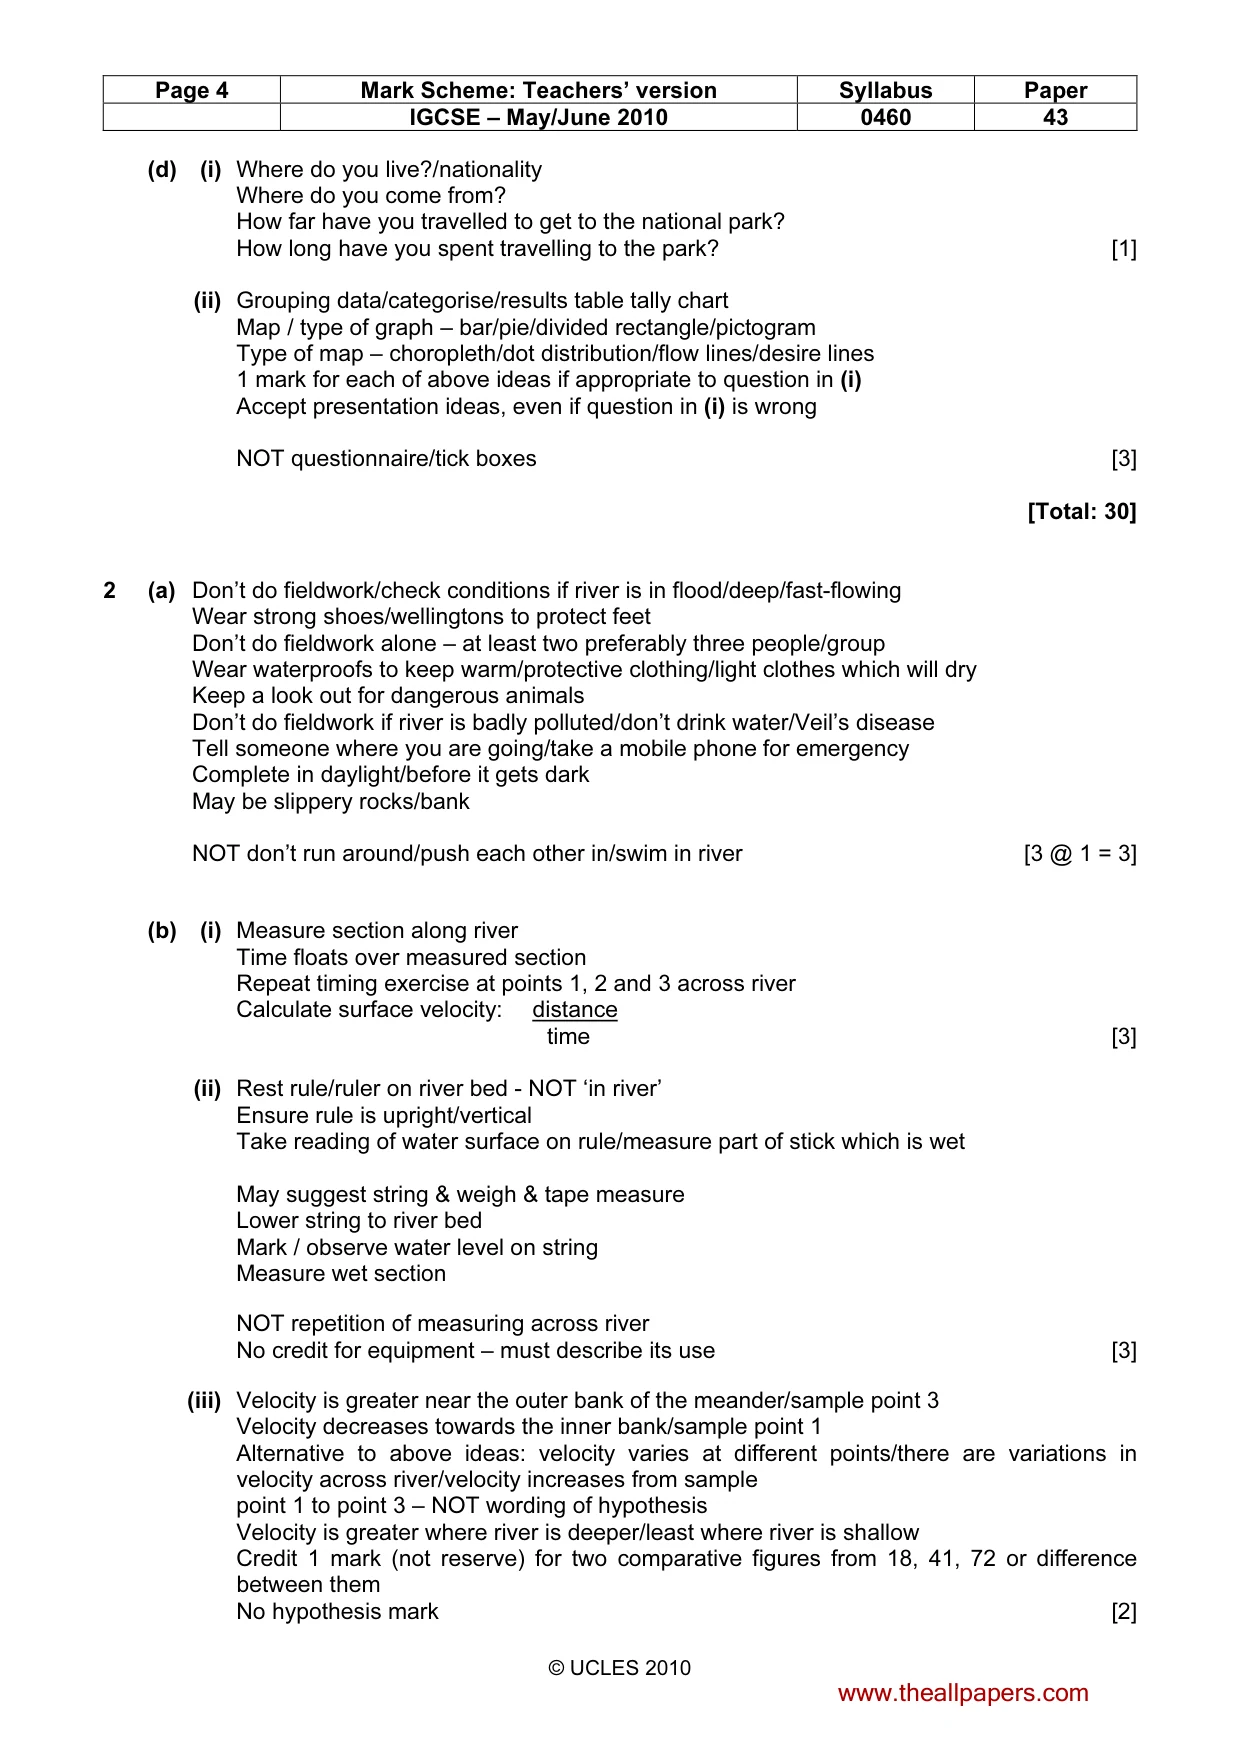
Page 3 Mark Scheme: Teachers’ version Syllabus Paper IGCSE – May/June 2010 0460 43 © UCLES 2010 (b) (i) Bar graph completion – need dividing line & labels (Yes/No) Allow tolerance from 72–75 or 22–28 [1] (ii) Pie graph – completion 1 mark (4 or 5 days, longer than 5 days) Shading/labels in key 1 mark Allow 1% tolerance (iii) Insert figures for sightseeing: 5 in 51–65 age group column 11 in total column Both correct for 1 mark [1] (iv) Hypothesis is partially/generally true/Yes/age does influence activities – reserve mark Physical/lively/active activities are more popular with younger people Such as cycling/mountain biking/horse riding/running/jogging Less physical/leisurely/relaxed activities are more popular with older people Such as sightseeing/driving/visiting historic buildings/shopping/bird watching Walking is popular with all age groups, doesn’t support hypothesis/exception Some activities are popular only with specific age groups – climbing: 21–50/walking (over 5 km) not with over 65 Credit exception such as 2 people under 20 visit historic buildings No data mark NOT ‘high risk’ activities [4] (c) (i) 1 Easy to get to 2 Scenery 3 Opportunity to do my favourite activity/Peace & quiet [3 @ 1 = 3] (ii) Improvements: New walking routes signposted: visitors will not get lost/easier to explore More car parks: not waste time looking for a parking space/not have to walk as far/not need to use public transport/safe and secure NOT more visitors Better toilet facilities: improved visitor comfort/more hygienic/less distance to facilities More cafes and refreshment facilities: improved visitor comfort/will not go hungry/rest & drink/relax/don’t have to bring own food/don’t have to leave park to eat More cycling horse riding routes: planned route to follow/away from traffic More information boards: visitors can learn about the area NOT stop people getting lost Improved footpath surfaces: easier/safer to walk on/less muddy/cleaner [2 @ 1 = 2] (iii) Yes true/most visitors do have a positive opinion – reserve mark Because; visitors gave examples of activities (Table 3)/opportunity to do favourite activities Visitors said what they liked (Table 4) – e.g. peace & quiet Visitors gave positive ideas for improvements (Table 5) / no serious problem/complaint Most visitors had visited more than once and returned (Table 1) Many visitors were staying more than one day (Table 2) 1 mark maximum on each Table Responses only based on one day in one national park/visitors not asked direct question: Do you like/have a positive view of national parks? [3] www.theallpapers.com
Mark scheme, page 4
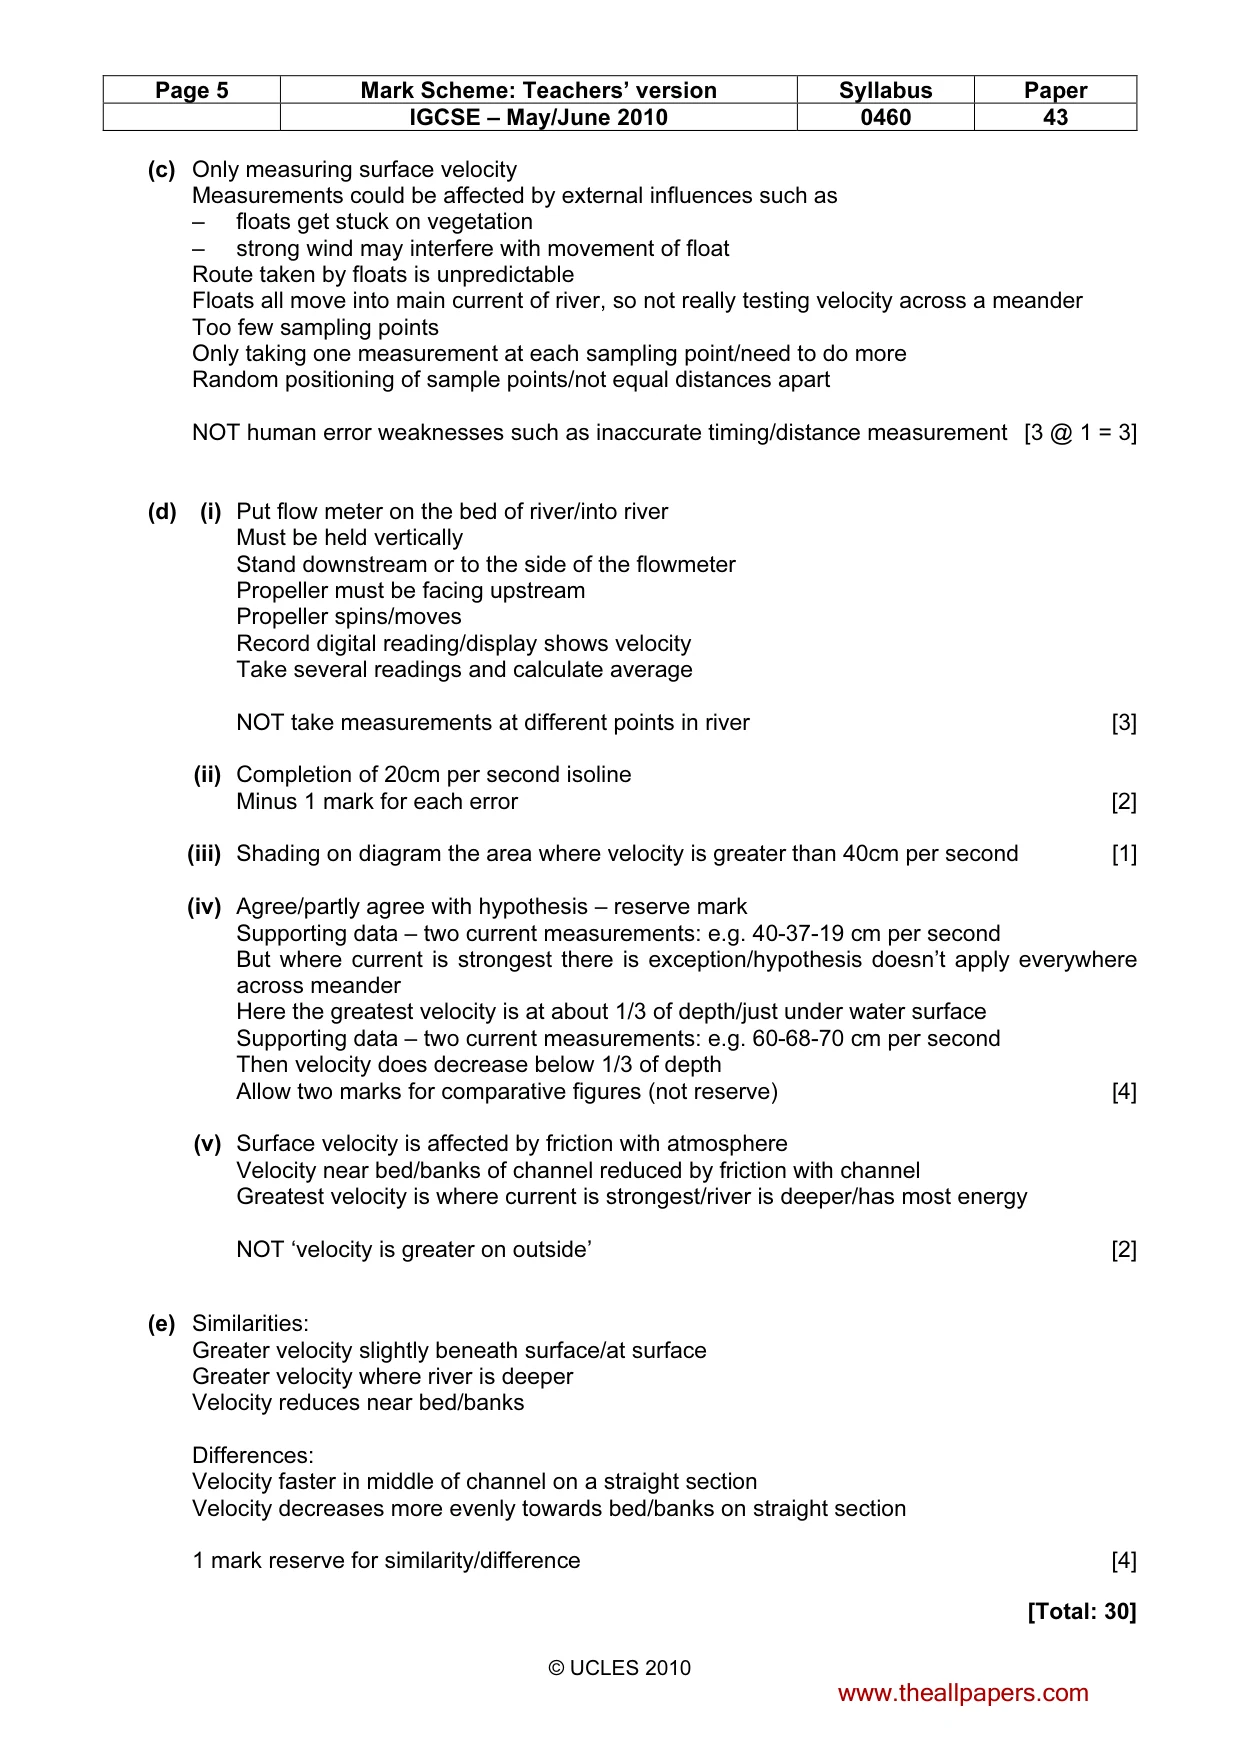
Page 4 Mark Scheme: Teachers’ version Syllabus Paper IGCSE – May/June 2010 0460 43 © UCLES 2010 (d) (i) Where do you live?/nationality Where do you come from? How far have you travelled to get to the national park? How long have you spent travelling to the park? [1] (ii) Grouping data/categorise/results table tally chart Map / type of graph – bar/pie/divided rectangle/pictogram Type of map – choropleth/dot distribution/flow lines/desire lines 1 mark for each of above ideas if appropriate to question in (i) Accept presentation ideas, even if question in (i) is wrong NOT questionnaire/tick boxes [3] [Total: 30] 2 (a) Don’t do fieldwork/check conditions if river is in flood/deep/fast-flowing Wear strong shoes/wellingtons to protect feet Don’t do fieldwork alone – at least two preferably three people/group Wear waterproofs to keep warm/protective clothing/light clothes which will dry Keep a look out for dangerous animals Don’t do fieldwork if river is badly polluted/don’t drink water/Veil’s disease Tell someone where you are going/take a mobile phone for emergency Complete in daylight/before it gets dark May be slippery rocks/bank NOT don’t run around/push each other in/swim in river [3 @ 1 = 3] (b) (i) Measure section along river Time floats over measured section Repeat timing exercise at points 1, 2 and 3 across river Calculate surface velocity: distance time [3] (ii) Rest rule/ruler on river bed - NOT ‘in river’ Ensure rule is upright/vertical Take reading of water surface on rule/measure part of stick which is wet May suggest string & weigh & tape measure Lower string to river bed Mark / observe water level on string Measure wet section NOT repetition of measuring across river No credit for equipment – must describe its use [3] (iii) Velocity is greater near the outer bank of the meander/sample point 3 Velocity decreases towards the inner bank/sample point 1 Alternative to above ideas: velocity varies at different points/there are variations in velocity across river/velocity increases from sample point 1 to point 3 – NOT wording of hypothesis Velocity is greater where river is deeper/least where river is shallow Credit 1 mark (not reserve) for two comparative figures from 18, 41, 72 or difference between them No hypothesis mark [2] www.theallpapers.com
Mark scheme, page 5
Page 5 Mark Scheme: Teachers’ version Syllabus Paper IGCSE – May/June 2010 0460 43 © UCLES 2010 (c) Only measuring surface velocity Measurements could be affected by external influences such as – floats get stuck on vegetation – strong wind may interfere with movement of float Route taken by floats is unpredictable Floats all move into main current of river, so not really testing velocity across a meander Too few sampling points Only taking one measurement at each sampling point/need to do more Random positioning of sample points/not equal distances apart NOT human error weaknesses such as inaccurate timing/distance measurement [3 @ 1 = 3] (d) (i) Put flow meter on the bed of river/into river Must be held vertically Stand downstream or to the side of the flowmeter Propeller must be facing upstream Propeller spins/moves Record digital reading/display shows velocity Take several readings and calculate average NOT take measurements at different points in river [3] (ii) Completion of 20cm per second isoline Minus 1 mark for each error [2] (iii) Shading on diagram the area where velocity is greater than 40cm per second [1] (iv) Agree/partly agree with hypothesis – reserve mark Supporting data – two current measurements: e.g. 40-37-19 cm per second But where current is strongest there is exception/hypothesis doesn’t apply everywhere across meander Here the greatest velocity is at about 1/3 of depth/just under water surface Supporting data – two current measurements: e.g. 60-68-70 cm per second Then velocity does decrease below 1/3 of depth Allow two marks for comparative figures (not reserve) [4] (v) Surface velocity is affected by friction with atmosphere Velocity near bed/banks of channel reduced by friction with channel Greatest velocity is where current is strongest/river is deeper/has most energy NOT ‘velocity is greater on outside’ [2] (e) Similarities: Greater velocity slightly beneath surface/at surface Greater velocity where river is deeper Velocity reduces near bed/banks Differences: Velocity faster in middle of channel on a straight section Velocity decreases more evenly towards bed/banks on straight section 1 mark reserve for similarity/difference [4] [Total: 30] www.theallpapers.com
What you needed in this session
Cambridge’s own grade thresholds for 2010 May/June, Paper 4 · Variant 3. A higher threshold means an easier paper — the bar moves with how the cohort did.