Cambridge IGCSE Geography 0460 — 2010 May/June Paper 4 · Variant 2
0460/42/M/J/10 · 60 marks · ≈68 min
The question paper and its mark scheme, free to read here and free to download. This is Cambridge’s own paper, exactly as it was sat.
Question paper16 pages







Mark scheme5 pages
Answers below. Sit the paper first if you are practising.

Paper as text
Question paper, page 1
This document consists of 15 printed pages, 1 blank page, and 1 Insert. DC (SM/CGW) 28980/5 R © UCLES 2010 [Turn over UNIVERSITY OF CAMBRIDGE INTERNATIONAL EXAMINATIONS International General Certificate of Secondary Education READ THESE INSTRUCTIONS FIRST Write your Centre number, candidate number and name on all the work you hand in. Write in dark blue or black pen. You may use a soft pencil for any diagrams, graphs or rough working. Do not use staples, paper clips, highlighters, glue or correction fluid. DO NOT WRITE ON ANY BARCODES. Answer all the questions. The Insert contains Fig. 1 for Question 1 and Figs 5, 6 and 7 for Question 2. The Insert is not required by the Examiner. Sketch maps and diagrams should be drawn whenever they serve to illustrate an answer. At the end of the examination, fasten all your work securely together. The number of marks is given in brackets [ ] at the end of each question or part question. GEOGRAPHY 0460/42 Paper 4 Alternative to Coursework May/June 2010 1 hour 30 minutes Candidates answer on the Question Paper. Additional Materials: Calculator Ruler For Examiner’s Use Q1 Q2 Total * 1 4 4 8 8 1 6 1 4 7 * www.theallpapers.com
Question paper, page 2
2 0460/42/M/J/10 © UCLES 2010 For Examiner’s Use 1 Eight students wanted to find out more about people who lived in a squatter settlement which was near to their school in a city in Uttar Pradesh, India. The squatter settlement had grown rapidly in the last ten years, both in size and in the number of inhabitants. They decided to investigate the following hypotheses: Hypothesis 1: Most people who live in the squatter settlement came to the city to look for a paid job. Hypothesis 2: Many of the people who live in the squatter settlement have paid jobs but they are poor people. The students decided that the best way to test their hypotheses was to ask some people who lived in the squatter settlement to give answers to a questionnaire. (a) Their first task was to produce their questionnaire. An example of a completed questionnaire is shown in Fig. 1 (Insert). (i) The students wanted to interview 100 people who had moved into the squatter settlement. Describe a suitable method for the students to choose people to interview. Explain why you have chosen this method. … … … … … …[2] (ii) Look at Fig. 1 (Insert). Suggest two reasons why the students gave people choices of age group to select from rather than just asking their age. 1 … … 2 … …[2] (iii) The students considered including more questions in their questionnaire, but decided not to. Suggest two appropriate questions they could have used to find out more about migration to the city. 1 … … 2 … …[2] www.theallpapers.com
Question paper, page 3
3 0460/42/M/J/10 © UCLES 2010 [Turn over For Examiner’s Use (b) Having completed their questionnaire the students produced a table of their results. Table 1 below shows a sample of the answers they obtained. Resident interviewed Age- group Gender Reason for migration Job Income (rupees) 1 15 – 30 Female Join other members of family Domestic servant Less than 20 000 2 15 – 30 Male Get a paid job Rickshaw driver 20 000 – 50 000 3 Under 15 Male Better education Student Less than 20 000 4 Over 60 Female Returning to place of birth Shop owner 20 000 – 50 000 5 31 – 60 Female Marry someone living here Housewife Less than 20 000 6 Table 1 (i) The completed questionnaire shown in Fig. 1 (Insert) is from resident number 6. Enter this data onto Table 1. [2] (ii) Each pair of students completed six questionnaires and then met with the others to check their method before doing any more questionnaires. Suggest why this meeting was a good idea. … … … …[2] www.theallpapers.com
Question paper, page 4
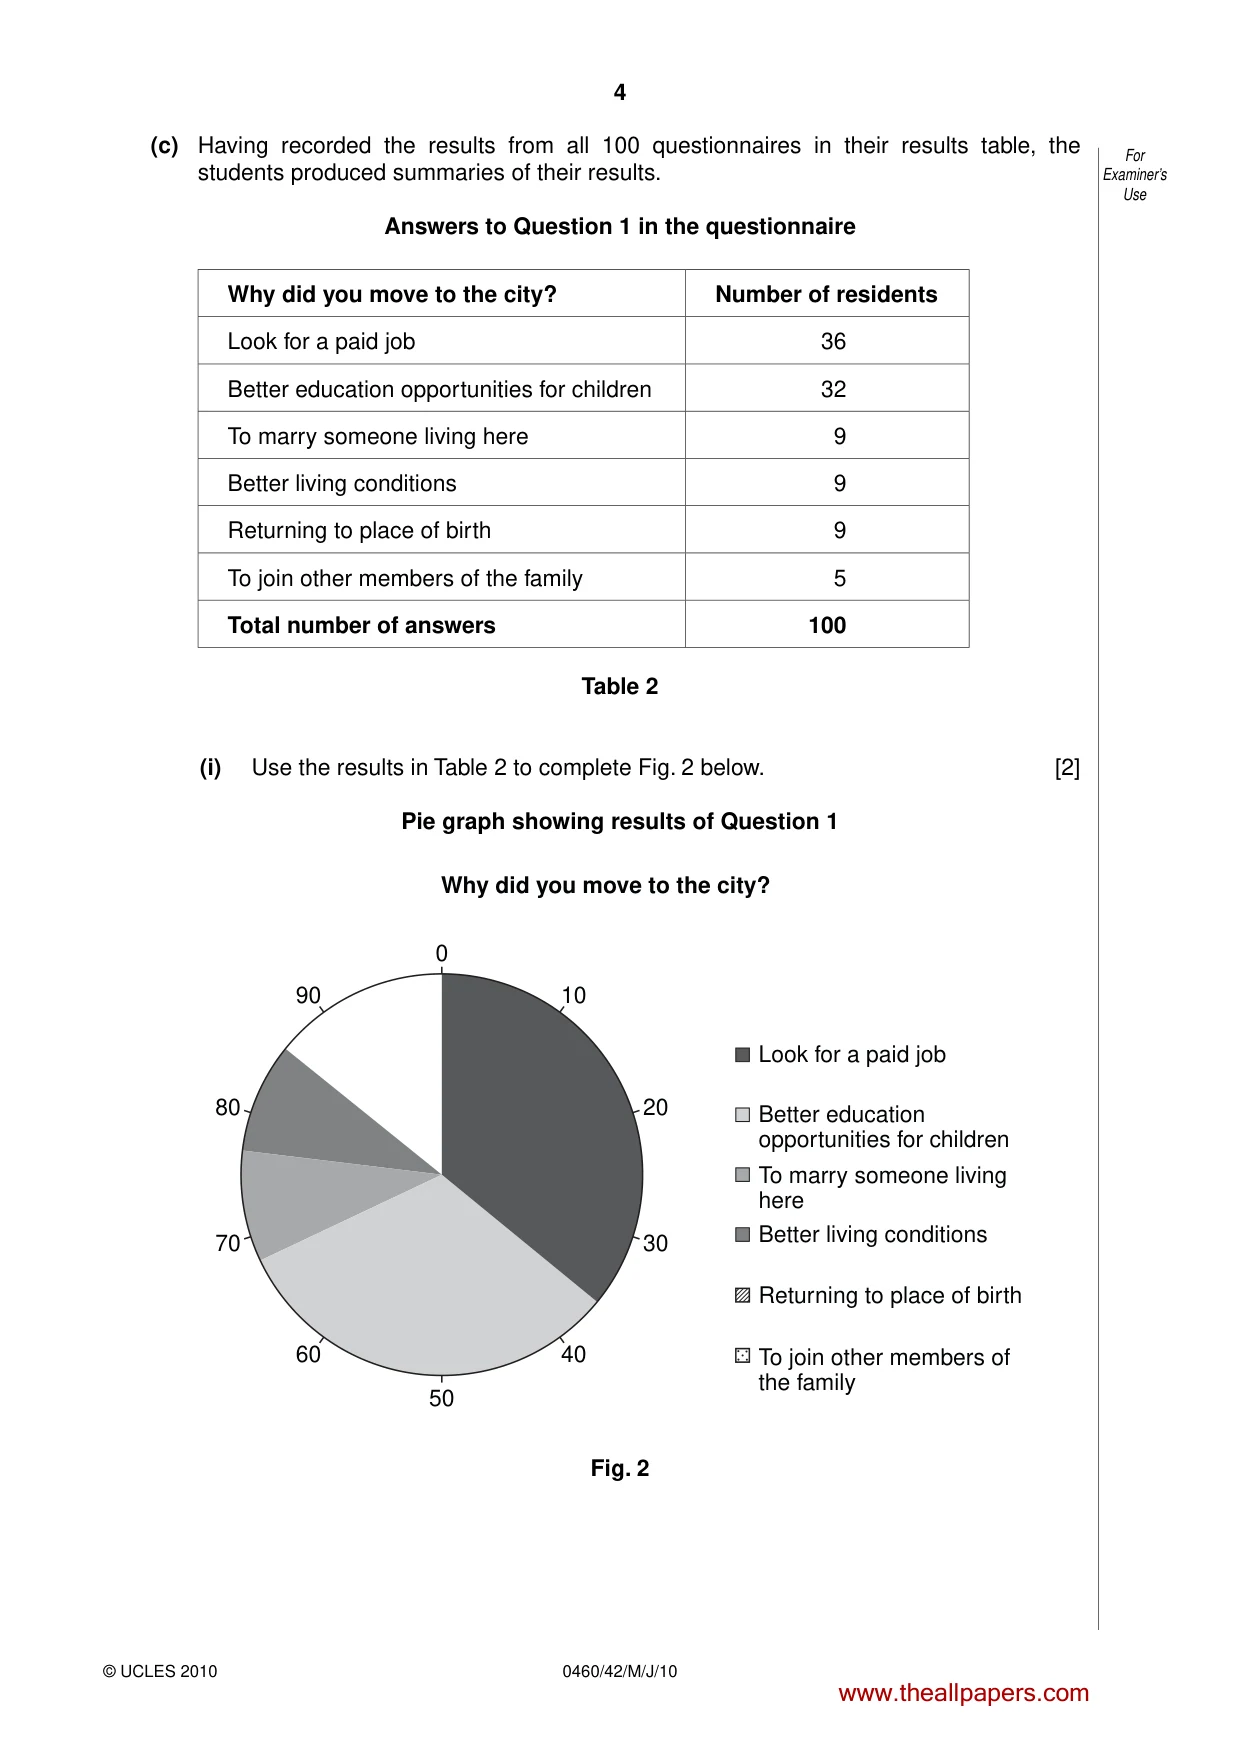
4 © UCLES 2010 For Examiner’s Use 0460/42/M/J/10 (c) Having recorded the results from all 100 questionnaires in their results table, the students produced summaries of their results. Answers to Question 1 in the questionnaire Why did you move to the city? Number of residents Look for a paid job 36 Better education opportunities for children 32 To marry someone living here 9 Better living conditions 9 Returning to place of birth 9 To join other members of the family 5 Total number of answers 100 Table 2 (i) Use the results in Table 2 to complete Fig. 2 below. [2] Pie graph showing results of Question 1 0 50 40 30 Why did you move to the city? 20 70 80 10 Look for a paid job Better education opportunities for children To marry someone living here Better living conditions To join other members of the family Returning to place of birth 60 90 Fig. 2 www.theallpapers.com
Question paper, page 5
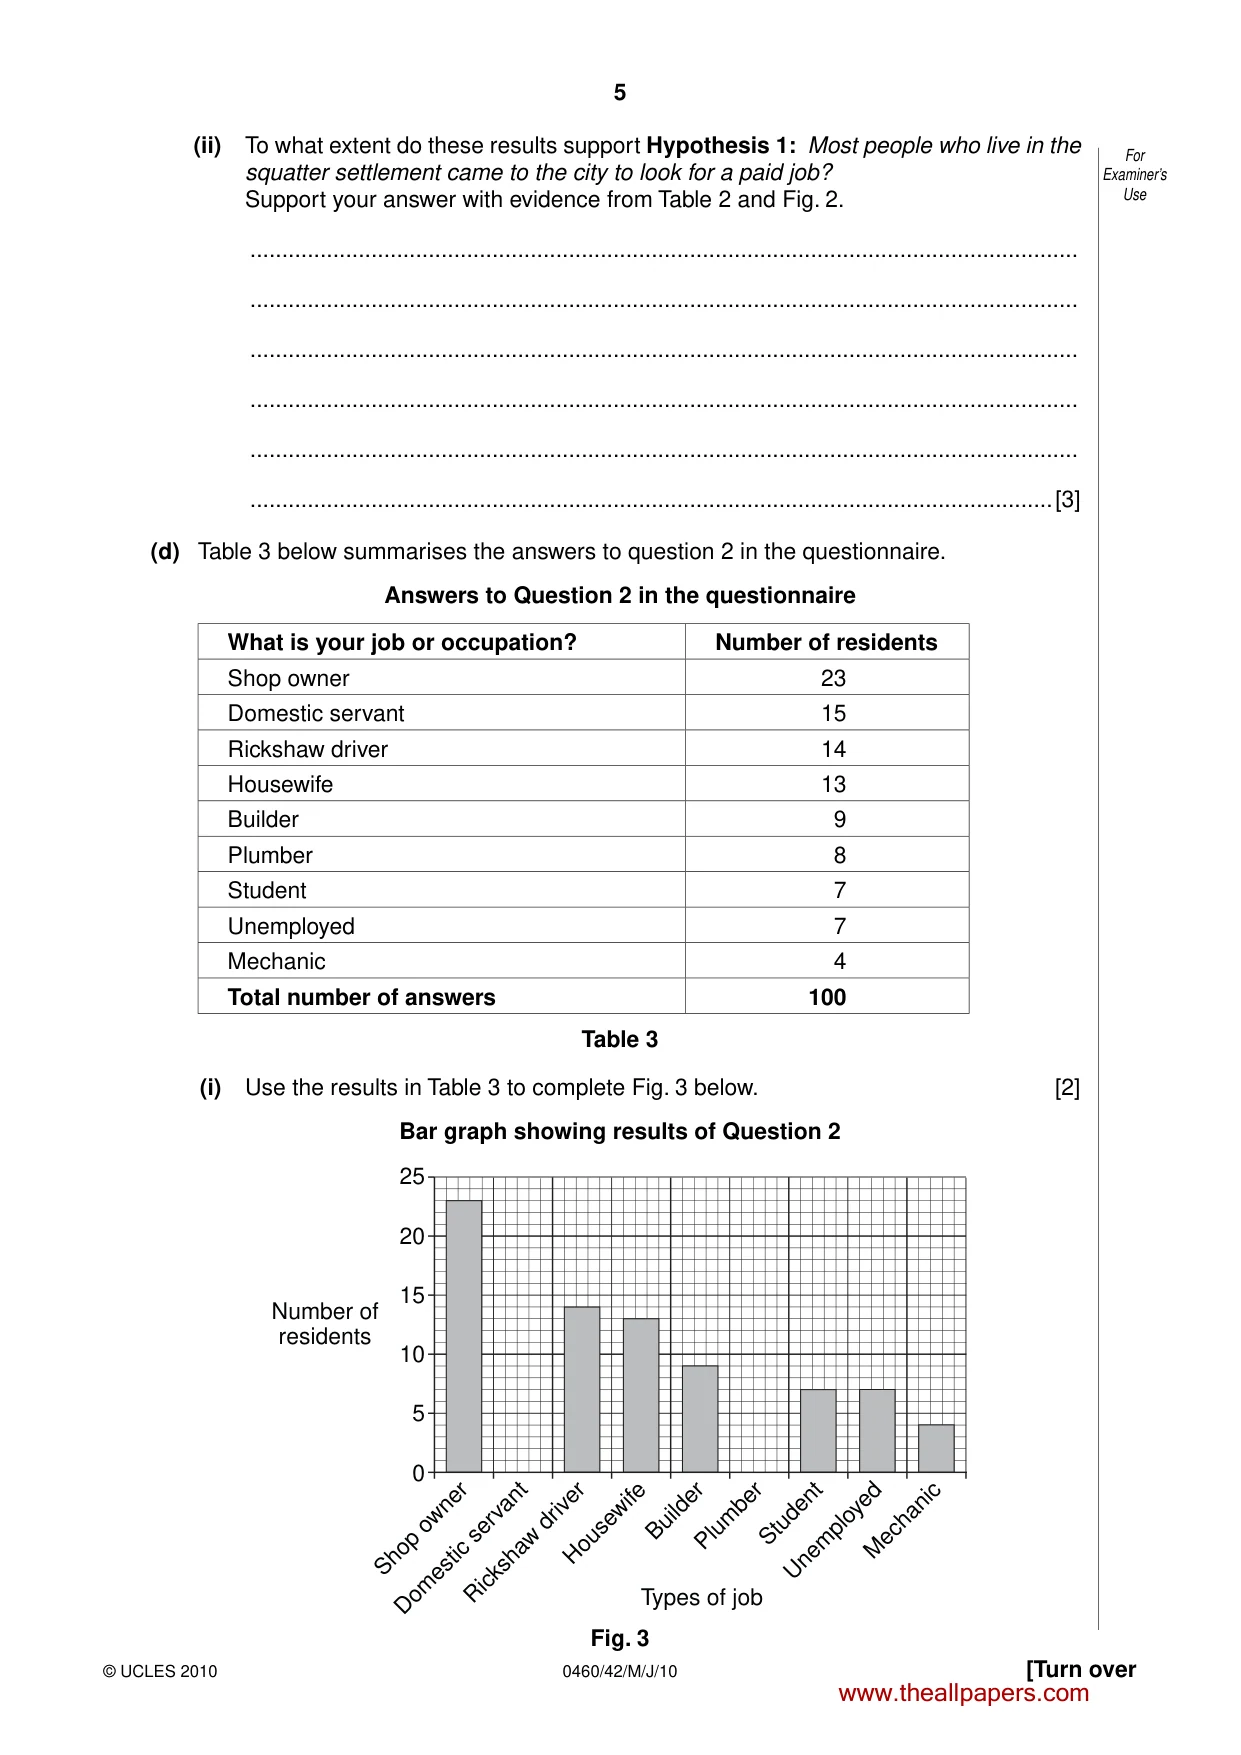
5 0460/42/M/J/10 © UCLES 2010 [Turn over For Examiner’s Use (ii) To what extent do these results support Hypothesis 1: Most people who live in the squatter settlement came to the city to look for a paid job? Support your answer with evidence from Table 2 and Fig. 2. … … … … … …[3] (d) Table 3 below summarises the answers to question 2 in the questionnaire. Answers to Question 2 in the questionnaire What is your job or occupation? Number of residents Shop owner 23 Domestic servant 15 Rickshaw driver 14 Housewife 13 Builder 9 Plumber 8 Student 7 Unemployed 7 Mechanic 4 Total number of answers 100 Table 3 (i) Use the results in Table 3 to complete Fig. 3 below. [2] Bar graph showing results of Question 2 0 Shop owner Domestic servant Rickshaw driver Housewife Builder Mechanic Plumber Student Unemployed 5 10 Number of residents Types of job 15 20 25 Fig. 3 www.theallpapers.com
Question paper, page 6
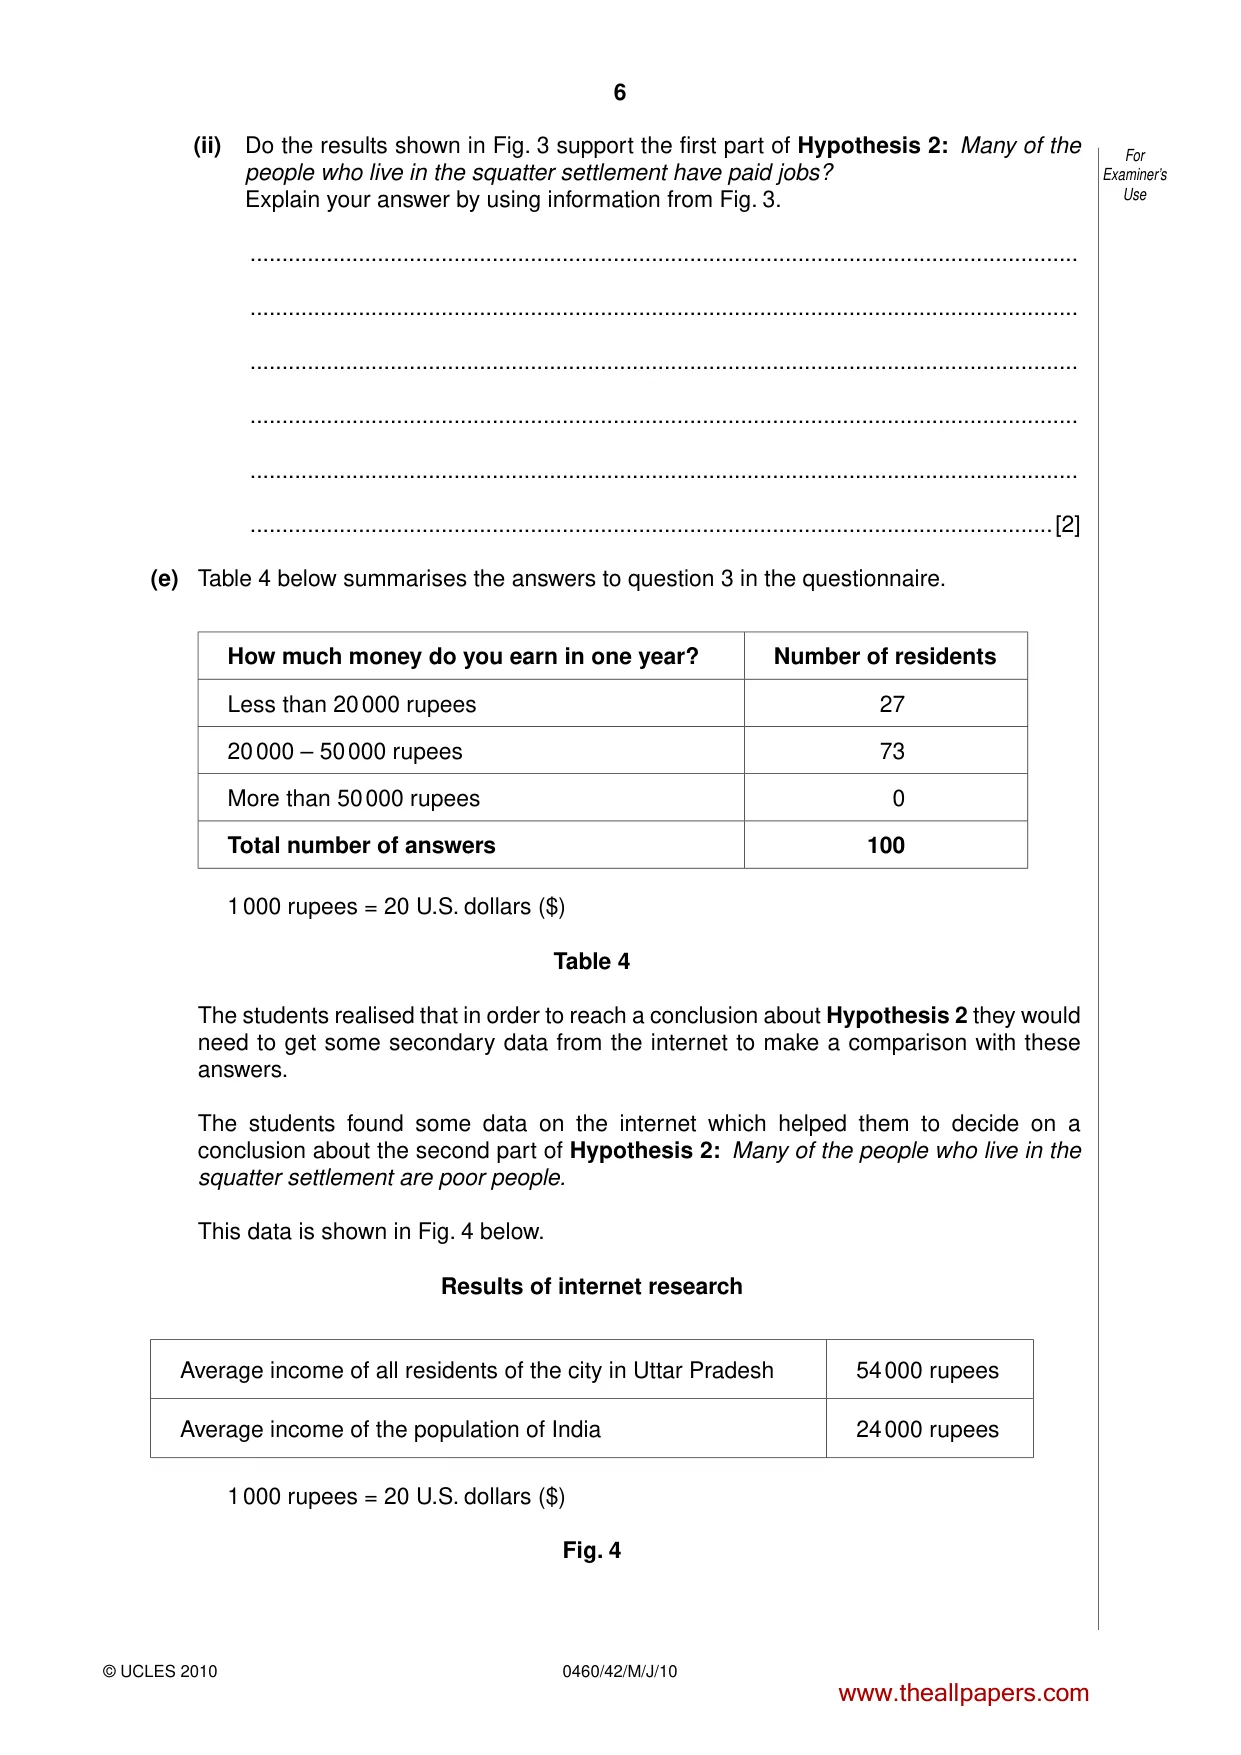
6 0460/42/M/J/10 © UCLES 2010 For Examiner’s Use (ii) Do the results shown in Fig. 3 support the first part of Hypothesis 2: Many of the people who live in the squatter settlement have paid jobs? Explain your answer by using information from Fig. 3. … … … … … …[2] (e) Table 4 below summarises the answers to question 3 in the questionnaire. How much money do you earn in one year? Number of residents Less than 20 000 rupees 27 20 000 – 50 000 rupees 73 More than 50 000 rupees 0 Total number of answers 100 1 000 rupees = 20 U.S. dollars ($) Table 4 The students realised that in order to reach a conclusion about Hypothesis 2 they would need to get some secondary data from the internet to make a comparison with these answers. The students found some data on the internet which helped them to decide on a conclusion about the second part of Hypothesis 2: Many of the people who live in the squatter settlement are poor people. This data is shown in Fig. 4 below. Results of internet research Average income of all residents of the city in Uttar Pradesh 54 000 rupees Average income of the population of India 24 000 rupees 1 000 rupees = 20 U.S. dollars ($) Fig. 4 www.theallpapers.com
Question paper, page 7
7 0460/42/M/J/10 © UCLES 2010 [Turn over For Examiner’s Use Is Hypothesis 2: Many of the people who live in the squatter settlement are poor people correct? Use information from Table 4 and Fig. 4 to explain your answer. … … … … … …[3] (f) (i) Look again at Fig. 1 (Insert). Suggest why the students included questions about age and gender. … …[1] (ii) Suggest another hypothesis which the students might have included to make use of this information. … …[1] (iii) Instead of putting the answers to question 3 into one of three categories the students could have just asked people how much money they earned in one year. What might be two disadvantages of this new question? 1 … … 2 … …[2] www.theallpapers.com
Question paper, page 8
8 0460/42/M/J/10 © UCLES 2010 For Examiner’s Use (g) Suggest one other aspect of life in a squatter settlement which students could investigate by a fieldwork technique other than a questionnaire. Describe how they could carry out this investigation. … … … … … … … …[4] [Total: 30 marks] www.theallpapers.com
Question paper, page 9
9 0460/42/M/J/10 © UCLES 2010 [Turn over For Examiner’s Use 2 A student was studying weather measurement in her lesson. She decided to do some fieldwork to measure and record rainfall and wind direction at her school. To extend her fieldwork she decided to compare her results with measurements recorded at the local airport, about 45 km away from school. The locations of the school and airport are shown in Fig. 5 (Insert). The student decided to investigate the following hypotheses: Hypothesis 1: Rainfall is greater when the wind is blowing from the south. Hypothesis 2: Rainfall is greater at the airport than at the school. (a) The student decided to take weather readings at 09.00 every day for two weeks. (i) Why did she want to take readings at the same time each day? … …[1] (ii) Suggest one possible problem of keeping to her schedule. … …[1] (b) To investigate Hypothesis 1 the student used a rain gauge and a wind vane. (i) She took daily readings of the amount of rain which had fallen. Fig. 6 (Insert) shows the rain gauge which she used. Explain how she used it. … … … … … …[3] (ii) Suggest two factors which the student should have considered when deciding where to position the rain gauge. 1 … … 2 … …[2] www.theallpapers.com
Question paper, page 10
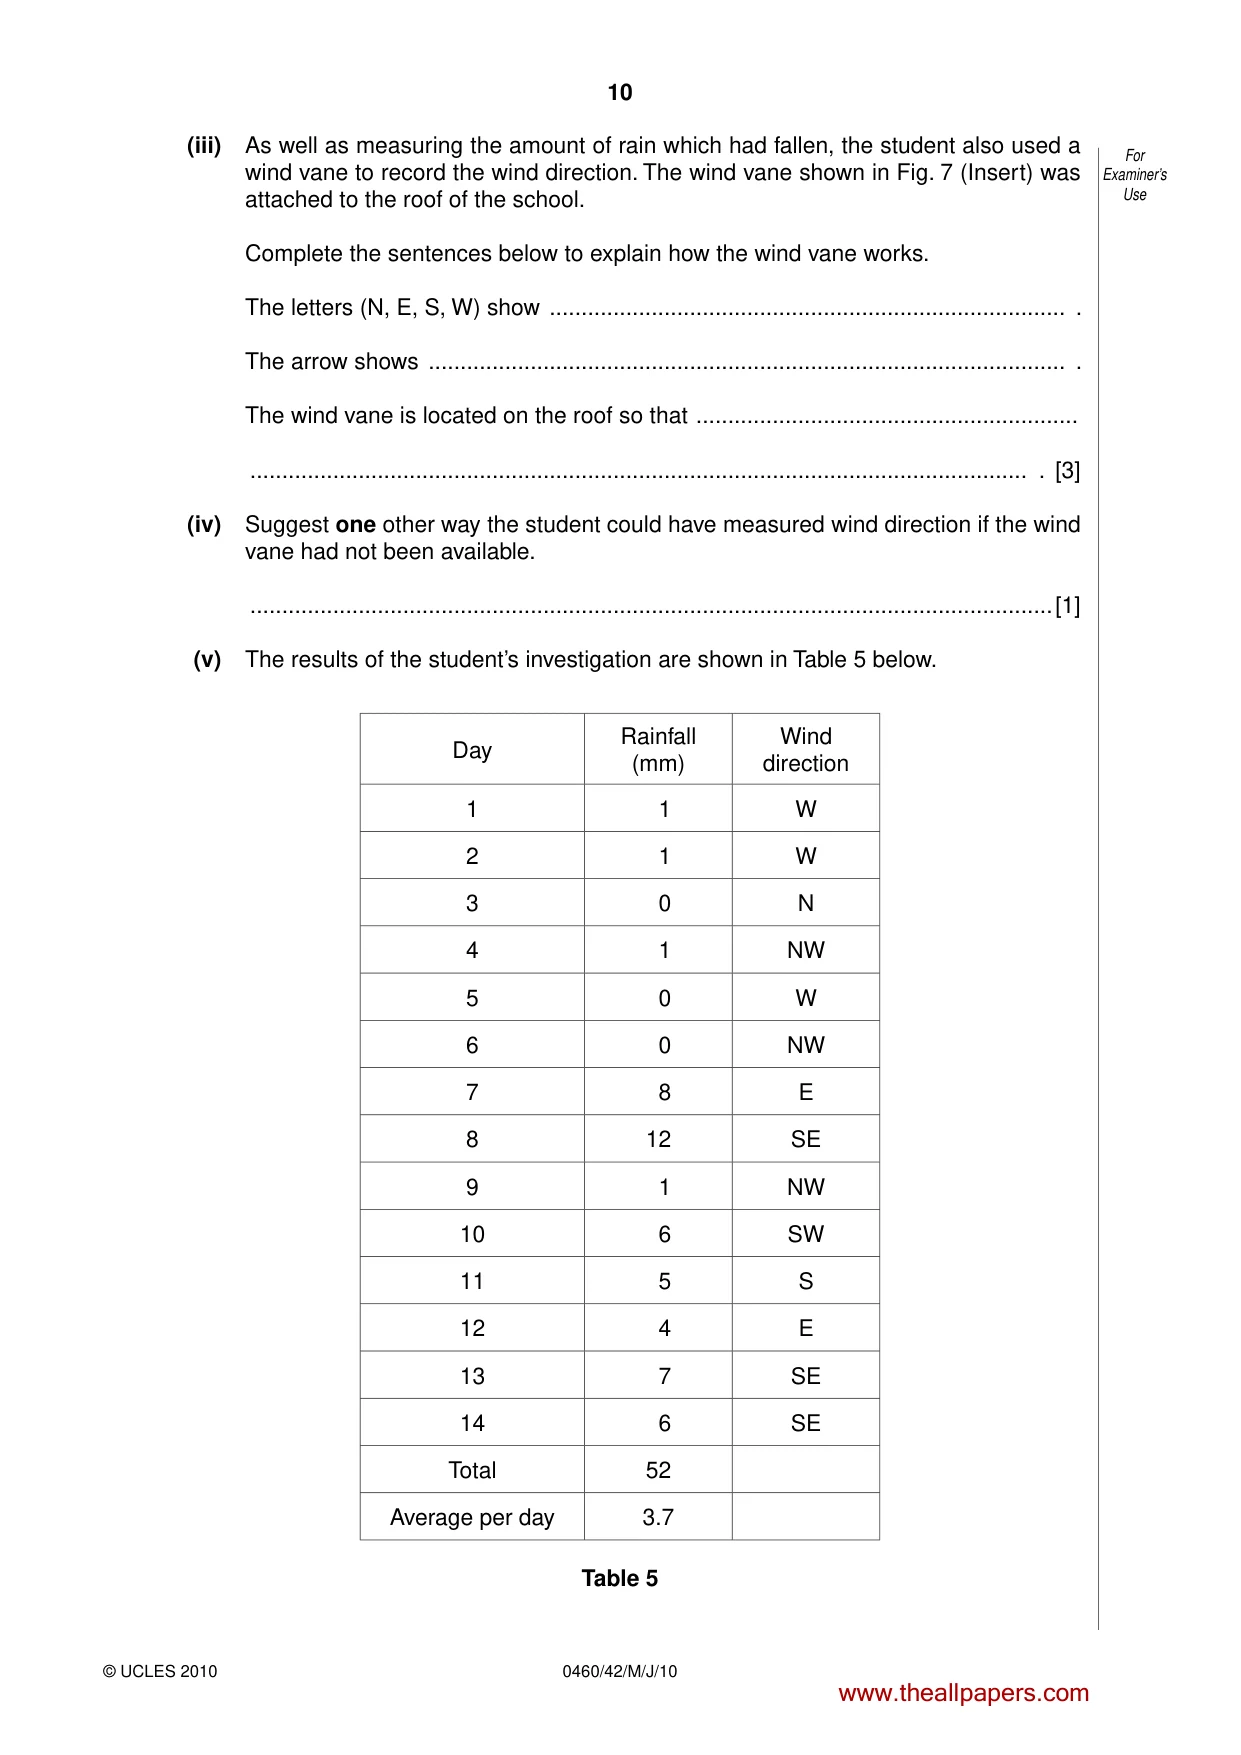
10 0460/42/M/J/10 © UCLES 2010 For Examiner’s Use (iii) As well as measuring the amount of rain which had fallen, the student also used a wind vane to record the wind direction. The wind vane shown in Fig. 7 (Insert) was attached to the roof of the school. Complete the sentences below to explain how the wind vane works. The letters (N, E, S, W) show … . The arrow shows … . The wind vane is located on the roof so that … … . [3] (iv) Suggest one other way the student could have measured wind direction if the wind vane had not been available. …[1] (v) The results of the student’s investigation are shown in Table 5 below. Day Rainfall (mm) Wind direction 1 1 W 2 1 W 3 0 N 4 1 NW 5 0 W 6 0 NW 7 8 E 8 12 SE 9 1 NW 10 6 SW 11 5 S 12 4 E 13 7 SE 14 6 SE Total 52 Average per day 3.7 Table 5 www.theallpapers.com
Question paper, page 11
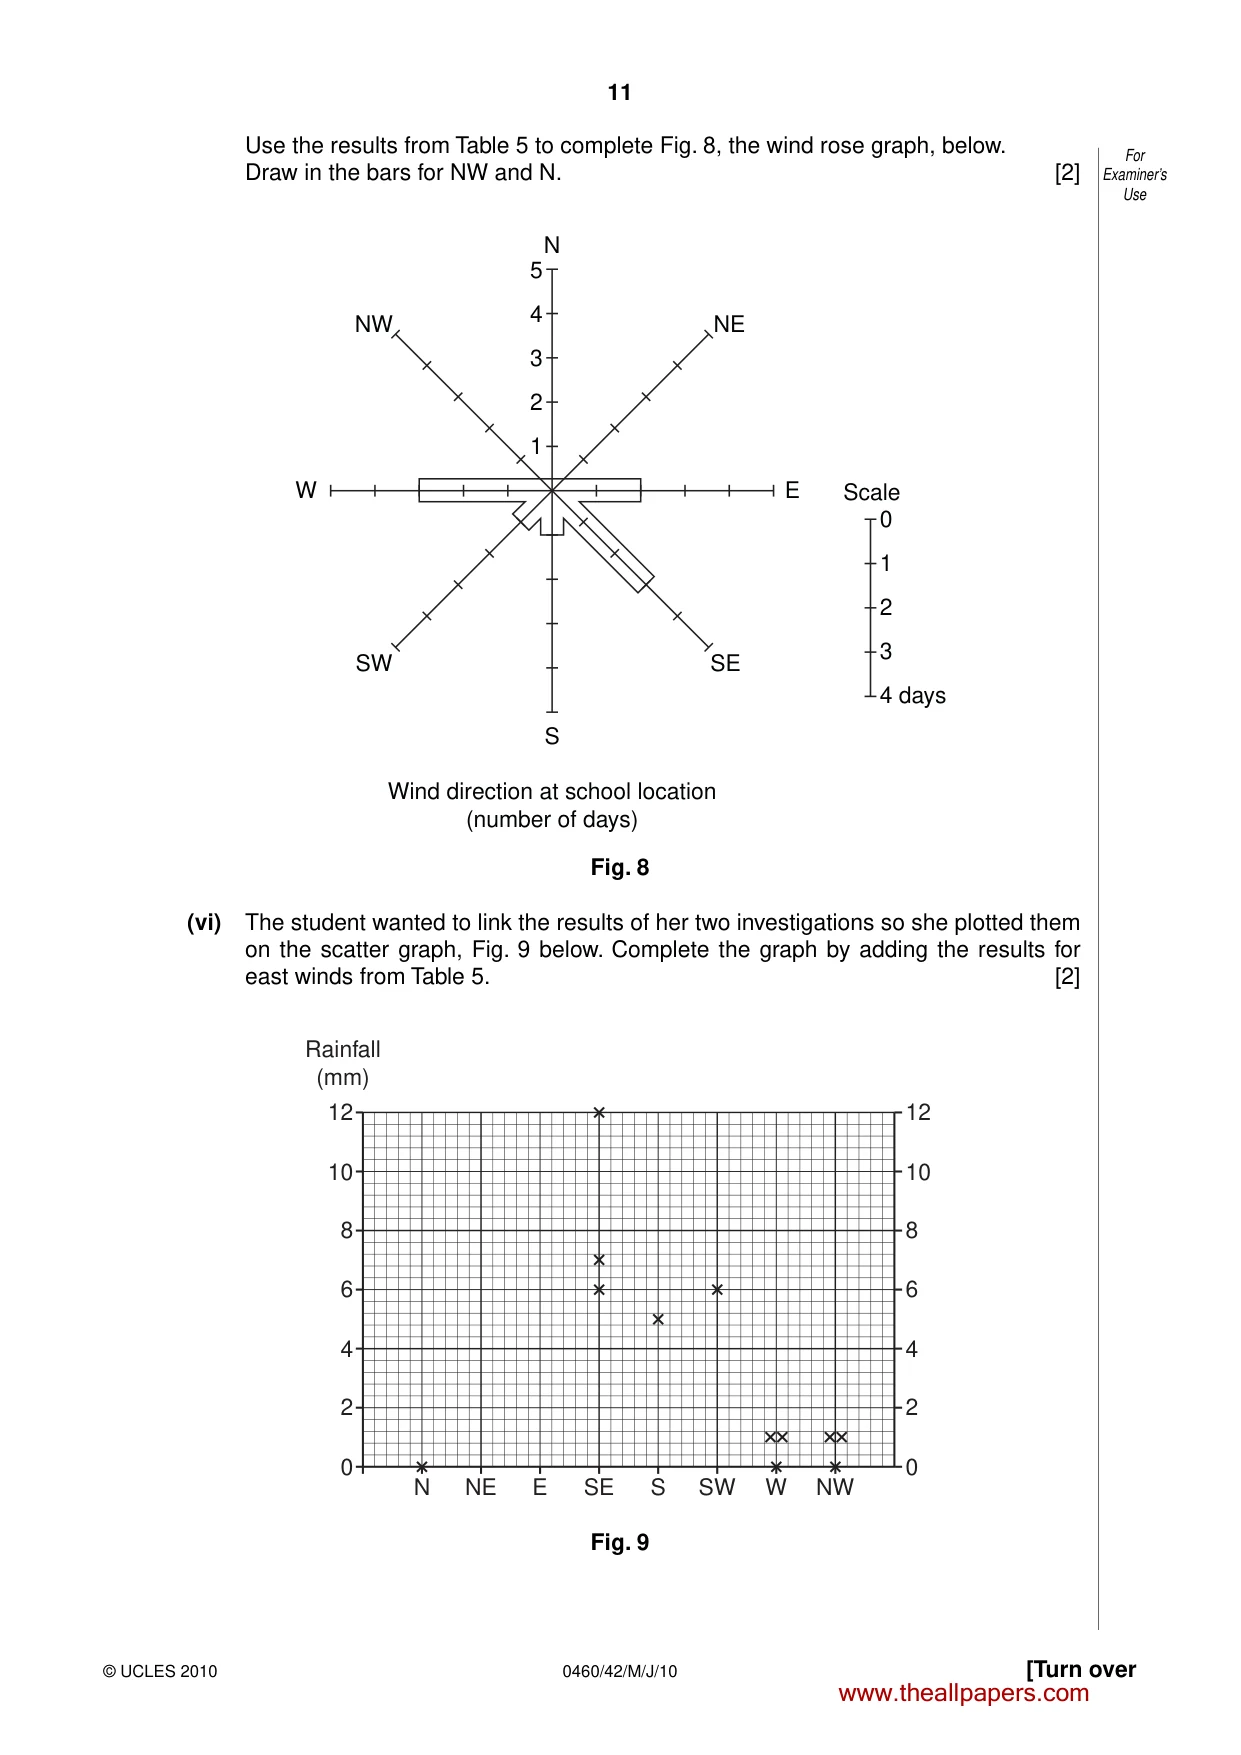
11 0460/42/M/J/10 © UCLES 2010 [Turn over For Examiner’s Use Use the results from Table 5 to complete Fig. 8, the wind rose graph, below. Draw in the bars for NW and N. [2] N 5 4 3 2 1 0 Scale 1 2 3 4 days S Wind direction at school location (number of days) E W NW NE SW SE Fig. 8 (vi) The student wanted to link the results of her two investigations so she plotted them on the scatter graph, Fig. 9 below. Complete the graph by adding the results for east winds from Table 5. [2] 0 2 4 N NE E SE S SW W NW 6 8 10 12 0 2 4 6 8 10 12 Rainfall (mm) Fig. 9 www.theallpapers.com
Question paper, page 12
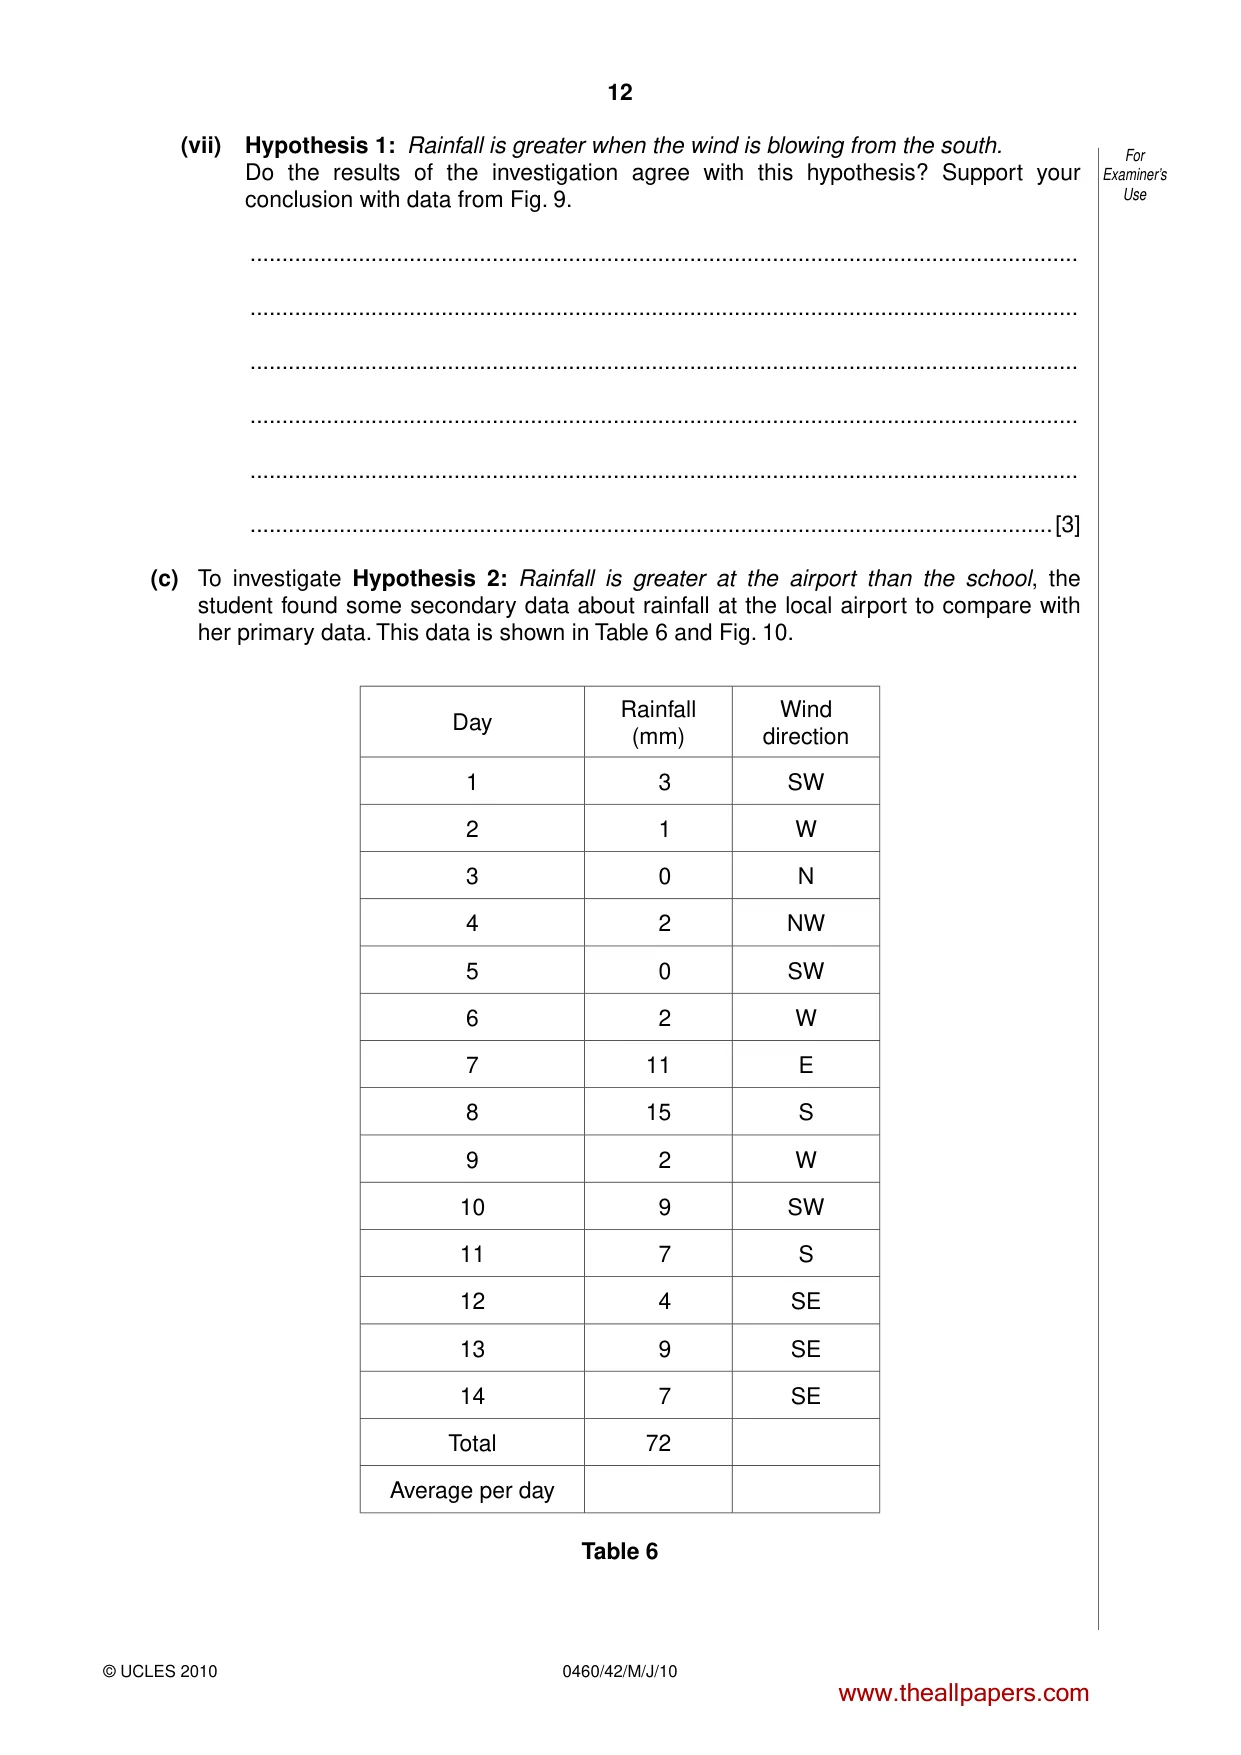
12 0460/42/M/J/10 © UCLES 2010 For Examiner’s Use (vii) Hypothesis 1: Rainfall is greater when the wind is blowing from the south. Do the results of the investigation agree with this hypothesis? Support your conclusion with data from Fig. 9. … … … … … …[3] (c) To investigate Hypothesis 2: Rainfall is greater at the airport than the school, the student found some secondary data about rainfall at the local airport to compare with her primary data. This data is shown in Table 6 and Fig. 10. Day Rainfall (mm) Wind direction 1 3 SW 2 1 W 3 0 N 4 2 NW 5 0 SW 6 2 W 7 11 E 8 15 S 9 2 W 10 9 SW 11 7 S 12 4 SE 13 9 SE 14 7 SE Total 72 Average per day Table 6 www.theallpapers.com
Question paper, page 13
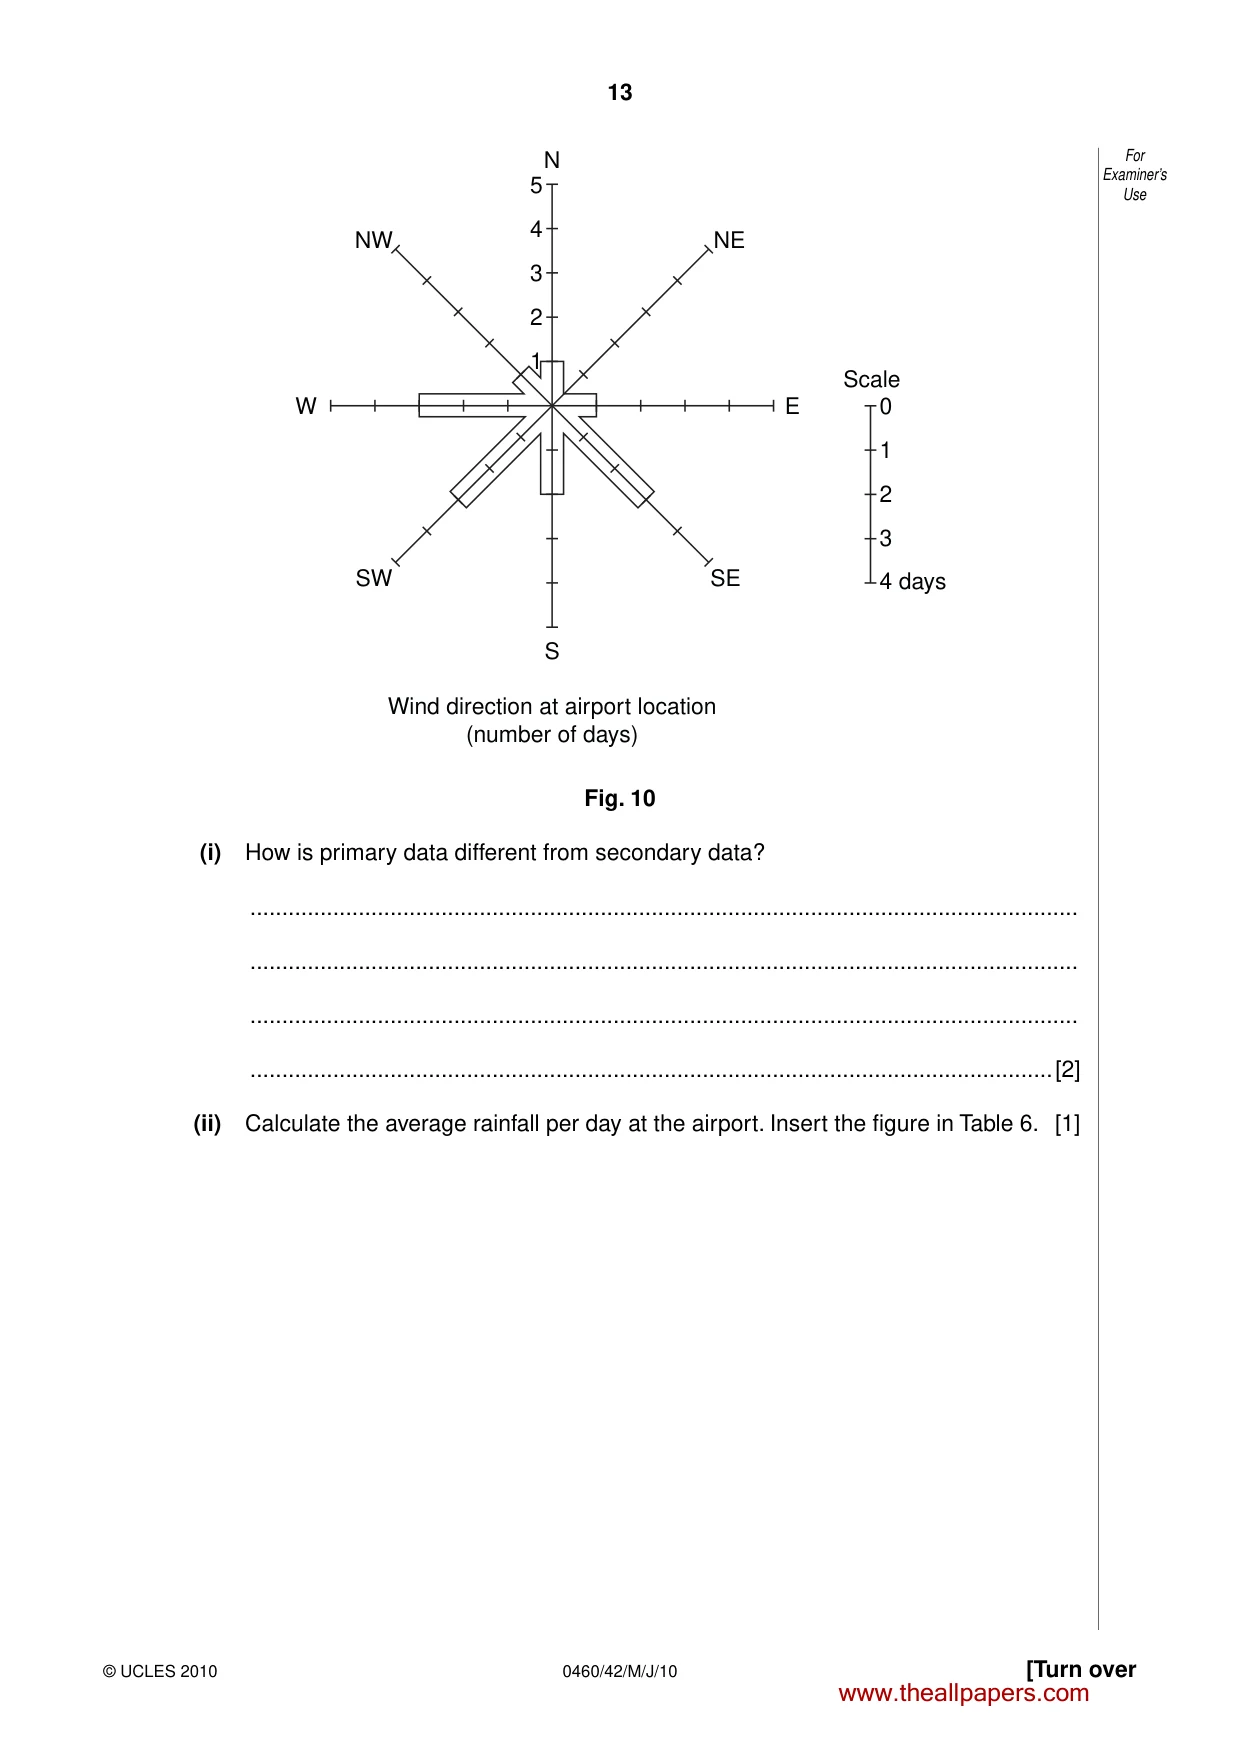
13 0460/42/M/J/10 © UCLES 2010 [Turn over For Examiner’s Use N 5 4 3 2 1 0 Scale 1 2 3 4 days S Wind direction at airport location (number of days) E W NW NE SW SE Fig. 10 (i) How is primary data different from secondary data? … … … …[2] (ii) Calculate the average rainfall per day at the airport. Insert the figure in Table 6. [1] www.theallpapers.com
Question paper, page 14
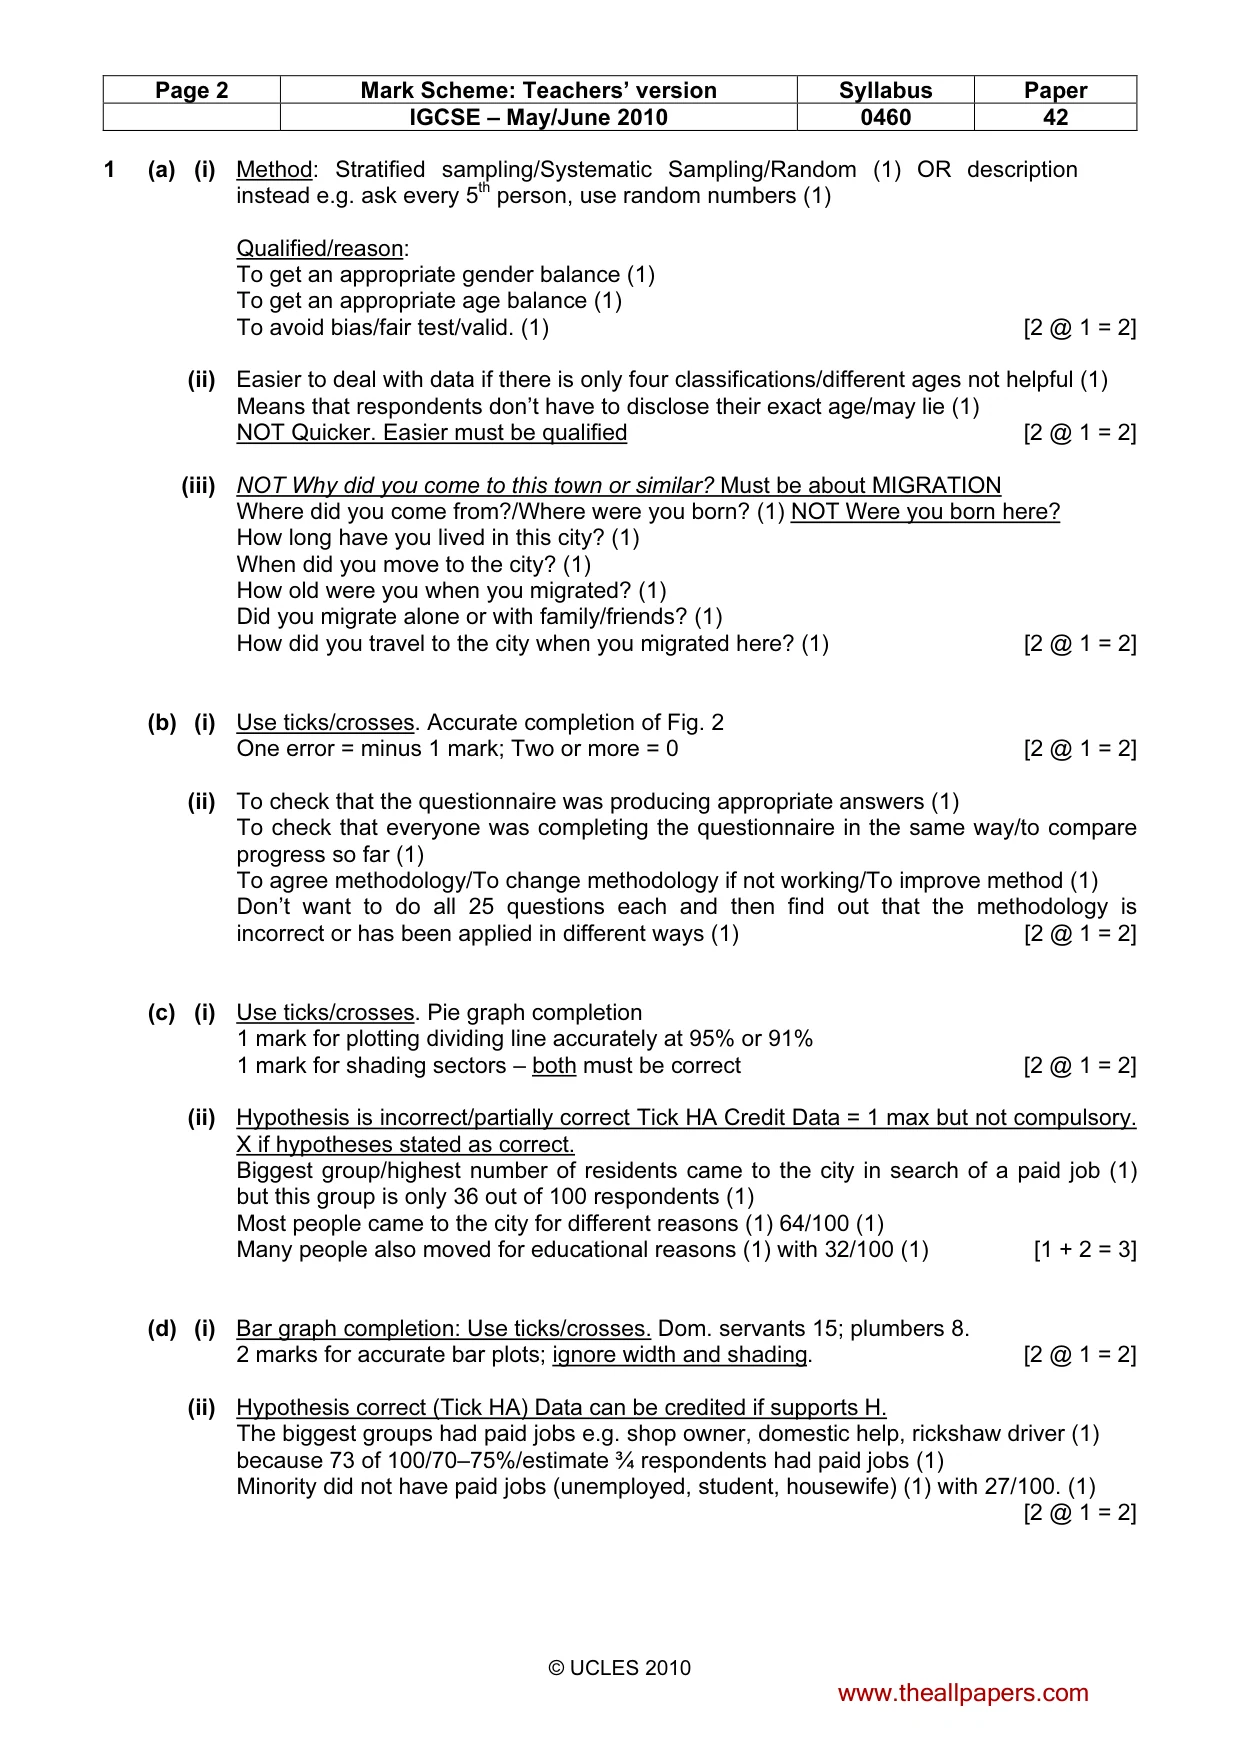
14 0460/42/M/J/10 © UCLES 2010 For Examiner’s Use (iii) In order to compare the amount of rainfall at school and the airport, the student plotted the dispersion graph shown in Fig. 11, below. 0 2 4 6 8 10 12 16 14 0 2 0 1 2 3 4 4 3 2 1 4 6 8 10 12 16 14 Daily rainfall (mm) Daily rainfall (mm) School Number of days Number of days Airport Fig. 11 Complete the dispersion graph for day 13 at the airport by using rainfall data from Table 6. [1] (iv) Use Fig. 11 to describe two differences between the rainfall patterns at the school and the airport. 1 … … 2 … …[2] www.theallpapers.com
Question paper, page 15
15 0460/42/M/J/10 © UCLES 2010 For Examiner’s Use (v) The student reached the conclusion that Hypothesis 2 is correct: Rainfall is greater at the airport than at the school. Suggest why rainfall is greater at the airport. Use Fig. 5 (Insert) and Figs. 8 and 10 to help you to answer. … … … … … …[3] (d) When the student had completed her tasks she wondered how she could improve the reliability of her results. Suggest some ways she could improve the reliability of her results. … … … … … …[3] [Total: 30 marks] www.theallpapers.com
Question paper, page 16
16 0460/42/M/J/10 © UCLES 2010 BLANK PAGE Permission to reproduce items where third-party owned material protected by copyright is included has been sought and cleared where possible. Every reasonable effort has been made by the publisher (UCLES) to trace copyright holders, but if any items requiring clearance have unwittingly been included, the publisher will be pleased to make amends at the earliest possible opportunity. University of Cambridge International Examinations is part of the Cambridge Assessment Group. Cambridge Assessment is the brand name of University of Cambridge Local Examinations Syndicate (UCLES), which is itself a department of the University of Cambridge. www.theallpapers.com
Mark scheme, page 1
UNIVERSITY OF CAMBRIDGE INTERNATIONAL EXAMINATIONS International General Certificate of Secondary Education MARK SCHEME for the May/June 2010 question paper for the guidance of teachers 0460 GEOGRAPHY 0460/42 Paper 42 (Alternative to Coursework), maximum raw mark 60 This mark scheme is published as an aid to teachers and candidates, to indicate the requirements of the examination. It shows the basis on which Examiners were instructed to award marks. It does not indicate the details of the discussions that took place at an Examiners’ meeting before marking began, which would have considered the acceptability of alternative answers. Mark schemes must be read in conjunction with the question papers and the report on the examination. • CIE will not enter into discussions or correspondence in connection with these mark schemes. CIE is publishing the mark schemes for the May/June 2010 question papers for most IGCSE, GCE Advanced Level and Advanced Subsidiary Level syllabuses and some Ordinary Level syllabuses. www.theallpapers.com
Mark scheme, page 2
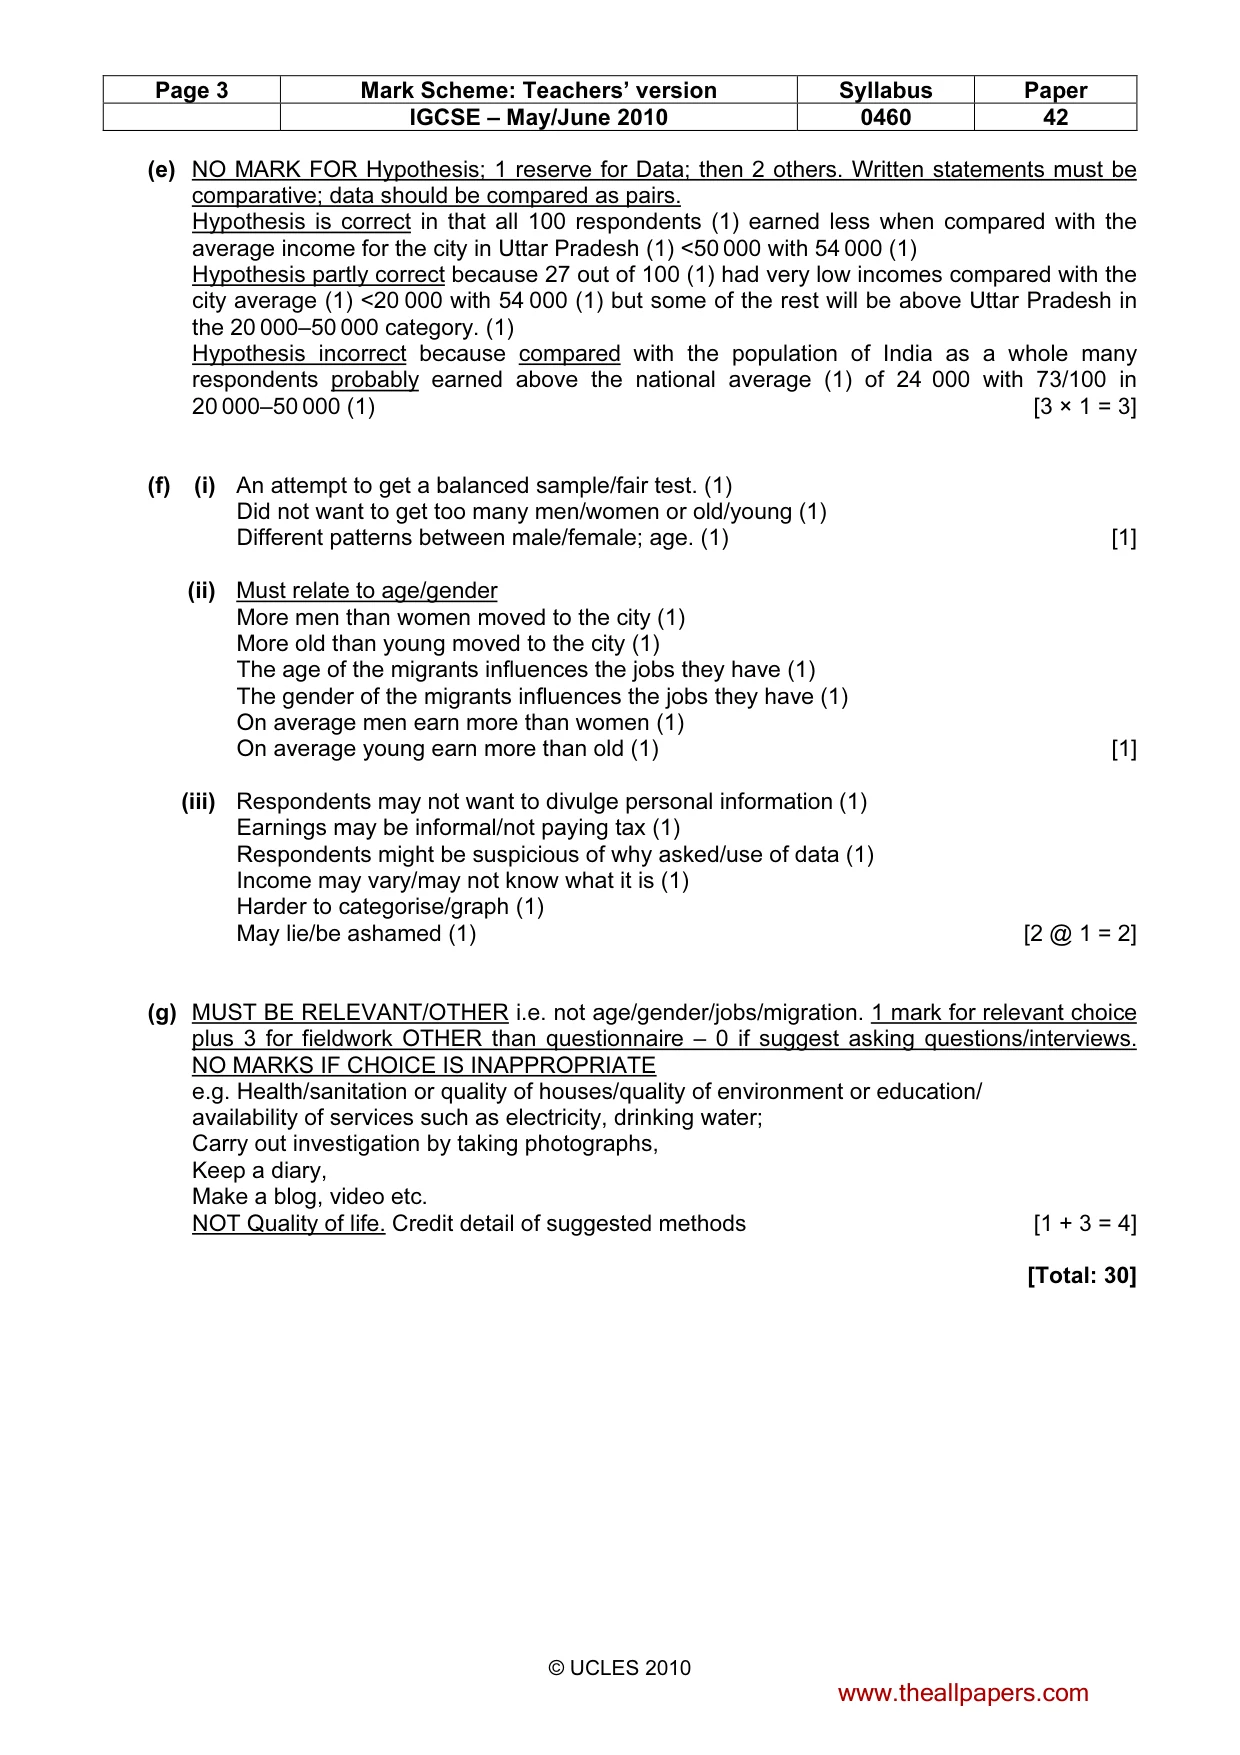
Page 2 Mark Scheme: Teachers’ version Syllabus Paper IGCSE – May/June 2010 0460 42 © UCLES 2010 1 (a) (i) Method: Stratified sampling/Systematic Sampling/Random (1) OR description instead e.g. ask every 5th person, use random numbers (1) Qualified/reason: To get an appropriate gender balance (1) To get an appropriate age balance (1) To avoid bias/fair test/valid. (1) [2 @ 1 = 2] (ii) Easier to deal with data if there is only four classifications/different ages not helpful (1) Means that respondents don’t have to disclose their exact age/may lie (1) NOT Quicker. Easier must be qualified [2 @ 1 = 2] (iii) NOT Why did you come to this town or similar? Must be about MIGRATION Where did you come from?/Where were you born? (1) NOT Were you born here? How long have you lived in this city? (1) When did you move to the city? (1) How old were you when you migrated? (1) Did you migrate alone or with family/friends? (1) How did you travel to the city when you migrated here? (1) [2 @ 1 = 2] (b) (i) Use ticks/crosses. Accurate completion of Fig. 2 One error = minus 1 mark; Two or more = 0 [2 @ 1 = 2] (ii) To check that the questionnaire was producing appropriate answers (1) To check that everyone was completing the questionnaire in the same way/to compare progress so far (1) To agree methodology/To change methodology if not working/To improve method (1) Don’t want to do all 25 questions each and then find out that the methodology is incorrect or has been applied in different ways (1) [2 @ 1 = 2] (c) (i) Use ticks/crosses. Pie graph completion 1 mark for plotting dividing line accurately at 95% or 91% 1 mark for shading sectors – both must be correct [2 @ 1 = 2] (ii) Hypothesis is incorrect/partially correct Tick HA Credit Data = 1 max but not compulsory. X if hypotheses stated as correct. Biggest group/highest number of residents came to the city in search of a paid job (1) but this group is only 36 out of 100 respondents (1) Most people came to the city for different reasons (1) 64/100 (1) Many people also moved for educational reasons (1) with 32/100 (1) [1 + 2 = 3] (d) (i) Bar graph completion: Use ticks/crosses. Dom. servants 15; plumbers 8. 2 marks for accurate bar plots; ignore width and shading. [2 @ 1 = 2] (ii) Hypothesis correct (Tick HA) Data can be credited if supports H. The biggest groups had paid jobs e.g. shop owner, domestic help, rickshaw driver (1) because 73 of 100/70–75%/estimate ¾ respondents had paid jobs (1) Minority did not have paid jobs (unemployed, student, housewife) (1) with 27/100. (1) [2 @ 1 = 2] www.theallpapers.com
Mark scheme, page 3
Page 3 Mark Scheme: Teachers’ version Syllabus Paper IGCSE – May/June 2010 0460 42 © UCLES 2010 (e) NO MARK FOR Hypothesis; 1 reserve for Data; then 2 others. Written statements must be comparative; data should be compared as pairs. Hypothesis is correct in that all 100 respondents (1) earned less when compared with the average income for the city in Uttar Pradesh (1) <50 000 with 54 000 (1) Hypothesis partly correct because 27 out of 100 (1) had very low incomes compared with the city average (1) <20 000 with 54 000 (1) but some of the rest will be above Uttar Pradesh in the 20 000–50 000 category. (1) Hypothesis incorrect because compared with the population of India as a whole many respondents probably earned above the national average (1) of 24 000 with 73/100 in 20 000–50 000 (1) [3 × 1 = 3] (f) (i) An attempt to get a balanced sample/fair test. (1) Did not want to get too many men/women or old/young (1) Different patterns between male/female; age. (1) [1] (ii) Must relate to age/gender More men than women moved to the city (1) More old than young moved to the city (1) The age of the migrants influences the jobs they have (1) The gender of the migrants influences the jobs they have (1) On average men earn more than women (1) On average young earn more than old (1) [1] (iii) Respondents may not want to divulge personal information (1) Earnings may be informal/not paying tax (1) Respondents might be suspicious of why asked/use of data (1) Income may vary/may not know what it is (1) Harder to categorise/graph (1) May lie/be ashamed (1) [2 @ 1 = 2] (g) MUST BE RELEVANT/OTHER i.e. not age/gender/jobs/migration. 1 mark for relevant choice plus 3 for fieldwork OTHER than questionnaire – 0 if suggest asking questions/interviews. NO MARKS IF CHOICE IS INAPPROPRIATE e.g. Health/sanitation or quality of houses/quality of environment or education/ availability of services such as electricity, drinking water; Carry out investigation by taking photographs, Keep a diary, Make a blog, video etc. NOT Quality of life. Credit detail of suggested methods [1 + 3 = 4] [Total: 30] www.theallpapers.com
Mark scheme, page 4
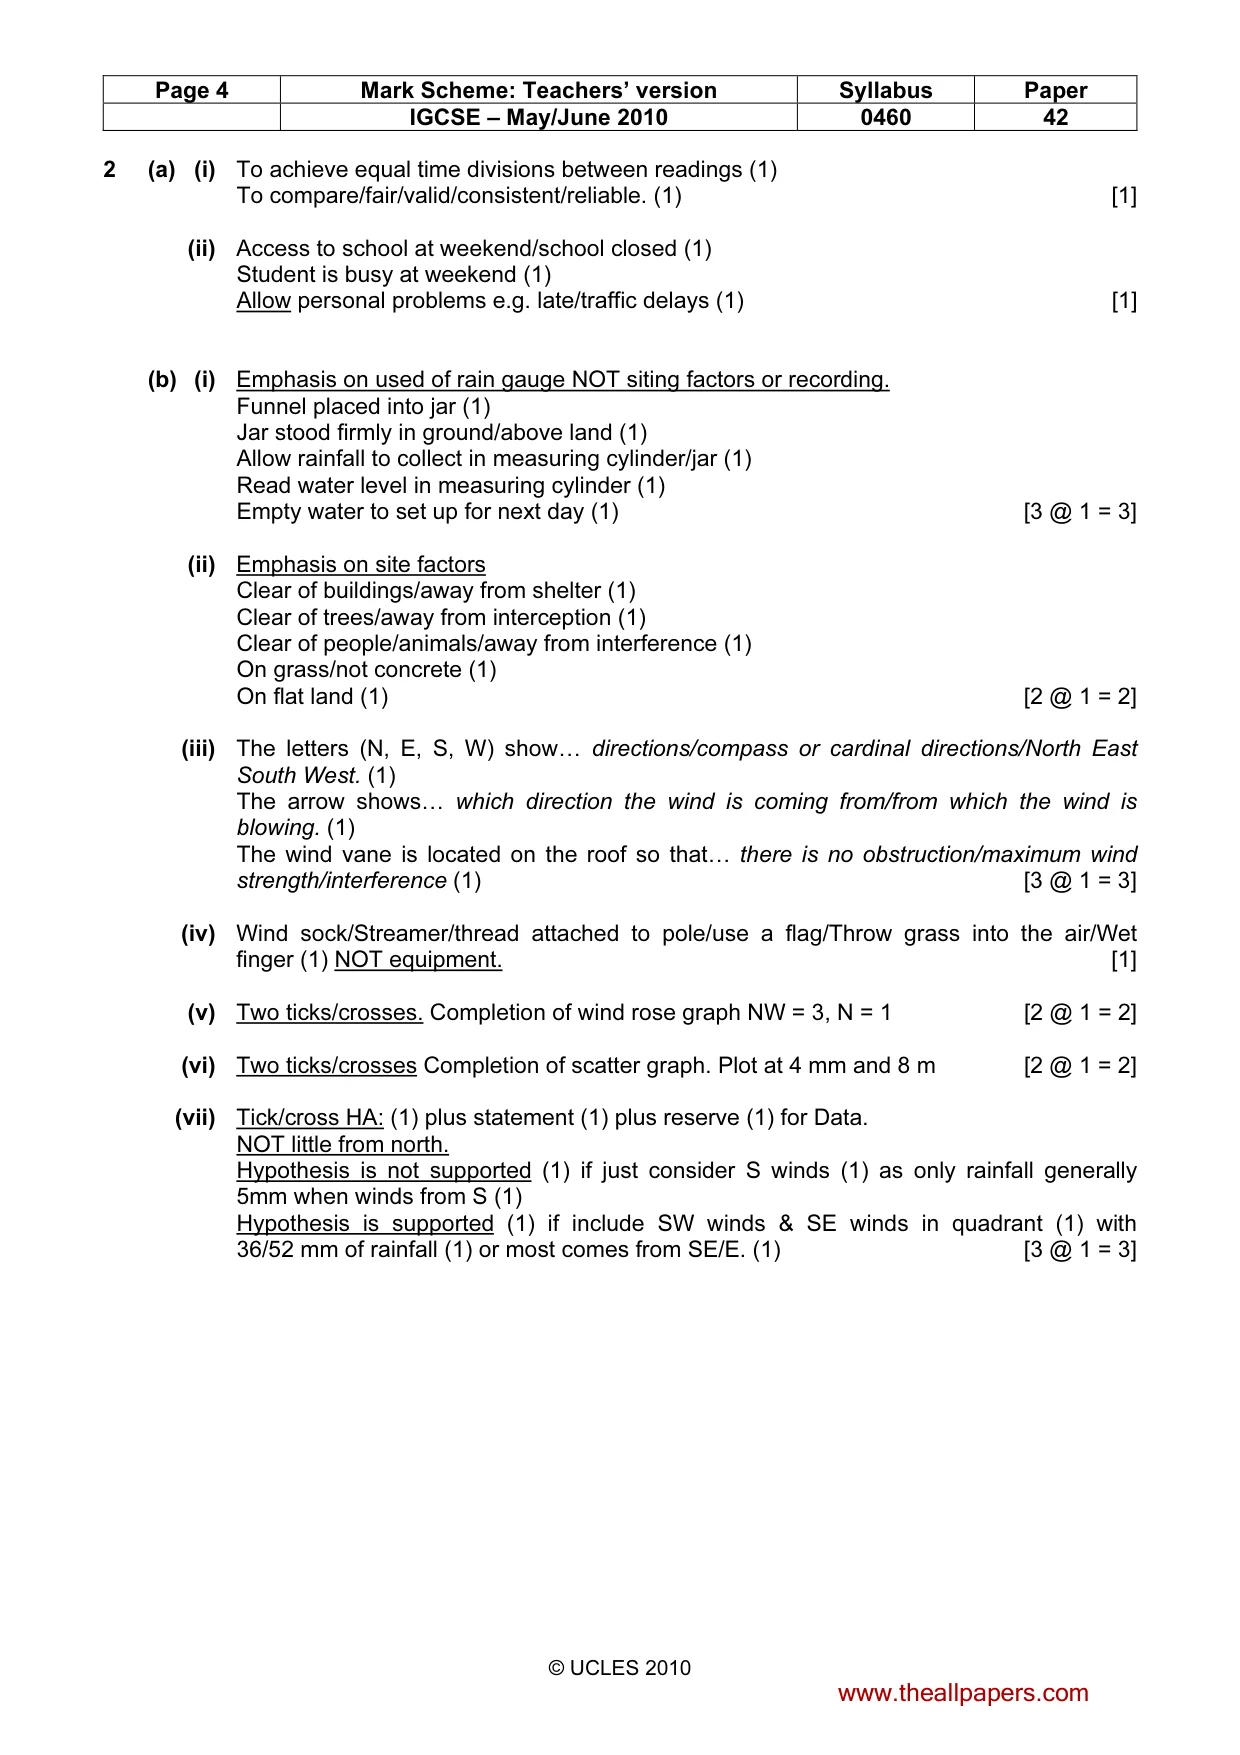
Page 4 Mark Scheme: Teachers’ version Syllabus Paper IGCSE – May/June 2010 0460 42 © UCLES 2010 2 (a) (i) To achieve equal time divisions between readings (1) To compare/fair/valid/consistent/reliable. (1) [1] (ii) Access to school at weekend/school closed (1) Student is busy at weekend (1) Allow personal problems e.g. late/traffic delays (1) [1] (b) (i) Emphasis on used of rain gauge NOT siting factors or recording. Funnel placed into jar (1) Jar stood firmly in ground/above land (1) Allow rainfall to collect in measuring cylinder/jar (1) Read water level in measuring cylinder (1) Empty water to set up for next day (1) [3 @ 1 = 3] (ii) Emphasis on site factors Clear of buildings/away from shelter (1) Clear of trees/away from interception (1) Clear of people/animals/away from interference (1) On grass/not concrete (1) On flat land (1) [2 @ 1 = 2] (iii) The letters (N, E, S, W) show… directions/compass or cardinal directions/North East South West. (1) The arrow shows… which direction the wind is coming from/from which the wind is blowing. (1) The wind vane is located on the roof so that… there is no obstruction/maximum wind strength/interference (1) [3 @ 1 = 3] (iv) Wind sock/Streamer/thread attached to pole/use a flag/Throw grass into the air/Wet finger (1) NOT equipment. [1] (v) Two ticks/crosses. Completion of wind rose graph NW = 3, N = 1 [2 @ 1 = 2] (vi) Two ticks/crosses Completion of scatter graph. Plot at 4 mm and 8 m [2 @ 1 = 2] (vii) Tick/cross HA: (1) plus statement (1) plus reserve (1) for Data. NOT little from north. Hypothesis is not supported (1) if just consider S winds (1) as only rainfall generally 5mm when winds from S (1) Hypothesis is supported (1) if include SW winds & SE winds in quadrant (1) with 36/52 mm of rainfall (1) or most comes from SE/E. (1) [3 @ 1 = 3] www.theallpapers.com
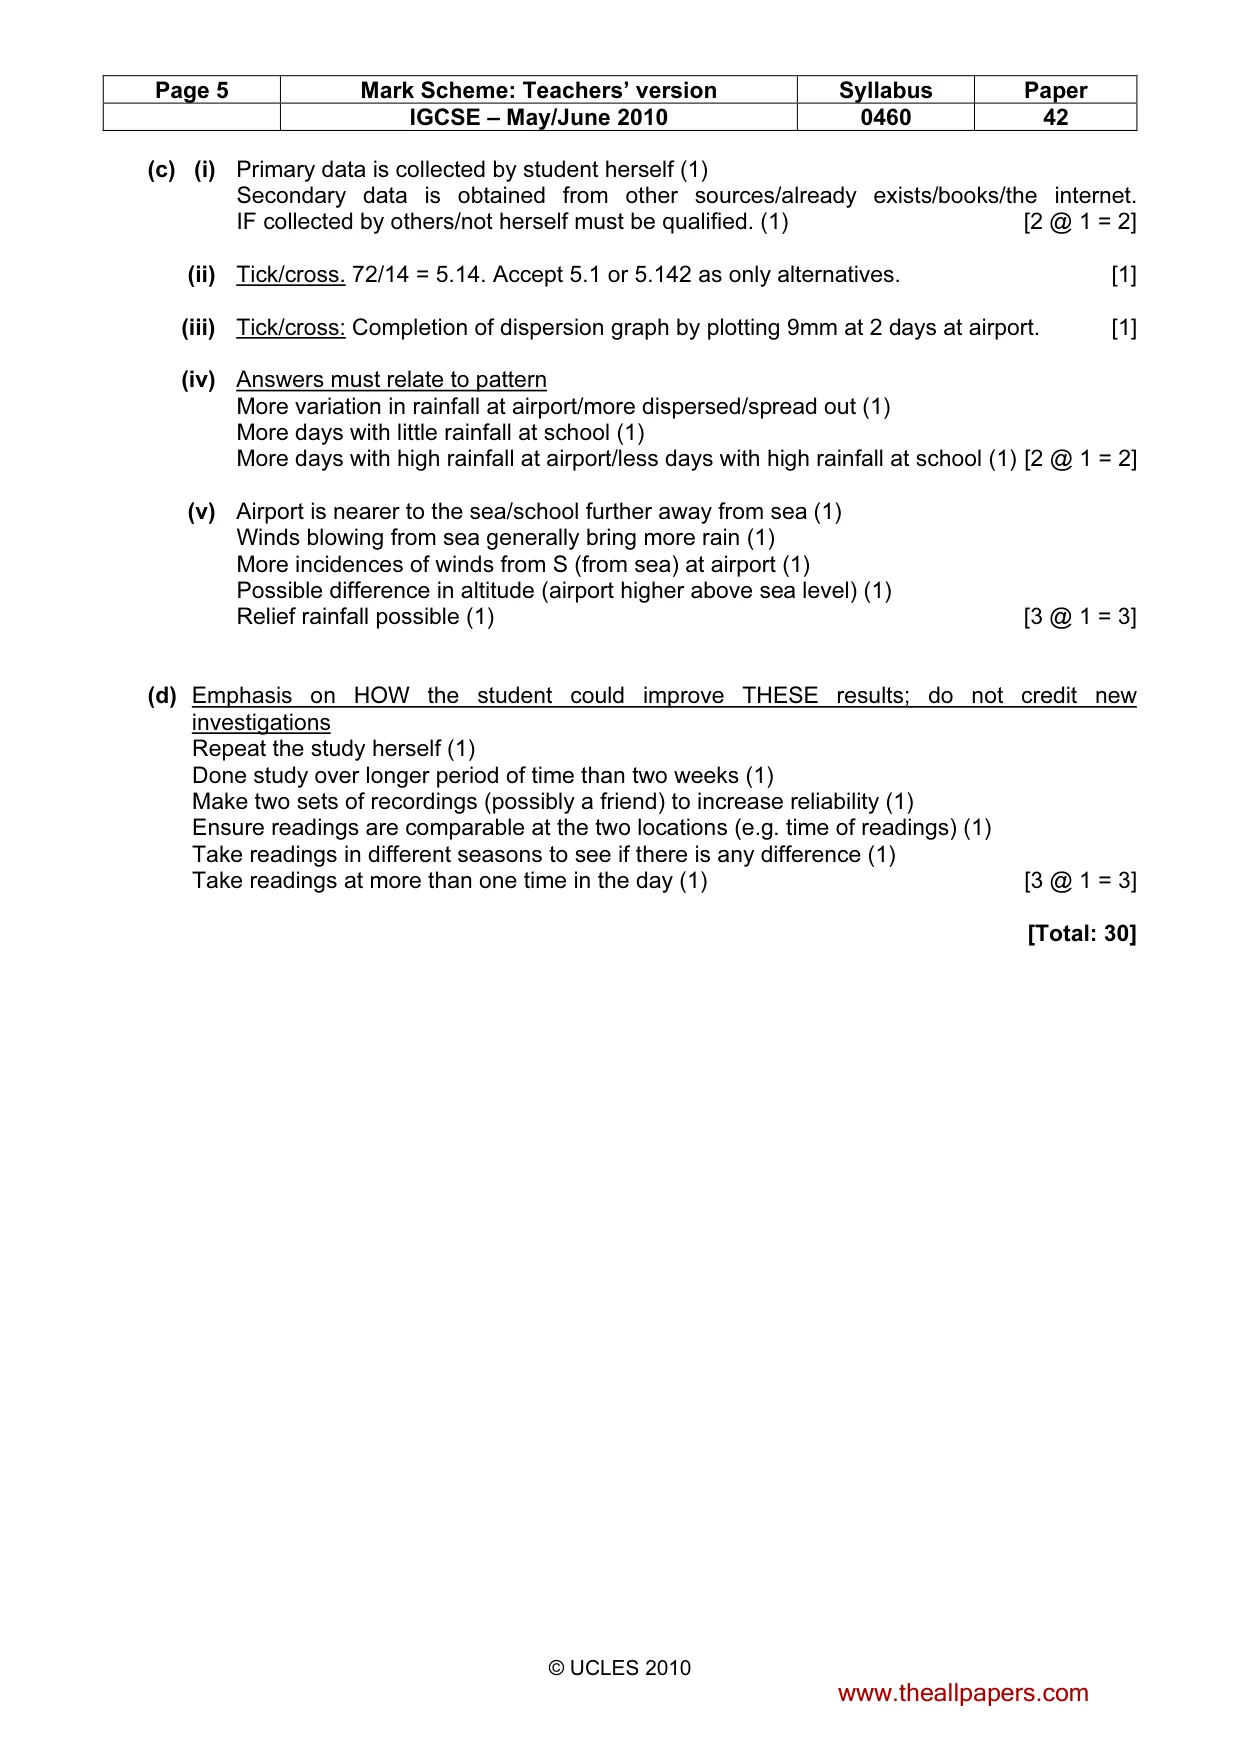
Mark scheme, page 5
Page 5 Mark Scheme: Teachers’ version Syllabus Paper IGCSE – May/June 2010 0460 42 © UCLES 2010 (c) (i) Primary data is collected by student herself (1) Secondary data is obtained from other sources/already exists/books/the internet. IF collected by others/not herself must be qualified. (1) [2 @ 1 = 2] (ii) Tick/cross. 72/14 = 5.14. Accept 5.1 or 5.142 as only alternatives. [1] (iii) Tick/cross: Completion of dispersion graph by plotting 9mm at 2 days at airport. [1] (iv) Answers must relate to pattern More variation in rainfall at airport/more dispersed/spread out (1) More days with little rainfall at school (1) More days with high rainfall at airport/less days with high rainfall at school (1) [2 @ 1 = 2] (v) Airport is nearer to the sea/school further away from sea (1) Winds blowing from sea generally bring more rain (1) More incidences of winds from S (from sea) at airport (1) Possible difference in altitude (airport higher above sea level) (1) Relief rainfall possible (1) [3 @ 1 = 3] (d) Emphasis on HOW the student could improve THESE results; do not credit new investigations Repeat the study herself (1) Done study over longer period of time than two weeks (1) Make two sets of recordings (possibly a friend) to increase reliability (1) Ensure readings are comparable at the two locations (e.g. time of readings) (1) Take readings in different seasons to see if there is any difference (1) Take readings at more than one time in the day (1) [3 @ 1 = 3] [Total: 30] www.theallpapers.com
What you needed in this session
Cambridge’s own grade thresholds for 2010 May/June, Paper 4 · Variant 2. A higher threshold means an easier paper — the bar moves with how the cohort did.