Cambridge IGCSE Geography 0460 — 2010 May/June Paper 4 · Variant 1
0460/41/M/J/10 · 60 marks · ≈68 min
The question paper and its mark scheme, free to read here and free to download. This is Cambridge’s own paper, exactly as it was sat.
Question paper16 pages





Mark scheme6 pages
Answers below. Sit the paper first if you are practising.
Paper as text
Question paper, page 1
This document consists of 15 printed pages, 1 blank page and 1 Insert. DC (DR/DR) 12043/5 © UCLES 2010 [Turn over UNIVERSITY OF CAMBRIDGE INTERNATIONAL EXAMINATIONS International General Certificate of Secondary Education READ THESE INSTRUCTIONS FIRST Write your Centre number, candidate number and name in the spaces provided. Write in dark blue or black pen. You may use a soft pencil for any diagrams, graphs or rough working. Do not use staples, paper clips, highlighters, glue or correction fluid. DO NOT WRITE ON ANY BARCODES. Answer all questions. The Insert contains Photograph A, Tables 1 and 3 and Fig. 5 for Question 1 and Fig. 6 and Table 4 for Question 2. The Insert is not required by the Examiner. Sketch maps and diagrams should be drawn whenever they serve to illustrate an answer. The number of marks is given in brackets [ ] at the end of each question or part question. * 2 8 0 5 9 7 5 1 1 3 * GEOGRAPHY 0460/41 Paper 4 Alternative to Coursework May/June 2010 1 hour 30 minutes Candidates answer on the Question Paper. Additional Materials: Calculator Ruler For Examiner’s Use Q1 Q2 Total www.theallpapers.com
Question paper, page 2
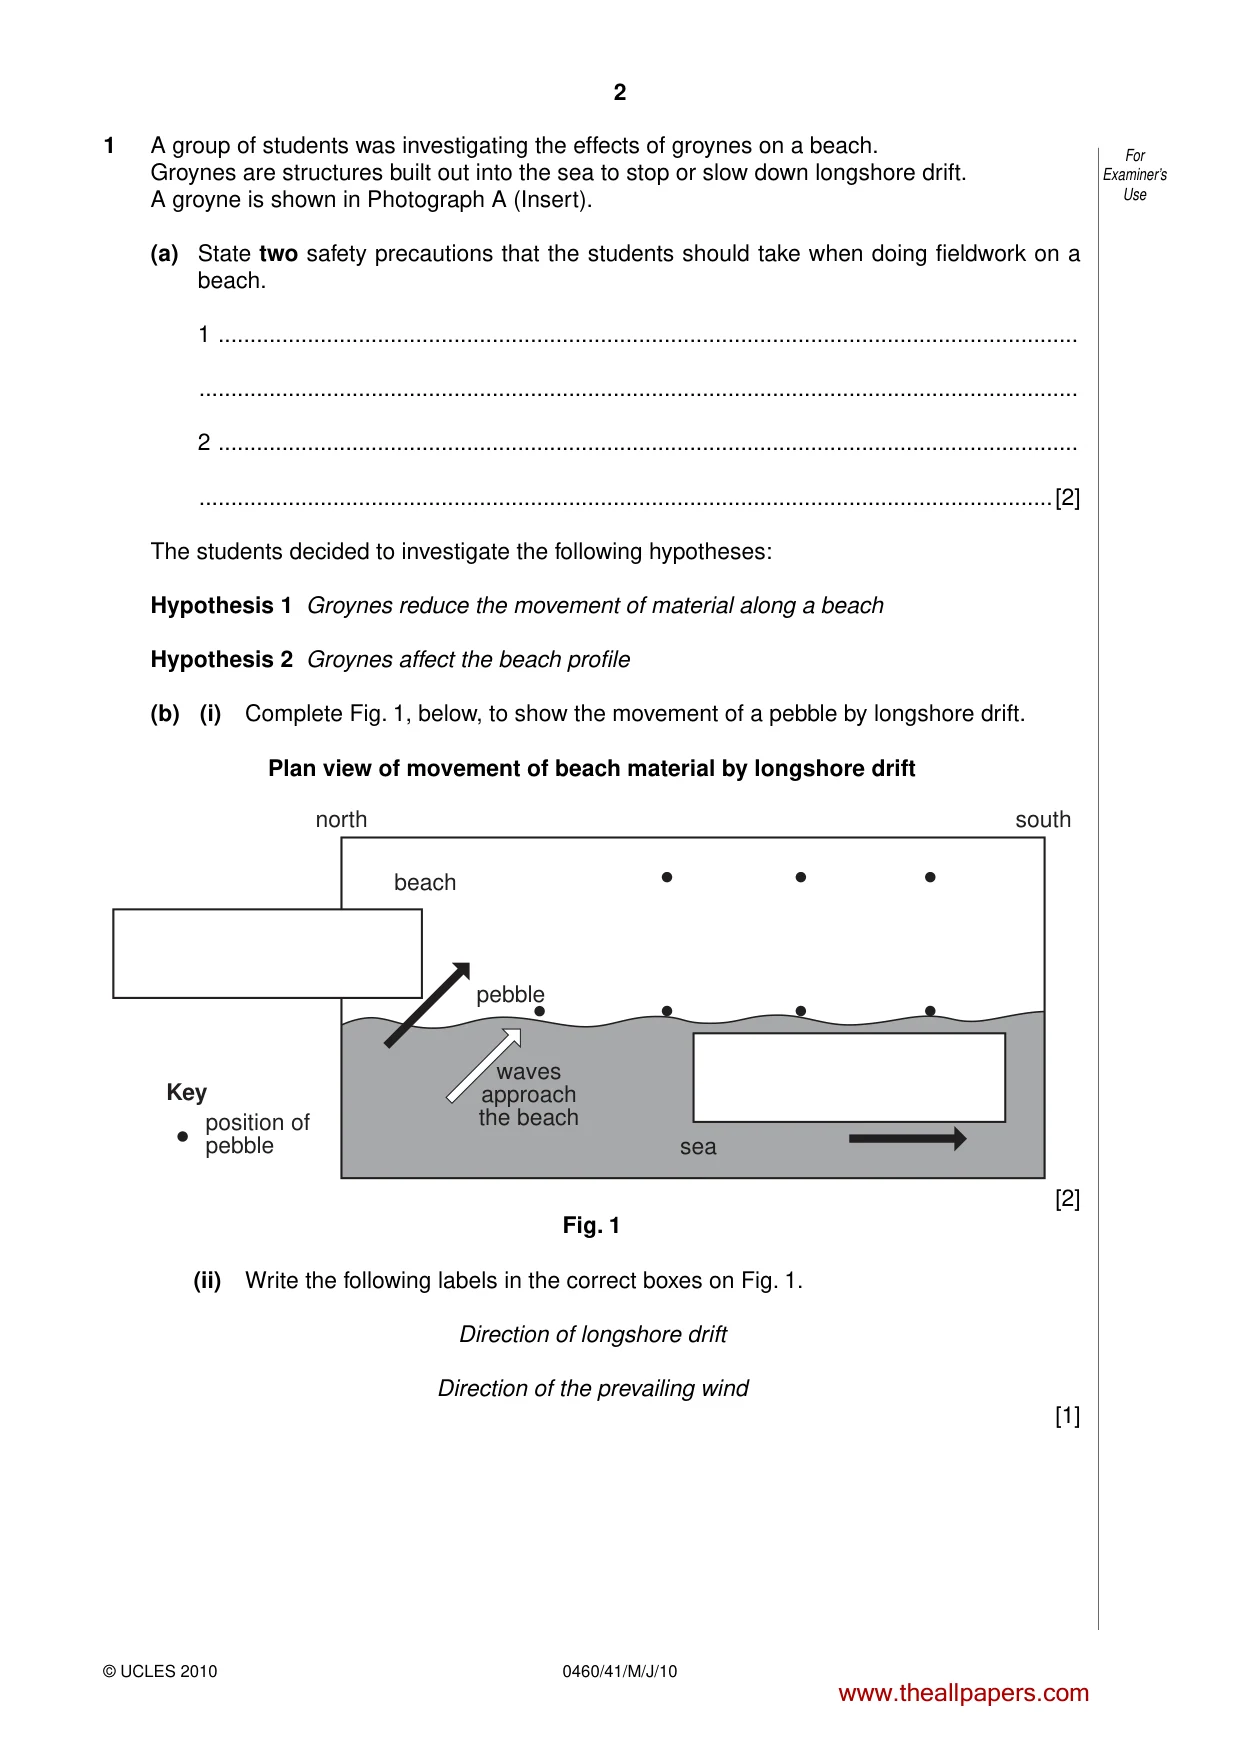
2 0460/41/M/J/10 For Examiner’s Use © UCLES 2010 1 A group of students was investigating the effects of groynes on a beach. Groynes are structures built out into the sea to stop or slow down longshore drift. A groyne is shown in Photograph A (Insert). (a) State two safety precautions that the students should take when doing fieldwork on a beach. 1 … … 2 … …[2] The students decided to investigate the following hypotheses: Hypothesis 1 Groynes reduce the movement of material along a beach Hypothesis 2 Groynes affect the beach profile (b) (i) Complete Fig. 1, below, to show the movement of a pebble by longshore drift. Plan view of movement of beach material by longshore drift beach pebble waves approach the beach north south sea Key position of pebble [2] Fig. 1 (ii) Write the following labels in the correct boxes on Fig. 1. Direction of longshore drift Direction of the prevailing wind [1] www.theallpapers.com
Question paper, page 3
3 0460/41/M/J/10 [Turn over For Examiner’s Use © UCLES 2010 (iii) Explain the process of longshore drift. … … … … … …[3] www.theallpapers.com
Question paper, page 4
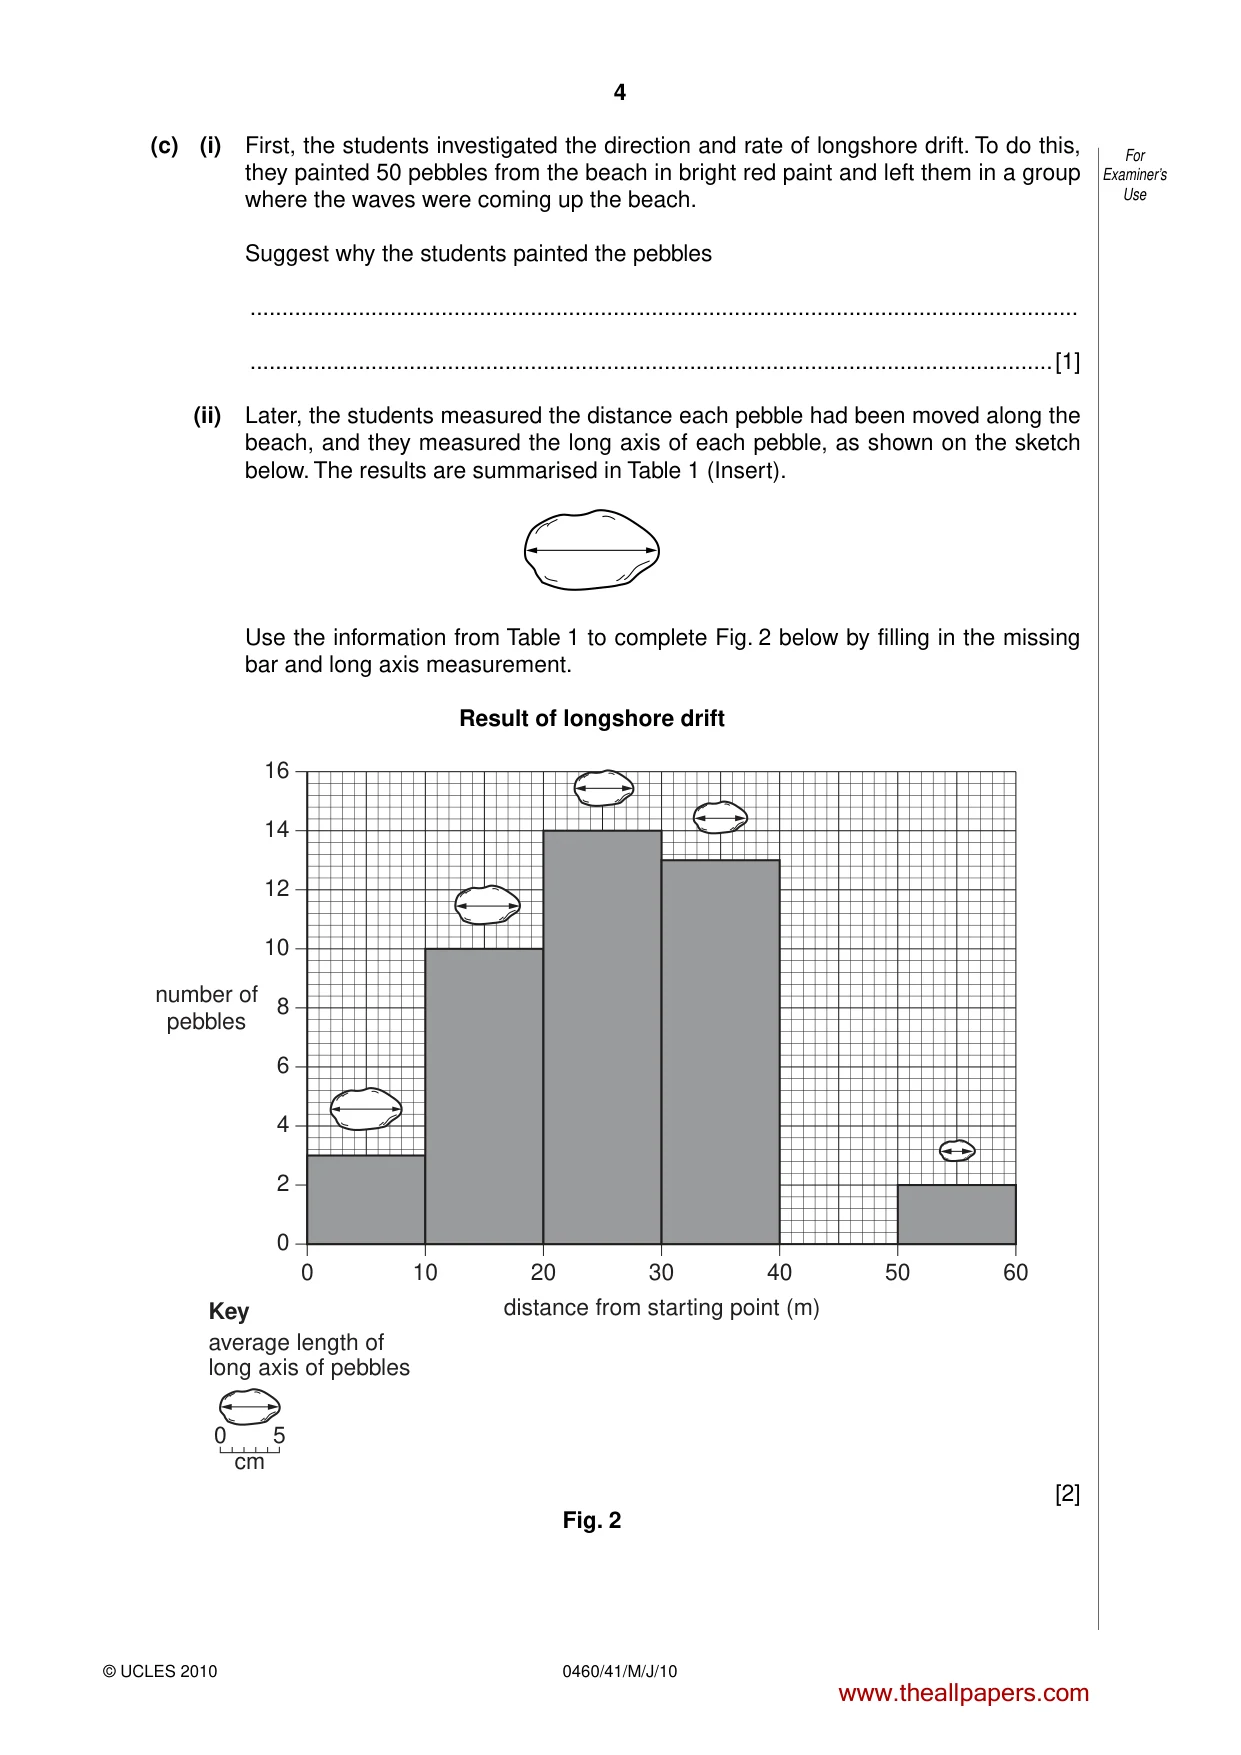
4 0460/41/M/J/10 For Examiner’s Use © UCLES 2010 (c) (i) First, the students investigated the direction and rate of longshore drift. To do this, they painted 50 pebbles from the beach in bright red paint and left them in a group where the waves were coming up the beach. Suggest why the students painted the pebbles … …[1] (ii) Later, the students measured the distance each pebble had been moved along the beach, and they measured the long axis of each pebble, as shown on the sketch below. The results are summarised in Table 1 (Insert). Use the information from Table 1 to complete Fig. 2 below by filling in the missing bar and long axis measurement. Result of longshore drift 0 10 20 30 distance from starting point (m) 40 50 60 0 2 4 6 8 10 12 14 16 number of pebbles Key average length of long axis of pebbles 0 5 cm [2] Fig. 2 www.theallpapers.com
Question paper, page 5
5 0460/41/M/J/10 [Turn over For Examiner’s Use © UCLES 2010 (iii) What did the students learn from this investigation about the impact of longshore drift on the movement of pebbles? … … … … … …[3] www.theallpapers.com
Question paper, page 6
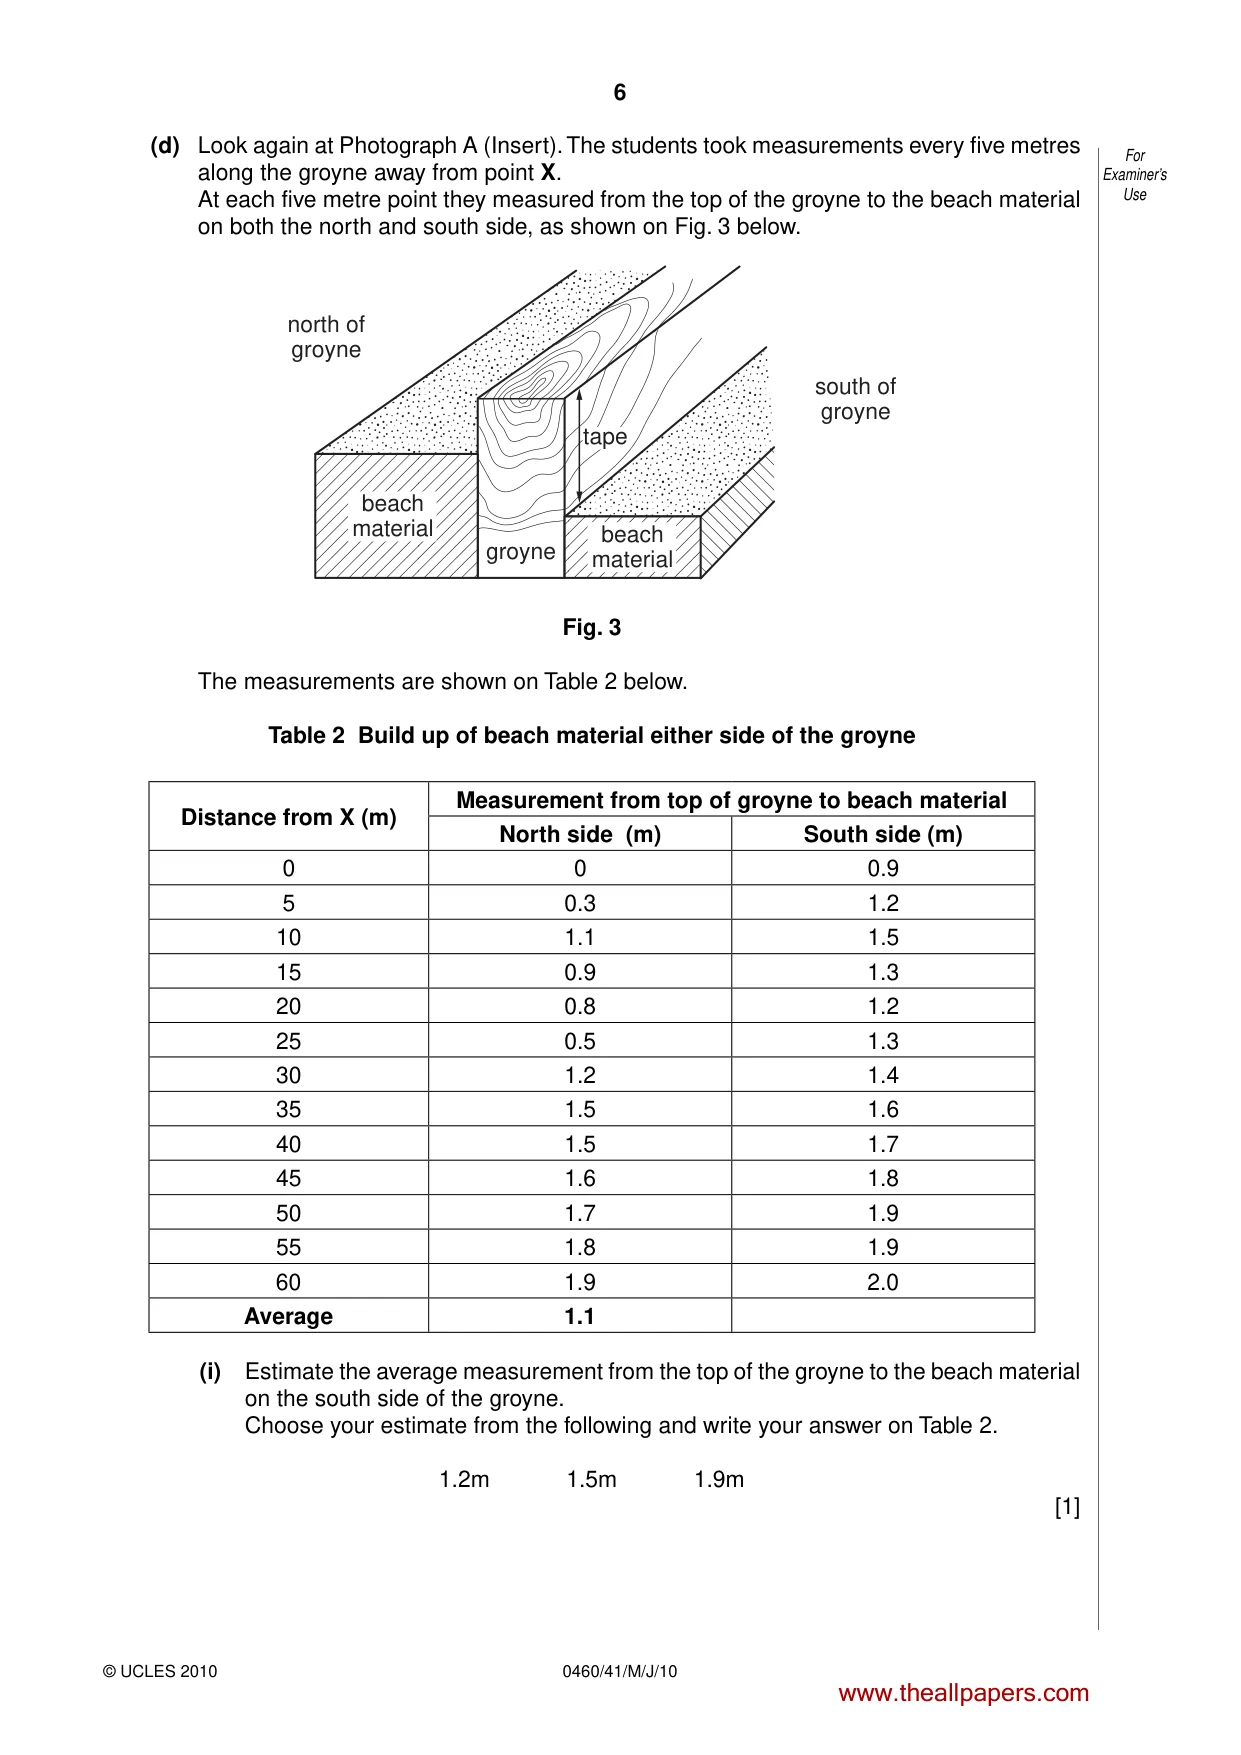
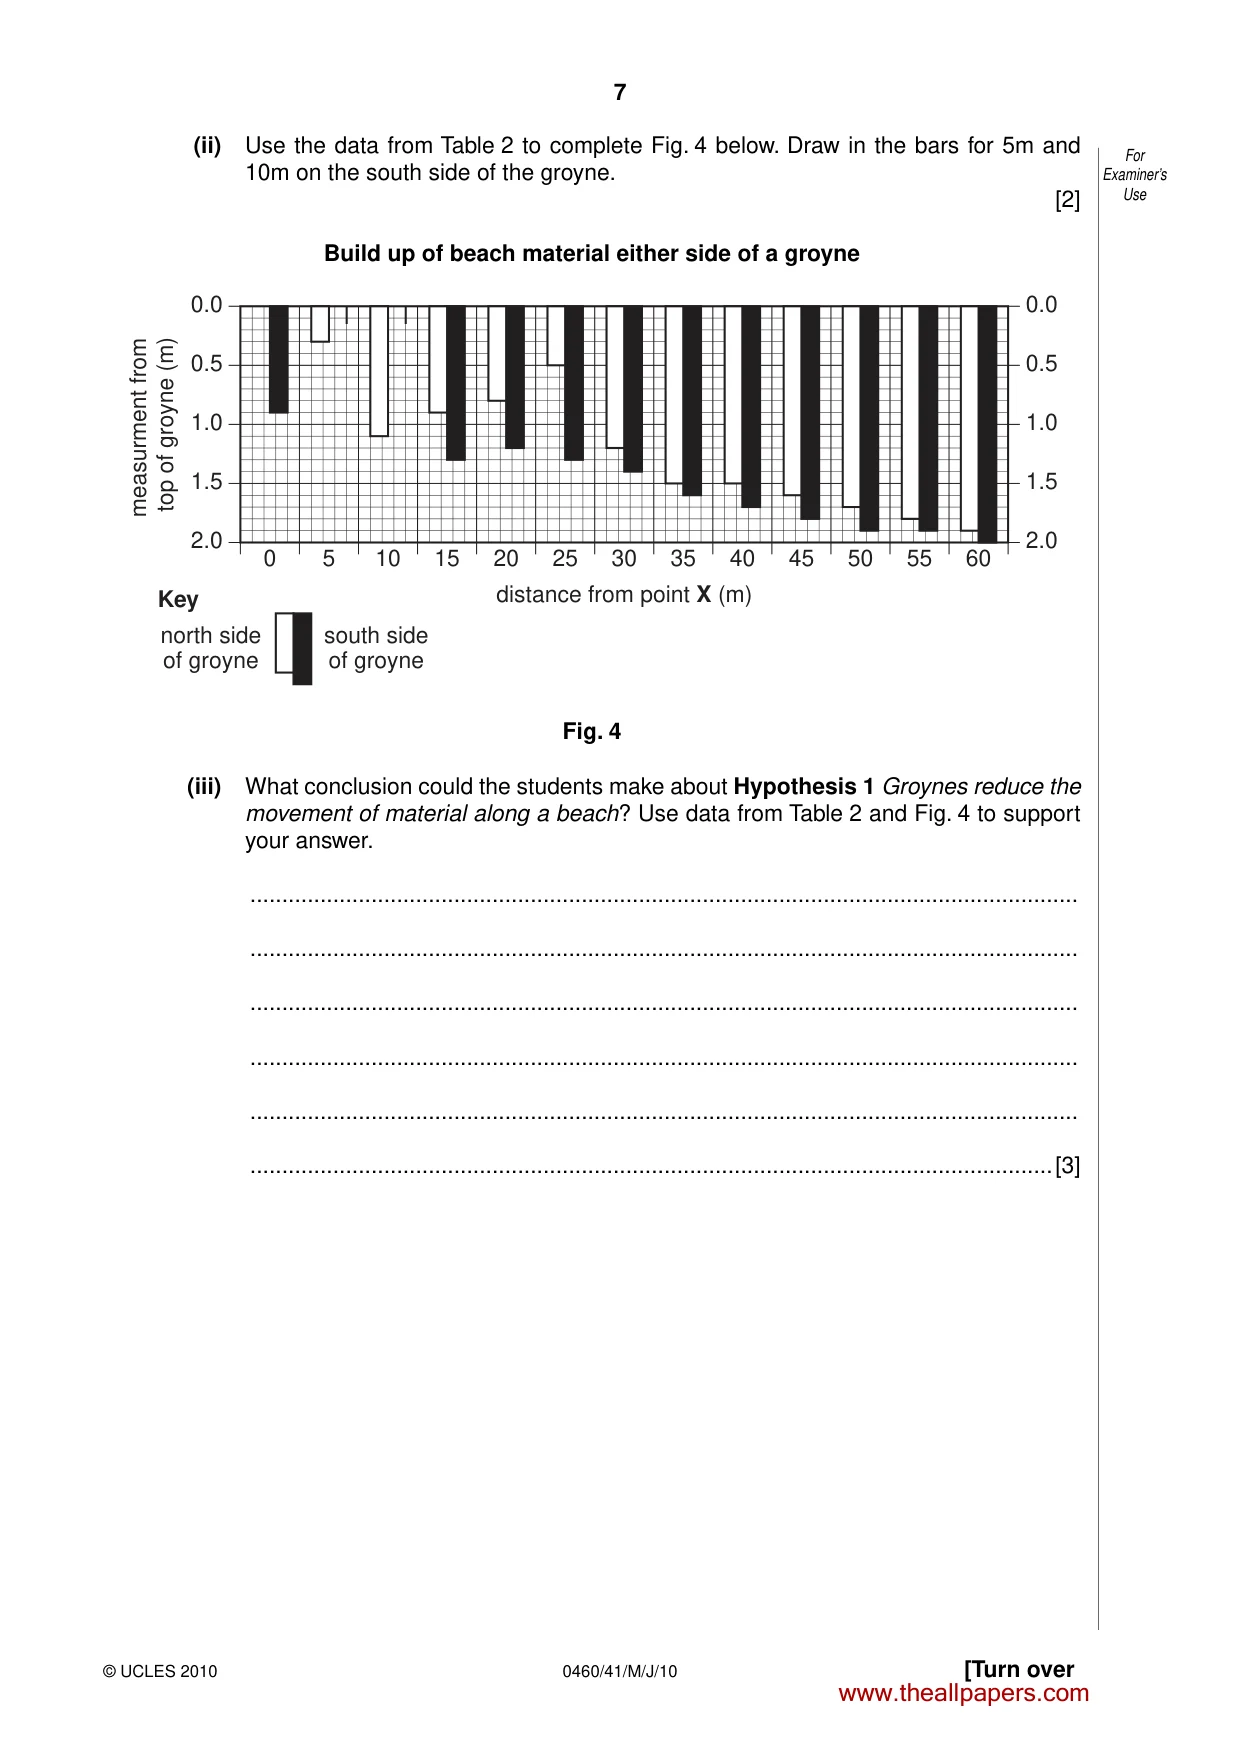
6 0460/41/M/J/10 For Examiner’s Use © UCLES 2010 (d) Look again at Photograph A (Insert). The students took measurements every five metres along the groyne away from point X. At each five metre point they measured from the top of the groyne to the beach material on both the north and south side, as shown on Fig. 3 below. tape beach material beach material north of groyne south of groyne groyne Fig. 3 The measurements are shown on Table 2 below. Table 2 Build up of beach material either side of the groyne Distance from X (m) Measurement from top of groyne to beach material North side (m) South side (m) 0 0 0.9 5 0.3 1.2 10 1.1 1.5 15 0.9 1.3 20 0.8 1.2 25 0.5 1.3 30 1.2 1.4 35 1.5 1.6 40 1.5 1.7 45 1.6 1.8 50 1.7 1.9 55 1.8 1.9 60 1.9 2.0 Average 1.1 (i) Estimate the average measurement from the top of the groyne to the beach material on the south side of the groyne. Choose your estimate from the following and write your answer on Table 2. 1.2m 1.5m 1.9m [1] www.theallpapers.com
Question paper, page 7
7 0460/41/M/J/10 [Turn over For Examiner’s Use © UCLES 2010 (ii) Use the data from Table 2 to complete Fig. 4 below. Draw in the bars for 5m and 10m on the south side of the groyne. [2] Build up of beach material either side of a groyne 0 5 10 15 20 25 30 distance from point X (m) 35 40 45 50 55 60 2.0 1.5 1.0 0.5 0.0 2.0 1.5 1.0 0.5 0.0 measurment from top of groyne (m) Key north side of groyne south side of groyne Fig. 4 (iii) What conclusion could the students make about Hypothesis 1 Groynes reduce the movement of material along a beach? Use data from Table 2 and Fig. 4 to support your answer. … … … … … …[3] www.theallpapers.com
Question paper, page 8
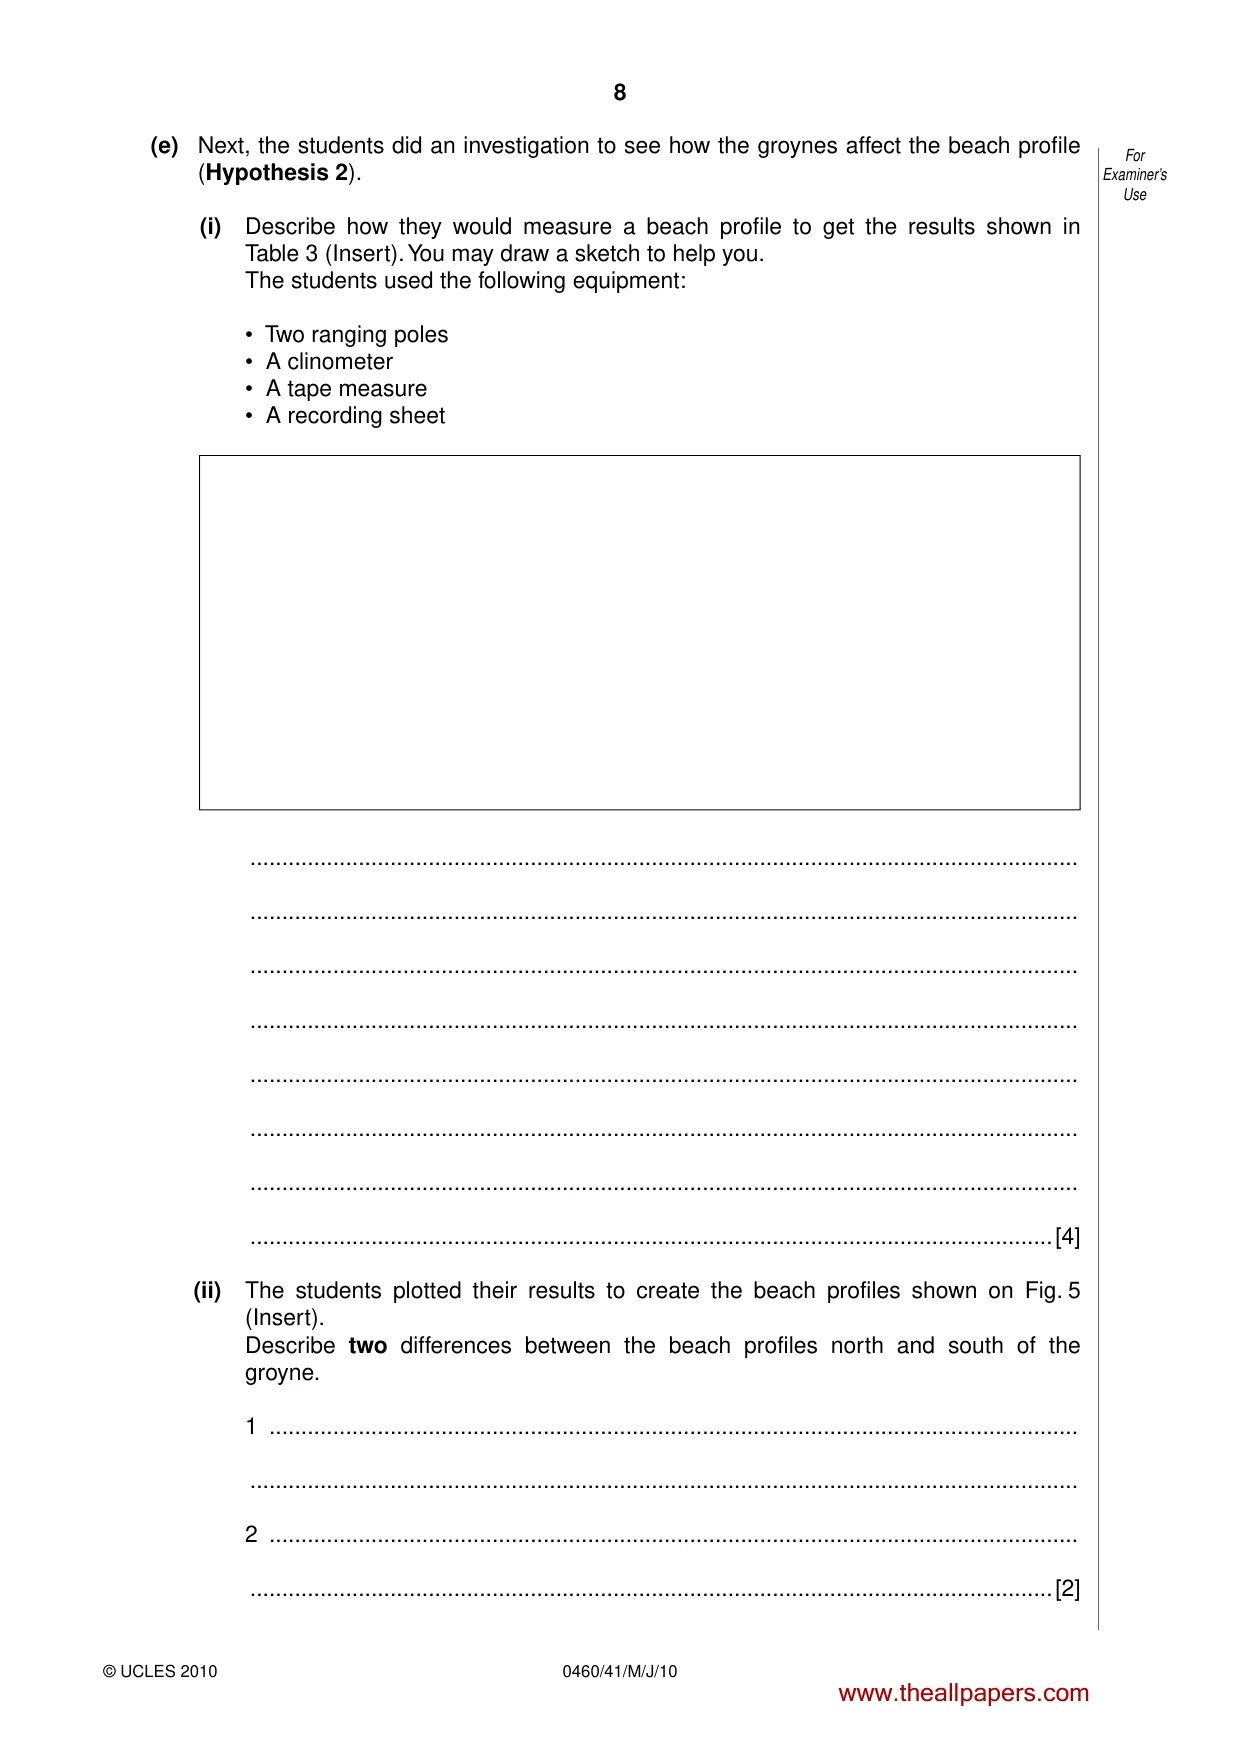
8 0460/41/M/J/10 For Examiner’s Use © UCLES 2010 (e) Next, the students did an investigation to see how the groynes affect the beach profile (Hypothesis 2). (i) Describe how they would measure a beach profile to get the results shown in Table 3 (Insert). You may draw a sketch to help you. The students used the following equipment: • Two ranging poles • A clinometer • A tape measure • A recording sheet … … … … … … … …[4] (ii) The students plotted their results to create the beach profiles shown on Fig. 5 (Insert). Describe two differences between the beach profiles north and south of the groyne. 1 … … 2 … …[2] www.theallpapers.com
Question paper, page 9
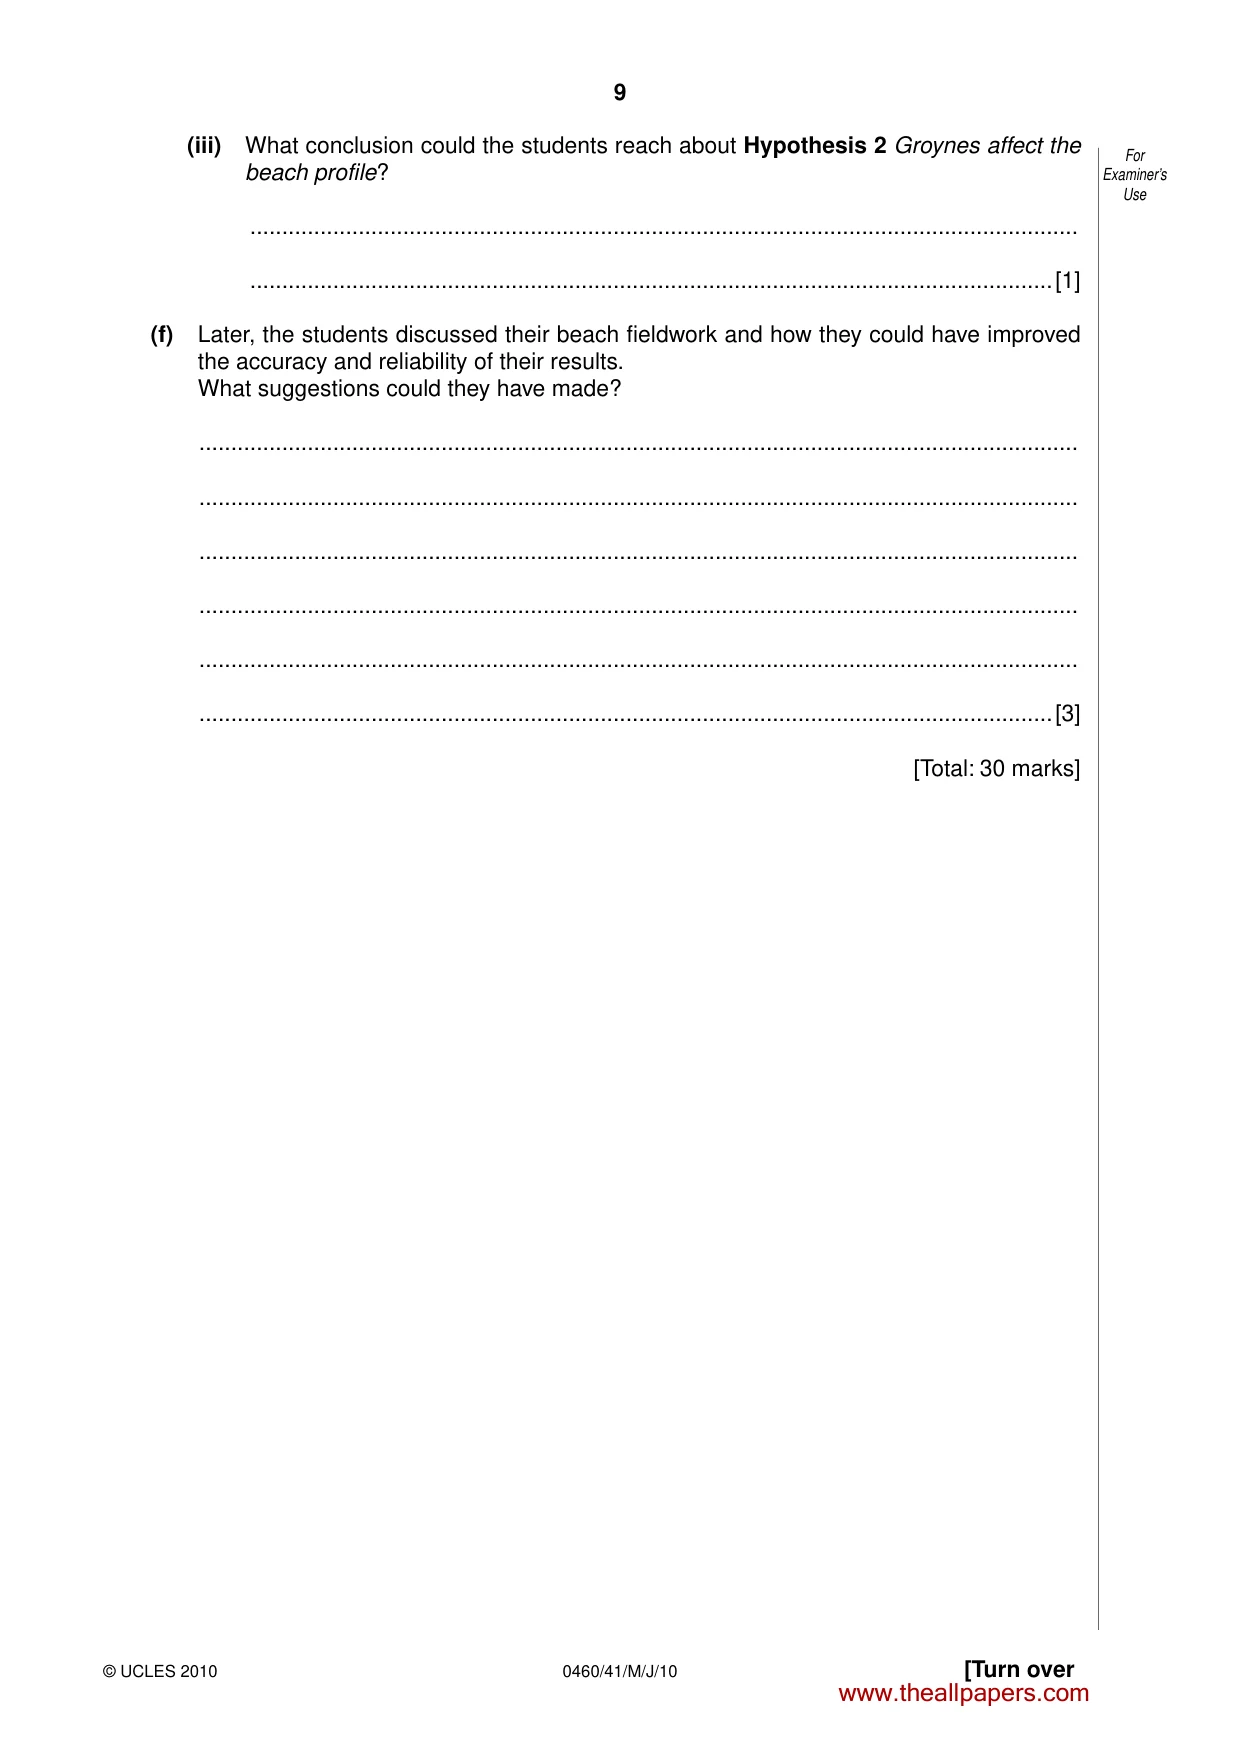
9 0460/41/M/J/10 [Turn over For Examiner’s Use © UCLES 2010 (iii) What conclusion could the students reach about Hypothesis 2 Groynes affect the beach profile? … …[1] (f) Later, the students discussed their beach fieldwork and how they could have improved the accuracy and reliability of their results. What suggestions could they have made? … … … … … …[3] [Total: 30 marks] www.theallpapers.com
Question paper, page 10
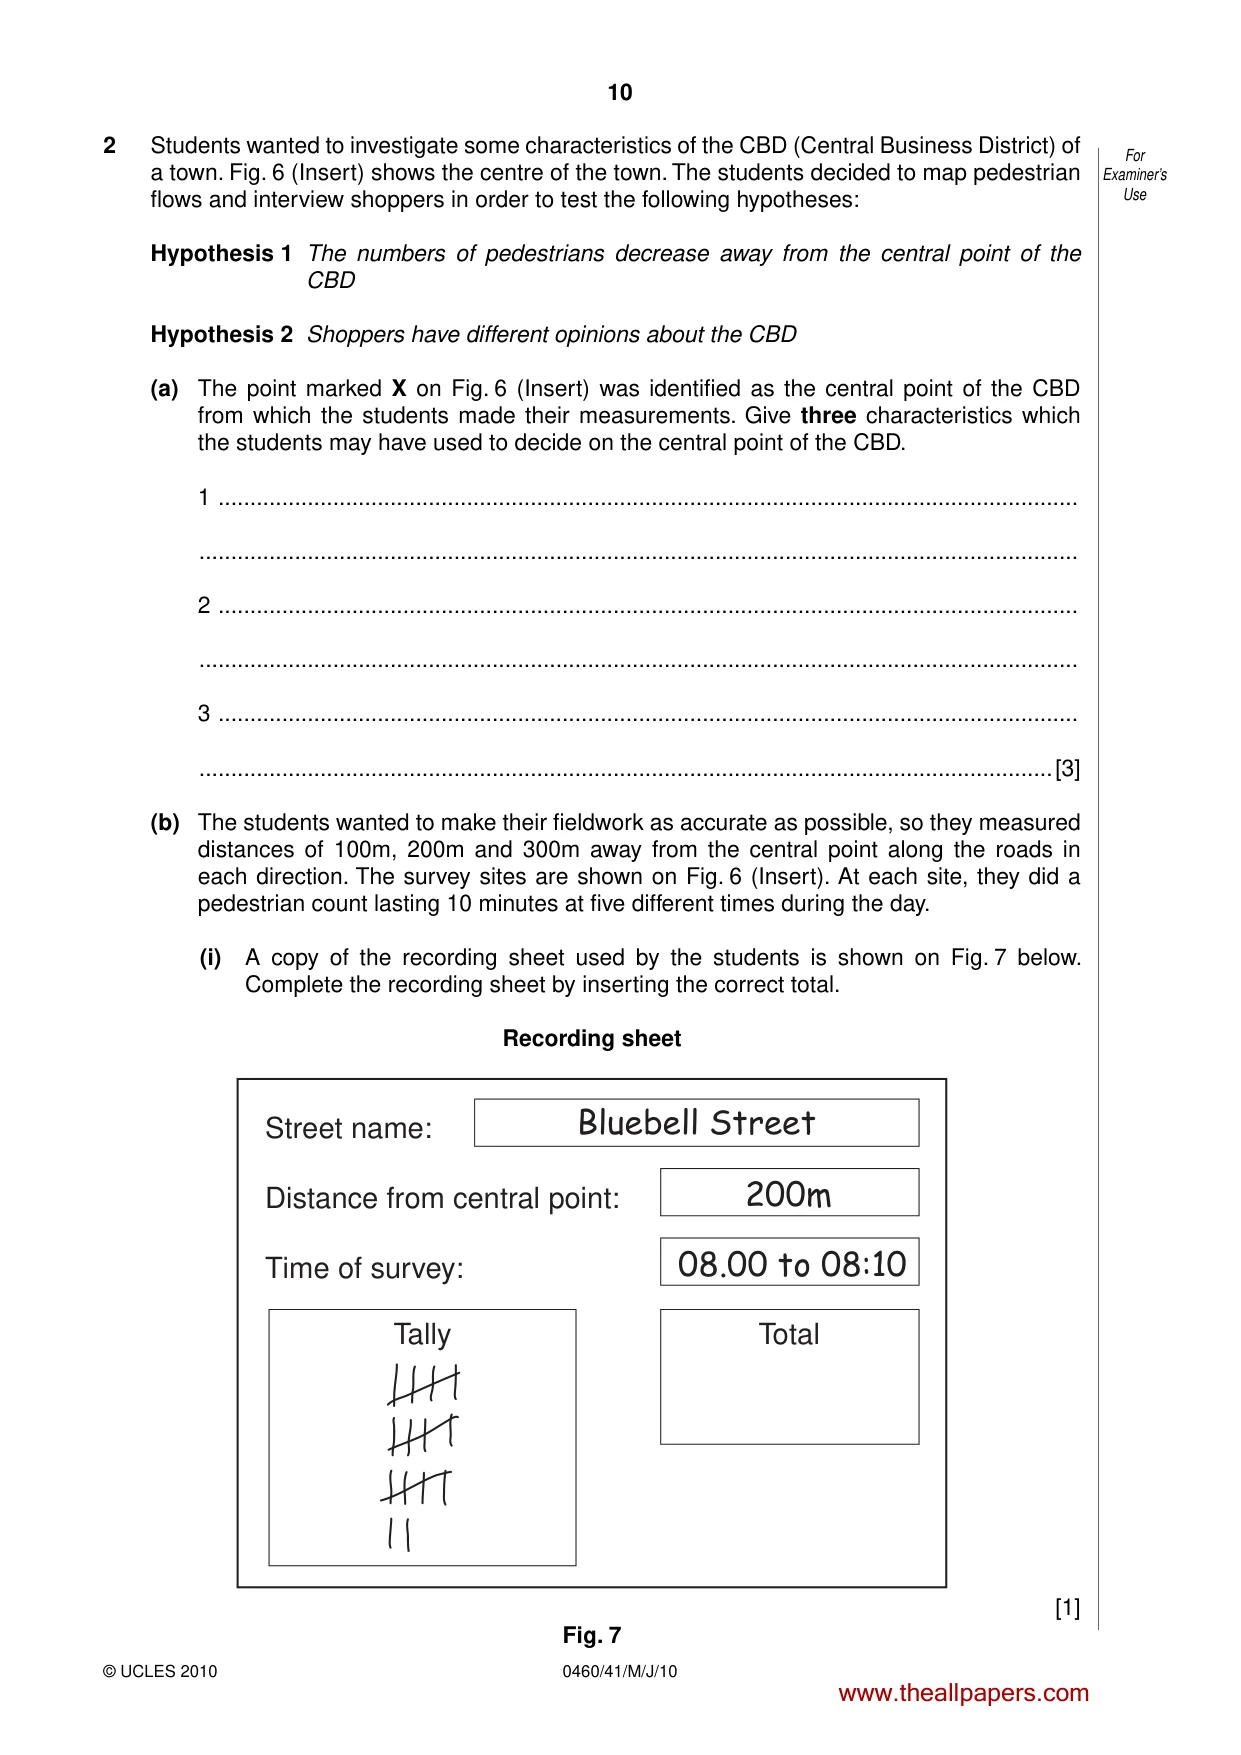
10 0460/41/M/J/10 For Examiner’s Use © UCLES 2010 2 Students wanted to investigate some characteristics of the CBD (Central Business District) of a town. Fig. 6 (Insert) shows the centre of the town. The students decided to map pedestrian flows and interview shoppers in order to test the following hypotheses: Hypothesis 1 The numbers of pedestrians decrease away from the central point of the CBD Hypothesis 2 Shoppers have different opinions about the CBD (a) The point marked X on Fig. 6 (Insert) was identified as the central point of the CBD from which the students made their measurements. Give three characteristics which the students may have used to decide on the central point of the CBD. 1 … … 2 … … 3 … …[3] (b) The students wanted to make their fieldwork as accurate as possible, so they measured distances of 100m, 200m and 300m away from the central point along the roads in each direction. The survey sites are shown on Fig. 6 (Insert). At each site, they did a pedestrian count lasting 10 minutes at five different times during the day. (i) A copy of the recording sheet used by the students is shown on Fig. 7 below. Complete the recording sheet by inserting the correct total. Recording sheet Street name: Distance from central point: Time of survey: Tally Total Bluebell Street 200m 08.00 to 08:10 [1] Fig. 7 www.theallpapers.com
Question paper, page 11
11 0460/41/M/J/10 [Turn over For Examiner’s Use © UCLES 2010 (ii) Suggest one advantage and one disadvantage of their method of selecting the sites for the pedestrian counts. Advantage … … Disadvantage … …[2] (iii) Study the results of the three survey sites on Bluebell Street which are shown in Table 4 (Insert). Give two reasons why the students did the pedestrian count at five different times during the day. 1 … … 2 … …[2] www.theallpapers.com
Question paper, page 12
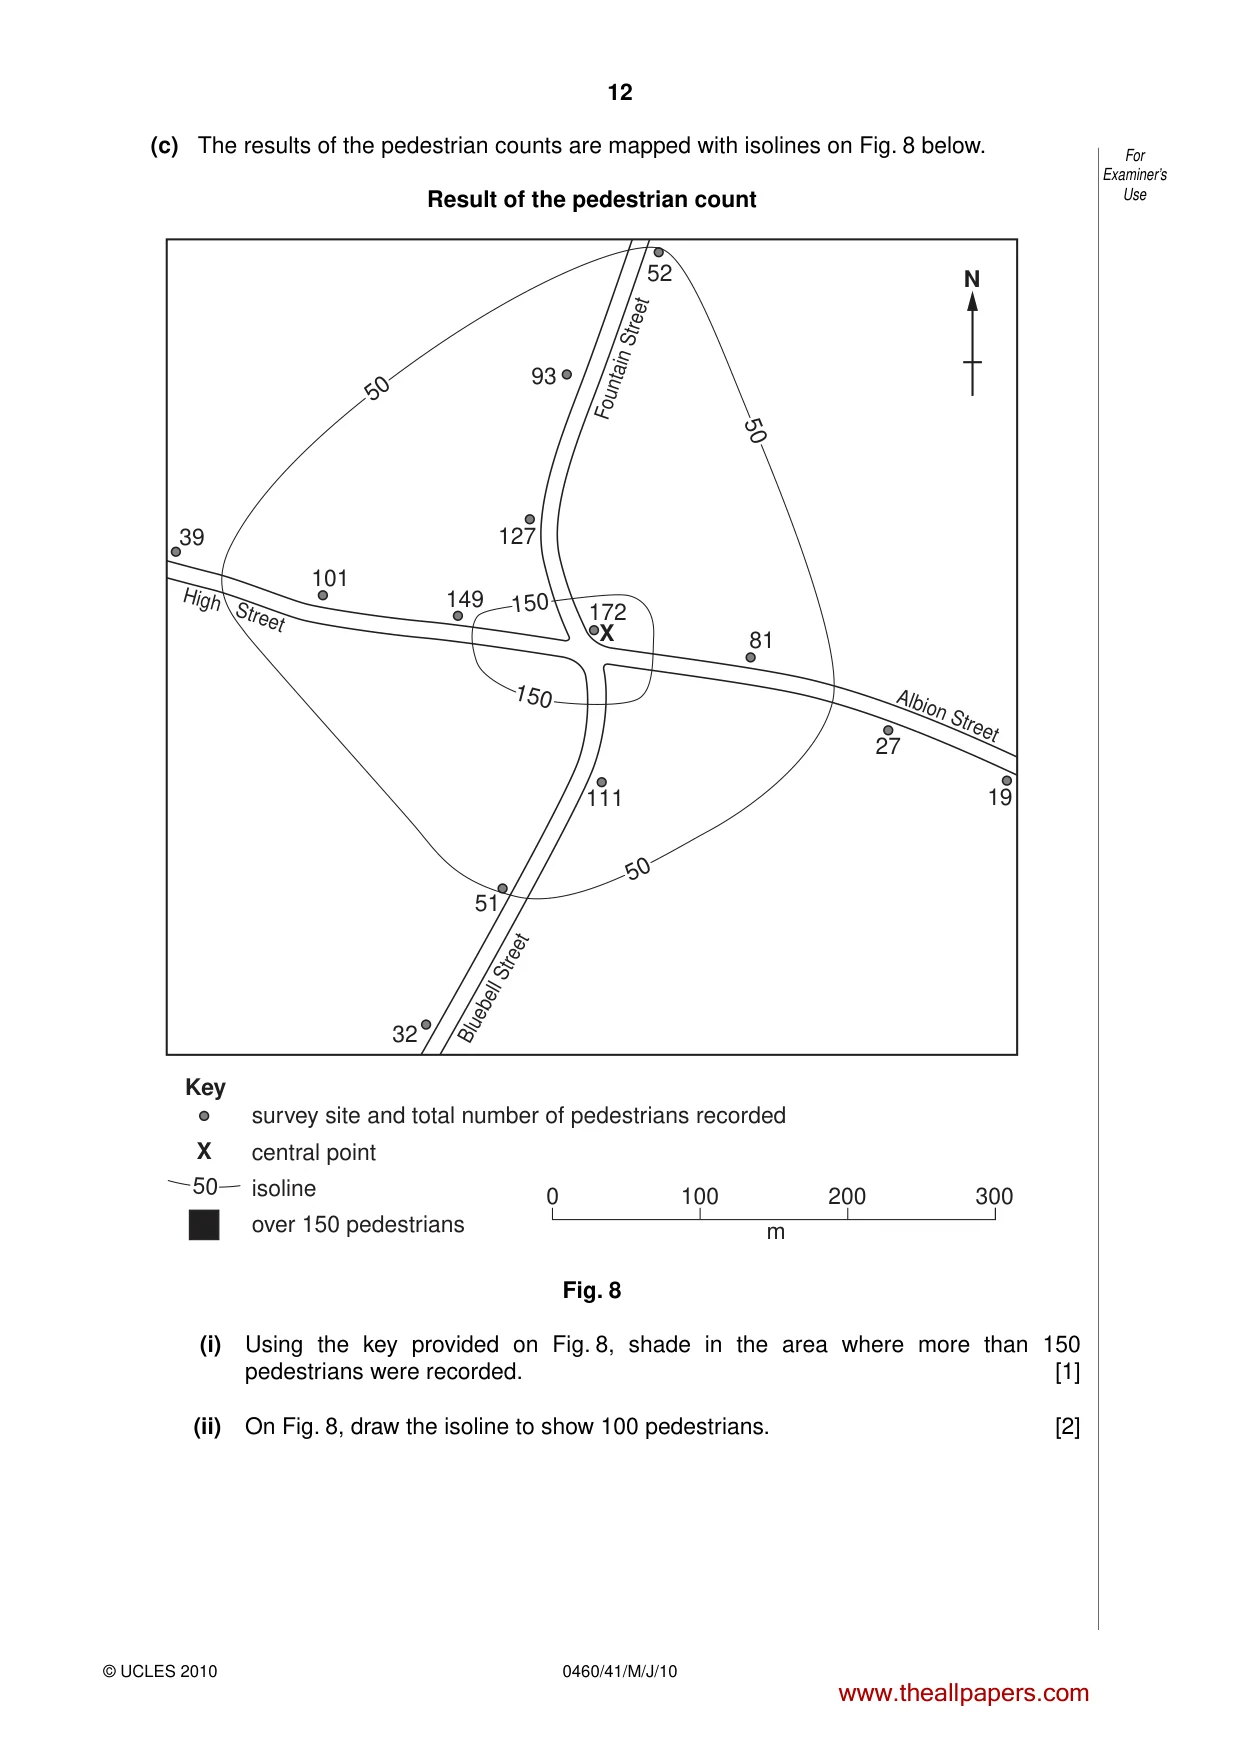
12 0460/41/M/J/10 For Examiner’s Use © UCLES 2010 (c) The results of the pedestrian counts are mapped with isolines on Fig. 8 below. Result of the pedestrian count X X 0 100 200 300 m N Key survey site and total number of pedestrians recorded central point isoline over 150 pedestrians 50 50 50 Bluebell Street Albion S treet Fountain Street High Street 39 101 149 127 172 81 52 93 27 19 111 51 32 150 150 50 Fig. 8 (i) Using the key provided on Fig. 8, shade in the area where more than 150 pedestrians were recorded. [1] (ii) On Fig. 8, draw the isoline to show 100 pedestrians. [2] www.theallpapers.com
Question paper, page 13
13 0460/41/M/J/10 [Turn over For Examiner’s Use © UCLES 2010 (iii) To what extent does the information on Fig. 8 support Hypothesis 1 The numbers of pedestrians decrease away from the central point of the CBD? … … … …[2] (iv) Use the information on Fig. 6 (Insert) to suggest why pedestrian flows vary within the study area. … … … …[2] (v) The outdoor market was closed on the day of the pedestrian counts. To extend their fieldwork, the students repeated the pedestrian counts on a day when the outdoor market was open between 08.00 and 13.00 hours. What difference would you expect the students to find between the results of the two days? … … … … … …[3] www.theallpapers.com
Question paper, page 14
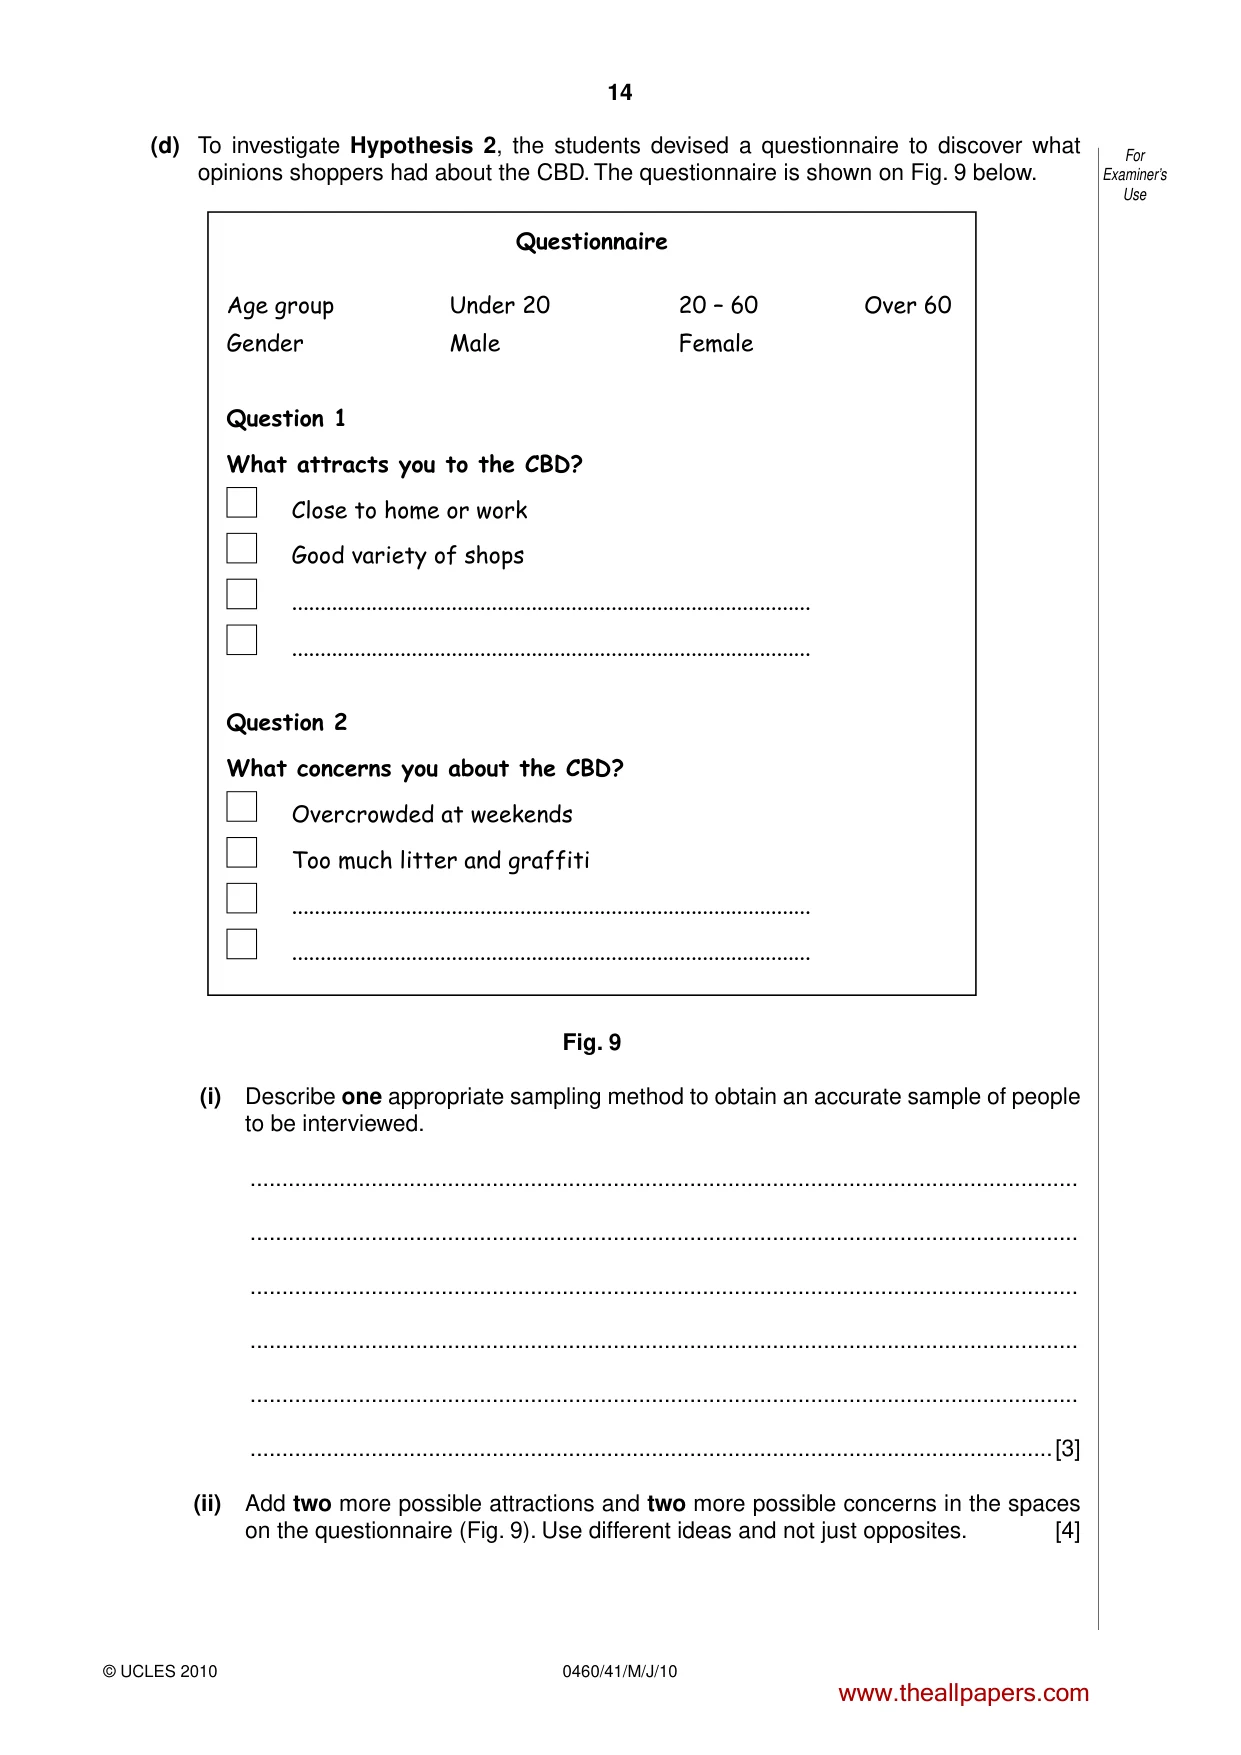
14 0460/41/M/J/10 For Examiner’s Use © UCLES 2010 (d) To investigate Hypothesis 2, the students devised a questionnaire to discover what opinions shoppers had about the CBD. The questionnaire is shown on Fig. 9 below. Questionnaire Age group Under 20 20 – 60 Over 60 Gender Male Female Question 1 What attracts you to the CBD? Close to home or work Good variety of shops … … Question 2 What concerns you about the CBD? Overcrowded at weekends Too much litter and graffiti … … Fig. 9 (i) Describe one appropriate sampling method to obtain an accurate sample of people to be interviewed. … … … … … …[3] (ii) Add two more possible attractions and two more possible concerns in the spaces on the questionnaire (Fig. 9). Use different ideas and not just opposites. [4] www.theallpapers.com
Question paper, page 15
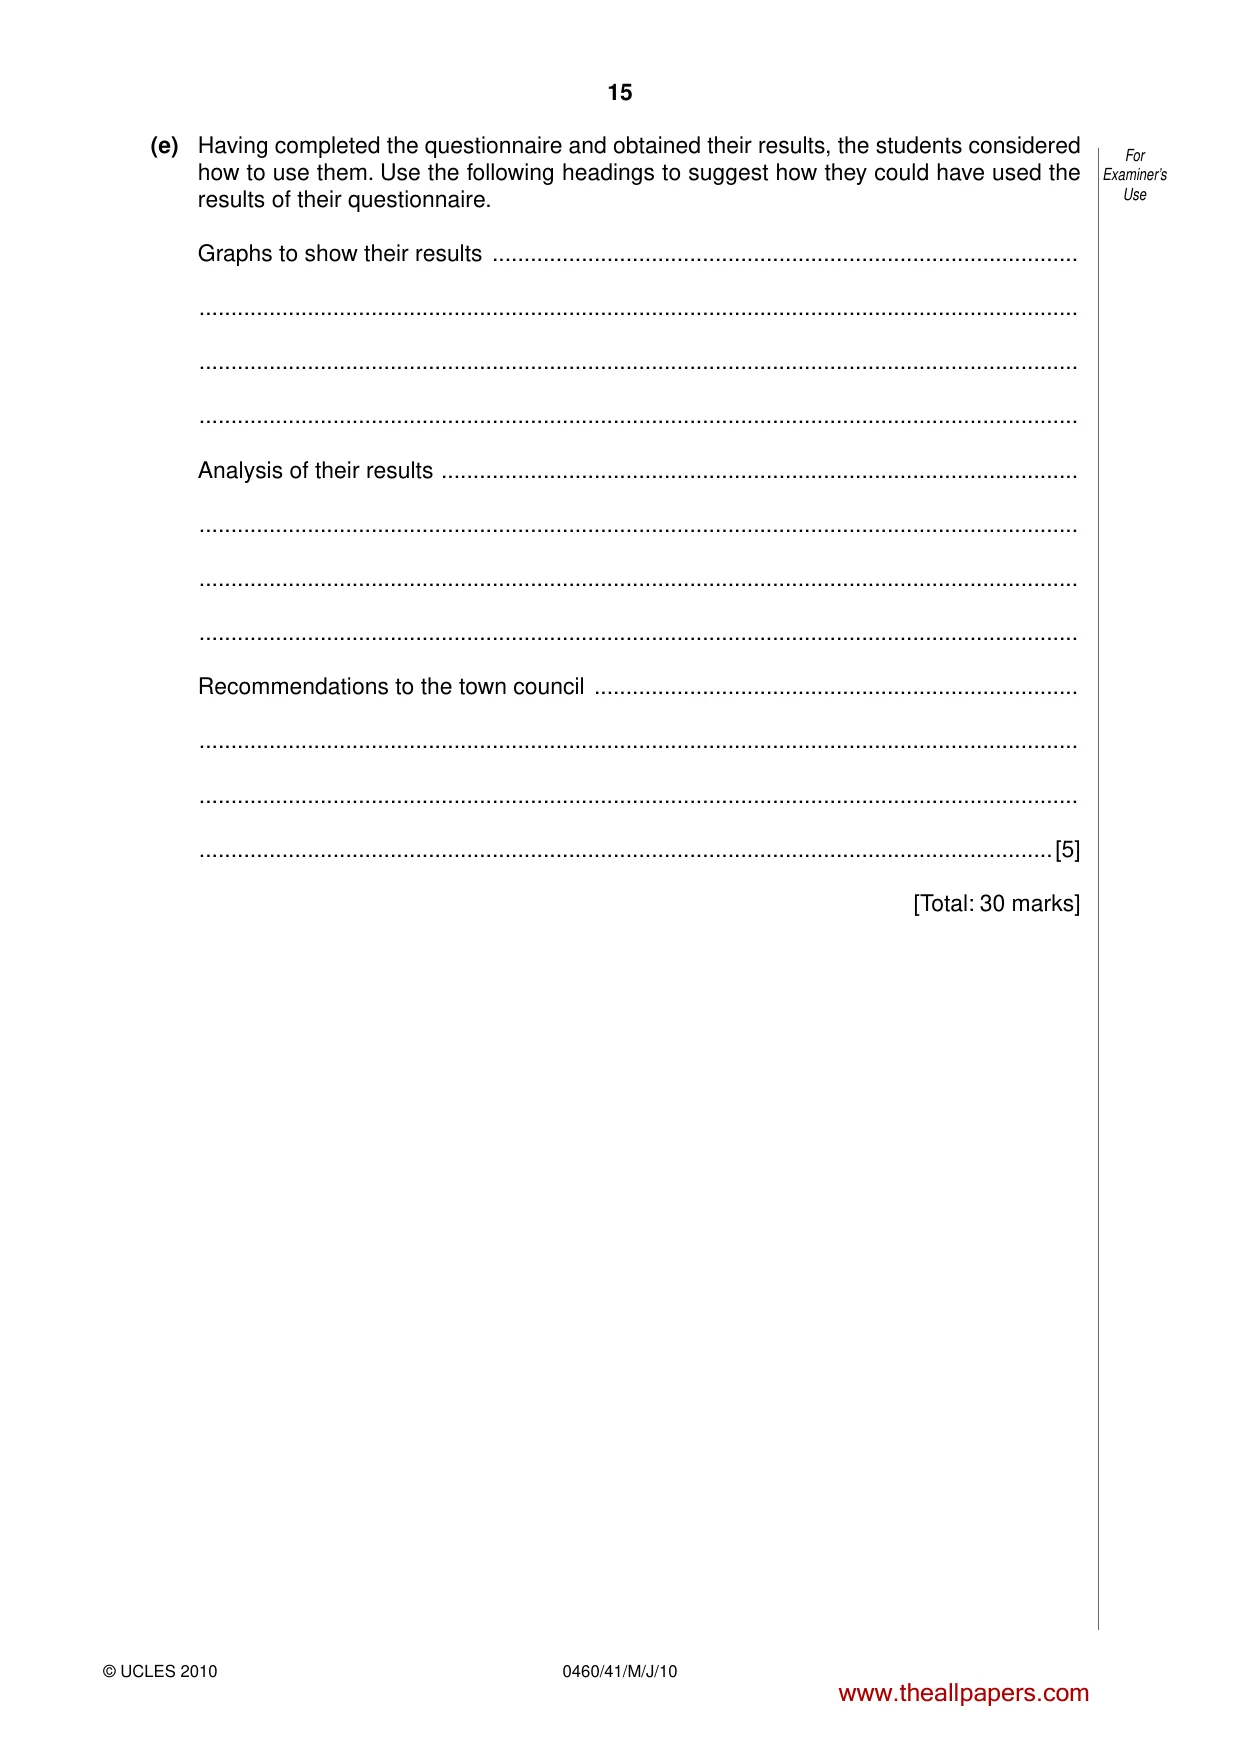
15 0460/41/M/J/10 For Examiner’s Use © UCLES 2010 (e) Having completed the questionnaire and obtained their results, the students considered how to use them. Use the following headings to suggest how they could have used the results of their questionnaire. Graphs to show their results … … … … Analysis of their results … … … … Recommendations to the town council … … … …[5] [Total: 30 marks] www.theallpapers.com
Question paper, page 16
16 0460/41/M/J/10 © UCLES 2010 BLANK PAGE Permission to reproduce items where third-party owned material protected by copyright is included has been sought and cleared where possible. Every reasonable effort has been made by the publisher (UCLES) to trace copyright holders, but if any items requiring clearance have unwittingly been included, the publisher will be pleased to make amends at the earliest possible opportunity. University of Cambridge International Examinations is part of the Cambridge Assessment Group. Cambridge Assessment is the brand name of University of Cambridge Local Examinations Syndicate (UCLES), which is itself a department of the University of Cambridge. www.theallpapers.com
Mark scheme, page 1
UNIVERSITY OF CAMBRIDGE INTERNATIONAL EXAMINATIONS International General Certificate of Secondary Education MARK SCHEME for the May/June 2010 question paper for the guidance of teachers 0460 GEOGRAPHY 0460/41 Paper 41 (Alternative to Coursework), maximum raw mark 60 This mark scheme is published as an aid to teachers and candidates, to indicate the requirements of the examination. It shows the basis on which Examiners were instructed to award marks. It does not indicate the details of the discussions that took place at an Examiners’ meeting before marking began, which would have considered the acceptability of alternative answers. Mark schemes must be read in conjunction with the question papers and the report on the examination. • CIE will not enter into discussions or correspondence in connection with these mark schemes. CIE is publishing the mark schemes for the May/June 2010 question papers for most IGCSE, GCE Advanced Level and Advanced Subsidiary Level syllabuses and some Ordinary Level syllabuses. www.theallpapers.com
Mark scheme, page 2
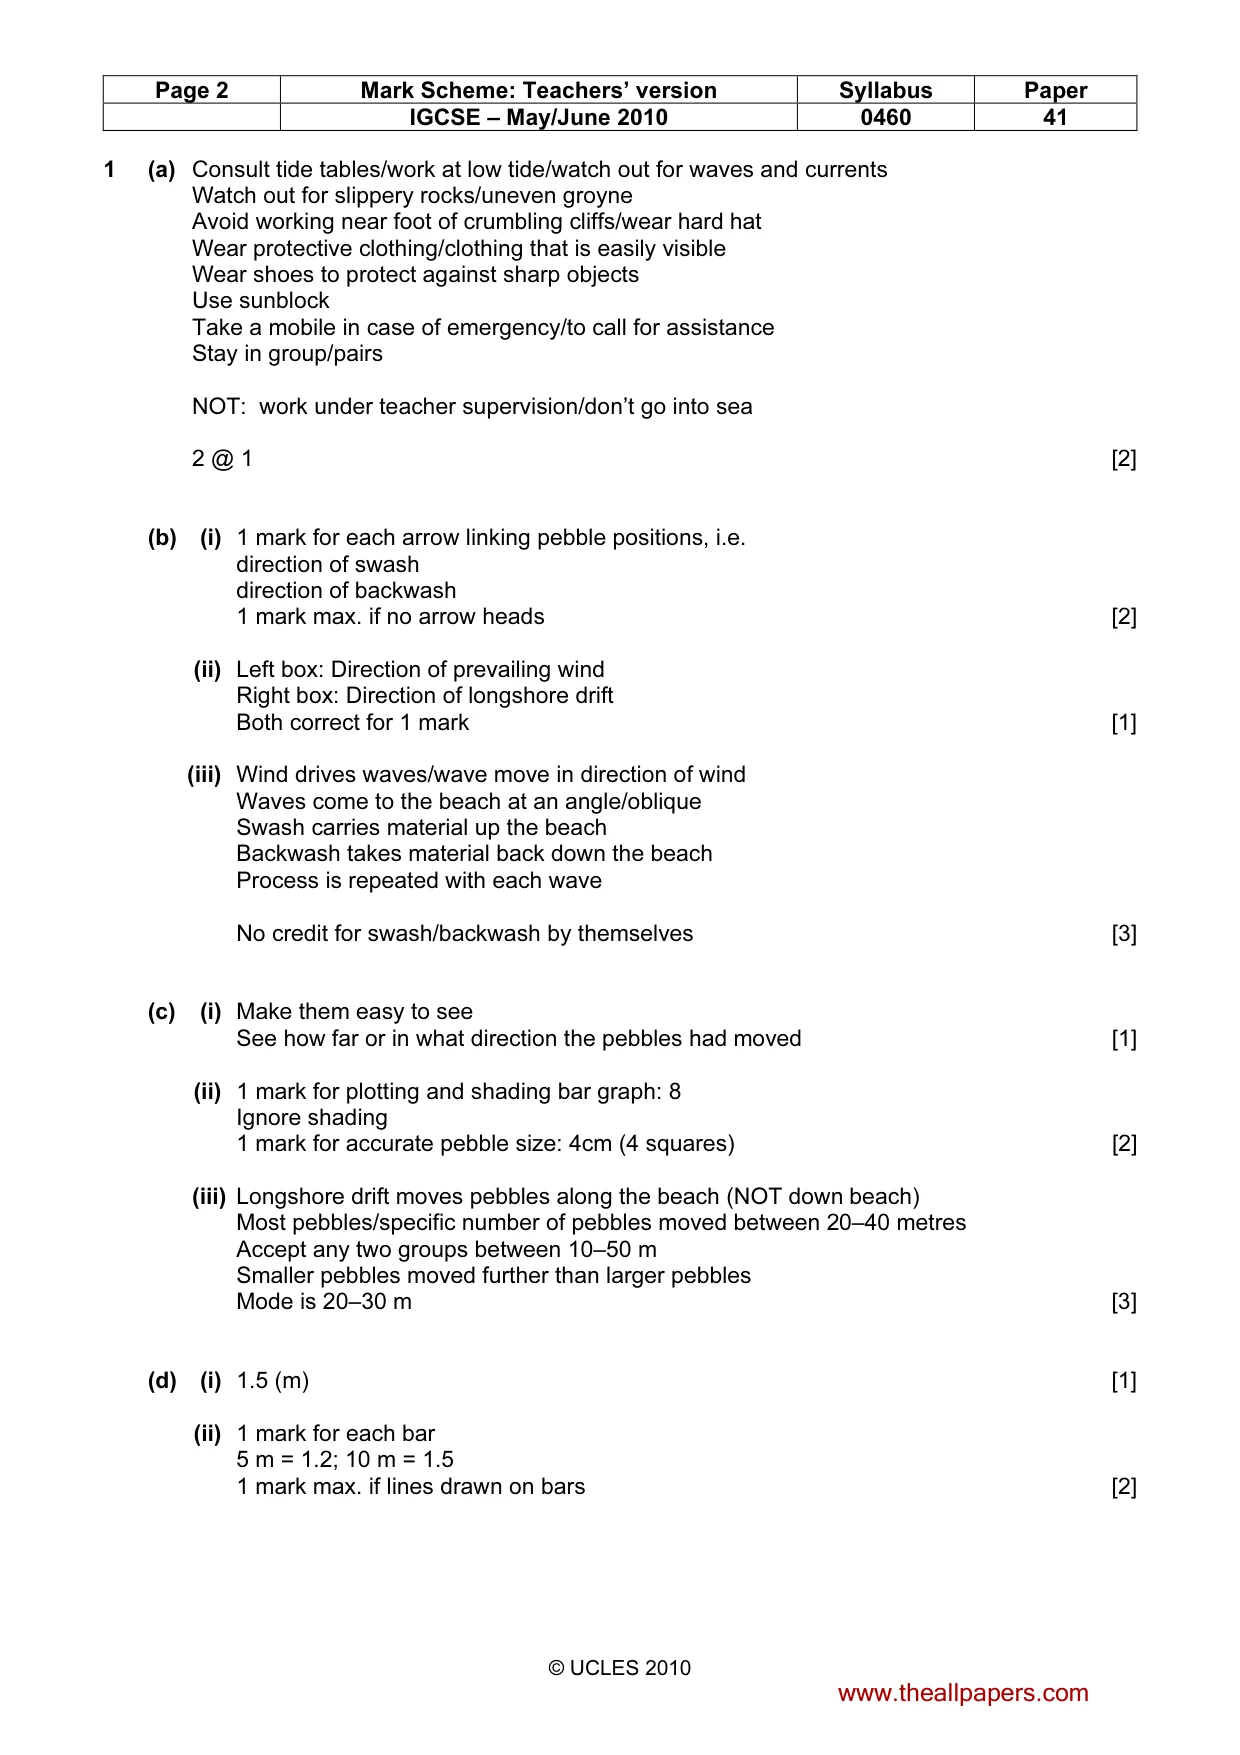
Page 2 Mark Scheme: Teachers’ version Syllabus Paper IGCSE – May/June 2010 0460 41 © UCLES 2010 1 (a) Consult tide tables/work at low tide/watch out for waves and currents Watch out for slippery rocks/uneven groyne Avoid working near foot of crumbling cliffs/wear hard hat Wear protective clothing/clothing that is easily visible Wear shoes to protect against sharp objects Use sunblock Take a mobile in case of emergency/to call for assistance Stay in group/pairs NOT: work under teacher supervision/don’t go into sea 2 @ 1 [2] (b) (i) 1 mark for each arrow linking pebble positions, i.e. direction of swash direction of backwash 1 mark max. if no arrow heads [2] (ii) Left box: Direction of prevailing wind Right box: Direction of longshore drift Both correct for 1 mark [1] (iii) Wind drives waves/wave move in direction of wind Waves come to the beach at an angle/oblique Swash carries material up the beach Backwash takes material back down the beach Process is repeated with each wave No credit for swash/backwash by themselves [3] (c) (i) Make them easy to see See how far or in what direction the pebbles had moved [1] (ii) 1 mark for plotting and shading bar graph: 8 Ignore shading 1 mark for accurate pebble size: 4cm (4 squares) [2] (iii) Longshore drift moves pebbles along the beach (NOT down beach) Most pebbles/specific number of pebbles moved between 20–40 metres Accept any two groups between 10–50 m Smaller pebbles moved further than larger pebbles Mode is 20–30 m [3] (d) (i) 1.5 (m) [1] (ii) 1 mark for each bar 5 m = 1.2; 10 m = 1.5 1 mark max. if lines drawn on bars [2] www.theallpapers.com
Mark scheme, page 3
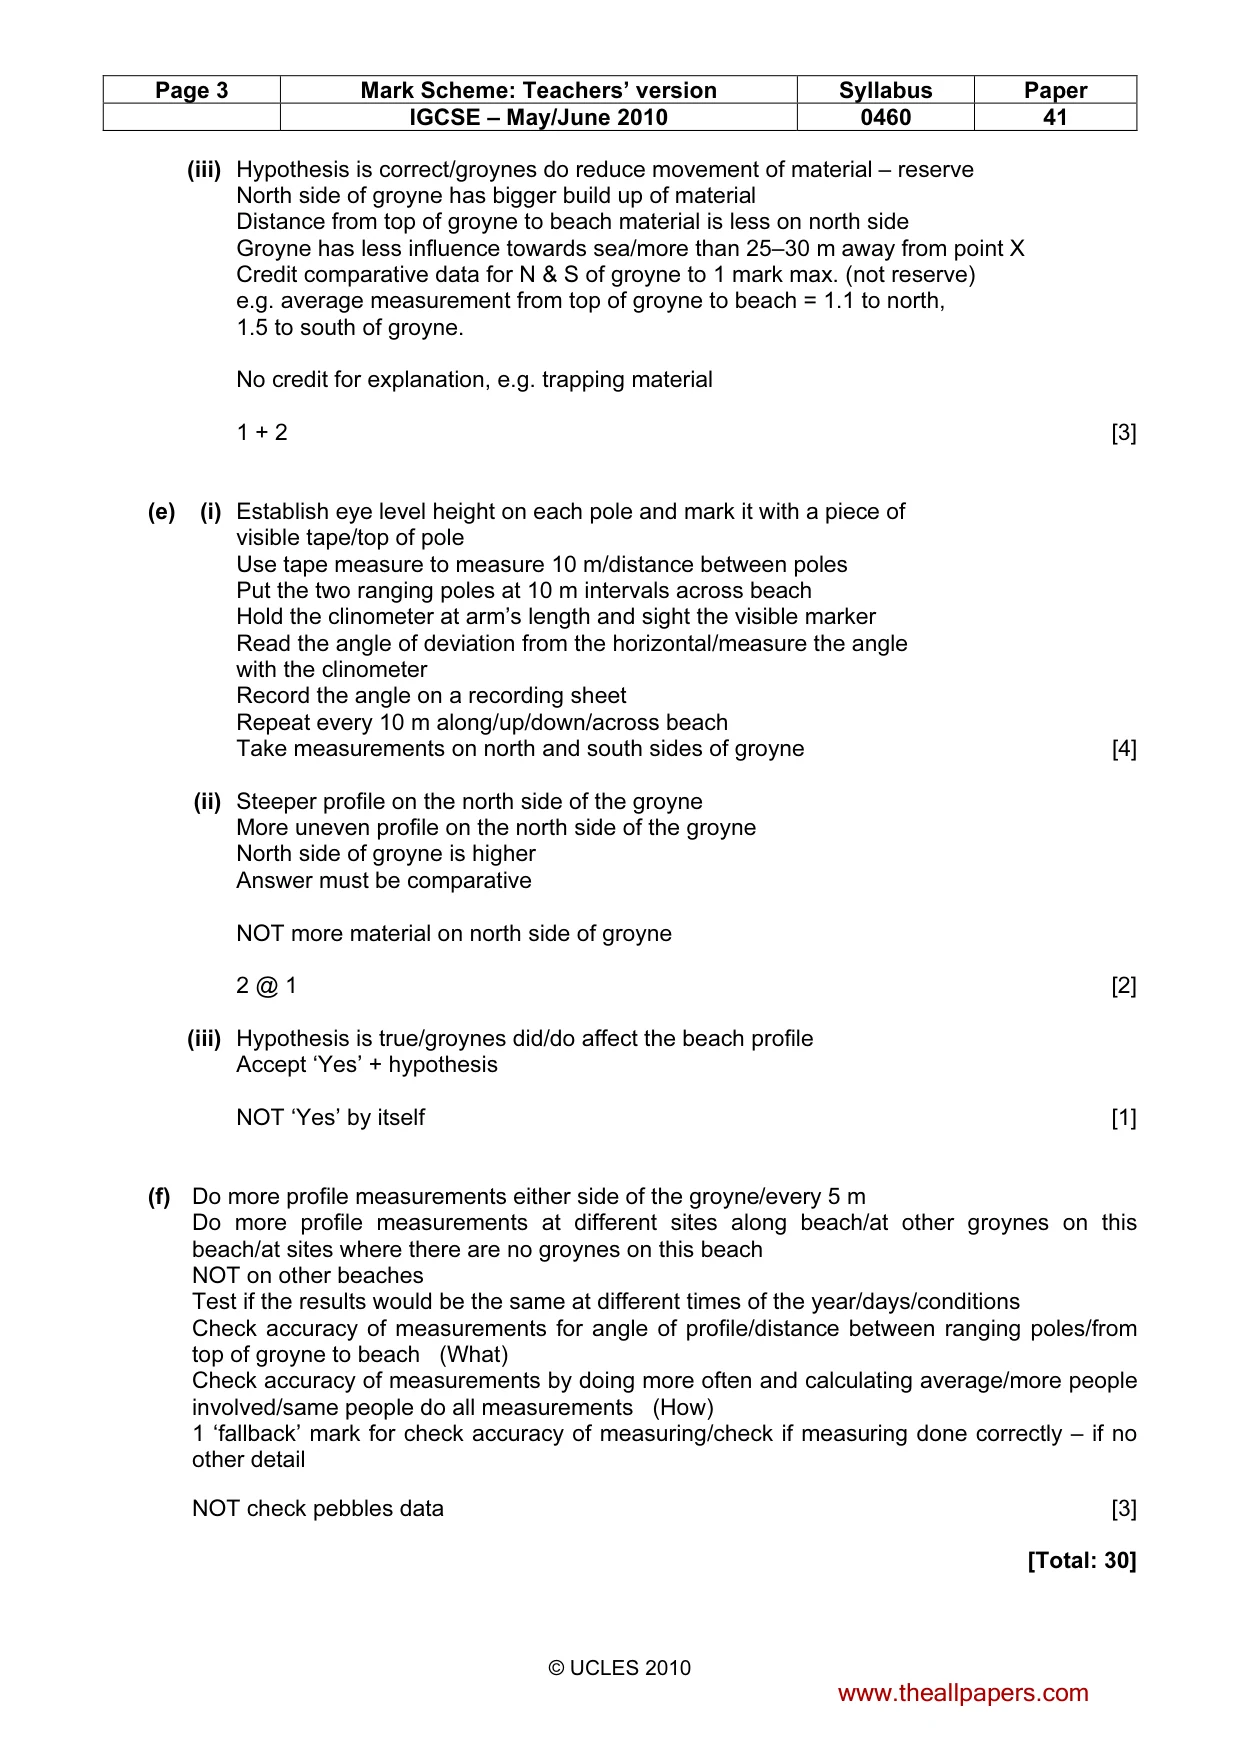
Page 3 Mark Scheme: Teachers’ version Syllabus Paper IGCSE – May/June 2010 0460 41 © UCLES 2010 (iii) Hypothesis is correct/groynes do reduce movement of material – reserve North side of groyne has bigger build up of material Distance from top of groyne to beach material is less on north side Groyne has less influence towards sea/more than 25–30 m away from point X Credit comparative data for N & S of groyne to 1 mark max. (not reserve) e.g. average measurement from top of groyne to beach = 1.1 to north, 1.5 to south of groyne. No credit for explanation, e.g. trapping material 1 + 2 [3] (e) (i) Establish eye level height on each pole and mark it with a piece of visible tape/top of pole Use tape measure to measure 10 m/distance between poles Put the two ranging poles at 10 m intervals across beach Hold the clinometer at arm’s length and sight the visible marker Read the angle of deviation from the horizontal/measure the angle with the clinometer Record the angle on a recording sheet Repeat every 10 m along/up/down/across beach Take measurements on north and south sides of groyne [4] (ii) Steeper profile on the north side of the groyne More uneven profile on the north side of the groyne North side of groyne is higher Answer must be comparative NOT more material on north side of groyne 2 @ 1 [2] (iii) Hypothesis is true/groynes did/do affect the beach profile Accept ‘Yes’ + hypothesis NOT ‘Yes’ by itself [1] (f) Do more profile measurements either side of the groyne/every 5 m Do more profile measurements at different sites along beach/at other groynes on this beach/at sites where there are no groynes on this beach NOT on other beaches Test if the results would be the same at different times of the year/days/conditions Check accuracy of measurements for angle of profile/distance between ranging poles/from top of groyne to beach (What) Check accuracy of measurements by doing more often and calculating average/more people involved/same people do all measurements (How) 1 ‘fallback’ mark for check accuracy of measuring/check if measuring done correctly – if no other detail NOT check pebbles data [3] [Total: 30] www.theallpapers.com
Mark scheme, page 4
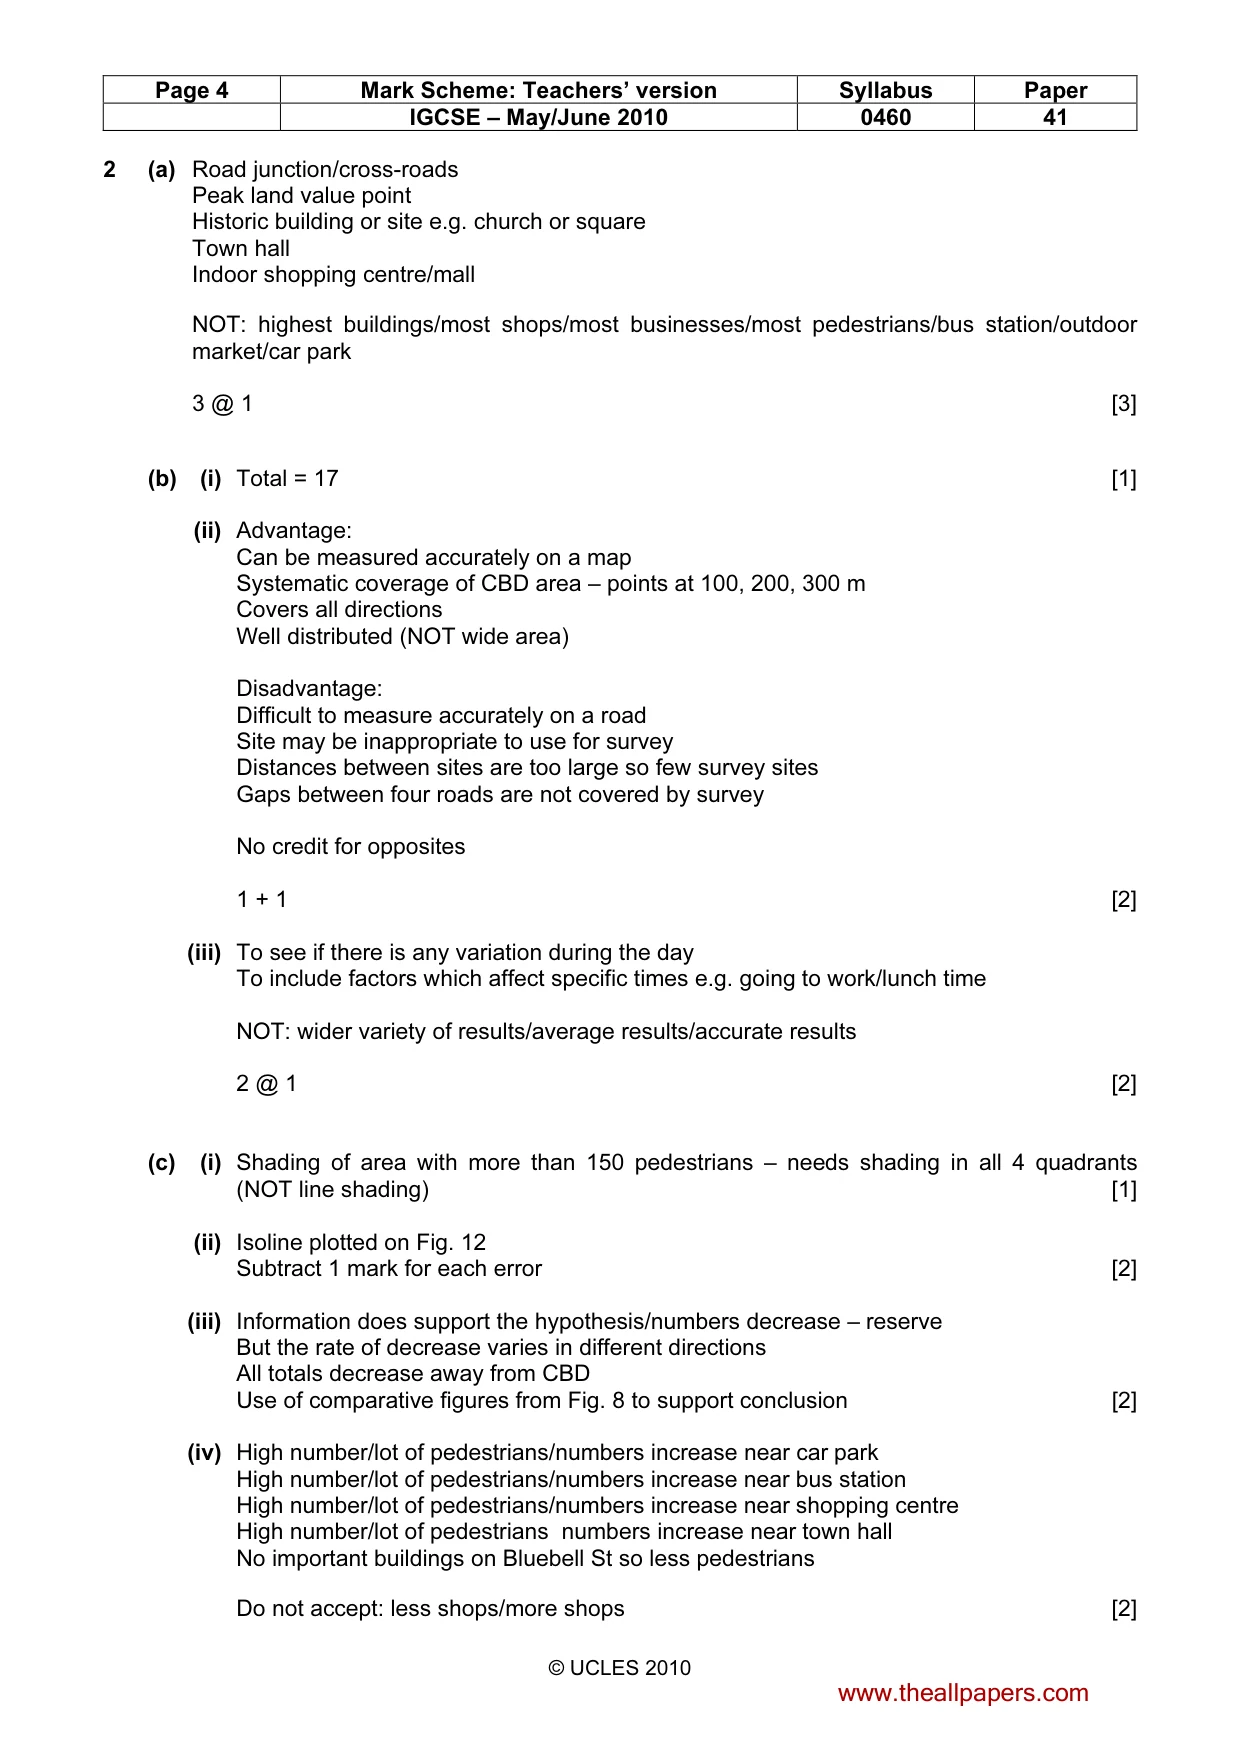
Page 4 Mark Scheme: Teachers’ version Syllabus Paper IGCSE – May/June 2010 0460 41 © UCLES 2010 2 (a) Road junction/cross-roads Peak land value point Historic building or site e.g. church or square Town hall Indoor shopping centre/mall NOT: highest buildings/most shops/most businesses/most pedestrians/bus station/outdoor market/car park 3 @ 1 [3] (b) (i) Total = 17 [1] (ii) Advantage: Can be measured accurately on a map Systematic coverage of CBD area – points at 100, 200, 300 m Covers all directions Well distributed (NOT wide area) Disadvantage: Difficult to measure accurately on a road Site may be inappropriate to use for survey Distances between sites are too large so few survey sites Gaps between four roads are not covered by survey No credit for opposites 1 + 1 [2] (iii) To see if there is any variation during the day To include factors which affect specific times e.g. going to work/lunch time NOT: wider variety of results/average results/accurate results 2 @ 1 [2] (c) (i) Shading of area with more than 150 pedestrians – needs shading in all 4 quadrants (NOT line shading) [1] (ii) Isoline plotted on Fig. 12 Subtract 1 mark for each error [2] (iii) Information does support the hypothesis/numbers decrease – reserve But the rate of decrease varies in different directions All totals decrease away from CBD Use of comparative figures from Fig. 8 to support conclusion [2] (iv) High number/lot of pedestrians/numbers increase near car park High number/lot of pedestrians/numbers increase near bus station High number/lot of pedestrians/numbers increase near shopping centre High number/lot of pedestrians numbers increase near town hall No important buildings on Bluebell St so less pedestrians Do not accept: less shops/more shops [2] www.theallpapers.com
Mark scheme, page 5
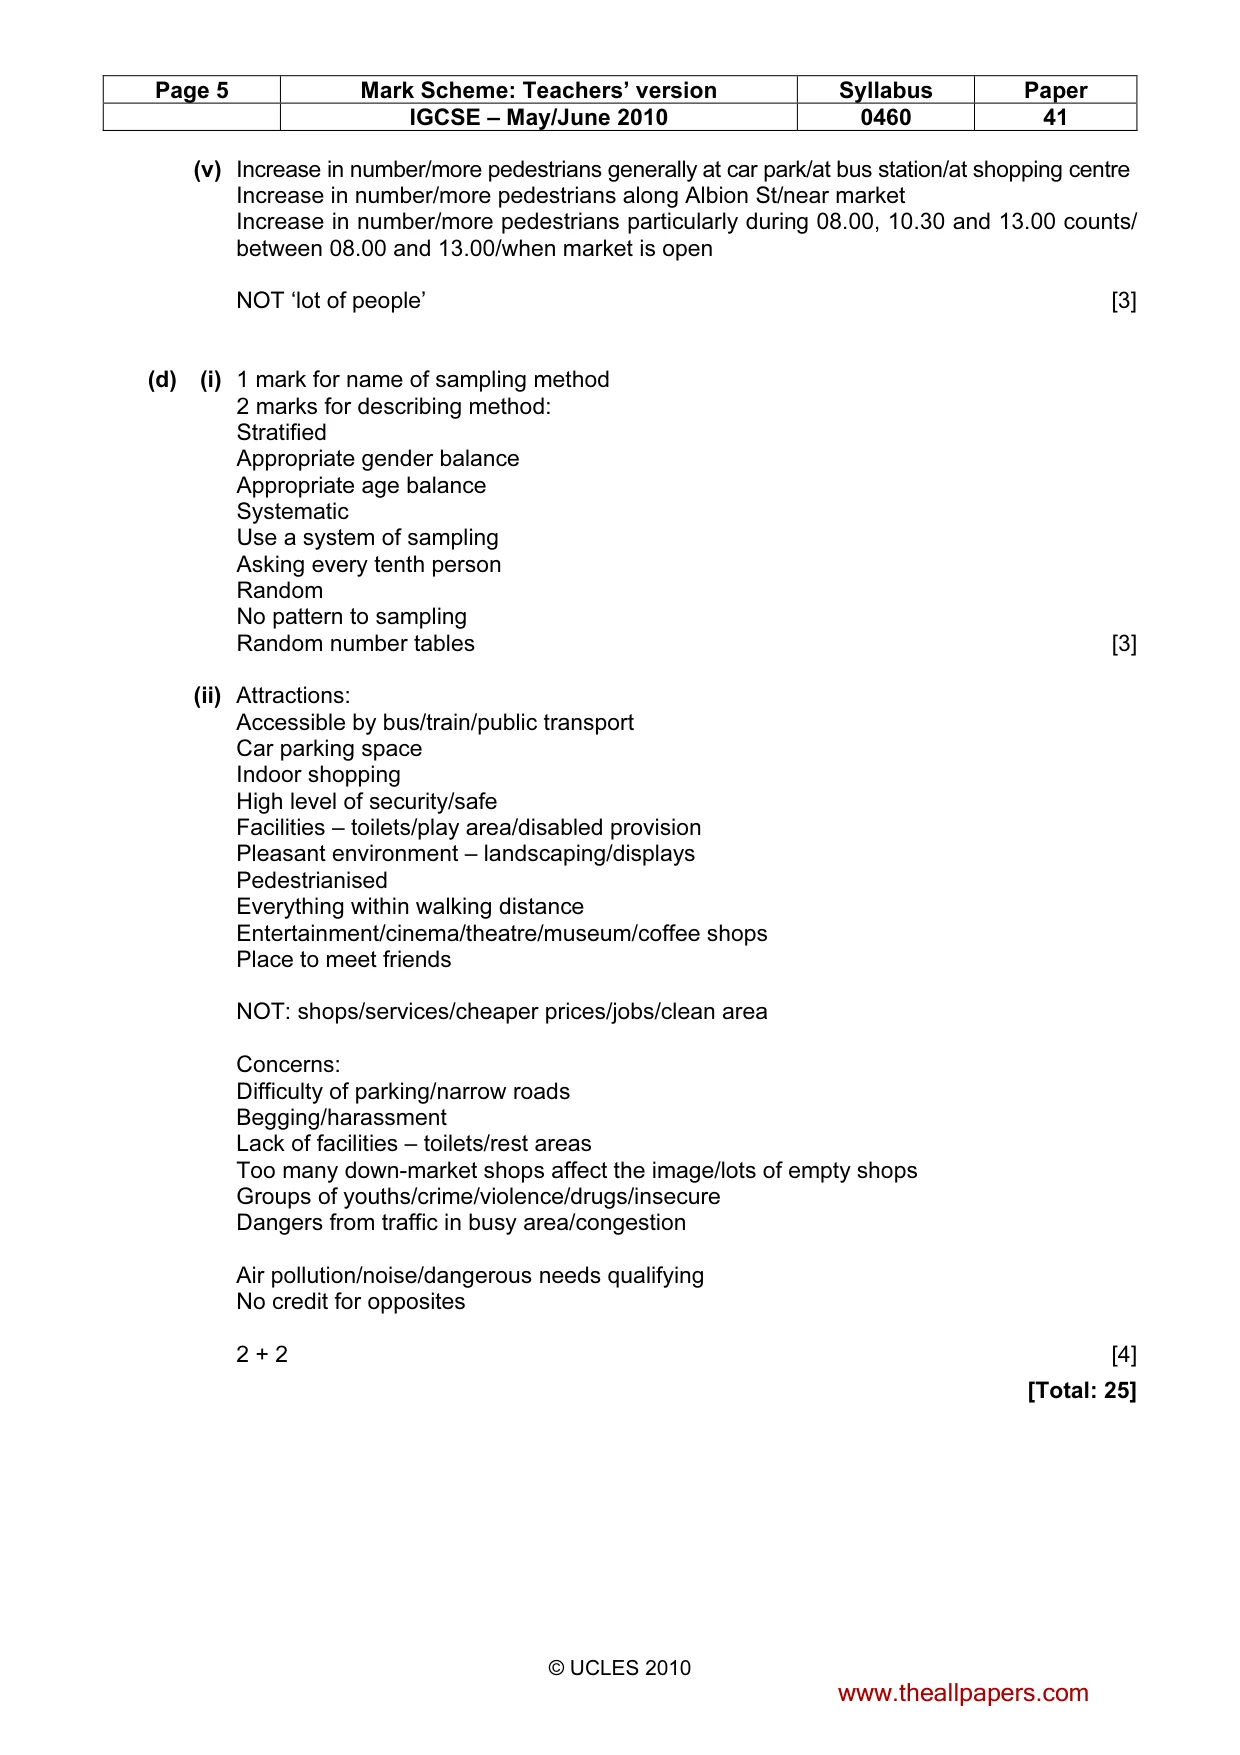
Page 5 Mark Scheme: Teachers’ version Syllabus Paper IGCSE – May/June 2010 0460 41 © UCLES 2010 (v) Increase in number/more pedestrians generally at car park/at bus station/at shopping centre Increase in number/more pedestrians along Albion St/near market Increase in number/more pedestrians particularly during 08.00, 10.30 and 13.00 counts/ between 08.00 and 13.00/when market is open NOT ‘lot of people’ [3] (d) (i) 1 mark for name of sampling method 2 marks for describing method: Stratified Appropriate gender balance Appropriate age balance Systematic Use a system of sampling Asking every tenth person Random No pattern to sampling Random number tables [3] (ii) Attractions: Accessible by bus/train/public transport Car parking space Indoor shopping High level of security/safe Facilities – toilets/play area/disabled provision Pleasant environment – landscaping/displays Pedestrianised Everything within walking distance Entertainment/cinema/theatre/museum/coffee shops Place to meet friends NOT: shops/services/cheaper prices/jobs/clean area Concerns: Difficulty of parking/narrow roads Begging/harassment Lack of facilities – toilets/rest areas Too many down-market shops affect the image/lots of empty shops Groups of youths/crime/violence/drugs/insecure Dangers from traffic in busy area/congestion Air pollution/noise/dangerous needs qualifying No credit for opposites 2 + 2 [4] [Total: 25] www.theallpapers.com
Mark scheme, page 6
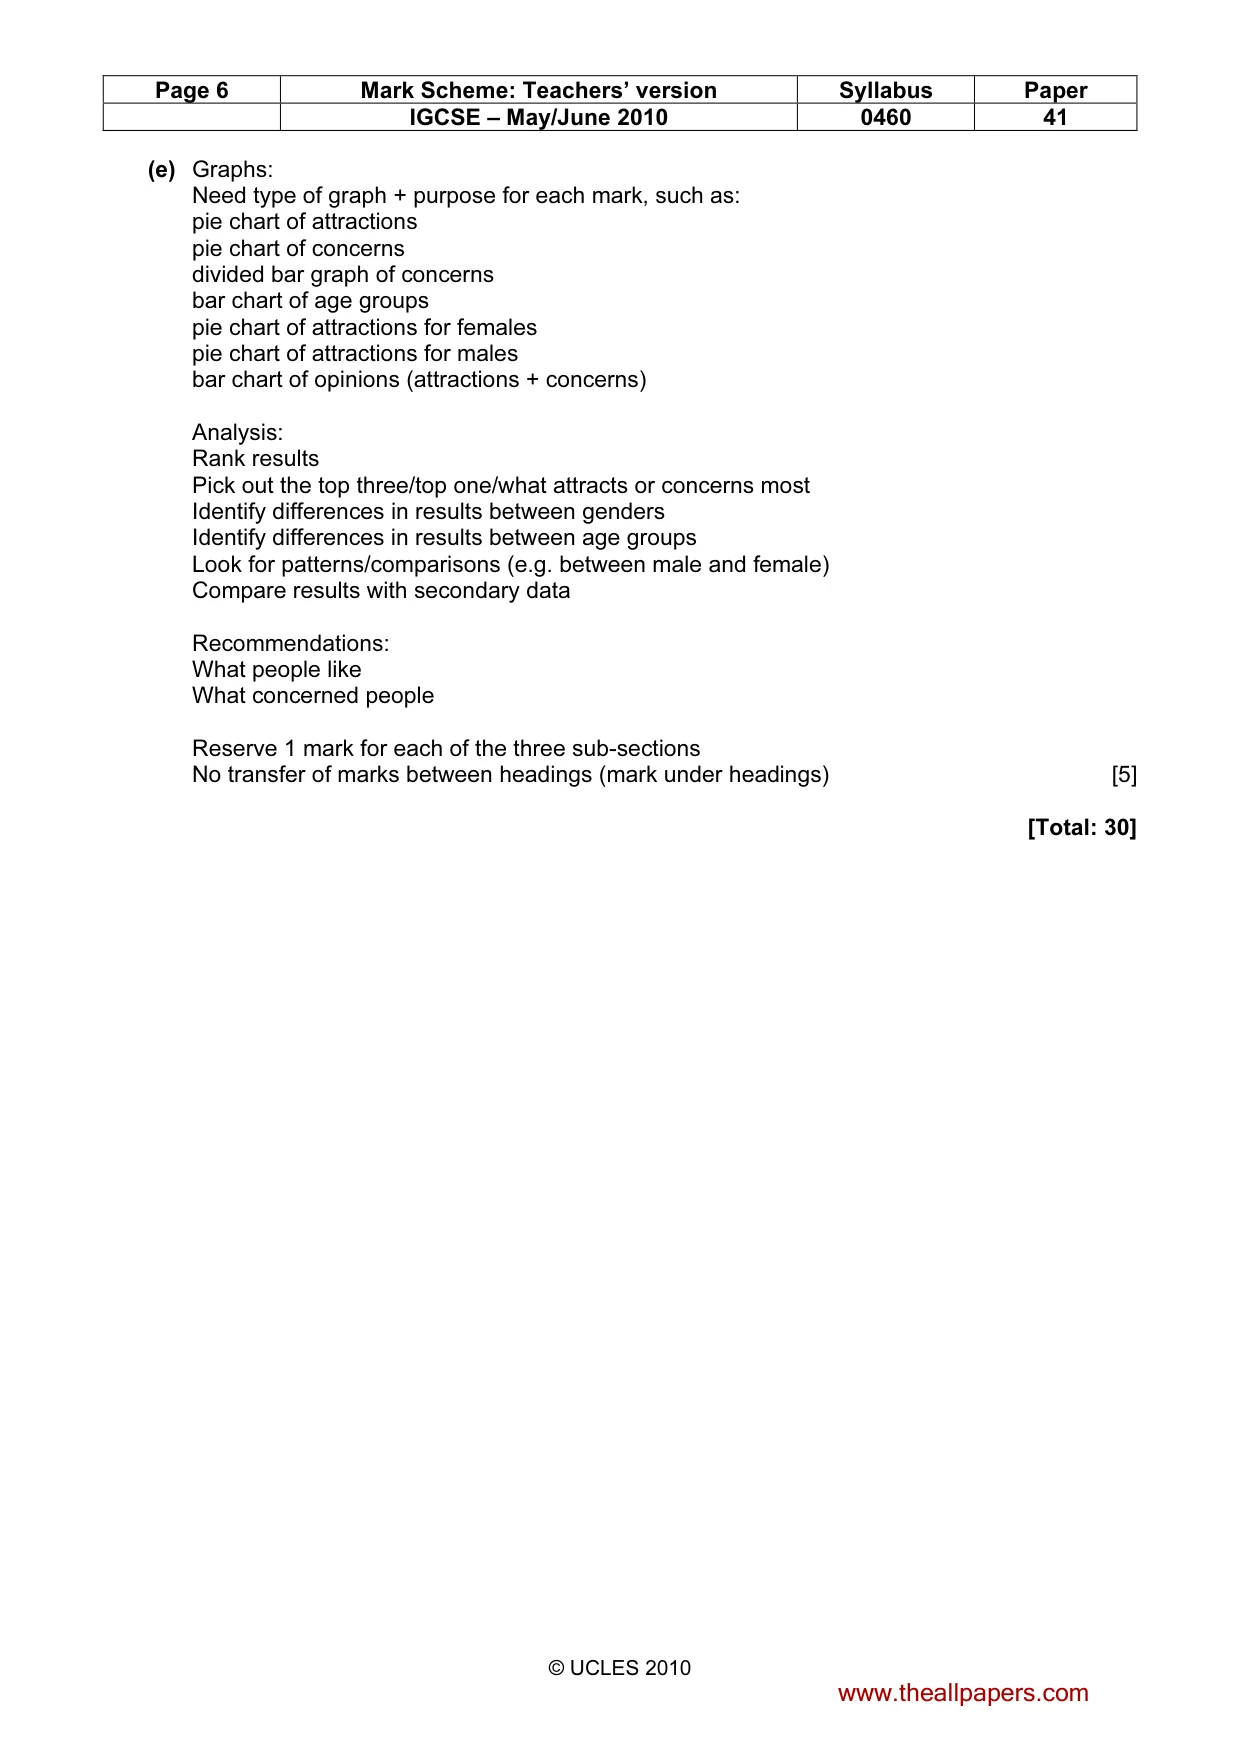
Page 6 Mark Scheme: Teachers’ version Syllabus Paper IGCSE – May/June 2010 0460 41 © UCLES 2010 (e) Graphs: Need type of graph + purpose for each mark, such as: pie chart of attractions pie chart of concerns divided bar graph of concerns bar chart of age groups pie chart of attractions for females pie chart of attractions for males bar chart of opinions (attractions + concerns) Analysis: Rank results Pick out the top three/top one/what attracts or concerns most Identify differences in results between genders Identify differences in results between age groups Look for patterns/comparisons (e.g. between male and female) Compare results with secondary data Recommendations: What people like What concerned people Reserve 1 mark for each of the three sub-sections No transfer of marks between headings (mark under headings) [5] [Total: 30] www.theallpapers.com
What you needed in this session
Cambridge’s own grade thresholds for 2010 May/June, Paper 4 · Variant 1. A higher threshold means an easier paper — the bar moves with how the cohort did.