Cambridge IGCSE Geography 0460 — 2010 May/June Paper 2 · Variant 3
0460/23/M/J/10 · 60 marks · ≈68 min
The question paper and its mark scheme, free to read here and free to download. This is Cambridge’s own paper, exactly as it was sat.
Question paper16 pages




Mark scheme4 pages
Answers below. Sit the paper first if you are practising.
Paper as text
Question paper, page 1
This document consists of 14 printed pages, 2 blank pages and 1 Insert. DC (AC/CGW) 22465/6 © UCLES 2010 [Turn over UNIVERSITY OF CAMBRIDGE INTERNATIONAL EXAMINATIONS International General Certificate of Secondary Education * 4 1 7 2 8 9 0 5 9 9 * GEOGRAPHY 0460/23 Paper 2 May/June 2010 1 hour 30 minutes Candidates answer on the Question Paper. Additional Materials: Ruler Protractor Plain paper 1:50 000 Survey Map Extract is enclosed with this question paper. READ THESE INSTRUCTIONS FIRST Write your Centre number, candidate number and name on all the work you hand in. Write in dark blue or black pen. You may use a soft pencil for any diagrams, graphs or rough working. Do not use staples, paper clips, highlighters, glue or correction fluid. DO NOT WRITE ON ANY BARCODES. Answer all questions. The Insert contains Photograph A for Question 4. Sketch maps and diagrams should be drawn whenever they serve to illustrate an answer. The Survey Map Extract and the Insert are not required by the Examiner. At the end of the examination, fasten all your work securely together. The number of marks is given in brackets [ ] at the end of each question or part question. For Examiner’s Use Q1 Q2 Q3 Q4 Q5 Q6 Total www.theallpapers.com
Question paper, page 2
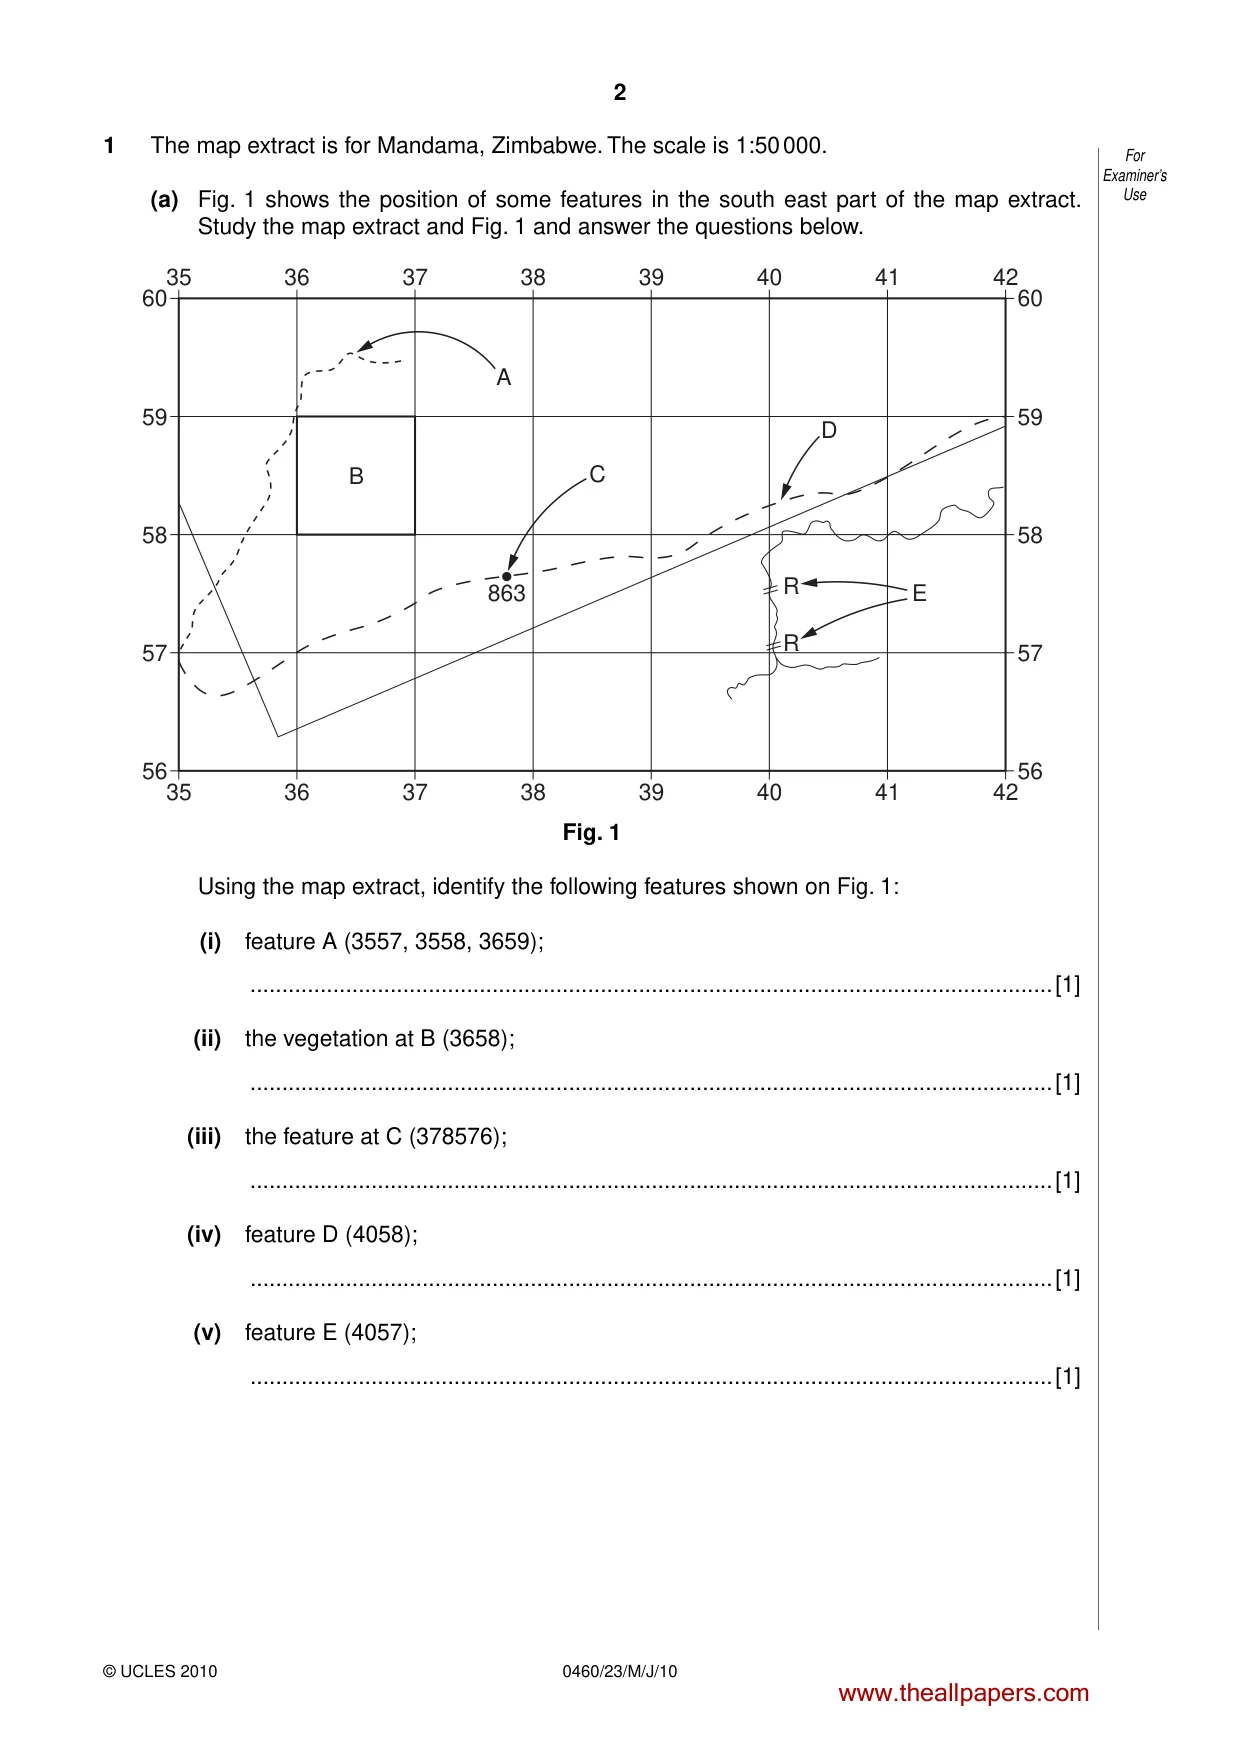
2 © UCLES 2010 0460/23/M/J/10 For Examiner’s Use 1 The map extract is for Mandama, Zimbabwe. The scale is 1:50 000. (a) Fig. 1 shows the position of some features in the south east part of the map extract. Study the map extract and Fig. 1 and answer the questions below. 60 59 B A C D E R R 58 57 56 60 35 36 37 38 39 40 41 42 35 36 37 38 39 40 41 42 59 58 57 56 863 Fig. 1 Using the map extract, identify the following features shown on Fig. 1: (i) feature A (3557, 3558, 3659); …[1] (ii) the vegetation at B (3658); …[1] (iii) the feature at C (378576); …[1] (iv) feature D (4058); …[1] (v) feature E (4057); …[1] www.theallpapers.com
Question paper, page 3
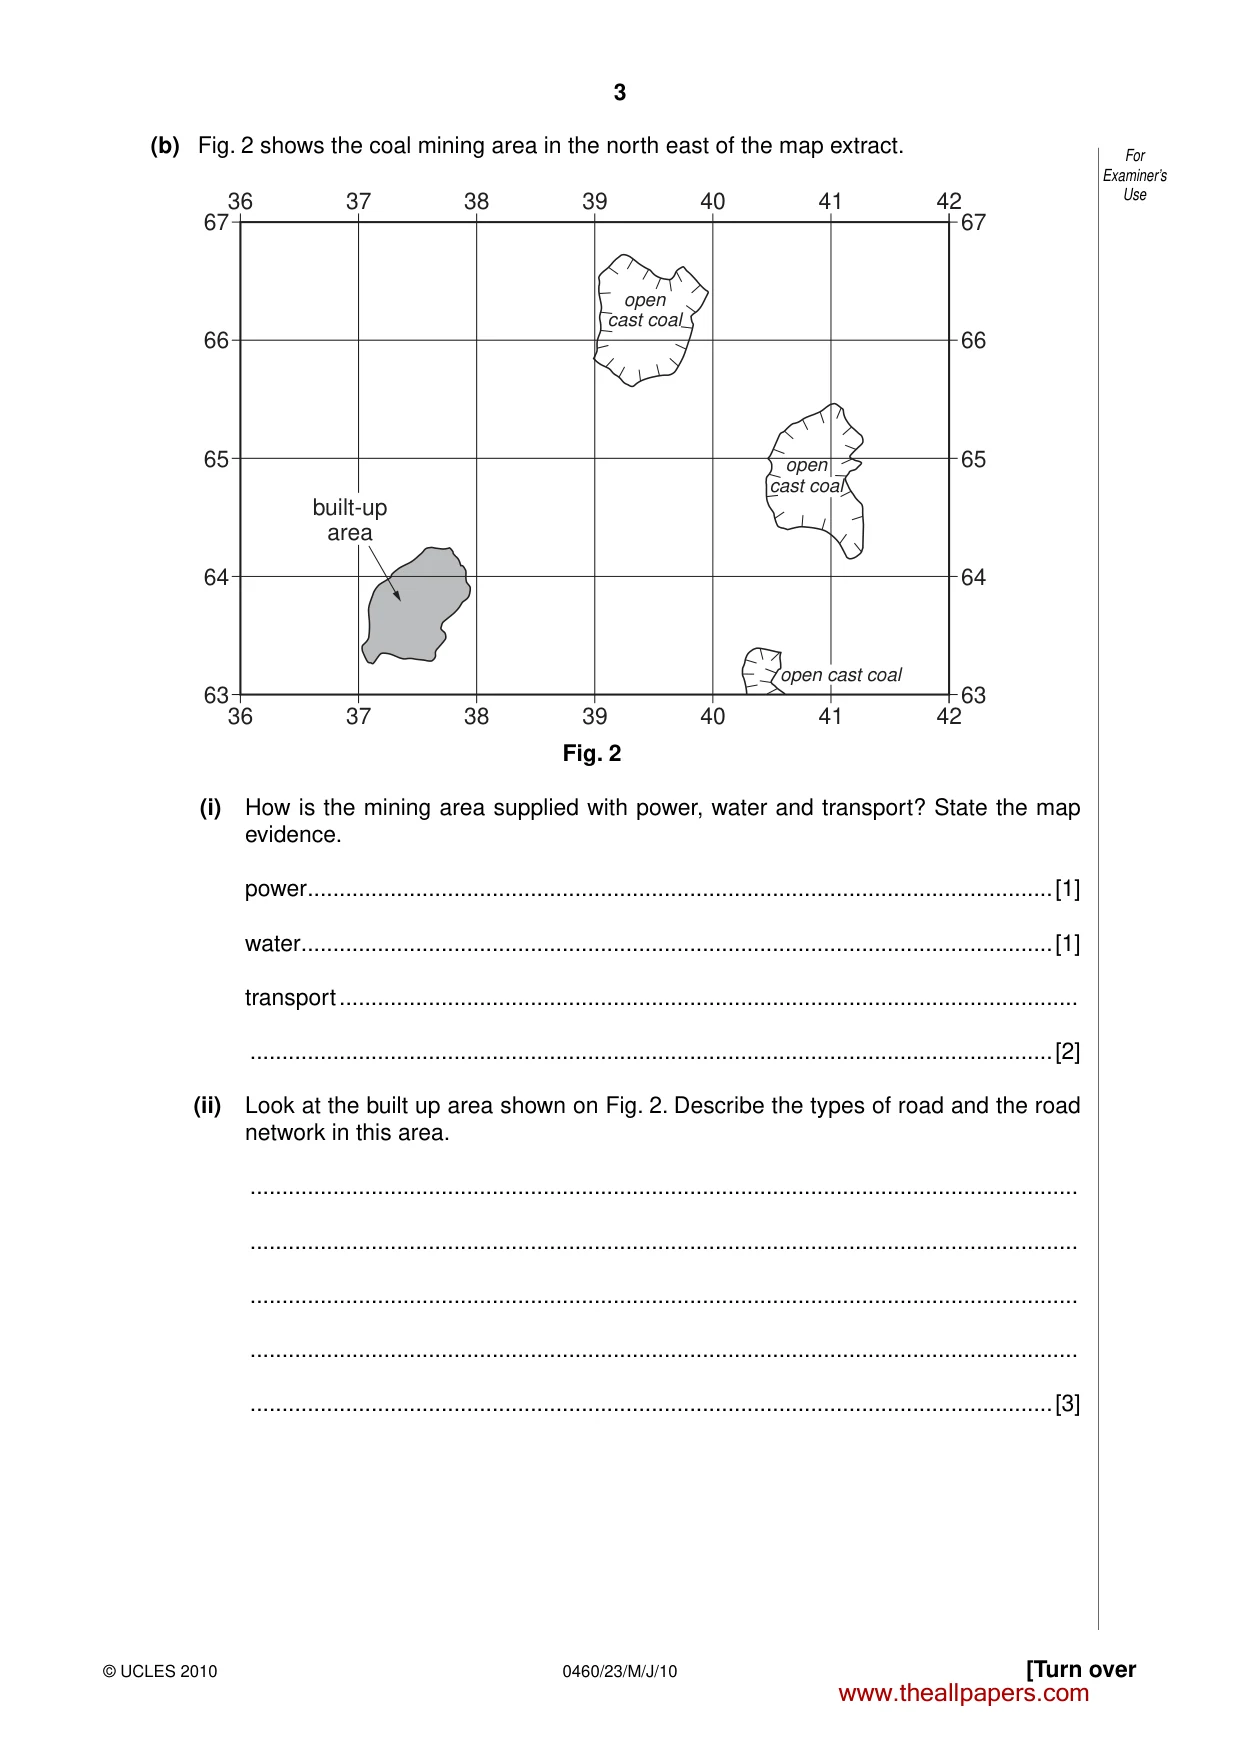
3 © UCLES 2010 [Turn over 0460/23/M/J/10 For Examiner’s Use (b) Fig. 2 shows the coal mining area in the north east of the map extract. 67 66 65 64 63 67 36 37 38 39 40 41 42 36 37 38 39 40 41 42 66 65 64 63 built-up area open cast coal open cast coal open cast coal Fig. 2 (i) How is the mining area supplied with power, water and transport? State the map evidence. power …[1] water …[1] transport … …[2] (ii) Look at the built up area shown on Fig. 2. Describe the types of road and the road network in this area. … … … … …[3] www.theallpapers.com
Question paper, page 4
4 © UCLES 2010 0460/23/M/J/10 For Examiner’s Use (c) Look at the large rivers in the western part of the map extract. (i) Find the major river confluence (junction) one kilometre south of Gobo Sulphur Springs. Give the six figure grid reference of the confluence. … [1] (ii) State the general direction of flow of the Kwizizi river. Give one reason for your answer. Direction of flow … Reason … … … [2] www.theallpapers.com
Question paper, page 5
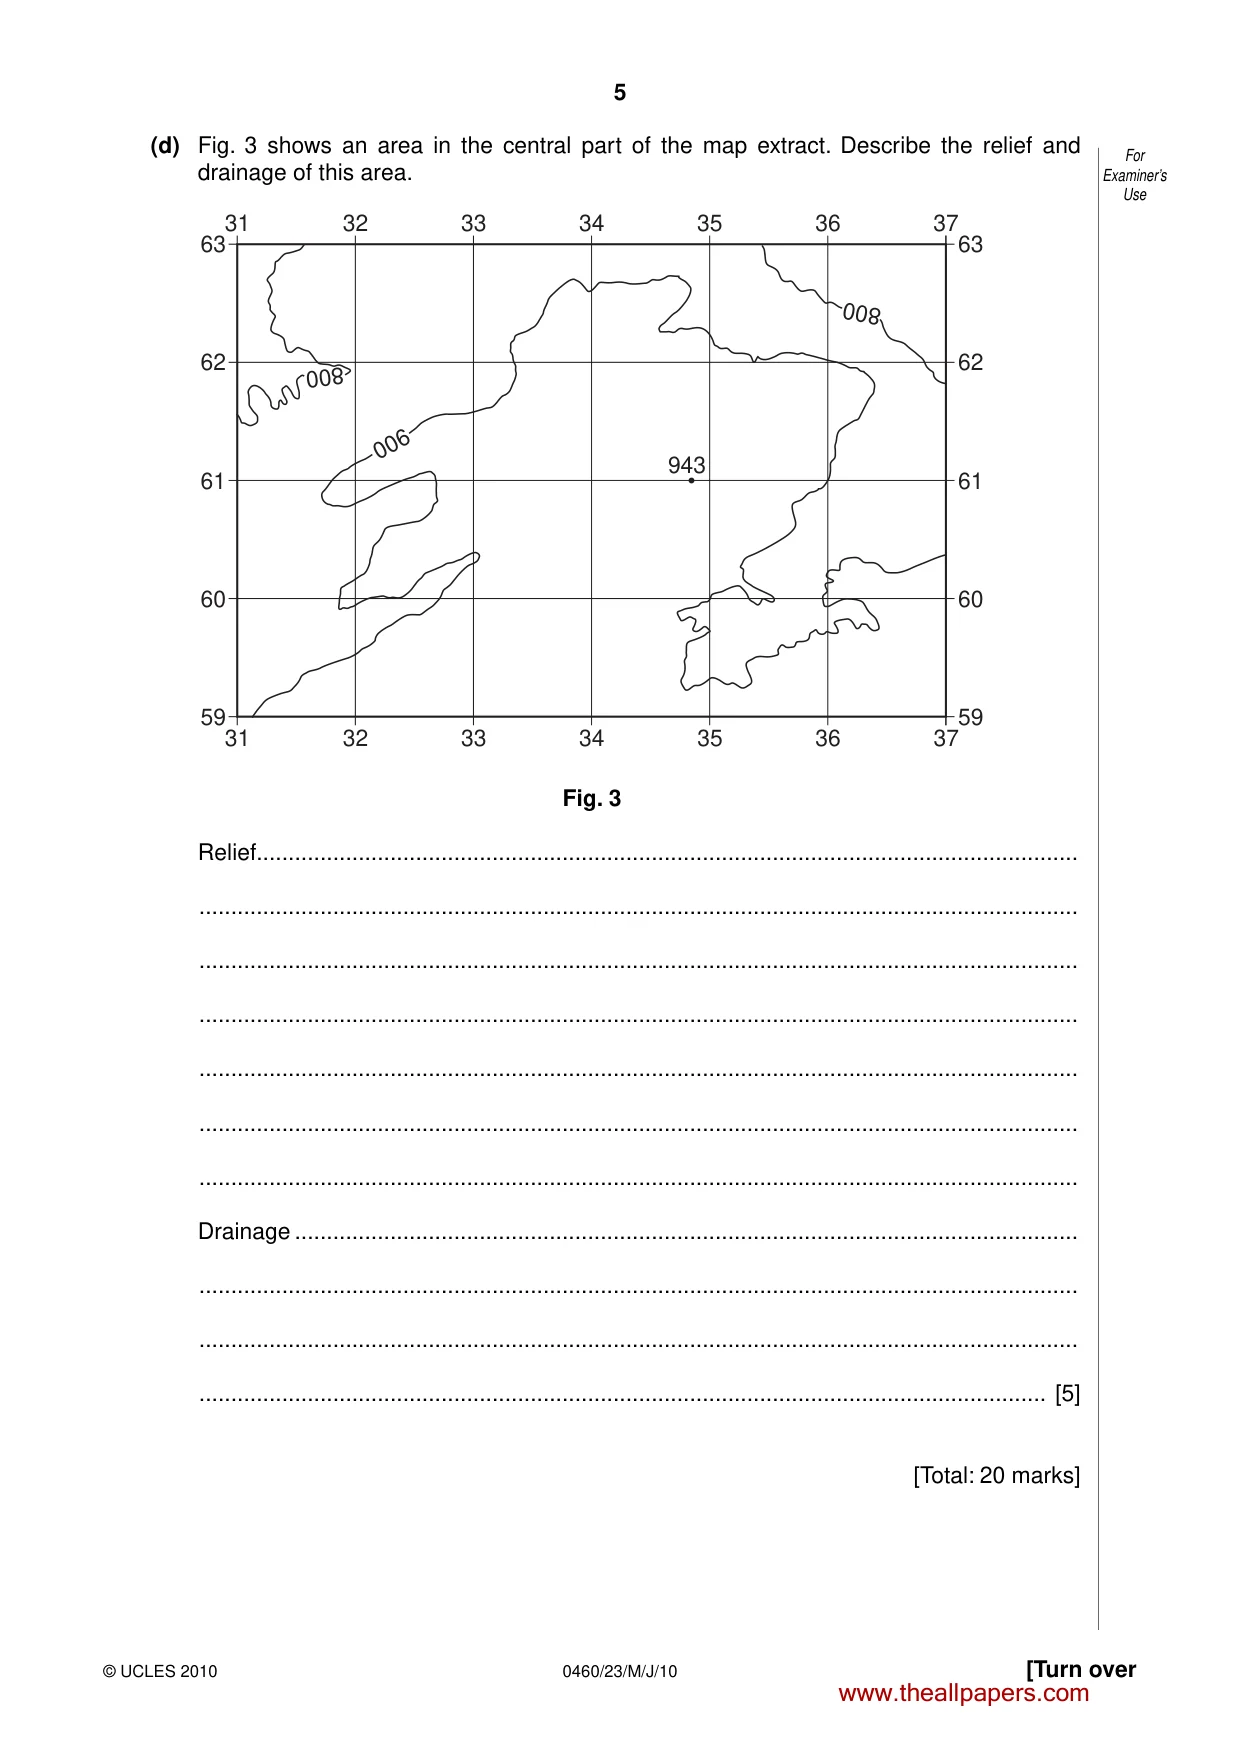
5 © UCLES 2010 [Turn over 0460/23/M/J/10 For Examiner’s Use (d) Fig. 3 shows an area in the central part of the map extract. Describe the relief and drainage of this area. 63 62 61 60 59 63 31 32 33 34 35 36 37 31 32 943 800 800 900 33 34 35 36 37 62 61 60 59 Fig. 3 Relief… … … … … … … Drainage … … … … [5] [Total: 20 marks] www.theallpapers.com
Question paper, page 6
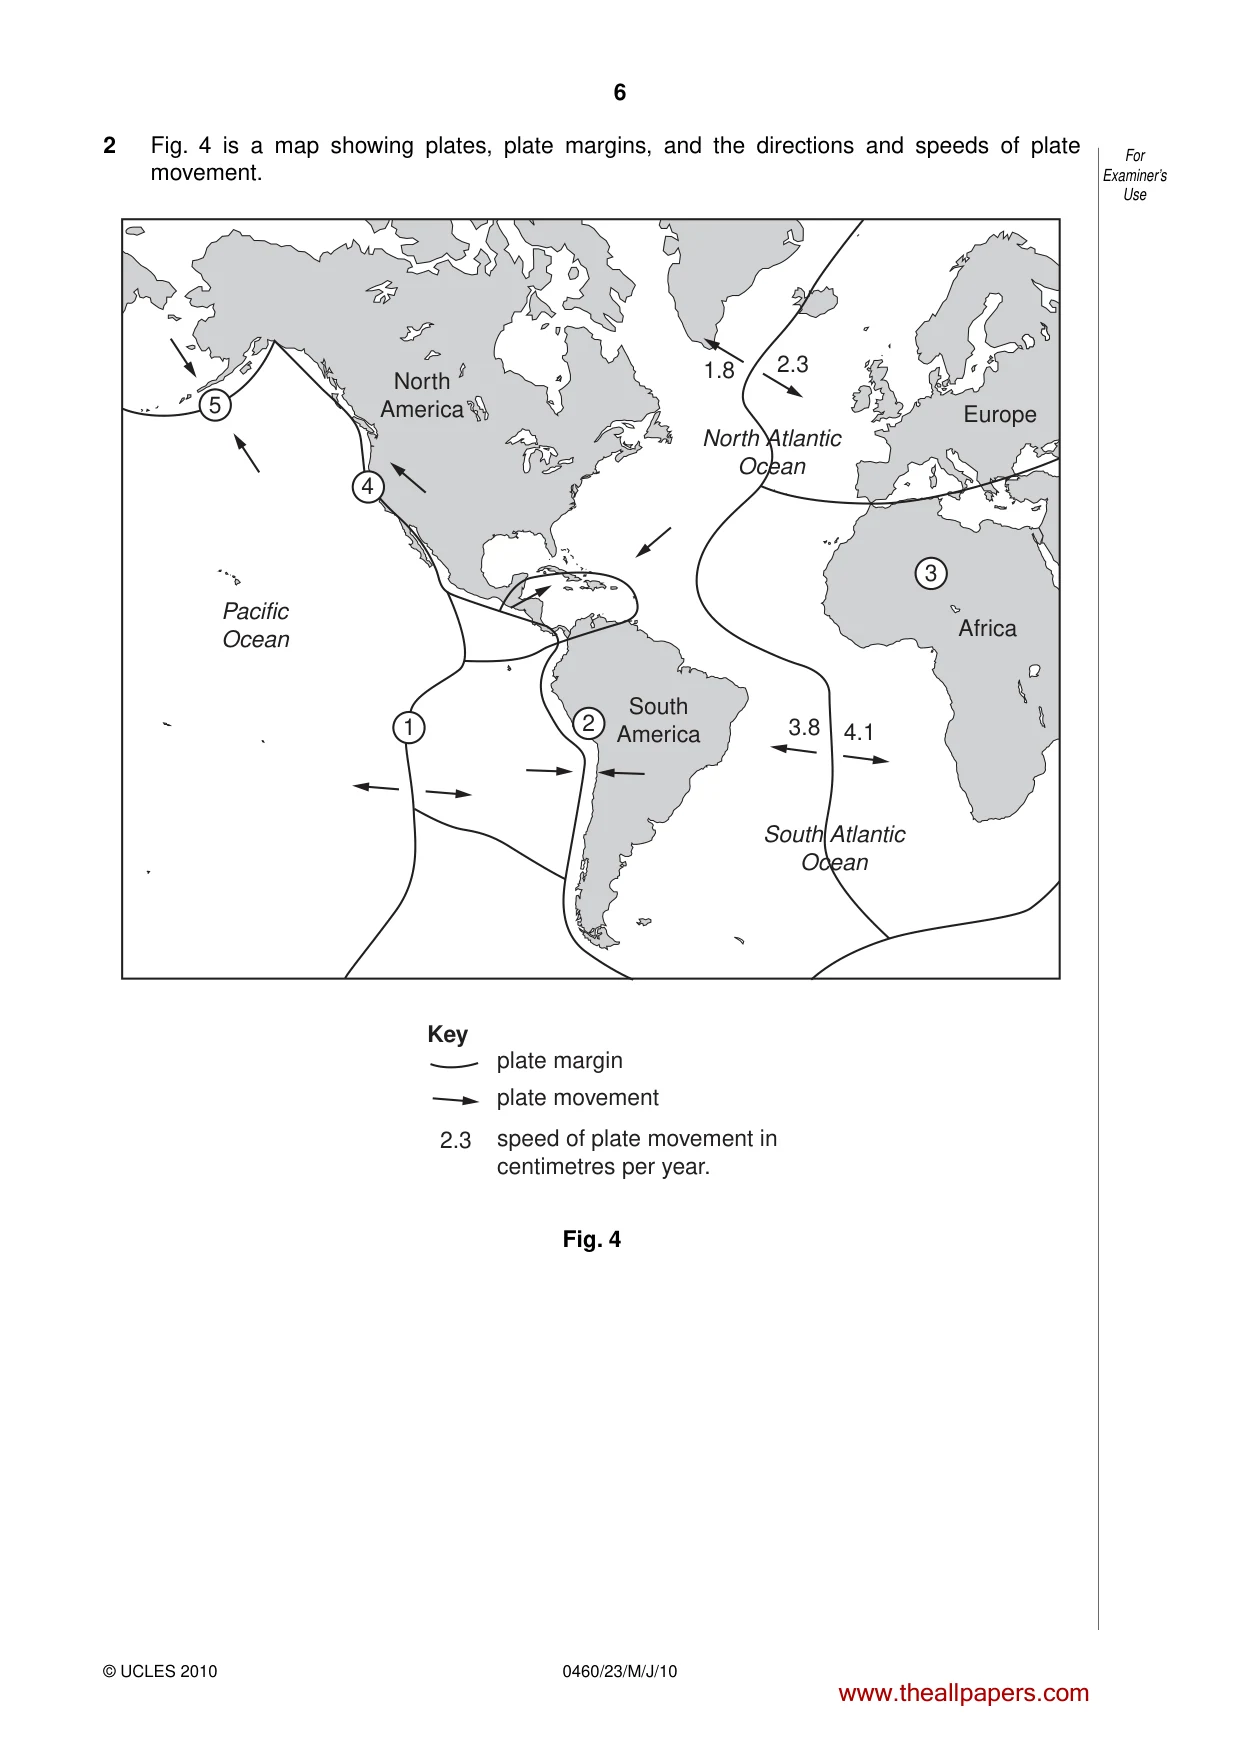
6 © UCLES 2010 0460/23/M/J/10 For Examiner’s Use 2 Fig. 4 is a map showing plates, plate margins, and the directions and speeds of plate movement. Pacific Ocean North Atlantic Ocean South Atlantic Ocean Africa South America Key plate margin plate movement speed of plate movement in centimetres per year. North America Europe 3 3.8 2.3 4.1 2.3 1.8 4 5 1 2 Fig. 4 www.theallpapers.com
Question paper, page 7
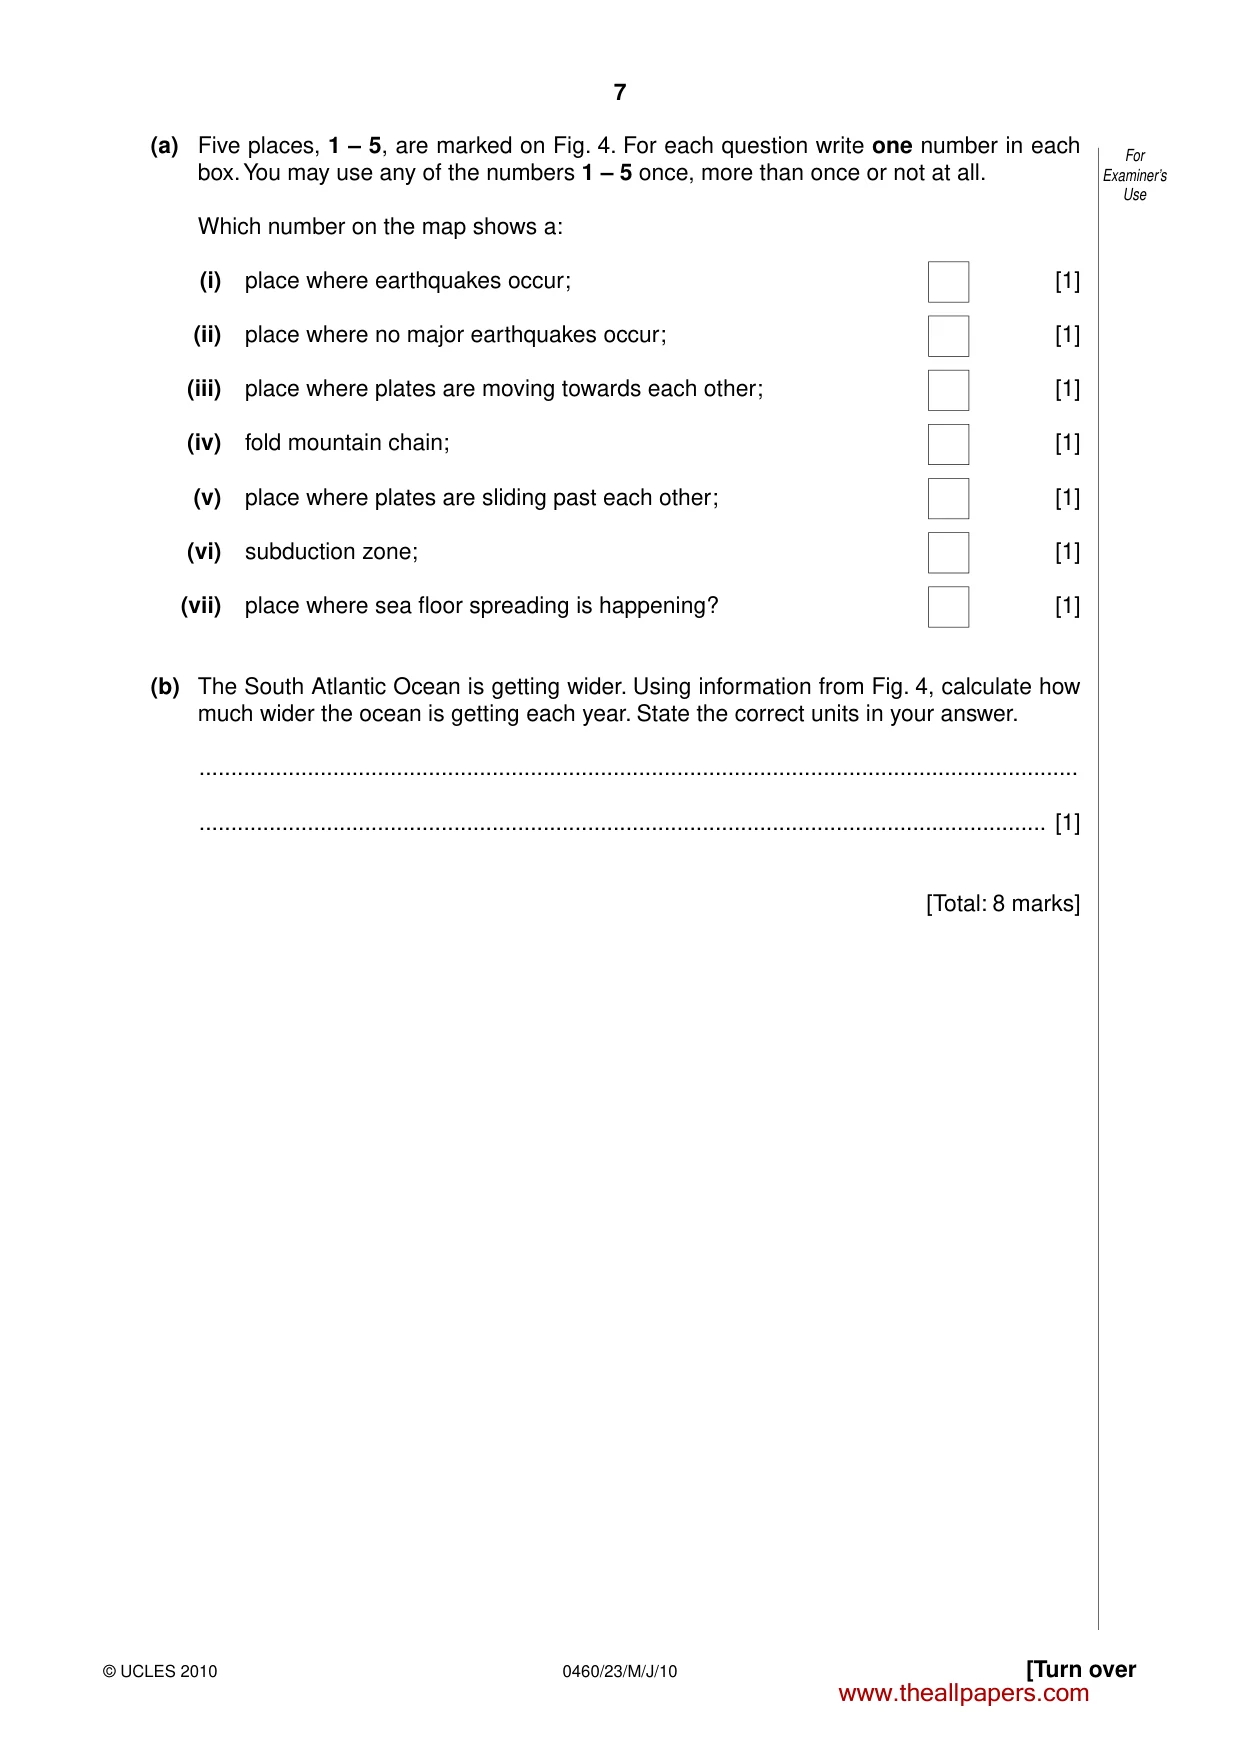
7 © UCLES 2010 [Turn over 0460/23/M/J/10 For Examiner’s Use (a) Five places, 1 – 5, are marked on Fig. 4. For each question write one number in each box. You may use any of the numbers 1 – 5 once, more than once or not at all. Which number on the map shows a: (i) place where earthquakes occur; [1] (ii) place where no major earthquakes occur; [1] (iii) place where plates are moving towards each other; [1] (iv) fold mountain chain; [1] (v) place where plates are sliding past each other; [1] (vi) subduction zone; [1] (vii) place where sea floor spreading is happening? [1] (b) The South Atlantic Ocean is getting wider. Using information from Fig. 4, calculate how much wider the ocean is getting each year. State the correct units in your answer. … … [1] [Total: 8 marks] www.theallpapers.com
Question paper, page 8
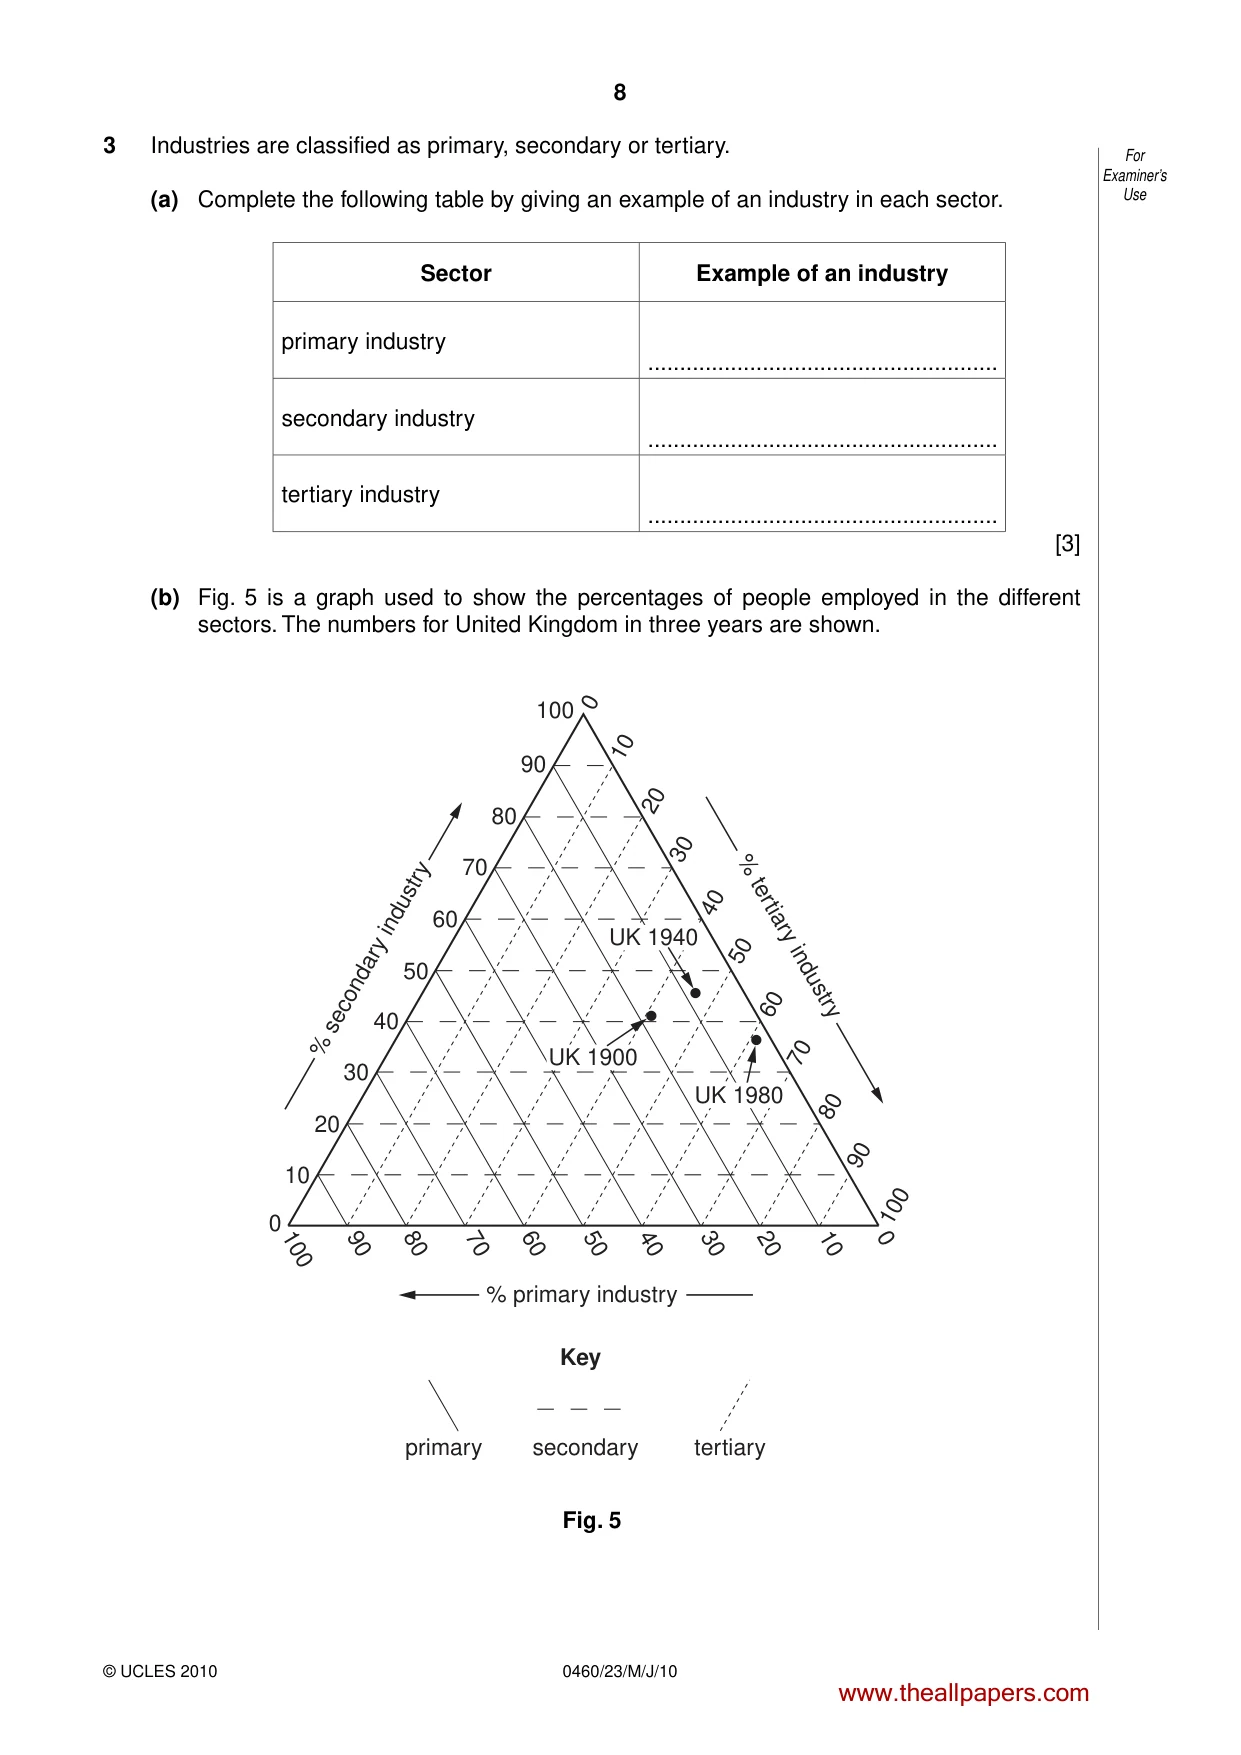
8 © UCLES 2010 0460/23/M/J/10 For Examiner’s Use 3 Industries are classified as primary, secondary or tertiary. (a) Complete the following table by giving an example of an industry in each sector. Sector Example of an industry primary industry … secondary industry … tertiary industry … [3] (b) Fig. 5 is a graph used to show the percentages of people employed in the different sectors. The numbers for United Kingdom in three years are shown. 90 100 70 80 50 60 30 40 10 20 0 90 100 70 80 50 60 30 40 10 20 0 100 90 80 70 60 50 40 30 20 10 0 % primary industry % tertiary industry % secondary industry UK 1940 UK 1900 UK 1980 Key primary secondary tertiary Fig. 5 www.theallpapers.com
Question paper, page 9
9 © UCLES 2010 [Turn over 0460/23/M/J/10 For Examiner’s Use (i) In Bangladesh, 58% are employed in primary industry, 17% in secondary industry and 25% in tertiary industry. Plot this information on Fig. 5 using a labelled dot. [2] (ii) The percentages employed in the different sectors change as a country becomes more developed. Fig. 5 shows information for the United Kingdom in 1900, 1940 and 1980. Use this information to describe how the United Kingdom’s employment structure changed between 1900 and 1980. You do not need to quote figures in your answer. … … … … … … … … [3] [Total: 8 marks] www.theallpapers.com
Question paper, page 10
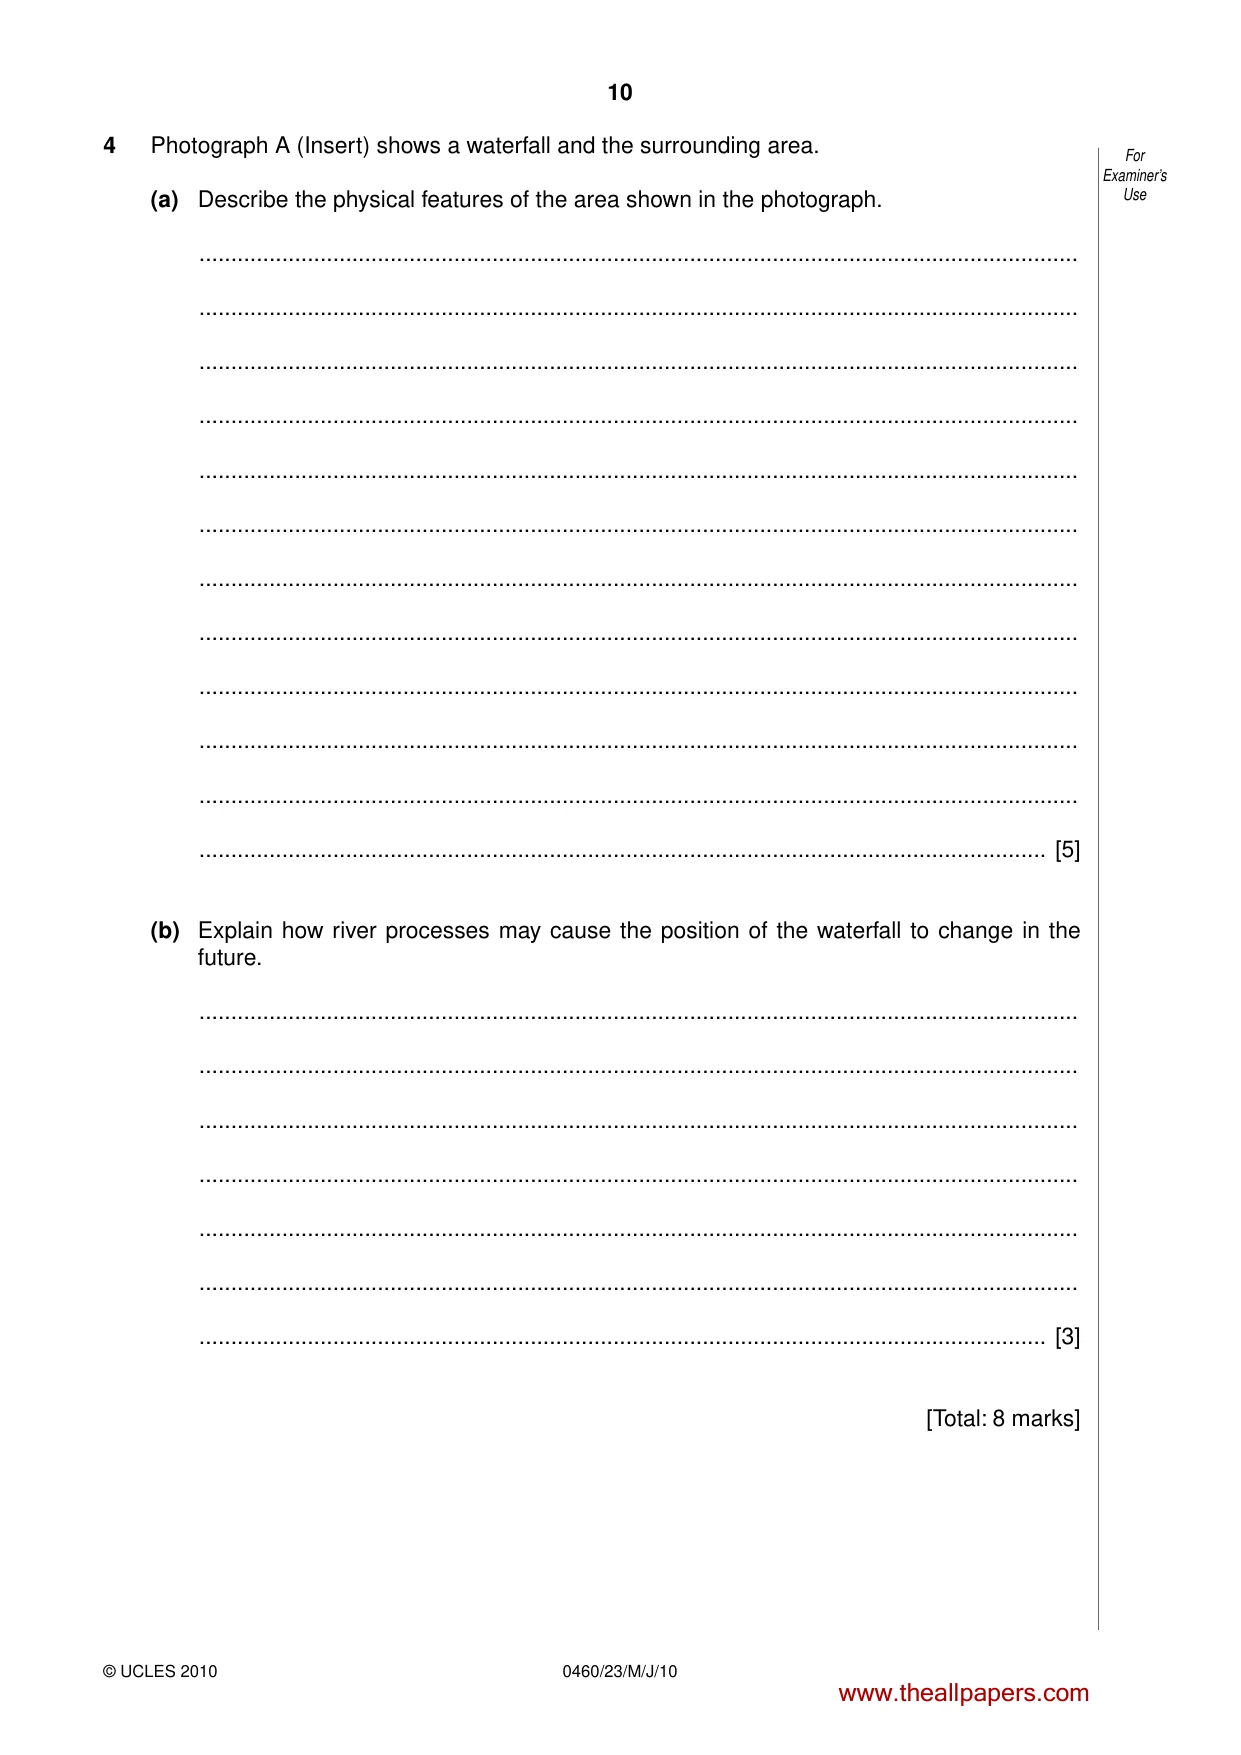
10 © UCLES 2010 0460/23/M/J/10 For Examiner’s Use 4 Photograph A (Insert) shows a waterfall and the surrounding area. (a) Describe the physical features of the area shown in the photograph. … … … … … … … … … … … … [5] (b) Explain how river processes may cause the position of the waterfall to change in the future. … … … … … … … [3] [Total: 8 marks] www.theallpapers.com
Question paper, page 11
11 0460/23/M/J/10 © UCLES 2010 [Turn over BLANK PAGE www.theallpapers.com
Question paper, page 12
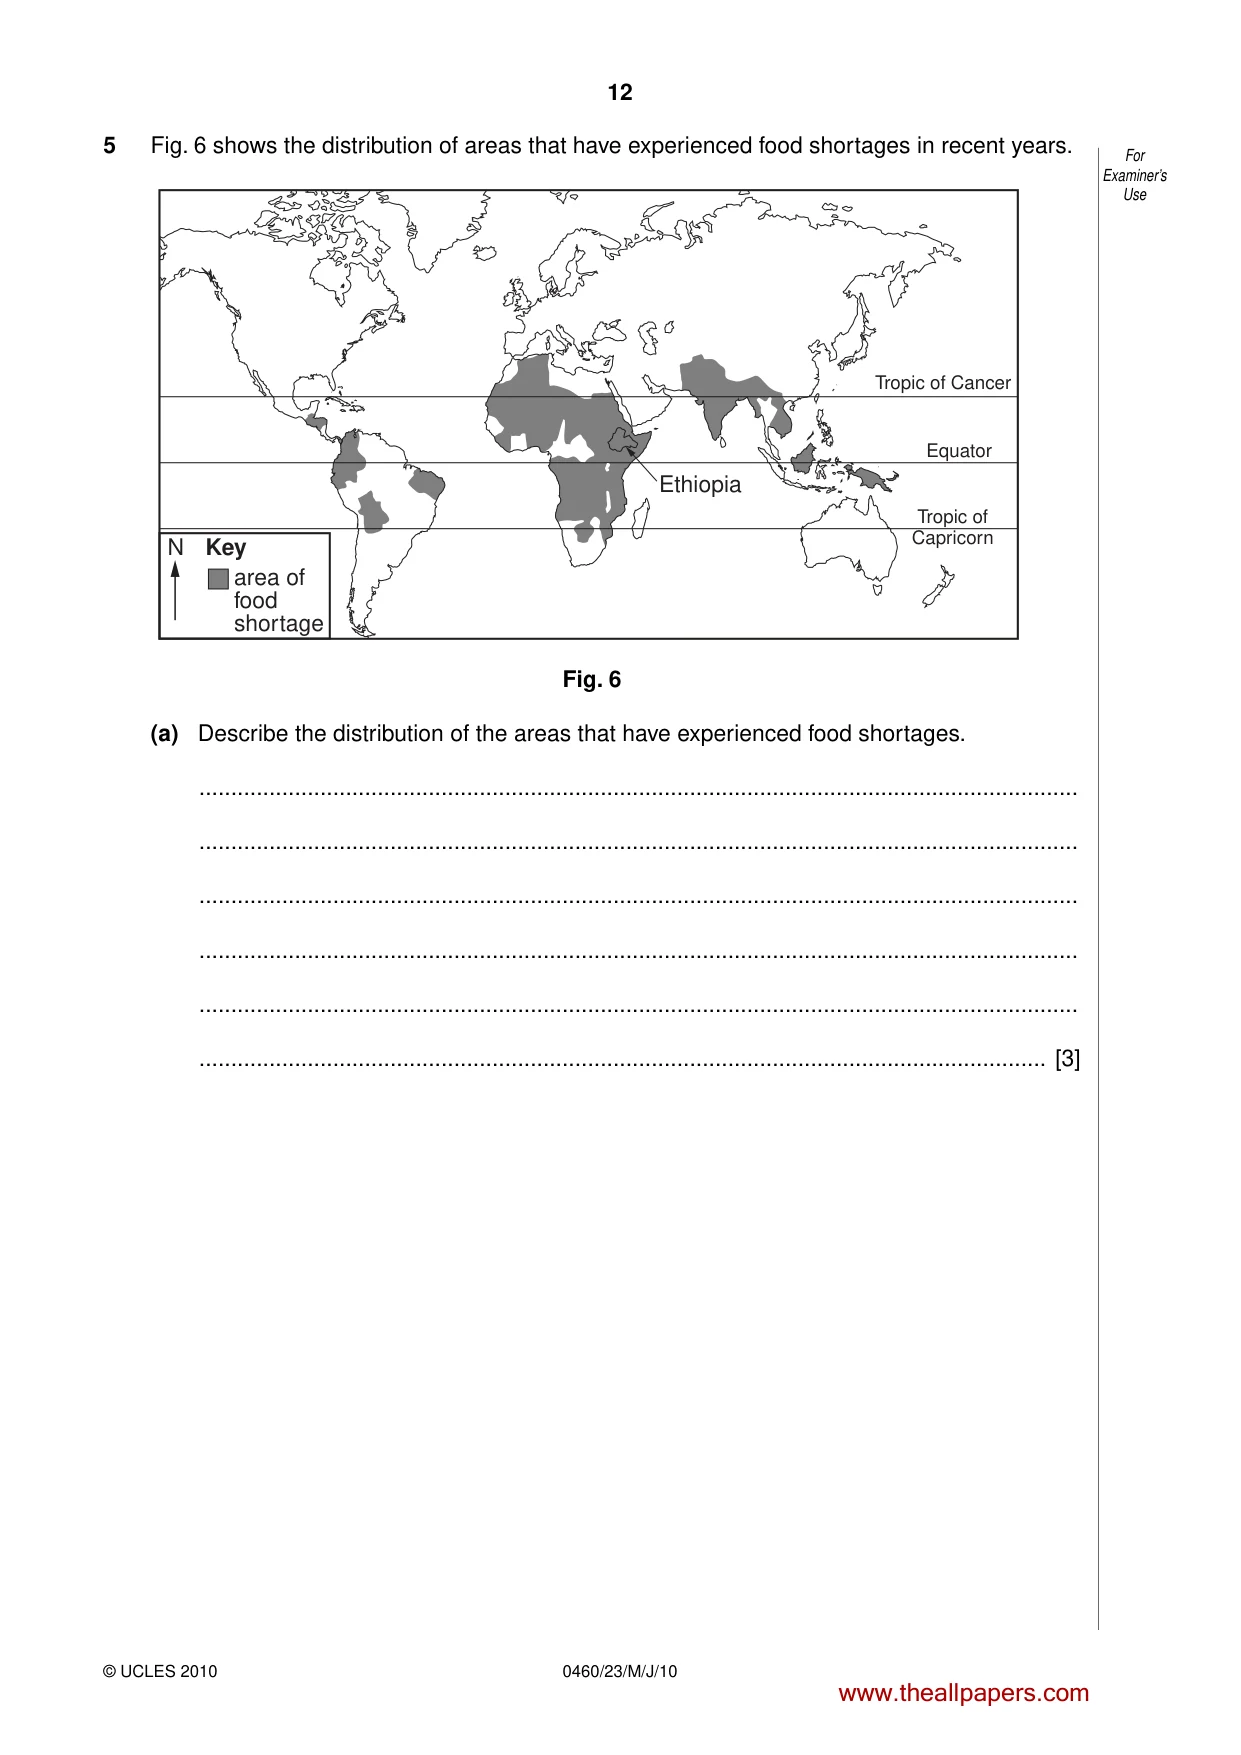
12 © UCLES 2010 0460/23/M/J/10 For Examiner’s Use 5 Fig. 6 shows the distribution of areas that have experienced food shortages in recent years. Equator Ethiopia Tropic of Cancer Tropic of Capricorn Key area of food shortage N Fig. 6 (a) Describe the distribution of the areas that have experienced food shortages. … … … … … … [3] www.theallpapers.com
Question paper, page 13
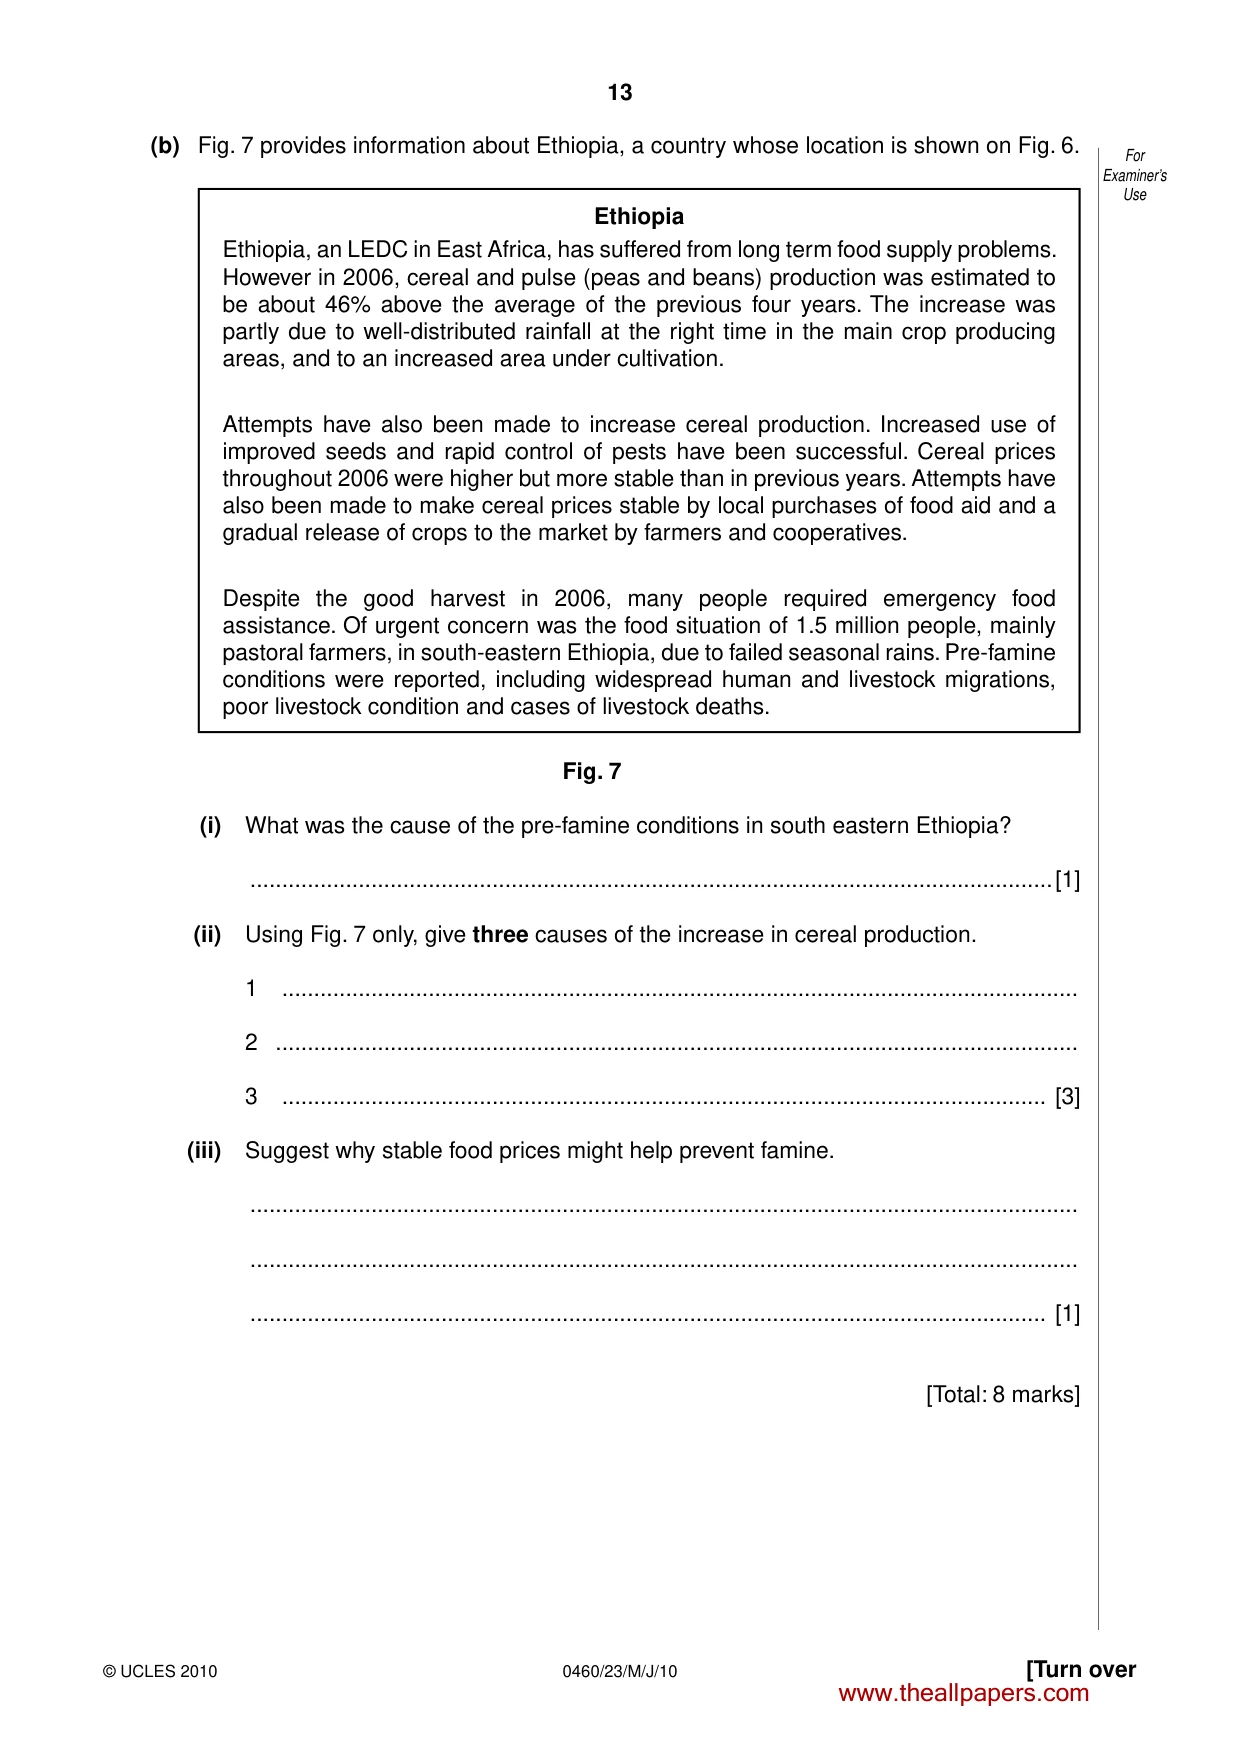
13 © UCLES 2010 [Turn over 0460/23/M/J/10 For Examiner’s Use (b) Fig. 7 provides information about Ethiopia, a country whose location is shown on Fig. 6. Ethiopia Ethiopia, an LEDC in East Africa, has suffered from long term food supply problems. However in 2006, cereal and pulse (peas and beans) production was estimated to be about 46% above the average of the previous four years. The increase was partly due to well-distributed rainfall at the right time in the main crop producing areas, and to an increased area under cultivation. Attempts have also been made to increase cereal production. Increased use of improved seeds and rapid control of pests have been successful. Cereal prices throughout 2006 were higher but more stable than in previous years. Attempts have also been made to make cereal prices stable by local purchases of food aid and a gradual release of crops to the market by farmers and cooperatives. Despite the good harvest in 2006, many people required emergency food assistance. Of urgent concern was the food situation of 1.5 million people, mainly pastoral farmers, in south-eastern Ethiopia, due to failed seasonal rains. Pre-famine conditions were reported, including widespread human and livestock migrations, poor livestock condition and cases of livestock deaths. Fig. 7 (i) What was the cause of the pre-famine conditions in south eastern Ethiopia? …[1] (ii) Using Fig. 7 only, give three causes of the increase in cereal production. 1 … 2 … 3 … [3] (iii) Suggest why stable food prices might help prevent famine. … … … [1] [Total: 8 marks] www.theallpapers.com
Question paper, page 14
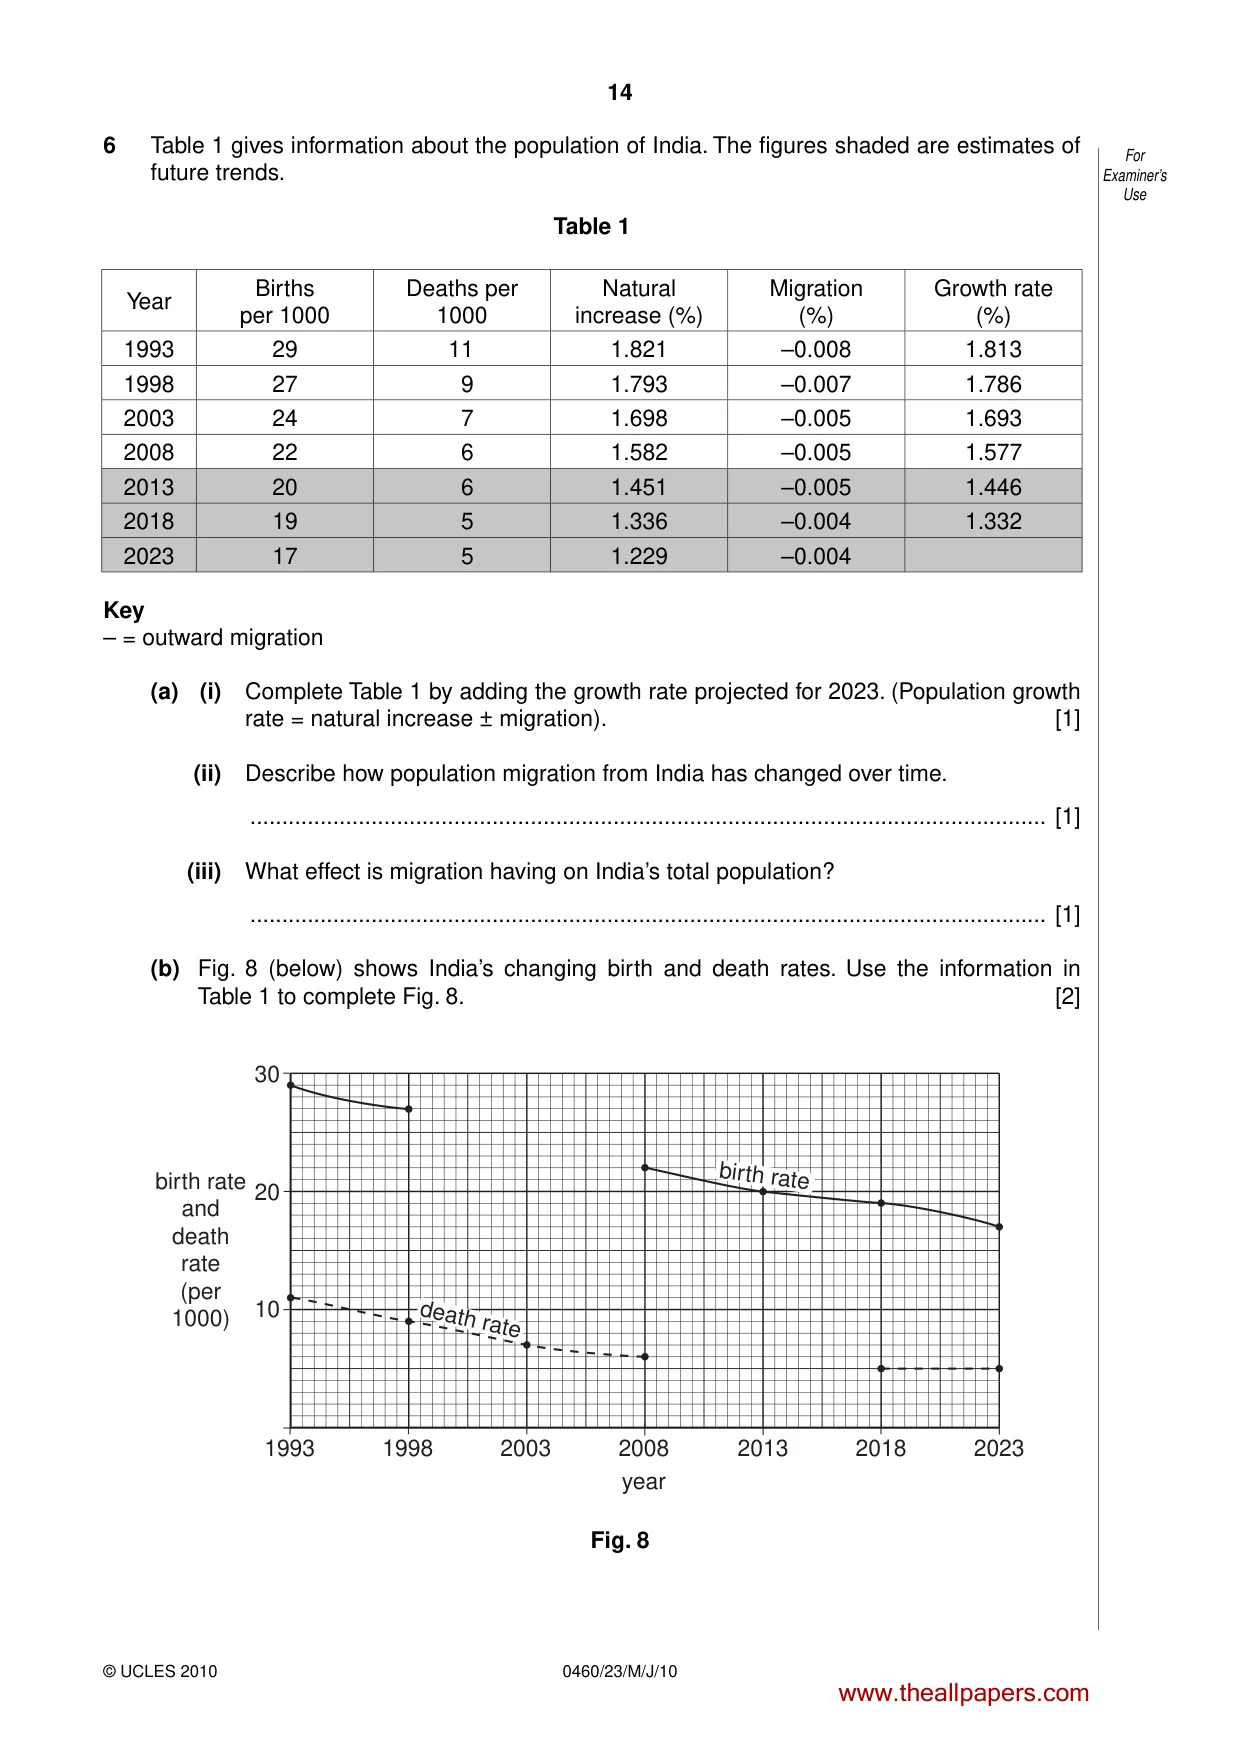
14 © UCLES 2010 0460/23/M/J/10 For Examiner’s Use 6 Table 1 gives information about the population of India. The figures shaded are estimates of future trends. Table 1 Year Births per 1000 Deaths per 1000 Natural increase (%) Migration (%) Growth rate (%) 1993 29 11 1.821 –0.008 1.813 1998 27 9 1.793 –0.007 1.786 2003 24 7 1.698 –0.005 1.693 2008 22 6 1.582 –0.005 1.577 2013 20 6 1.451 –0.005 1.446 2018 19 5 1.336 –0.004 1.332 2023 17 5 1.229 –0.004 Key – = outward migration (a) (i) Complete Table 1 by adding the growth rate projected for 2023. (Population growth rate = natural increase ± migration). [1] (ii) Describe how population migration from India has changed over time. … [1] (iii) What effect is migration having on India’s total population? … [1] (b) Fig. 8 (below) shows India’s changing birth and death rates. Use the information in Table 1 to complete Fig. 8. [2] 1993 10 20 birth rate and death rate (per 1000) 30 1998 2003 2008 year 2013 2018 2023 death rate birth rate Fig. 8 www.theallpapers.com
Question paper, page 15
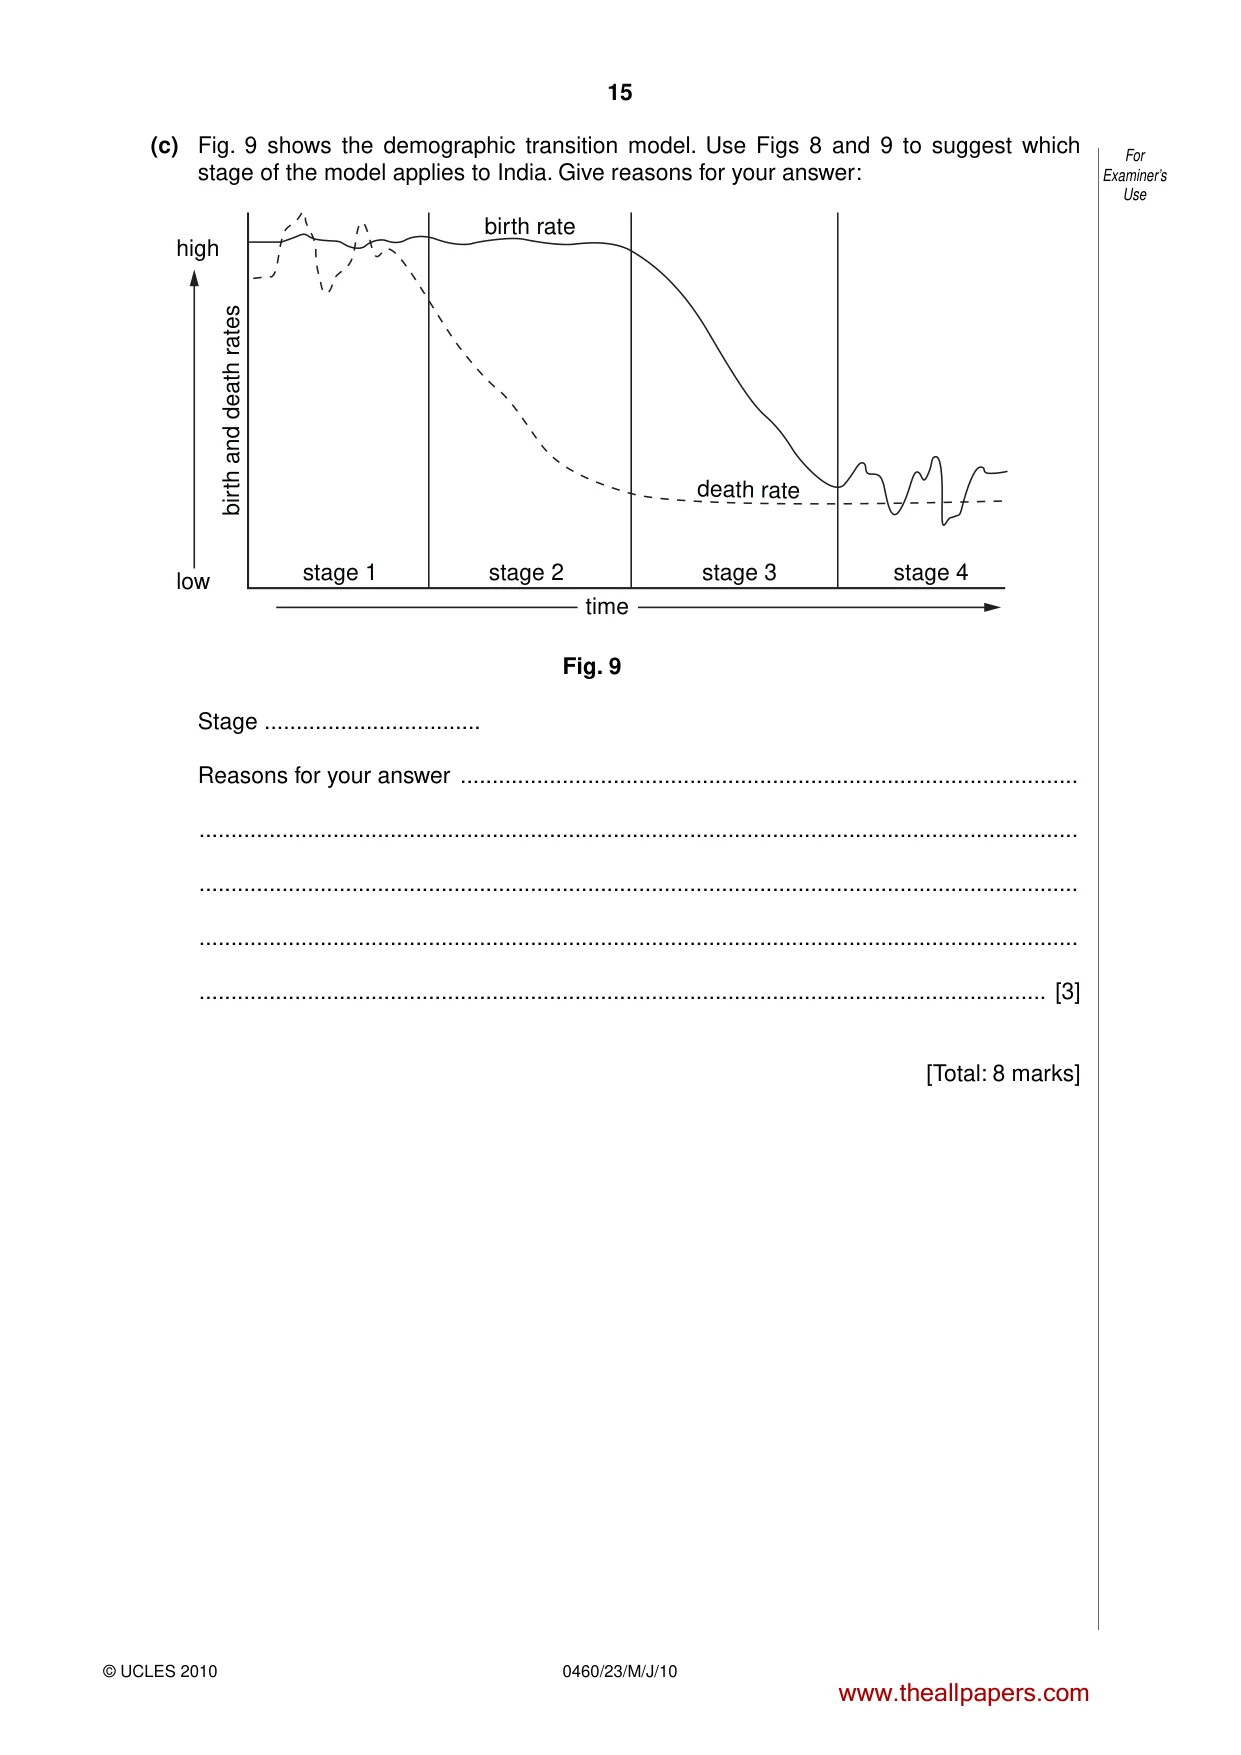
15 © UCLES 2010 0460/23/M/J/10 For Examiner’s Use (c) Fig. 9 shows the demographic transition model. Use Figs 8 and 9 to suggest which stage of the model applies to India. Give reasons for your answer: time stage 1 birth rate death rate low high birth and death rates stage 2 stage 4 stage 3 Fig. 9 Stage … Reasons for your answer … … … … … [3] [Total: 8 marks] www.theallpapers.com
Question paper, page 16
16 0460/23/M/J/10 © UCLES 2010 Permission to reproduce items where third-party owned material protected by copyright is included has been sought and cleared where possible. Every reasonable effort has been made by the publisher (UCLES) to trace copyright holders, but if any items requiring clearance have unwittingly been included, the publisher will be pleased to make amends at the earliest possible opportunity. University of Cambridge International Examinations is part of the Cambridge Assessment Group. Cambridge Assessment is the brand name of University of Cambridge Local Examinations Syndicate (UCLES), which is itself a department of the University of Cambridge. BLANK PAGE www.theallpapers.com
Mark scheme, page 1
UNIVERSITY OF CAMBRIDGE INTERNATIONAL EXAMINATIONS International General Certificate of Secondary Education MARK SCHEME for the May/June 2010 question paper for the guidance of teachers 0460 GEOGRAPHY 0460/23 Paper 23, maximum raw mark 60 This mark scheme is published as an aid to teachers and candidates, to indicate the requirements of the examination. It shows the basis on which Examiners were instructed to award marks. It does not indicate the details of the discussions that took place at an Examiners’ meeting before marking began, which would have considered the acceptability of alternative answers. Mark schemes must be read in conjunction with the question papers and the report on the examination. • CIE will not enter into discussions or correspondence in connection with these mark schemes. CIE is publishing the mark schemes for the May/June 2010 question papers for most IGCSE, GCE Advanced Level and Advanced Subsidiary Level syllabuses and some Ordinary Level syllabuses. www.theallpapers.com
Mark scheme, page 2
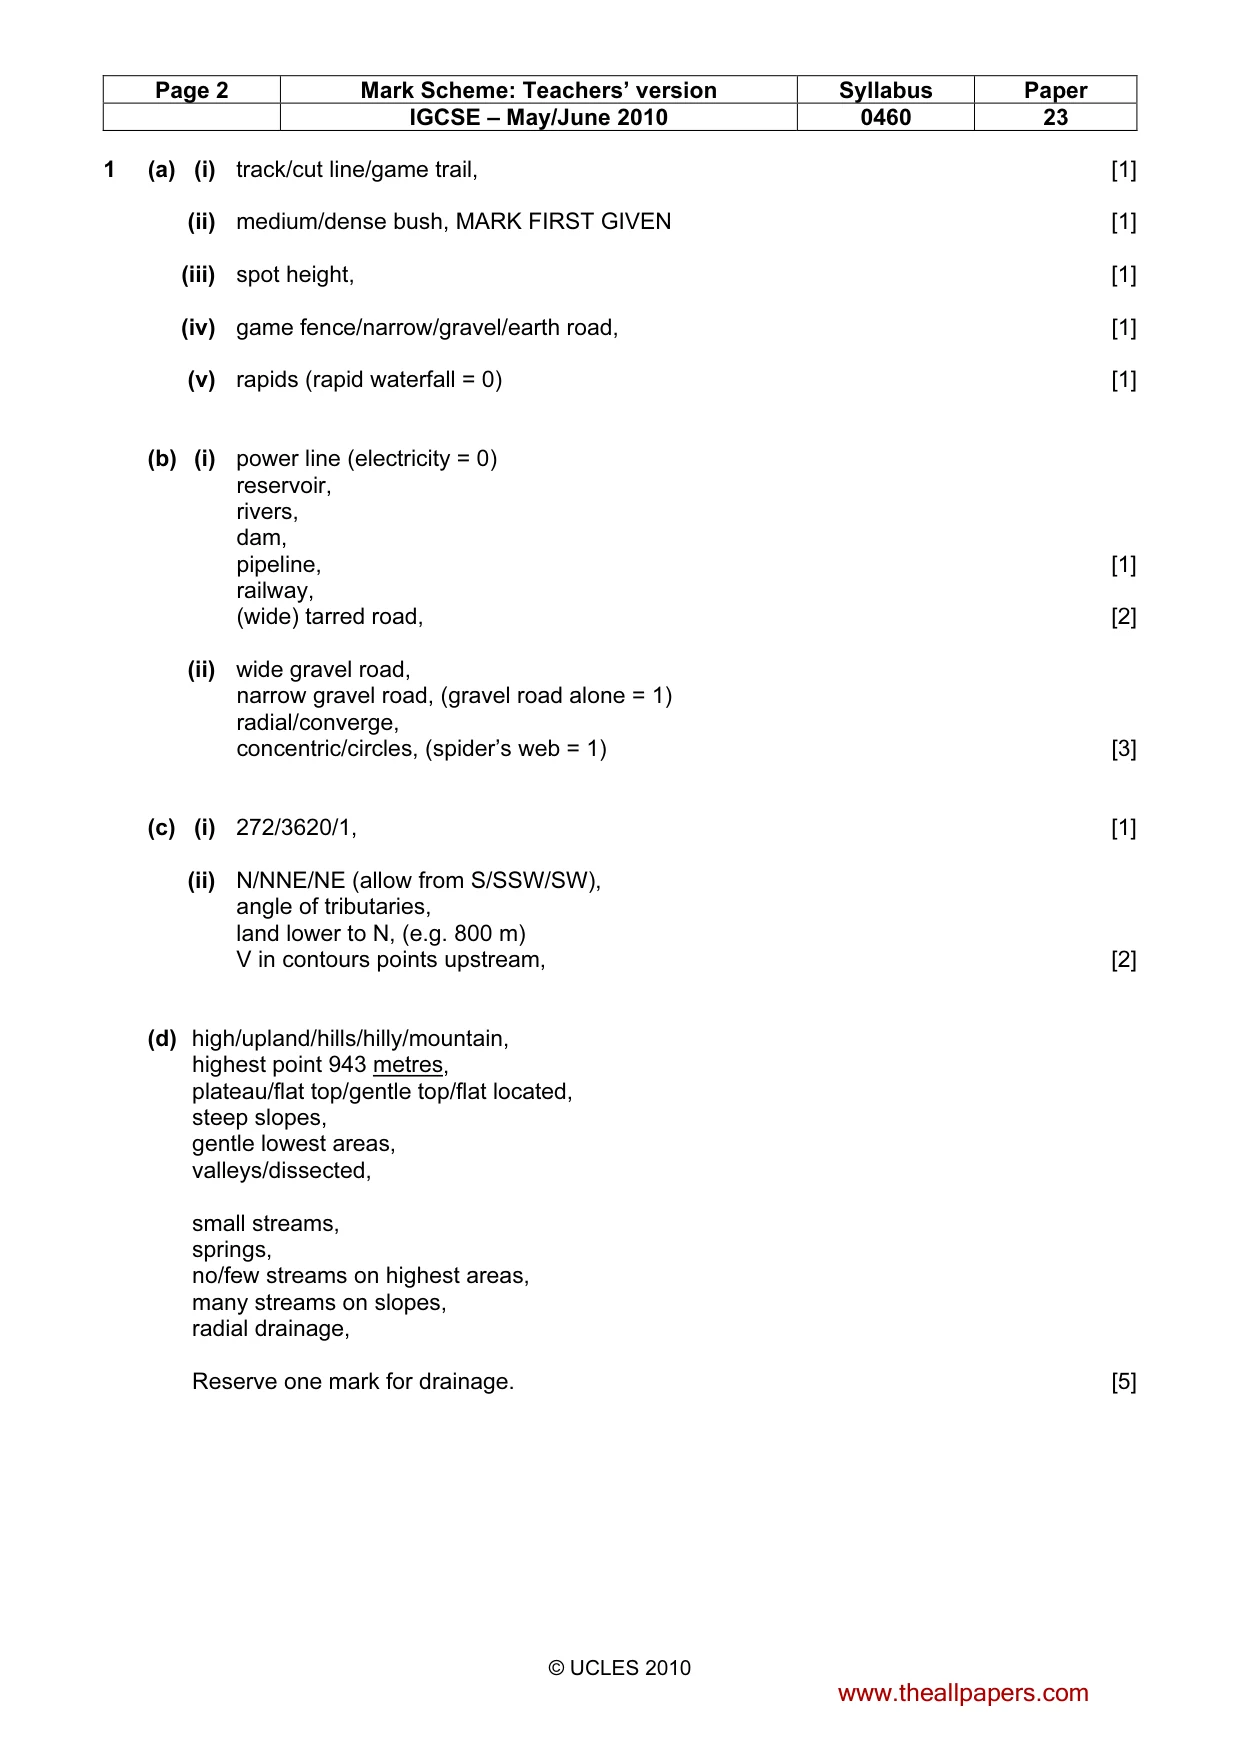
Page 2 Mark Scheme: Teachers’ version Syllabus Paper IGCSE – May/June 2010 0460 23 © UCLES 2010 1 (a) (i) track/cut line/game trail, [1] (ii) medium/dense bush, MARK FIRST GIVEN [1] (iii) spot height, [1] (iv) game fence/narrow/gravel/earth road, [1] (v) rapids (rapid waterfall = 0) [1] (b) (i) power line (electricity = 0) reservoir, rivers, dam, pipeline, [1] railway, (wide) tarred road, [2] (ii) wide gravel road, narrow gravel road, (gravel road alone = 1) radial/converge, concentric/circles, (spider’s web = 1) [3] (c) (i) 272/3620/1, [1] (ii) N/NNE/NE (allow from S/SSW/SW), angle of tributaries, land lower to N, (e.g. 800 m) V in contours points upstream, [2] (d) high/upland/hills/hilly/mountain, highest point 943 metres, plateau/flat top/gentle top/flat located, steep slopes, gentle lowest areas, valleys/dissected, small streams, springs, no/few streams on highest areas, many streams on slopes, radial drainage, Reserve one mark for drainage. [5] www.theallpapers.com
Mark scheme, page 3
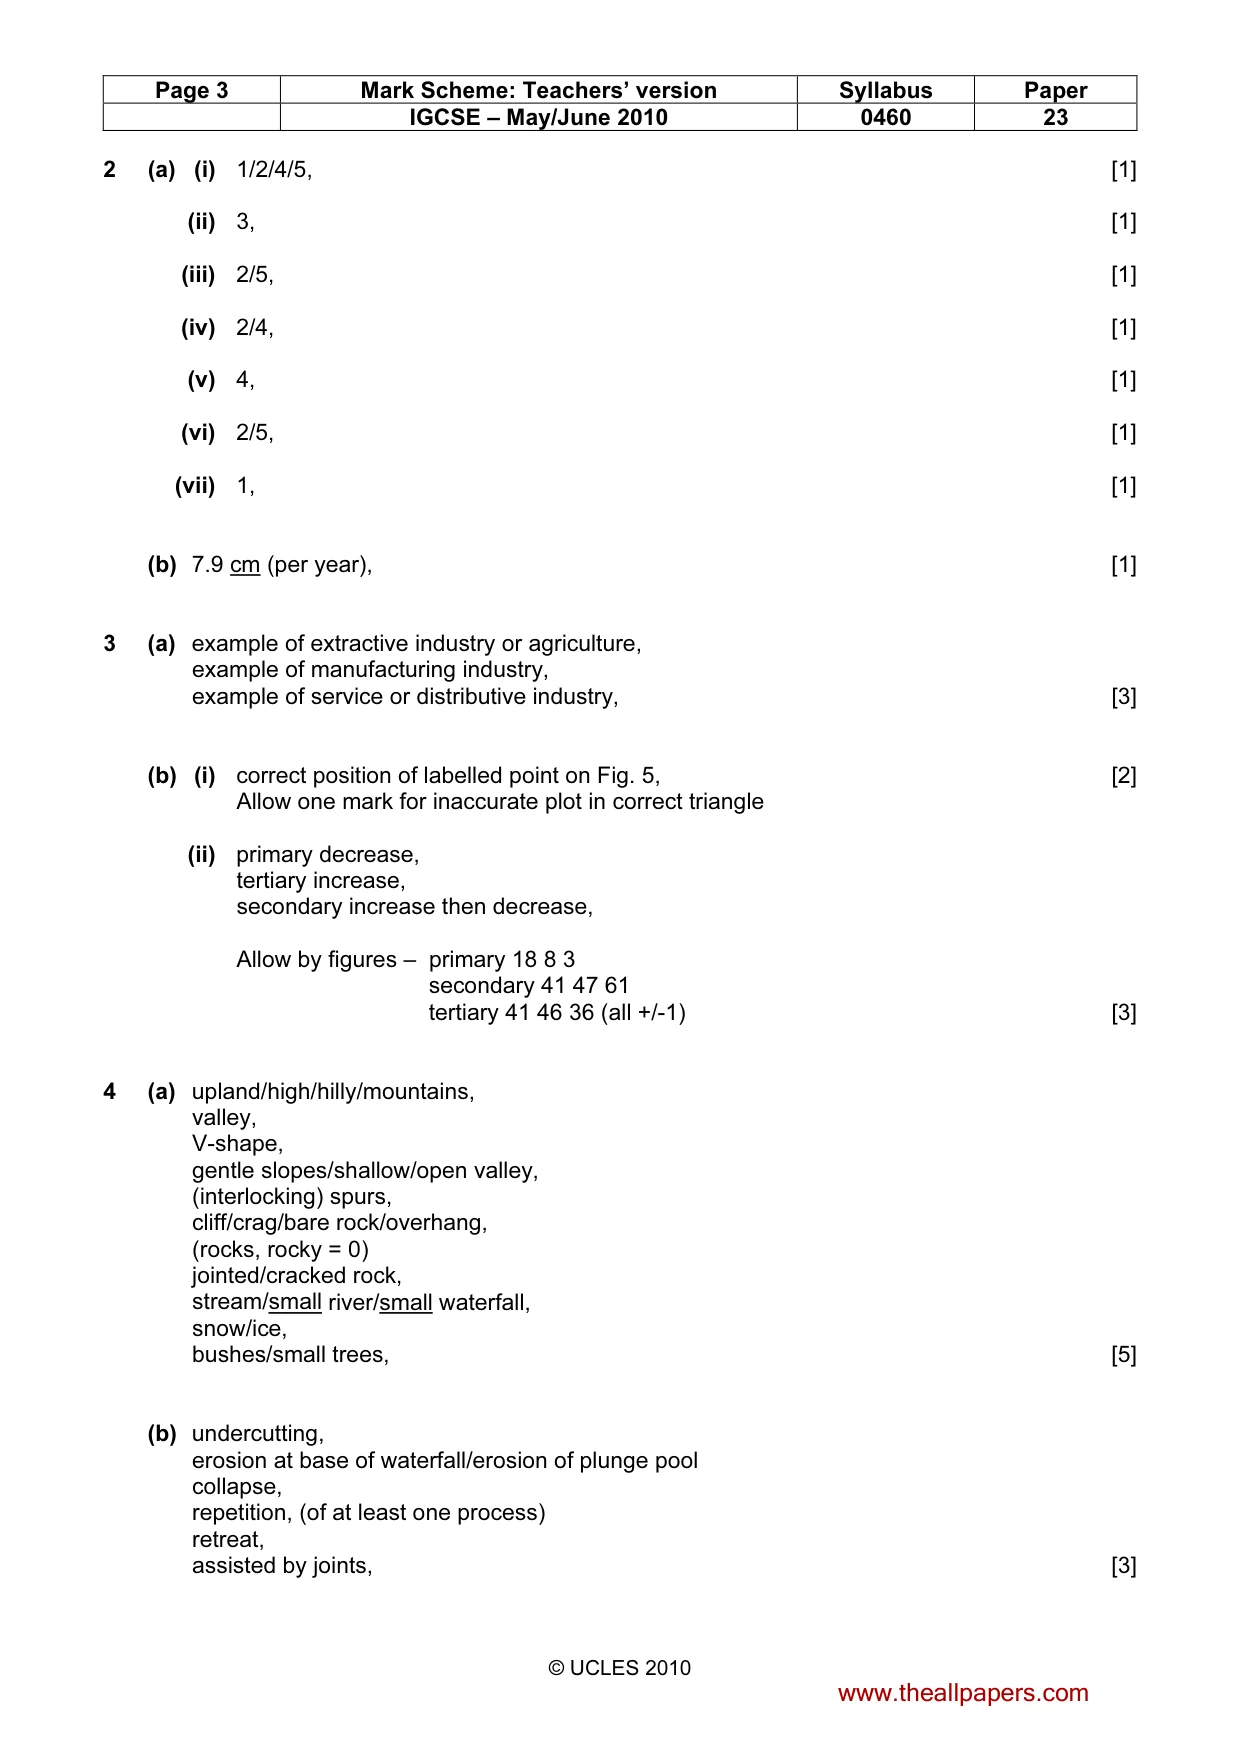
Page 3 Mark Scheme: Teachers’ version Syllabus Paper IGCSE – May/June 2010 0460 23 © UCLES 2010 2 (a) (i) 1/2/4/5, [1] (ii) 3, [1] (iii) 2/5, [1] (iv) 2/4, [1] (v) 4, [1] (vi) 2/5, [1] (vii) 1, [1] (b) 7.9 cm (per year), [1] 3 (a) example of extractive industry or agriculture, example of manufacturing industry, example of service or distributive industry, [3] (b) (i) correct position of labelled point on Fig. 5, [2] Allow one mark for inaccurate plot in correct triangle (ii) primary decrease, tertiary increase, secondary increase then decrease, Allow by figures – primary 18 8 3 secondary 41 47 61 tertiary 41 46 36 (all +/-1) [3] 4 (a) upland/high/hilly/mountains, valley, V-shape, gentle slopes/shallow/open valley, (interlocking) spurs, cliff/crag/bare rock/overhang, (rocks, rocky = 0) jointed/cracked rock, stream/small river/small waterfall, snow/ice, bushes/small trees, [5] (b) undercutting, erosion at base of waterfall/erosion of plunge pool collapse, repetition, (of at least one process) retreat, assisted by joints, [3] www.theallpapers.com
Mark scheme, page 4
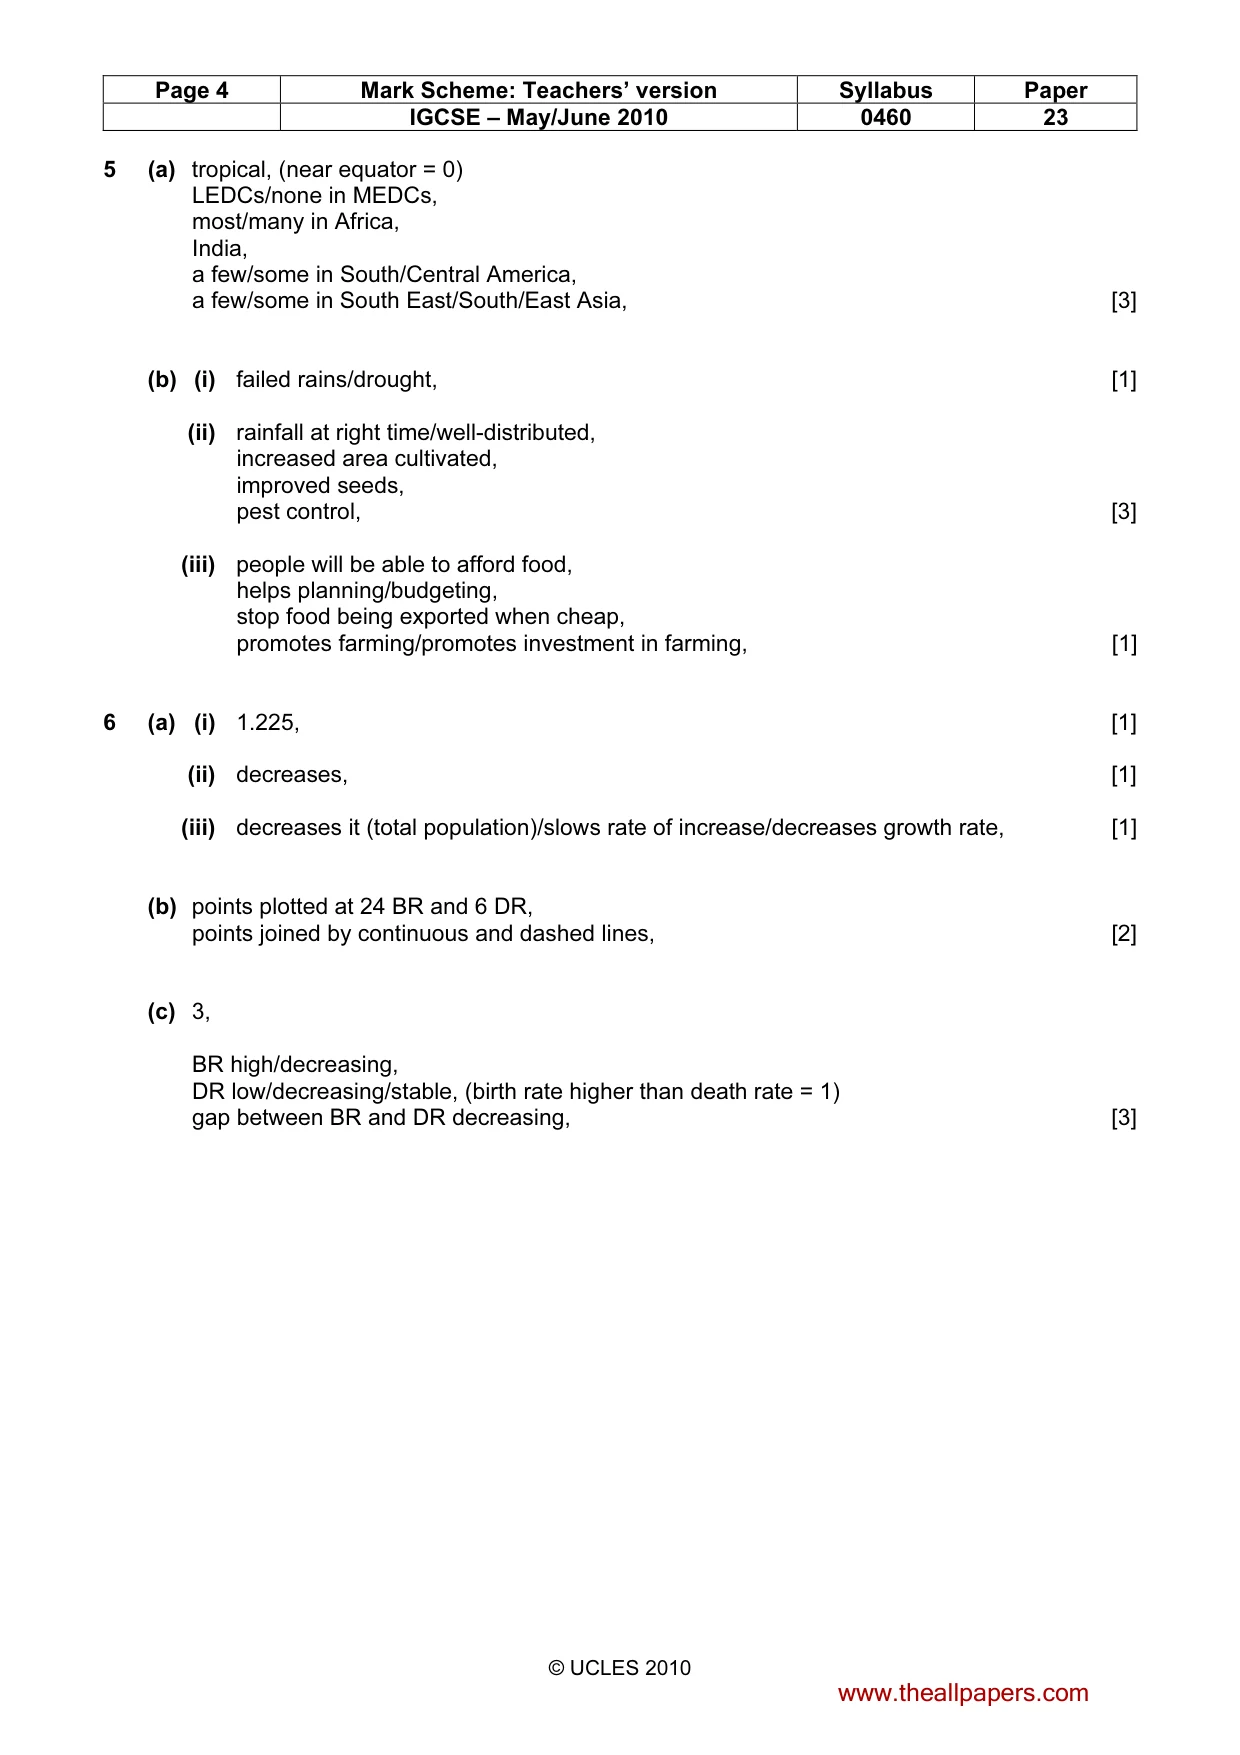
Page 4 Mark Scheme: Teachers’ version Syllabus Paper IGCSE – May/June 2010 0460 23 © UCLES 2010 5 (a) tropical, (near equator = 0) LEDCs/none in MEDCs, most/many in Africa, India, a few/some in South/Central America, a few/some in South East/South/East Asia, [3] (b) (i) failed rains/drought, [1] (ii) rainfall at right time/well-distributed, increased area cultivated, improved seeds, pest control, [3] (iii) people will be able to afford food, helps planning/budgeting, stop food being exported when cheap, promotes farming/promotes investment in farming, [1] 6 (a) (i) 1.225, [1] (ii) decreases, [1] (iii) decreases it (total population)/slows rate of increase/decreases growth rate, [1] (b) points plotted at 24 BR and 6 DR, points joined by continuous and dashed lines, [2] (c) 3, BR high/decreasing, DR low/decreasing/stable, (birth rate higher than death rate = 1) gap between BR and DR decreasing, [3] www.theallpapers.com
What you needed in this session
Cambridge’s own grade thresholds for 2010 May/June, Paper 2 · Variant 3. A higher threshold means an easier paper — the bar moves with how the cohort did.