Cambridge IGCSE Geography 0460 — 2010 May/June Paper 2 · Variant 2
0460/22/M/J/10 · 60 marks · ≈68 min
The question paper and its mark scheme, free to read here and free to download. This is Cambridge’s own paper, exactly as it was sat.
Question paper16 pages
Mark scheme6 pages
Answers below. Sit the paper first if you are practising.
Paper as text
Question paper, page 1
This document consists of 15 printed pages, 1 blank page and 1 Insert. DC (KN/CGW) 22823/3 © UCLES 2010 [Turn over UNIVERSITY OF CAMBRIDGE INTERNATIONAL EXAMINATIONS International General Certificate of Secondary Education READ THESE INSTRUCTIONS FIRST Write your Centre number, candidate number and name on all the work you hand in. Write in dark blue or black pen. You may use a soft pencil for any diagrams, graphs or rough working. Do not use staples, paper clips, highlighters, glue or correction fluid. DO NOT WRITE ON ANY BARCODES. Answer all questions. The Insert contains Photographs A, B and C for Question 2. Sketch maps and diagrams should be drawn whenever they serve to illustrate an answer. The Survey Map Extract and the Insert are not required by the Examiner. At the end of the examination, fasten all your work securely together. The number of marks is given in brackets [ ] at the end of each question or part question. * 6 2 6 9 0 9 9 5 1 3 * GEOGRAPHY 0460/22 Paper 2 May/June 2010 1 hour 30 minutes Candidates answer on the Question Paper. Additional Materials: Ruler Protractor Plain paper 1:50 000 Survey Map Extract is enclosed with this question paper. For Examiner’s Use Q1 Q2 Q3 Q4 Q5 Q6 Total www.theallpapers.com
Question paper, page 2
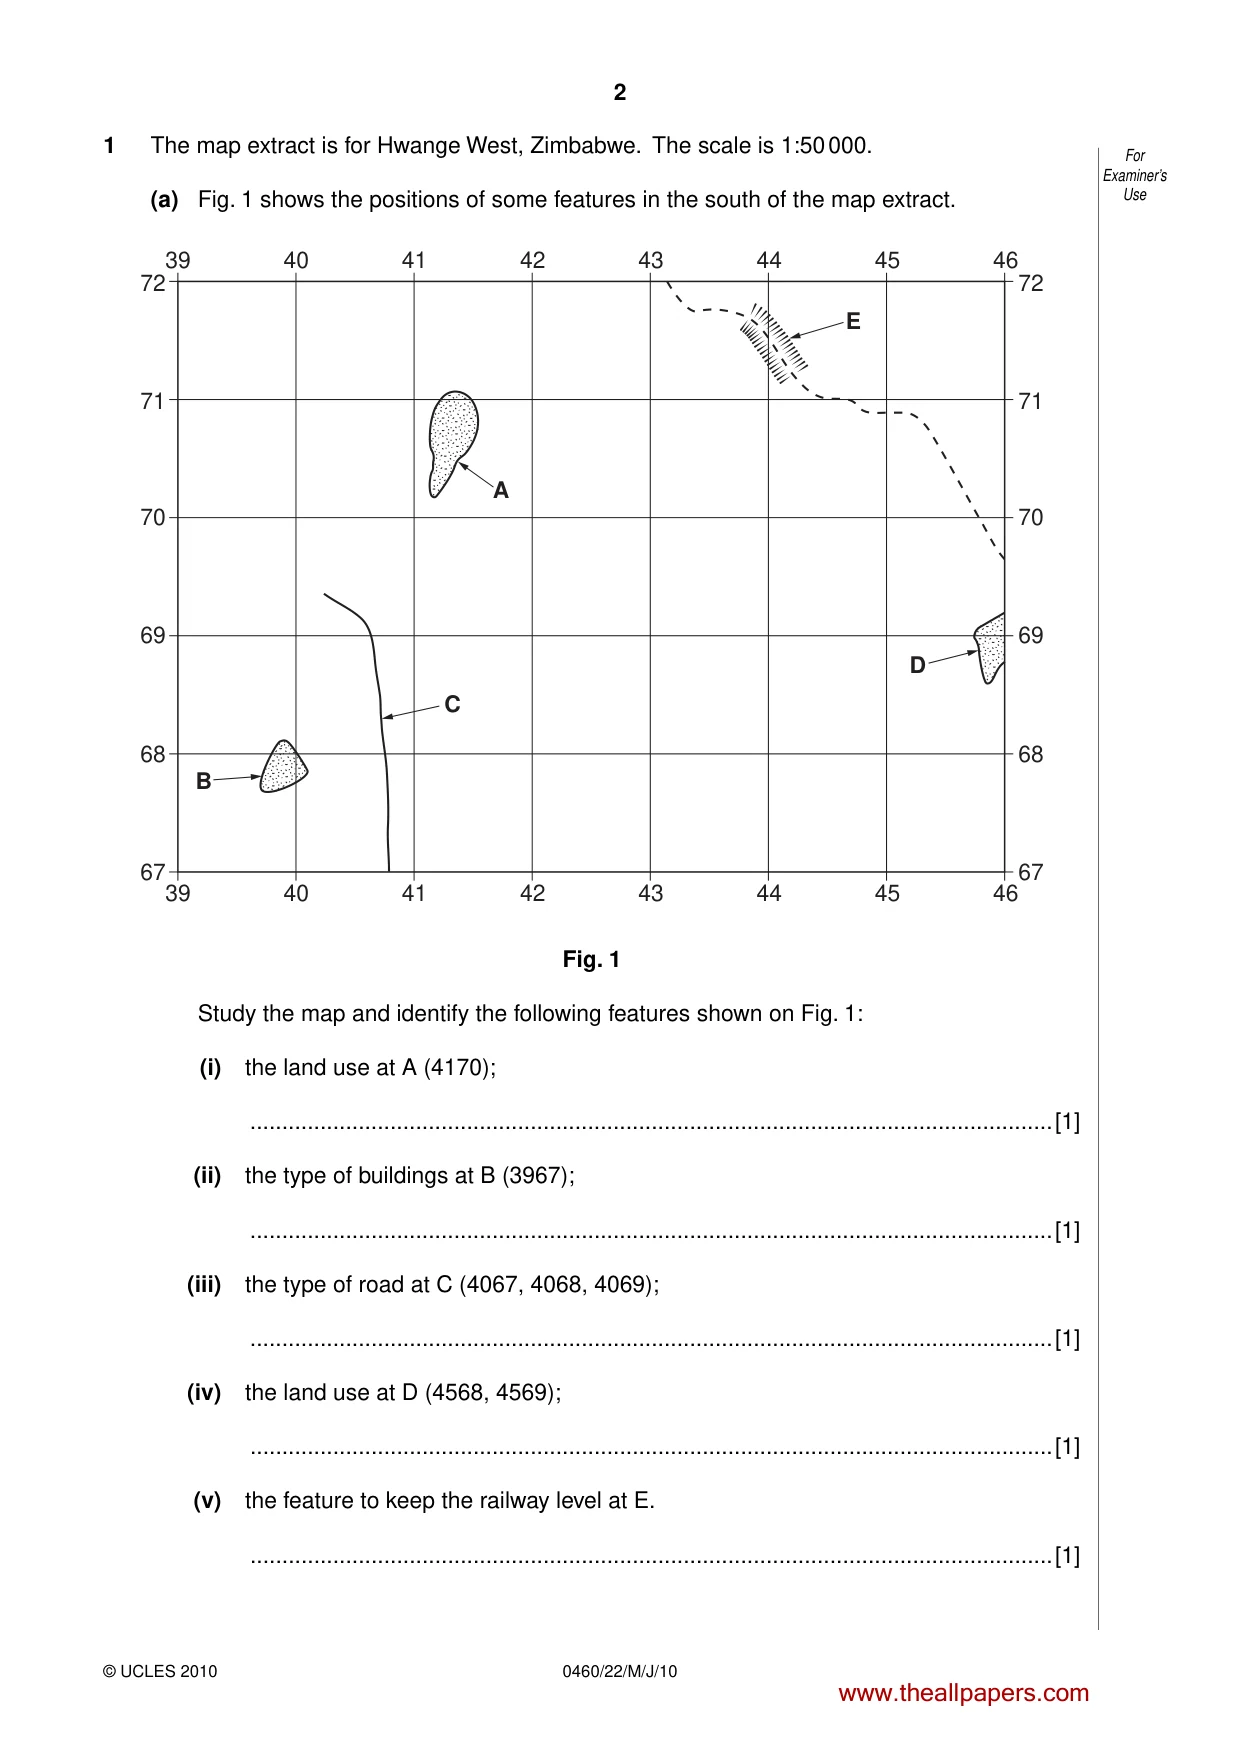
2 0460/22/M/J/10 © UCLES 2010 For Examiner’s Use 1 The map extract is for Hwange West, Zimbabwe. The scale is 1:50 000. (a) Fig. 1 shows the positions of some features in the south of the map extract. 39 40 41 42 43 44 45 46 39 40 41 42 43 44 45 46 67 68 69 70 71 72 67 68 69 70 71 72 E A C B D Fig. 1 Study the map and identify the following features shown on Fig. 1: (i) the land use at A (4170); …[1] (ii) the type of buildings at B (3967); …[1] (iii) the type of road at C (4067, 4068, 4069); …[1] (iv) the land use at D (4568, 4569); …[1] (v) the feature to keep the railway level at E. …[1] www.theallpapers.com
Question paper, page 3
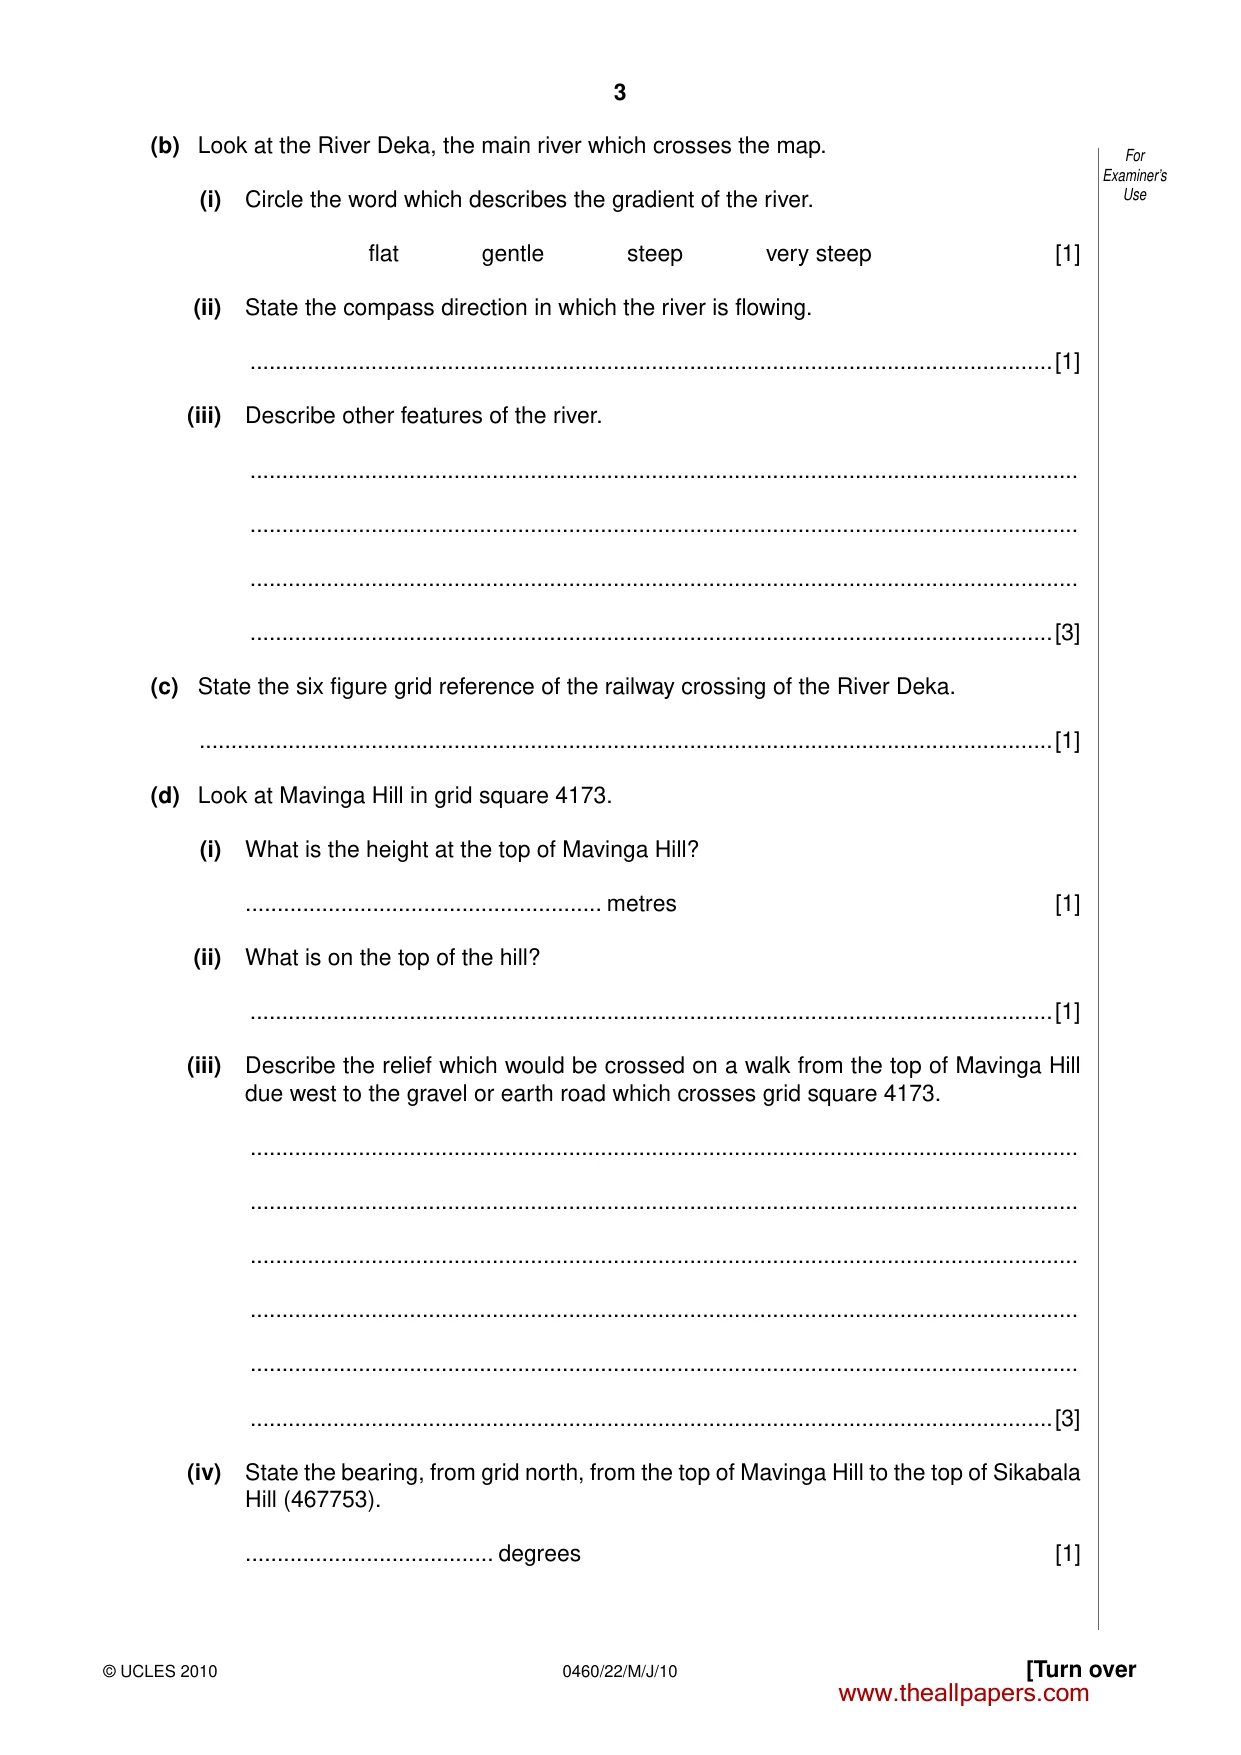
3 [Turn over © UCLES 2010 0460/22/M/J/10 For Examiner’s Use (b) Look at the River Deka, the main river which crosses the map. (i) Circle the word which describes the gradient of the river. flat gentle steep very steep [1] (ii) State the compass direction in which the river is flowing. …[1] (iii) Describe other features of the river. … … … …[3] (c) State the six figure grid reference of the railway crossing of the River Deka. …[1] (d) Look at Mavinga Hill in grid square 4173. (i) What is the height at the top of Mavinga Hill? … metres [1] (ii) What is on the top of the hill? …[1] (iii) Describe the relief which would be crossed on a walk from the top of Mavinga Hill due west to the gravel or earth road which crosses grid square 4173. … … … … … …[3] (iv) State the bearing, from grid north, from the top of Mavinga Hill to the top of Sikabala Hill (467753). … degrees [1] www.theallpapers.com
Question paper, page 4
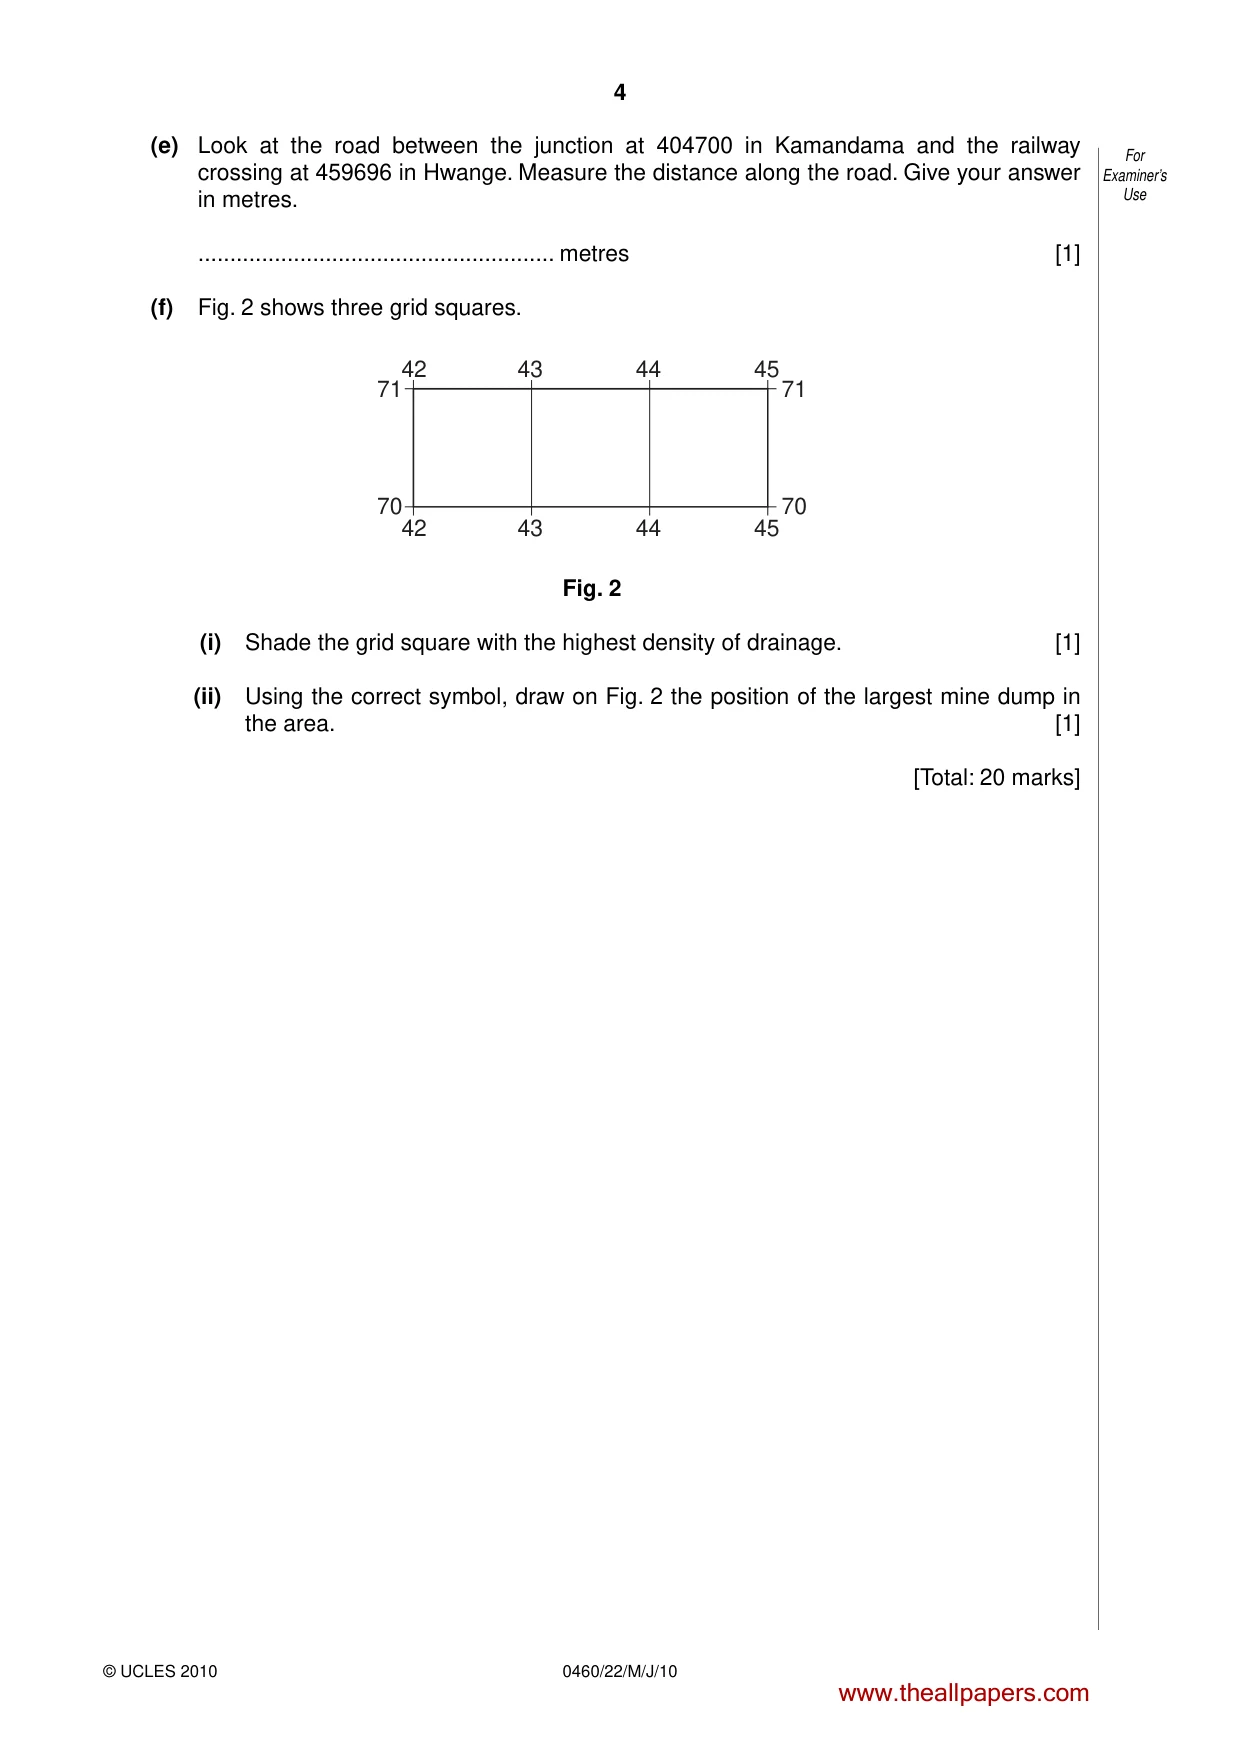
4 0460/22/M/J/10 © UCLES 2010 For Examiner’s Use (e) Look at the road between the junction at 404700 in Kamandama and the railway crossing at 459696 in Hwange. Measure the distance along the road. Give your answer in metres. … metres [1] (f) Fig. 2 shows three grid squares. 42 42 43 44 45 45 43 44 71 70 71 70 Fig. 2 (i) Shade the grid square with the highest density of drainage. [1] (ii) Using the correct symbol, draw on Fig. 2 the position of the largest mine dump in the area. [1] [Total: 20 marks] www.theallpapers.com
Question paper, page 5
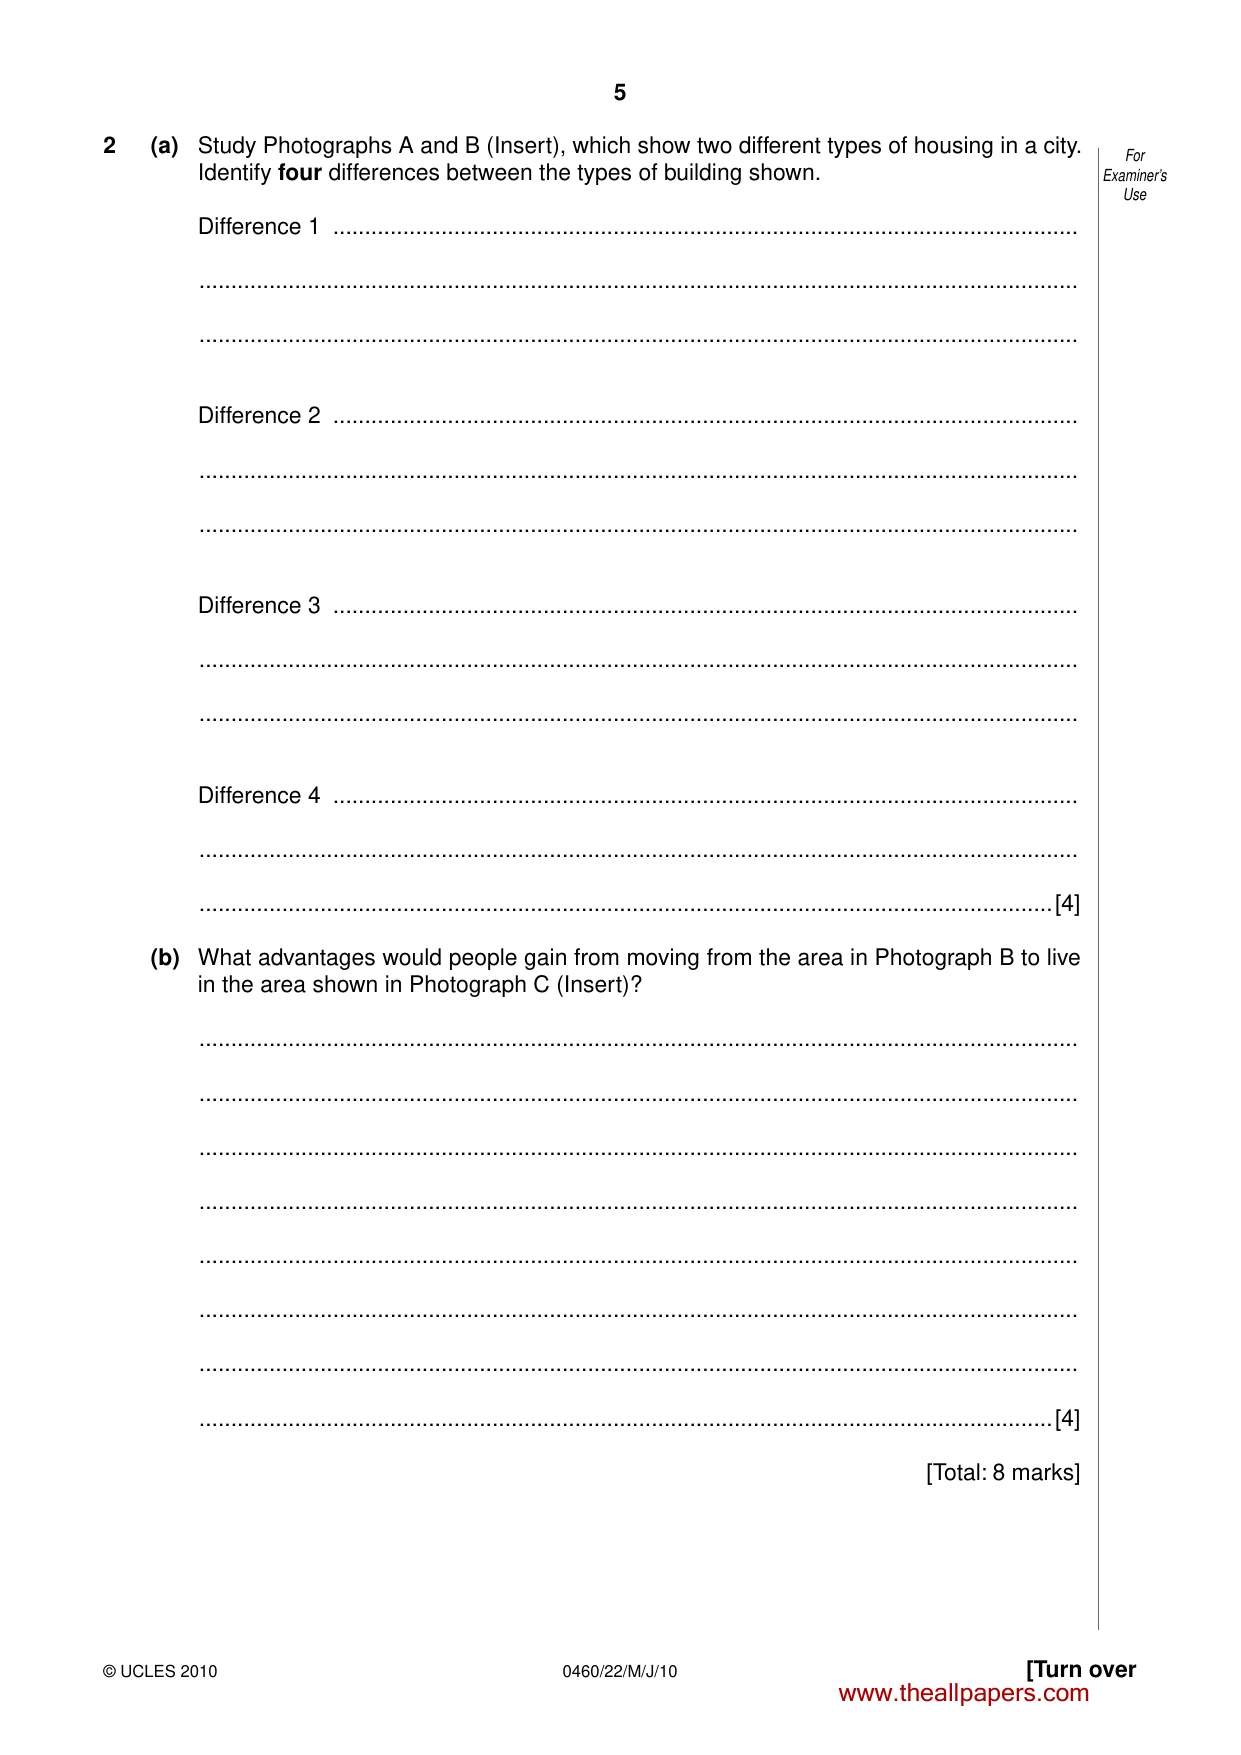
5 [Turn over © UCLES 2010 0460/22/M/J/10 For Examiner’s Use 2 (a) Study Photographs A and B (Insert), which show two different types of housing in a city. Identify four differences between the types of building shown. Difference 1 … … … Difference 2 … … … Difference 3 … … … Difference 4 … … …[4] (b) What advantages would people gain from moving from the area in Photograph B to live in the area shown in Photograph C (Insert)? … … … … … … … …[4] [Total: 8 marks] www.theallpapers.com
Question paper, page 6
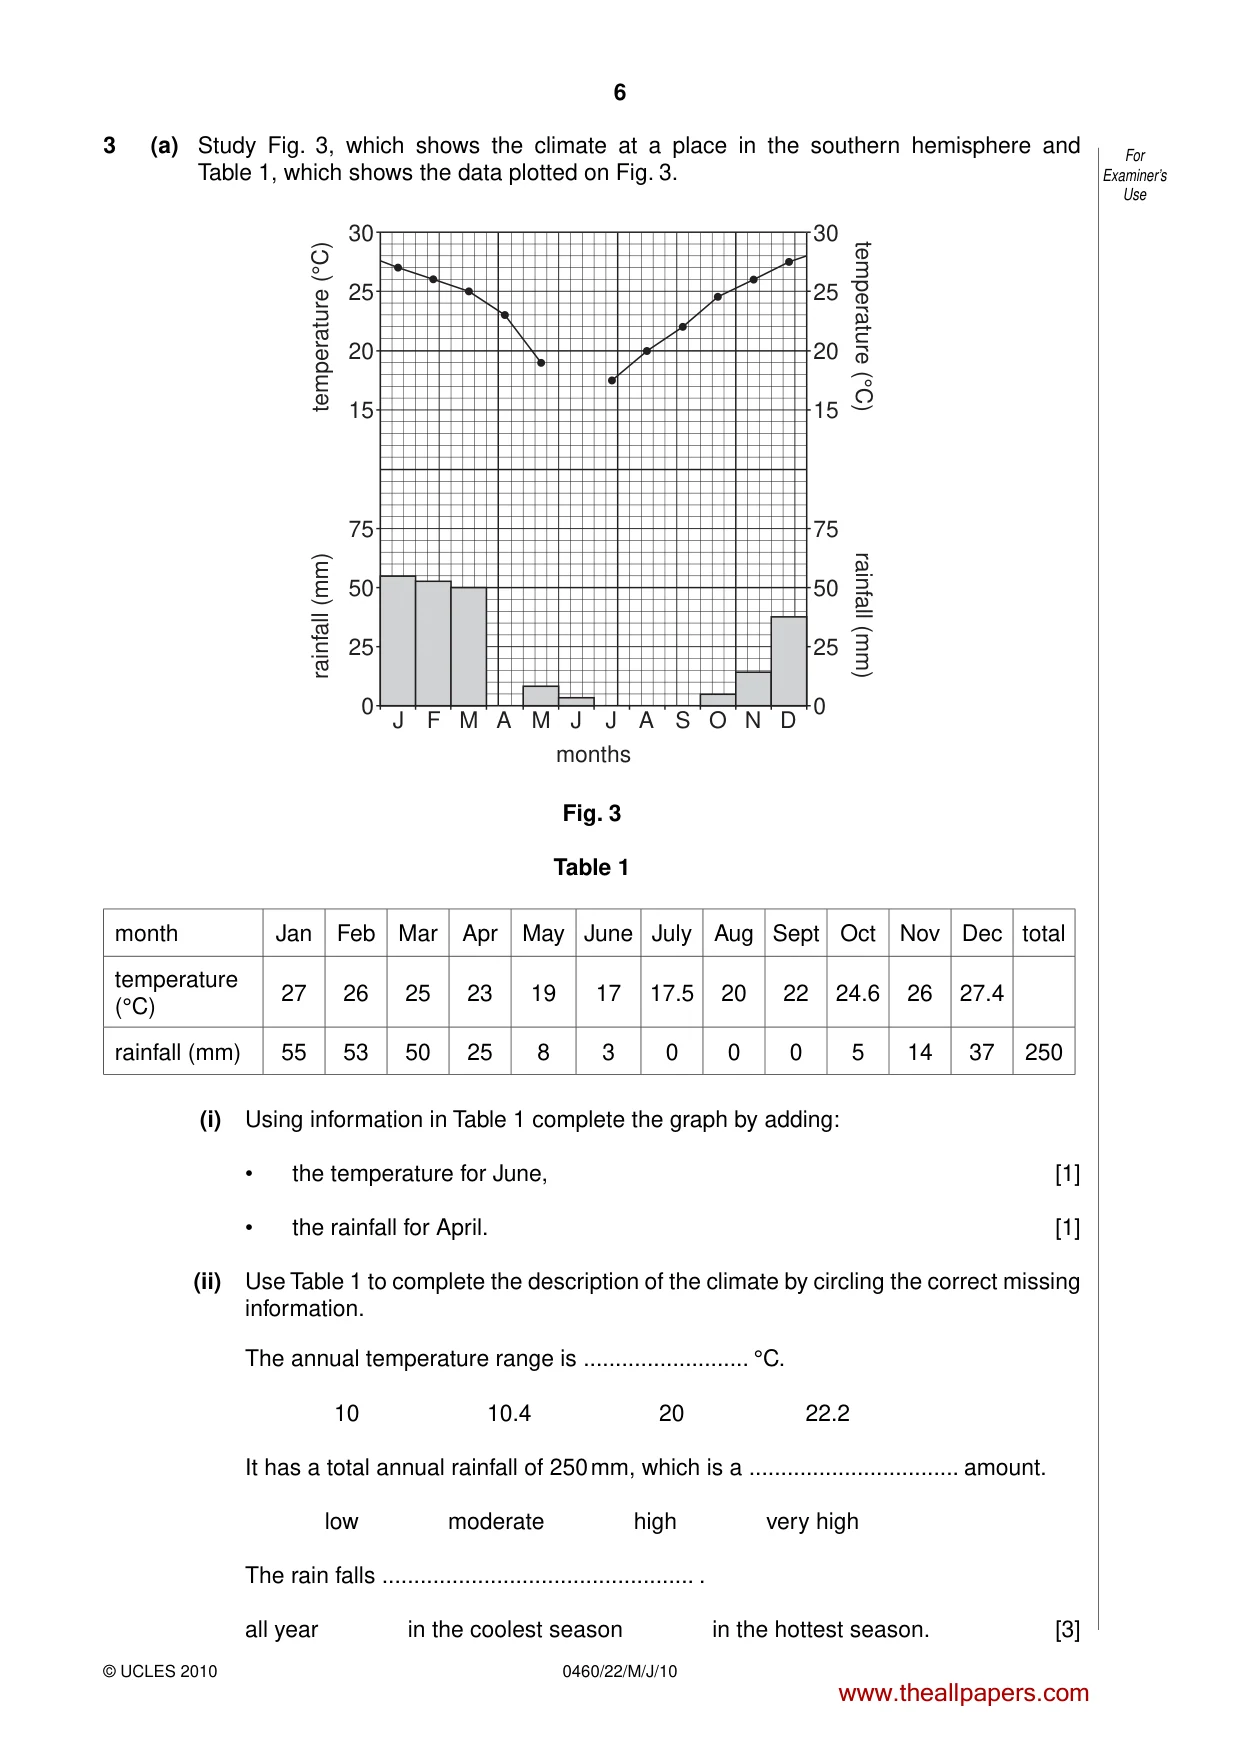
6 0460/22/M/J/10 © UCLES 2010 For Examiner’s Use 3 (a) Study Fig. 3, which shows the climate at a place in the southern hemisphere and Table 1, which shows the data plotted on Fig. 3. 0 J F M A M J months J A S O N D 25 50 rainfall (mm) temperature (°C) rainfall (mm) temperature (°C) 75 15 20 25 30 0 25 50 75 15 20 25 30 Fig. 3 Table 1 month Jan Feb Mar Apr May June July Aug Sept Oct Nov Dec total temperature (°C) 27 26 25 23 19 17 17.5 20 22 24.6 26 27.4 rainfall (mm) 55 53 50 25 8 3 0 0 0 5 14 37 250 (i) Using information in Table 1 complete the graph by adding: • the temperature for June, [1] • the rainfall for April. [1] (ii) Use Table 1 to complete the description of the climate by circling the correct missing information. The annual temperature range is … °C. 10 10.4 20 22.2 It has a total annual rainfall of 250 mm, which is a … amount. low moderate high very high The rain falls … . all year in the coolest season in the hottest season. [3] www.theallpapers.com
Question paper, page 7
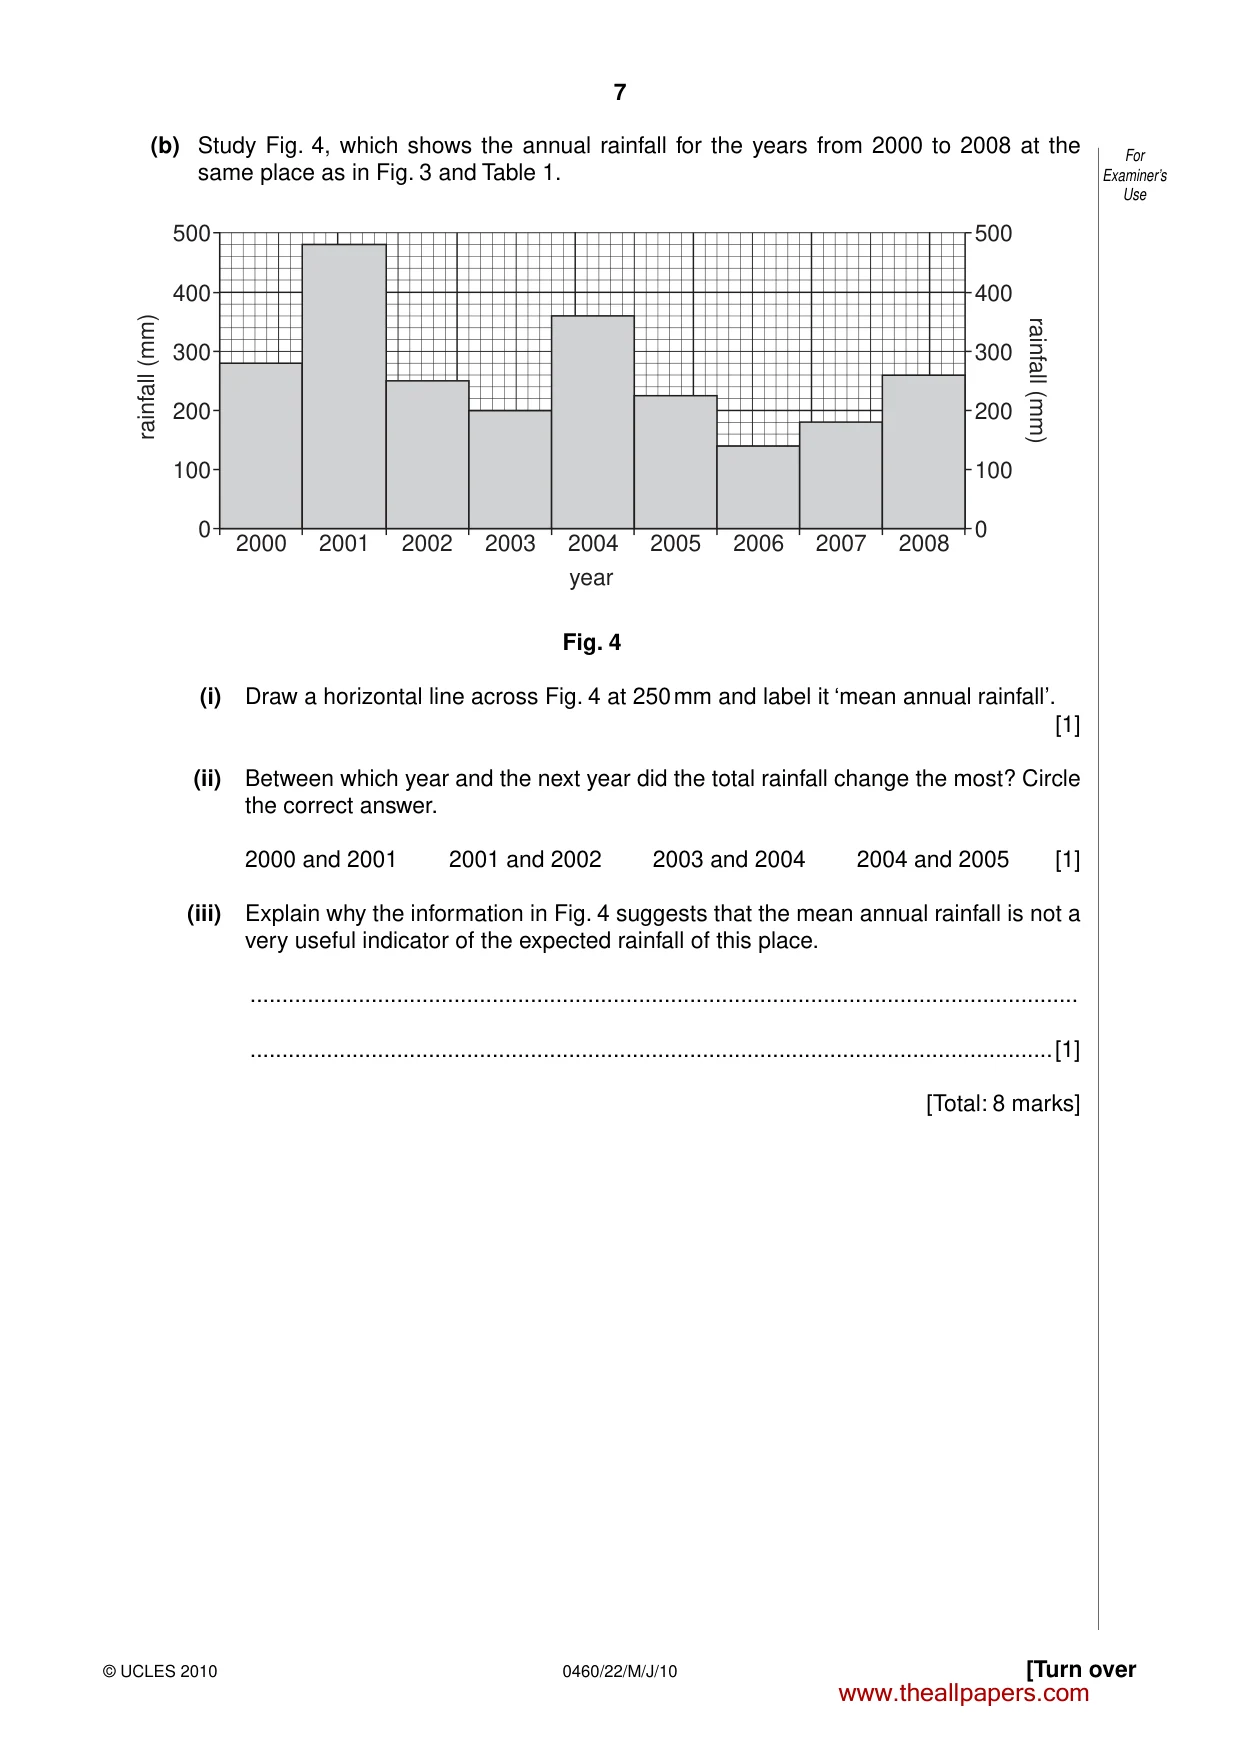
7 [Turn over © UCLES 2010 0460/22/M/J/10 For Examiner’s Use (b) Study Fig. 4, which shows the annual rainfall for the years from 2000 to 2008 at the same place as in Fig. 3 and Table 1. 0 2000 2001 2002 2003 2004 2006 2008 2007 2005 year 100 200 rainfall (mm) rainfall (mm) 300 400 500 0 100 200 300 400 500 Fig. 4 (i) Draw a horizontal line across Fig. 4 at 250 mm and label it ‘mean annual rainfall’. [1] (ii) Between which year and the next year did the total rainfall change the most? Circle the correct answer. 2000 and 2001 2001 and 2002 2003 and 2004 2004 and 2005 [1] (iii) Explain why the information in Fig. 4 suggests that the mean annual rainfall is not a very useful indicator of the expected rainfall of this place. … …[1] [Total: 8 marks] www.theallpapers.com
Question paper, page 8
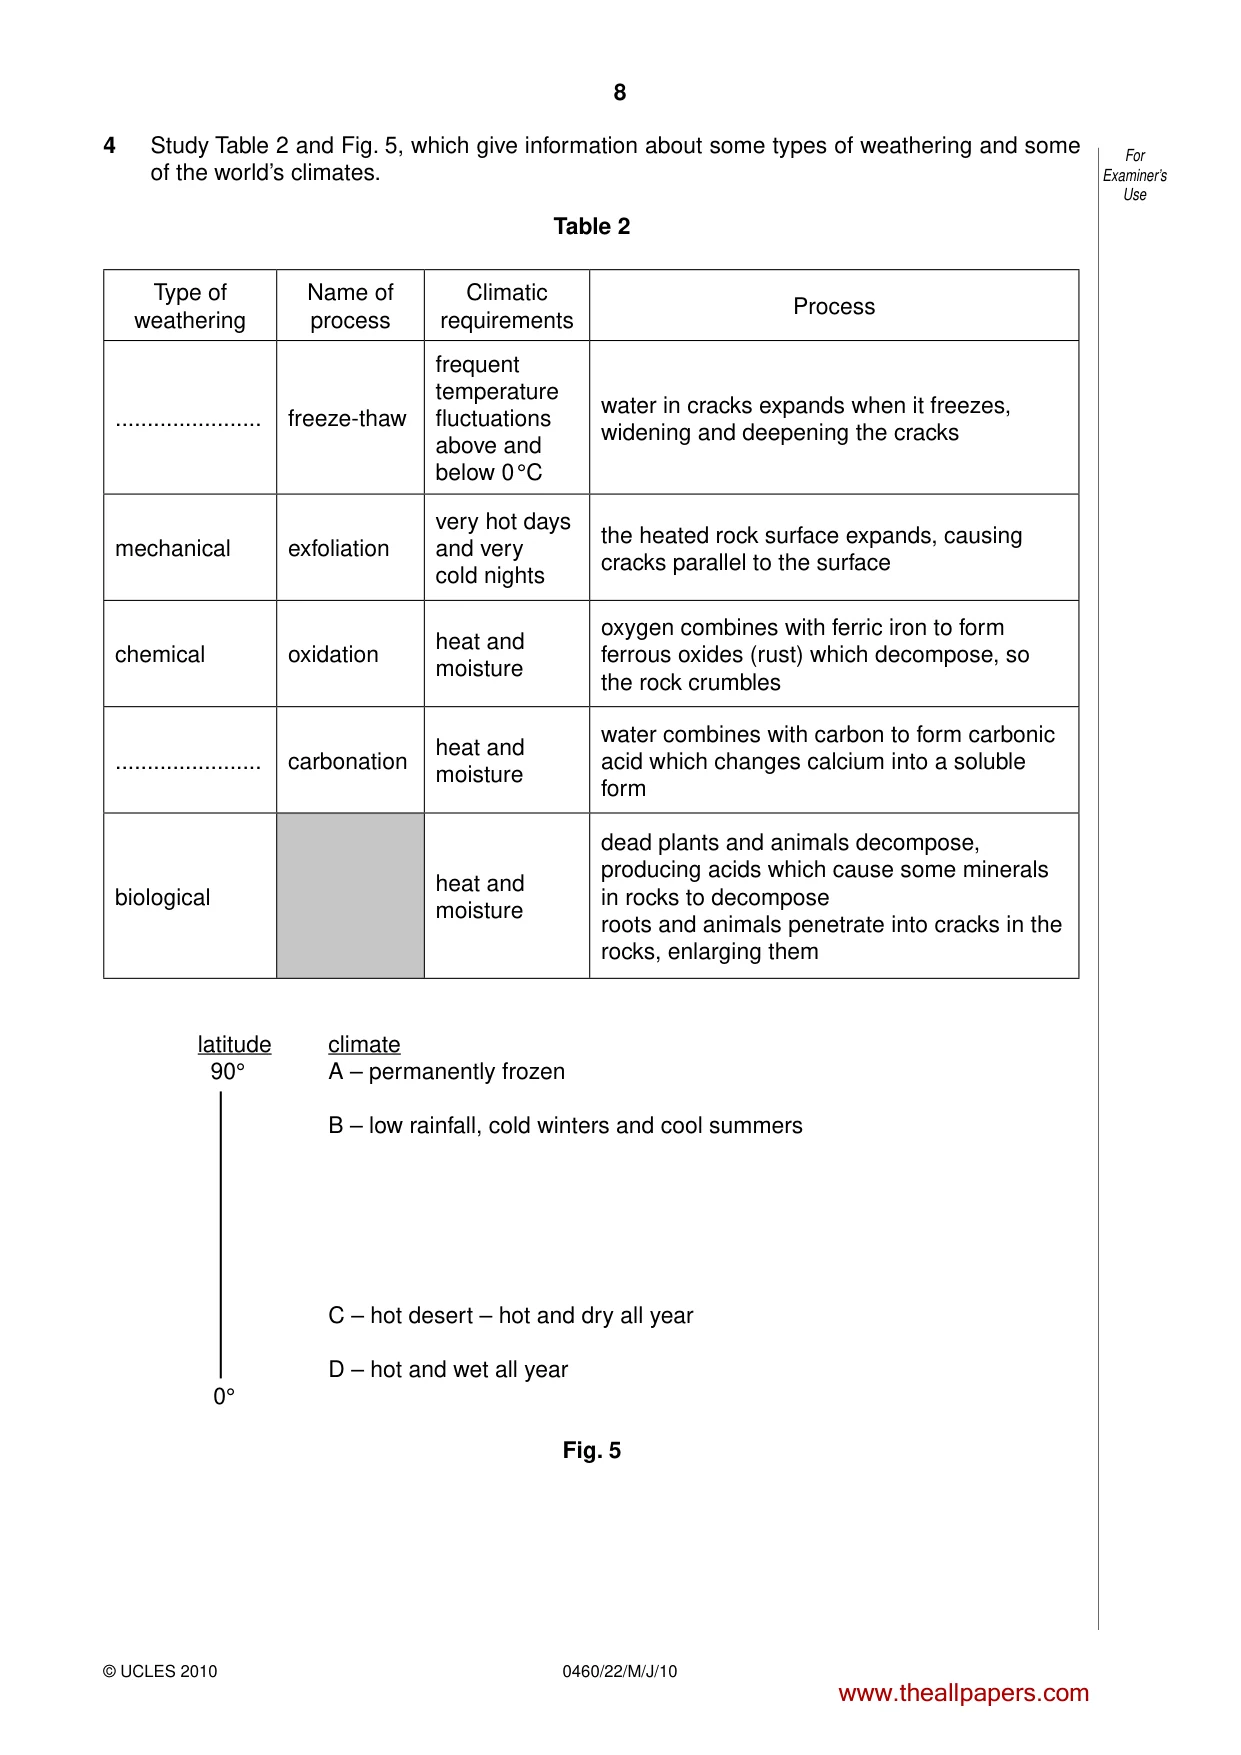
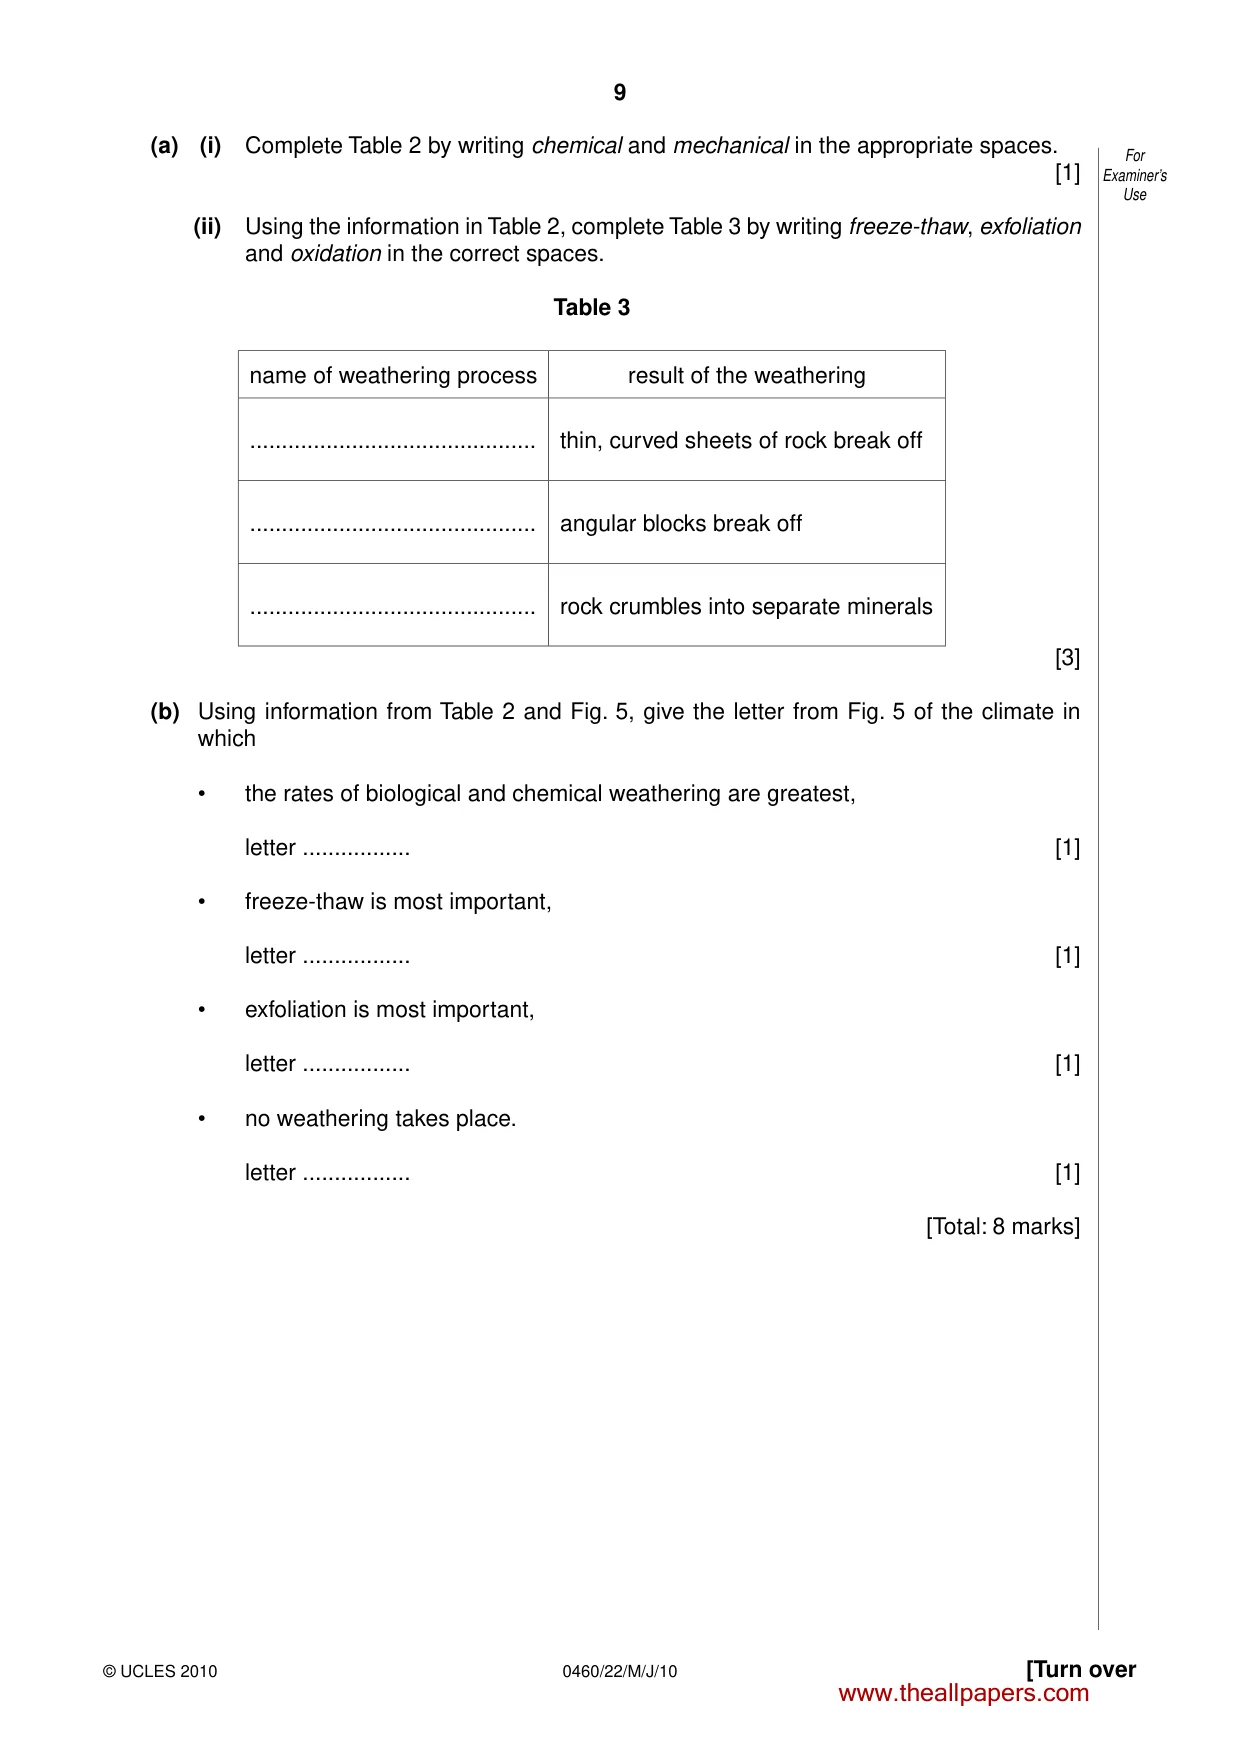
8 0460/22/M/J/10 © UCLES 2010 For Examiner’s Use 4 Study Table 2 and Fig. 5, which give information about some types of weathering and some of the world’s climates. Table 2 Type of weathering Name of process Climatic requirements Process … freeze-thaw frequent temperature fluctuations above and below 0 °C water in cracks expands when it freezes, widening and deepening the cracks mechanical exfoliation very hot days and very cold nights the heated rock surface expands, causing cracks parallel to the surface chemical oxidation heat and moisture oxygen combines with ferric iron to form ferrous oxides (rust) which decompose, so the rock crumbles … carbonation heat and moisture water combines with carbon to form carbonic acid which changes calcium into a soluble form biological heat and moisture dead plants and animals decompose, producing acids which cause some minerals in rocks to decompose roots and animals penetrate into cracks in the rocks, enlarging them latitude climate 90° A – permanently frozen B – low rainfall, cold winters and cool summers C – hot desert – hot and dry all year D – hot and wet all year 0° Fig. 5 www.theallpapers.com
Question paper, page 9
9 [Turn over © UCLES 2010 0460/22/M/J/10 For Examiner’s Use (a) (i) Complete Table 2 by writing chemical and mechanical in the appropriate spaces. [1] (ii) Using the information in Table 2, complete Table 3 by writing freeze-thaw, exfoliation and oxidation in the correct spaces. Table 3 name of weathering process result of the weathering … thin, curved sheets of rock break off … angular blocks break off … rock crumbles into separate minerals [3] (b) Using information from Table 2 and Fig. 5, give the letter from Fig. 5 of the climate in which • the rates of biological and chemical weathering are greatest, letter … [1] • freeze-thaw is most important, letter … [1] • exfoliation is most important, letter … [1] • no weathering takes place. letter … [1] [Total: 8 marks] www.theallpapers.com
Question paper, page 10
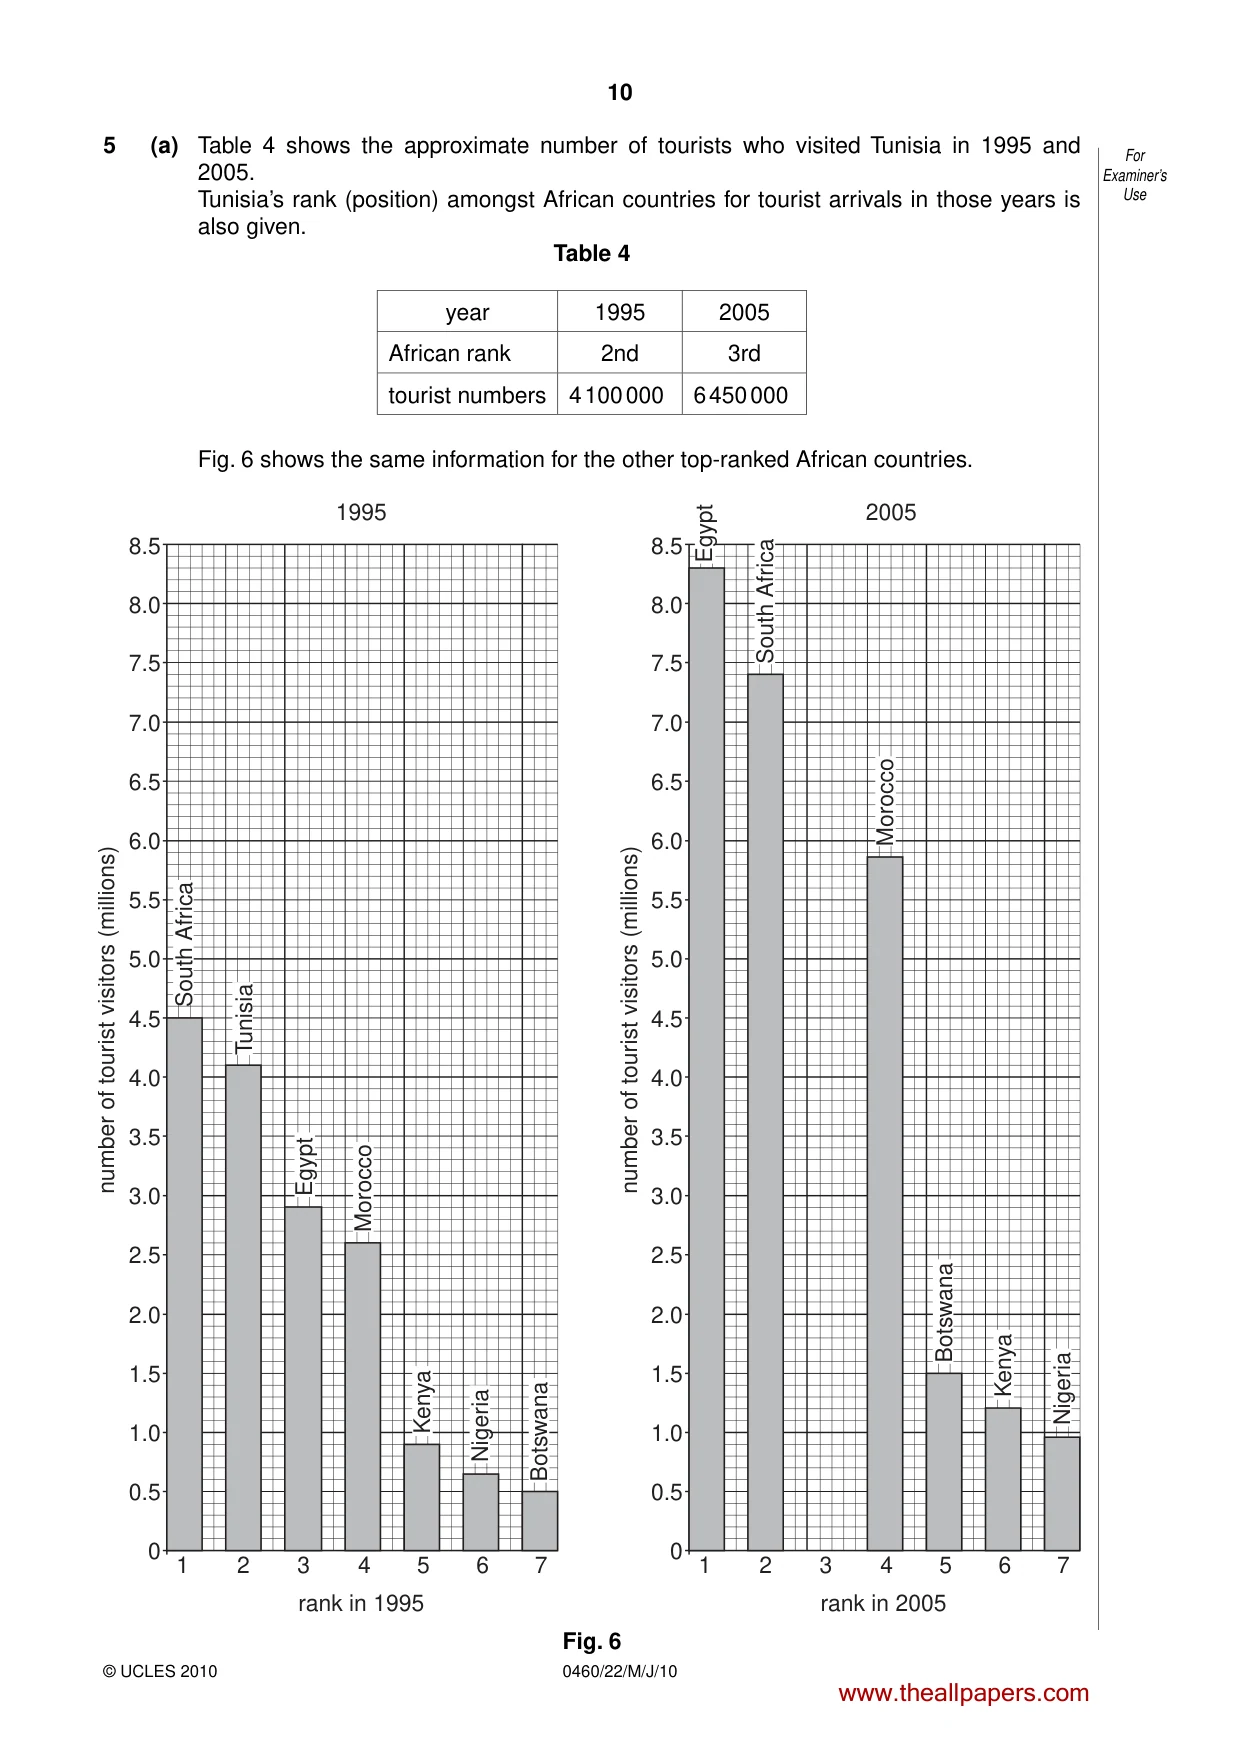
10 0460/22/M/J/10 © UCLES 2010 For Examiner’s Use 5 (a) Table 4 shows the approximate number of tourists who visited Tunisia in 1995 and 2005. Tunisia’s rank (position) amongst African countries for tourist arrivals in those years is also given. Table 4 year 1995 2005 African rank 2nd 3rd tourist numbers 4 100 000 6 450 000 Fig. 6 shows the same information for the other top-ranked African countries. 0 1 2 3 4 rank in 1995 1995 2005 5 6 7 0.5 1.0 number of tourist visitors (millions) 1.5 2.0 2.5 3.0 3.5 4.0 4.5 5.0 5.5 6.0 6.5 7.0 7.5 8.0 8.5 South Africa Nigeria Botswana Kenya Morocco Egypt Tunisia 0 1 2 3 4 rank in 2005 5 6 7 0.5 1.0 number of tourist visitors (millions) 1.5 2.0 2.5 3.0 3.5 4.0 4.5 5.0 5.5 6.0 6.5 7.0 7.5 8.0 8.5 South Africa Nigeria Botswana Kenya Morocco Egypt Fig. 6 www.theallpapers.com
Question paper, page 11
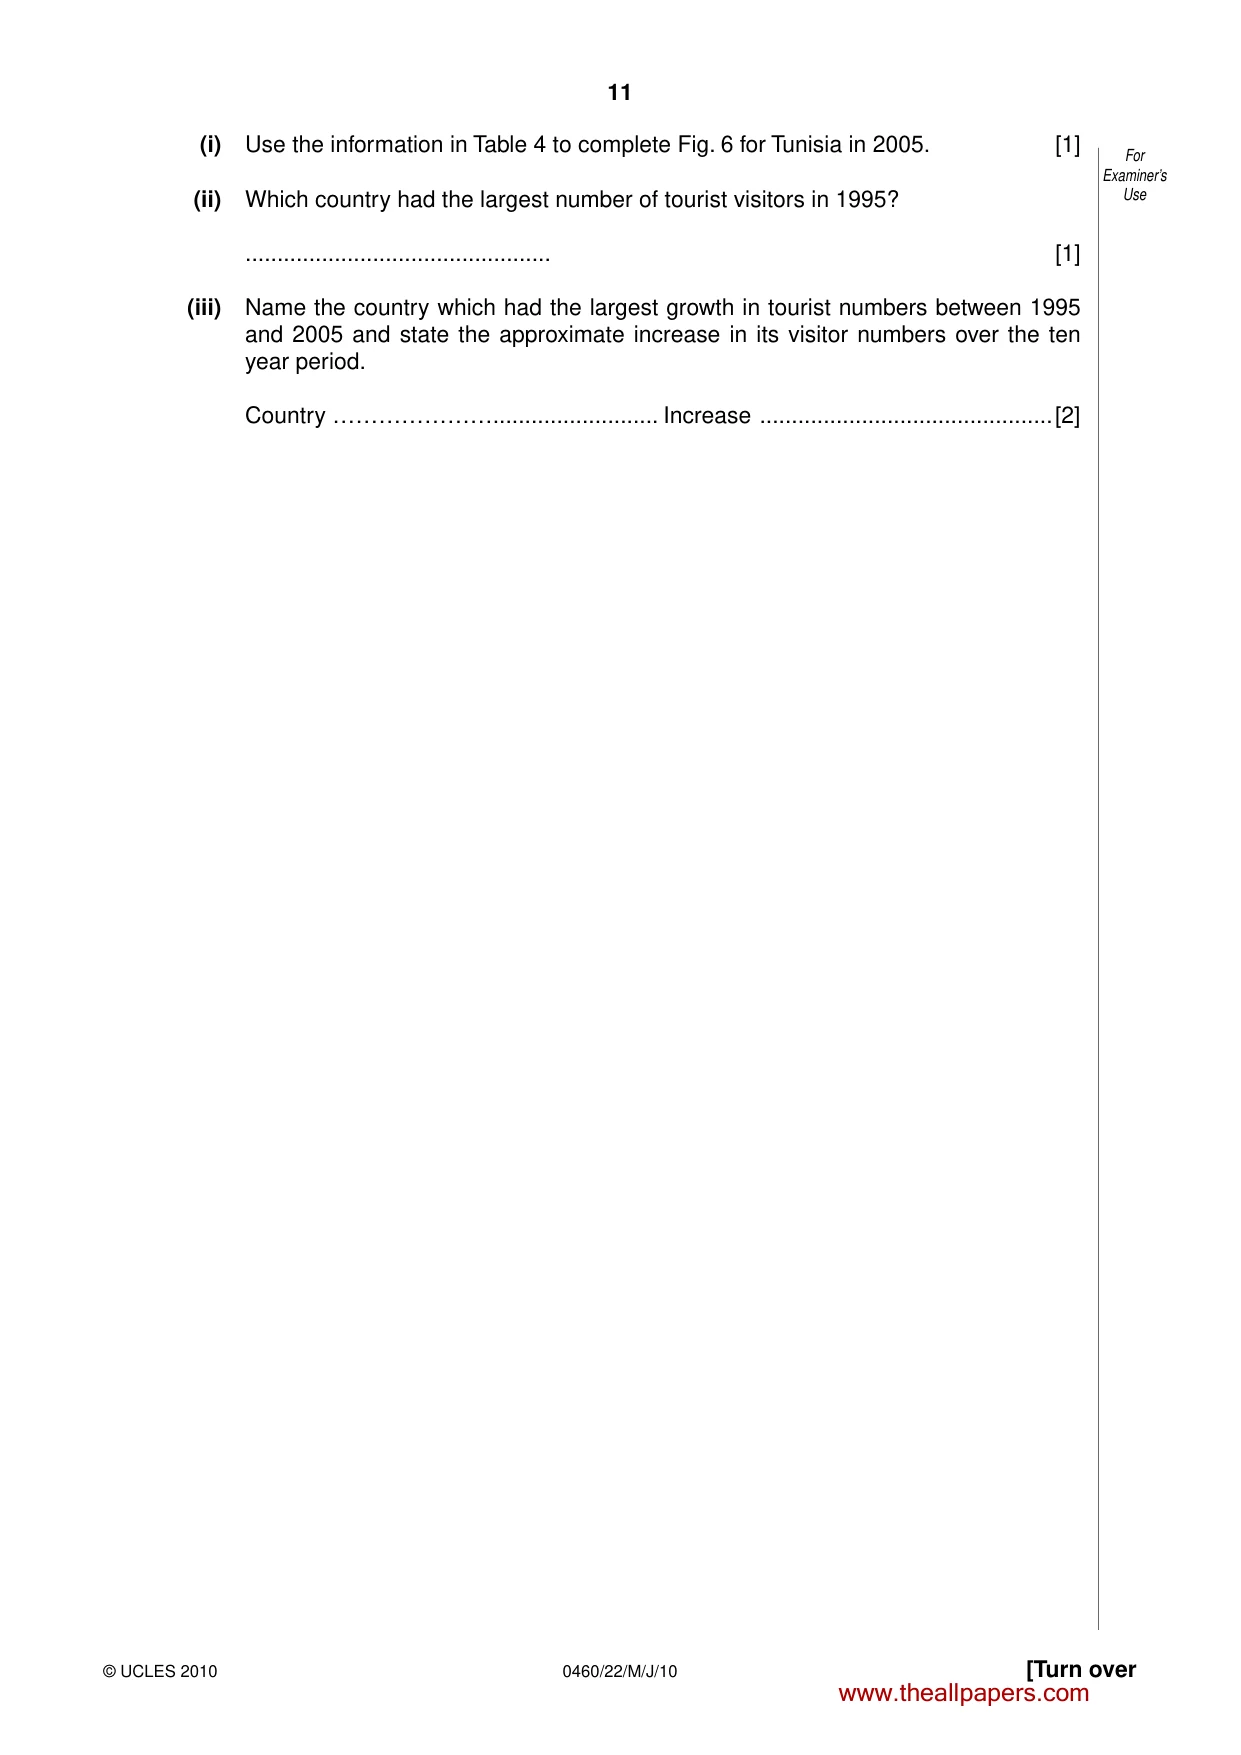
11 [Turn over © UCLES 2010 0460/22/M/J/10 For Examiner’s Use (i) Use the information in Table 4 to complete Fig. 6 for Tunisia in 2005. [1] (ii) Which country had the largest number of tourist visitors in 1995? … [1] (iii) Name the country which had the largest growth in tourist numbers between 1995 and 2005 and state the approximate increase in its visitor numbers over the ten year period. Country …………………… Increase …[2] www.theallpapers.com
Question paper, page 12
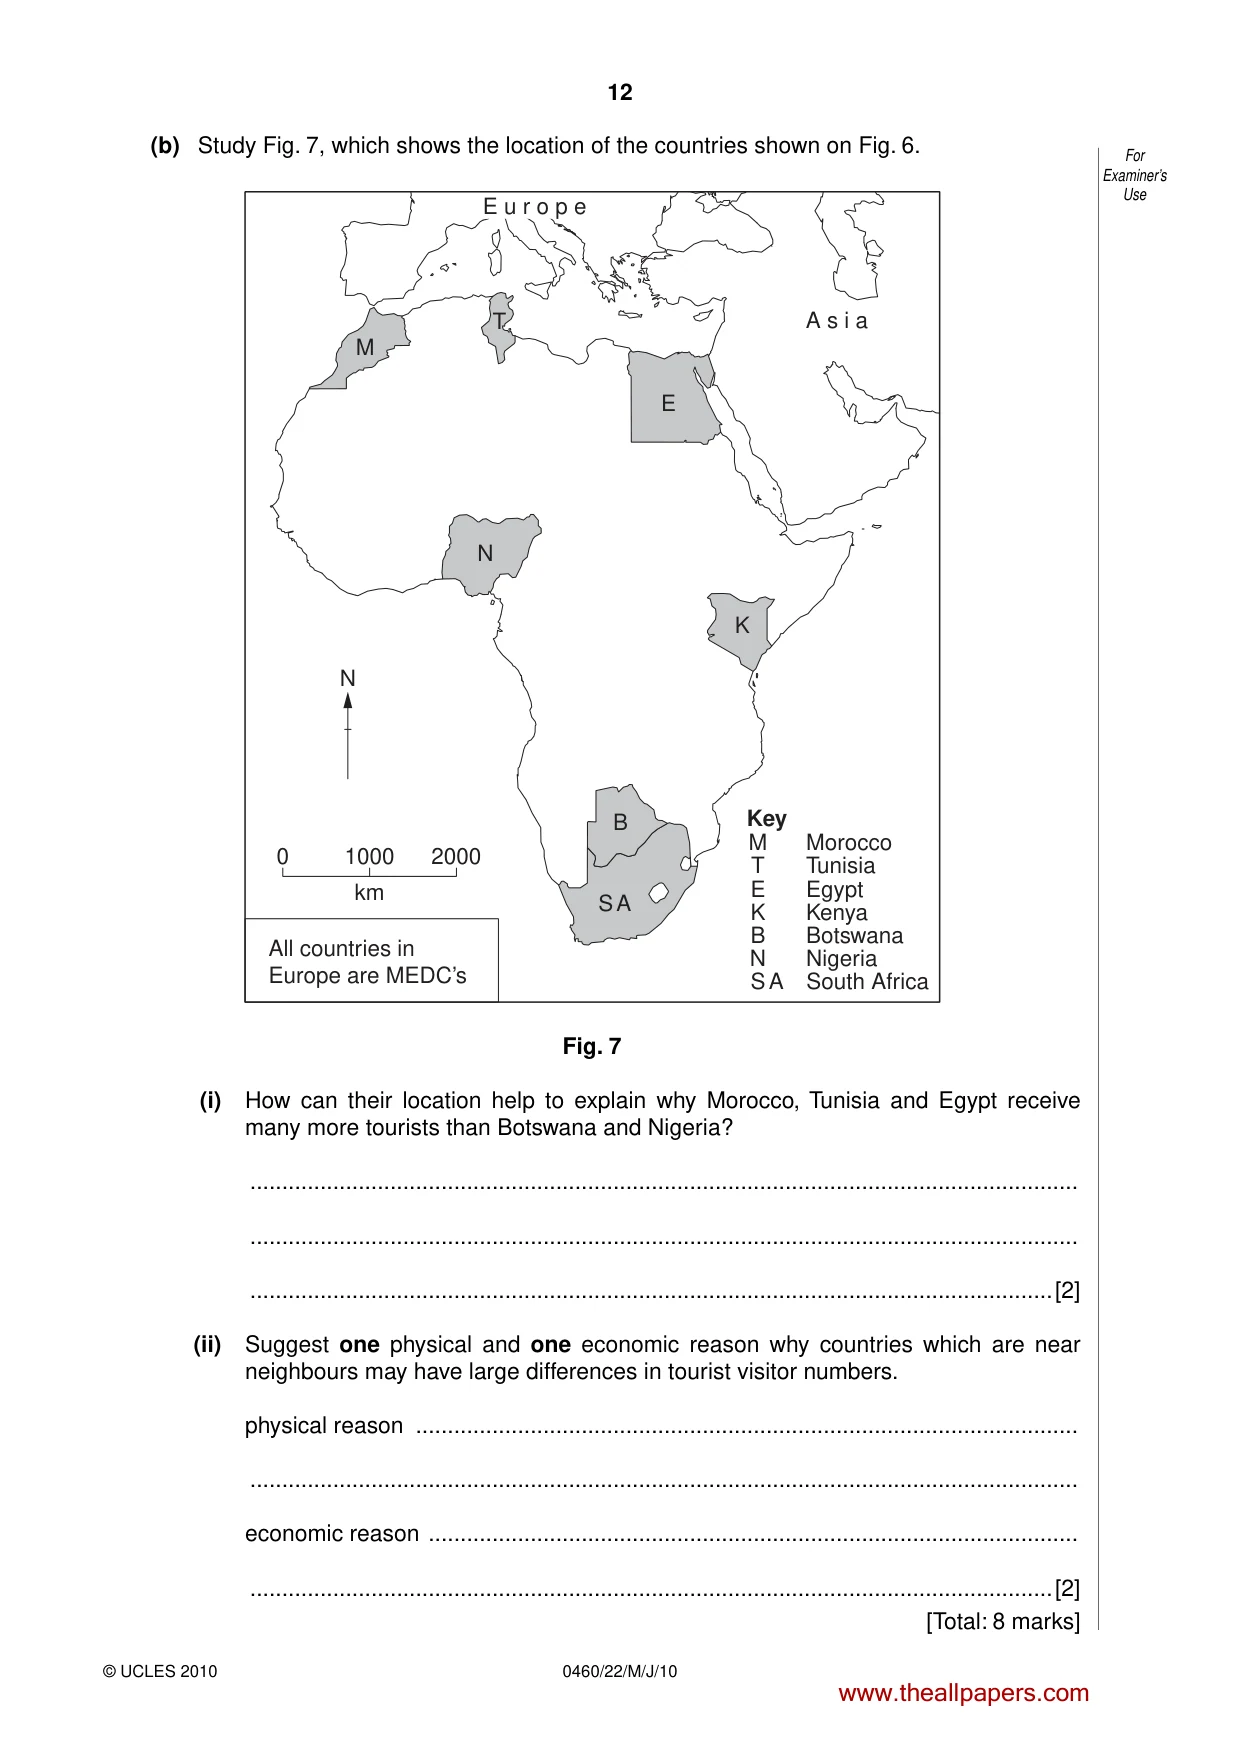
12 0460/22/M/J/10 © UCLES 2010 For Examiner’s Use (b) Study Fig. 7, which shows the location of the countries shown on Fig. 6. K B S A N N E A s i a M T E u r o p e 0 1000 All countries in Europe are MEDC’s km 2000 Key M T E K B N S A Morocco Tunisia Egypt Kenya Botswana Nigeria South Africa Fig. 7 (i) How can their location help to explain why Morocco, Tunisia and Egypt receive many more tourists than Botswana and Nigeria? … … …[2] (ii) Suggest one physical and one economic reason why countries which are near neighbours may have large differences in tourist visitor numbers. physical reason … … economic reason … …[2] [Total: 8 marks] www.theallpapers.com
Question paper, page 13
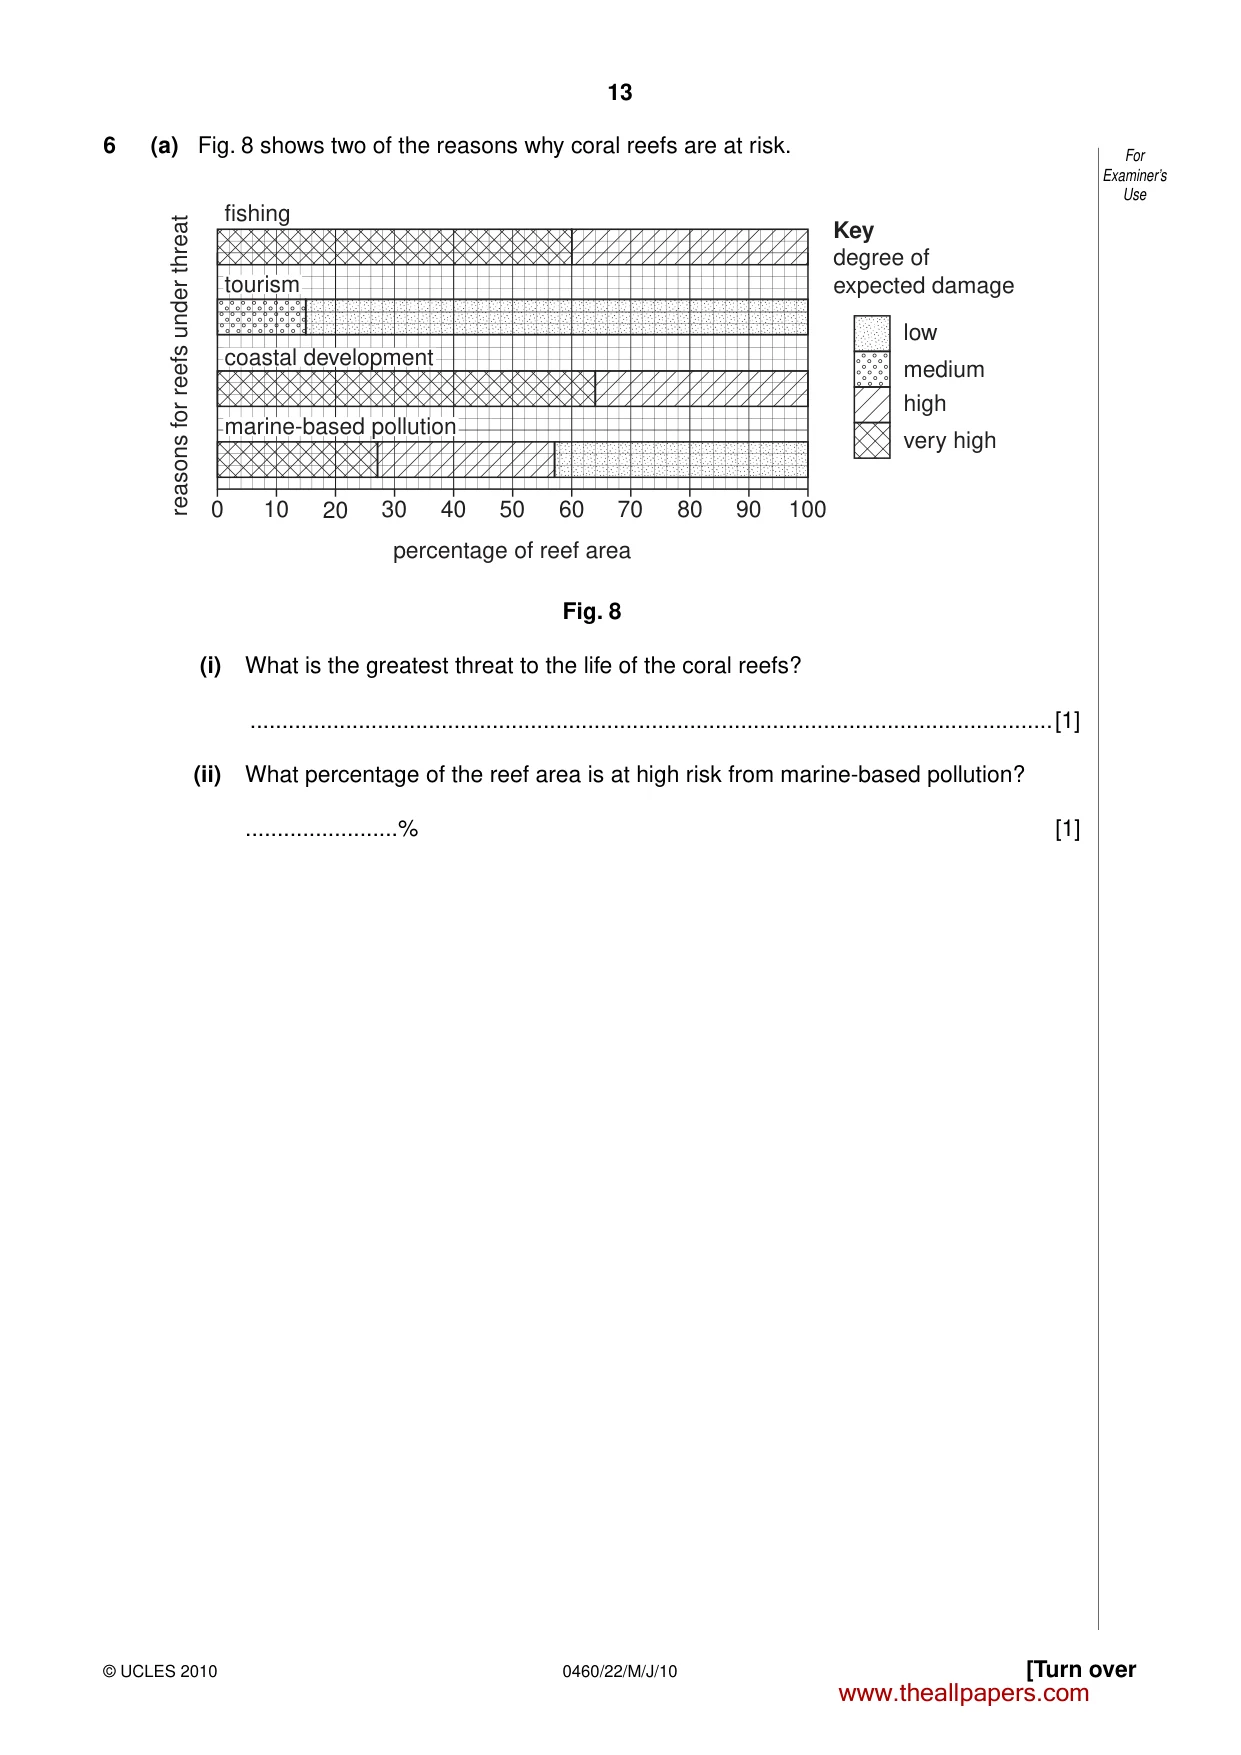
13 [Turn over © UCLES 2010 0460/22/M/J/10 For Examiner’s Use 6 (a) Fig. 8 shows two of the reasons why coral reefs are at risk. 0 10 fishing Key degree of expected damage low medium high very high 20 reasons for reefs under threat 30 40 50 percentage of reef area 60 70 80 90 100 tourism coastal development marine-based pollution Fig. 8 (i) What is the greatest threat to the life of the coral reefs? …[1] (ii) What percentage of the reef area is at high risk from marine-based pollution? …% [1] www.theallpapers.com
Question paper, page 14
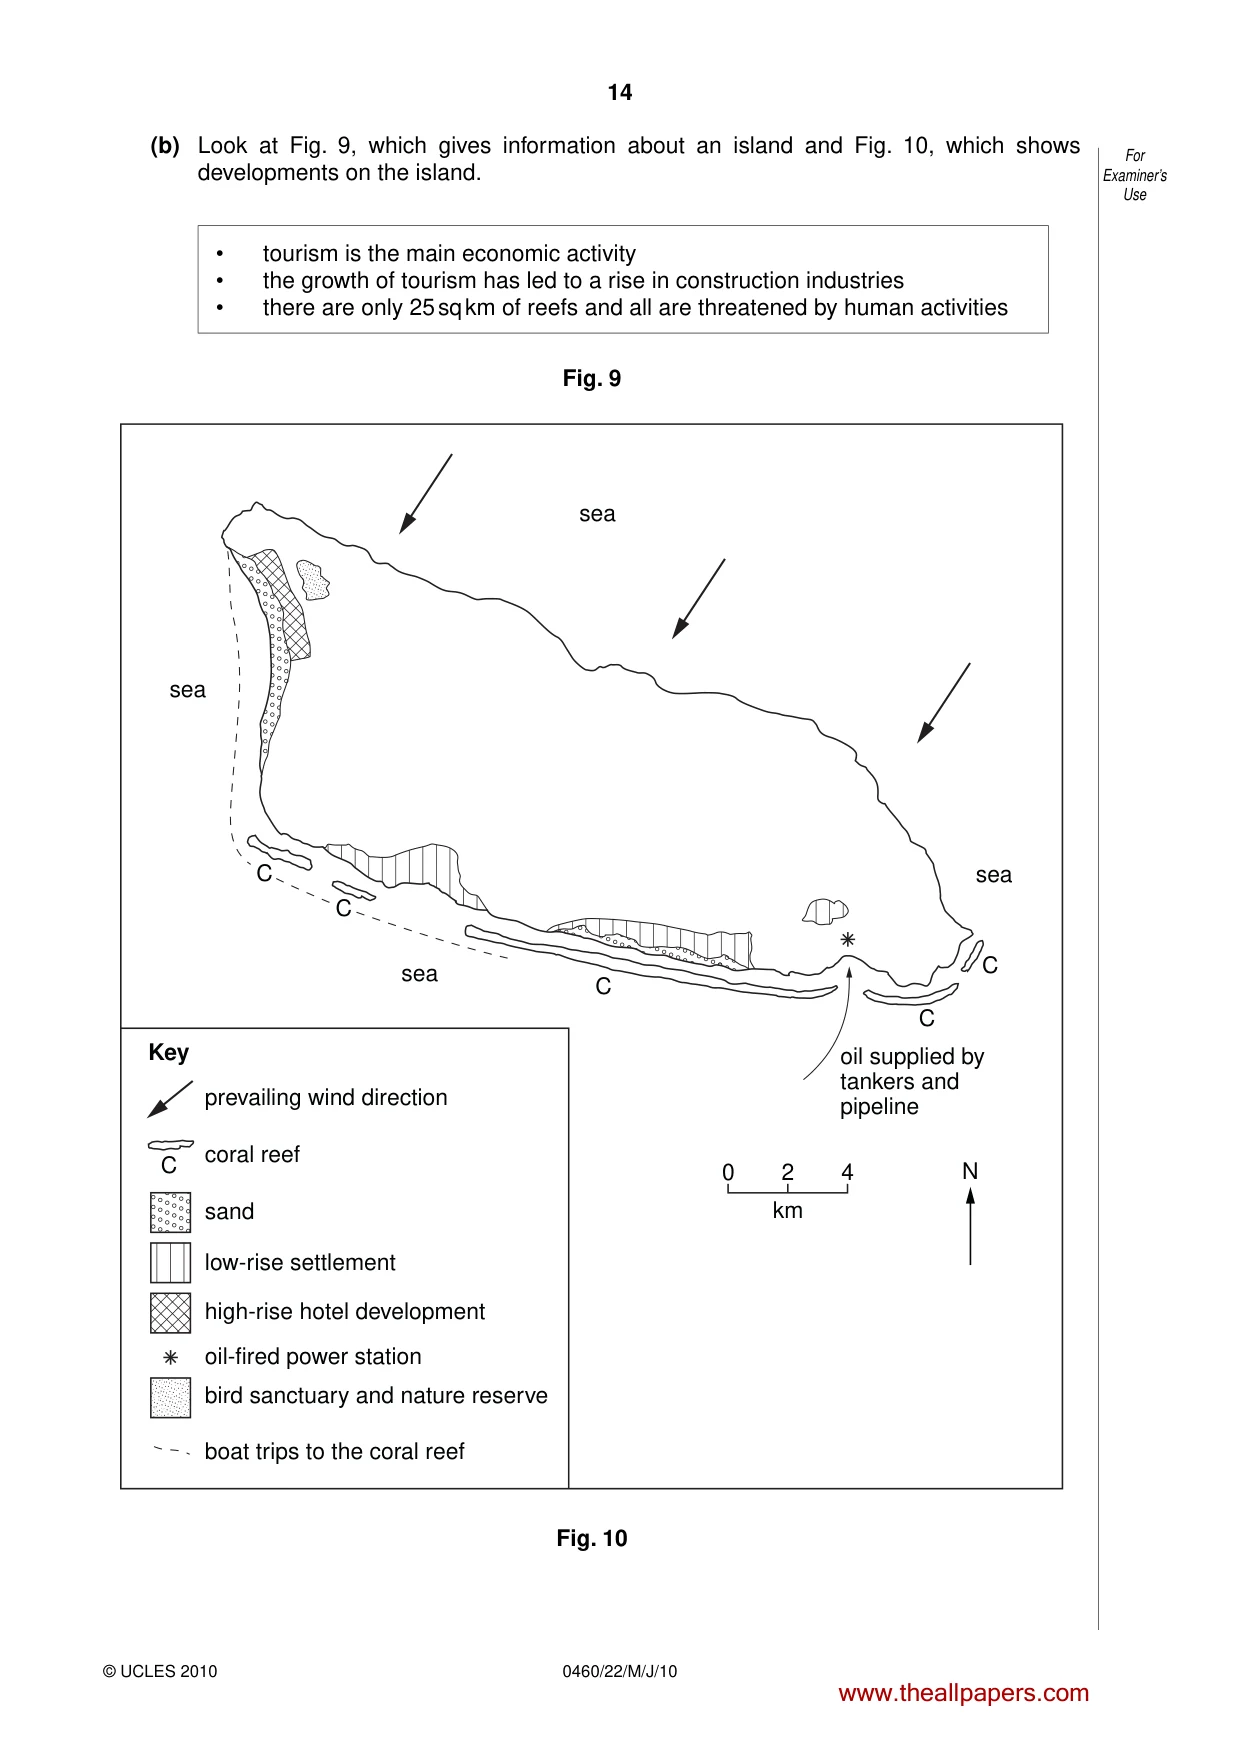
14 0460/22/M/J/10 © UCLES 2010 For Examiner’s Use (b) Look at Fig. 9, which gives information about an island and Fig. 10, which shows developments on the island. • tourism is the main economic activity • the growth of tourism has led to a rise in construction industries • there are only 25 sq km of reefs and all are threatened by human activities Fig. 9 sea sea sea sand coral reef prevailing wind direction low-rise settlement high-rise hotel development oil-fired power station bird sanctuary and nature reserve boat trips to the coral reef sea C C C C C oil supplied by tankers and pipeline 0 2 N Key km 4 C Fig. 10 www.theallpapers.com
Question paper, page 15
15 © UCLES 2010 0460/22/M/J/10 For Examiner’s Use Using only evidence from Fig. 10: (i) state one way in which marine-based pollution (pollution which occurs at sea) is likely to occur in this area; … …[1] (ii) explain why the oil-fired power station will not cause air pollution problems on the island; … … …[2] (iii) explain how the location of the recent high-rise hotel development will cause noise and visual pollution problems. … … … … … …[3] [Total: 8 marks] www.theallpapers.com
Question paper, page 16
16 0460/22/M/J/10 © UCLES 2010 BLANK PAGE Copyright Acknowledgements: Question 2 Photograph A © Muriel Fretwell © UCLES. Question 2 Photograph B © Muriel Fretwell © UCLES. Question 2 Photograph C © Muriel Fretwell © UCLES. Question 5a Fig. 6 © www.nationmaster.com; 28/3/2009. Permission to reproduce items where third-party owned material protected by copyright is included has been sought and cleared where possible. Every reasonable effort has been made by the publisher (UCLES) to trace copyright holders, but if any items requiring clearance have unwittingly been included, the publisher will be pleased to make amends at the earliest possible opportunity. University of Cambridge International Examinations is part of the Cambridge Assessment Group. Cambridge Assessment is the brand name of University of Cambridge Local Examinations Syndicate (UCLES), which is itself a department of the University of Cambridge. www.theallpapers.com
Mark scheme, page 1
UNIVERSITY OF CAMBRIDGE INTERNATIONAL EXAMINATIONS International General Certificate of Secondary Education MARK SCHEME for the May/June 2010 question paper for the guidance of teachers 0460 GEOGRAPHY 0460/22 Paper 22, maximum raw mark 60 This mark scheme is published as an aid to teachers and candidates, to indicate the requirements of the examination. It shows the basis on which Examiners were instructed to award marks. It does not indicate the details of the discussions that took place at an Examiners’ meeting before marking began, which would have considered the acceptability of alternative answers. Mark schemes must be read in conjunction with the question papers and the report on the examination. • CIE will not enter into discussions or correspondence in connection with these mark schemes. CIE is publishing the mark schemes for the May/June 2010 question papers for most IGCSE, GCE Advanced Level and Advanced Subsidiary Level syllabuses and some Ordinary Level syllabuses. www.theallpapers.com
Mark scheme, page 2
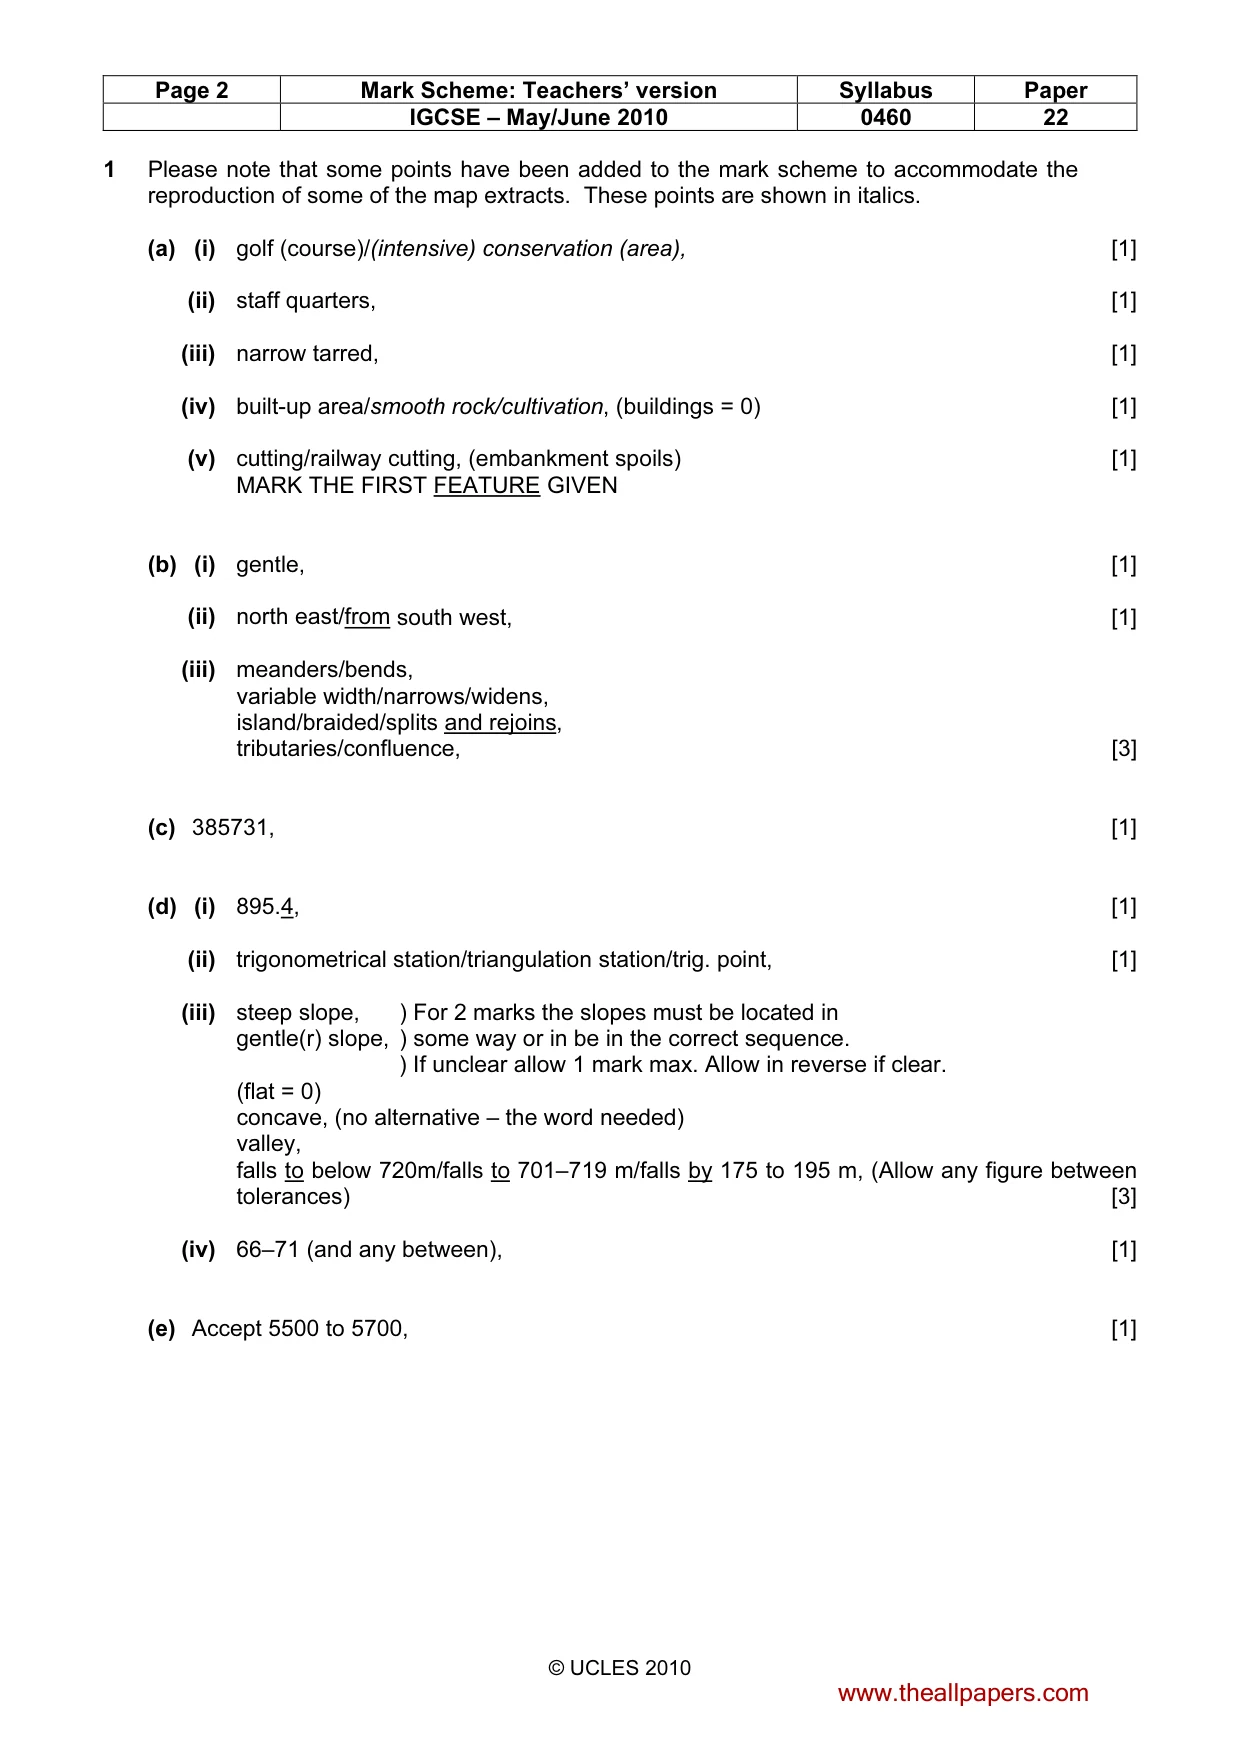
Page 2 Mark Scheme: Teachers’ version Syllabus Paper IGCSE – May/June 2010 0460 22 © UCLES 2010 1 Please note that some points have been added to the mark scheme to accommodate the reproduction of some of the map extracts. These points are shown in italics. (a) (i) golf (course)/(intensive) conservation (area), [1] (ii) staff quarters, [1] (iii) narrow tarred, [1] (iv) built-up area/smooth rock/cultivation, (buildings = 0) [1] (v) cutting/railway cutting, (embankment spoils) [1] MARK THE FIRST FEATURE GIVEN (b) (i) gentle, [1] (ii) north east/from south west, [1] (iii) meanders/bends, variable width/narrows/widens, island/braided/splits and rejoins, tributaries/confluence, [3] (c) 385731, [1] (d) (i) 895.4, [1] (ii) trigonometrical station/triangulation station/trig. point, [1] (iii) steep slope, ) For 2 marks the slopes must be located in gentle(r) slope, ) some way or in be in the correct sequence. ) If unclear allow 1 mark max. Allow in reverse if clear. (flat = 0) concave, (no alternative – the word needed) valley, falls to below 720m/falls to 701–719 m/falls by 175 to 195 m, (Allow any figure between tolerances) [3] (iv) 66–71 (and any between), [1] (e) Accept 5500 to 5700, [1] www.theallpapers.com
Mark scheme, page 3
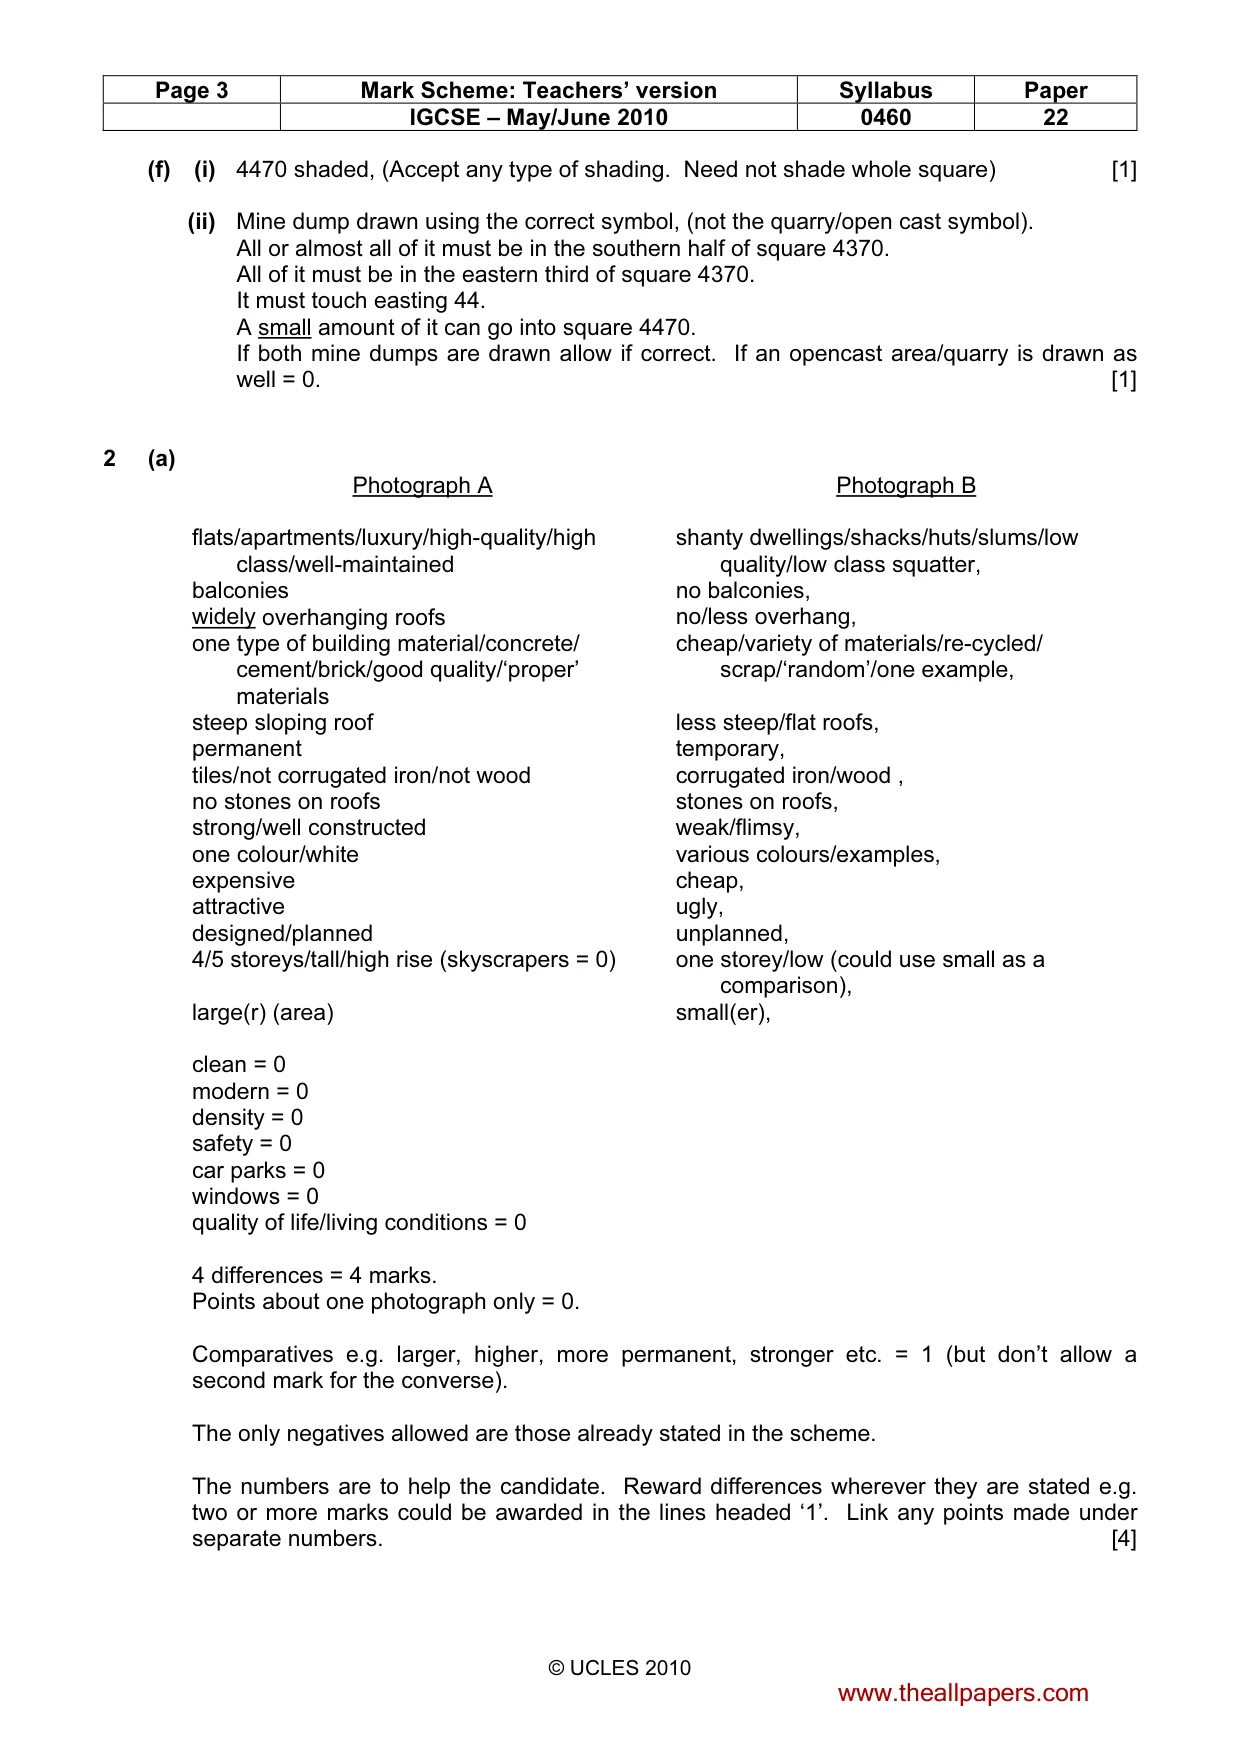
Page 3 Mark Scheme: Teachers’ version Syllabus Paper IGCSE – May/June 2010 0460 22 © UCLES 2010 (f) (i) 4470 shaded, (Accept any type of shading. Need not shade whole square) [1] (ii) Mine dump drawn using the correct symbol, (not the quarry/open cast symbol). All or almost all of it must be in the southern half of square 4370. All of it must be in the eastern third of square 4370. It must touch easting 44. A small amount of it can go into square 4470. If both mine dumps are drawn allow if correct. If an opencast area/quarry is drawn as well = 0. [1] 2 (a) Photograph A flats/apartments/luxury/high-quality/high class/well-maintained balconies widely overhanging roofs one type of building material/concrete/ cement/brick/good quality/‘proper’ materials steep sloping roof permanent tiles/not corrugated iron/not wood no stones on roofs strong/well constructed one colour/white expensive attractive designed/planned 4/5 storeys/tall/high rise (skyscrapers = 0) large(r) (area) Photograph B shanty dwellings/shacks/huts/slums/low quality/low class squatter, no balconies, no/less overhang, cheap/variety of materials/re-cycled/ scrap/‘random’/one example, less steep/flat roofs, temporary, corrugated iron/wood , stones on roofs, weak/flimsy, various colours/examples, cheap, ugly, unplanned, one storey/low (could use small as a comparison), small(er), clean = 0 modern = 0 density = 0 safety = 0 car parks = 0 windows = 0 quality of life/living conditions = 0 4 differences = 4 marks. Points about one photograph only = 0. Comparatives e.g. larger, higher, more permanent, stronger etc. = 1 (but don’t allow a second mark for the converse). The only negatives allowed are those already stated in the scheme. The numbers are to help the candidate. Reward differences wherever they are stated e.g. two or more marks could be awarded in the lines headed ‘1’. Link any points made under separate numbers. [4] www.theallpapers.com
Mark scheme, page 4
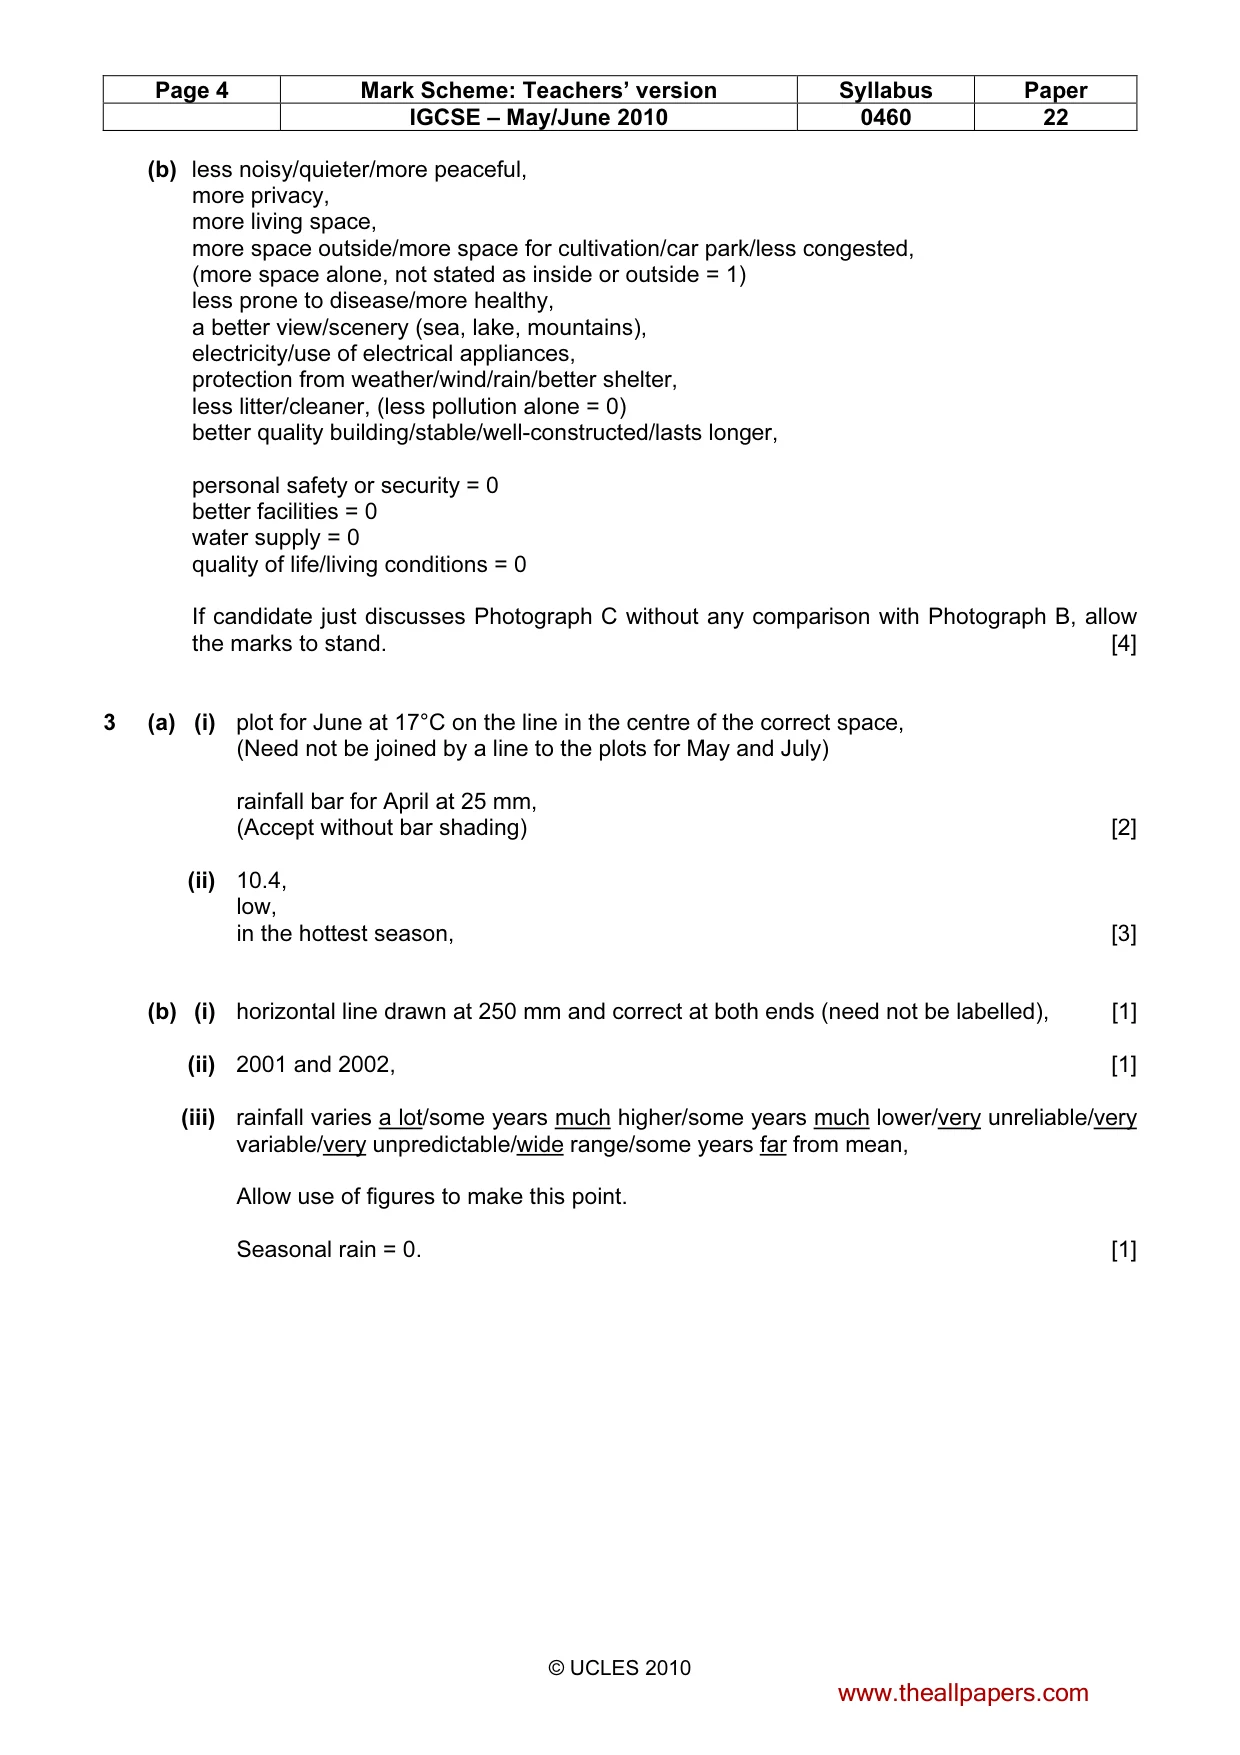
Page 4 Mark Scheme: Teachers’ version Syllabus Paper IGCSE – May/June 2010 0460 22 © UCLES 2010 (b) less noisy/quieter/more peaceful, more privacy, more living space, more space outside/more space for cultivation/car park/less congested, (more space alone, not stated as inside or outside = 1) less prone to disease/more healthy, a better view/scenery (sea, lake, mountains), electricity/use of electrical appliances, protection from weather/wind/rain/better shelter, less litter/cleaner, (less pollution alone = 0) better quality building/stable/well-constructed/lasts longer, personal safety or security = 0 better facilities = 0 water supply = 0 quality of life/living conditions = 0 If candidate just discusses Photograph C without any comparison with Photograph B, allow the marks to stand. [4] 3 (a) (i) plot for June at 17°C on the line in the centre of the correct space, (Need not be joined by a line to the plots for May and July) rainfall bar for April at 25 mm, (Accept without bar shading) [2] (ii) 10.4, low, in the hottest season, [3] (b) (i) horizontal line drawn at 250 mm and correct at both ends (need not be labelled), [1] (ii) 2001 and 2002, [1] (iii) rainfall varies a lot/some years much higher/some years much lower/very unreliable/very variable/very unpredictable/wide range/some years far from mean, Allow use of figures to make this point. Seasonal rain = 0. [1] www.theallpapers.com
Mark scheme, page 5
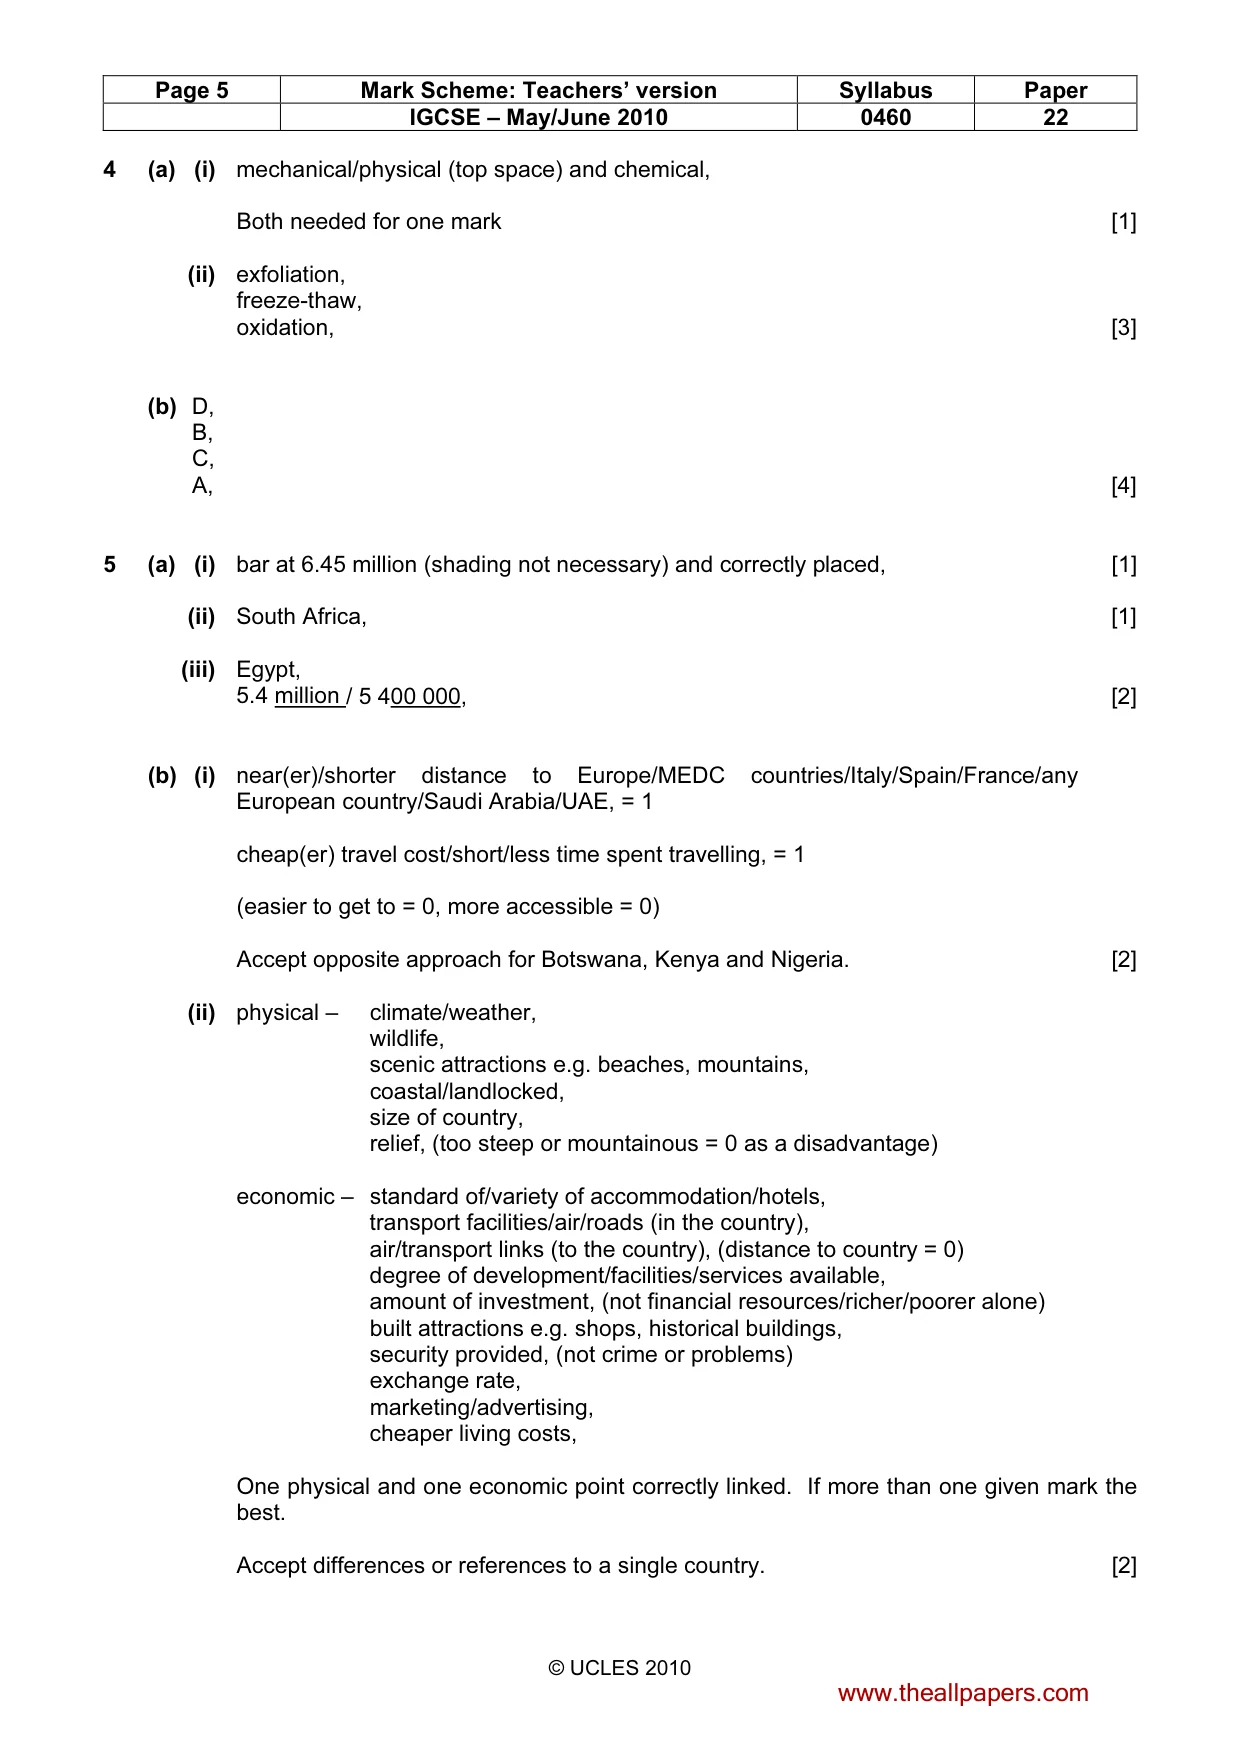
Page 5 Mark Scheme: Teachers’ version Syllabus Paper IGCSE – May/June 2010 0460 22 © UCLES 2010 4 (a) (i) mechanical/physical (top space) and chemical, Both needed for one mark [1] (ii) exfoliation, freeze-thaw, oxidation, [3] (b) D, B, C, A, [4] 5 (a) (i) bar at 6.45 million (shading not necessary) and correctly placed, [1] (ii) South Africa, [1] (iii) Egypt, 5.4 million / 5 400 000, [2] (b) (i) near(er)/shorter distance to Europe/MEDC countries/Italy/Spain/France/any European country/Saudi Arabia/UAE, = 1 cheap(er) travel cost/short/less time spent travelling, = 1 (easier to get to = 0, more accessible = 0) Accept opposite approach for Botswana, Kenya and Nigeria. [2] (ii) physical – climate/weather, wildlife, scenic attractions e.g. beaches, mountains, coastal/landlocked, size of country, relief, (too steep or mountainous = 0 as a disadvantage) economic – standard of/variety of accommodation/hotels, transport facilities/air/roads (in the country), air/transport links (to the country), (distance to country = 0) degree of development/facilities/services available, amount of investment, (not financial resources/richer/poorer alone) built attractions e.g. shops, historical buildings, security provided, (not crime or problems) exchange rate, marketing/advertising, cheaper living costs, One physical and one economic point correctly linked. If more than one given mark the best. Accept differences or references to a single country. [2] www.theallpapers.com
Mark scheme, page 6
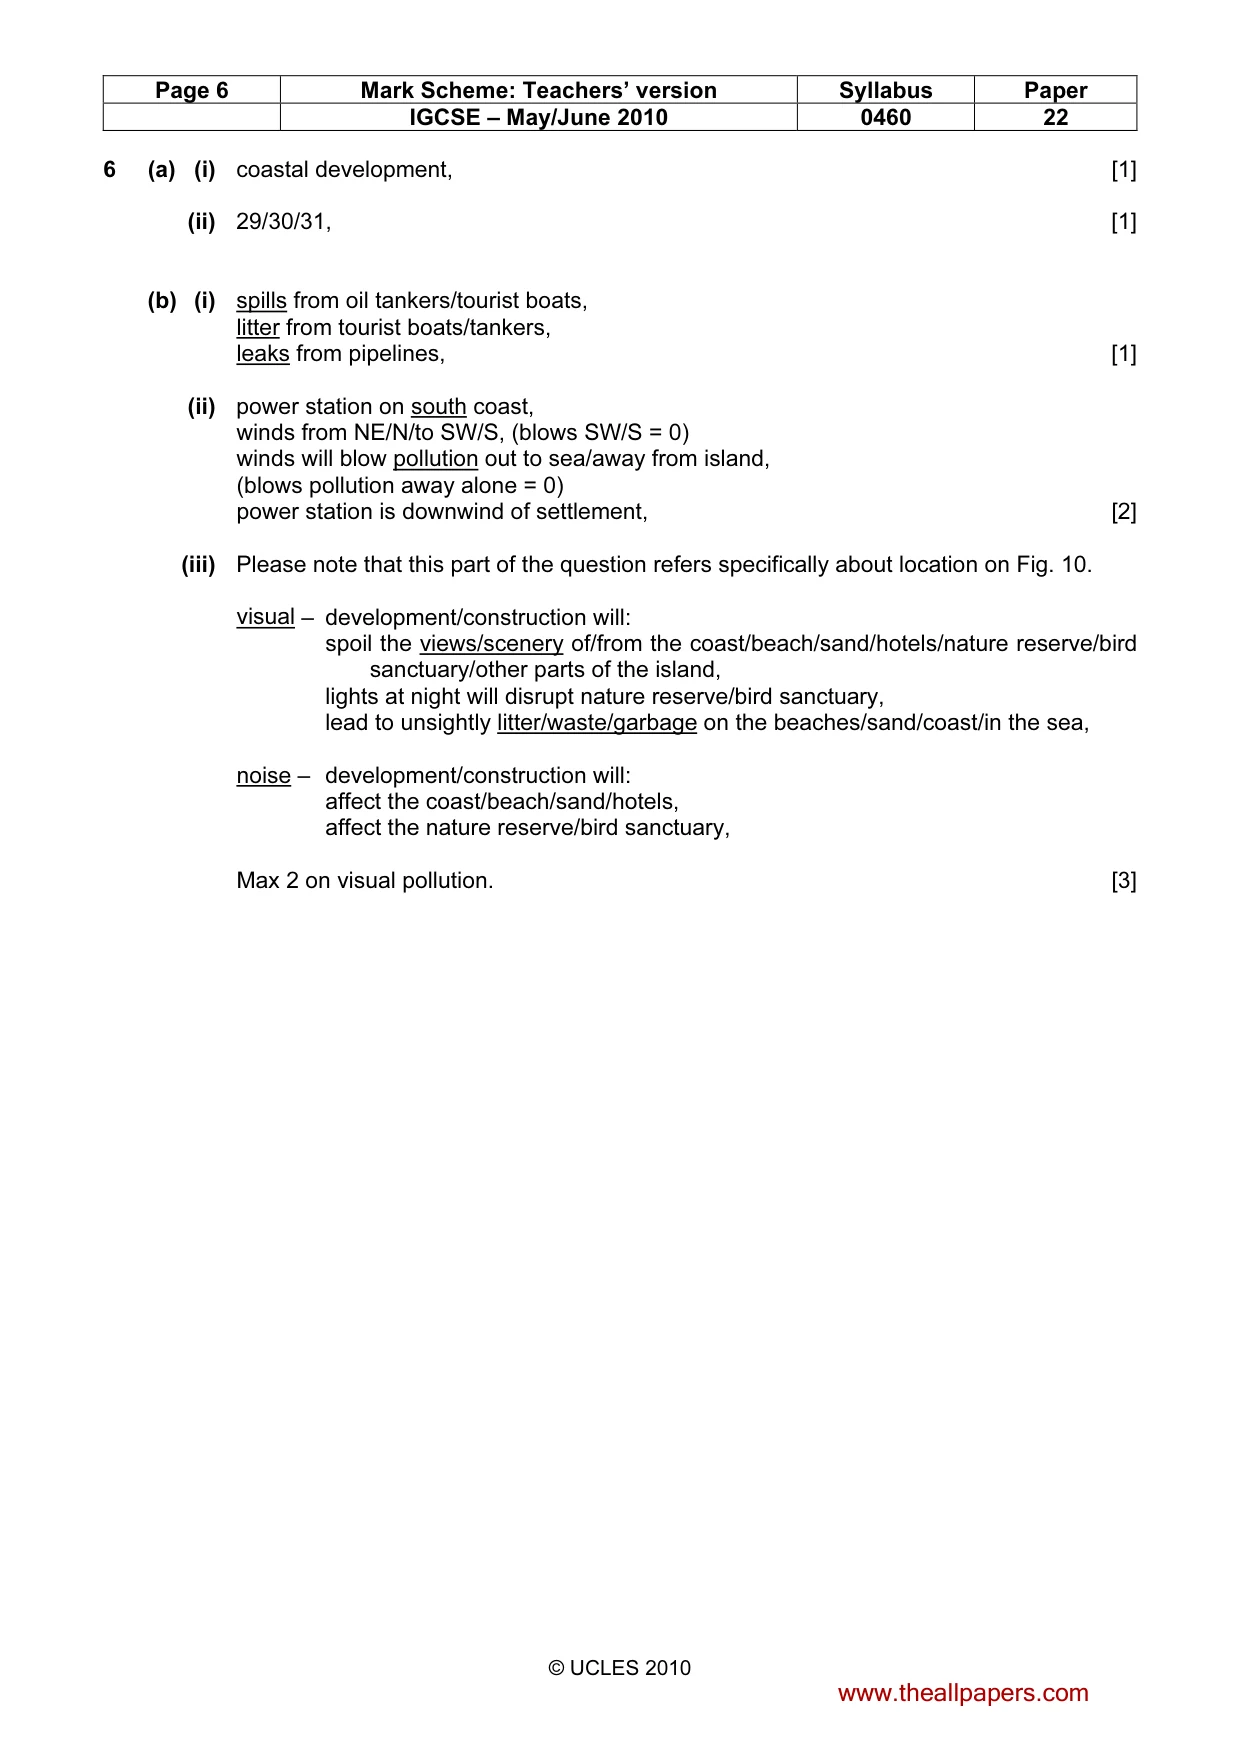
Page 6 Mark Scheme: Teachers’ version Syllabus Paper IGCSE – May/June 2010 0460 22 © UCLES 2010 6 (a) (i) coastal development, [1] (ii) 29/30/31, [1] (b) (i) spills from oil tankers/tourist boats, litter from tourist boats/tankers, leaks from pipelines, [1] (ii) power station on south coast, winds from NE/N/to SW/S, (blows SW/S = 0) winds will blow pollution out to sea/away from island, (blows pollution away alone = 0) power station is downwind of settlement, [2] (iii) Please note that this part of the question refers specifically about location on Fig. 10. visual – development/construction will: spoil the views/scenery of/from the coast/beach/sand/hotels/nature reserve/bird sanctuary/other parts of the island, lights at night will disrupt nature reserve/bird sanctuary, lead to unsightly litter/waste/garbage on the beaches/sand/coast/in the sea, noise – development/construction will: affect the coast/beach/sand/hotels, affect the nature reserve/bird sanctuary, Max 2 on visual pollution. [3] www.theallpapers.com
What you needed in this session
Cambridge’s own grade thresholds for 2010 May/June, Paper 2 · Variant 2. A higher threshold means an easier paper — the bar moves with how the cohort did.