Cambridge IGCSE Geography 0460 — 2010 May/June Paper 2 · Variant 1
0460/21/M/J/10 · 60 marks · ≈68 min
The question paper and its mark scheme, free to read here and free to download. This is Cambridge’s own paper, exactly as it was sat.
Question paper16 pages
Mark scheme5 pages
Answers below. Sit the paper first if you are practising.
Paper as text
Question paper, page 1
This document consists of 15 printed pages, 1 blank page and 1 Insert. DC (DR/DR) 11616/6 © UCLES 2010 [Turn over UNIVERSITY OF CAMBRIDGE INTERNATIONAL EXAMINATIONS International General Certificate of Secondary Education READ THESE INSTRUCTIONS FIRST Write your Centre number, candidate number and name in the spaces provided. Write in dark blue or black pen. You may use a soft pencil for any diagrams, graphs or rough working. Do not use staples, paper clips, highlighters, glue or correction fluid. DO NOT WRITE IN ANY BARCODES. Answer all questions. The Insert contains Photographs A and B for Question 4. Sketch maps and diagrams should be drawn whenever they serve to illustrate an answer. The Survey Map Extract and the Insert are not required by the Examiner. At the end of the examination, fasten all your work securely together. The number of marks is given in brackets [ ] at the end of each question or part question. GEOGRAPHY 0460/21 Paper 2 May/June 2010 1 hour 30 minutes Candidates answer on the Question Paper. Additional Materials: Ruler Protractor Plain paper 1:50 000 Survey Map Extract is enclosed with this question paper. * 3 3 0 4 7 9 9 8 3 1 * www.theallpapers.com
Question paper, page 2
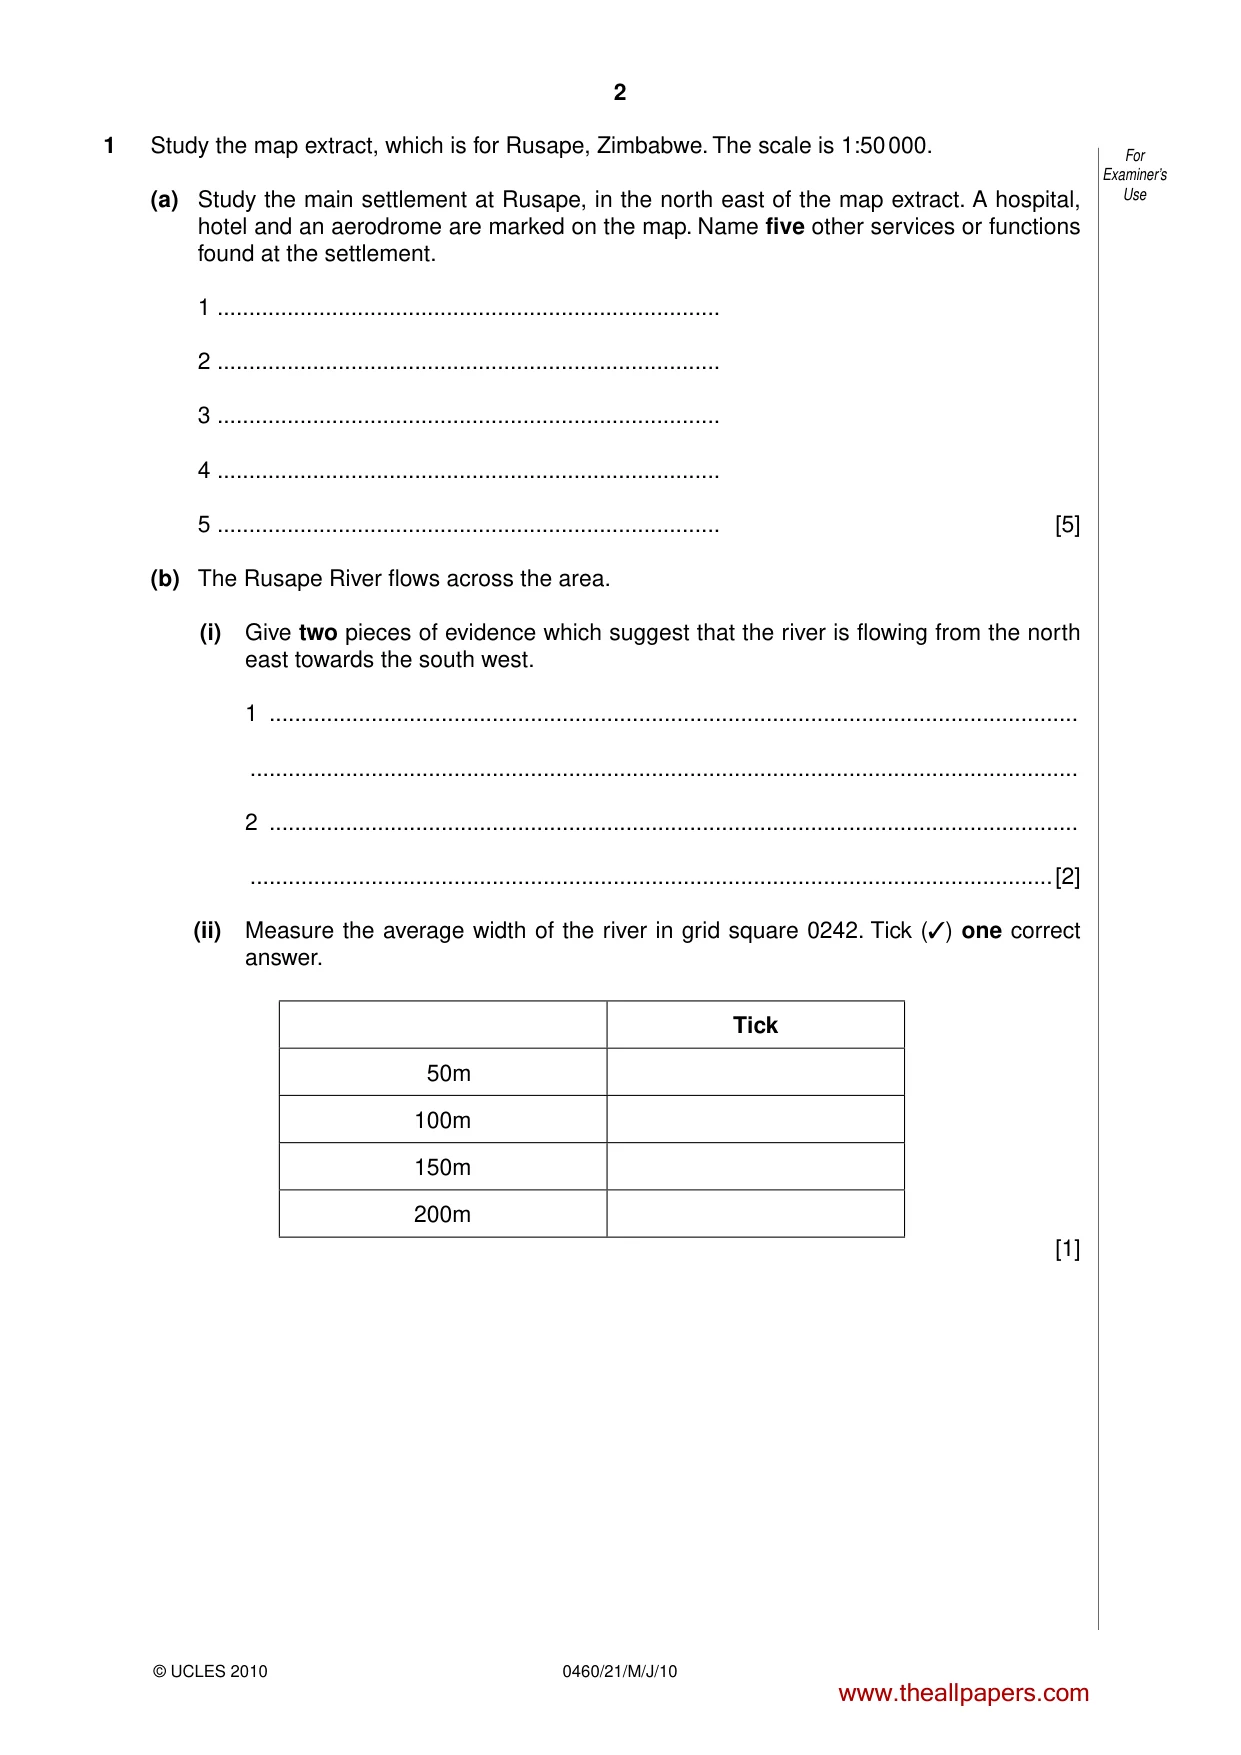
2 0460/21/M/J/10 For Examiner’s Use © UCLES 2010 1 Study the map extract, which is for Rusape, Zimbabwe. The scale is 1:50 000. (a) Study the main settlement at Rusape, in the north east of the map extract. A hospital, hotel and an aerodrome are marked on the map. Name five other services or functions found at the settlement. 1 … 2 … 3 … 4 … 5 … [5] (b) The Rusape River flows across the area. (i) Give two pieces of evidence which suggest that the river is flowing from the north east towards the south west. 1 … … 2 … …[2] (ii) Measure the average width of the river in grid square 0242. Tick (✓) one correct answer. Tick 50m 100m 150m 200m [1] www.theallpapers.com
Question paper, page 3
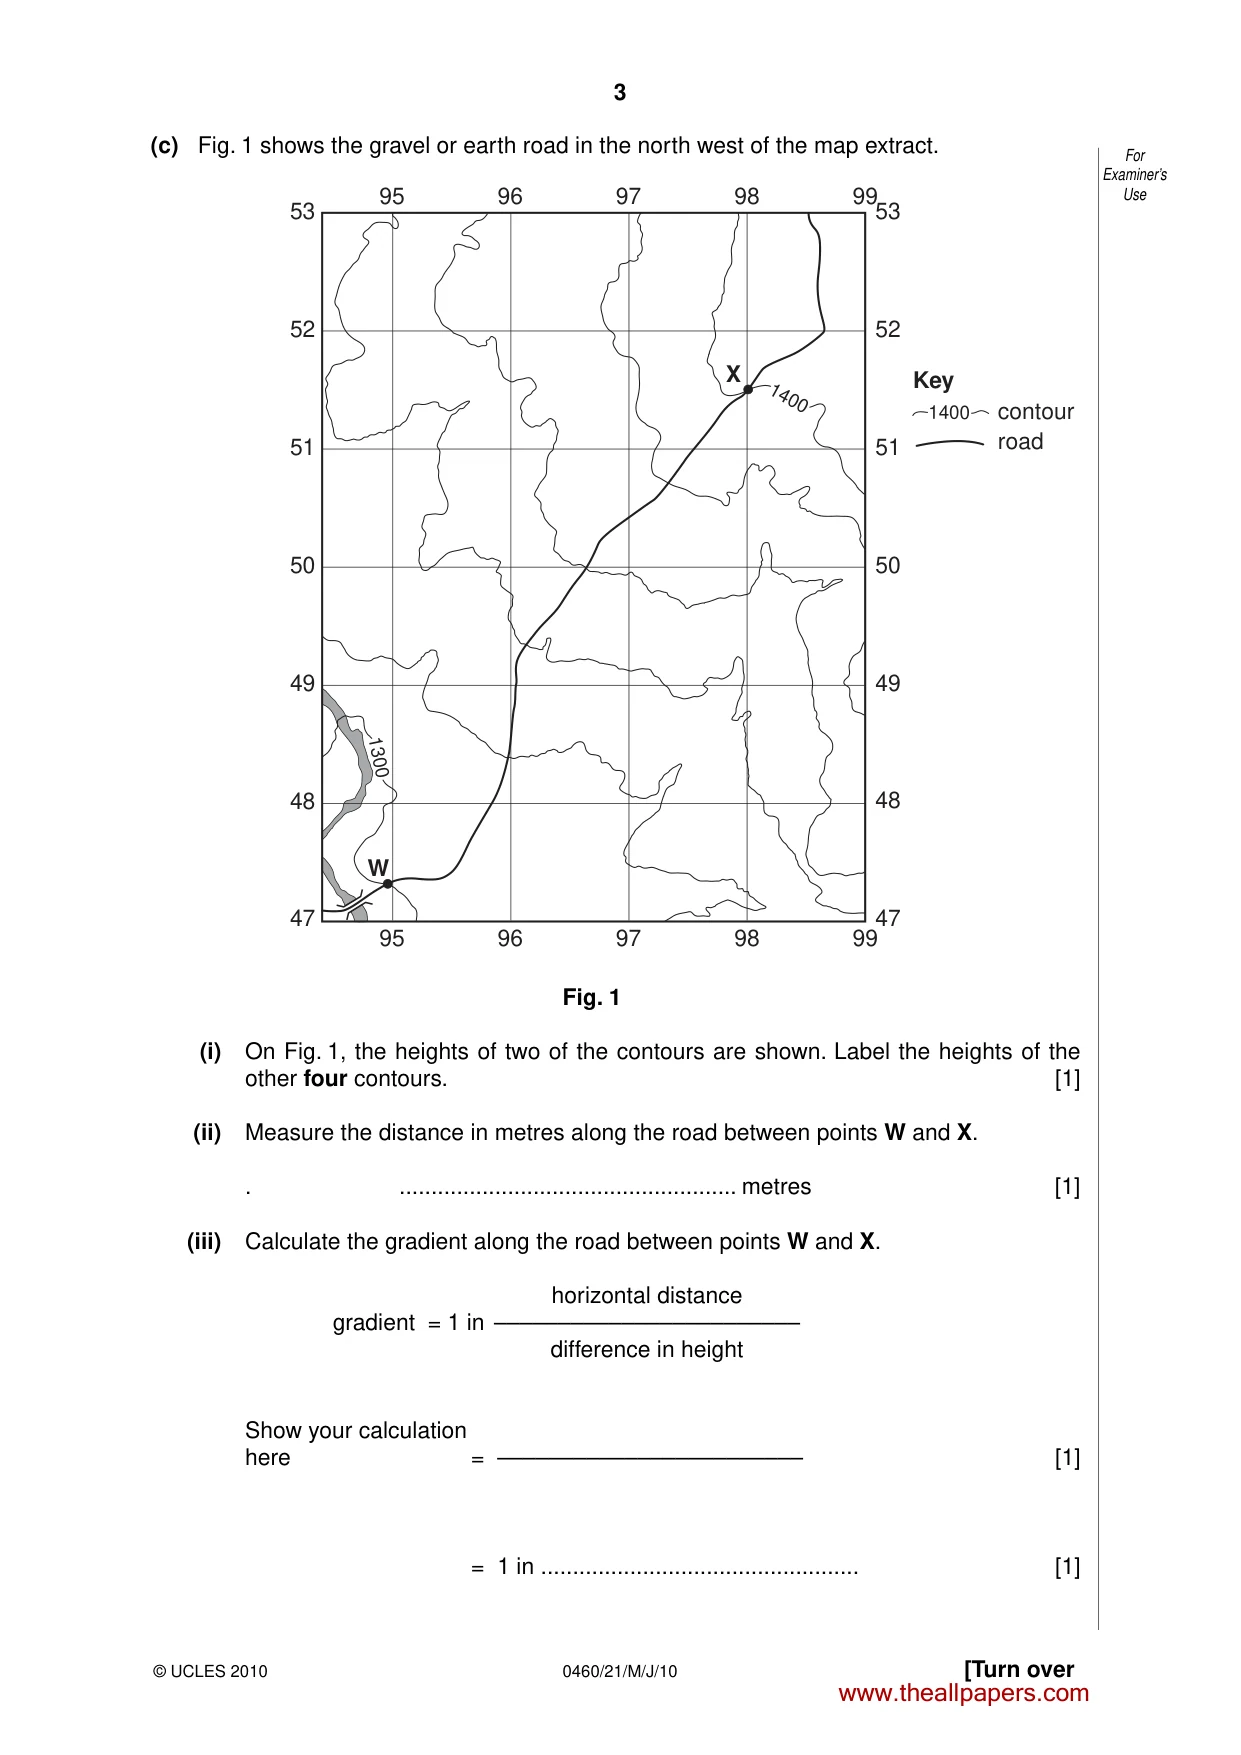
3 0460/21/M/J/10 [Turn over For Examiner’s Use © UCLES 2010 (c) Fig. 1 shows the gravel or earth road in the north west of the map extract. X W 1300 1400 Key 1400 contour road 99 98 97 96 95 99 98 97 96 95 53 52 51 50 49 48 47 53 52 51 50 49 48 47 Fig. 1 (i) On Fig. 1, the heights of two of the contours are shown. Label the heights of the other four contours. [1] (ii) Measure the distance in metres along the road between points W and X. . … metres [1] (iii) Calculate the gradient along the road between points W and X. horizontal distance gradient = 1 in –––––––––––––––––––––––– difference in height Show your calculation here = –––––––––––––––––––––––– [1] = 1 in … [1] www.theallpapers.com
Question paper, page 4
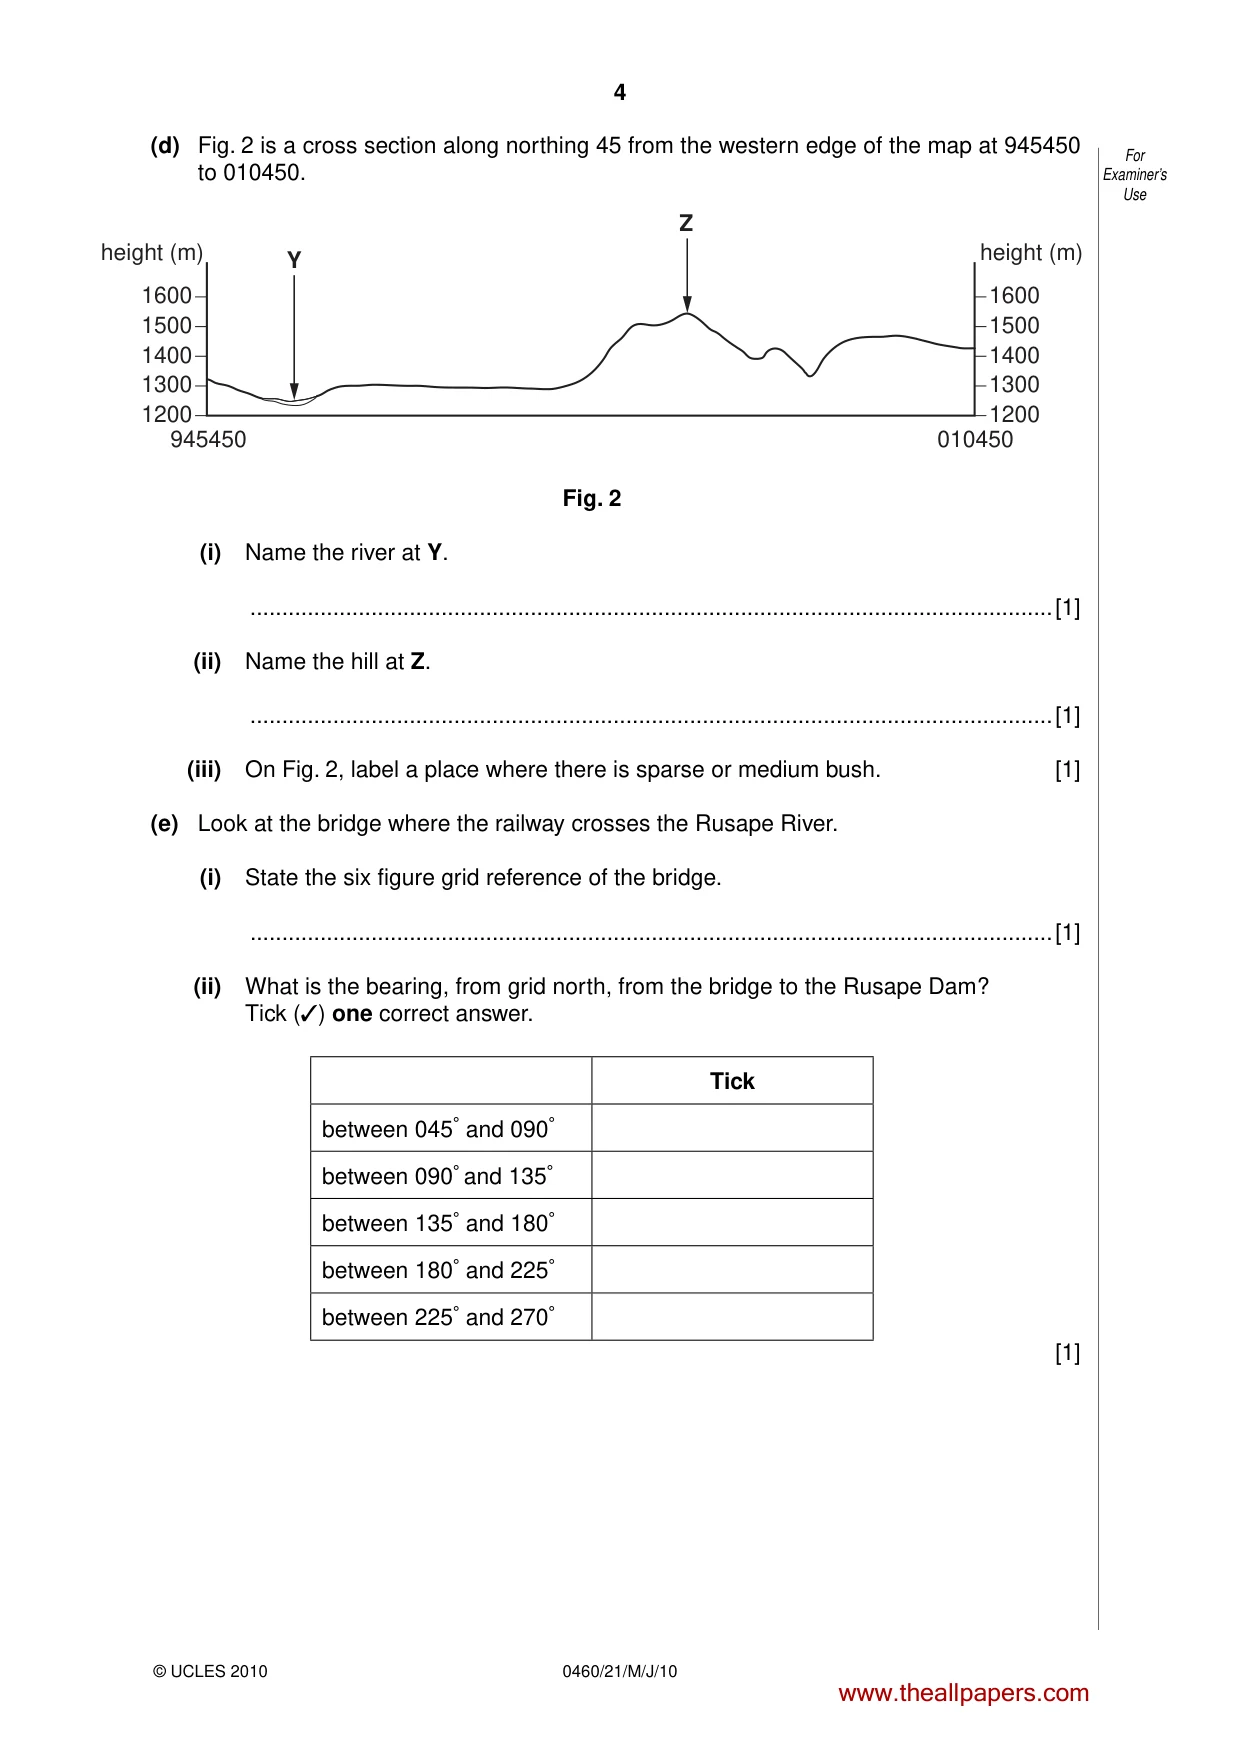
4 0460/21/M/J/10 For Examiner’s Use © UCLES 2010 (d) Fig. 2 is a cross section along northing 45 from the western edge of the map at 945450 to 010450. 1200 1300 1400 1500 1600 945450 1200 1300 1400 1500 1600 010450 Y Z height (m) height (m) Fig. 2 (i) Name the river at Y. …[1] (ii) Name the hill at Z. …[1] (iii) On Fig. 2, label a place where there is sparse or medium bush. [1] (e) Look at the bridge where the railway crosses the Rusape River. (i) State the six figure grid reference of the bridge. …[1] (ii) What is the bearing, from grid north, from the bridge to the Rusape Dam? Tick (✓) one correct answer. Tick between 045° and 090° between 090° and 135° between 135° and 180° between 180° and 225° between 225° and 270° [1] www.theallpapers.com
Question paper, page 5
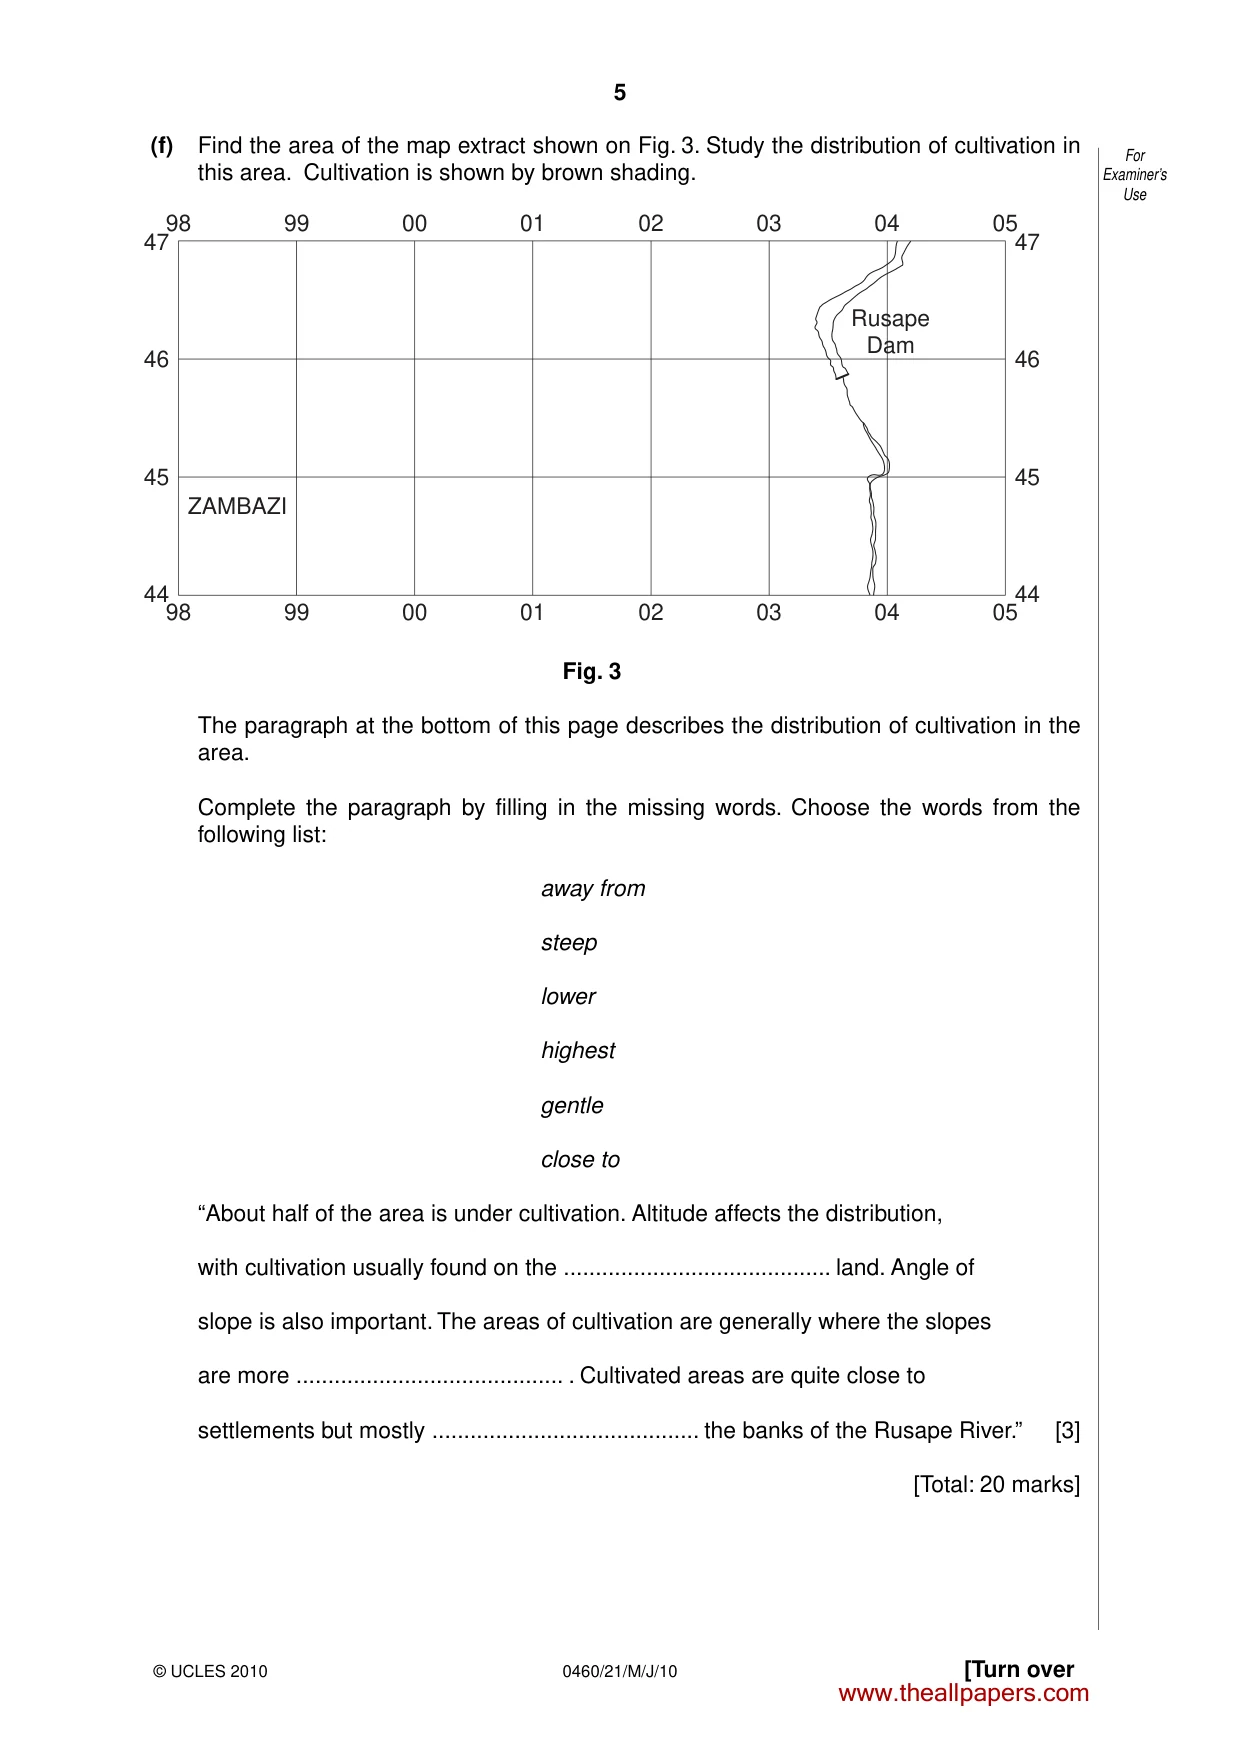
5 0460/21/M/J/10 [Turn over For Examiner’s Use © UCLES 2010 (f) Find the area of the map extract shown on Fig. 3. Study the distribution of cultivation in this area. Cultivation is shown by brown shading. Rusape Dam ZAMBAZI 98 99 00 01 02 03 04 05 98 99 00 01 02 03 04 05 47 46 45 44 47 46 45 44 Fig. 3 The paragraph at the bottom of this page describes the distribution of cultivation in the area. Complete the paragraph by filling in the missing words. Choose the words from the following list: away from steep lower highest gentle close to “About half of the area is under cultivation. Altitude affects the distribution, with cultivation usually found on the … land. Angle of slope is also important. The areas of cultivation are generally where the slopes are more … . Cultivated areas are quite close to settlements but mostly … the banks of the Rusape River.” [3] [Total: 20 marks] www.theallpapers.com
Question paper, page 6
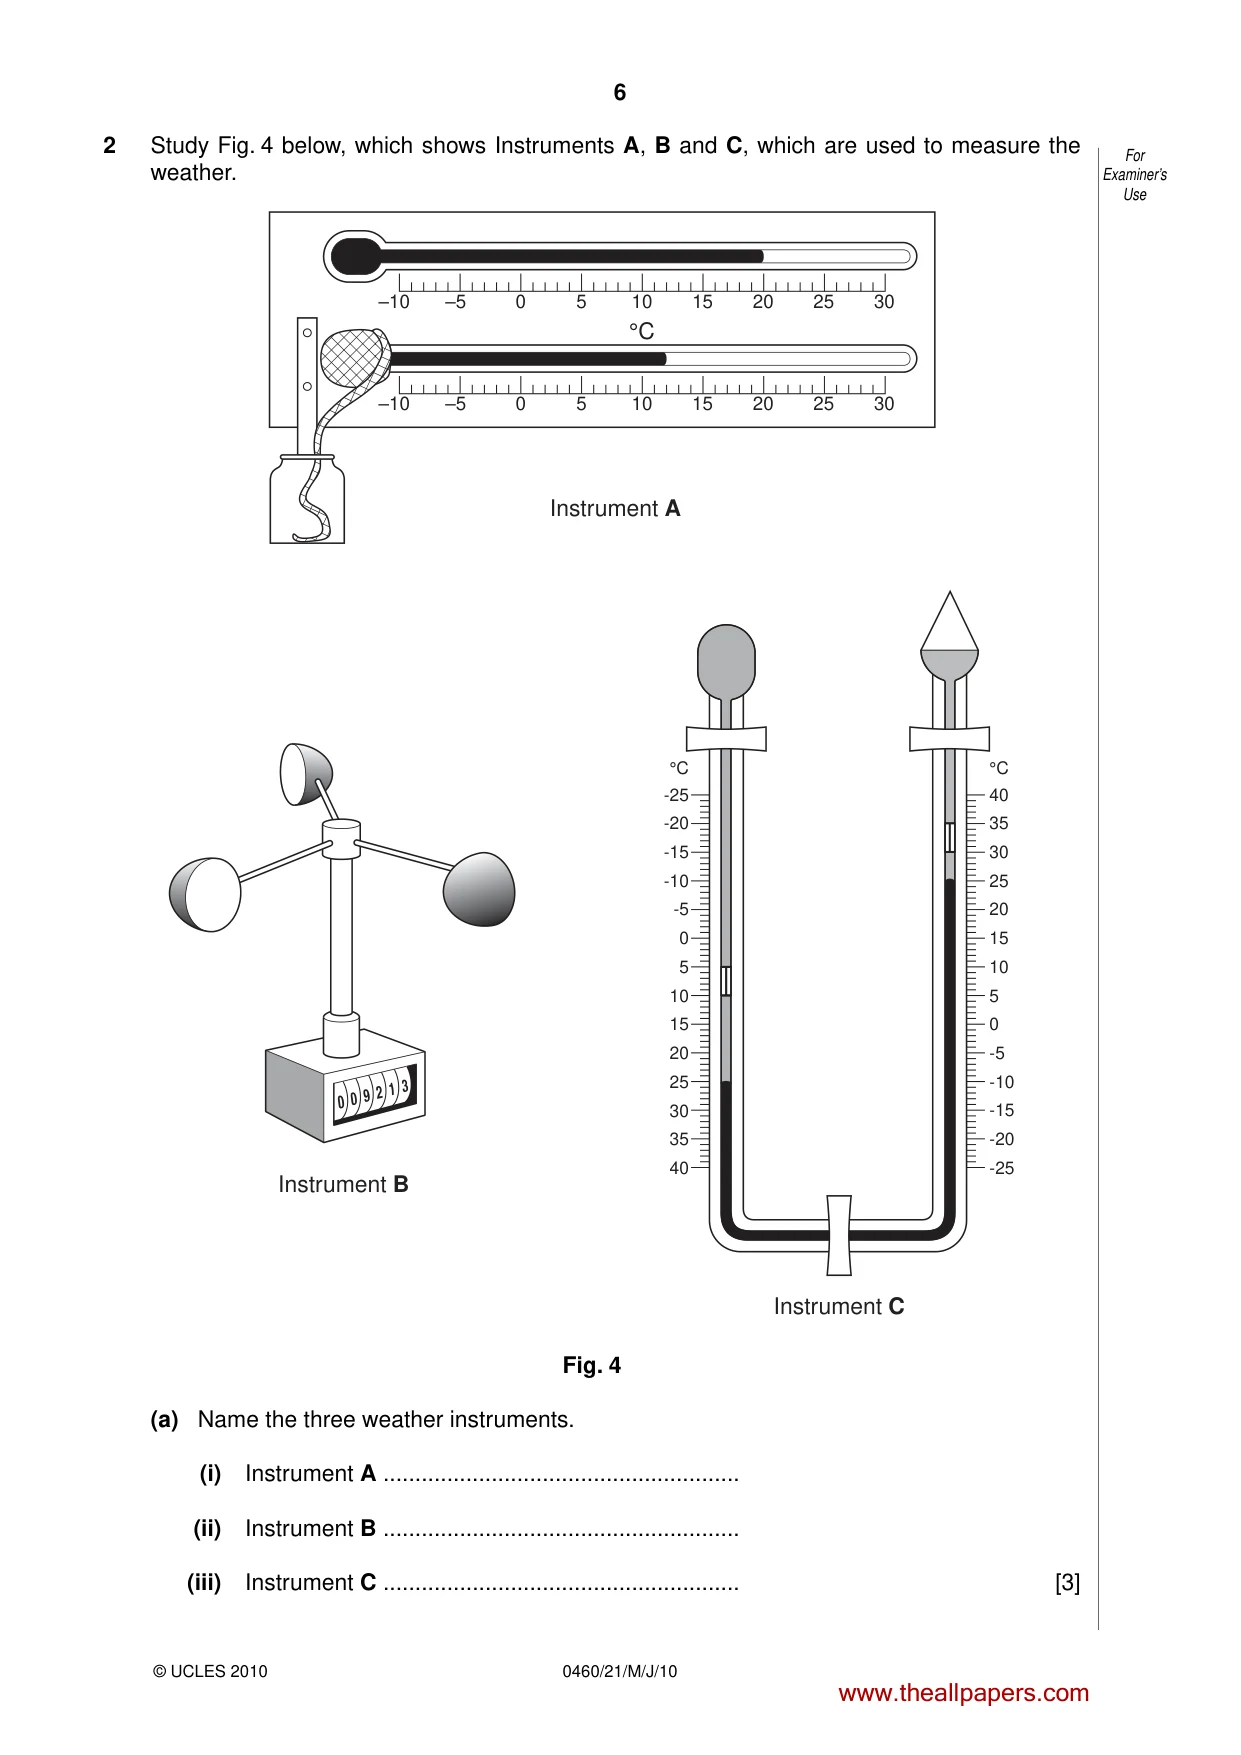
6 0460/21/M/J/10 For Examiner’s Use © UCLES 2010 2 Study Fig. 4 below, which shows Instruments A, B and C, which are used to measure the weather. °C -25 -20 -15 -10 -5 0 5 10 15 20 25 30 35 40 °C 40 35 30 25 20 15 10 5 0 -5 -10 -15 -20 -25 Instrument A Instrument B Instrument C –10 –5 0 5 10 °C 15 20 25 30 –10 –5 0 5 10 15 20 25 30 Fig. 4 (a) Name the three weather instruments. (i) Instrument A … (ii) Instrument B … (iii) Instrument C … [3] www.theallpapers.com
Question paper, page 7
7 0460/21/M/J/10 [Turn over For Examiner’s Use © UCLES 2010 (b) On the diagram for Instrument C, use labelled arrows to show: (i) mercury; (ii) alcohol. [2] (c) Using the information shown on Instrument C, state: (i) the present temperature; … [1] (ii) the maximum temperature since the instrument was re-set; … [1] (iii) the minimum temperature since the instrument was re-set. … [1] [Total: 8 marks] www.theallpapers.com
Question paper, page 8
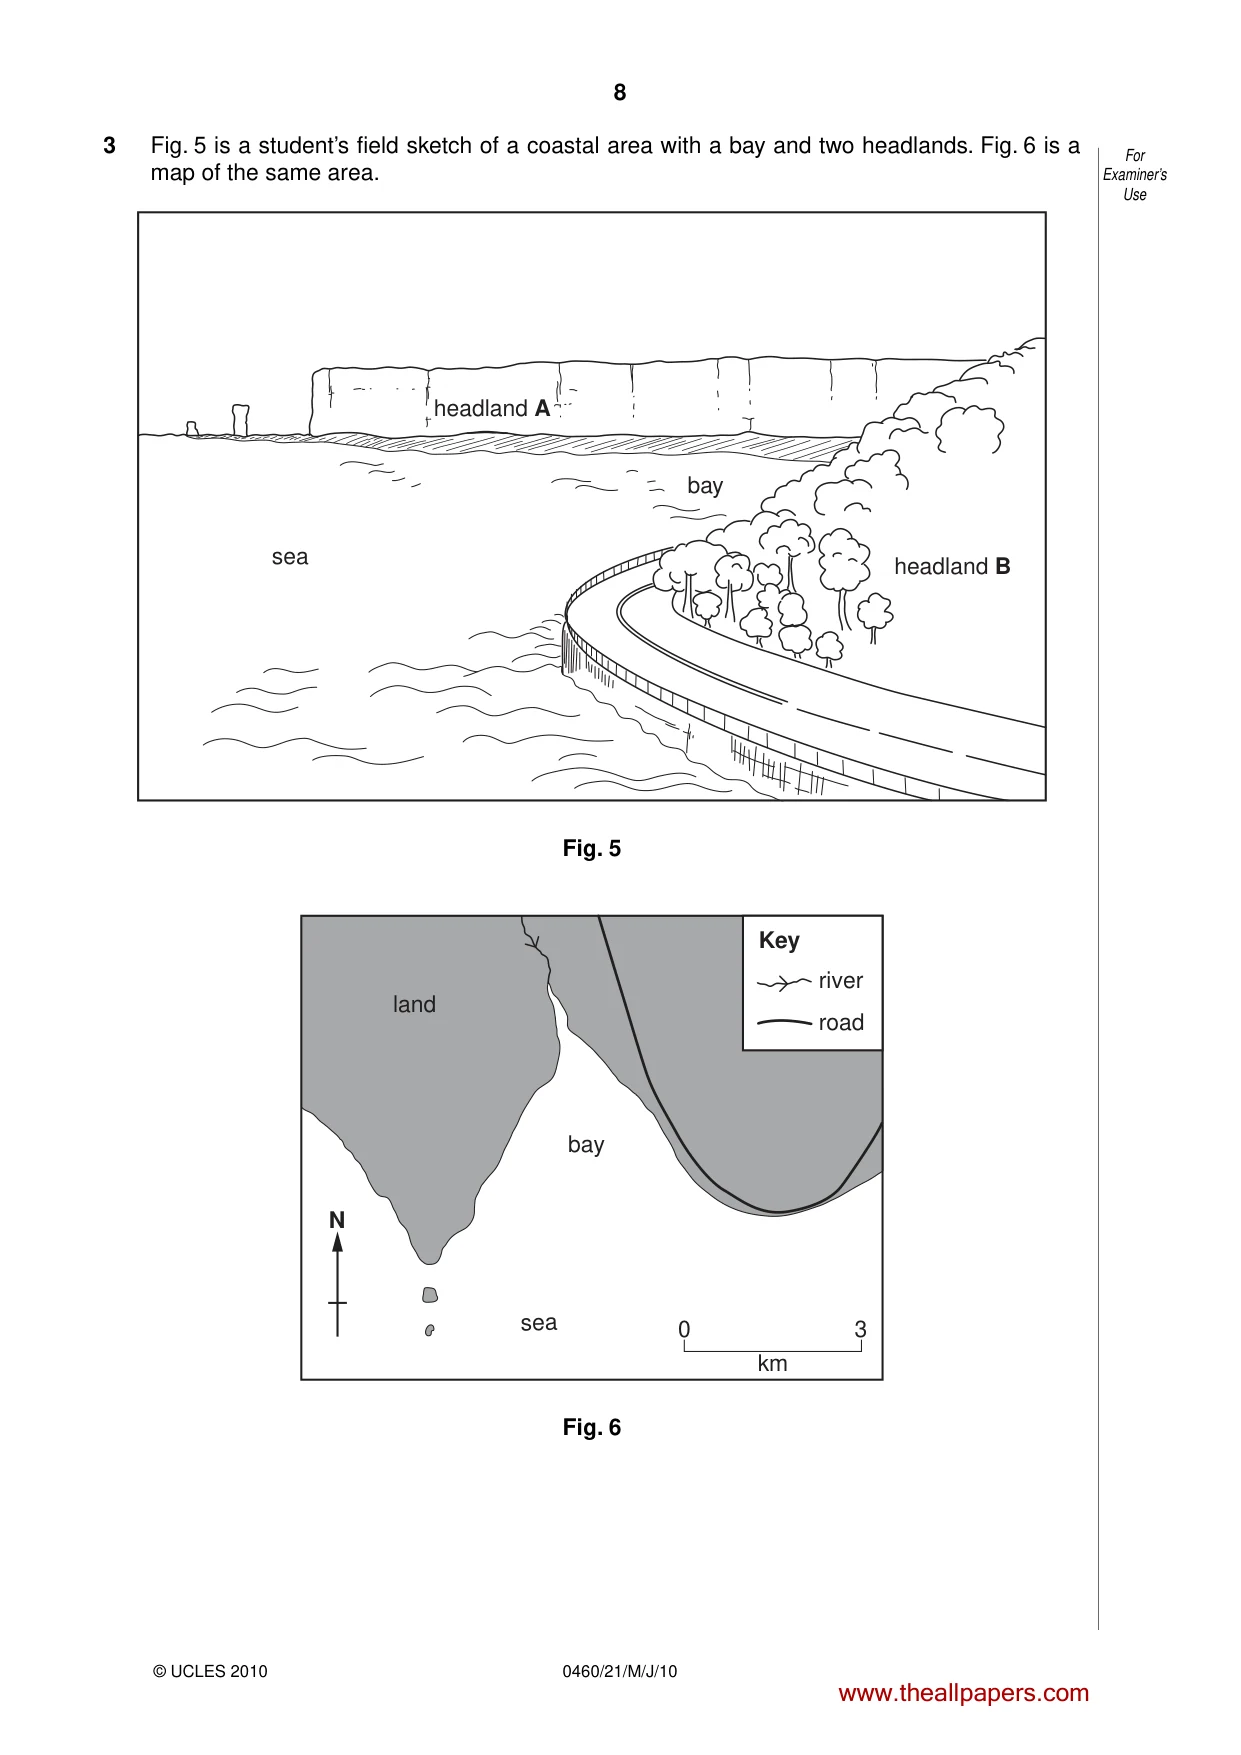
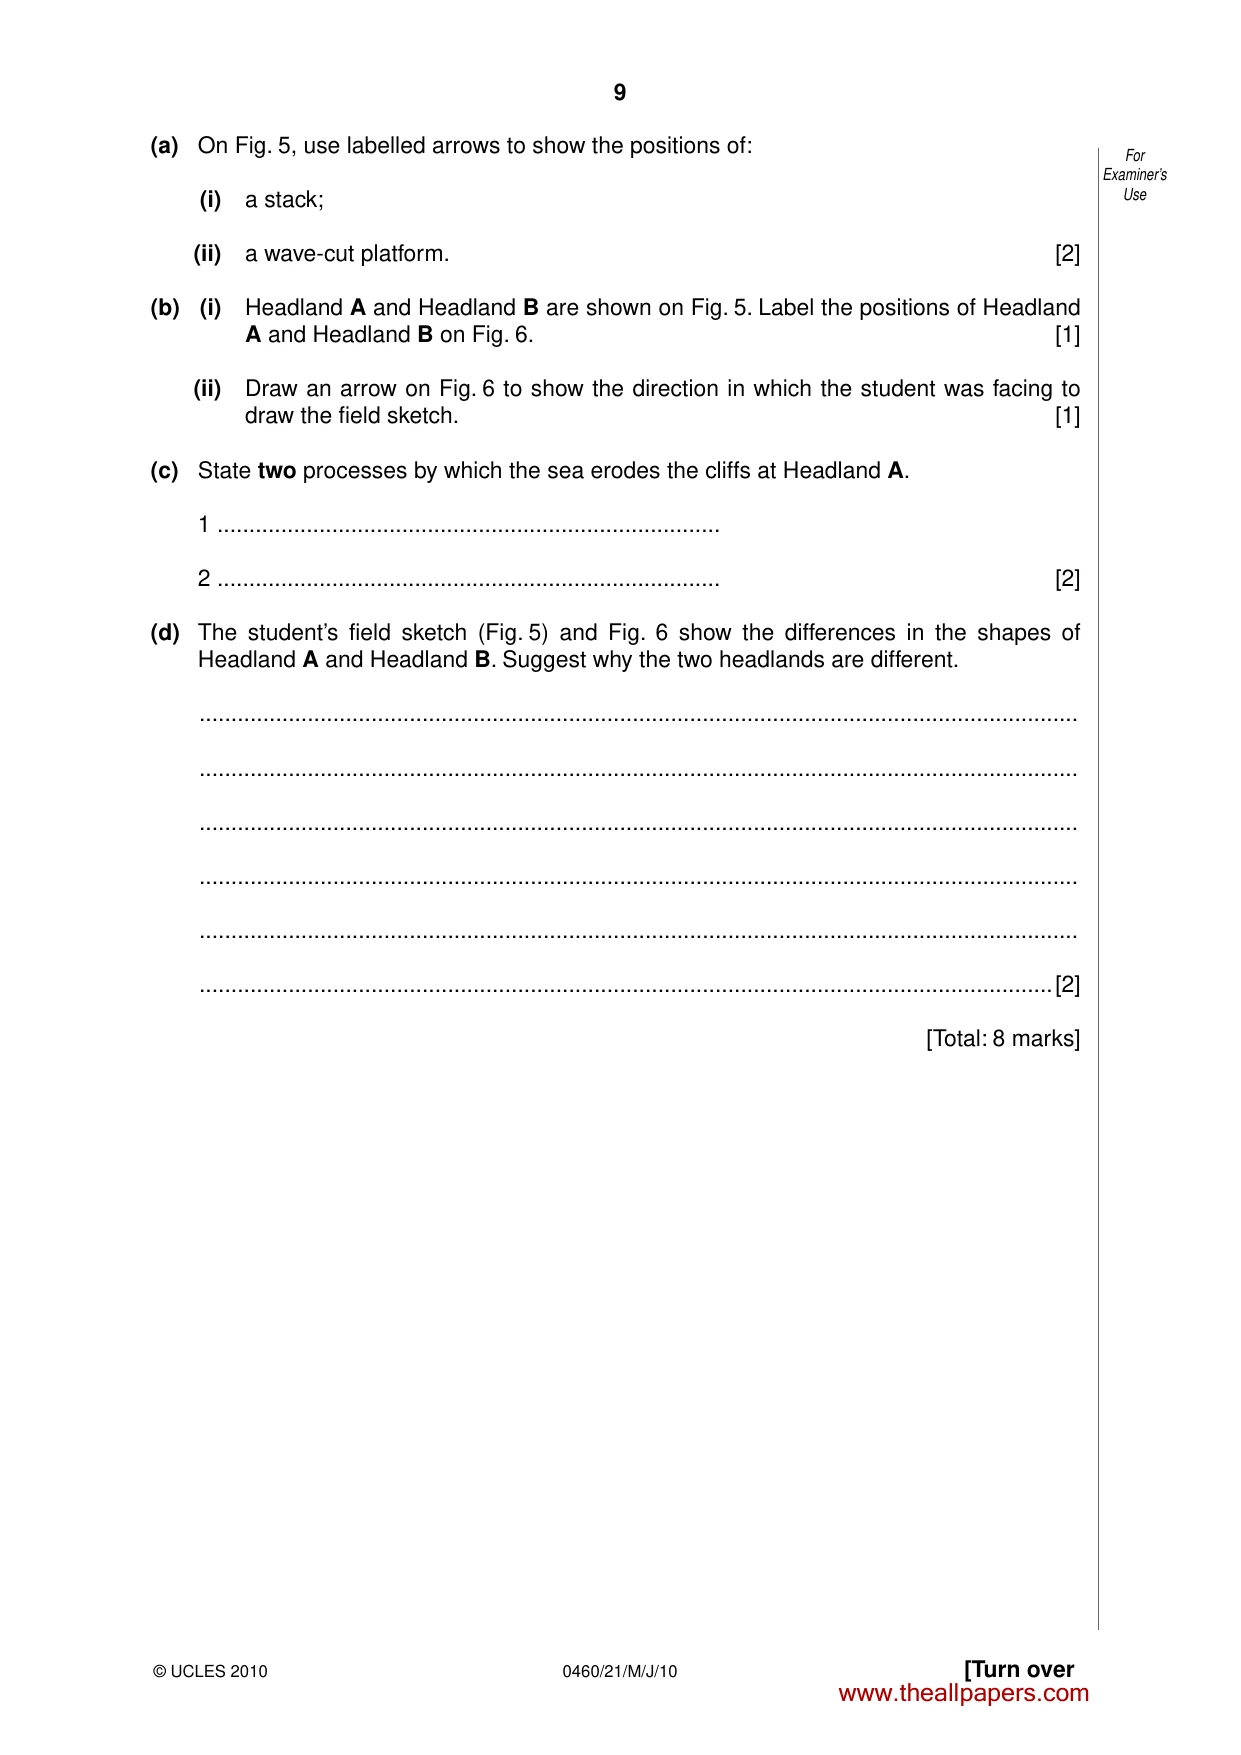
8 0460/21/M/J/10 For Examiner’s Use © UCLES 2010 3 Fig. 5 is a student’s field sketch of a coastal area with a bay and two headlands. Fig. 6 is a map of the same area. headland A headland B bay sea Fig. 5 land bay sea 0 3 km N Key river road Fig. 6 www.theallpapers.com
Question paper, page 9
9 0460/21/M/J/10 [Turn over For Examiner’s Use © UCLES 2010 (a) On Fig. 5, use labelled arrows to show the positions of: (i) a stack; (ii) a wave-cut platform. [2] (b) (i) Headland A and Headland B are shown on Fig. 5. Label the positions of Headland A and Headland B on Fig. 6. [1] (ii) Draw an arrow on Fig. 6 to show the direction in which the student was facing to draw the field sketch. [1] (c) State two processes by which the sea erodes the cliffs at Headland A. 1 … 2 … [2] (d) The student’s field sketch (Fig. 5) and Fig. 6 show the differences in the shapes of Headland A and Headland B. Suggest why the two headlands are different. … … … … … …[2] [Total: 8 marks] www.theallpapers.com
Question paper, page 10
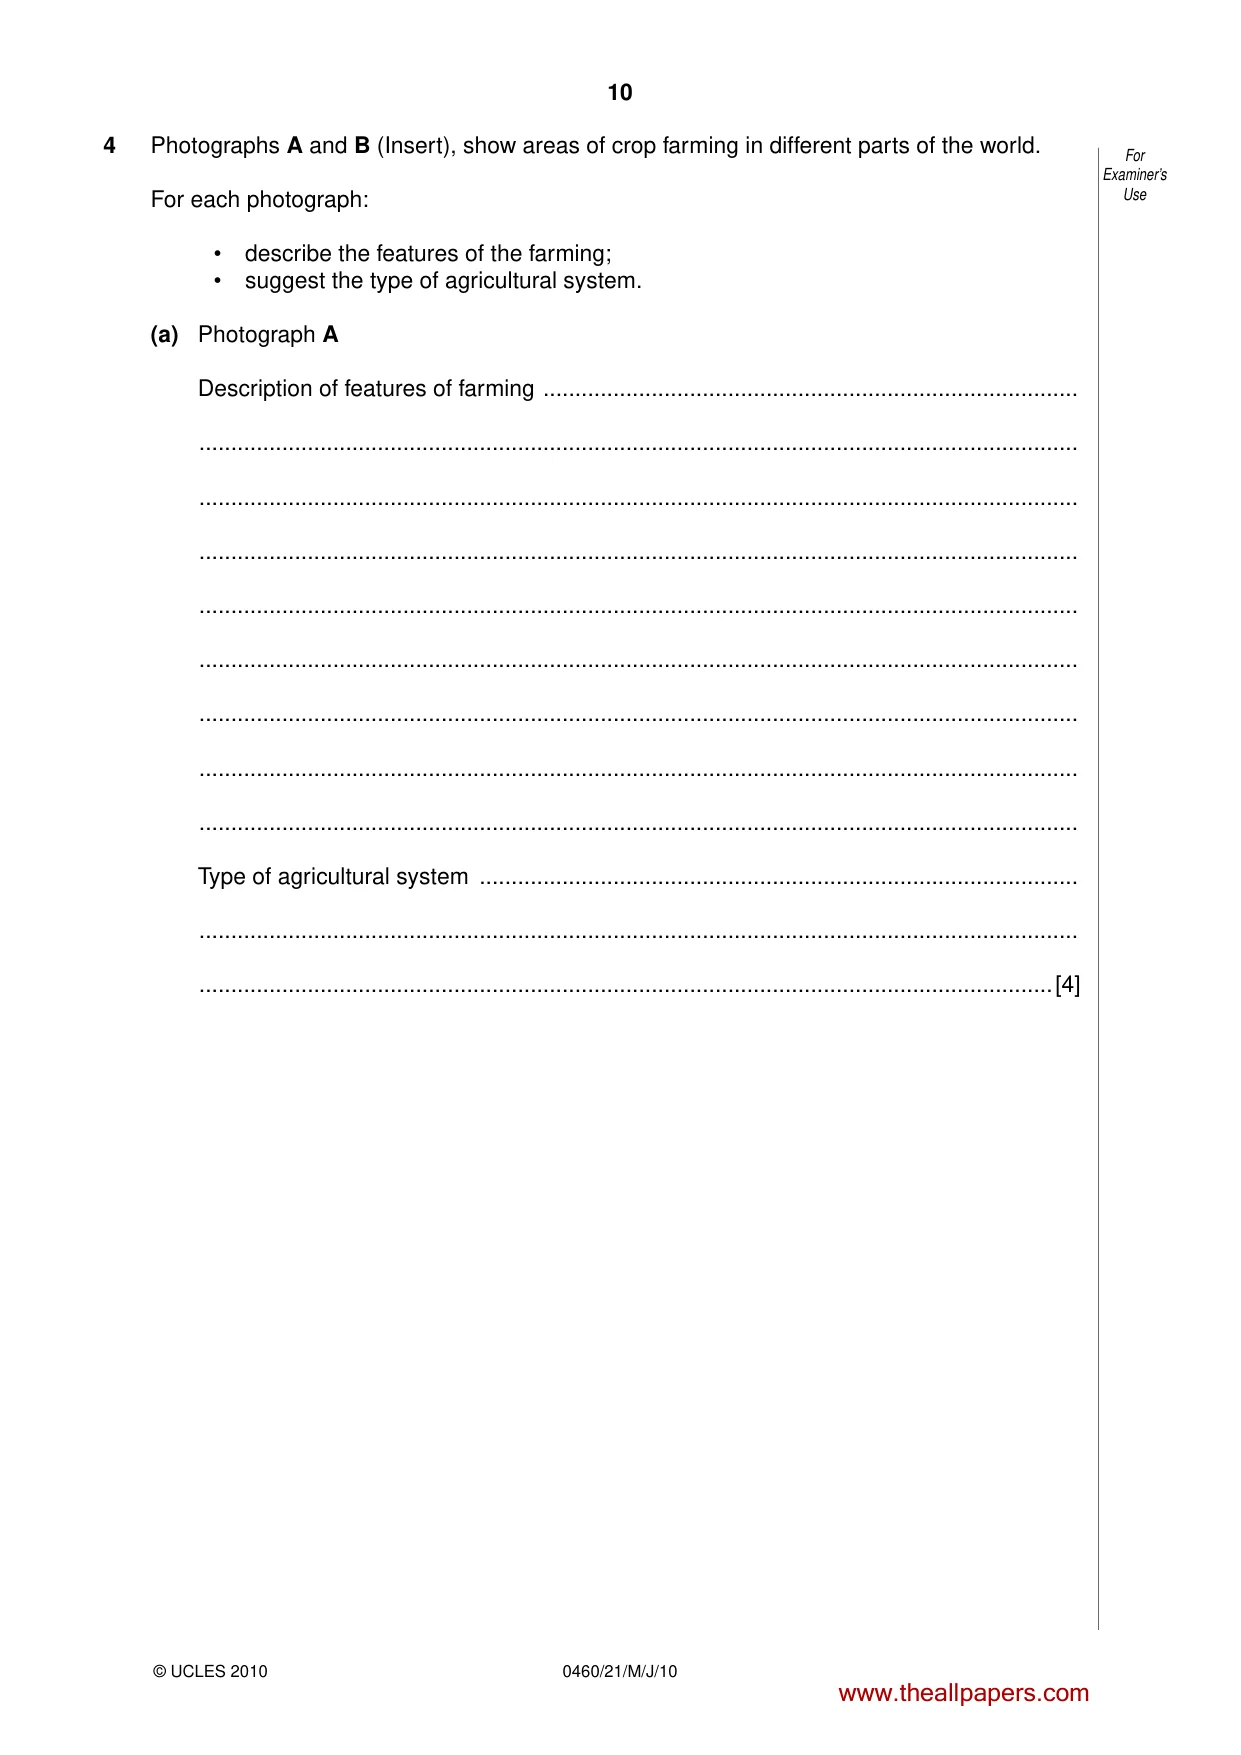
10 0460/21/M/J/10 For Examiner’s Use © UCLES 2010 4 Photographs A and B (Insert), show areas of crop farming in different parts of the world. For each photograph: • describe the features of the farming; • suggest the type of agricultural system. (a) Photograph A Description of features of farming … … … … … … … … … Type of agricultural system … … …[4] www.theallpapers.com
Question paper, page 11
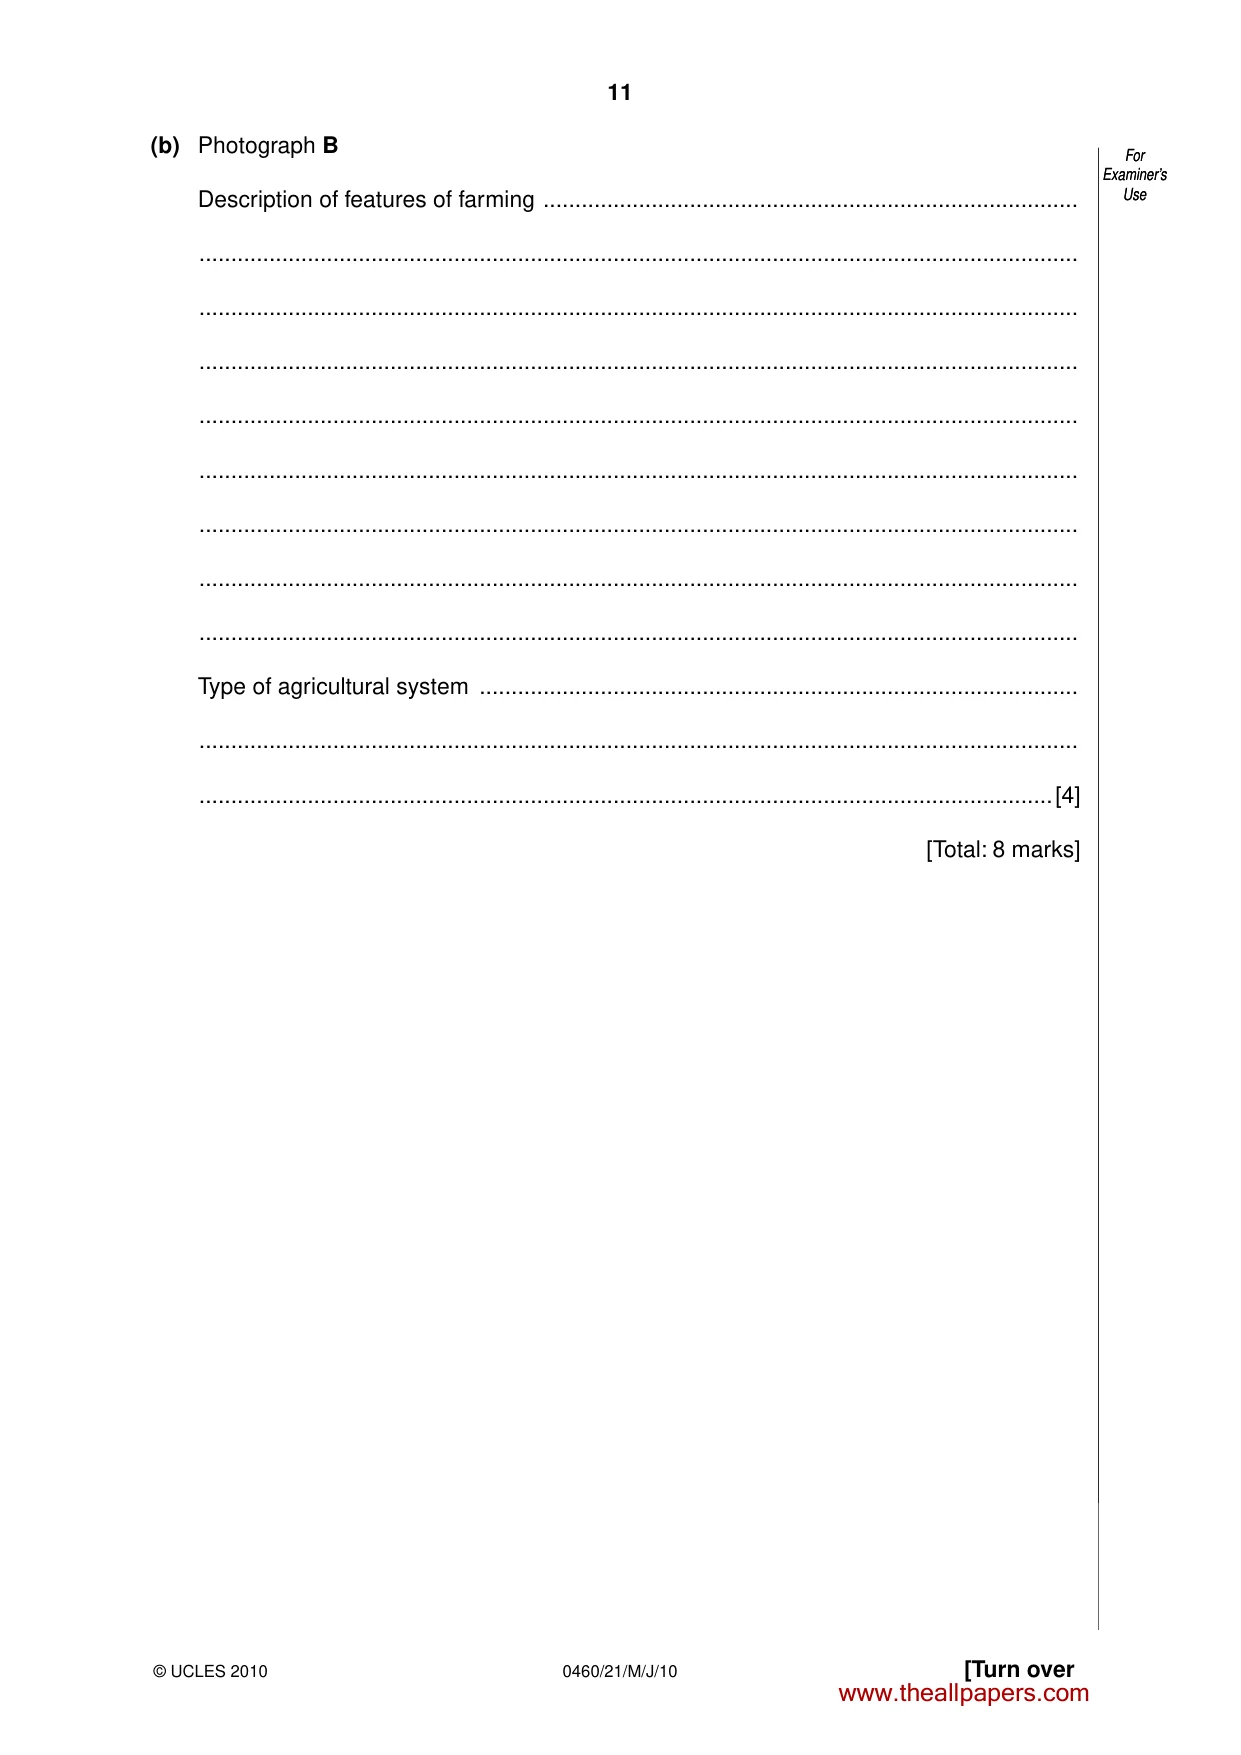
11 0460/21/M/J/10 [Turn over For Examiner’s Use © UCLES 2010 (b) Photograph B Description of features of farming … … … … … … … … … Type of agricultural system … … …[4] [Total: 8 marks] For Examiner’s Use www.theallpapers.com
Question paper, page 12
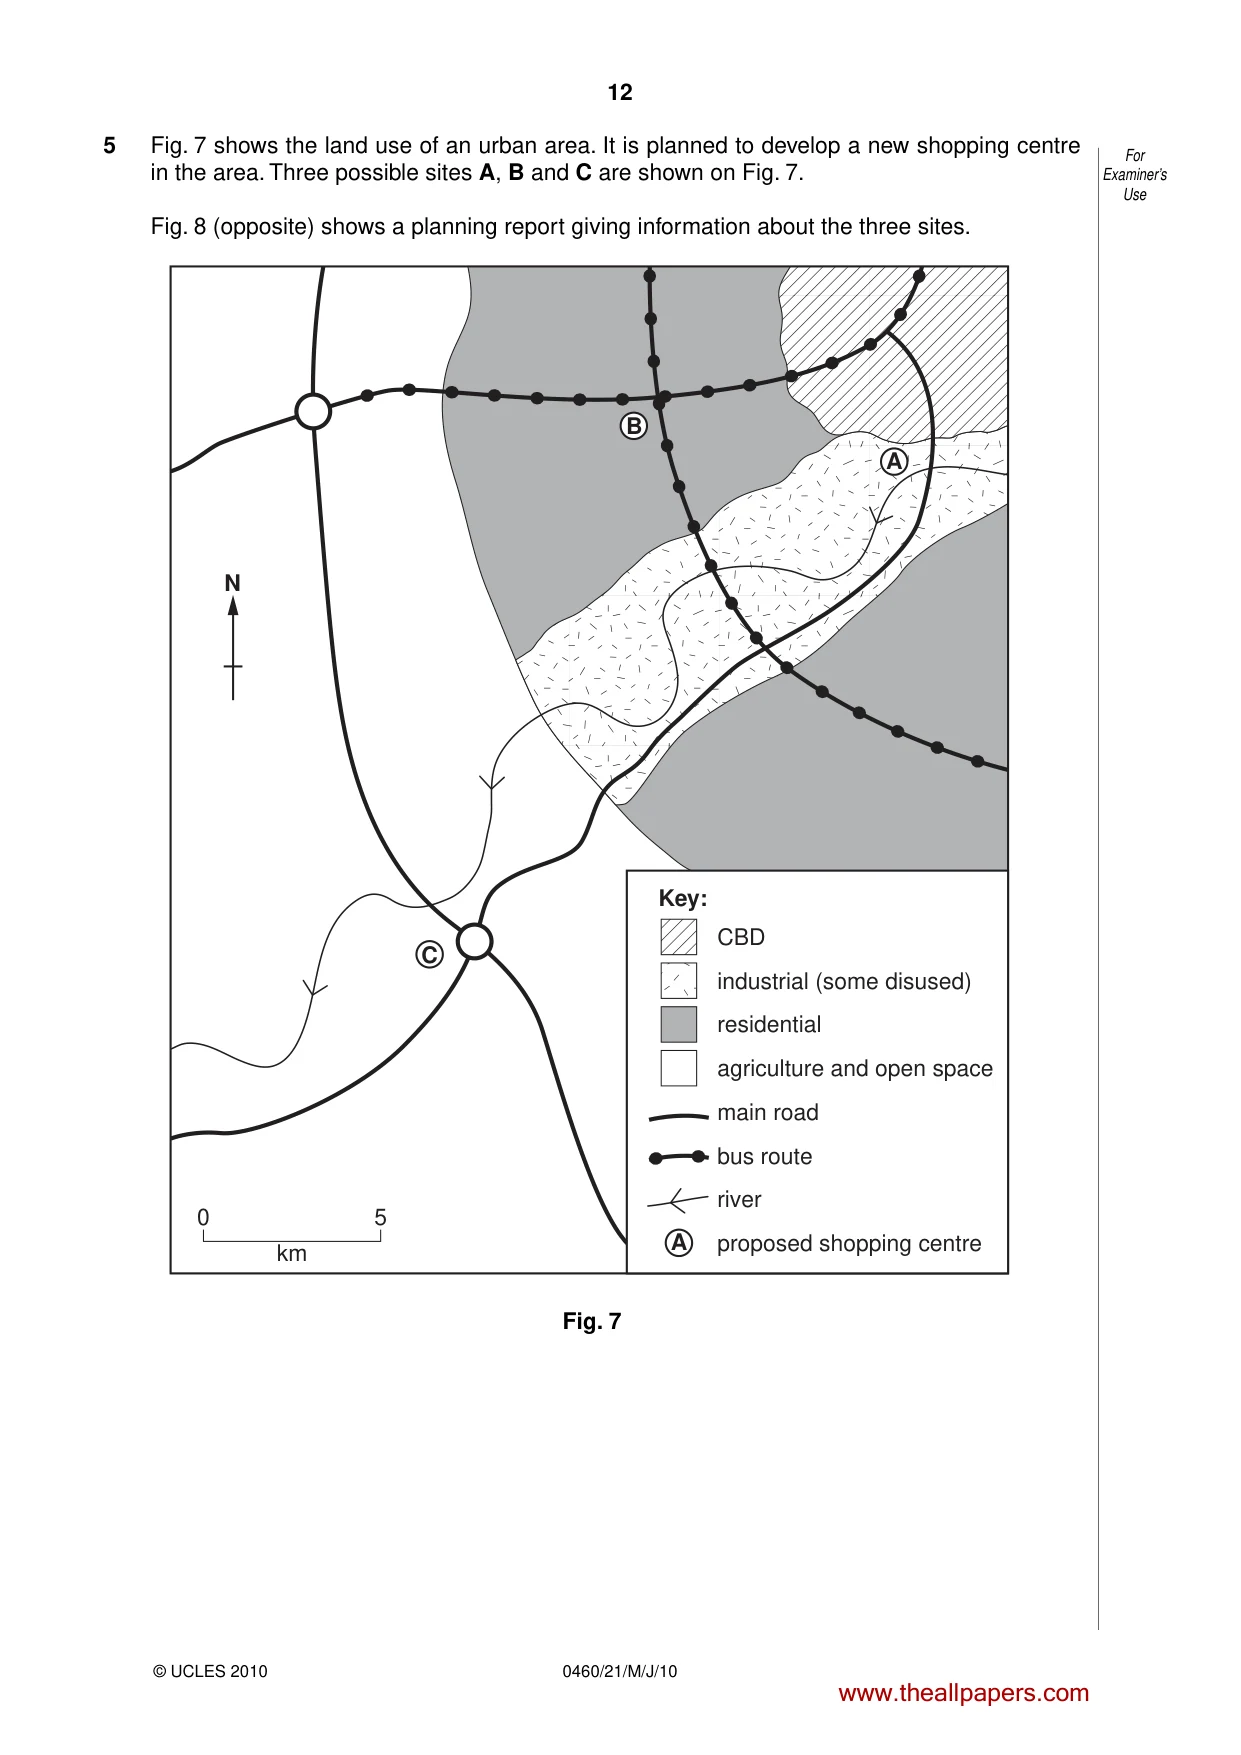
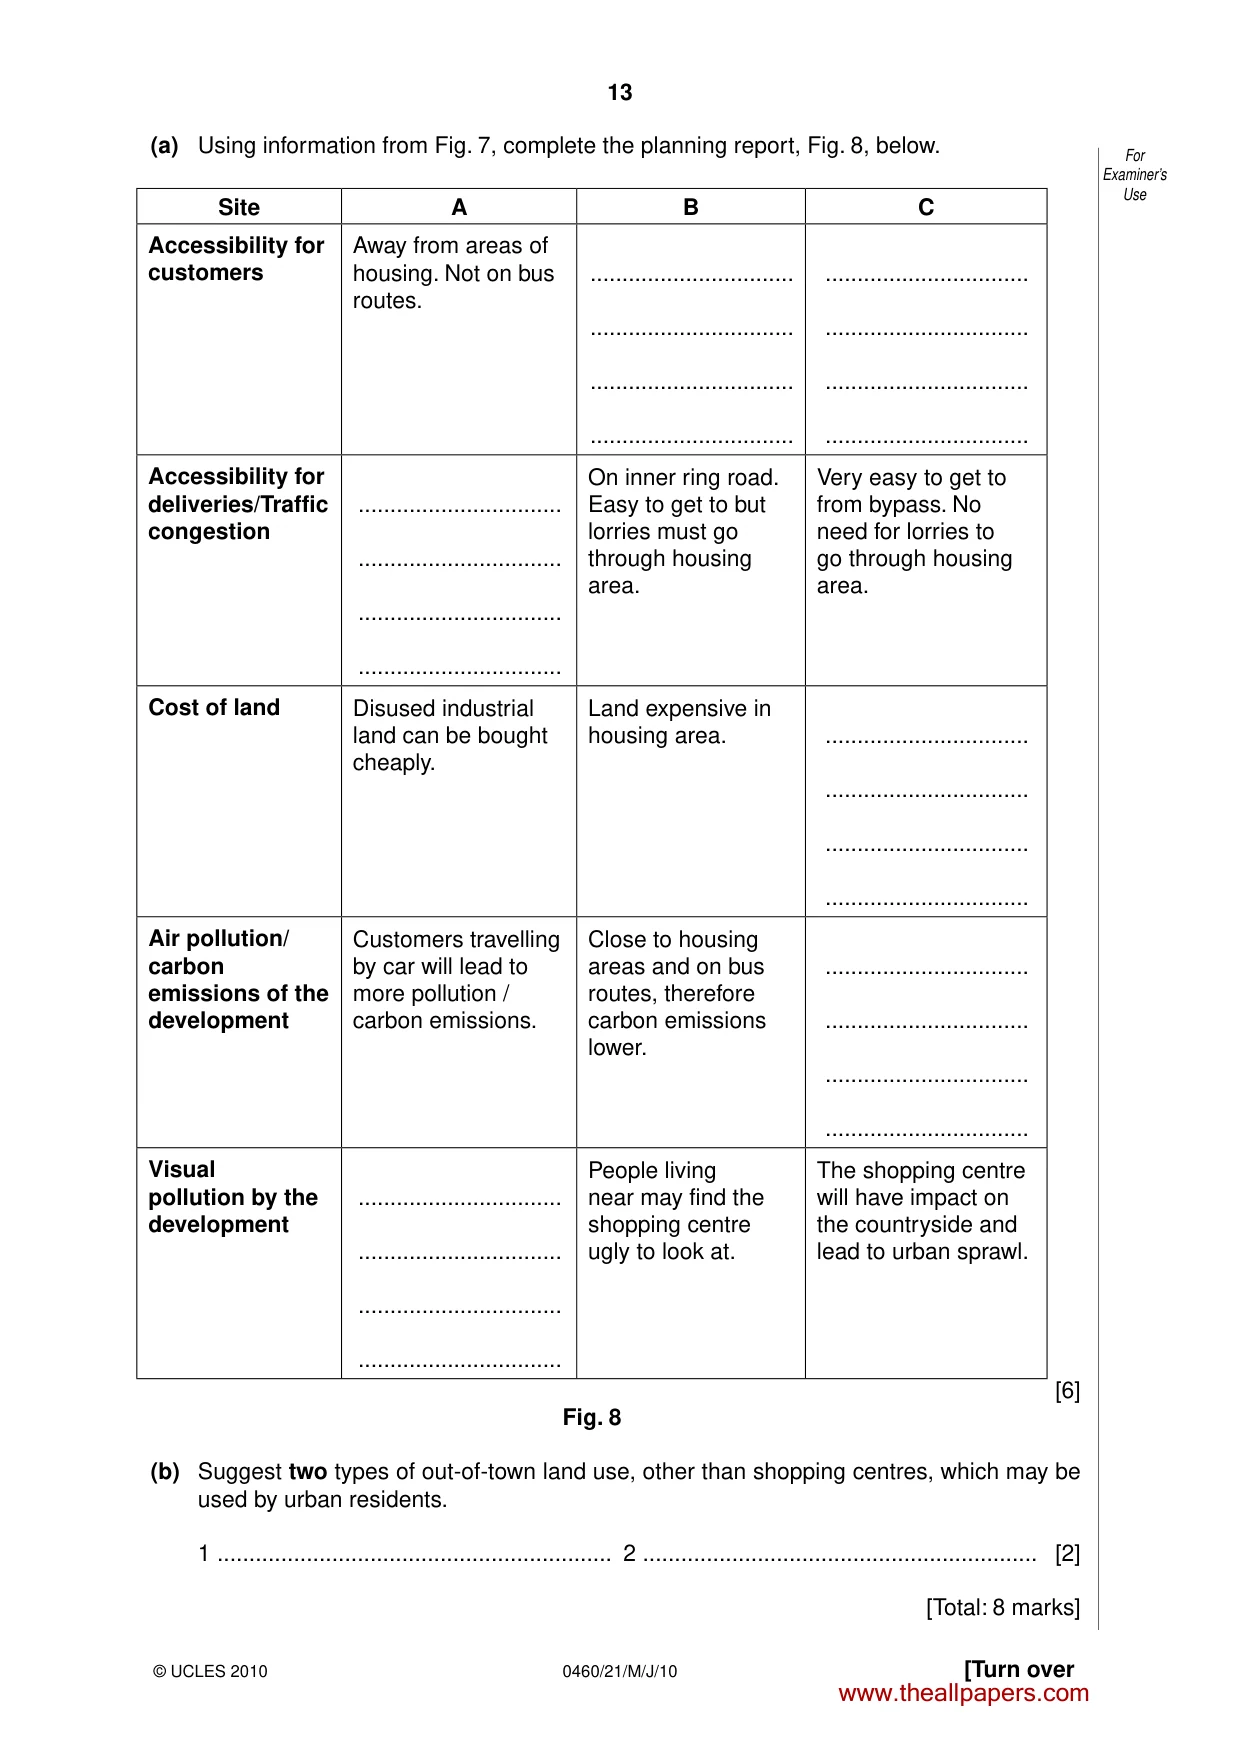
12 0460/21/M/J/10 For Examiner’s Use © UCLES 2010 5 Fig. 7 shows the land use of an urban area. It is planned to develop a new shopping centre in the area. Three possible sites A, B and C are shown on Fig. 7. Fig. 8 (opposite) shows a planning report giving information about the three sites. km N 0 5 C A B Key: CBD industrial (some disused) residential main road bus route river proposed shopping centre agriculture and open space A Fig. 7 www.theallpapers.com
Question paper, page 13
13 0460/21/M/J/10 [Turn over For Examiner’s Use © UCLES 2010 (a) Using information from Fig. 7, complete the planning report, Fig. 8, below. Site A B C Accessibility for customers Away from areas of housing. Not on bus routes. … … … … … … … … Accessibility for deliveries/Traffic congestion … … … … On inner ring road. Easy to get to but lorries must go through housing area. Very easy to get to from bypass. No need for lorries to go through housing area. Cost of land Disused industrial land can be bought cheaply. Land expensive in housing area. … … … … Air pollution/ carbon emissions of the development Customers travelling by car will lead to more pollution / carbon emissions. Close to housing areas and on bus routes, therefore carbon emissions lower. … … … … Visual pollution by the development … … … … People living near may find the shopping centre ugly to look at. The shopping centre will have impact on the countryside and lead to urban sprawl. [6] Fig. 8 (b) Suggest two types of out-of-town land use, other than shopping centres, which may be used by urban residents. 1 … 2 … [2] [Total: 8 marks] www.theallpapers.com
Question paper, page 14
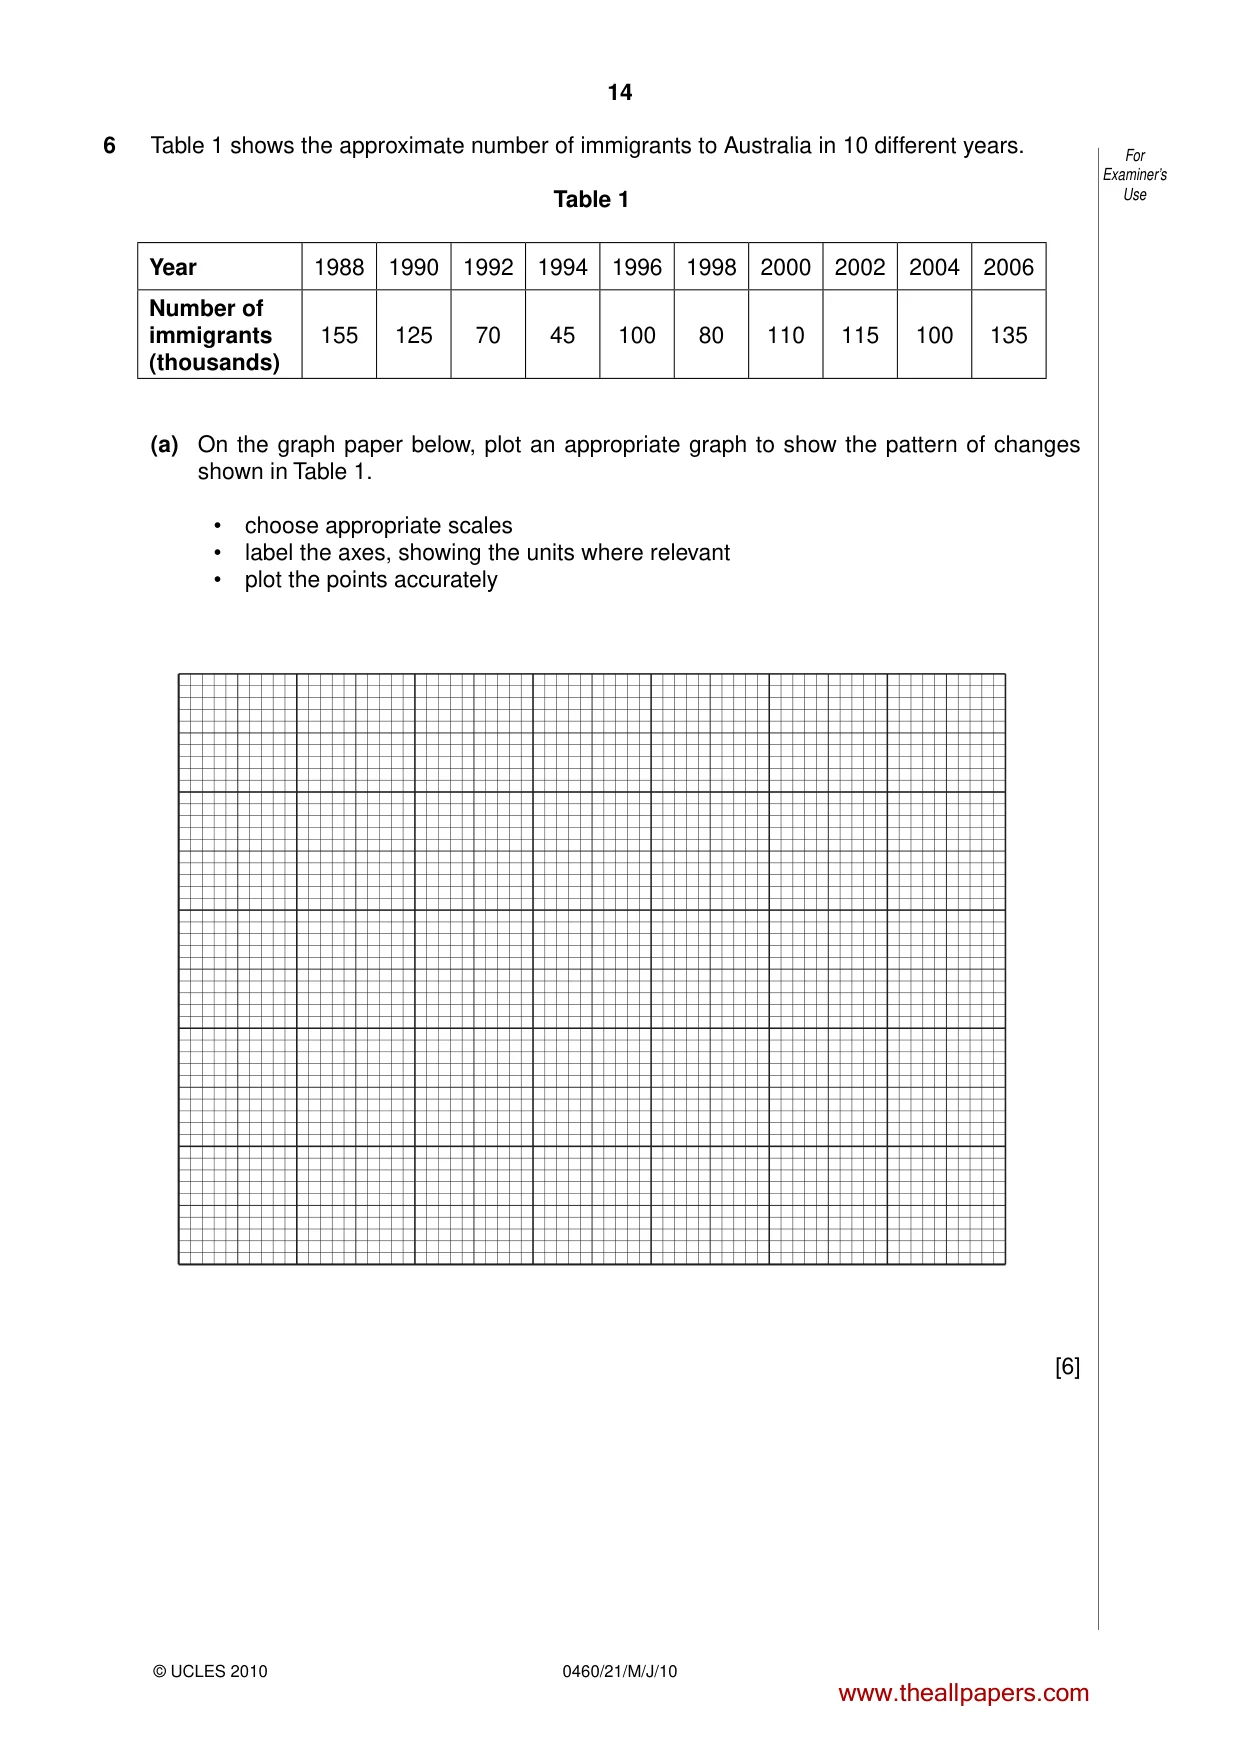
14 0460/21/M/J/10 For Examiner’s Use © UCLES 2010 6 Table 1 shows the approximate number of immigrants to Australia in 10 different years. Table 1 Year 1988 1990 1992 1994 1996 1998 2000 2002 2004 2006 Number of immigrants (thousands) 155 125 70 45 100 80 110 115 100 135 (a) On the graph paper below, plot an appropriate graph to show the pattern of changes shown in Table 1. • choose appropriate scales • label the axes, showing the units where relevant • plot the points accurately [6] www.theallpapers.com
Question paper, page 15
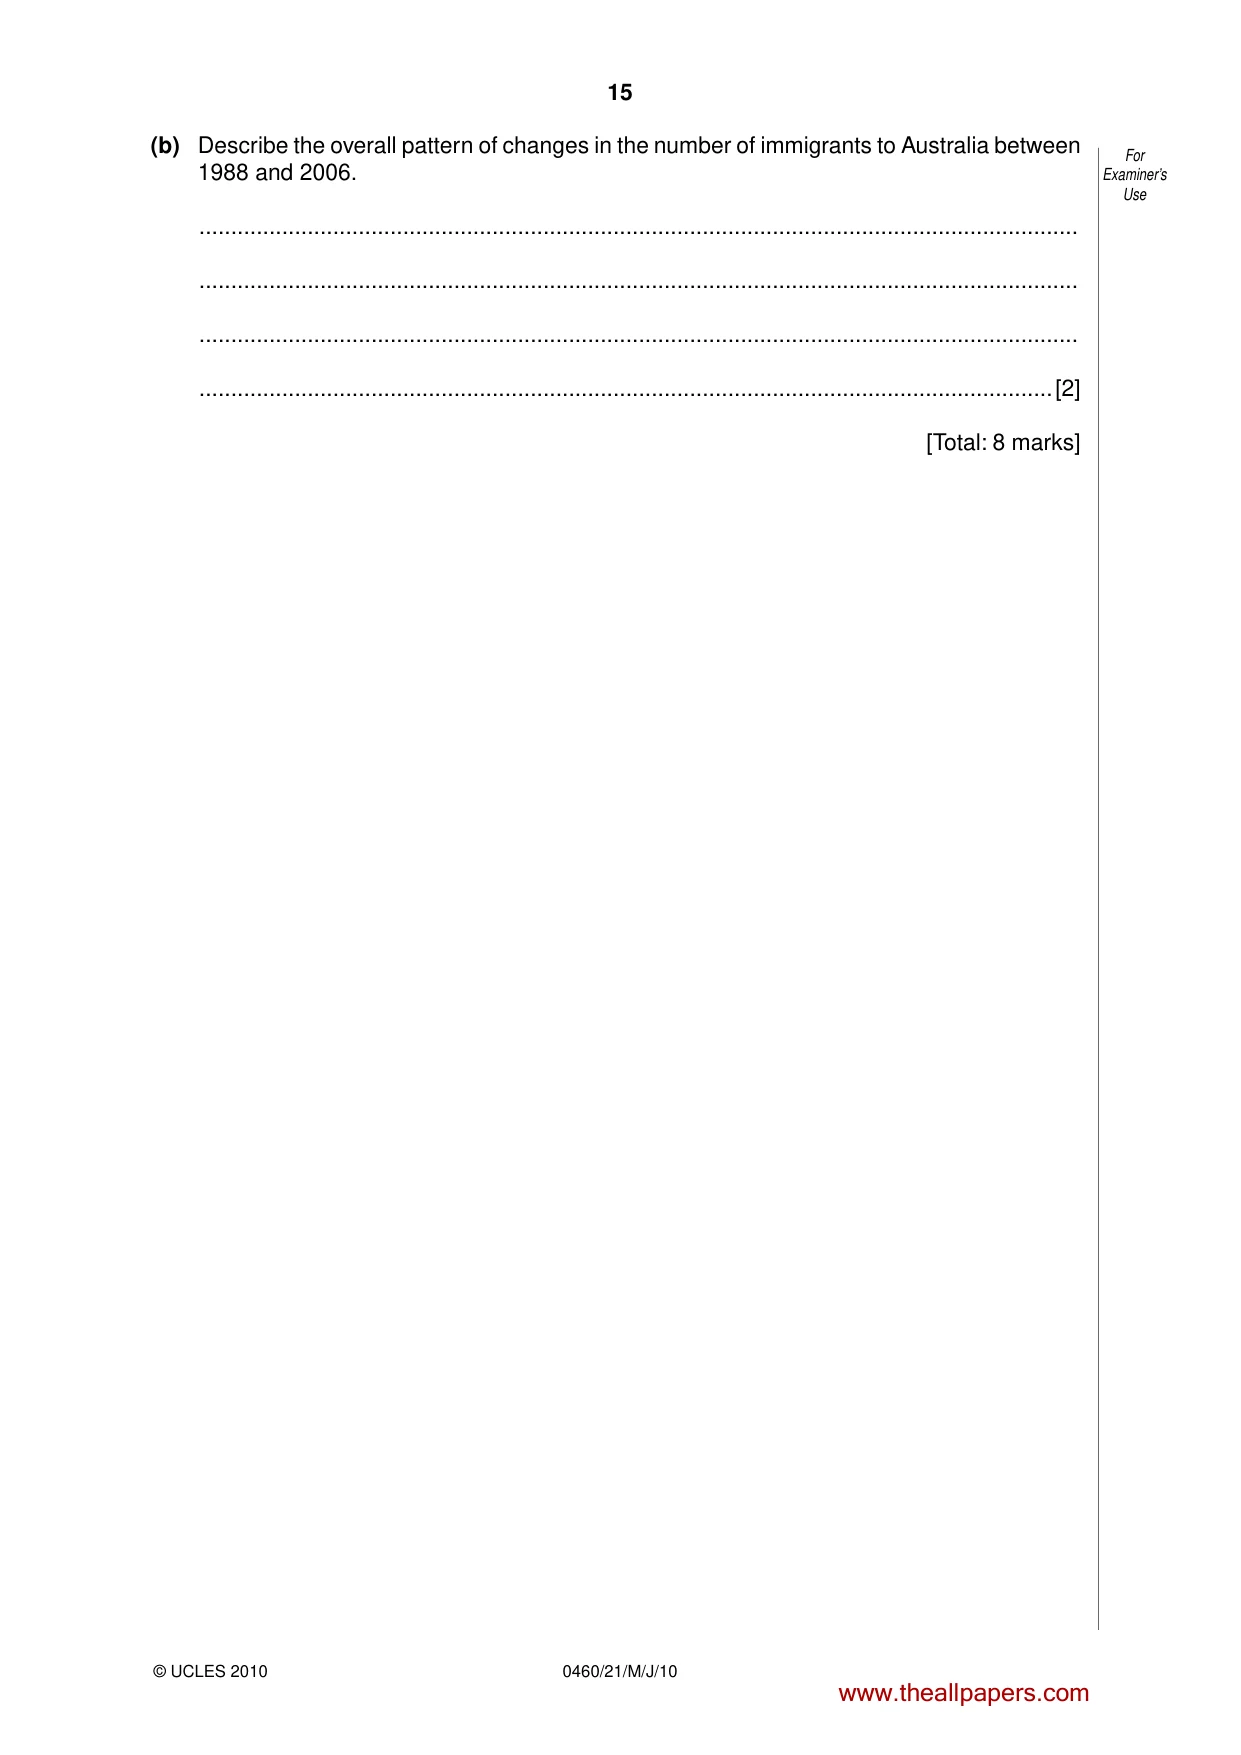
15 0460/21/M/J/10 For Examiner’s Use © UCLES 2010 (b) Describe the overall pattern of changes in the number of immigrants to Australia between 1988 and 2006. … … … …[2] [Total: 8 marks] www.theallpapers.com
Question paper, page 16
16 0460/21/M/J/10 © UCLES 2010 BLANK PAGE Copyright Acknowledgements: Question 4 Photographs A & B D Kelly, © UCLES. Permission to reproduce items where third-party owned material protected by copyright is included has been sought and cleared where possible. Every reasonable effort has been made by the publisher (UCLES) to trace copyright holders, but if any items requiring clearance have unwittingly been included, the publisher will be pleased to make amends at the earliest possible opportunity. University of Cambridge International Examinations is part of the Cambridge Assessment Group. Cambridge Assessment is the brand name of University of Cambridge Local Examinations Syndicate (UCLES), which is itself a department of the University of Cambridge. www.theallpapers.com
Mark scheme, page 1
UNIVERSITY OF CAMBRIDGE INTERNATIONAL EXAMINATIONS International General Certificate of Secondary Education MARK SCHEME for the May/June 2010 question paper for the guidance of teachers 0460 GEOGRAPHY 0460/21 Paper 21, maximum raw mark 60 This mark scheme is published as an aid to teachers and candidates, to indicate the requirements of the examination. It shows the basis on which Examiners were instructed to award marks. It does not indicate the details of the discussions that took place at an Examiners’ meeting before marking began, which would have considered the acceptability of alternative answers. Mark schemes must be read in conjunction with the question papers and the report on the examination. • CIE will not enter into discussions or correspondence in connection with these mark schemes. CIE is publishing the mark schemes for the May/June 2010 question papers for most IGCSE, GCE Advanced Level and Advanced Subsidiary Level syllabuses and some Ordinary Level syllabuses. www.theallpapers.com
Mark scheme, page 2
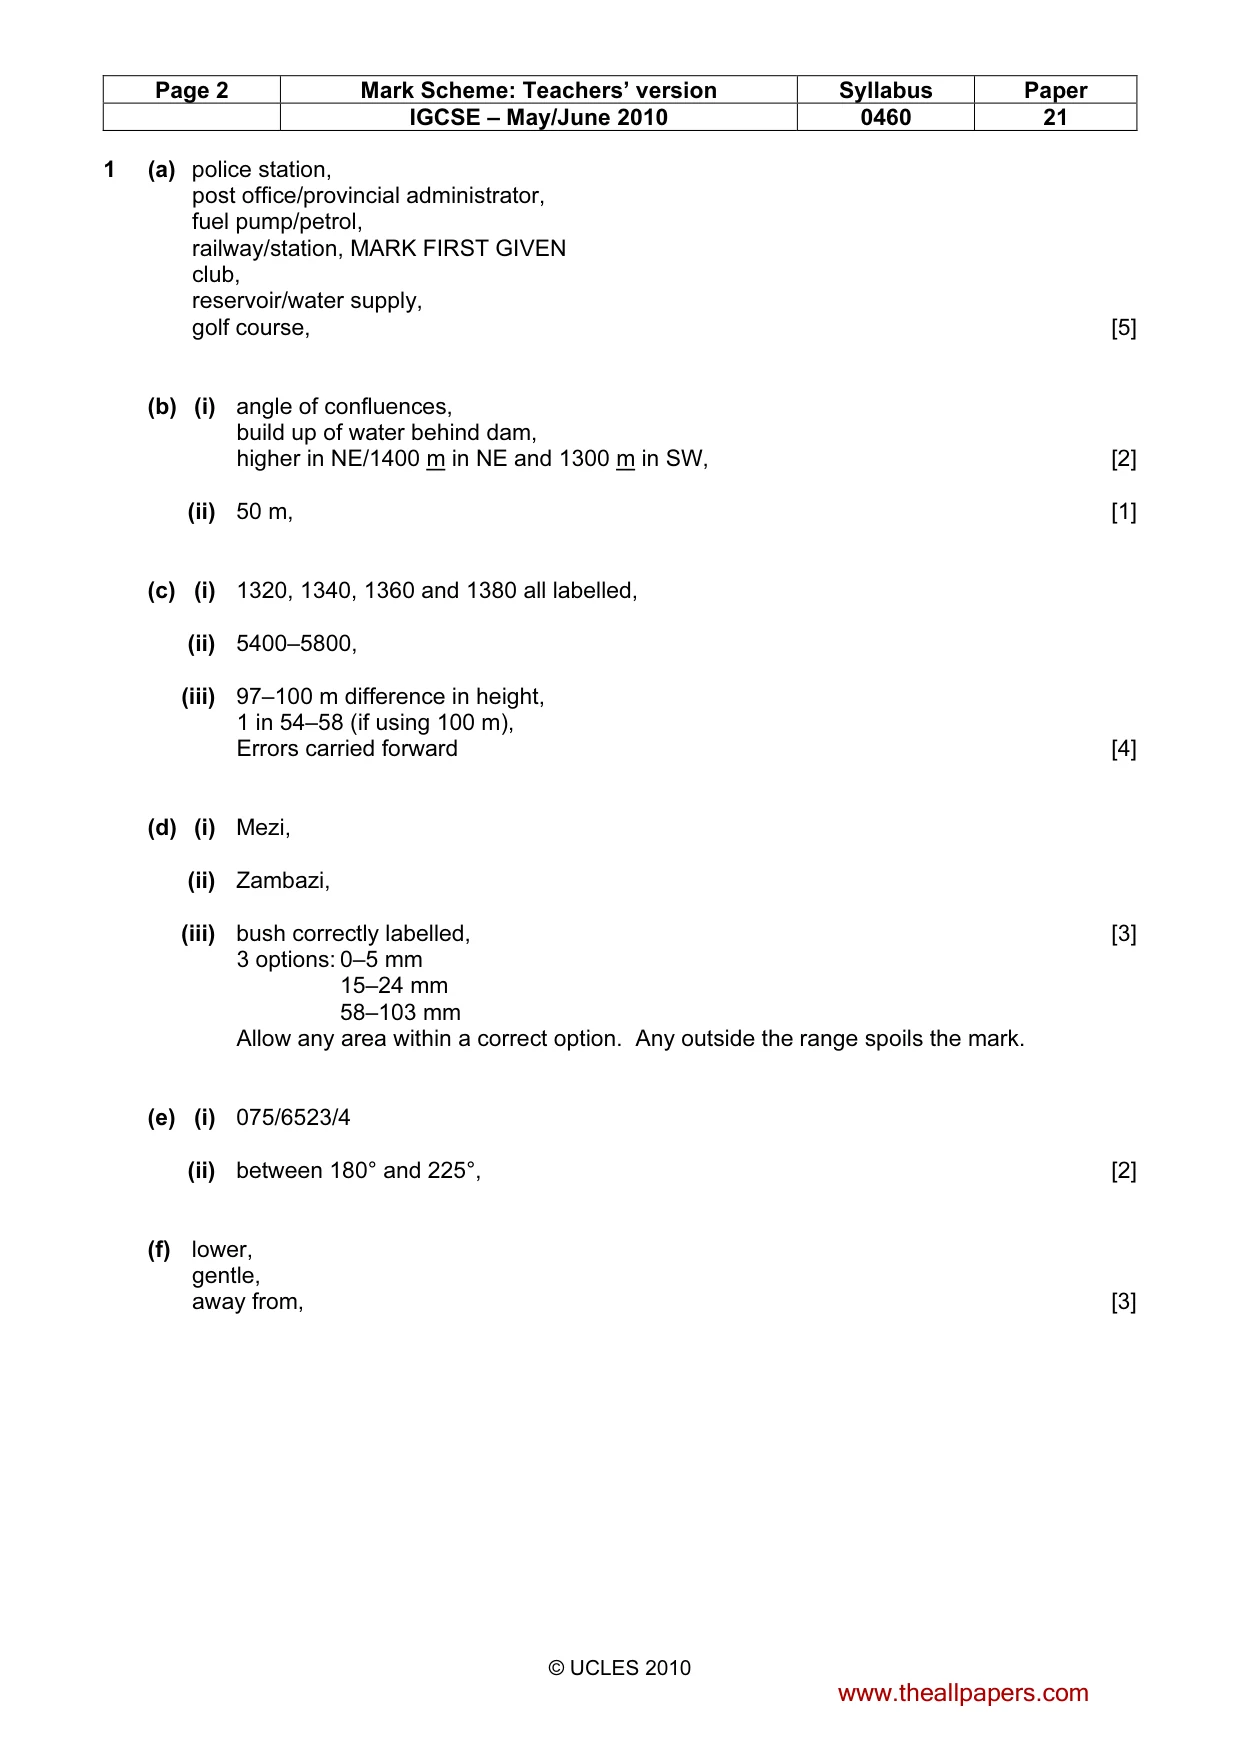
Page 2 Mark Scheme: Teachers’ version Syllabus Paper IGCSE – May/June 2010 0460 21 © UCLES 2010 1 (a) police station, post office/provincial administrator, fuel pump/petrol, railway/station, MARK FIRST GIVEN club, reservoir/water supply, golf course, [5] (b) (i) angle of confluences, build up of water behind dam, higher in NE/1400 m in NE and 1300 m in SW, [2] (ii) 50 m, [1] (c) (i) 1320, 1340, 1360 and 1380 all labelled, (ii) 5400–5800, (iii) 97–100 m difference in height, 1 in 54–58 (if using 100 m), Errors carried forward [4] (d) (i) Mezi, (ii) Zambazi, (iii) bush correctly labelled, [3] 3 options: 0–5 mm 15–24 mm 58–103 mm Allow any area within a correct option. Any outside the range spoils the mark. (e) (i) 075/6523/4 (ii) between 180° and 225°, [2] (f) lower, gentle, away from, [3] www.theallpapers.com
Mark scheme, page 3
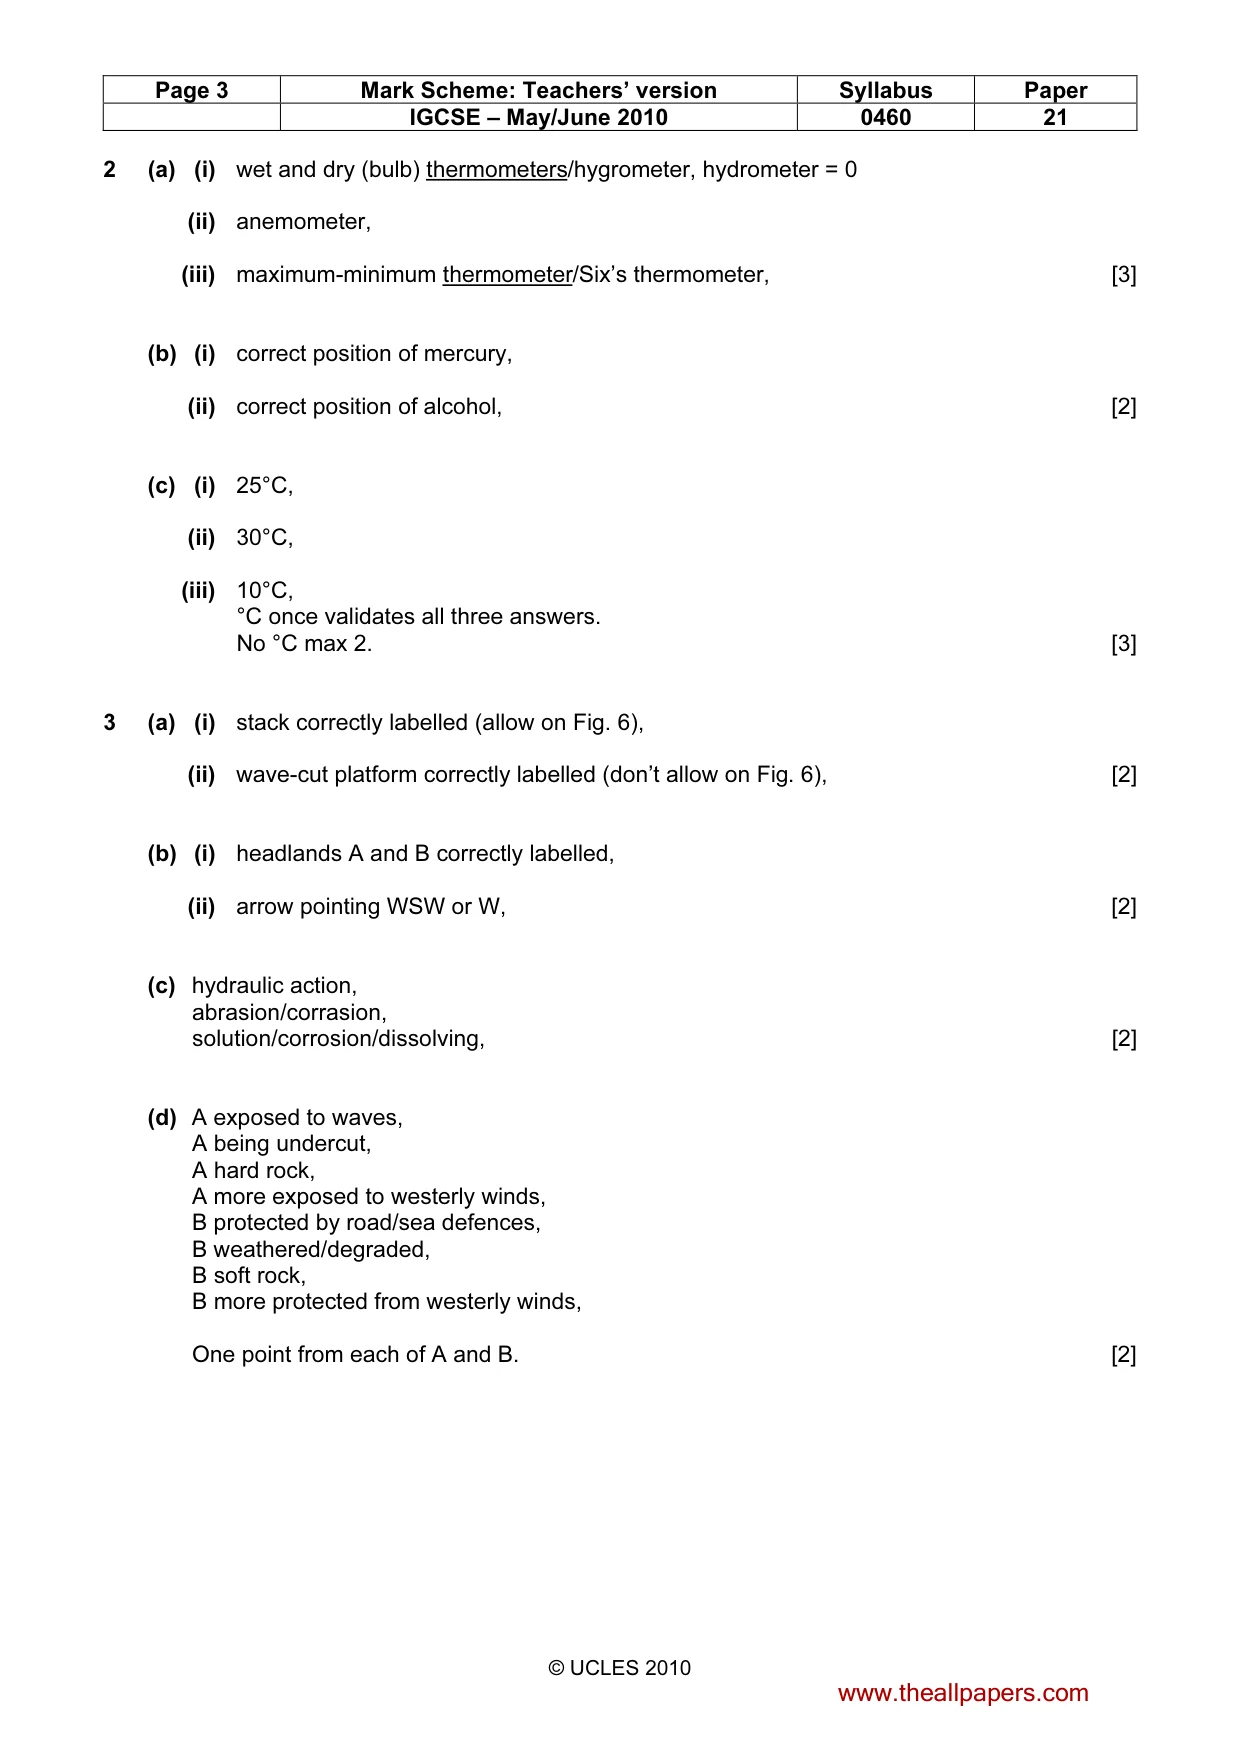
Page 3 Mark Scheme: Teachers’ version Syllabus Paper IGCSE – May/June 2010 0460 21 © UCLES 2010 2 (a) (i) wet and dry (bulb) thermometers/hygrometer, hydrometer = 0 (ii) anemometer, (iii) maximum-minimum thermometer/Six’s thermometer, [3] (b) (i) correct position of mercury, (ii) correct position of alcohol, [2] (c) (i) 25°C, (ii) 30°C, (iii) 10°C, °C once validates all three answers. No °C max 2. [3] 3 (a) (i) stack correctly labelled (allow on Fig. 6), (ii) wave-cut platform correctly labelled (don’t allow on Fig. 6), [2] (b) (i) headlands A and B correctly labelled, (ii) arrow pointing WSW or W, [2] (c) hydraulic action, abrasion/corrasion, solution/corrosion/dissolving, [2] (d) A exposed to waves, A being undercut, A hard rock, A more exposed to westerly winds, B protected by road/sea defences, B weathered/degraded, B soft rock, B more protected from westerly winds, One point from each of A and B. [2] www.theallpapers.com
Mark scheme, page 4
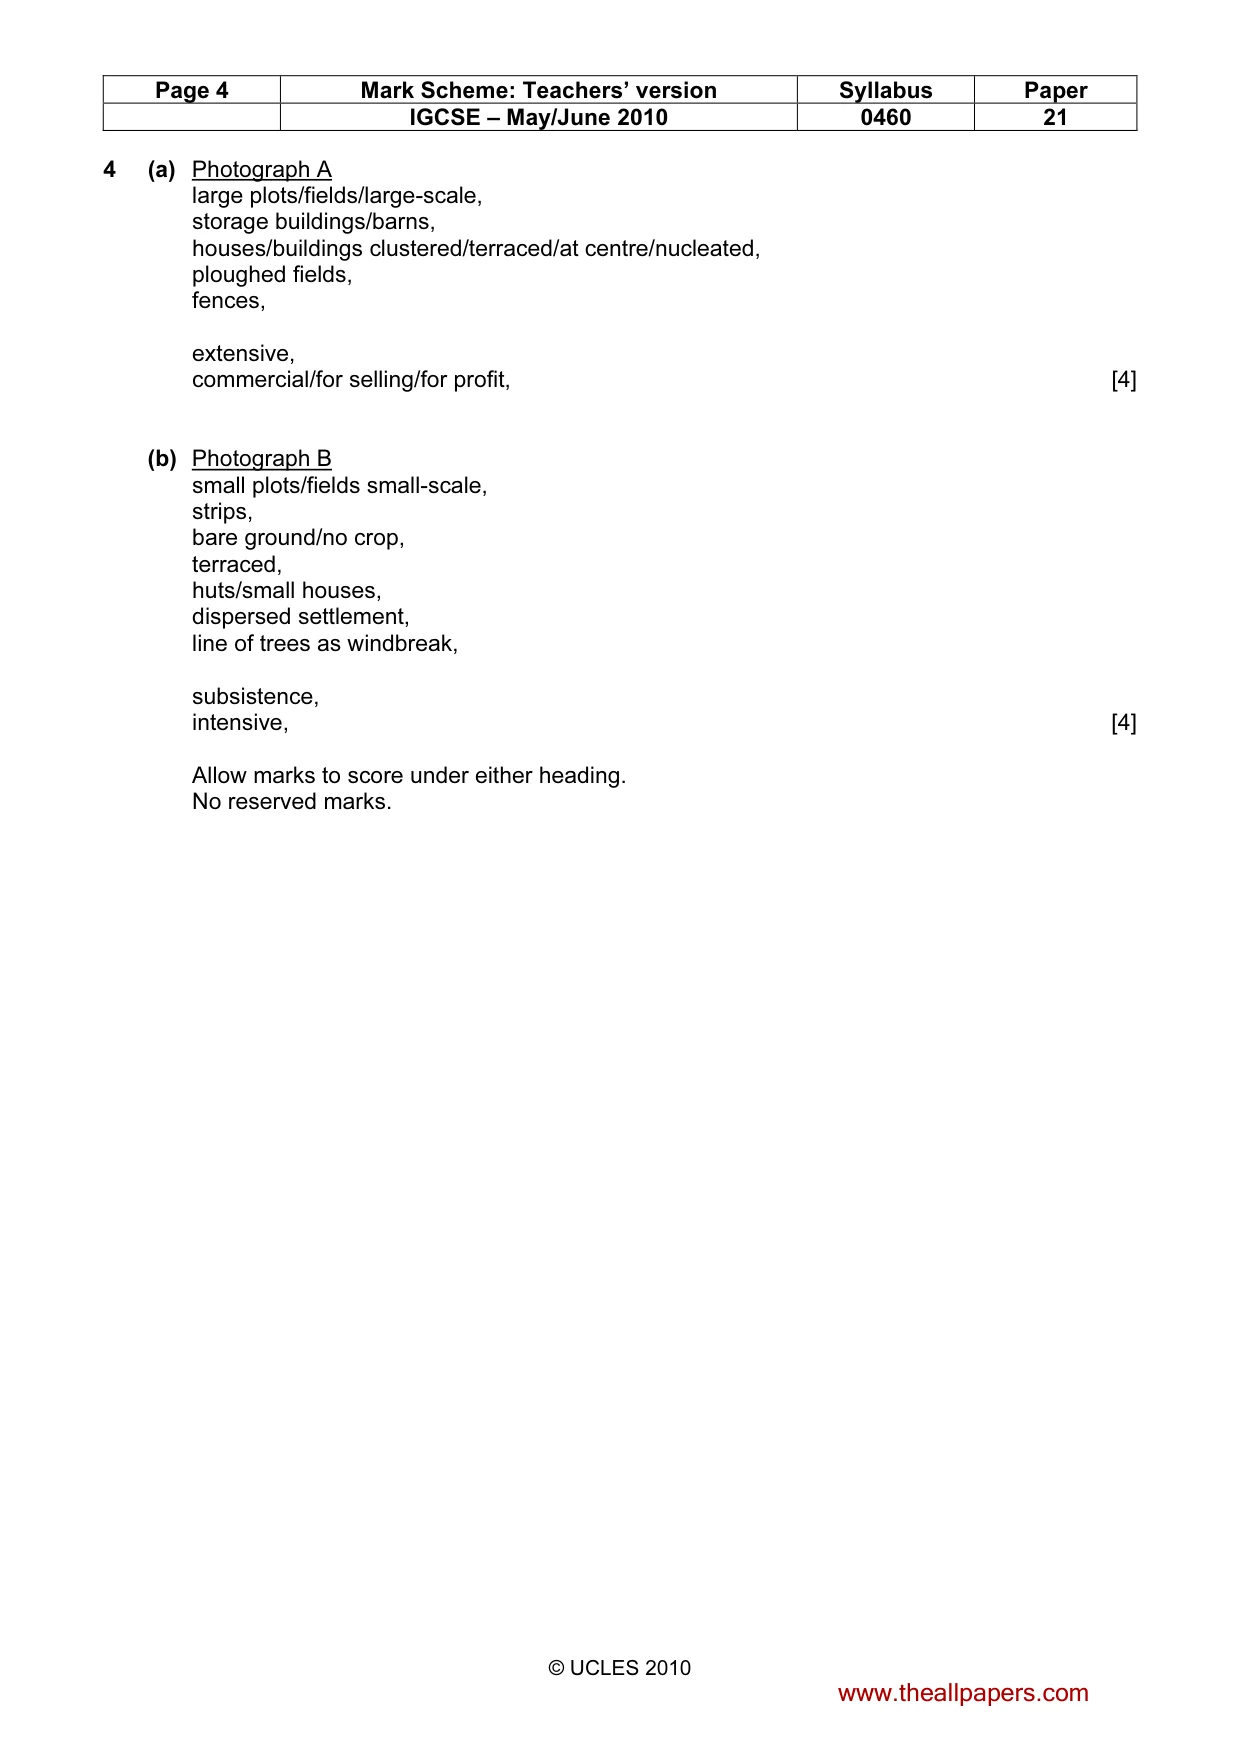
Page 4 Mark Scheme: Teachers’ version Syllabus Paper IGCSE – May/June 2010 0460 21 © UCLES 2010 4 (a) Photograph A large plots/fields/large-scale, storage buildings/barns, houses/buildings clustered/terraced/at centre/nucleated, ploughed fields, fences, extensive, commercial/for selling/for profit, [4] (b) Photograph B small plots/fields small-scale, strips, bare ground/no crop, terraced, huts/small houses, dispersed settlement, line of trees as windbreak, subsistence, intensive, [4] Allow marks to score under either heading. No reserved marks. www.theallpapers.com
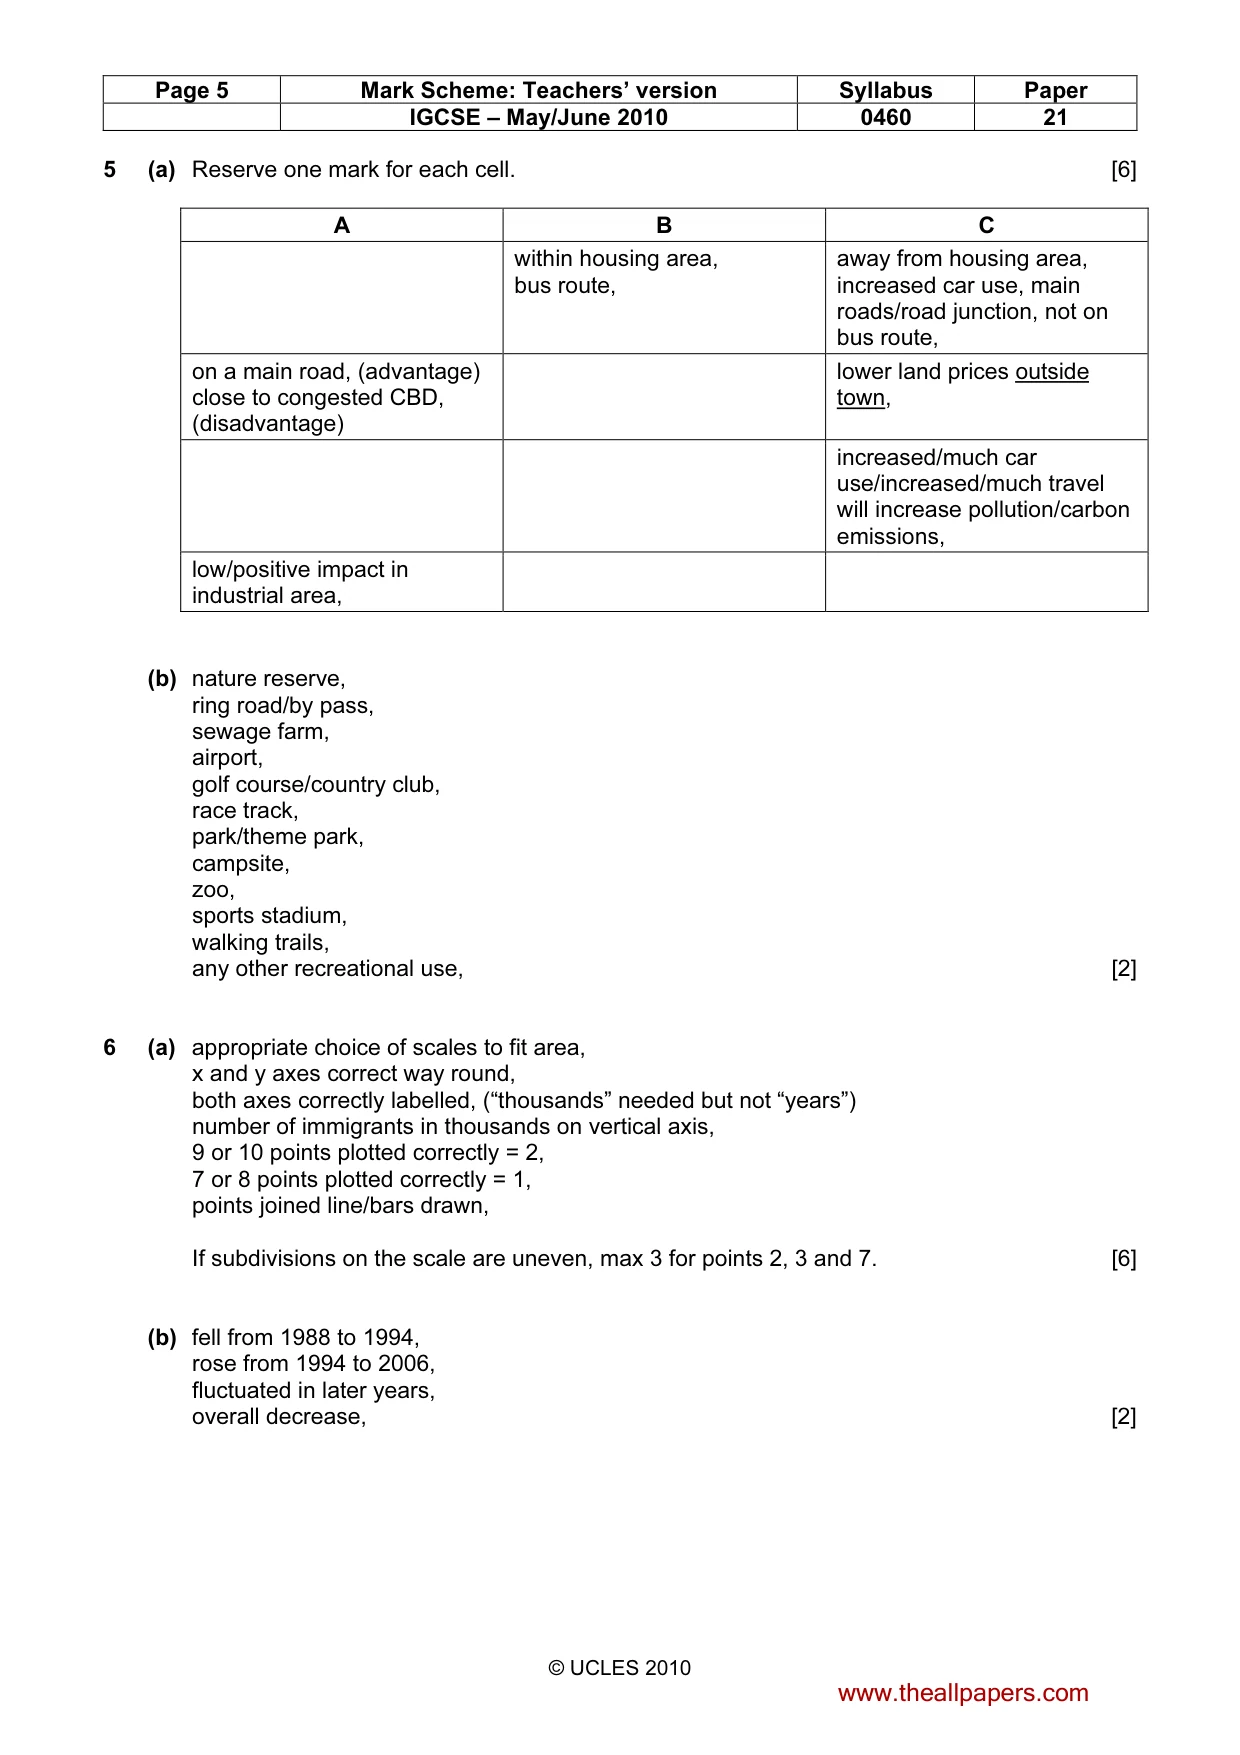
Mark scheme, page 5
Page 5 Mark Scheme: Teachers’ version Syllabus Paper IGCSE – May/June 2010 0460 21 © UCLES 2010 5 (a) Reserve one mark for each cell. [6] A B C within housing area, bus route, away from housing area, increased car use, main roads/road junction, not on bus route, on a main road, (advantage) close to congested CBD, (disadvantage) lower land prices outside town, increased/much car use/increased/much travel will increase pollution/carbon emissions, low/positive impact in industrial area, (b) nature reserve, ring road/by pass, sewage farm, airport, golf course/country club, race track, park/theme park, campsite, zoo, sports stadium, walking trails, any other recreational use, [2] 6 (a) appropriate choice of scales to fit area, x and y axes correct way round, both axes correctly labelled, (“thousands” needed but not “years”) number of immigrants in thousands on vertical axis, 9 or 10 points plotted correctly = 2, 7 or 8 points plotted correctly = 1, points joined line/bars drawn, If subdivisions on the scale are uneven, max 3 for points 2, 3 and 7. [6] (b) fell from 1988 to 1994, rose from 1994 to 2006, fluctuated in later years, overall decrease, [2] www.theallpapers.com
What you needed in this session
Cambridge’s own grade thresholds for 2010 May/June, Paper 2 · Variant 1. A higher threshold means an easier paper — the bar moves with how the cohort did.