Cambridge IGCSE Environmental Management 0680 — 2022 Oct/Nov Paper 2 · Variant 2
0680/22/O/N/22 · 5 questions · 80 marks · ≈90 min
The question paper and its mark scheme, free to read here and free to download. This is Cambridge’s own paper, exactly as it was sat.
Question paper28 pages






Mark scheme15 pages
Answers below. Sit the paper first if you are practising.
Questions as text
Q1 · In 2020, there were 2 100 000 people working in the agricultural industry in Spain
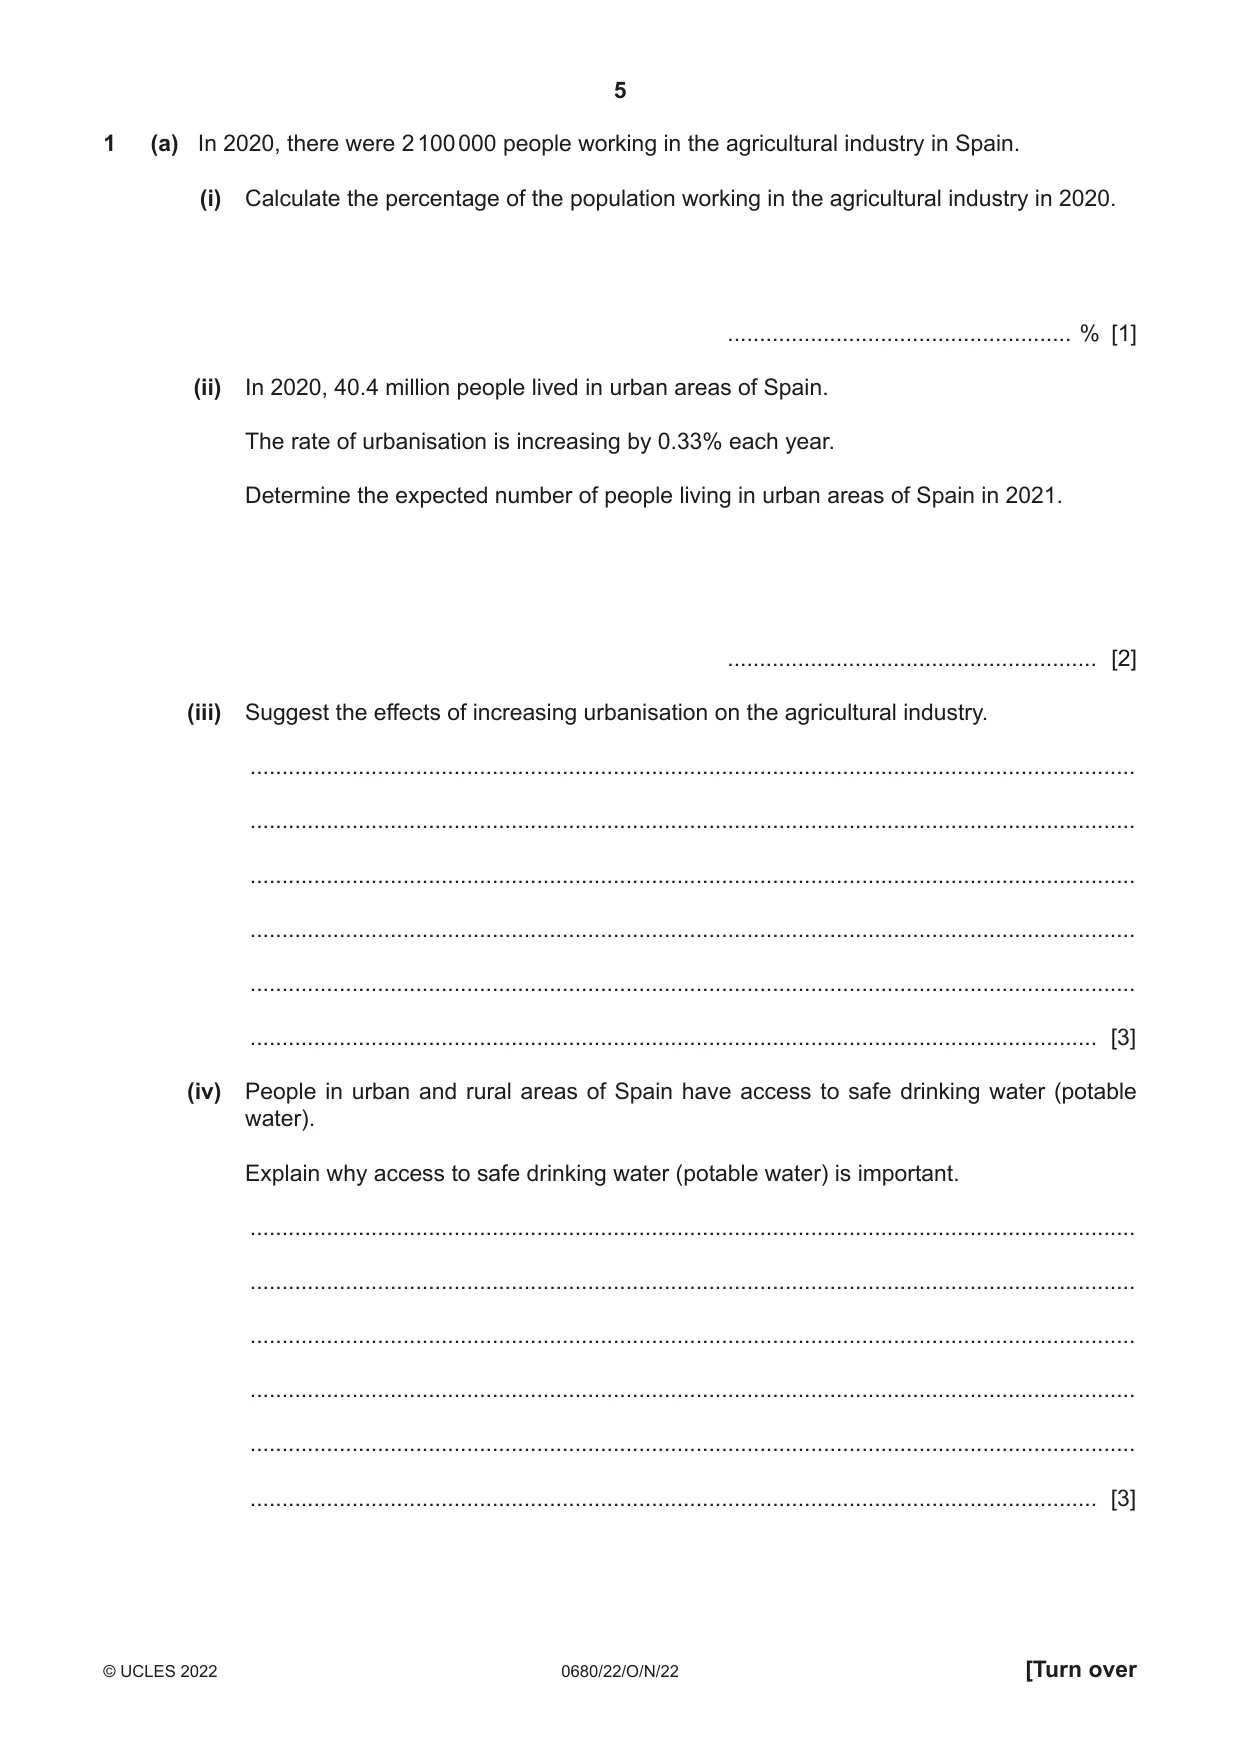
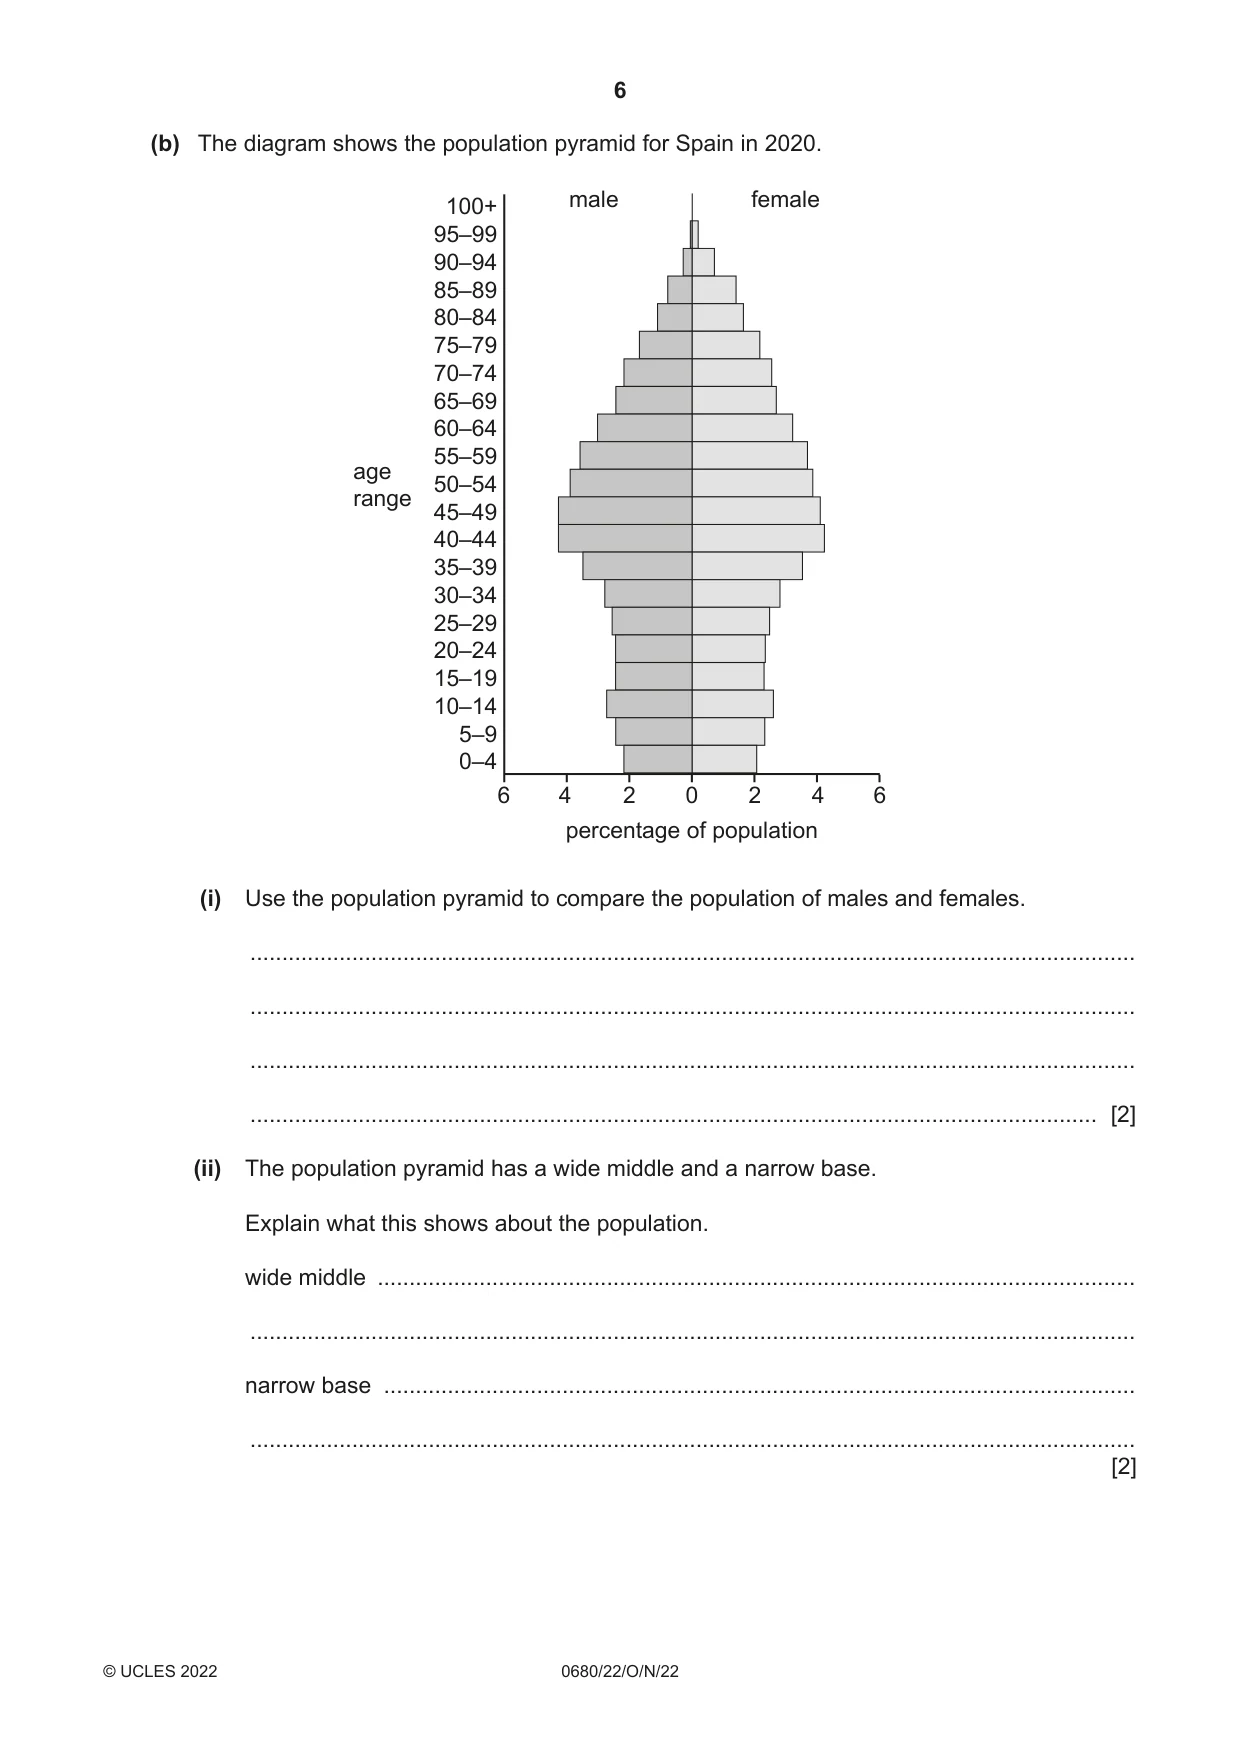
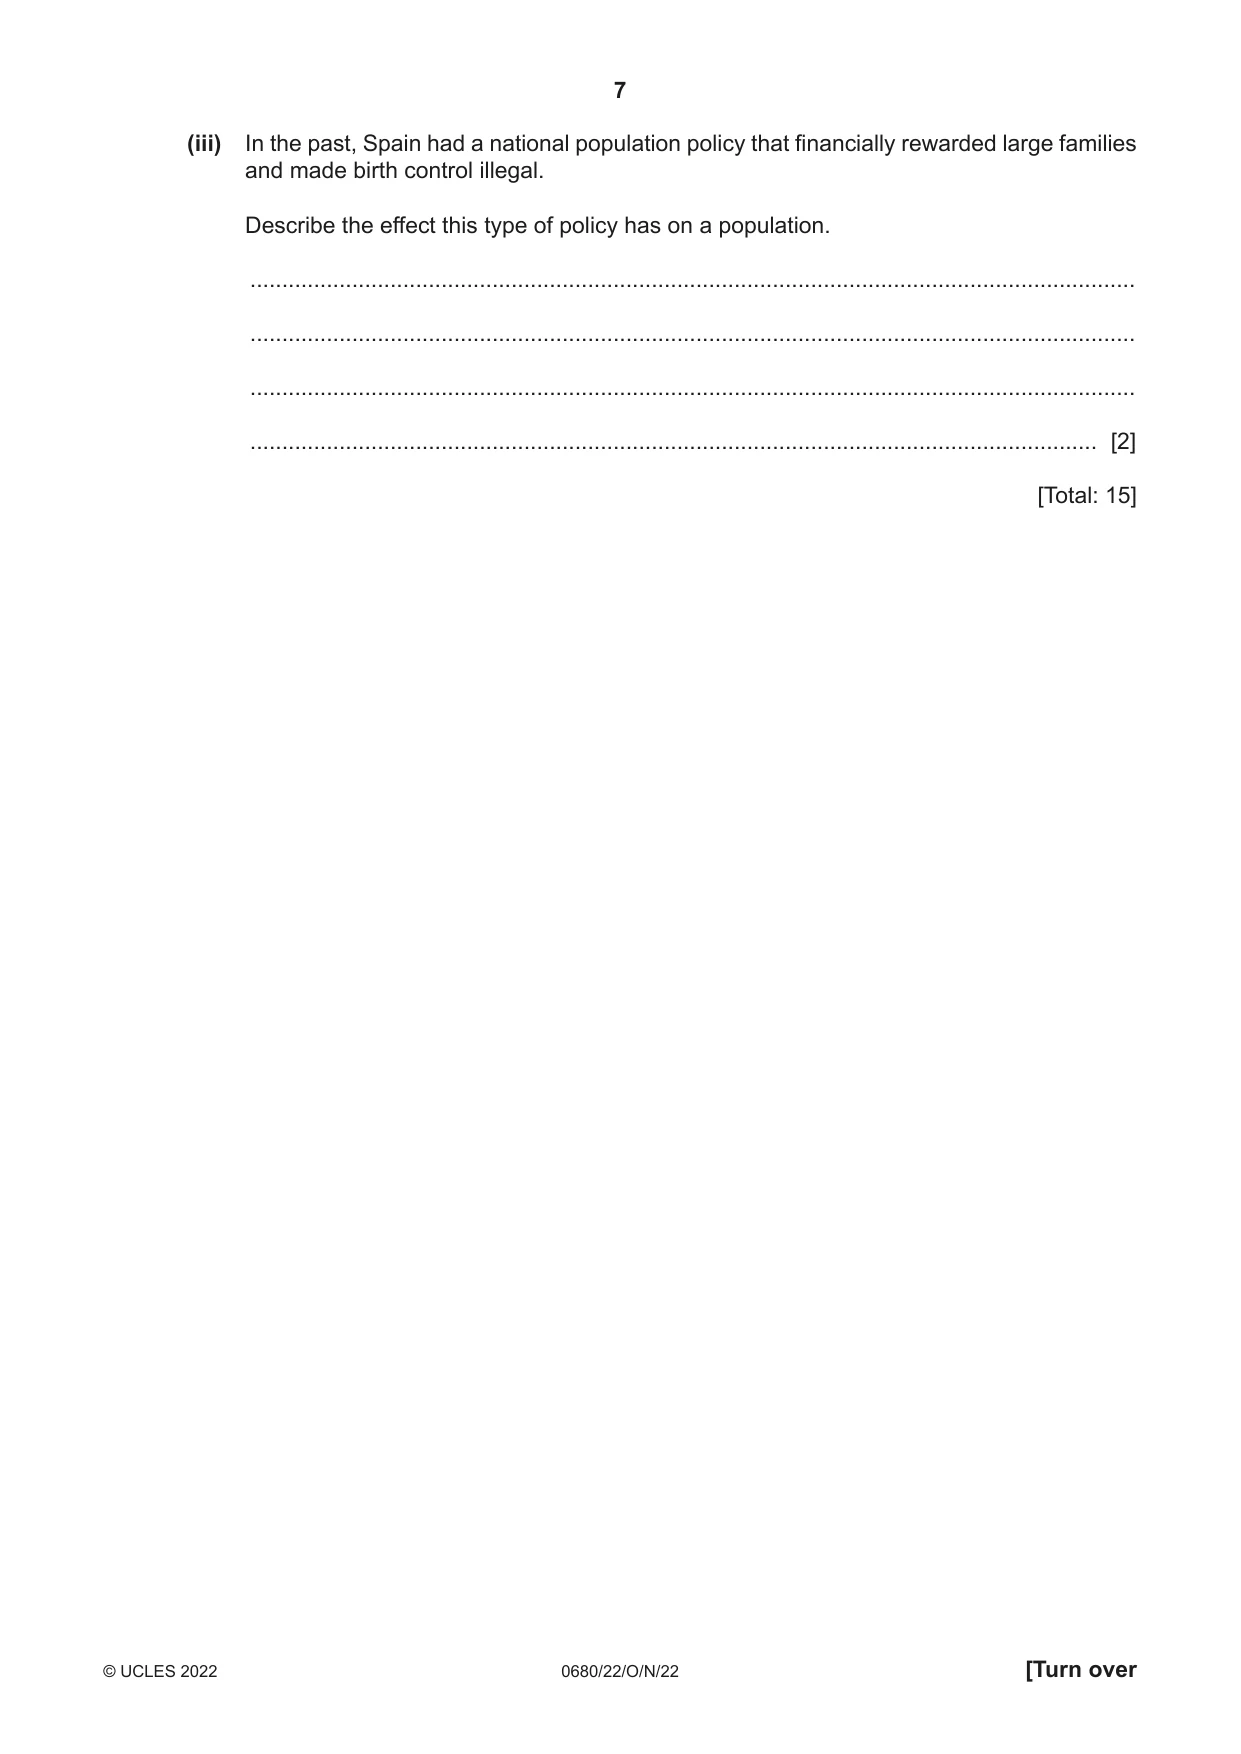
1 (a) In 2020, there were 2 100 000 people working in the agricultural industry in Spain. (i) Calculate the percentage of the population working in the agricultural industry in 2020. ...................................................... % [1] (ii) In 2020, 40.4 million people lived in urban areas of Spain. The rate of urbanisation is increasing by 0.33% each year. Determine the expected number of people living in urban areas of Spain in 2021. .......................................................... [2] (iii) Suggest the effects of increasing urbanisation on the agricultural industry. ........................................................................................................................................... ........................................................................................................................................... ........................................................................................................................................... ........................................................................................................................................... ........................................................................................................................................... ..................................................................................................................................... [3] (iv) People in urban and rural areas of Spain have access to safe drinking water (potable water). Explain why access to safe drinking water (potable water) is important. ........................................................................................................................................... ........................................................................................................................................... ........................................................................................................................................... ........................................................................................................................................... ........................................................................................................................................... ..................................................................................................................................... [3] (b) The diagram shows the population pyramid for Spain in 2020. male female 100+ 95–99 90–94 85–89 80–84 75–79 70–74 65–69 60–64 55–59 age 50–54 range 45–49 40–44 35–39 30–34 25–29 20–24 15–19 10–14 5–9 0–4 6 4 2 0 2 4 6 percentage of population (i) Use the population pyramid to compare the population of males and females. ........................................................................................................................................... ........................................................................................................................................... ........................................................................................................................................... ..................................................................................................................................... [2] (ii) The population pyramid has a wide middle and a narrow base. Explain what this shows about the population. wide middle ....................................................................................................................... ........................................................................................................................................... narrow base ...................................................................................................................... ........................................................................................................................................... [2] (iii) In the past, Spain had a national population policy that financially rewarded large families and made birth control illegal. Describe the effect this type of policy has on a population. ........................................................................................................................................... ........................................................................................................................................... ........................................................................................................................................... ..................................................................................................................................... [2] [Total: 15]
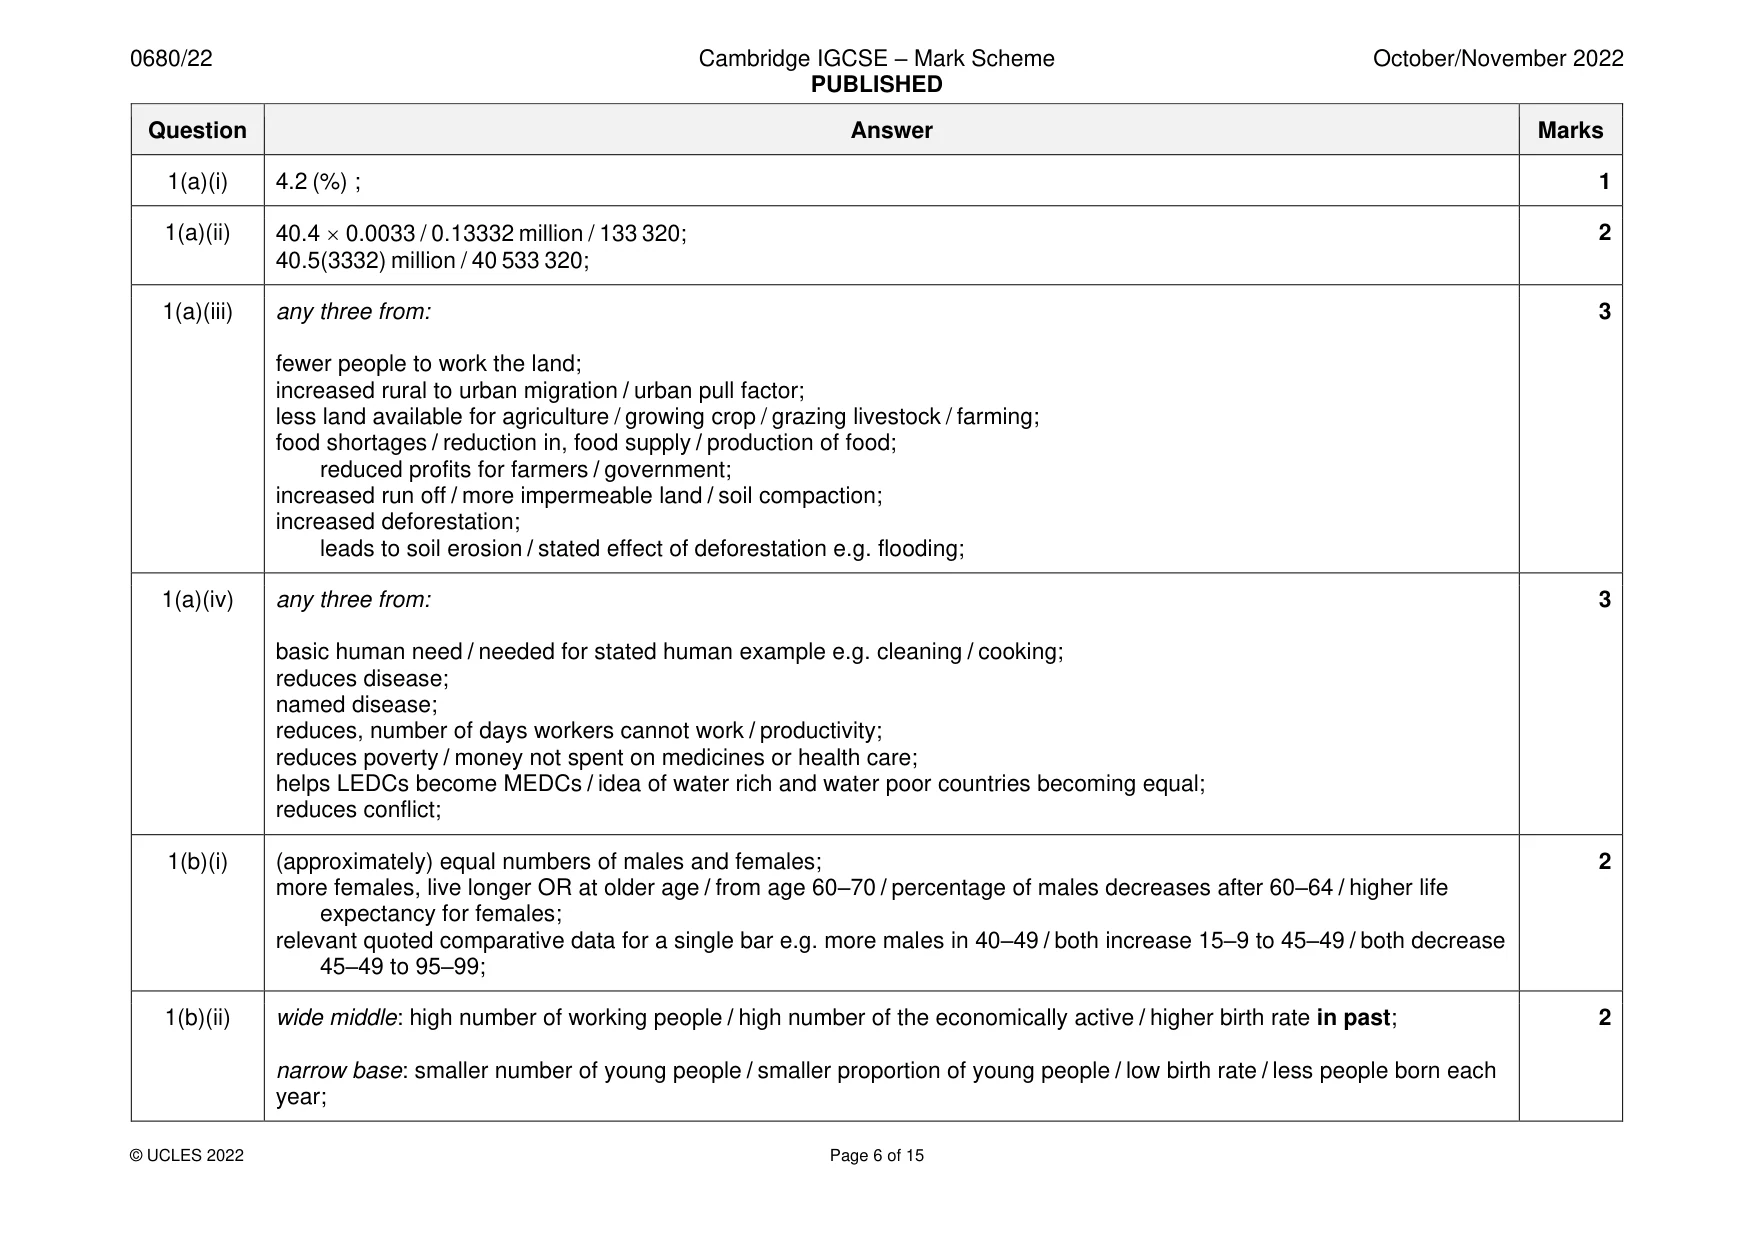
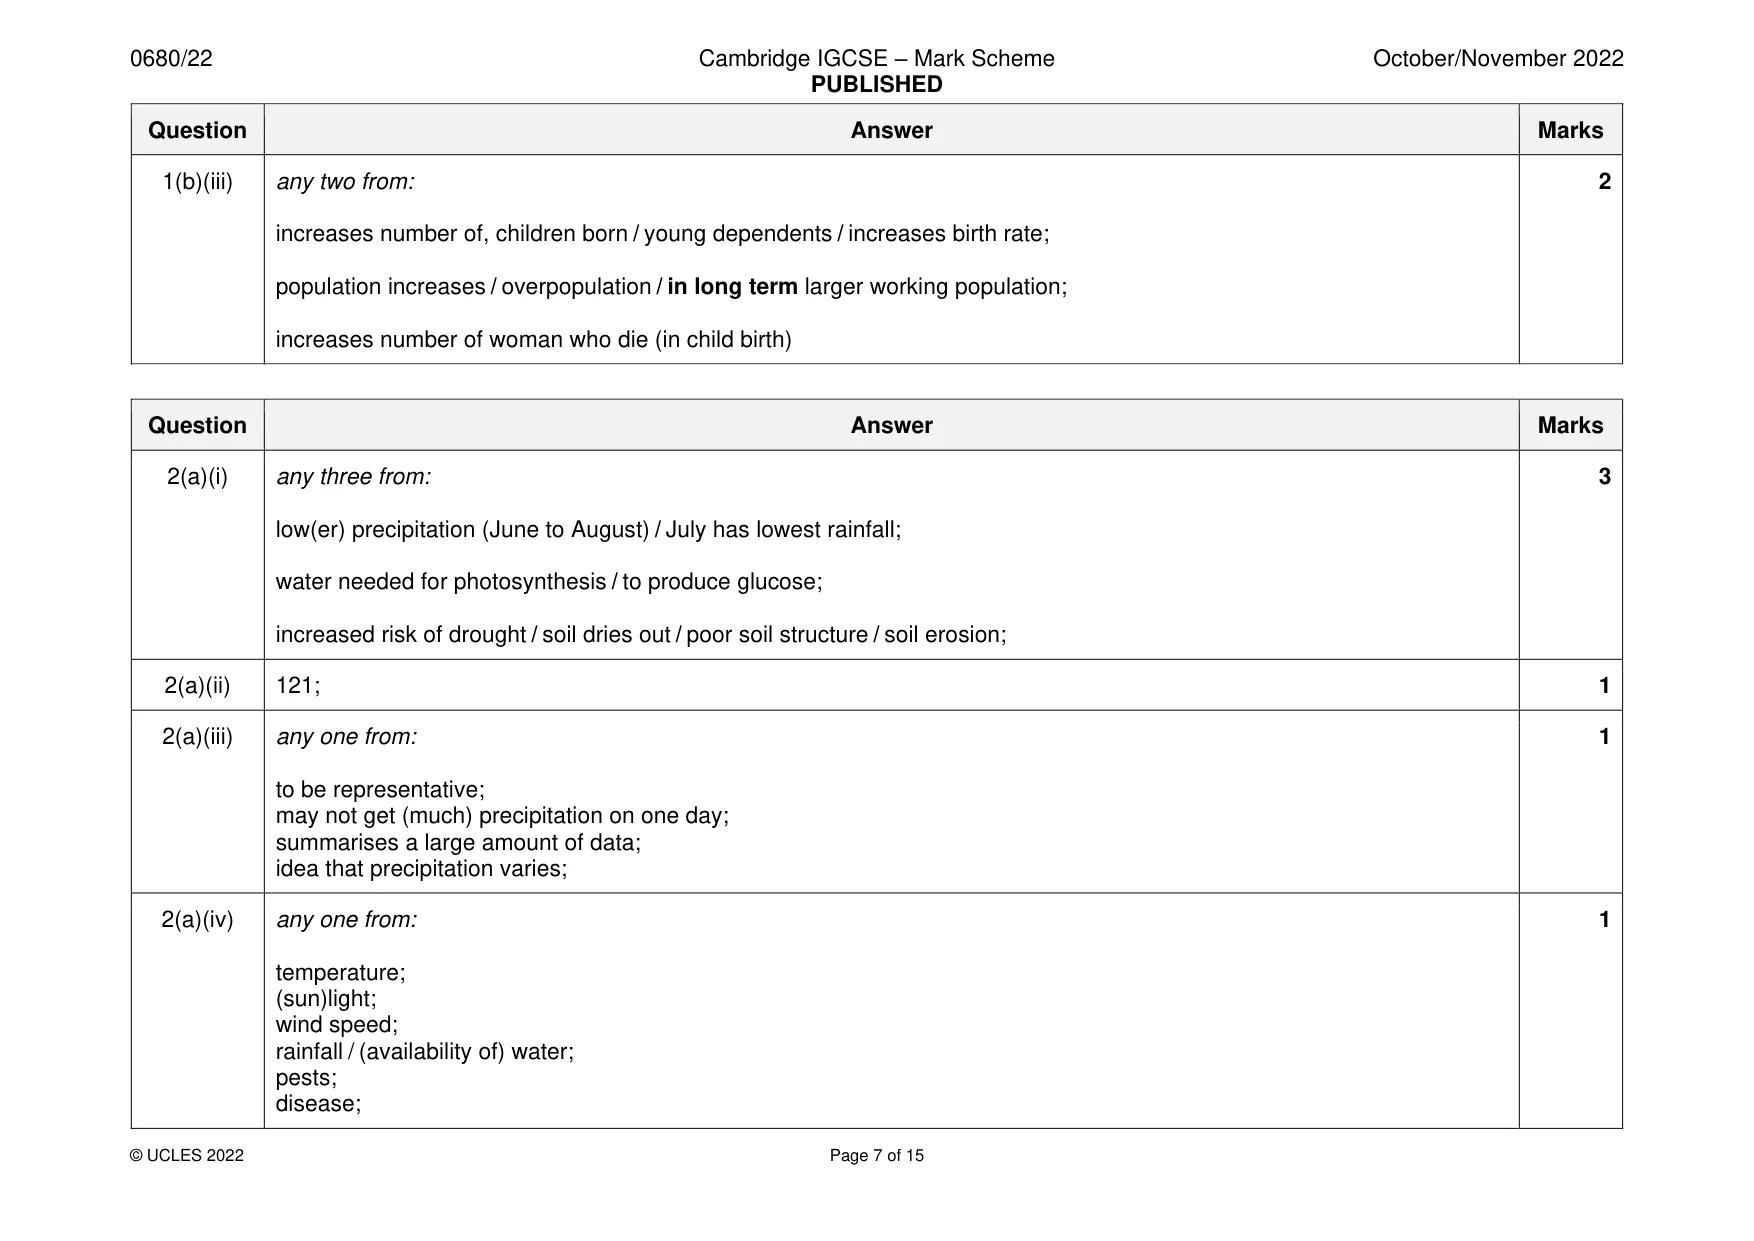
Mark scheme: Question Answer Marks 1(a)(i) 4.2 (%) ; 1 1(a)(ii) 40.4 0.0033 / 0.13332 million / 133 320; 2 40.5(3332) million / 40 533 320; 1(a)(iii) any three from: 3 fewer people to work the land; increased rural to urban migration / urban pull factor; less land available for agriculture / growing crop / grazing livestock / farming; food shortages / reduction in, food supply / production of food; reduced profits for farmers / government; increased run off / more impermeable land / soil compaction; increased deforestation; leads to soil erosion / stated effect of deforestation e.g. flooding; 1(a)(iv) any three from: 3 basic human need / needed for stated human example e.g. cleaning / cooking; reduces disease; named disease; reduces, number of days workers cannot work / productivity; reduces poverty / money not spent on medicines or health care; helps LEDCs become MEDCs / idea of water rich and water poor countries becoming equal; reduces conflict; 1(b)(i) (approximately) equal numbers of males and females; 2 more females, live longer OR at older age / from age 60–70 / percentage of males decreases after 60–64 / higher life expectancy for females; relevant quoted comparative data for a single bar e.g. more males in 40–49 / both increase 15–9 to 45–49 / both decrease 45–49 to 95–99; 1(b)(ii) wide middle: high number of working people / high number of the economically active / higher birth rate in past; 2 narrow base: smaller number of young people / smaller proportion of young people / low birth rate / less people born each year; 1(b)(iii) any two from: 2 increases number of, children born / young dependents / increases birth rate; population increases / overpopulation / in long term larger working population; increases number of woman who die (in child birth)
Q2 · The bar chart shows the average monthly precipitation over one year for two locations…
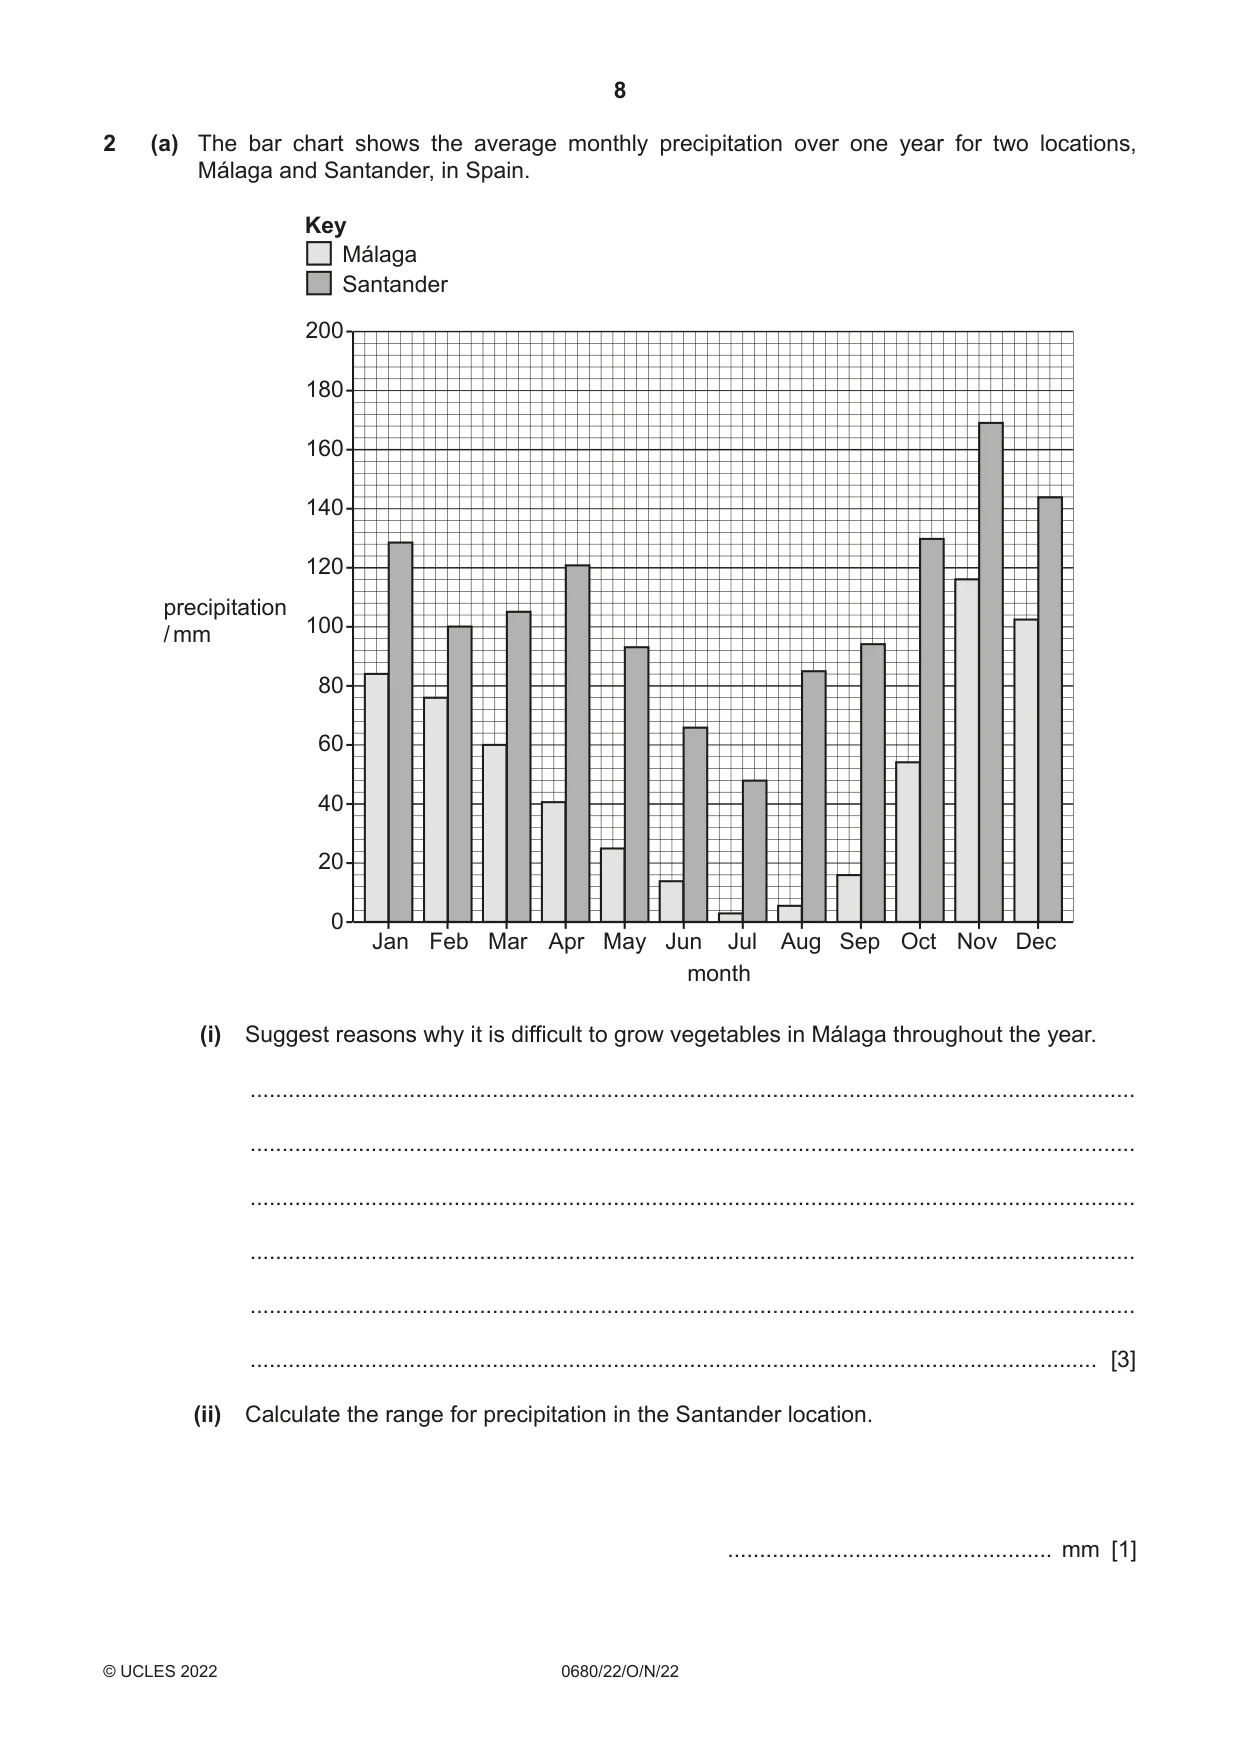
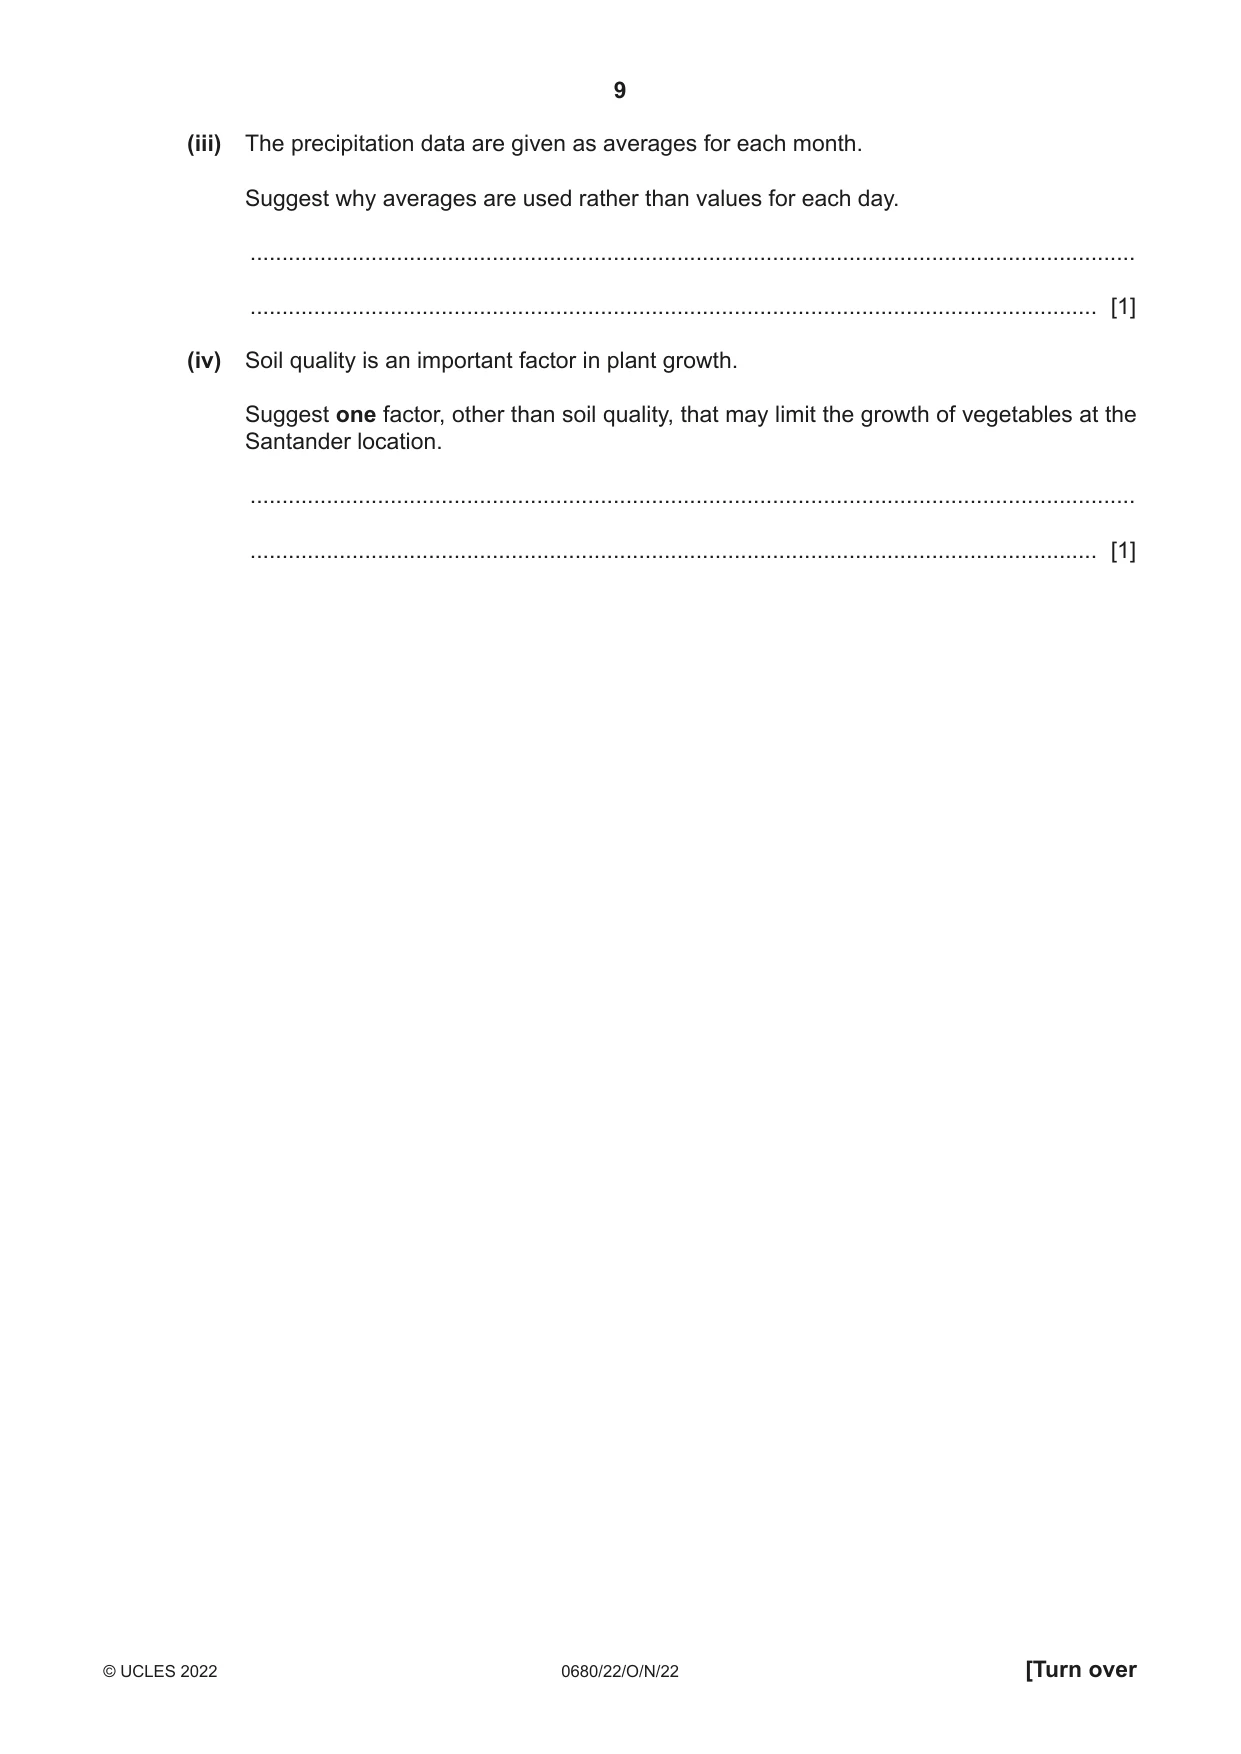
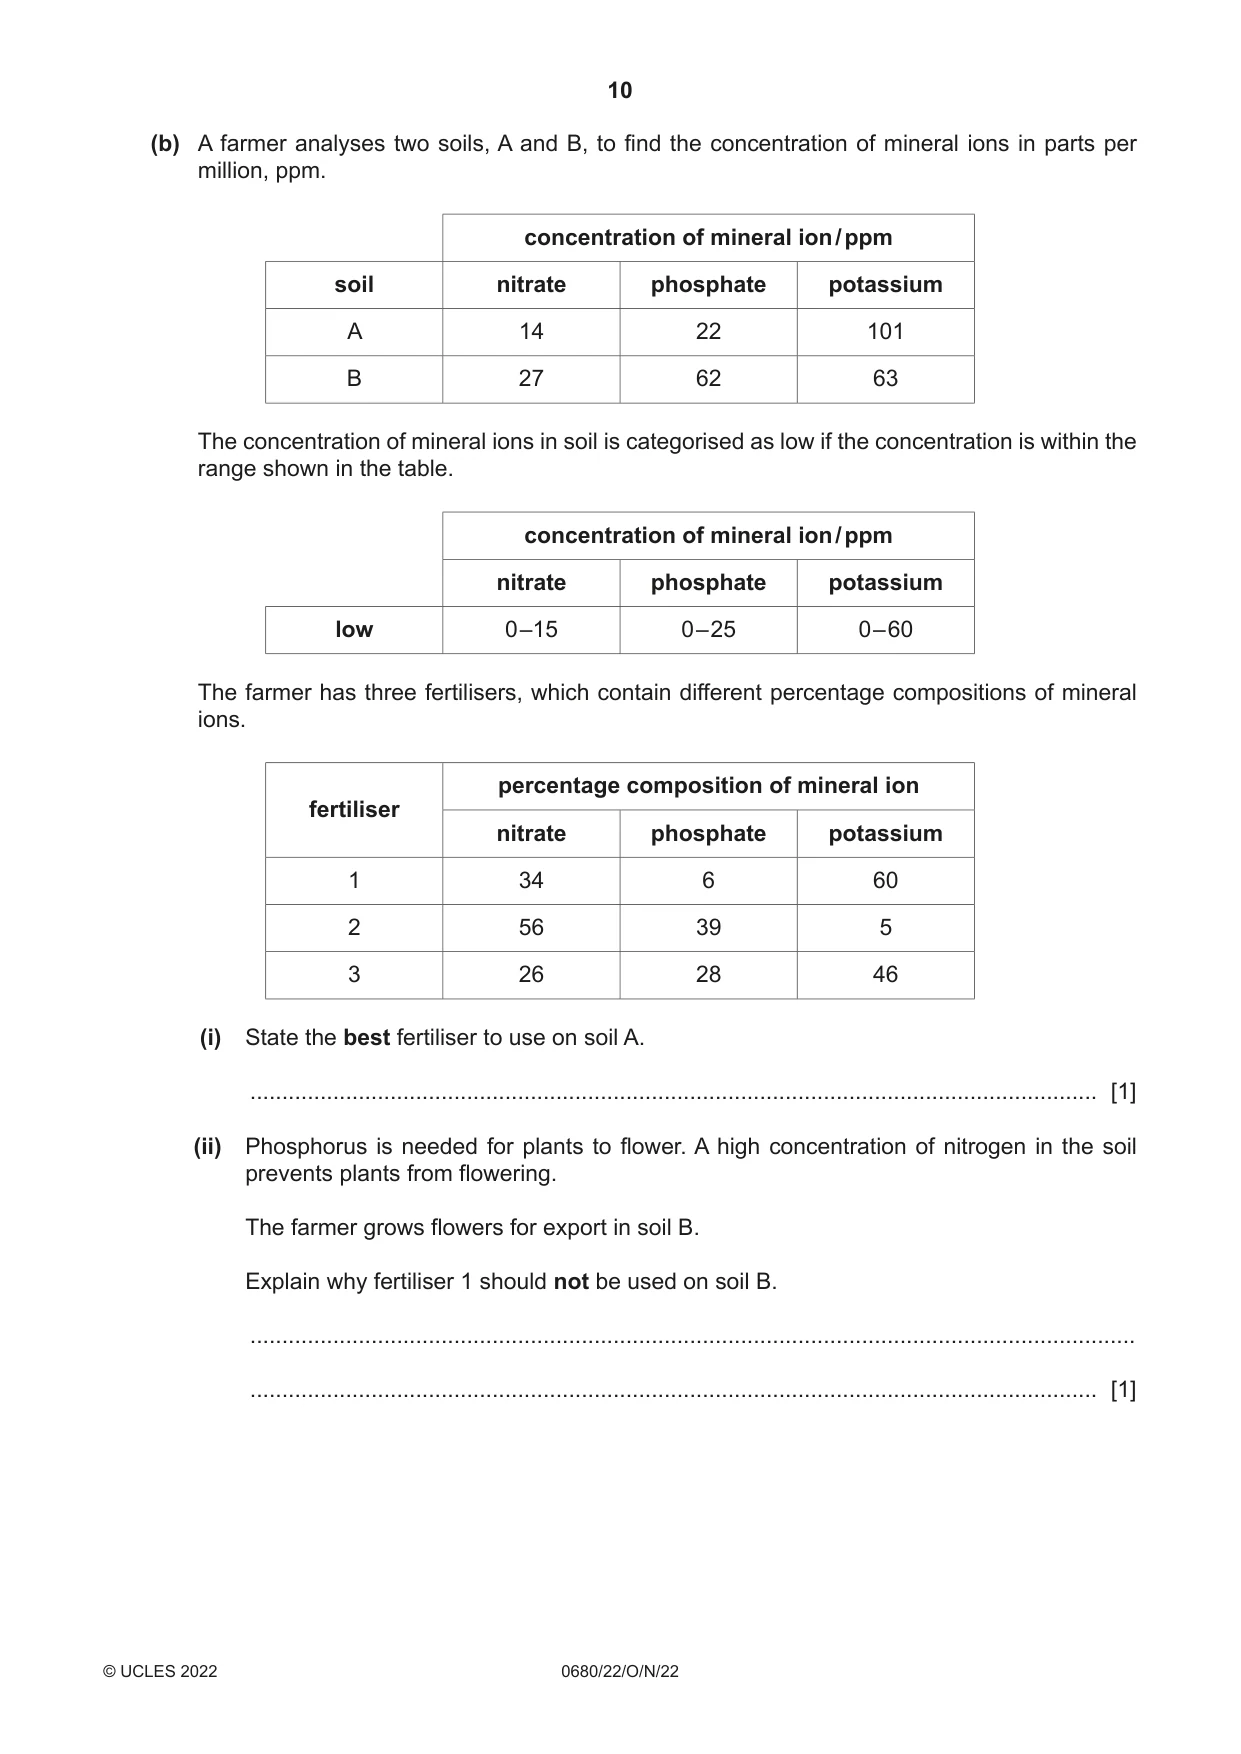
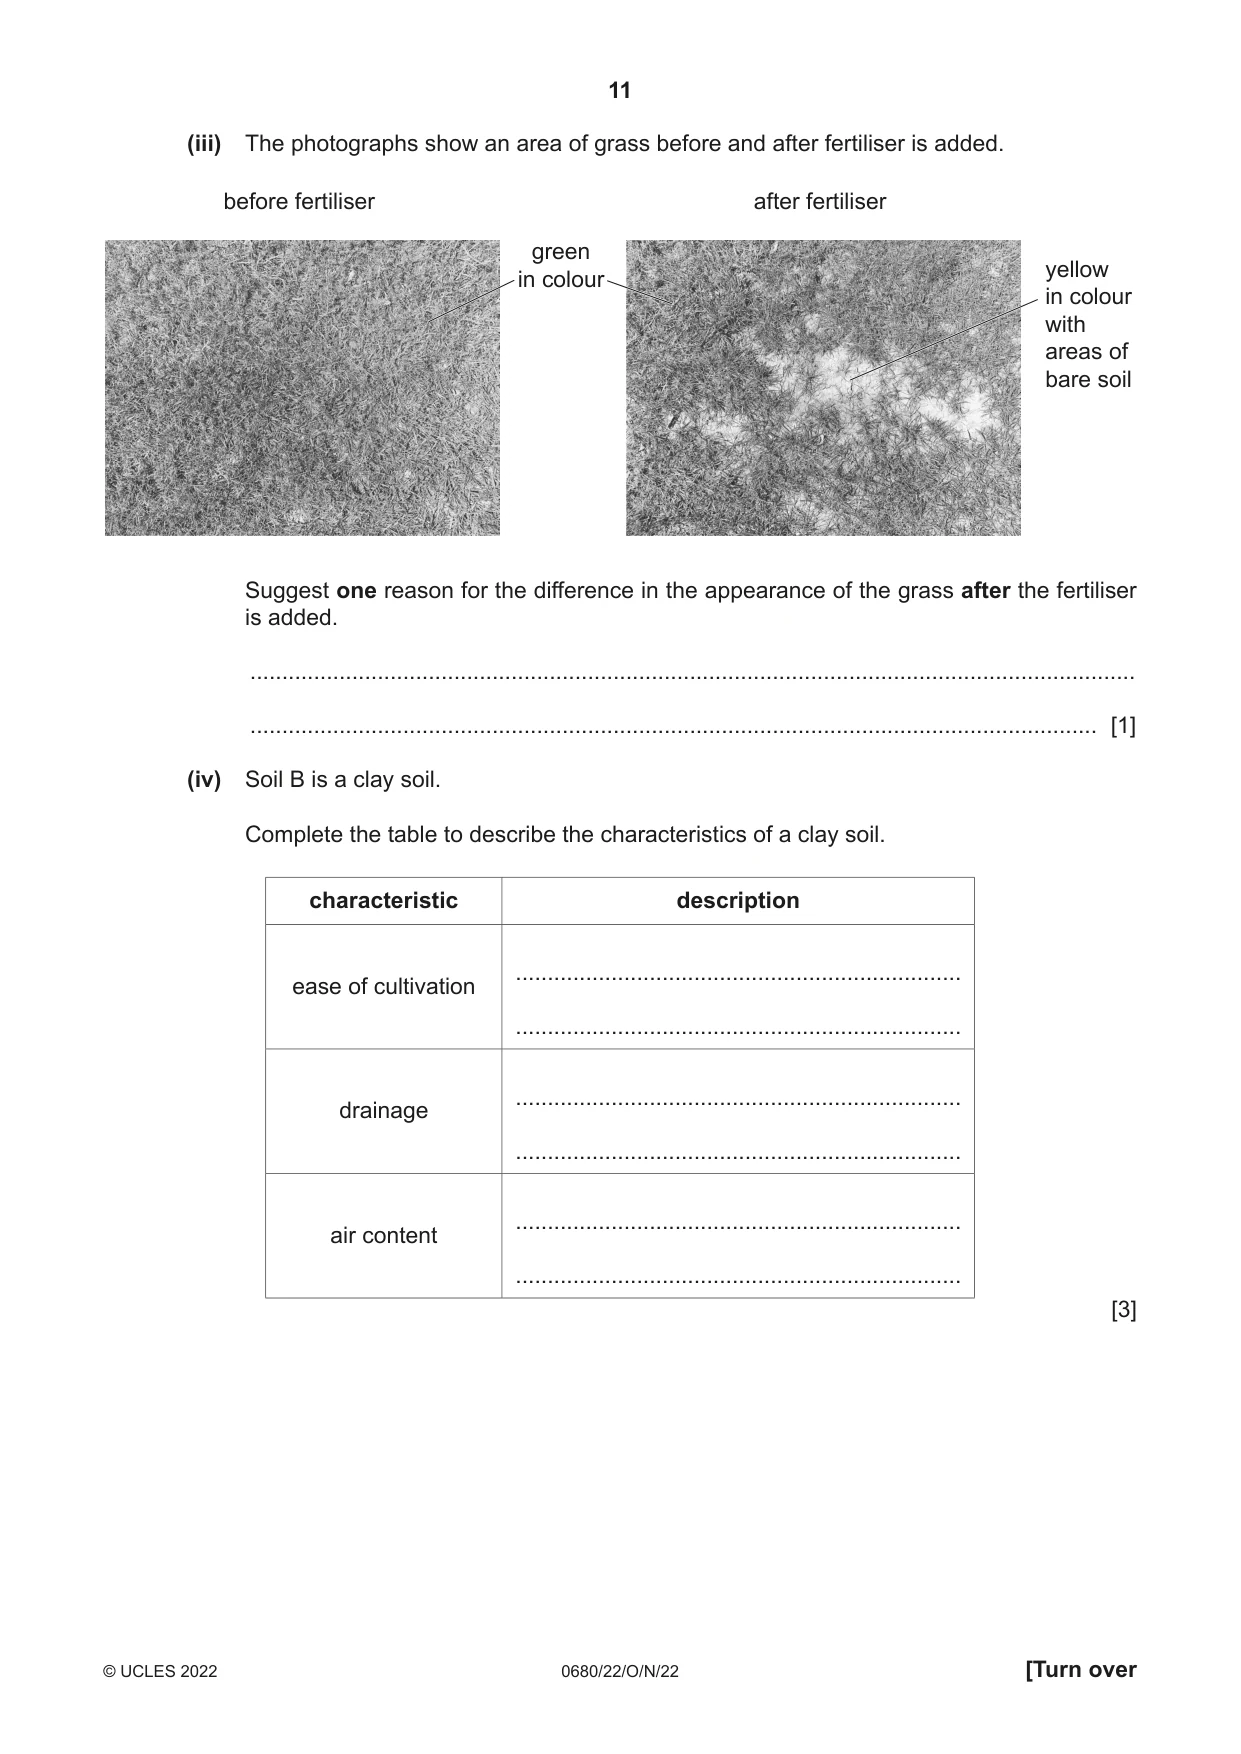
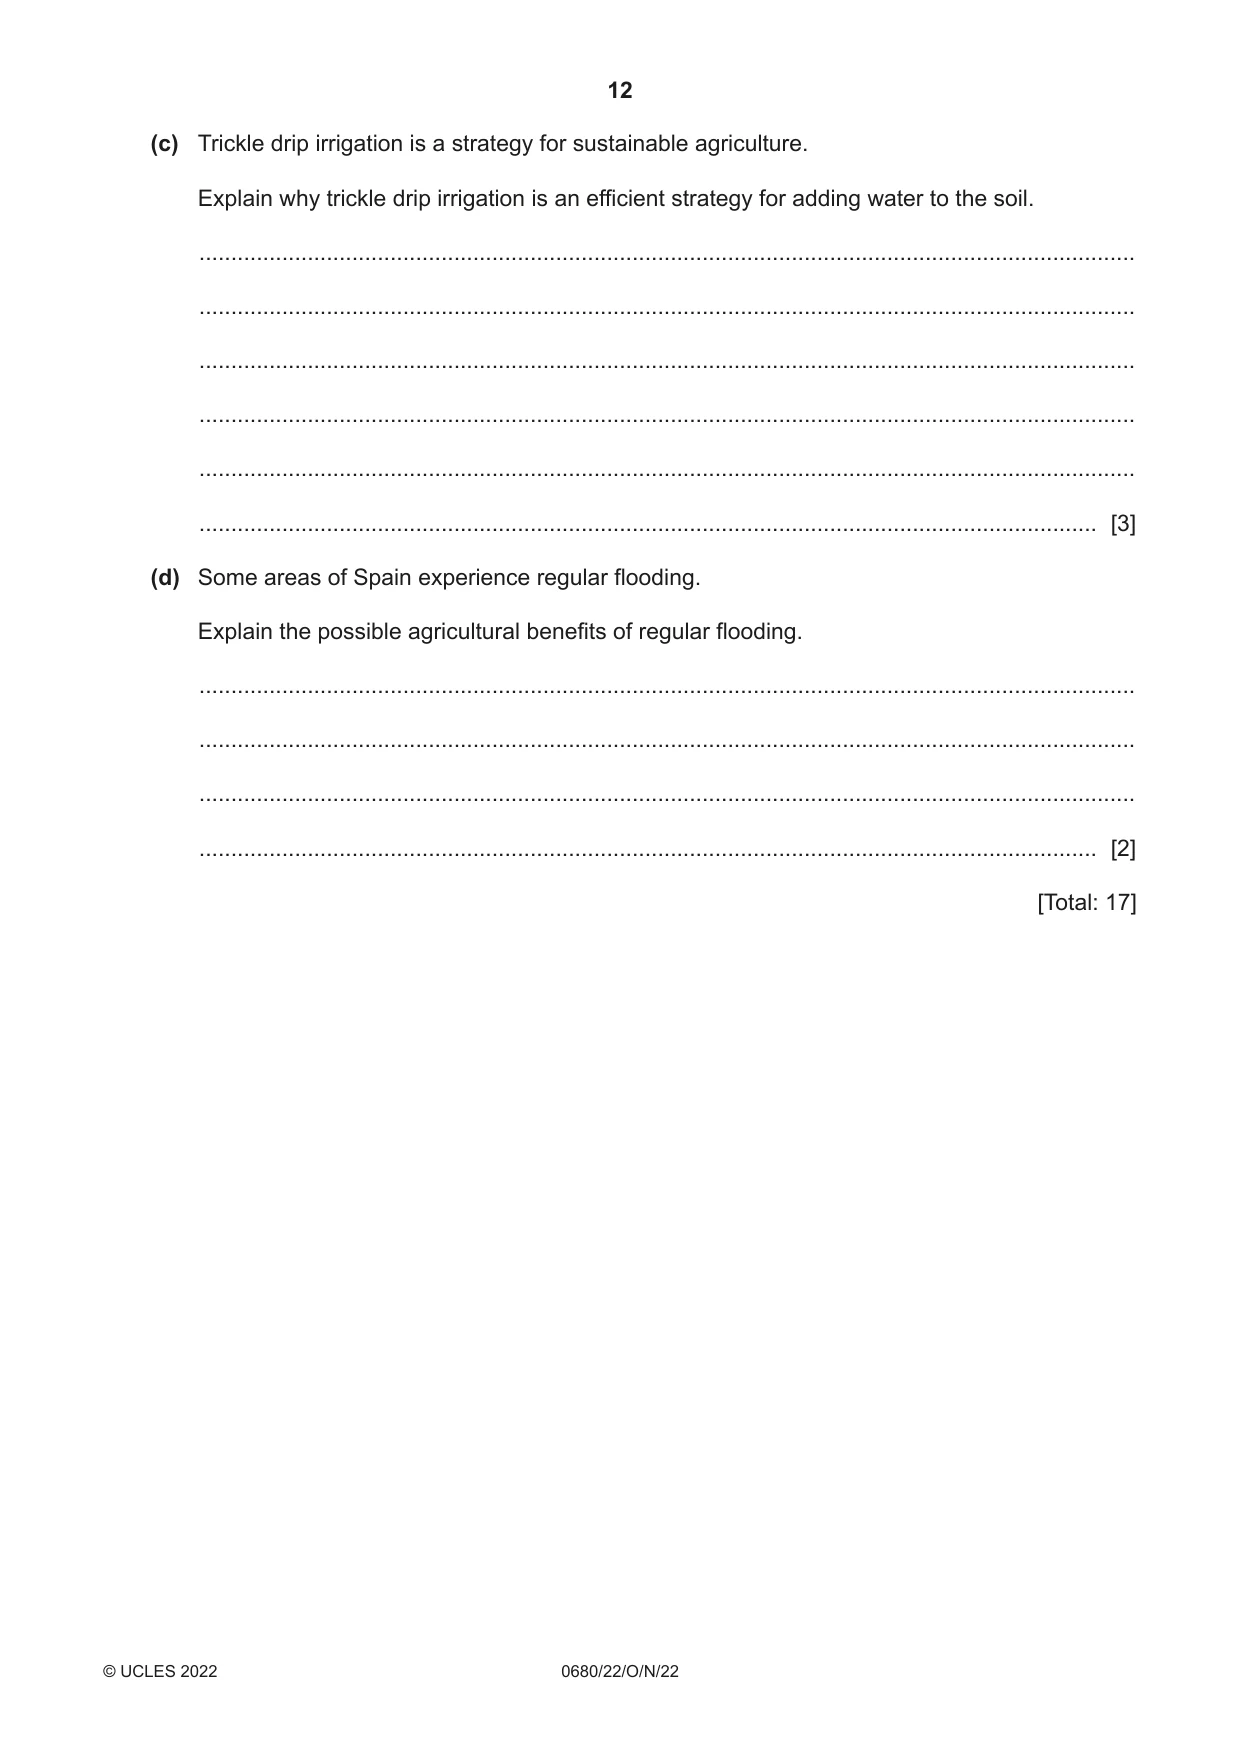
2 (a) The bar chart shows the average monthly precipitation over one year for two locations, Málaga and Santander, in Spain. Key Málaga Santander 200 180 160 140 120 precipitation 100 / mm 80 60 40 20 0 Jan Feb Mar Apr May Jun Jul Aug Sep Oct Nov Dec month (i) Suggest reasons why it is difficult to grow vegetables in Málaga throughout the year. ........................................................................................................................................... ........................................................................................................................................... ........................................................................................................................................... ........................................................................................................................................... ........................................................................................................................................... ..................................................................................................................................... [3] (ii) Calculate the range for precipitation in the Santander location. ................................................... mm [1] (iii) The precipitation data are given as averages for each month. Suggest why averages are used rather than values for each day. ........................................................................................................................................... ..................................................................................................................................... [1] (iv) Soil quality is an important factor in plant growth. Suggest one factor, other than soil quality, that may limit the growth of vegetables at the Santander location. ........................................................................................................................................... ..................................................................................................................................... [1] (b) A farmer analyses two soils, A and B, to find the concentration of mineral ions in parts per million, ppm. concentration of mineral ion / ppm soil nitrate phosphate potassium A 14 22 101 B 27 62 63 The concentration of mineral ions in soil is categorised as low if the concentration is within the range shown in the table. concentration of mineral ion / ppm nitrate phosphate potassium low 0 –15 0 – 25 0 – 60 The farmer has three fertilisers, which contain different percentage compositions of mineral ions. percentage composition of mineral ion fertiliser nitrate phosphate potassium 1 34 6 60 2 56 39 5 3 26 28 46 (i) State the best fertiliser to use on soil A. ..................................................................................................................................... [1] (ii) Phosphorus is needed for plants to flower. A high concentration of nitrogen in the soil prevents plants from flowering. The farmer grows flowers for export in soil B. Explain why fertiliser 1 should not be used on soil B. ........................................................................................................................................... ..................................................................................................................................... [1] (iii) The photographs show an area of grass before and after fertiliser is added. before fertiliser after fertiliser green yellow in colour in colour with areas of bare soil Suggest one reason for the difference in the appearance of the grass after the fertiliser is added. ........................................................................................................................................... ..................................................................................................................................... [1] (iv) Soil B is a clay soil. Complete the table to describe the characteristics of a clay soil. characteristic description ...................................................................... ease of cultivation ...................................................................... ...................................................................... drainage ...................................................................... ...................................................................... air content ...................................................................... [3] (c) Trickle drip irrigation is a strategy for sustainable agriculture. Explain why trickle drip irrigation is an efficient strategy for adding water to the soil. ................................................................................................................................................... ................................................................................................................................................... ................................................................................................................................................... ................................................................................................................................................... ................................................................................................................................................... ............................................................................................................................................. [3] (d) Some areas of Spain experience regular flooding. Explain the possible agricultural benefits of regular flooding. ................................................................................................................................................... ................................................................................................................................................... ................................................................................................................................................... ............................................................................................................................................. [2] [Total: 17]
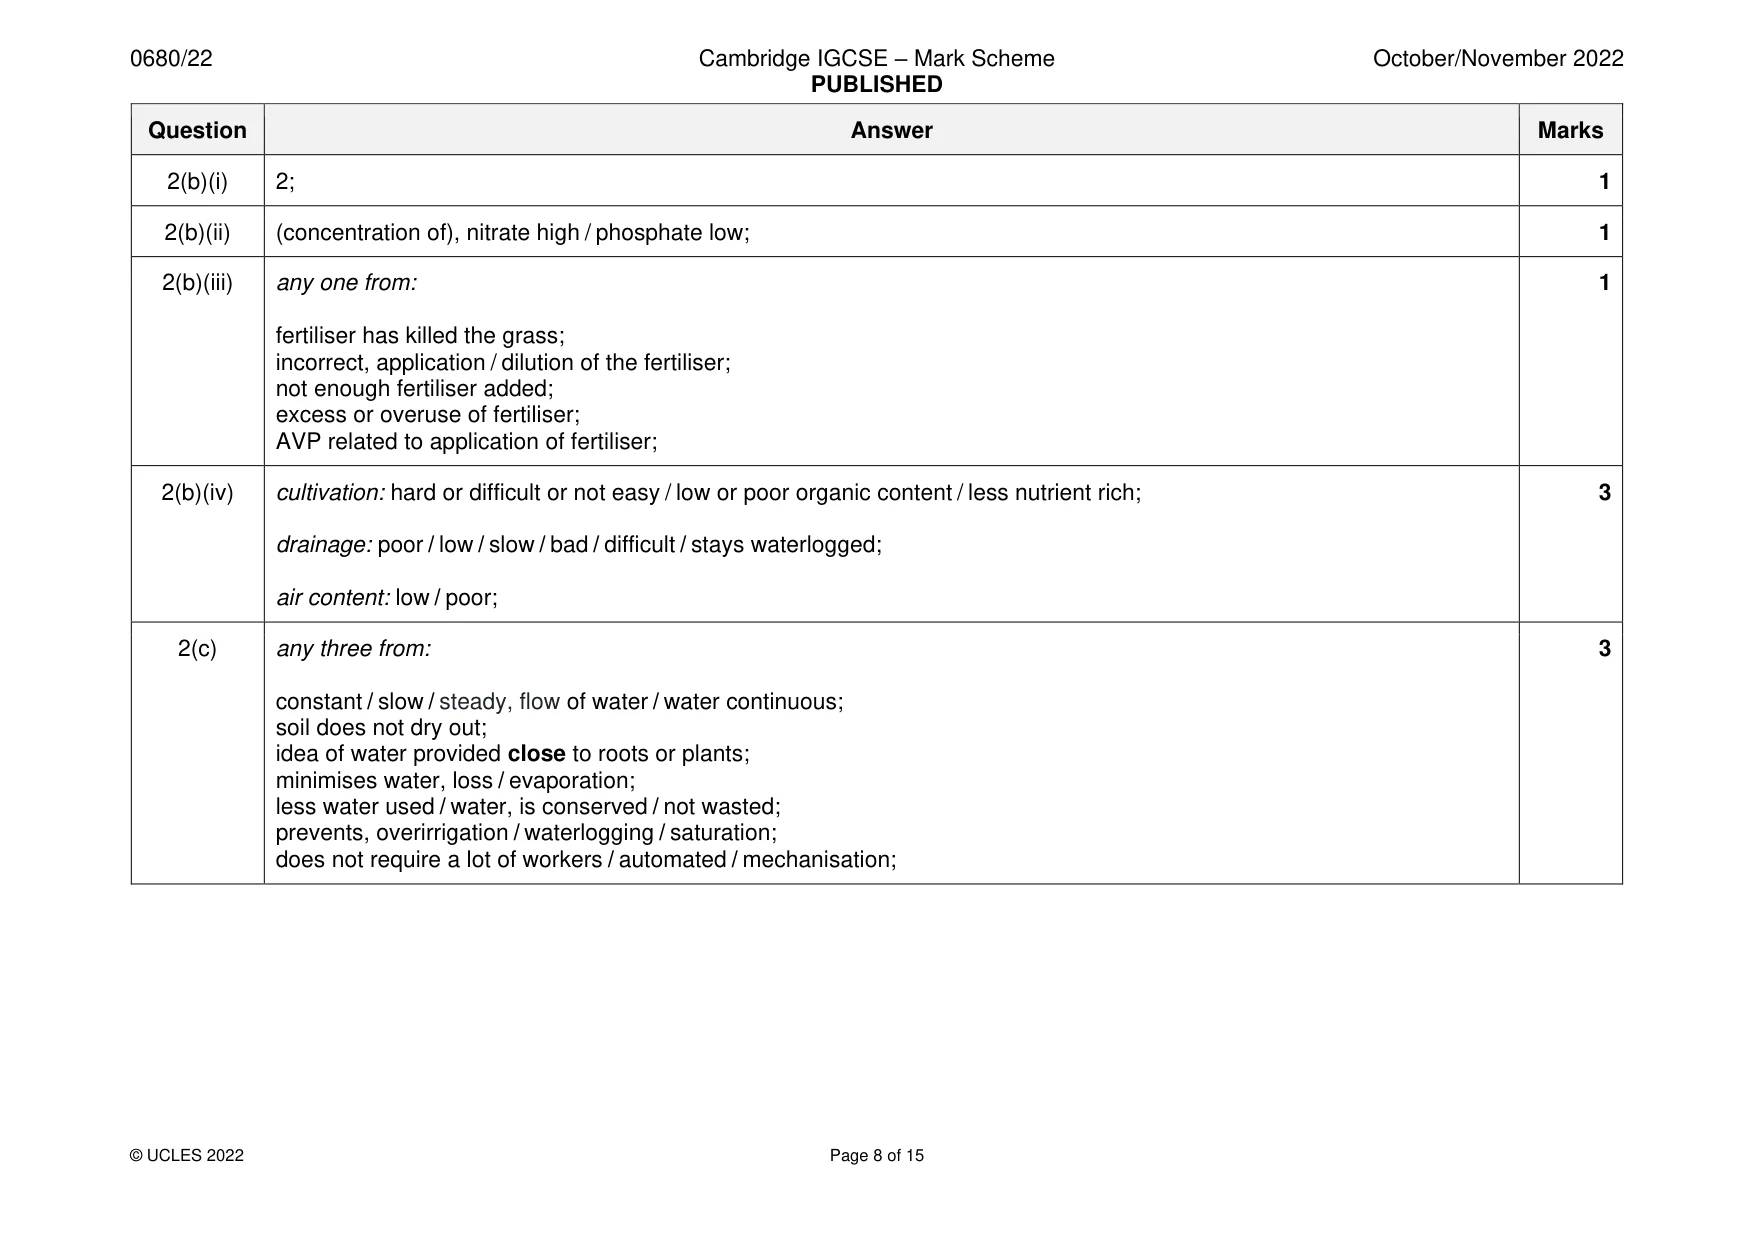
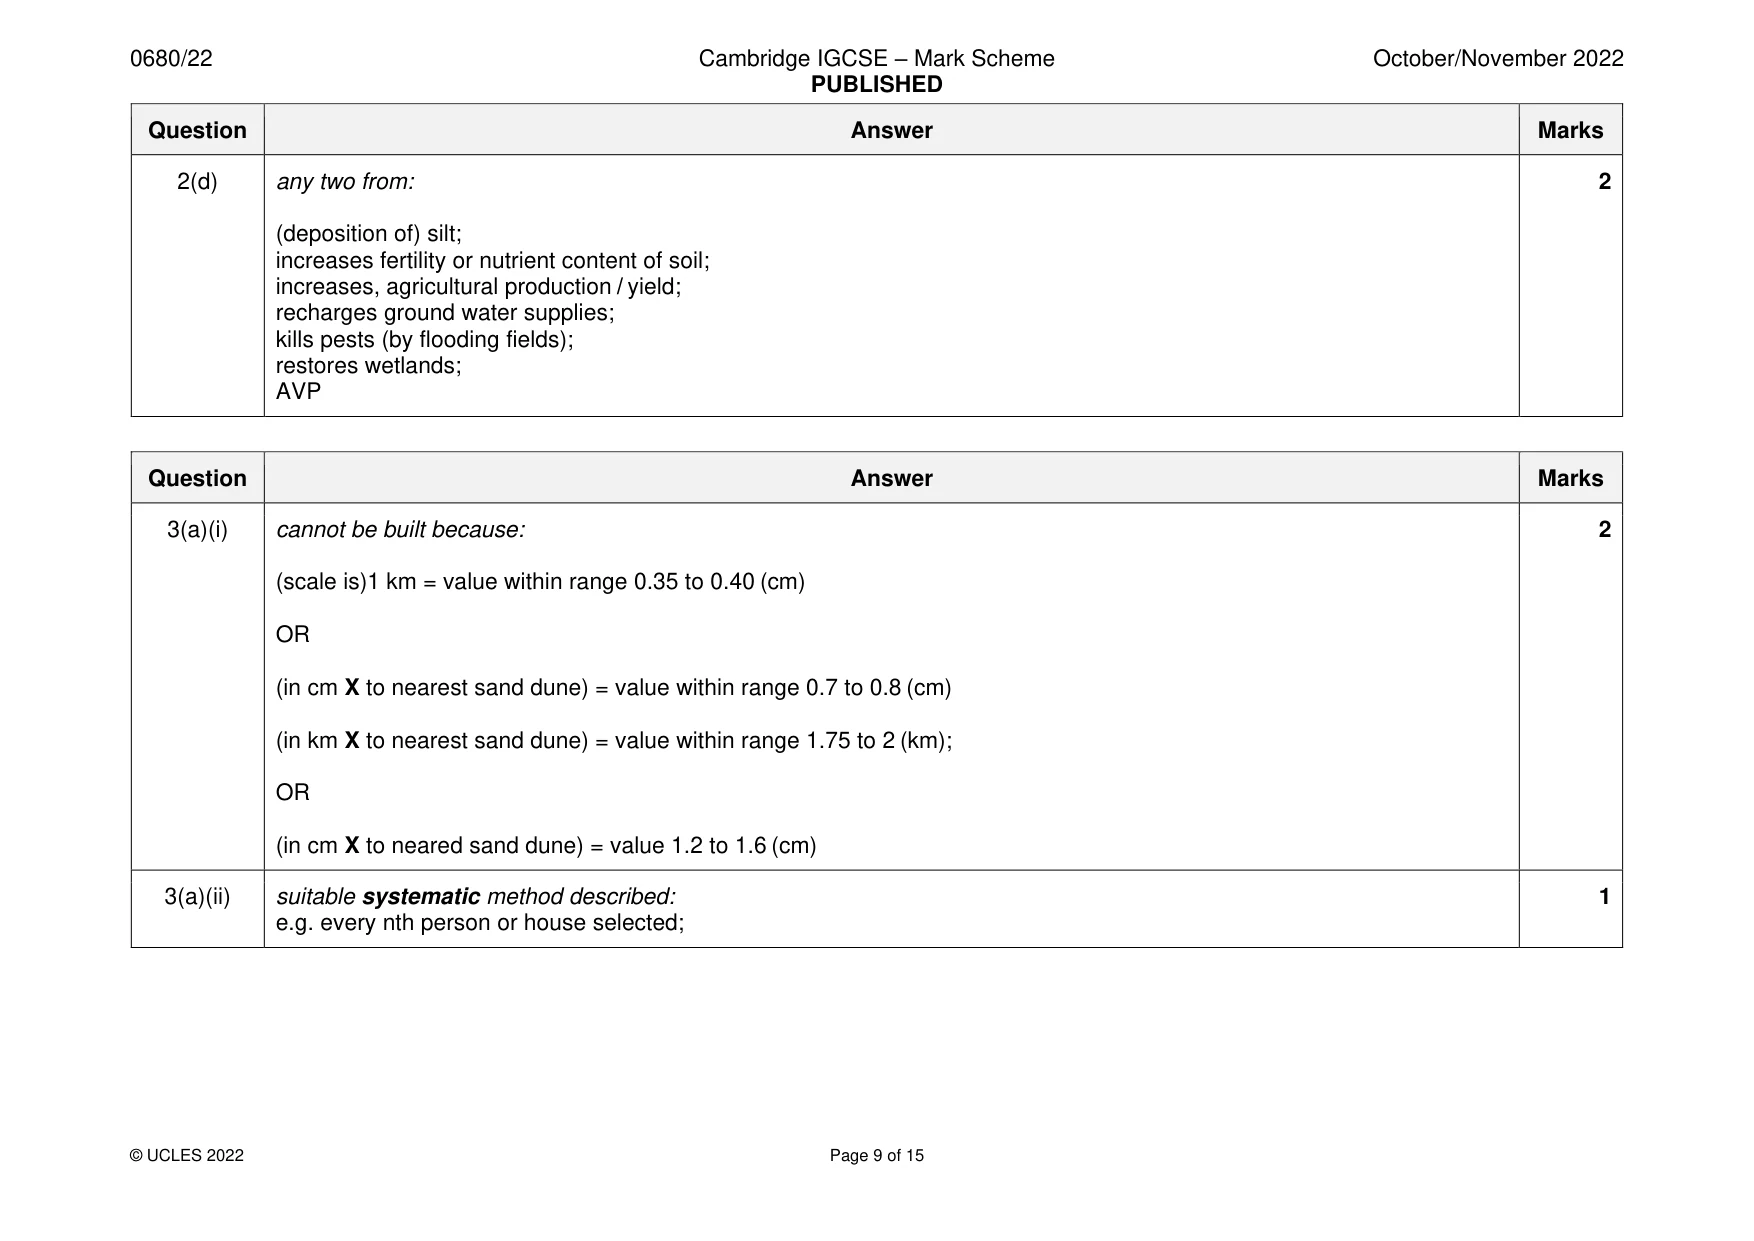
Mark scheme: 2(a)(i) any three from: 3 low(er) precipitation (June to August) / July has lowest rainfall; water needed for photosynthesis / to produce glucose; increased risk of drought / soil dries out / poor soil structure / soil erosion; 2(a)(ii) 121; 1 2(a)(iii) any one from: 1 to be representative; may not get (much) precipitation on one day; summarises a large amount of data; idea that precipitation varies; 2(a)(iv) any one from: 1 temperature; (sun)light; wind speed; rainfall / (availability of) water; pests; disease; 2(b)(i) 2; 1 2(b)(ii) (concentration of), nitrate high / phosphate low; 1 2(b)(iii) any one from: 1 fertiliser has killed the grass; incorrect, application / dilution of the fertiliser; not enough fertiliser added; excess or overuse of fertiliser; AVP related to application of fertiliser; 2(b)(iv) cultivation: hard or difficult or not easy / low or poor organic content / less nutrient rich; 3 drainage: poor / low / slow / bad / difficult / stays waterlogged; air content: low / poor; 2(c) any three from: 3 constant / slow / steady, flow of water / water continuous; soil does not dry out; idea of water provided close to roots or plants; minimises water, loss / evaporation; less water used / water, is conserved / not wasted; prevents, overirrigation / waterlogging / saturation; does not require a lot of workers / automated / mechanisation; 2(d) any two from: 2 (deposition of) silt; increases fertility or nutrient content of soil; increases, agricultural production / yield; recharges ground water supplies; kills pests (by flooding fields); restores wetlands; AVP
Q3 · A sand dune is a hill of sand
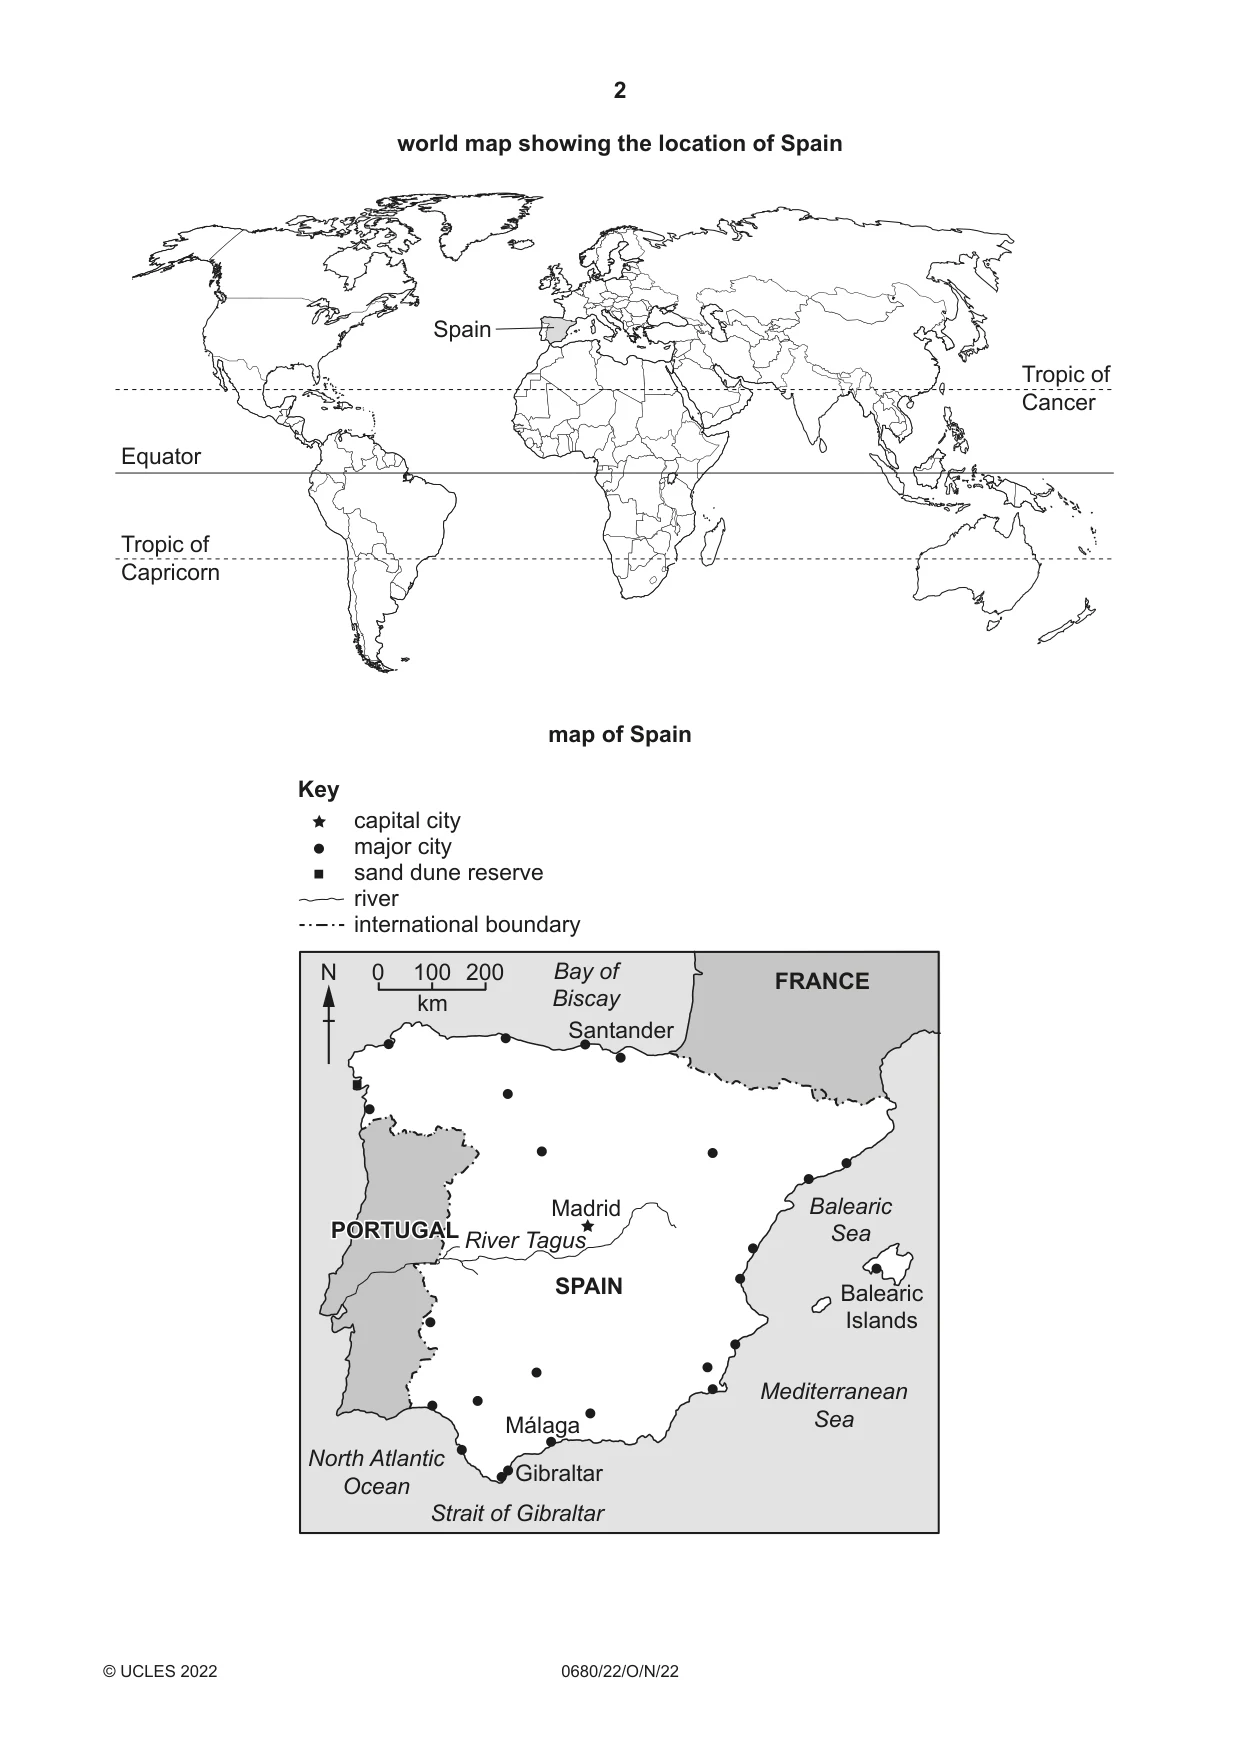
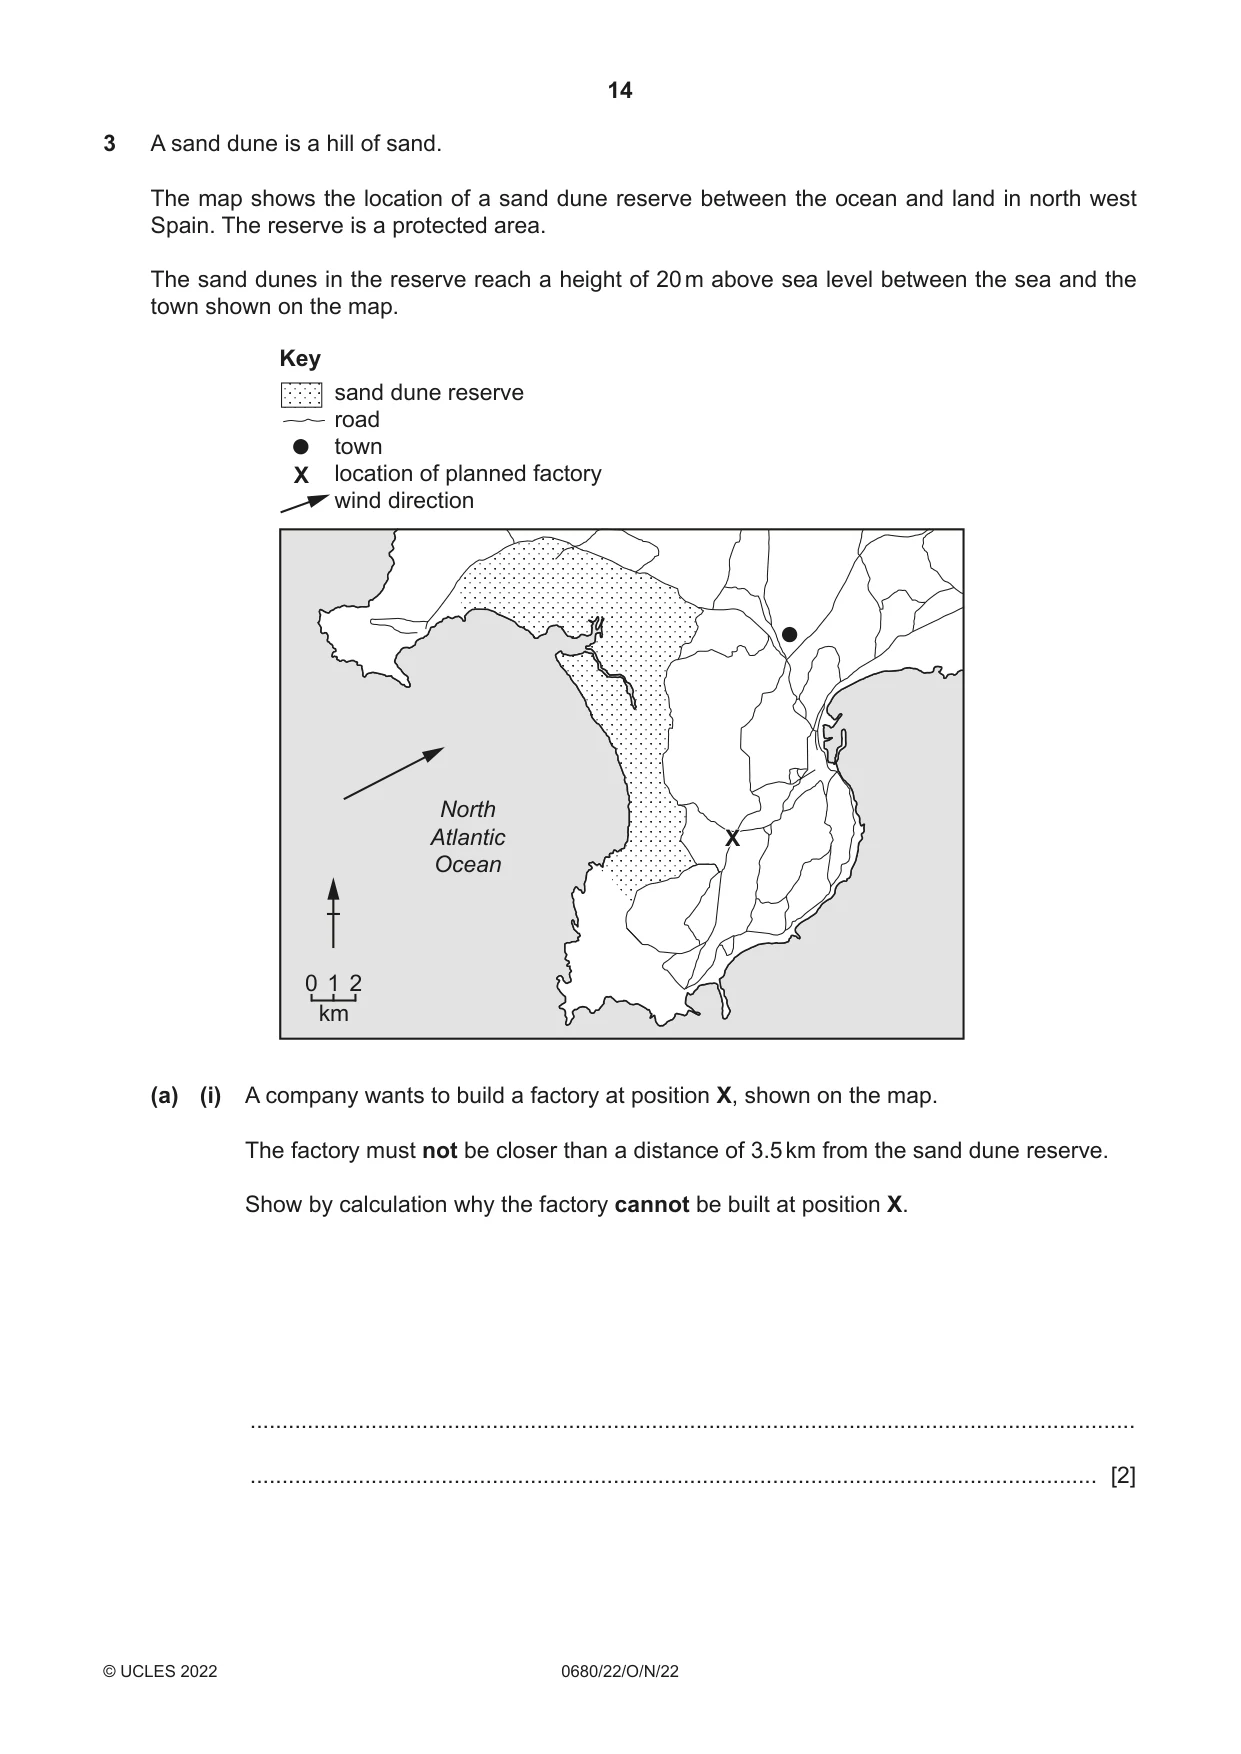
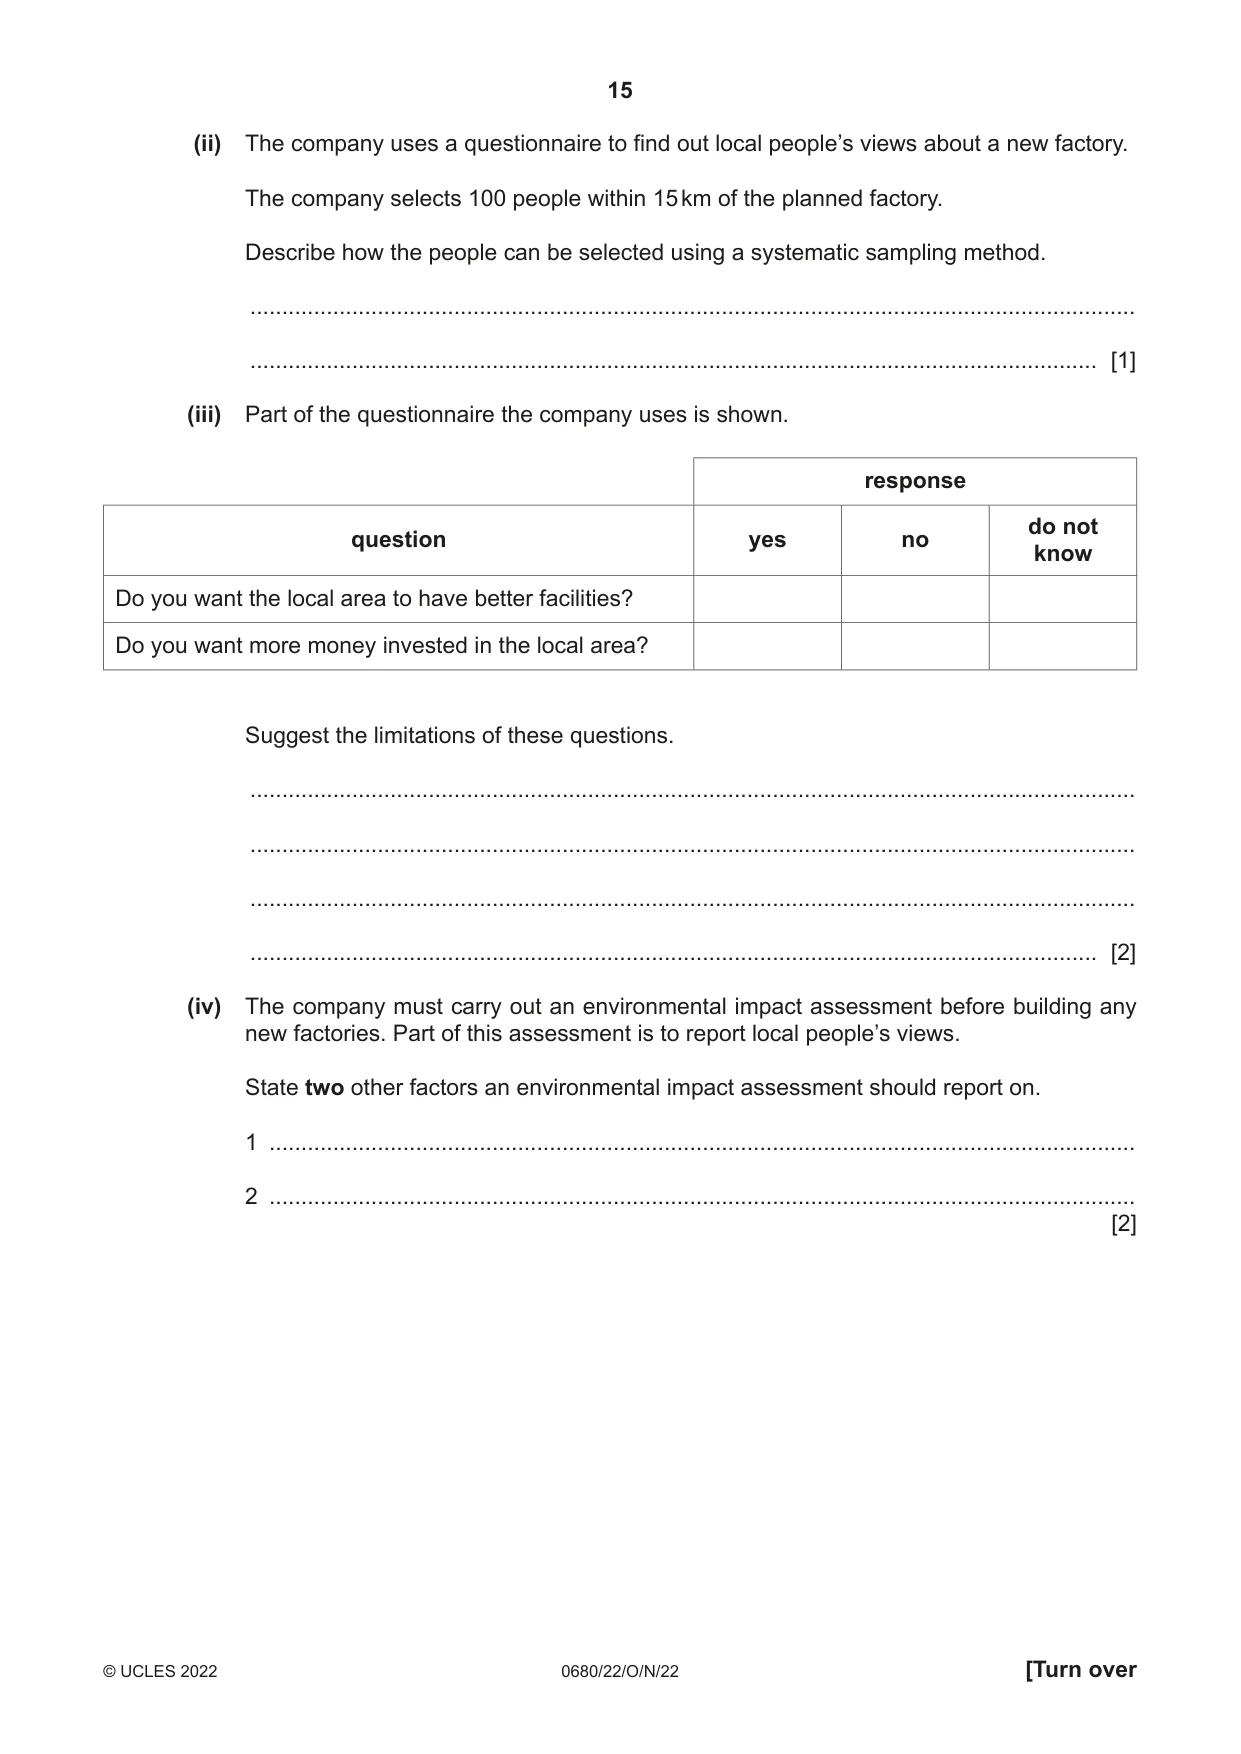
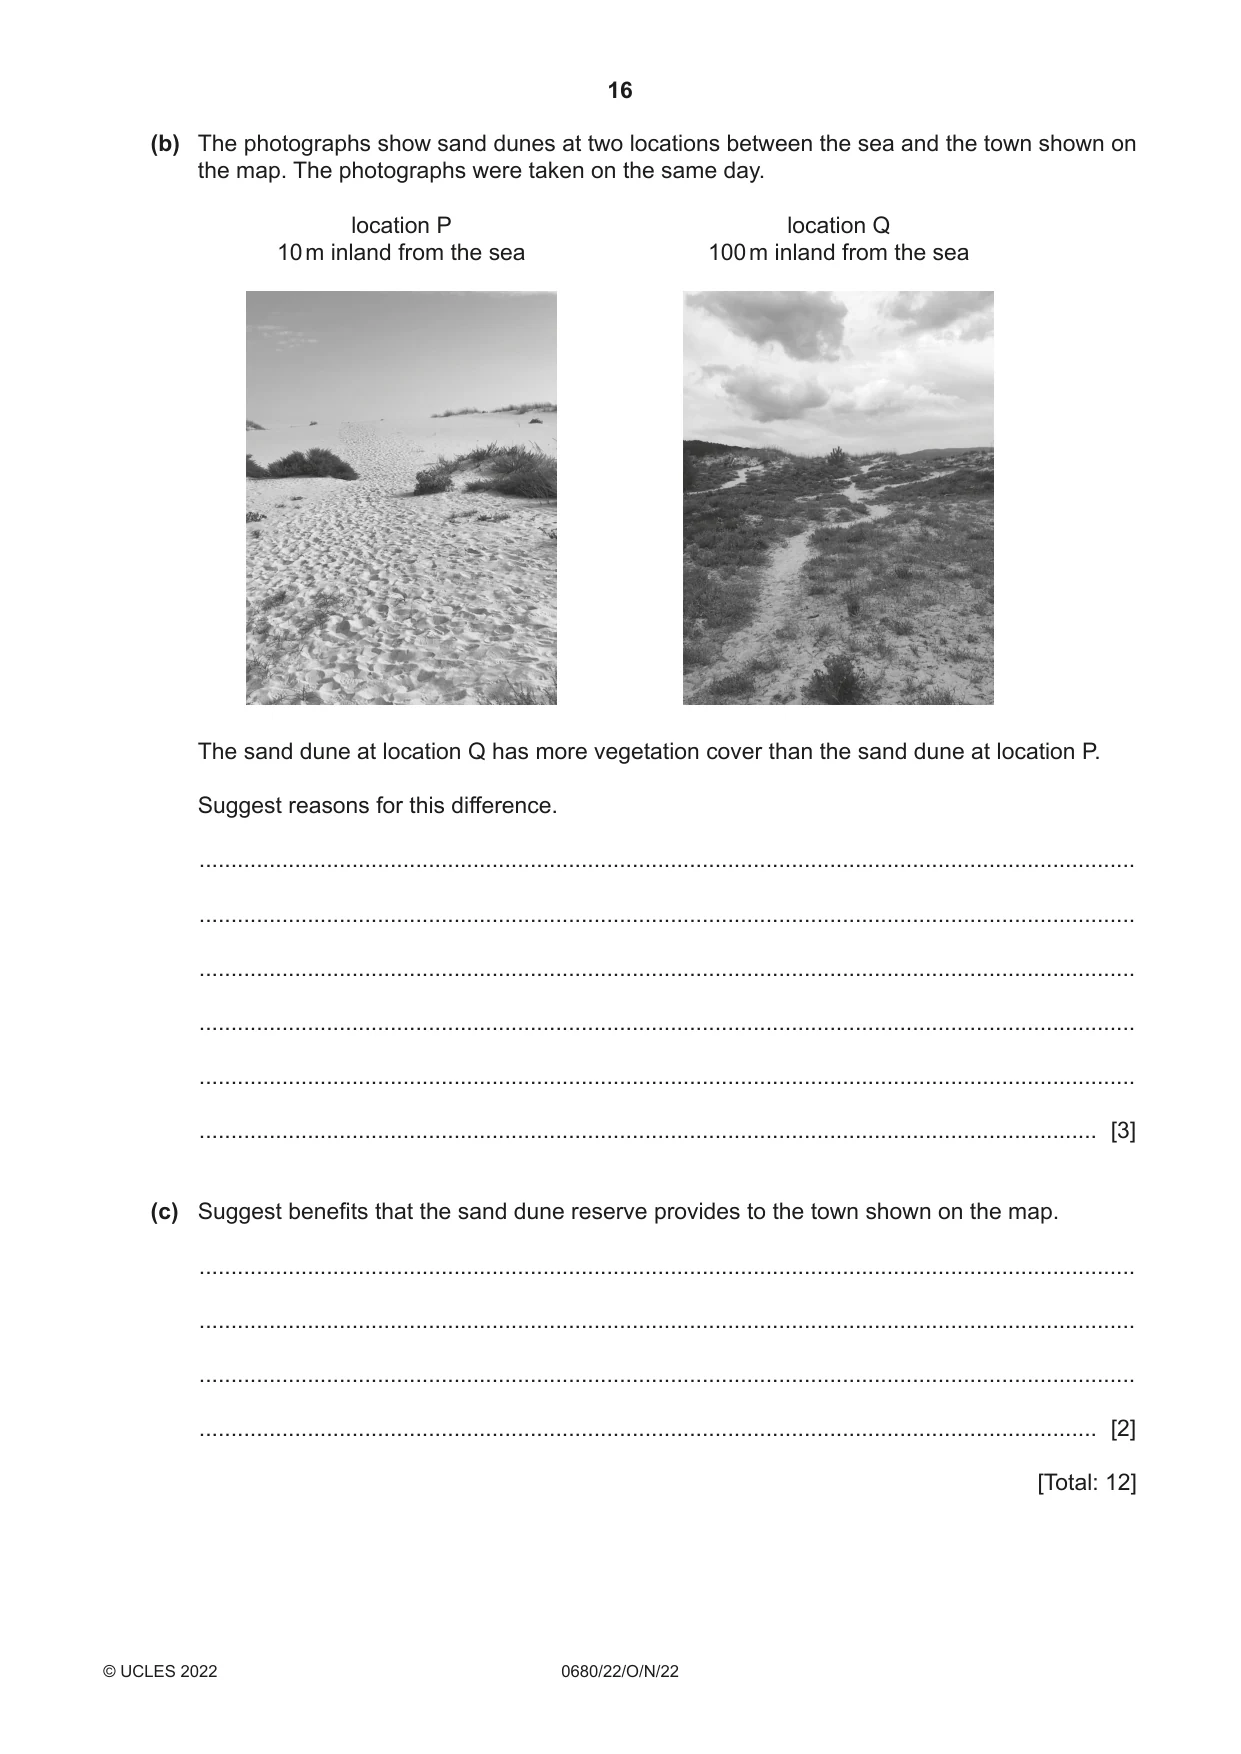
3 A sand dune is a hill of sand. The map shows the location of a sand dune reserve between the ocean and land in north west Spain. The reserve is a protected area. The sand dunes in the reserve reach a height of 20 m above sea level between the sea and the town shown on the map. Key sand dune reserve road town X location of planned factory wind direction North Atlantic XX Ocean 0 1 2 km (a) (i) A company wants to build a factory at position X, shown on the map. The factory must not be closer than a distance of 3.5 km from the sand dune reserve. Show by calculation why the factory cannot be built at position X. ........................................................................................................................................... ..................................................................................................................................... [2] (ii) The company uses a questionnaire to find out local people’s views about a new factory. The company selects 100 people within 15 km of the planned factory. Describe how the people can be selected using a systematic sampling method. ........................................................................................................................................... ..................................................................................................................................... [1] (iii) Part of the questionnaire the company uses is shown. response do not question yes no know Do you want the local area to have better facilities? Do you want more money invested in the local area? Suggest the limitations of these questions. ........................................................................................................................................... ........................................................................................................................................... ........................................................................................................................................... ..................................................................................................................................... [2] (iv) The company must carry out an environmental impact assessment before building any new factories. Part of this assessment is to report local people’s views. State two other factors an environmental impact assessment should report on. 1 ........................................................................................................................................ 2 ........................................................................................................................................ [2] (b) The photographs show sand dunes at two locations between the sea and the town shown on the map. The photographs were taken on the same day. location P location Q 10 m inland from the sea 100 m inland from the sea The sand dune at location Q has more vegetation cover than the sand dune at location P. Suggest reasons for this difference. ................................................................................................................................................... ................................................................................................................................................... ................................................................................................................................................... ................................................................................................................................................... ................................................................................................................................................... ............................................................................................................................................. [3] (c) Suggest benefits that the sand dune reserve provides to the town shown on the map. ................................................................................................................................................... ................................................................................................................................................... ................................................................................................................................................... ............................................................................................................................................. [2] [Total: 12]
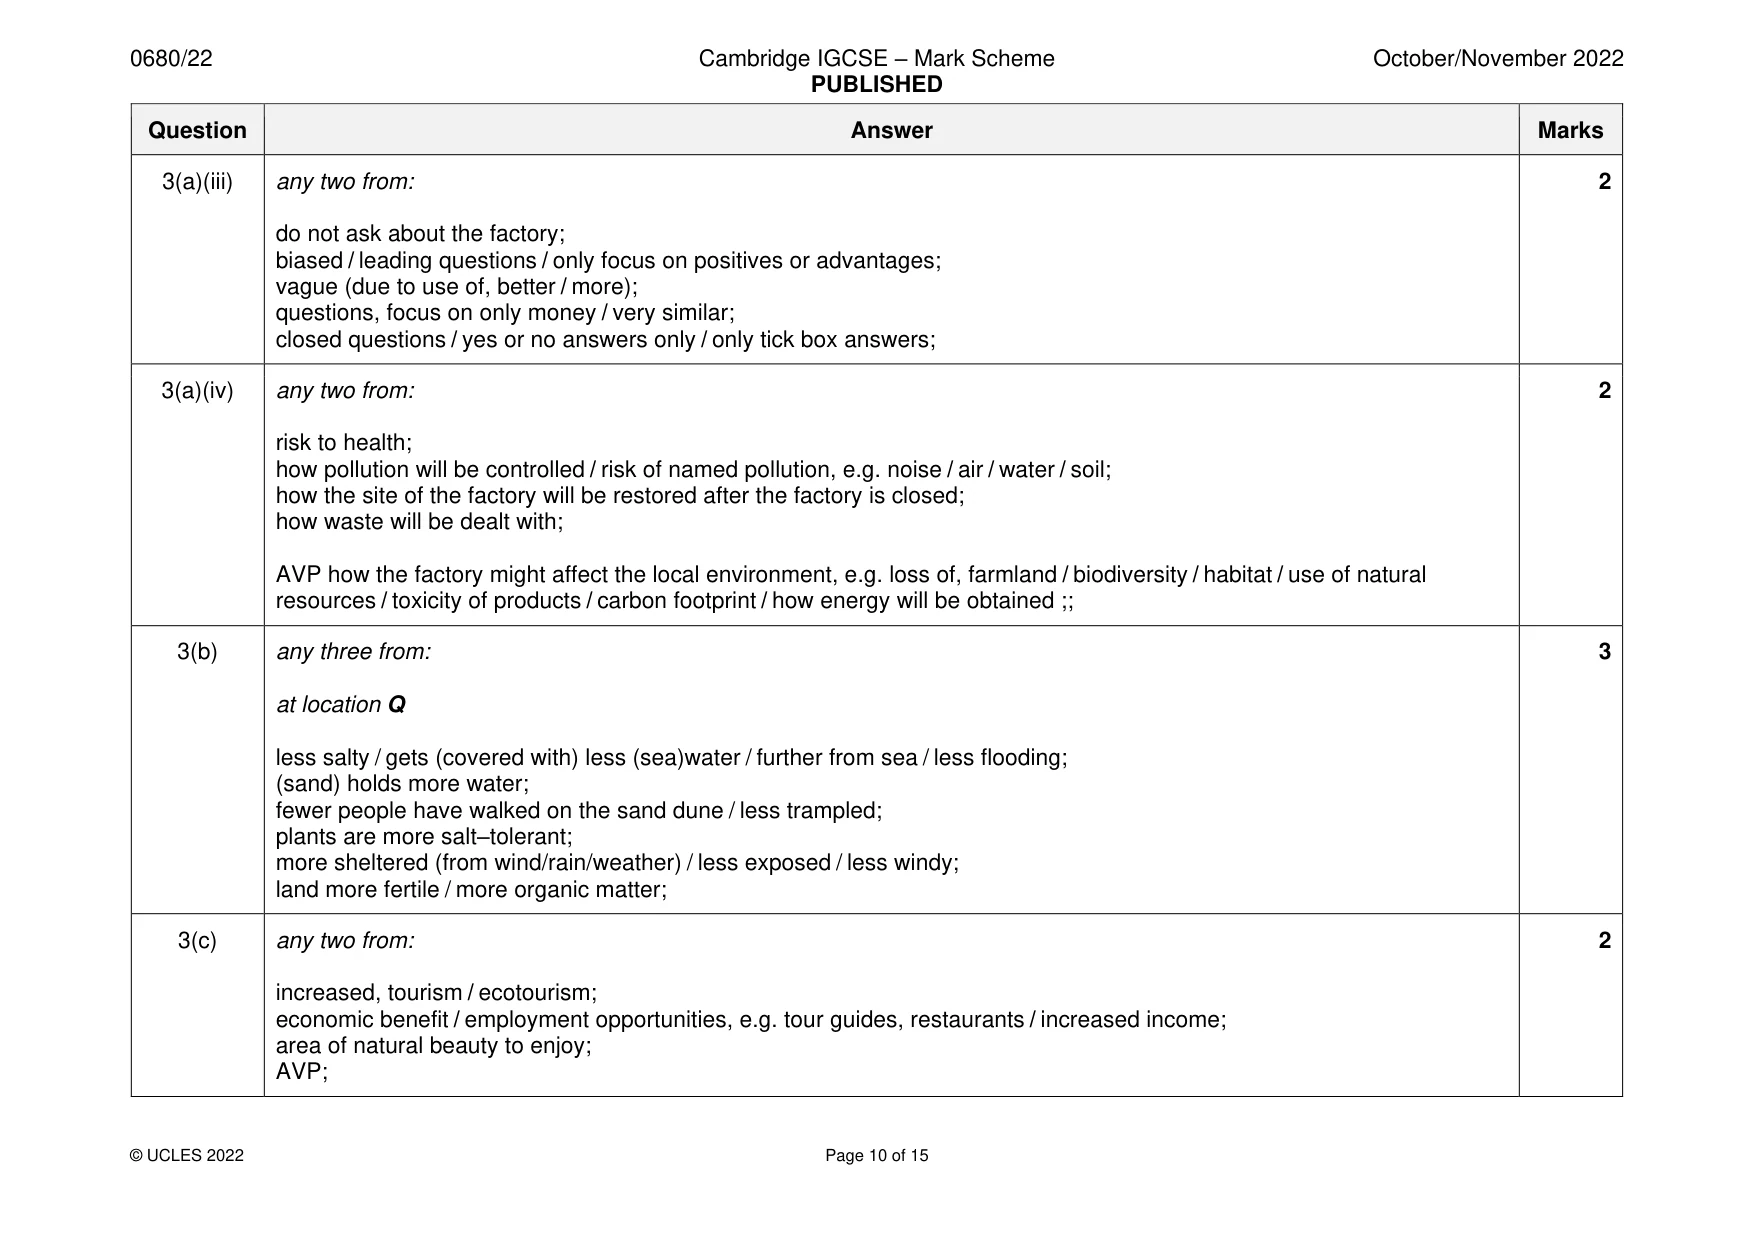
Mark scheme: 3(a)(i) cannot be built because: 2 (scale is)1 km = value within range 0.35 to 0.40 (cm) OR (in cm X to nearest sand dune) = value within range 0.7 to 0.8 (cm) (in km X to nearest sand dune) = value within range 1.75 to 2 (km); OR (in cm X to neared sand dune) = value 1.2 to 1.6 (cm) 3(a)(ii) suitable systematic method described: 1 e.g. every nth person or house selected; 3(a)(iii) any two from: 2 do not ask about the factory; biased / leading questions / only focus on positives or advantages; vague (due to use of, better / more); questions, focus on only money / very similar; closed questions / yes or no answers only / only tick box answers; 3(a)(iv) any two from: 2 risk to health; how pollution will be controlled / risk of named pollution, e.g. noise / air / water / soil; how the site of the factory will be restored after the factory is closed; how waste will be dealt with; AVP how the factory might affect the local environment, e.g. loss of, farmland / biodiversity / habitat / use of natural resources / toxicity of products / carbon footprint / how energy will be obtained ;; 3(b) any three from: 3 at location Q less salty / gets (covered with) less (sea)water / further from sea / less flooding; (sand) holds more water; fewer people have walked on the sand dune / less trampled; plants are more salt–tolerant; more sheltered (from wind/rain/weather) / less exposed / less windy; land more fertile / more organic matter; 3(c) any two from: 2 increased, tourism / ecotourism; economic benefit / employment opportunities, e.g. tour guides, restaurants / increased income; area of natural beauty to enjoy; AVP;
Q4 · In 2019, Spain’s annual electricity consumption was 239.5 billion kWh
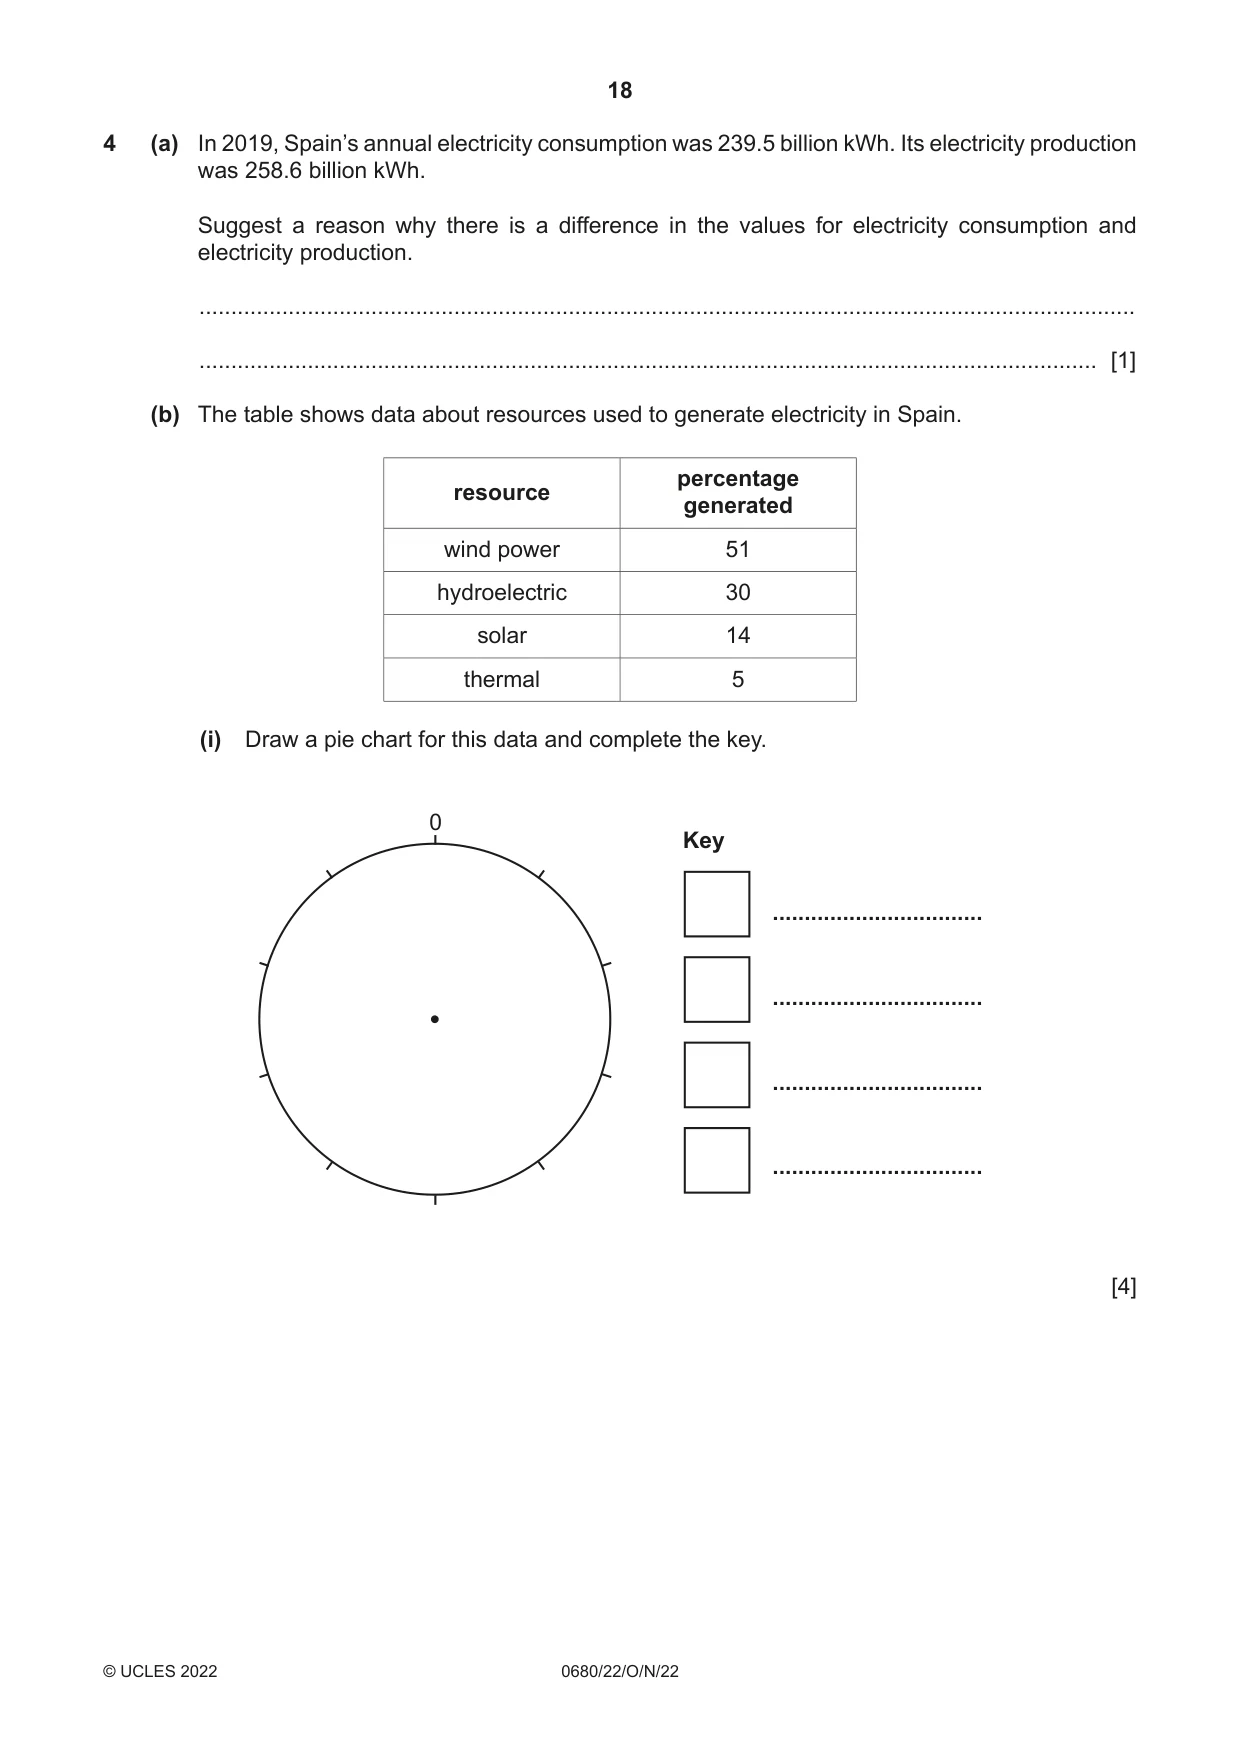
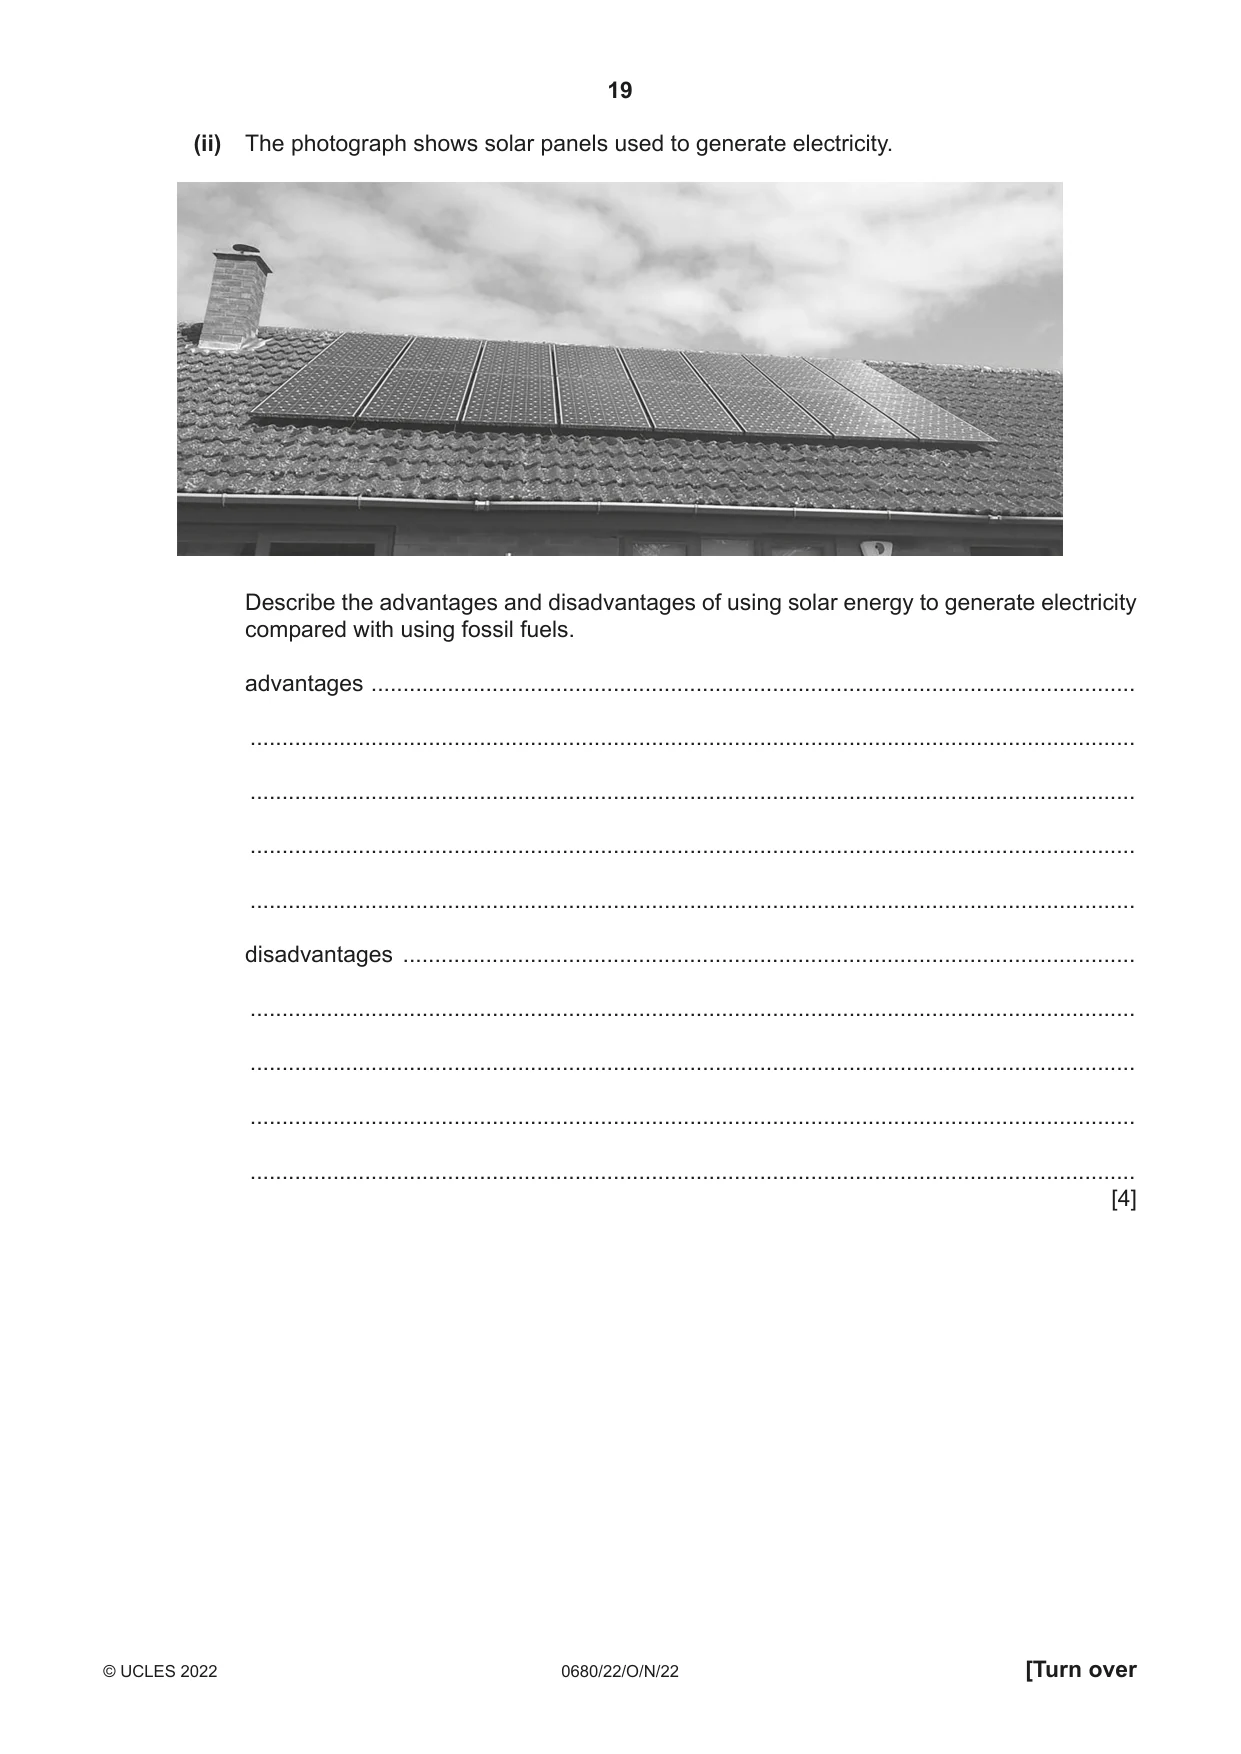
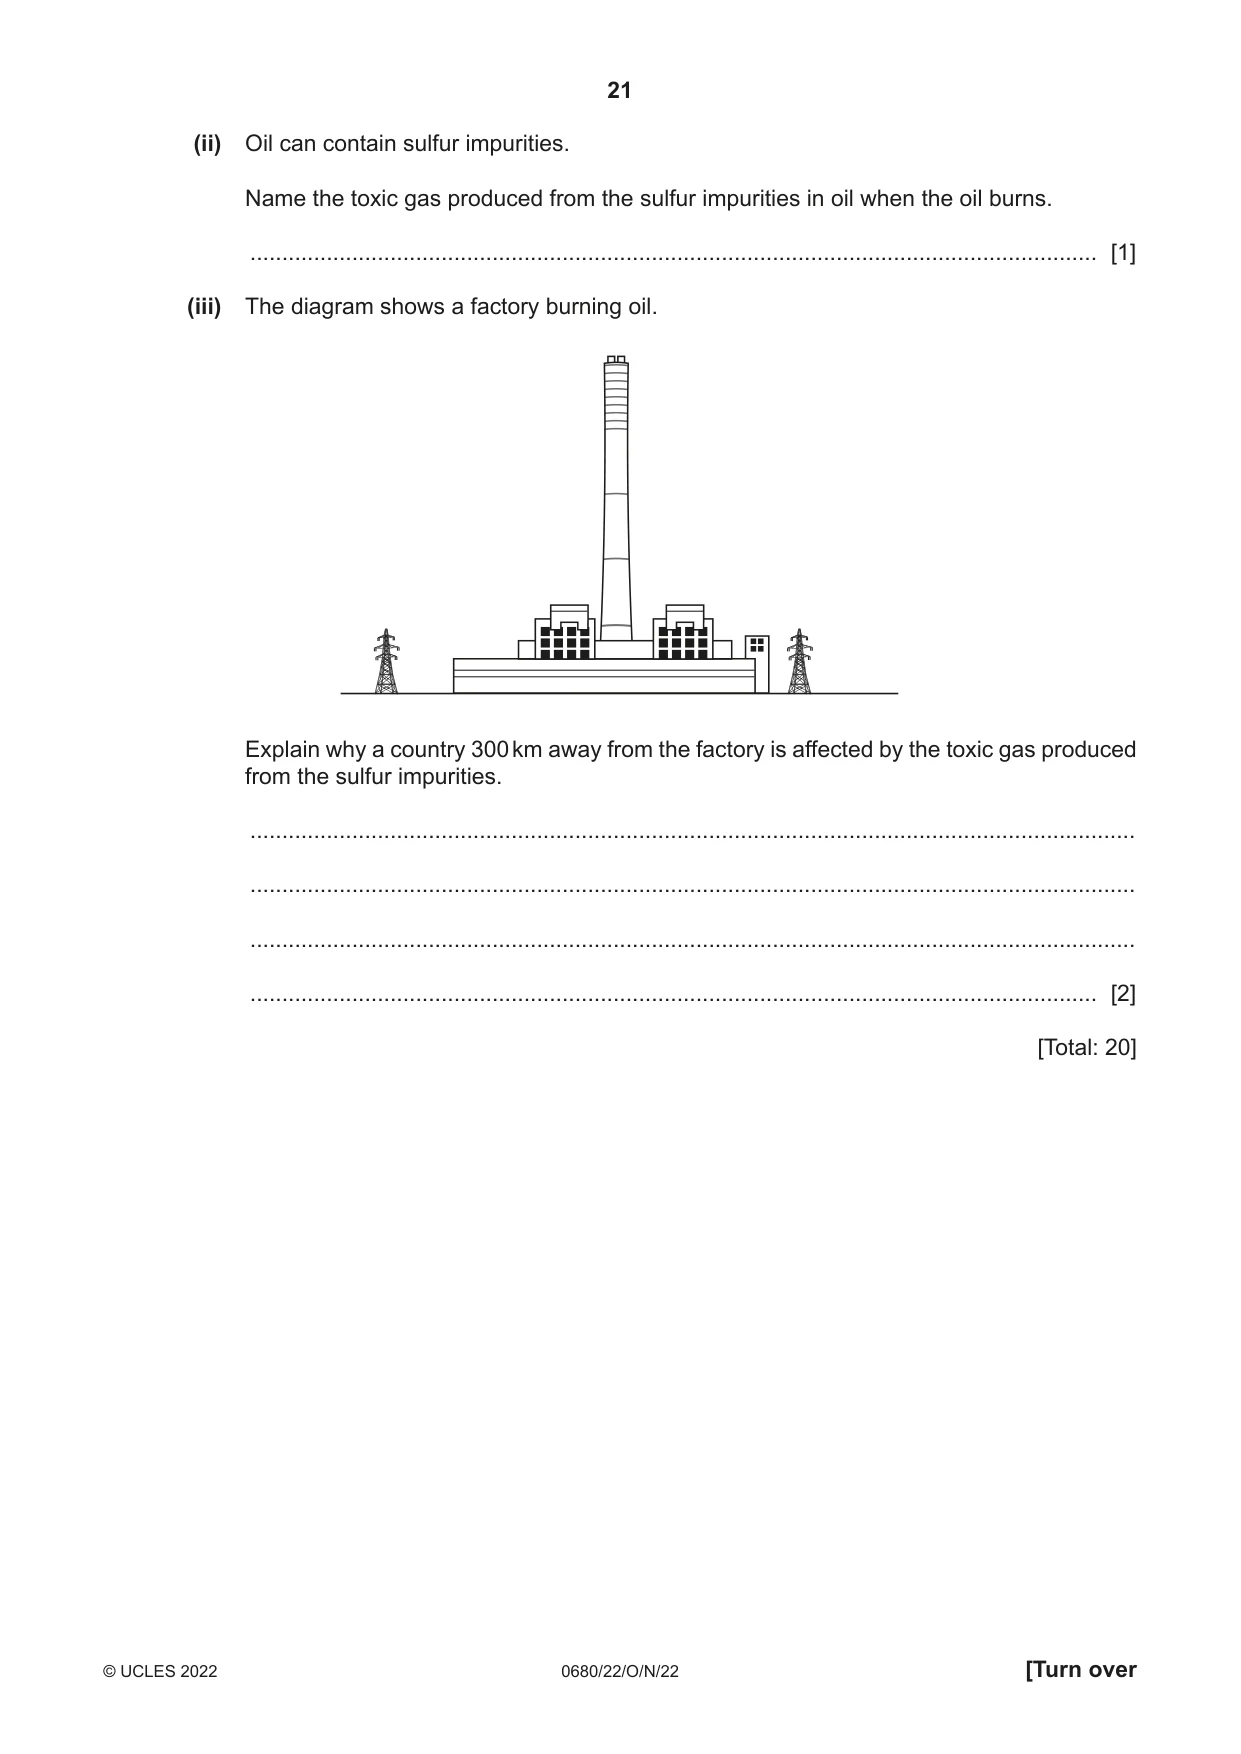
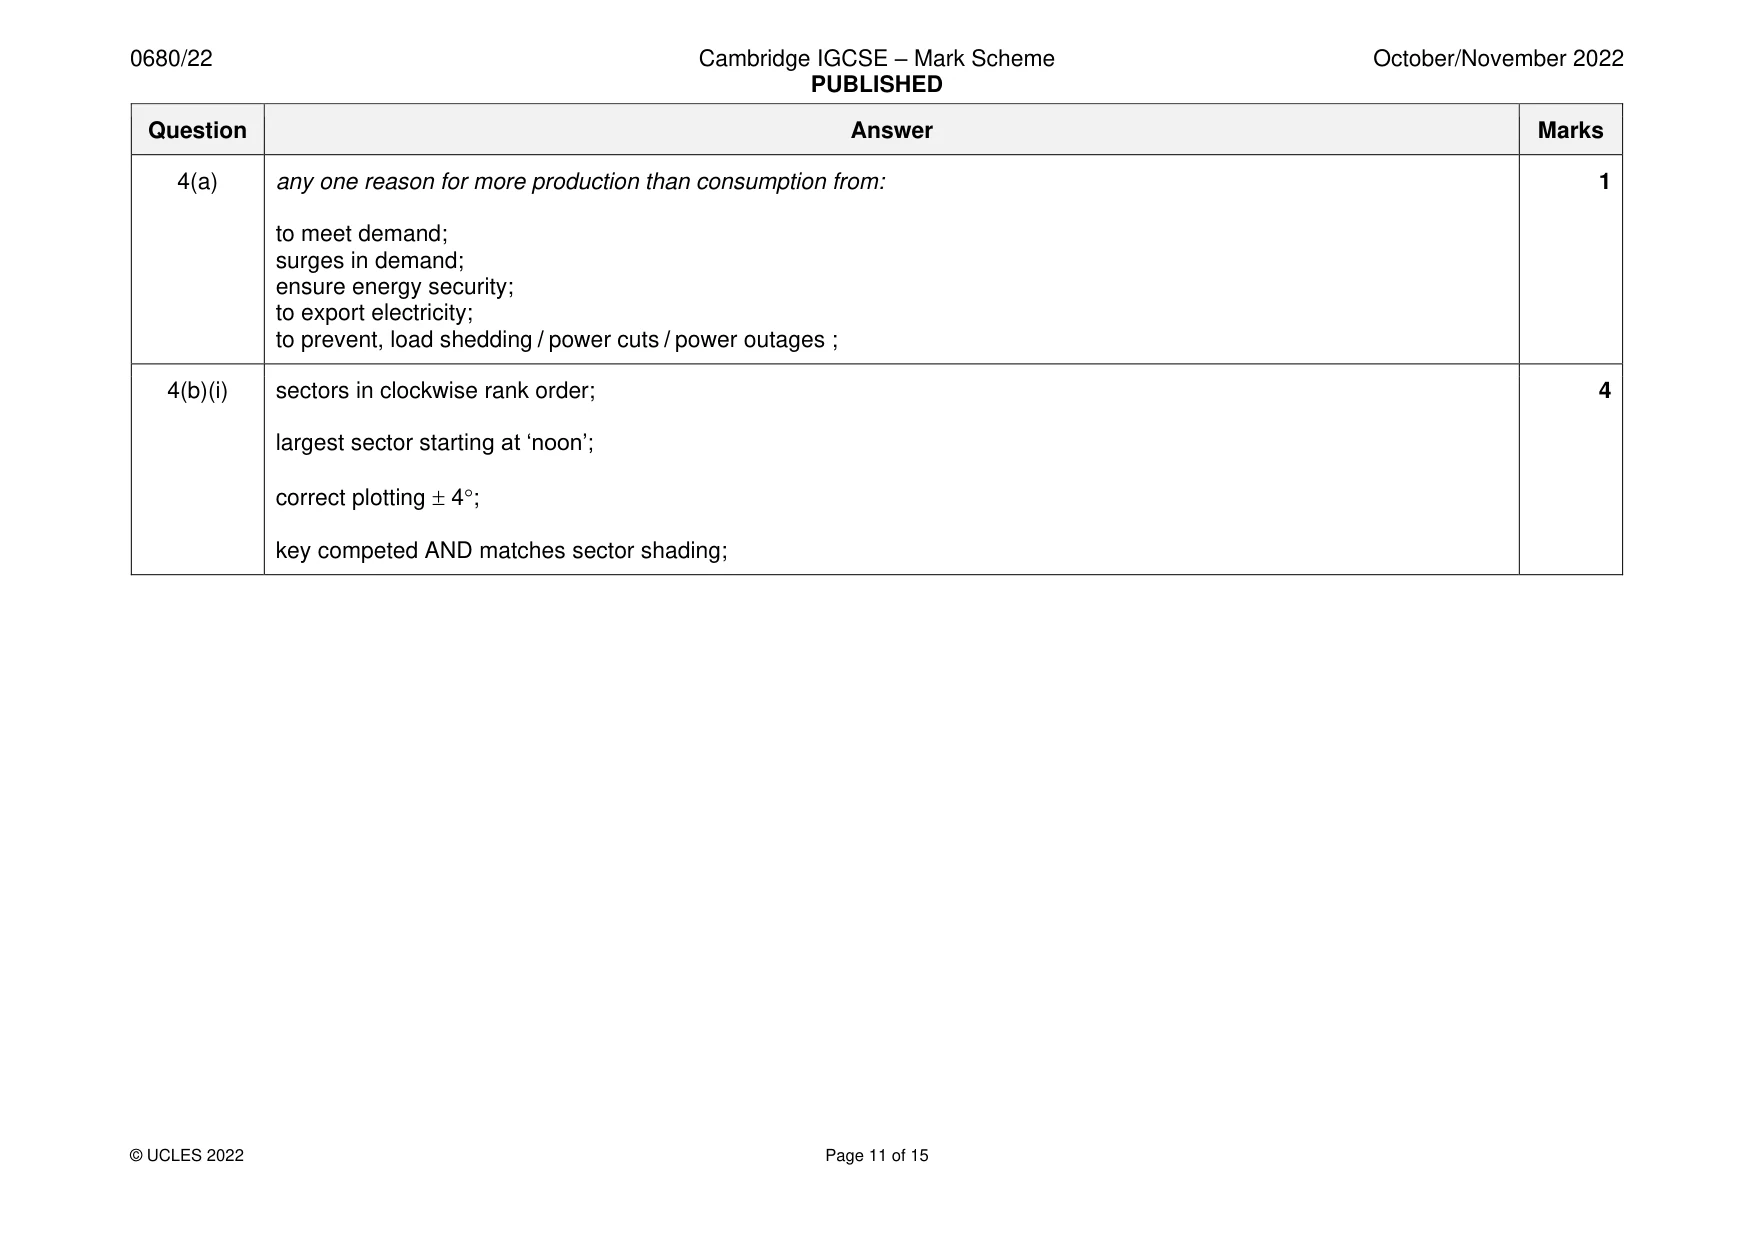
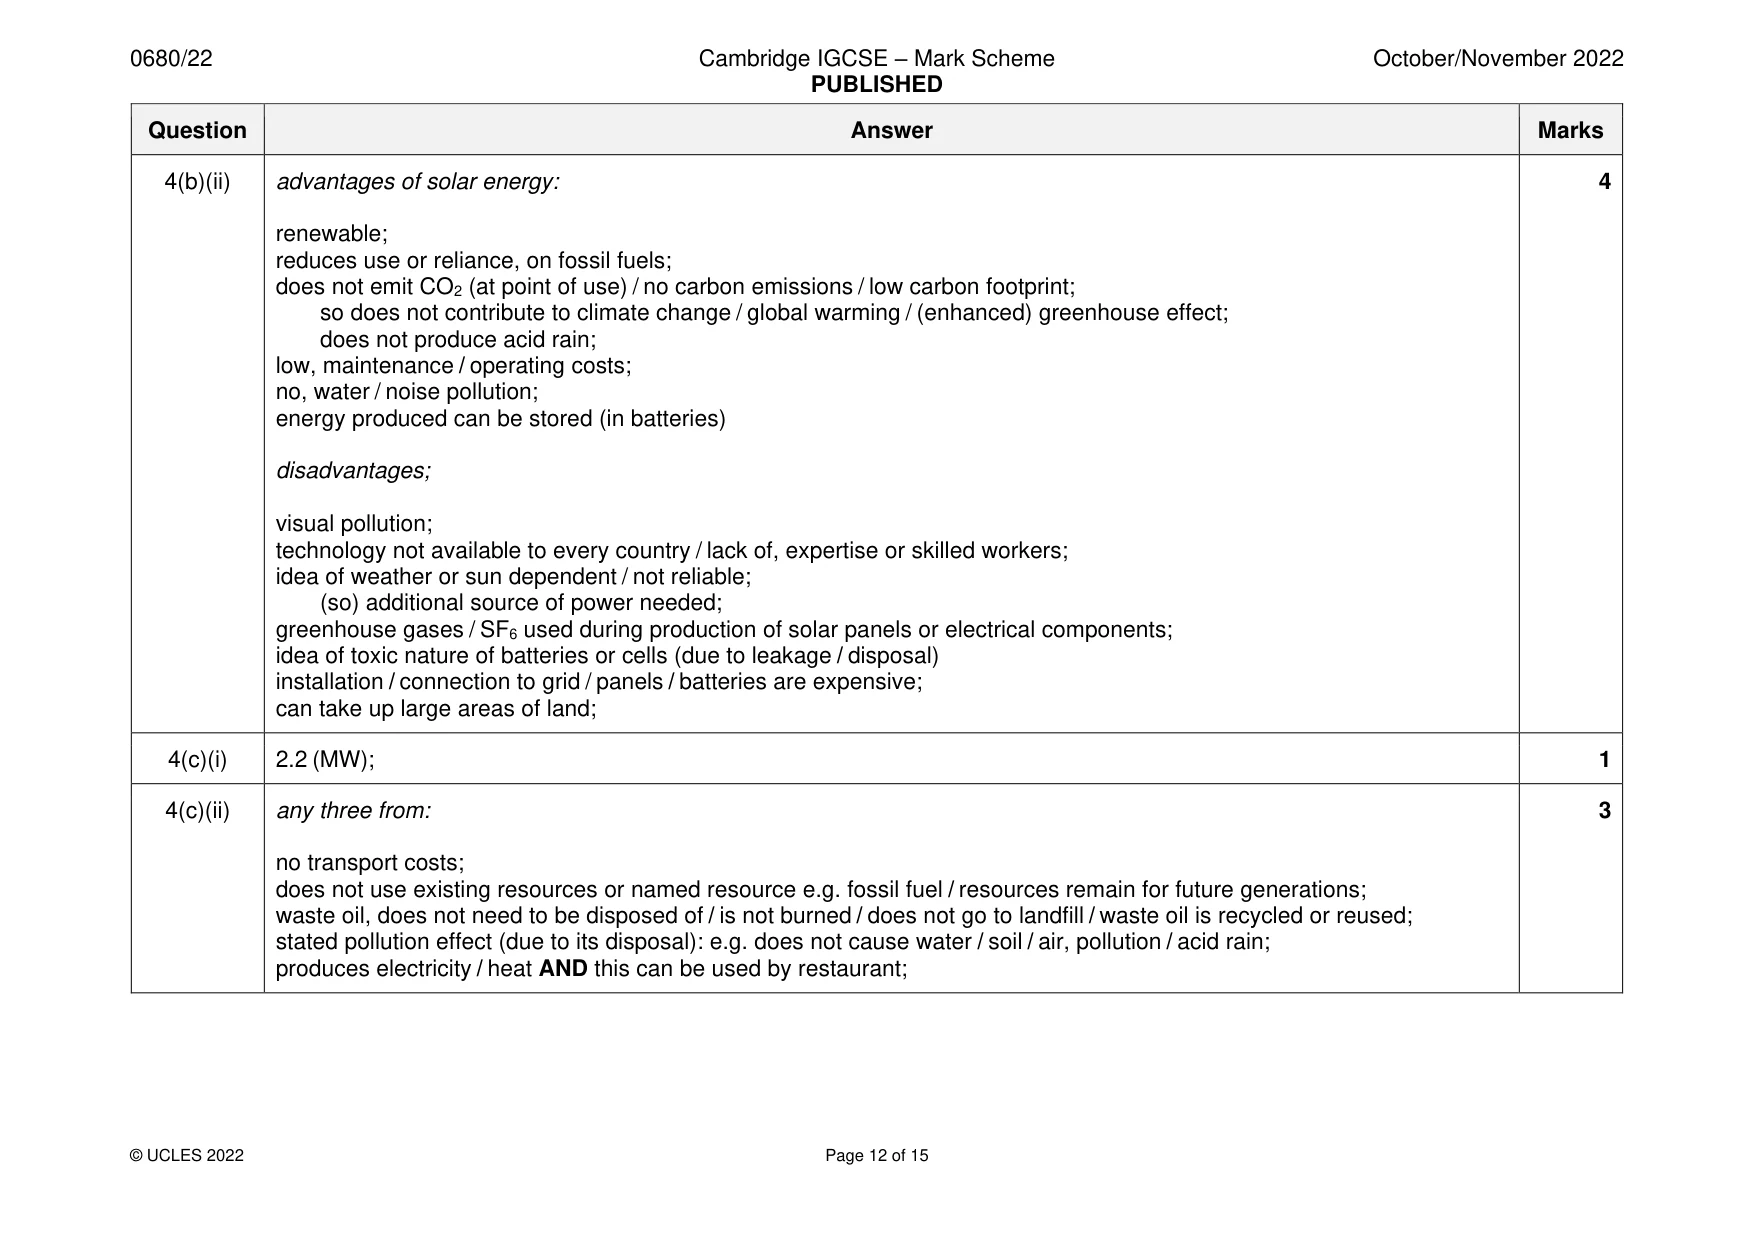
4 (a) In 2019, Spain’s annual electricity consumption was 239.5 billion kWh. Its electricity production was 258.6 billion kWh. Suggest a reason why there is a difference in the values for electricity consumption and electricity production. ................................................................................................................................................... ............................................................................................................................................. [1] (b) The table shows data about resources used to generate electricity in Spain. percentage resource generated wind power 51 hydroelectric 30 solar 14 thermal 5 (i) Draw a pie chart for this data and complete the key. 0 Key ................................. ................................. ................................. ................................. [4] (ii) The photograph shows solar panels used to generate electricity. Describe the advantages and disadvantages of using solar energy to generate electricity compared with using fossil fuels. advantages ........................................................................................................................ ........................................................................................................................................... ........................................................................................................................................... ........................................................................................................................................... ........................................................................................................................................... disadvantages ................................................................................................................... ........................................................................................................................................... ........................................................................................................................................... ........................................................................................................................................... ........................................................................................................................................... [4] (c) Energy can be obtained from waste cooking oil. (i) A restaurant uses a machine to convert waste cooking oil into electricity. 1 litre of waste cooking oil provides 0.004 MW of power. In one week, a restaurant produces 550 litres of waste cooking oil. Calculate the power provided by the machine in one week at the restaurant. ................................................... MW [1] (ii) Explain why using waste cooking oil to generate electricity is a sustainable strategy for managing energy resources. ........................................................................................................................................... ........................................................................................................................................... ........................................................................................................................................... ........................................................................................................................................... ........................................................................................................................................... ..................................................................................................................................... [3] (d) Most of the oil found in sedimentary rocks north of Madrid has been extracted. (i) Describe the formation of oil. ........................................................................................................................................... ........................................................................................................................................... ........................................................................................................................................... ........................................................................................................................................... ........................................................................................................................................... ........................................................................................................................................... ........................................................................................................................................... ..................................................................................................................................... [4] (ii) Oil can contain sulfur impurities. Name the toxic gas produced from the sulfur impurities in oil when the oil burns. ..................................................................................................................................... [1] (iii) The diagram shows a factory burning oil. Explain why a country 300 km away from the factory is affected by the toxic gas produced from the sulfur impurities. ........................................................................................................................................... ........................................................................................................................................... ........................................................................................................................................... ..................................................................................................................................... [2] [Total: 20]
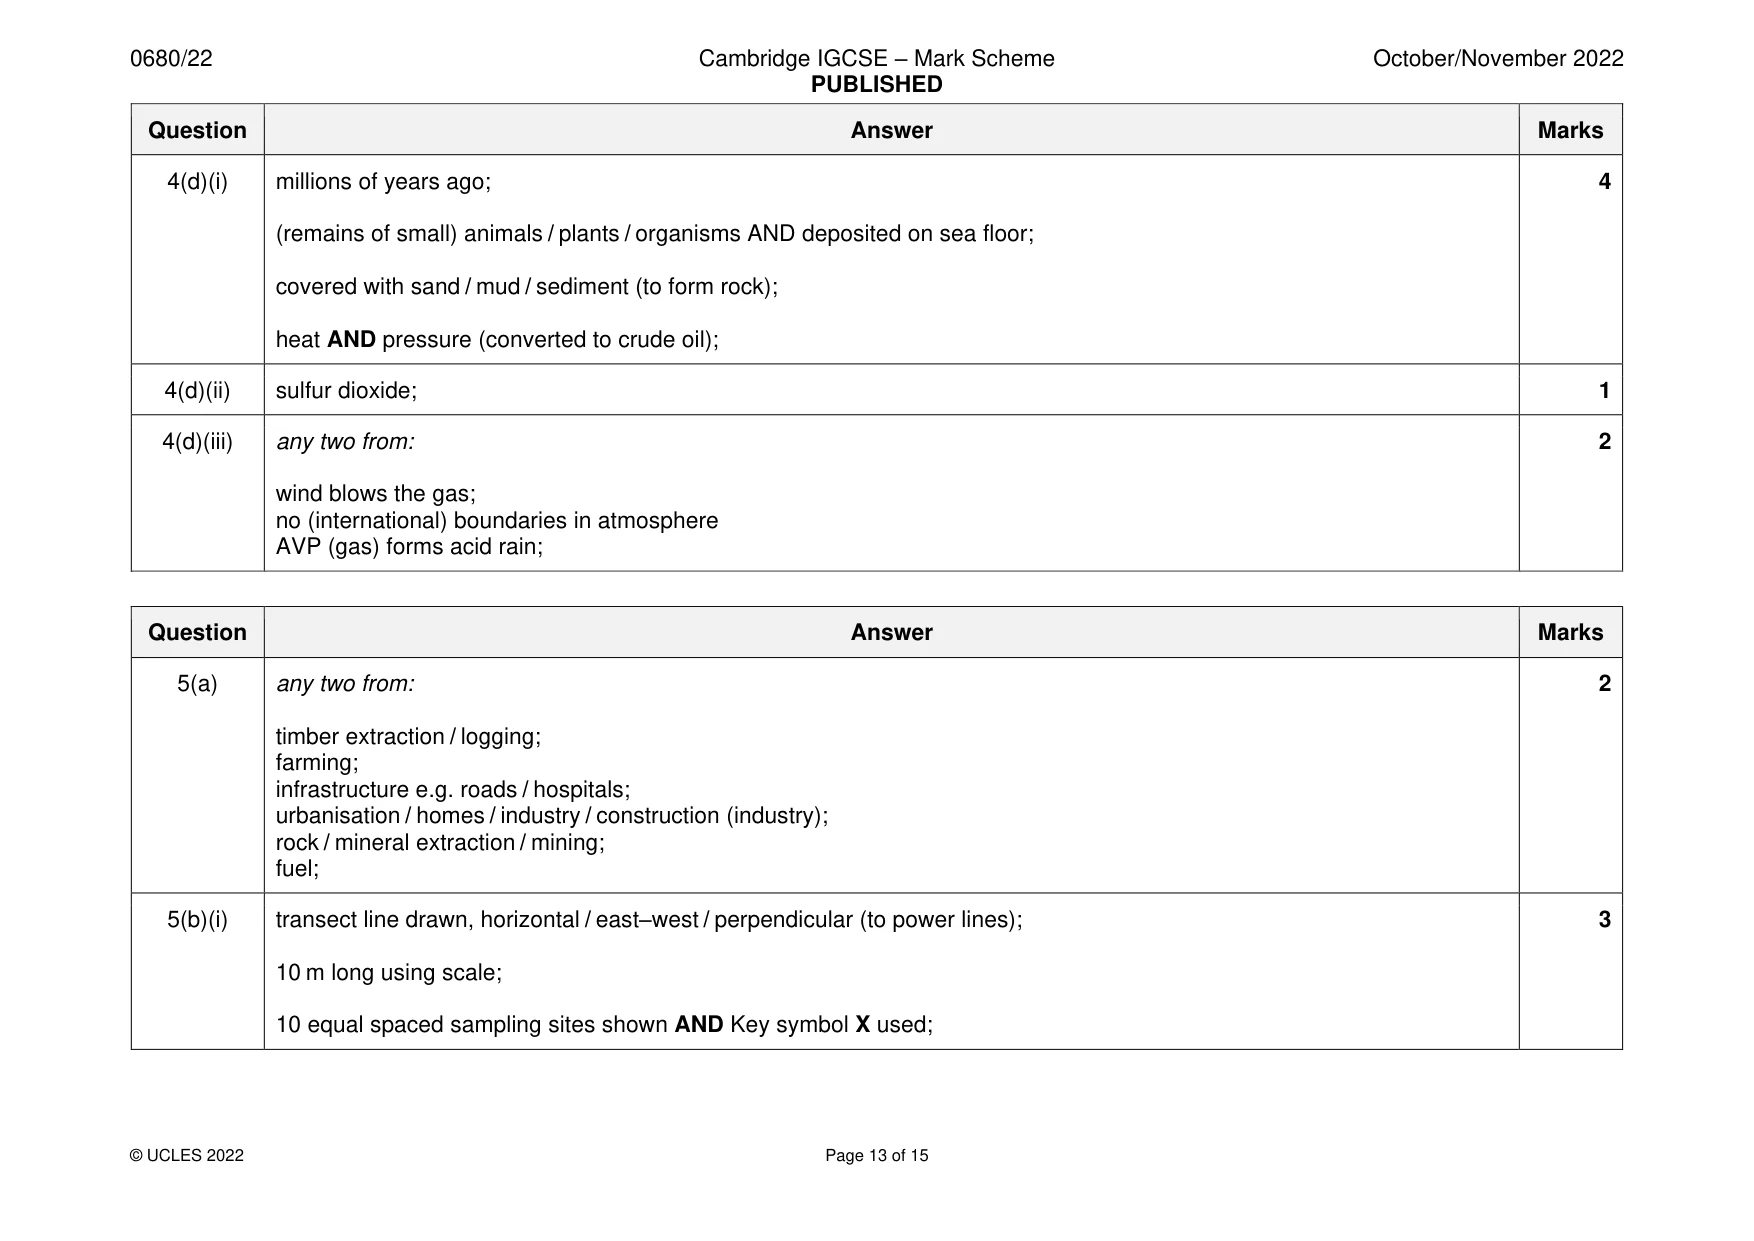
Mark scheme: 4(a) any one reason for more production than consumption from: 1 to meet demand; surges in demand; ensure energy security; to export electricity; to prevent, load shedding / power cuts / power outages ; 4(b)(i) sectors in clockwise rank order; 4 largest sector starting at ‘noon’; correct plotting 4; key competed AND matches sector shading; 4(b)(ii) advantages of solar energy: 4 renewable; reduces use or reliance, on fossil fuels; does not emit CO2 (at point of use) / no carbon emissions / low carbon footprint; so does not contribute to climate change / global warming / (enhanced) greenhouse effect; does not produce acid rain; low, maintenance / operating costs; no, water / noise pollution; energy produced can be stored (in batteries) disadvantages; visual pollution; technology not available to every country / lack of, expertise or skilled workers; idea of weather or sun dependent / not reliable; (so) additional source of power needed; greenhouse gases / SF6 used during production of solar panels or electrical components; idea of toxic nature of batteries or cells (due to leakage / disposal) installation / connection to grid / panels / batteries are expensive; can take up large areas of land; 4(c)(i) 2.2 (MW); 1 4(c)(ii) any three from: 3 no transport costs; does not use existing resources or named resource e.g. fossil fuel / resources remain for future generations; waste oil, does not need to be disposed of / is not burned / does not go to landfill / waste oil is recycled or reused; stated pollution effect (due to its disposal): e.g. does not cause water / soil / air, pollution / acid rain; produces electricity / heat AND this can be used by restaurant; 4(d)(i) millions of years ago; 4 (remains of small) animals / plants / organisms AND deposited on sea floor; covered with sand / mud / sediment (to form rock); heat AND pressure (converted to crude oil); 4(d)(ii) sulfur dioxide; 1 4(d)(iii) any two from: 2 wind blows the gas; no (international) boundaries in atmosphere AVP (gas) forms acid rain;
Q5 · Forests cover 36% of the land of Spain
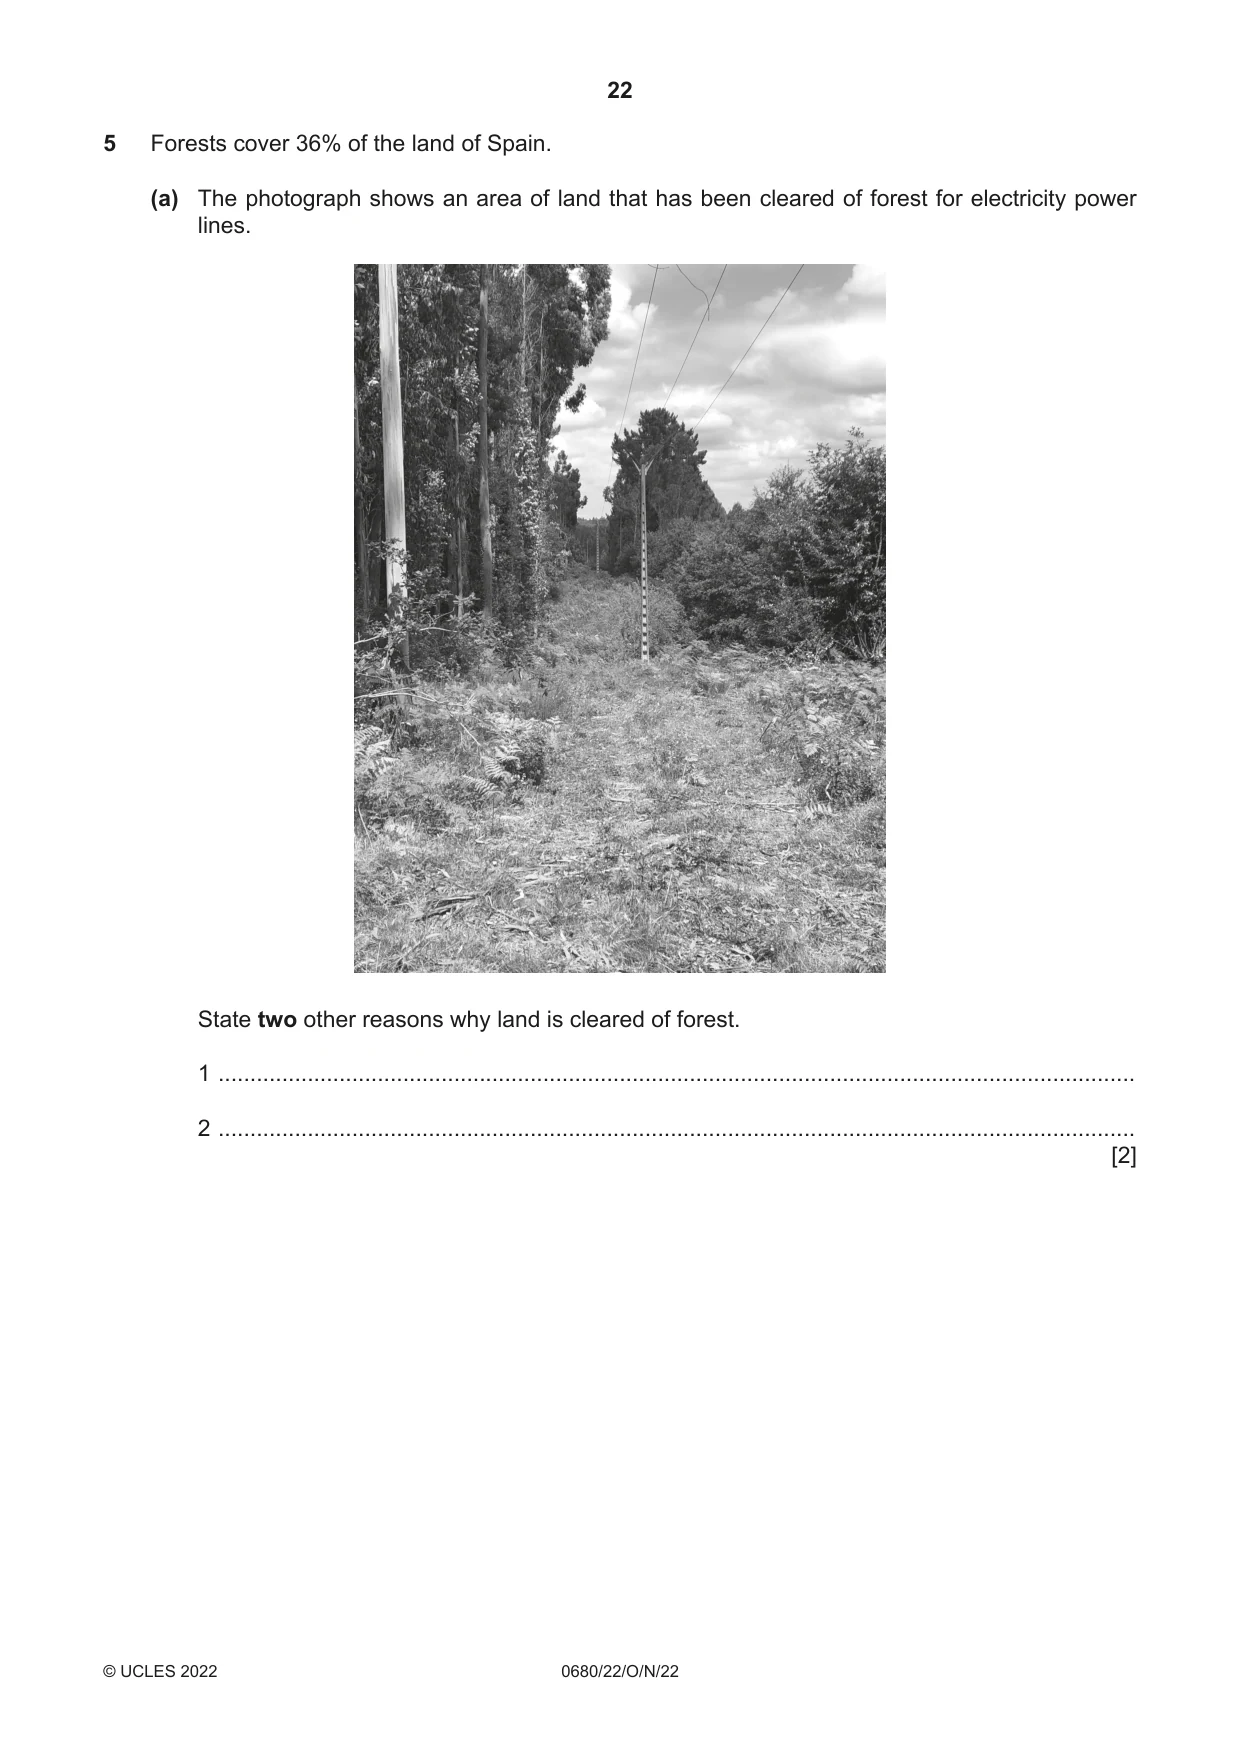
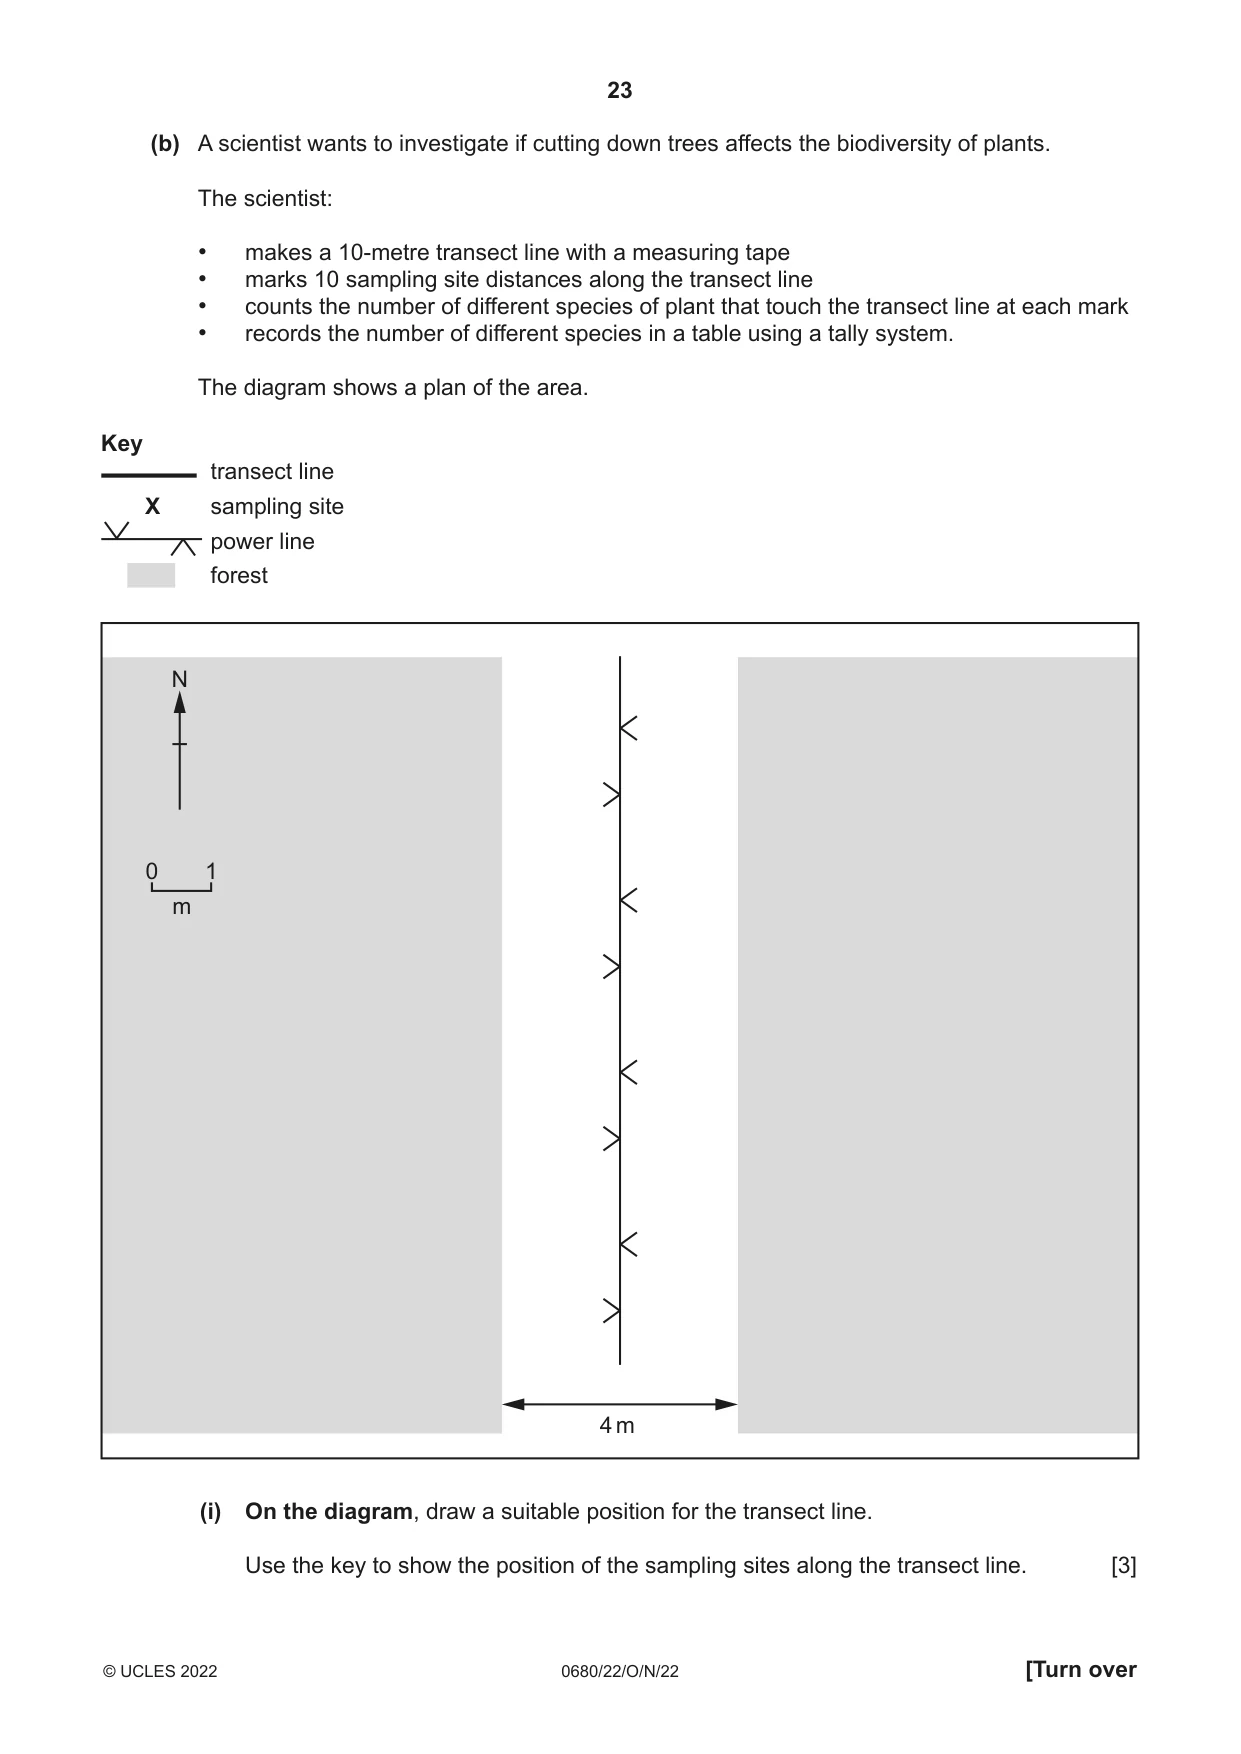
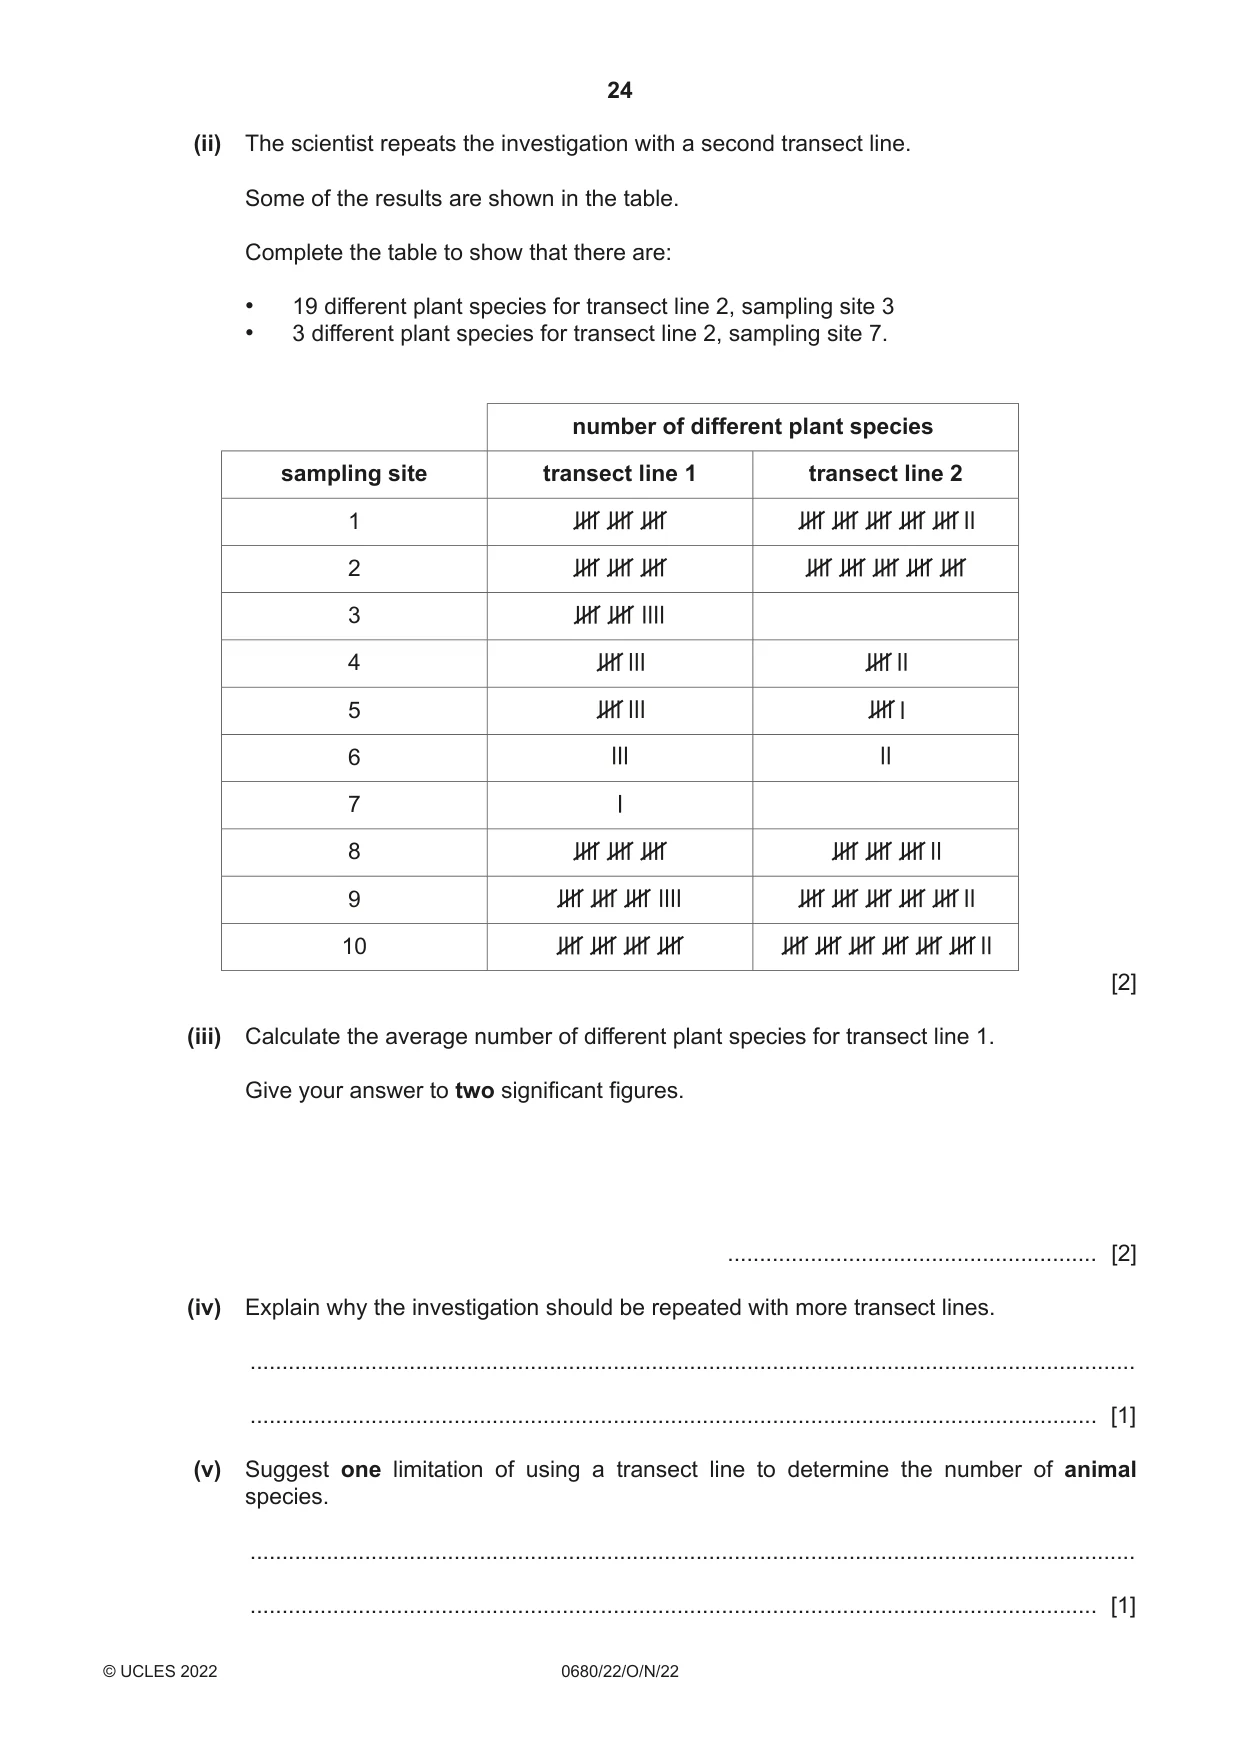
5 Forests cover 36% of the land of Spain. (a) The photograph shows an area of land that has been cleared of forest for electricity power lines. State two other reasons why land is cleared of forest. 1 ................................................................................................................................................ 2 ................................................................................................................................................ [2] (b) A scientist wants to investigate if cutting down trees affects the biodiversity of plants. The scientist: • makes a 10-metre transect line with a measuring tape • marks 10 sampling site distances along the transect line • counts the number of different species of plant that touch the transect line at each mark • records the number of different species in a table using a tally system. The diagram shows a plan of the area. Key transect line X sampling site power line forest N 0 1 m 4 m (i) On the diagram, draw a suitable position for the transect line. Use the key to show the position of the sampling sites along the transect line. [3] (ii) The scientist repeats the investigation with a second transect line. Some of the results are shown in the table. Complete the table to show that there are: • 19 different plant species for transect line 2, sampling site 3 • 3 different plant species for transect line 2, sampling site 7. number of different plant species sampling site transect line 1 transect line 2 1 2 3 4 5 6 7 8 9 10 [2] (iii) Calculate the average number of different plant species for transect line 1. Give your answer to two significant figures. .......................................................... [2] (iv) Explain why the investigation should be repeated with more transect lines. ........................................................................................................................................... ..................................................................................................................................... [1] (v) Suggest one limitation of using a transect line to determine the number of animal species. ........................................................................................................................................... ..................................................................................................................................... [1]
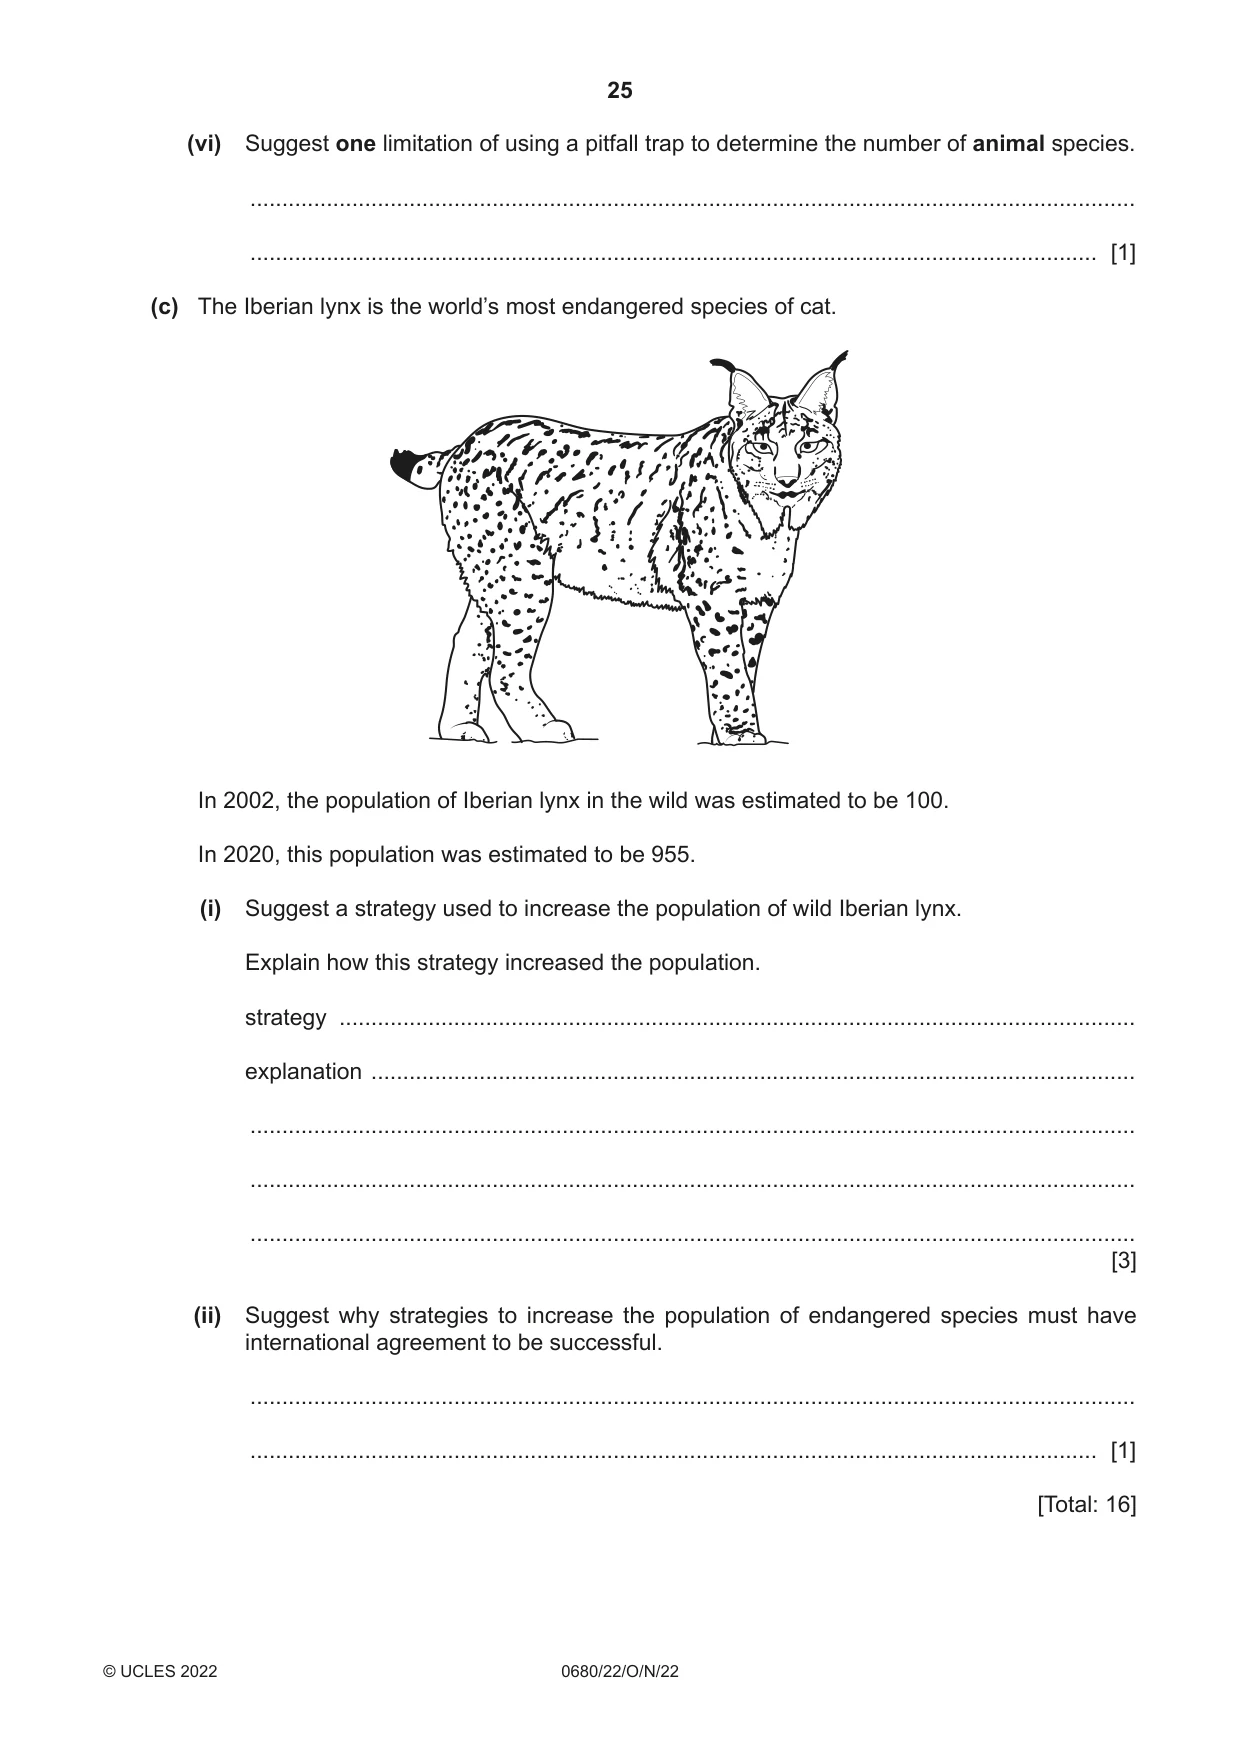
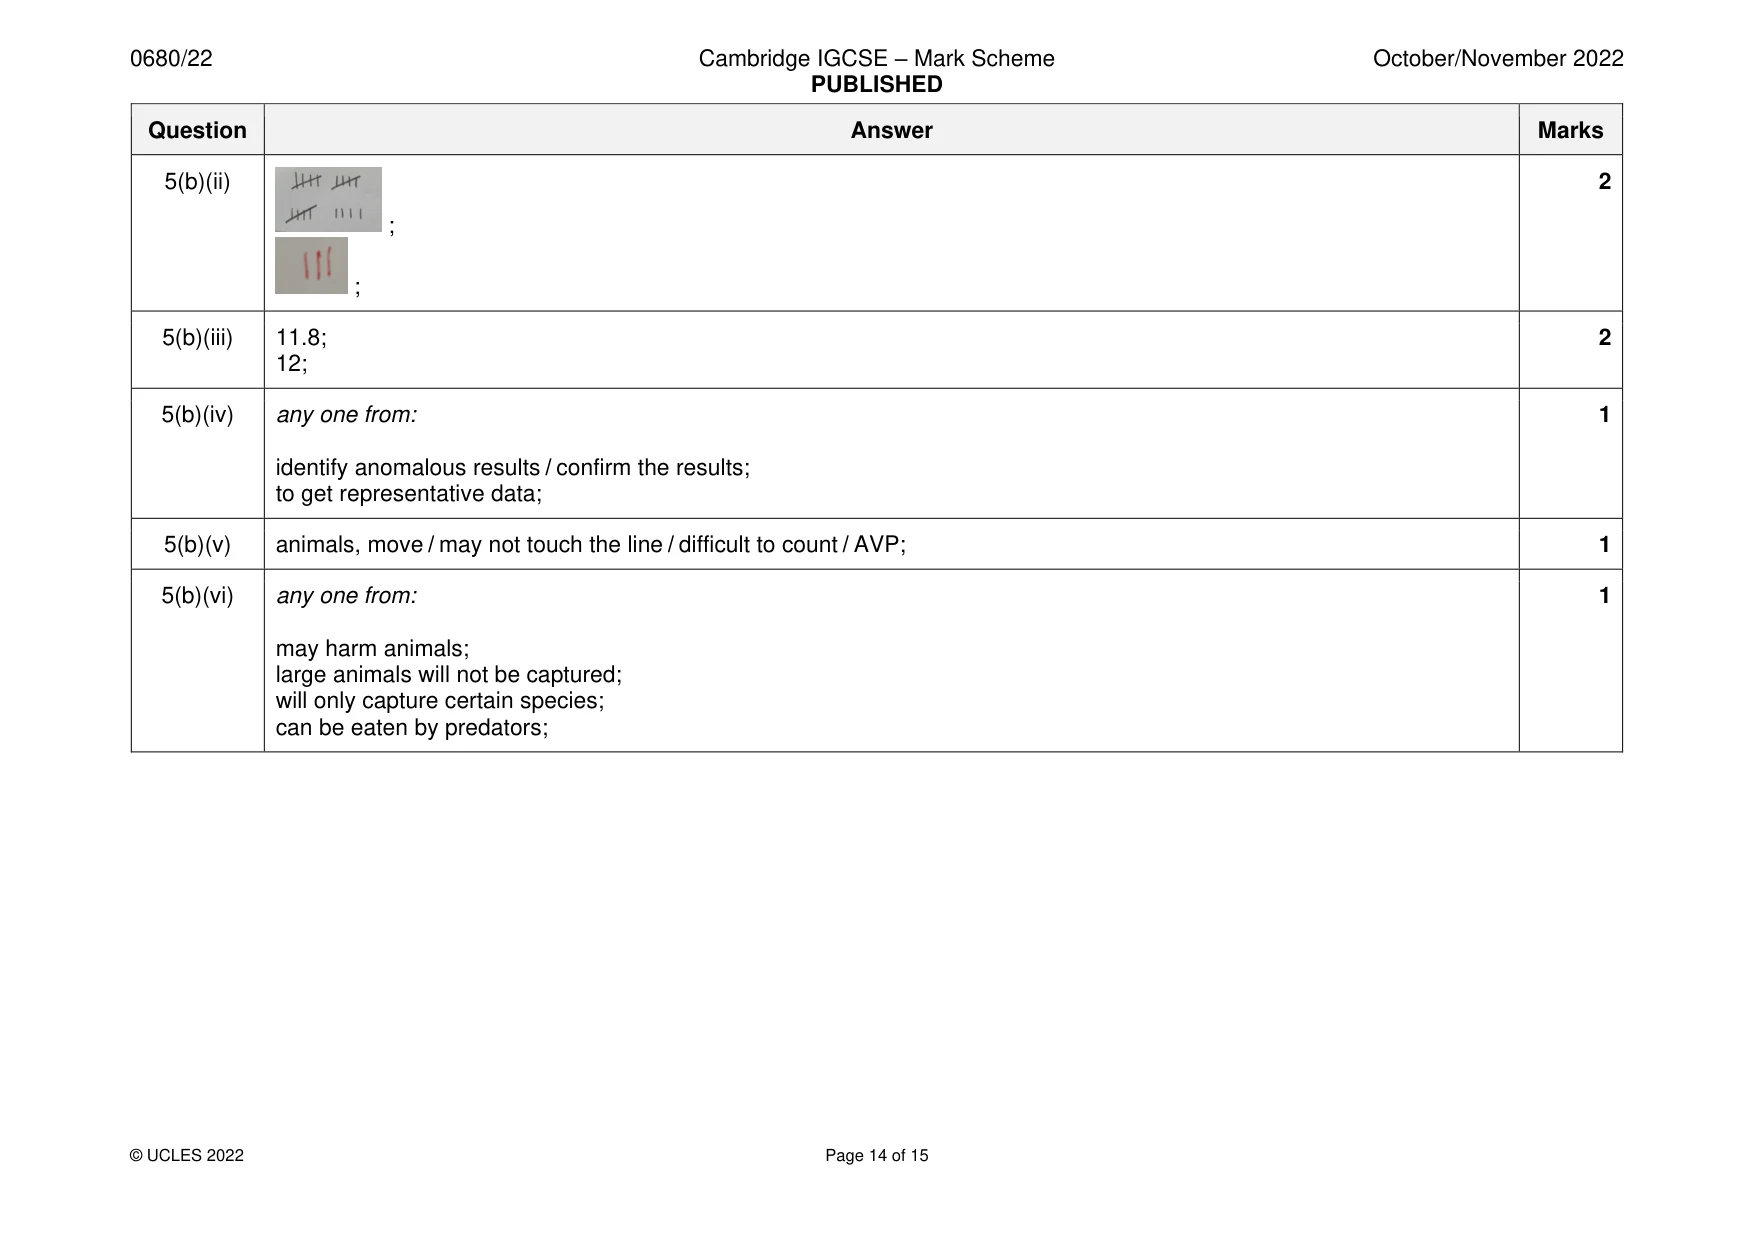
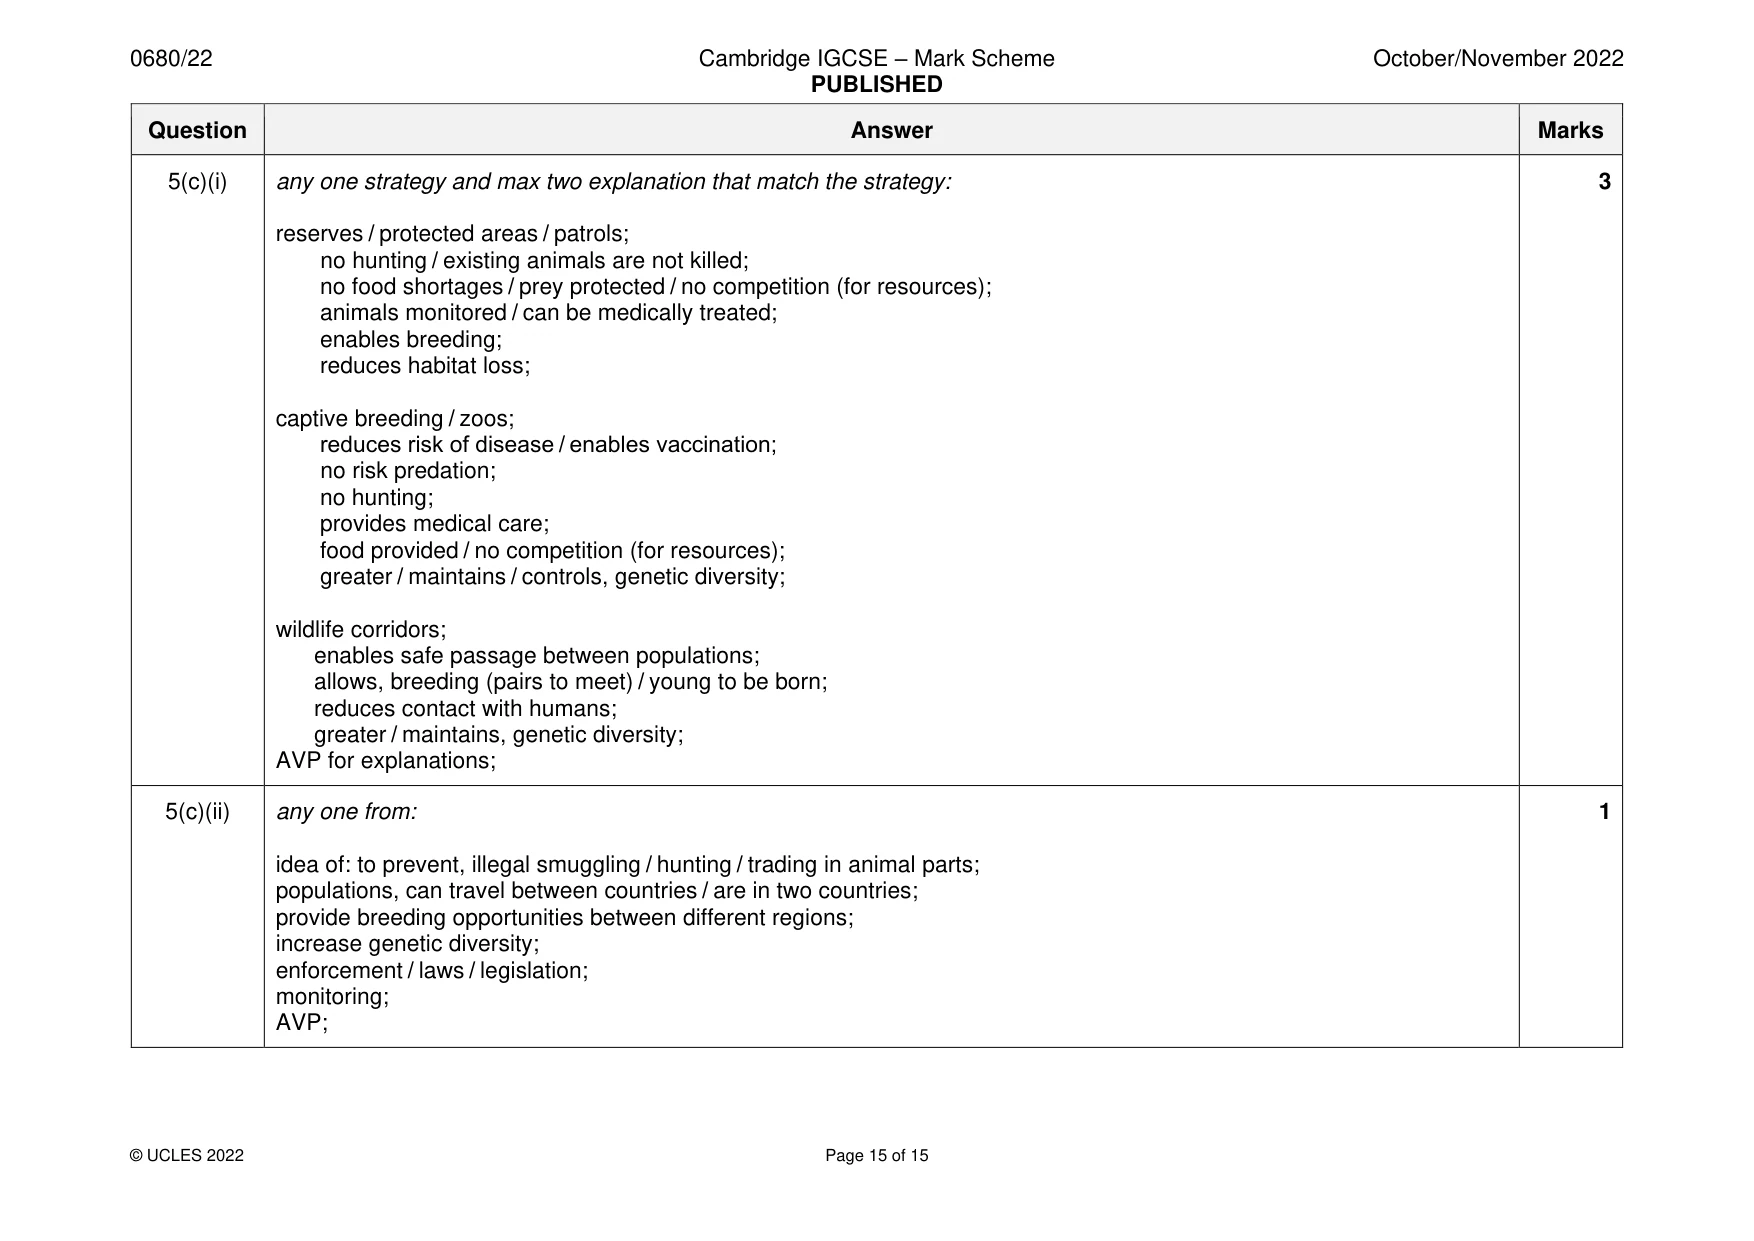
Mark scheme: 5(a) any two from: 2 timber extraction / logging; farming; infrastructure e.g. roads / hospitals; urbanisation / homes / industry / construction (industry); rock / mineral extraction / mining; fuel; 5(b)(i) transect line drawn, horizontal / east–west / perpendicular (to power lines); 3 10 m long using scale; 10 equal spaced sampling sites shown AND Key symbol X used; 5(b)(ii) 2 ; ; 5(b)(iii) 11.8; 2 12; 5(b)(iv) any one from: 1 identify anomalous results / confirm the results; to get representative data; 5(b)(v) animals, move / may not touch the line / difficult to count / AVP; 1 5(b)(vi) any one from: 1 may harm animals; large animals will not be captured; will only capture certain species; can be eaten by predators; 5(c)(i) any one strategy and max two explanation that match the strategy: 3 reserves / protected areas / patrols; no hunting / existing animals are not killed; no food shortages / prey protected / no competition (for resources); animals monitored / can be medically treated; enables breeding; reduces habitat loss; captive breeding / zoos; reduces risk of disease / enables vaccination; no risk predation; no hunting; provides medical care; food provided / no competition (for resources); greater / maintains / controls, genetic diversity; wildlife corridors; enables safe passage between populations; allows, breeding (pairs to meet) / young to be born; reduces contact with humans; greater / maintains, genetic diversity; AVP for explanations; 5(c)(ii) any one from: 1 idea of: to prevent, illegal smuggling / hunting / trading in animal parts; populations, can travel between countries / are in two countries; provide breeding opportunities between different regions; increase genetic diversity; enforcement / laws / legislation; monitoring; AVP;
What was in this paper
The subtopics covered by these 5 questions, and how many questions each got. Open one in a new tab to see every Cambridge question on it.
What you needed in this session
Cambridge’s own grade thresholds for 2022 Oct/Nov, Paper 2 · Variant 2. A higher threshold means an easier paper — the bar moves with how the cohort did.