Cambridge IGCSE Environmental Management 0680 — 2024 May/June Paper 2 · Variant 2
0680/22/M/J/24 · 4 questions · 80 marks · ≈90 min
The question paper and its mark scheme, free to read here and free to download. This is Cambridge’s own paper, exactly as it was sat.
Question paper20 pages

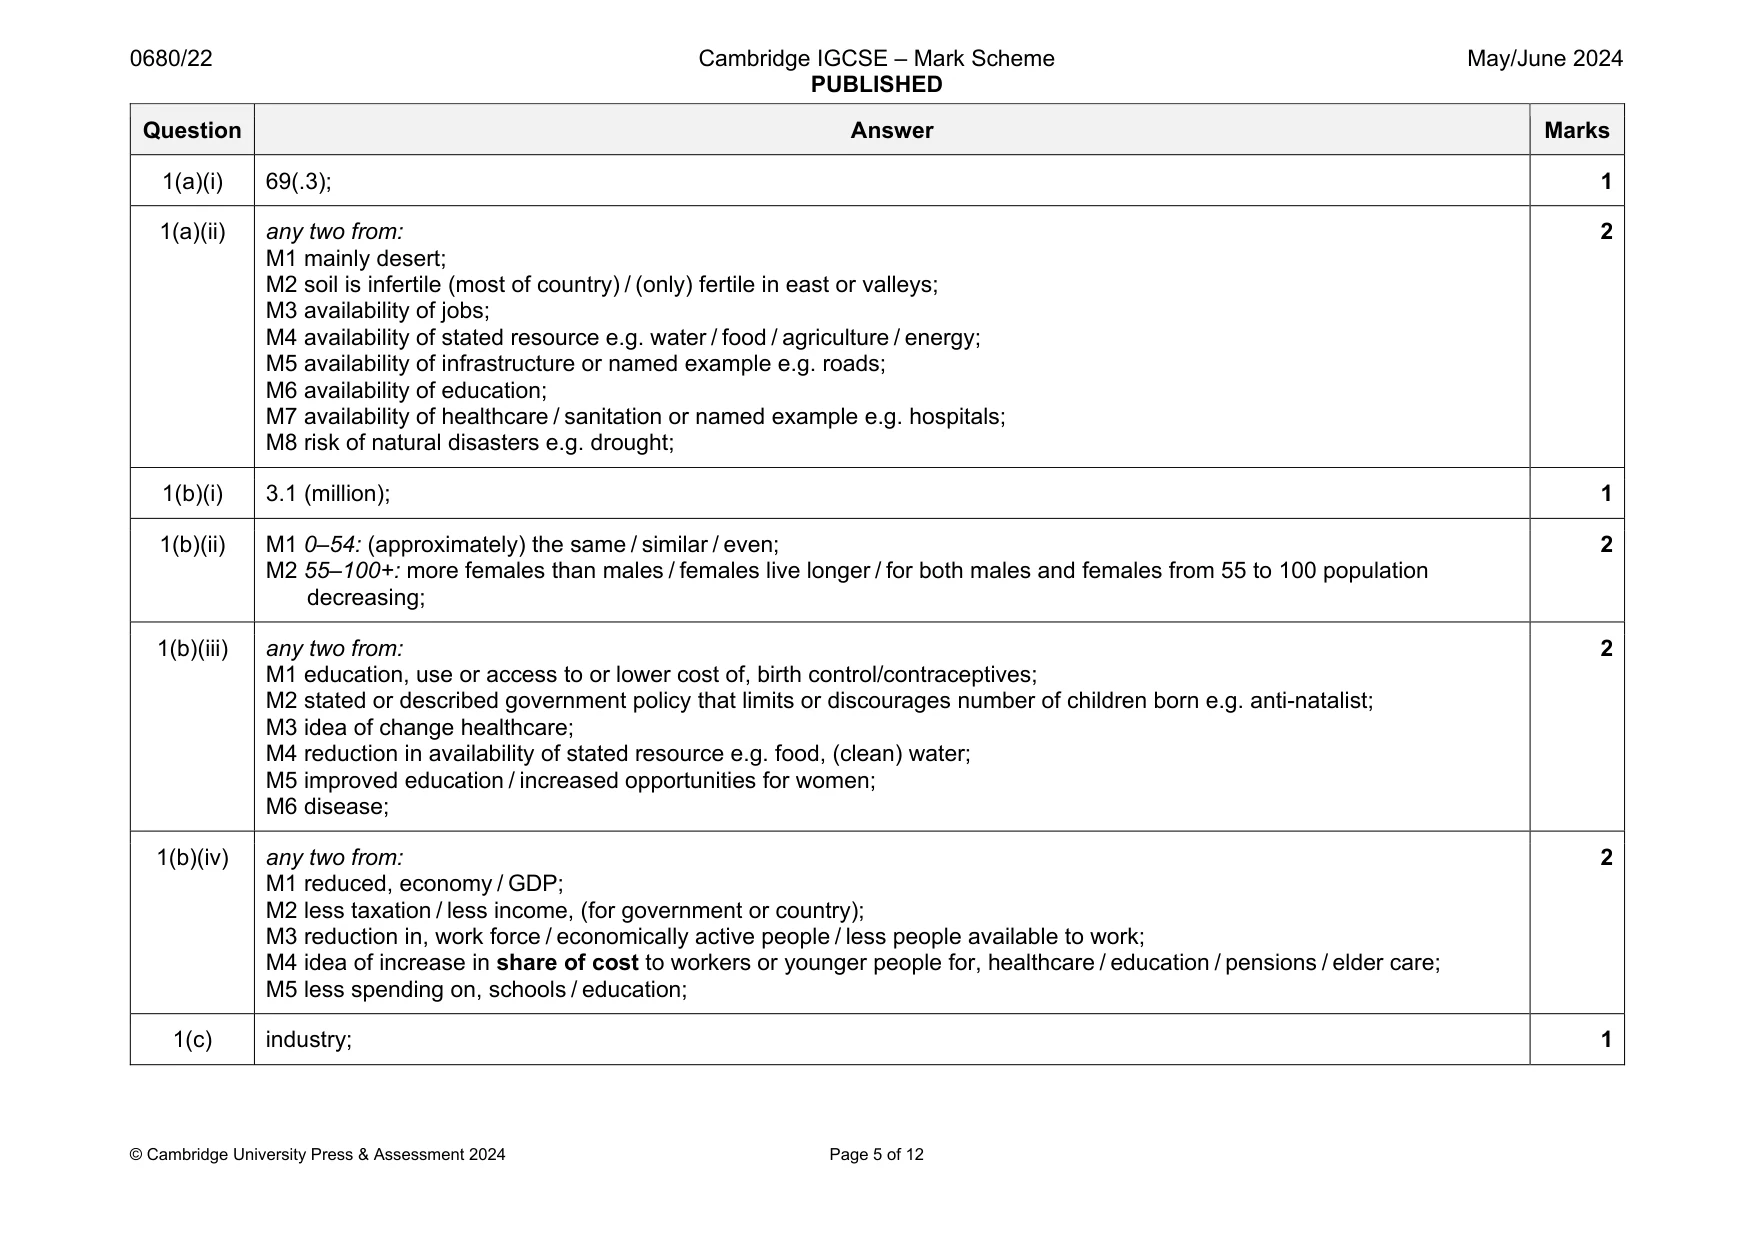
Mark scheme12 pages
Answers below. Sit the paper first if you are practising.
Questions as text
Q1 · Calculate the population density in Uzbekistan in 2021
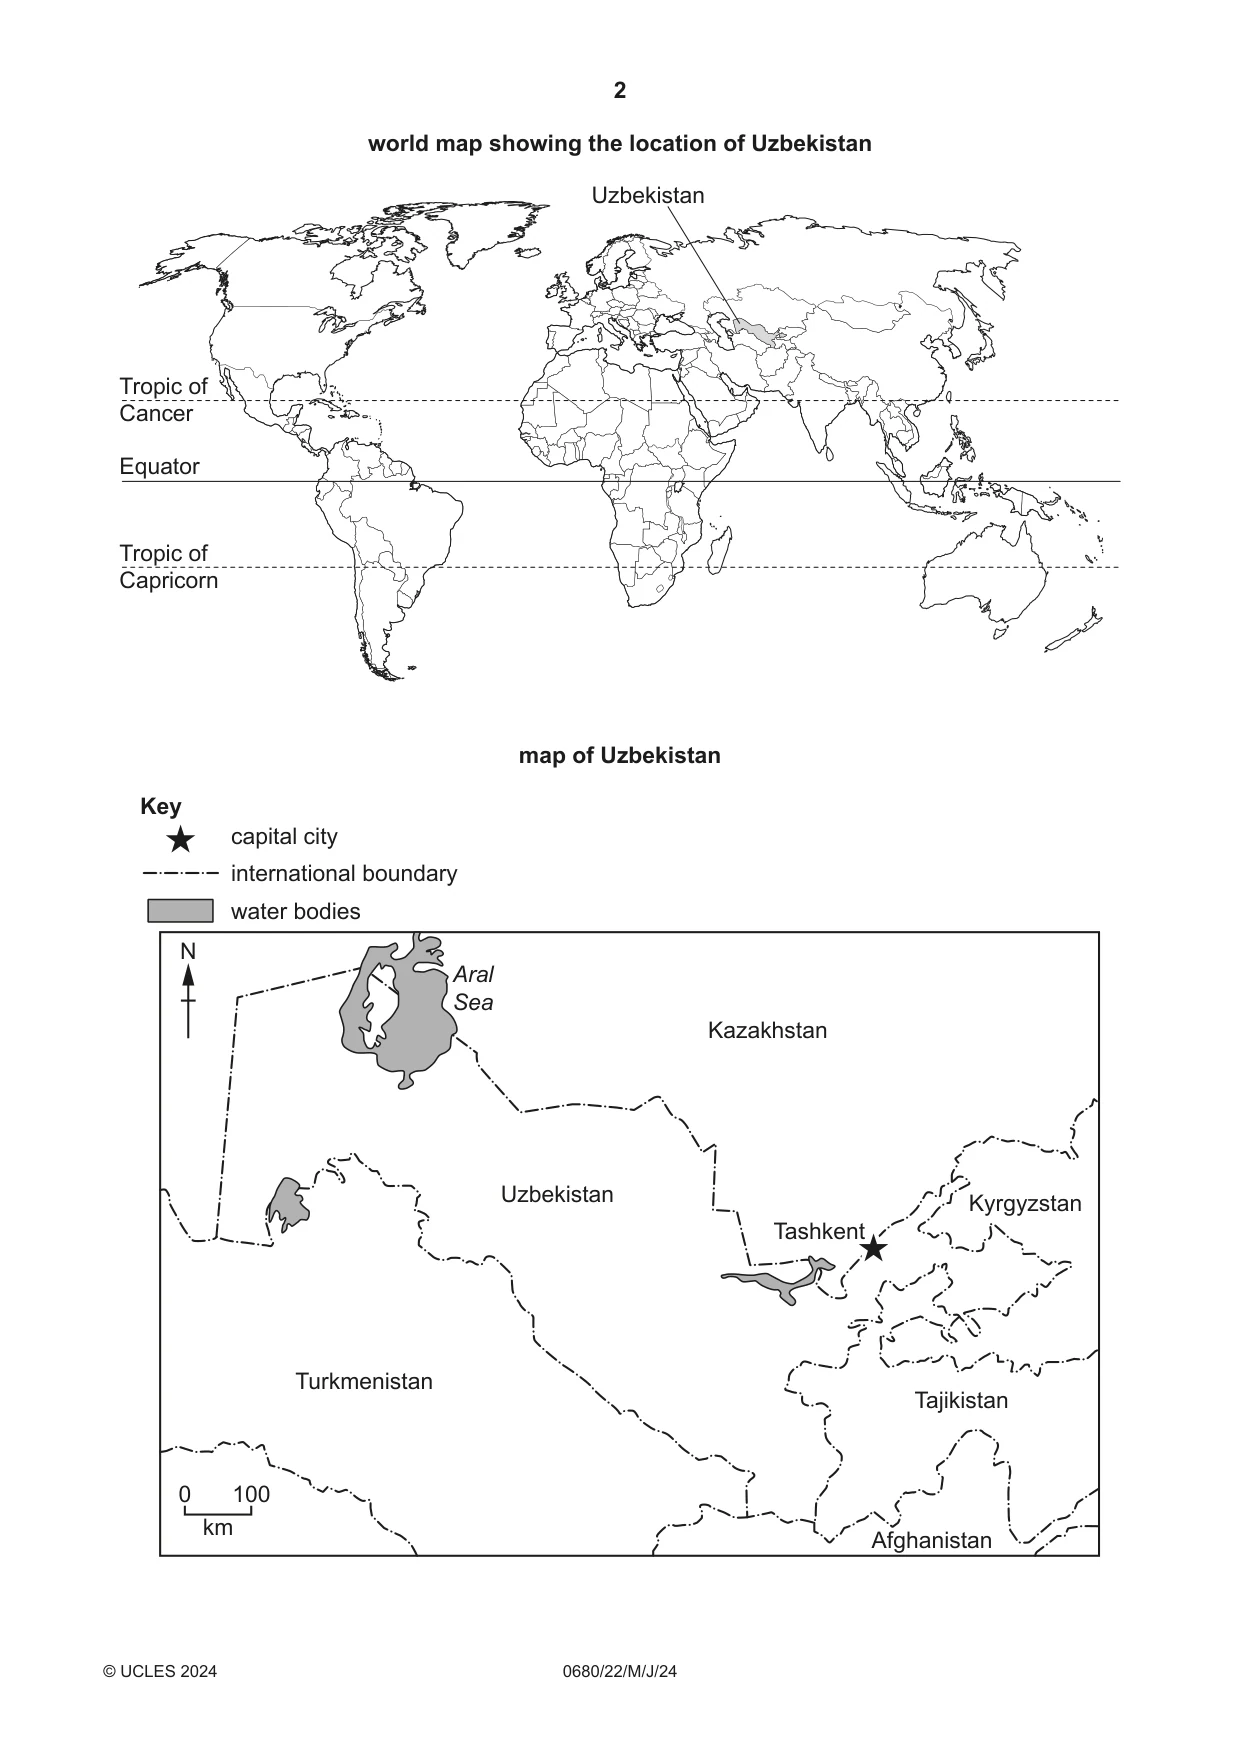
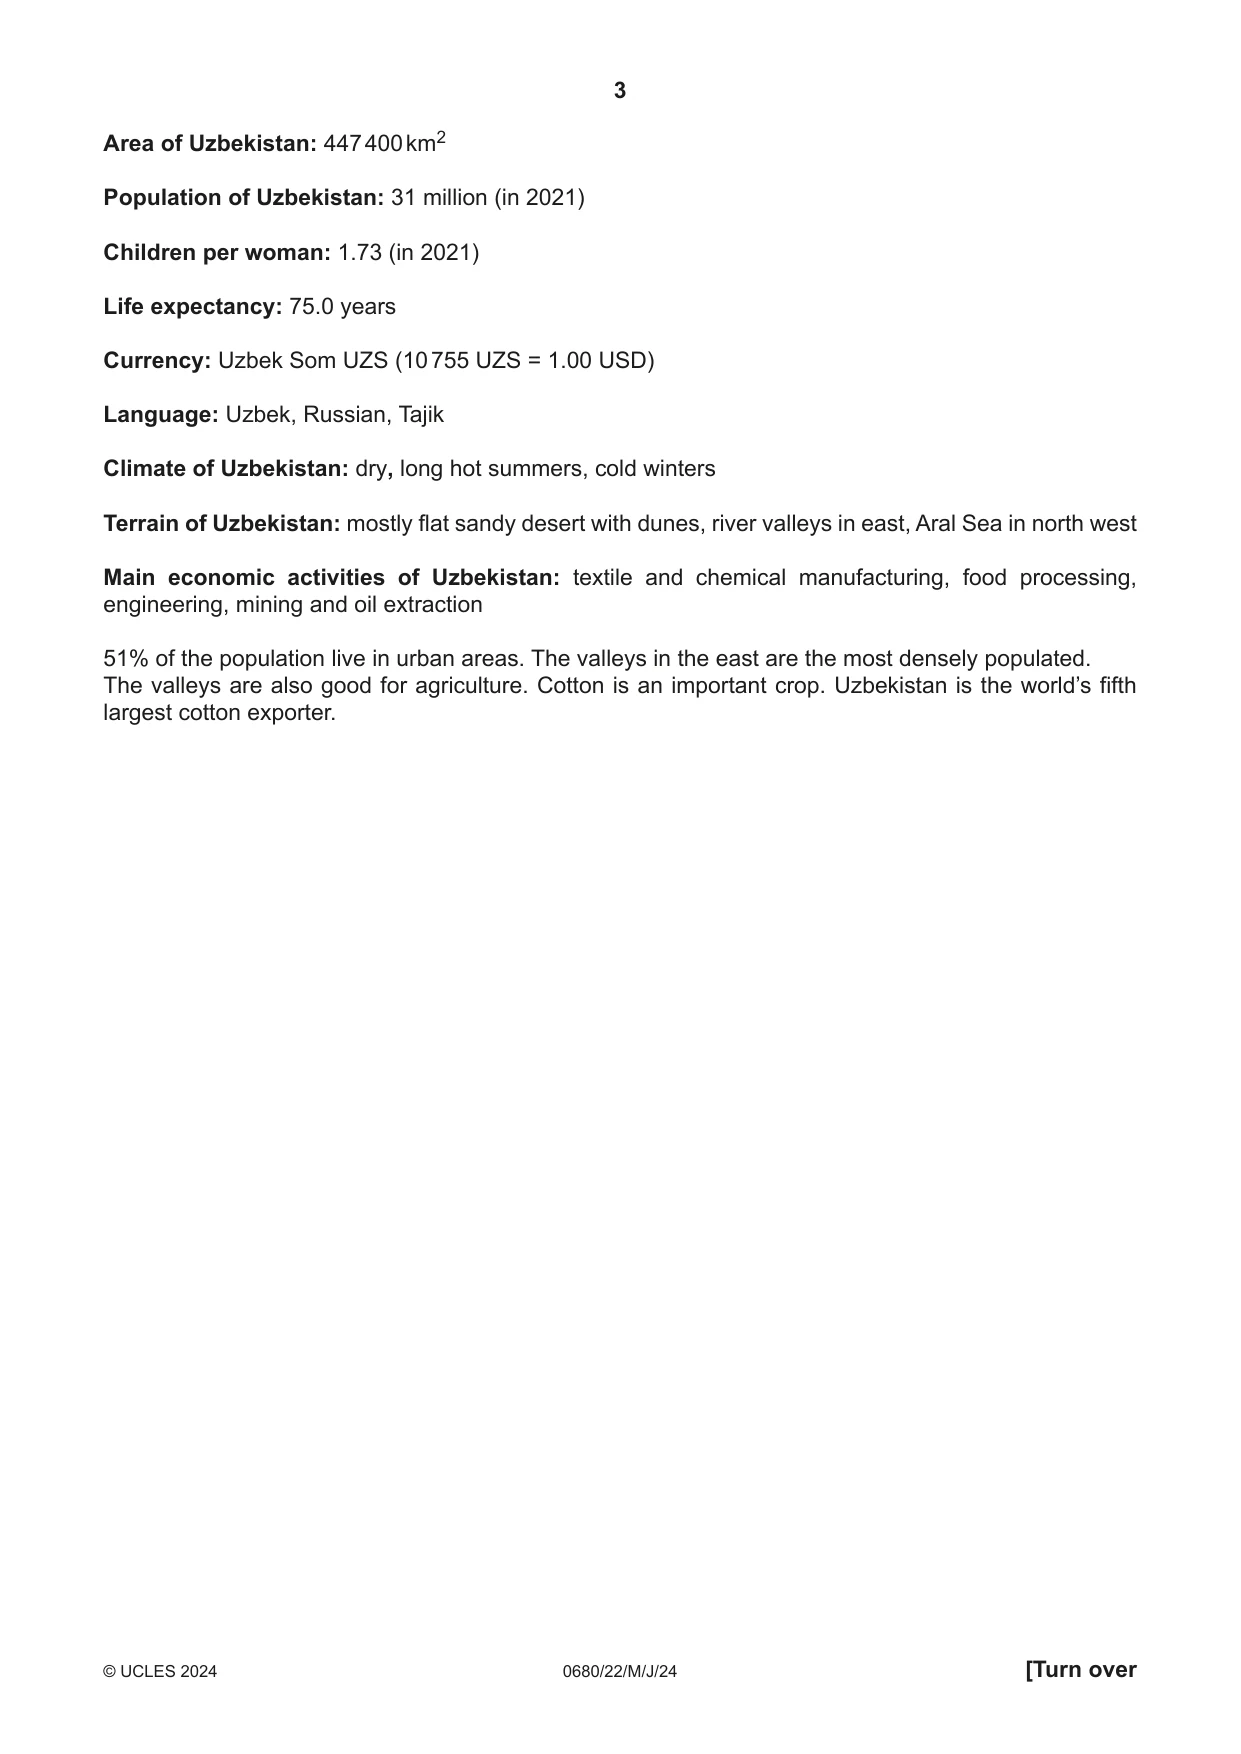
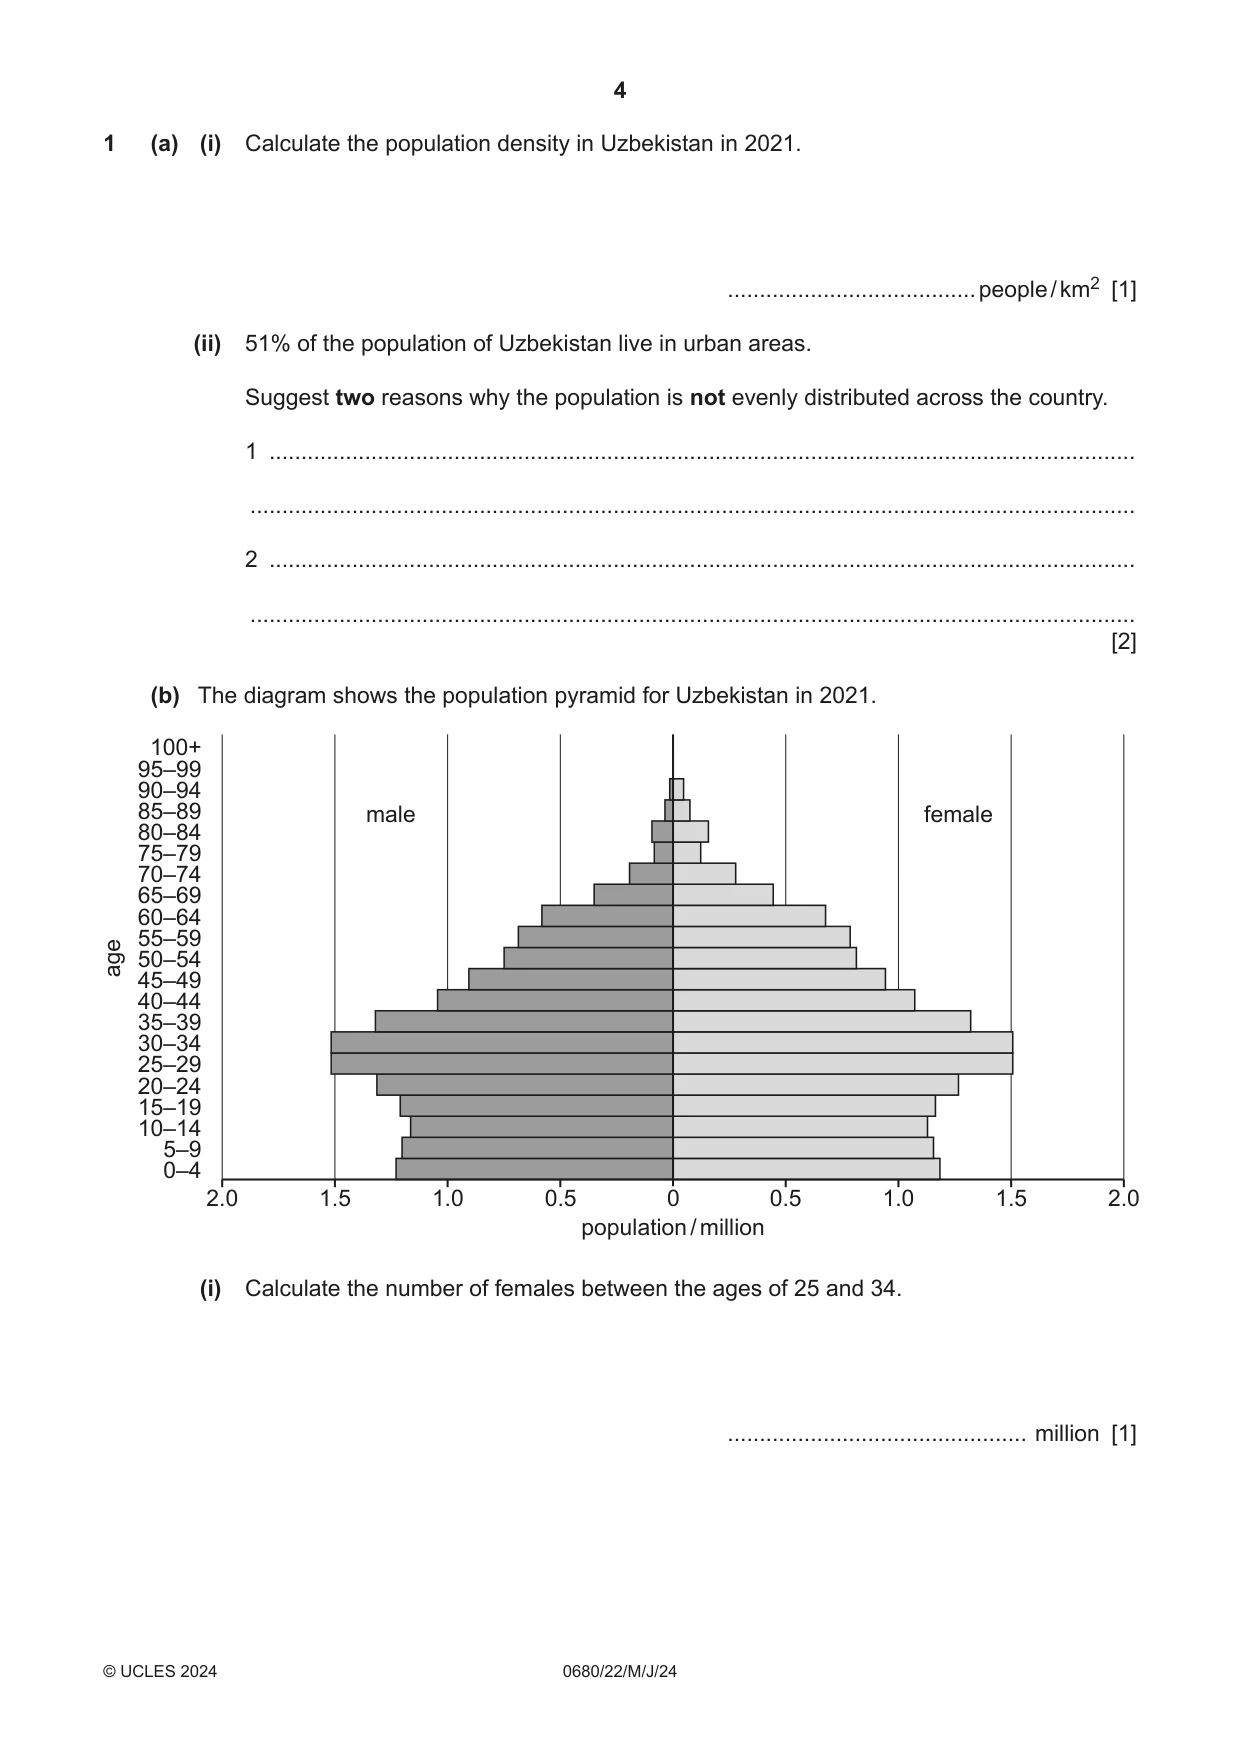
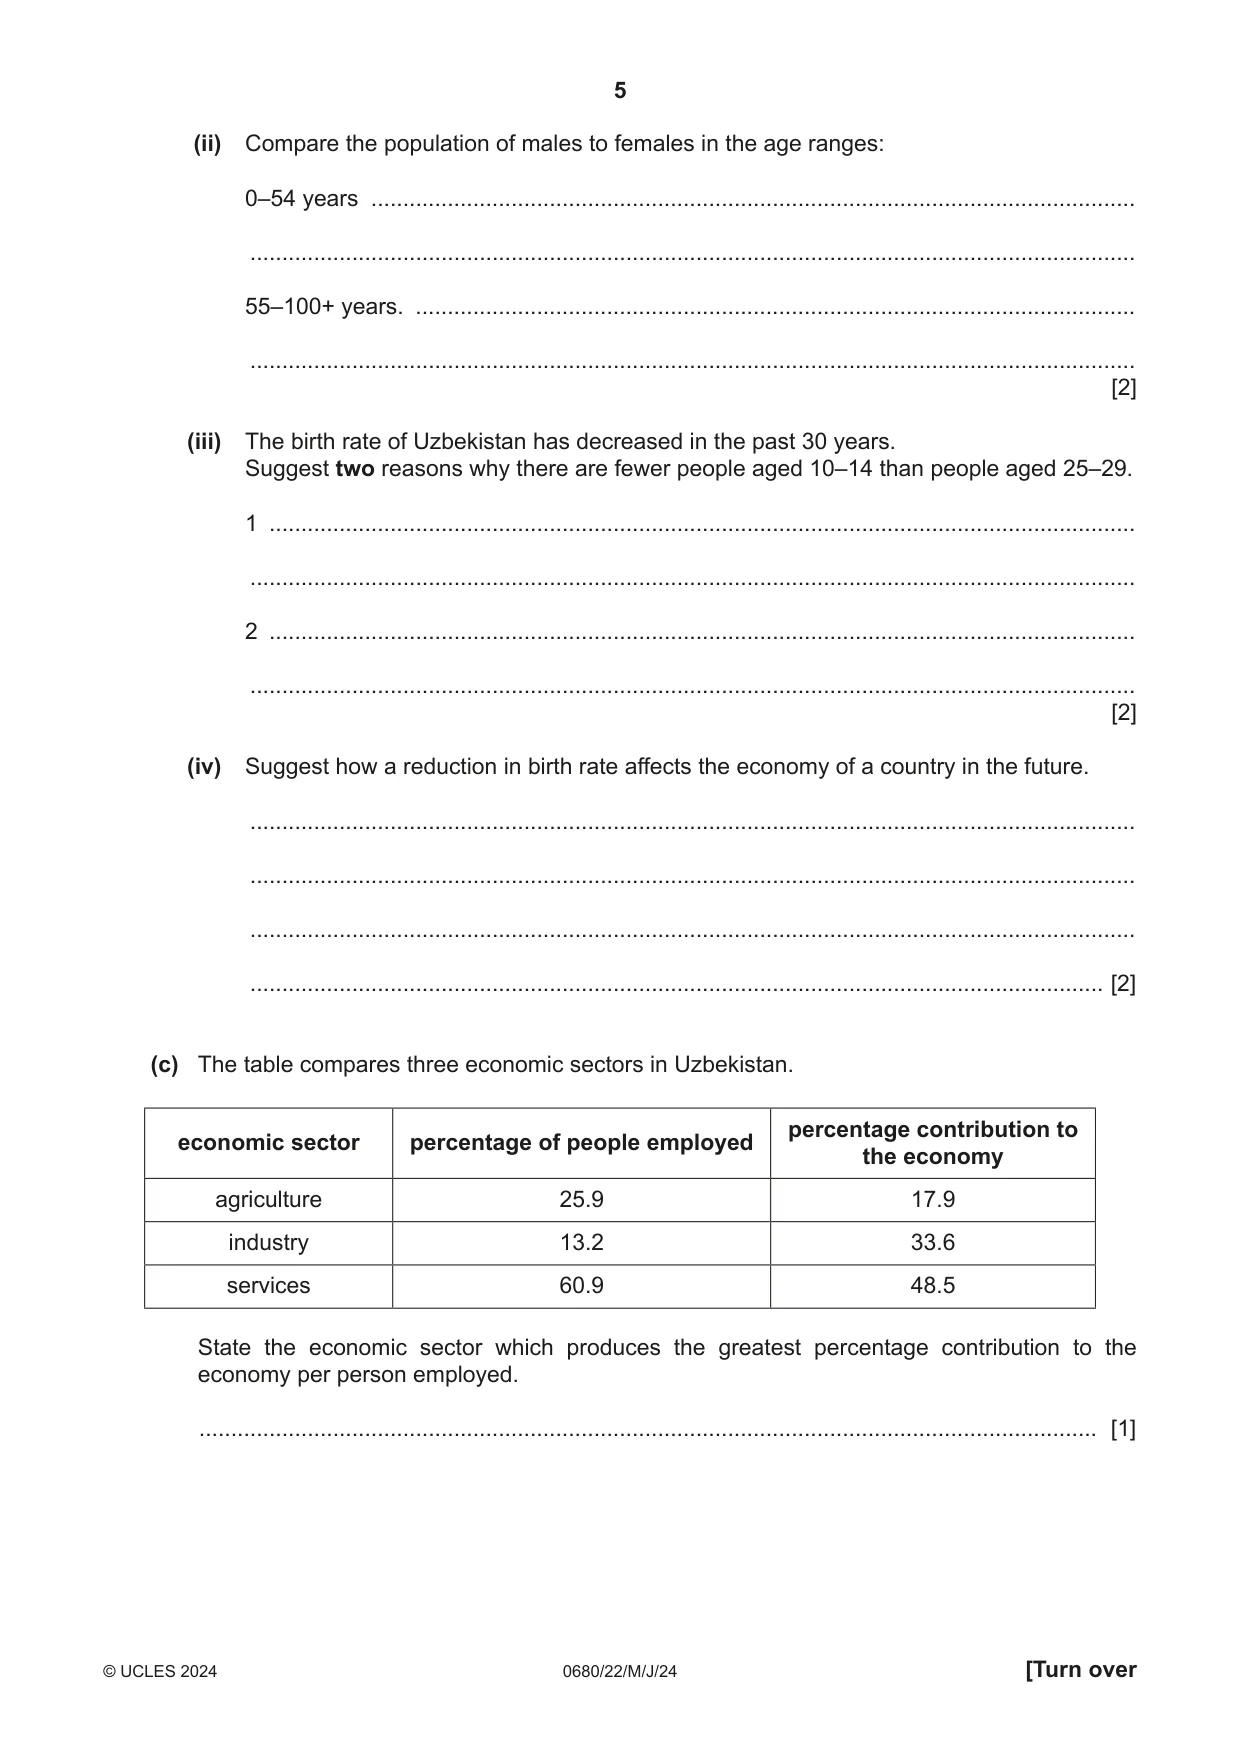
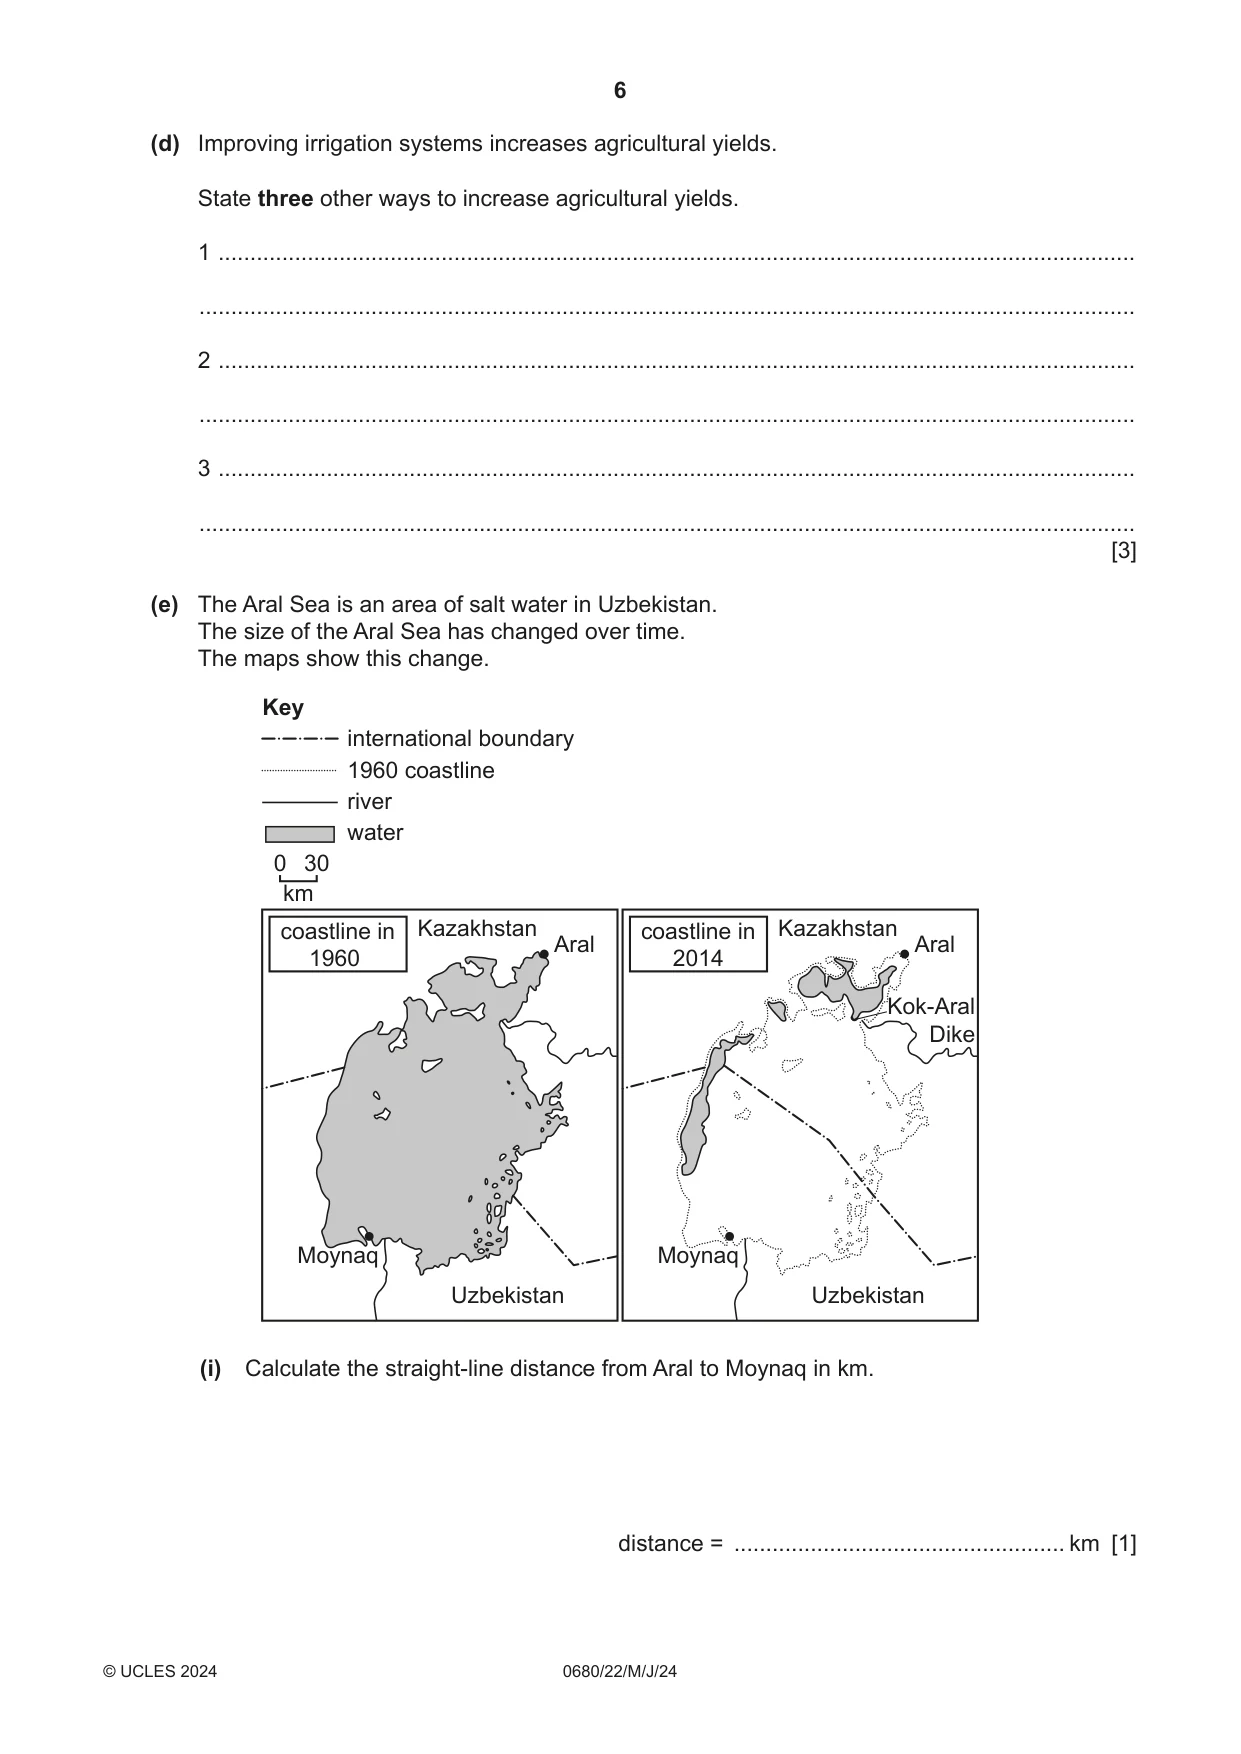
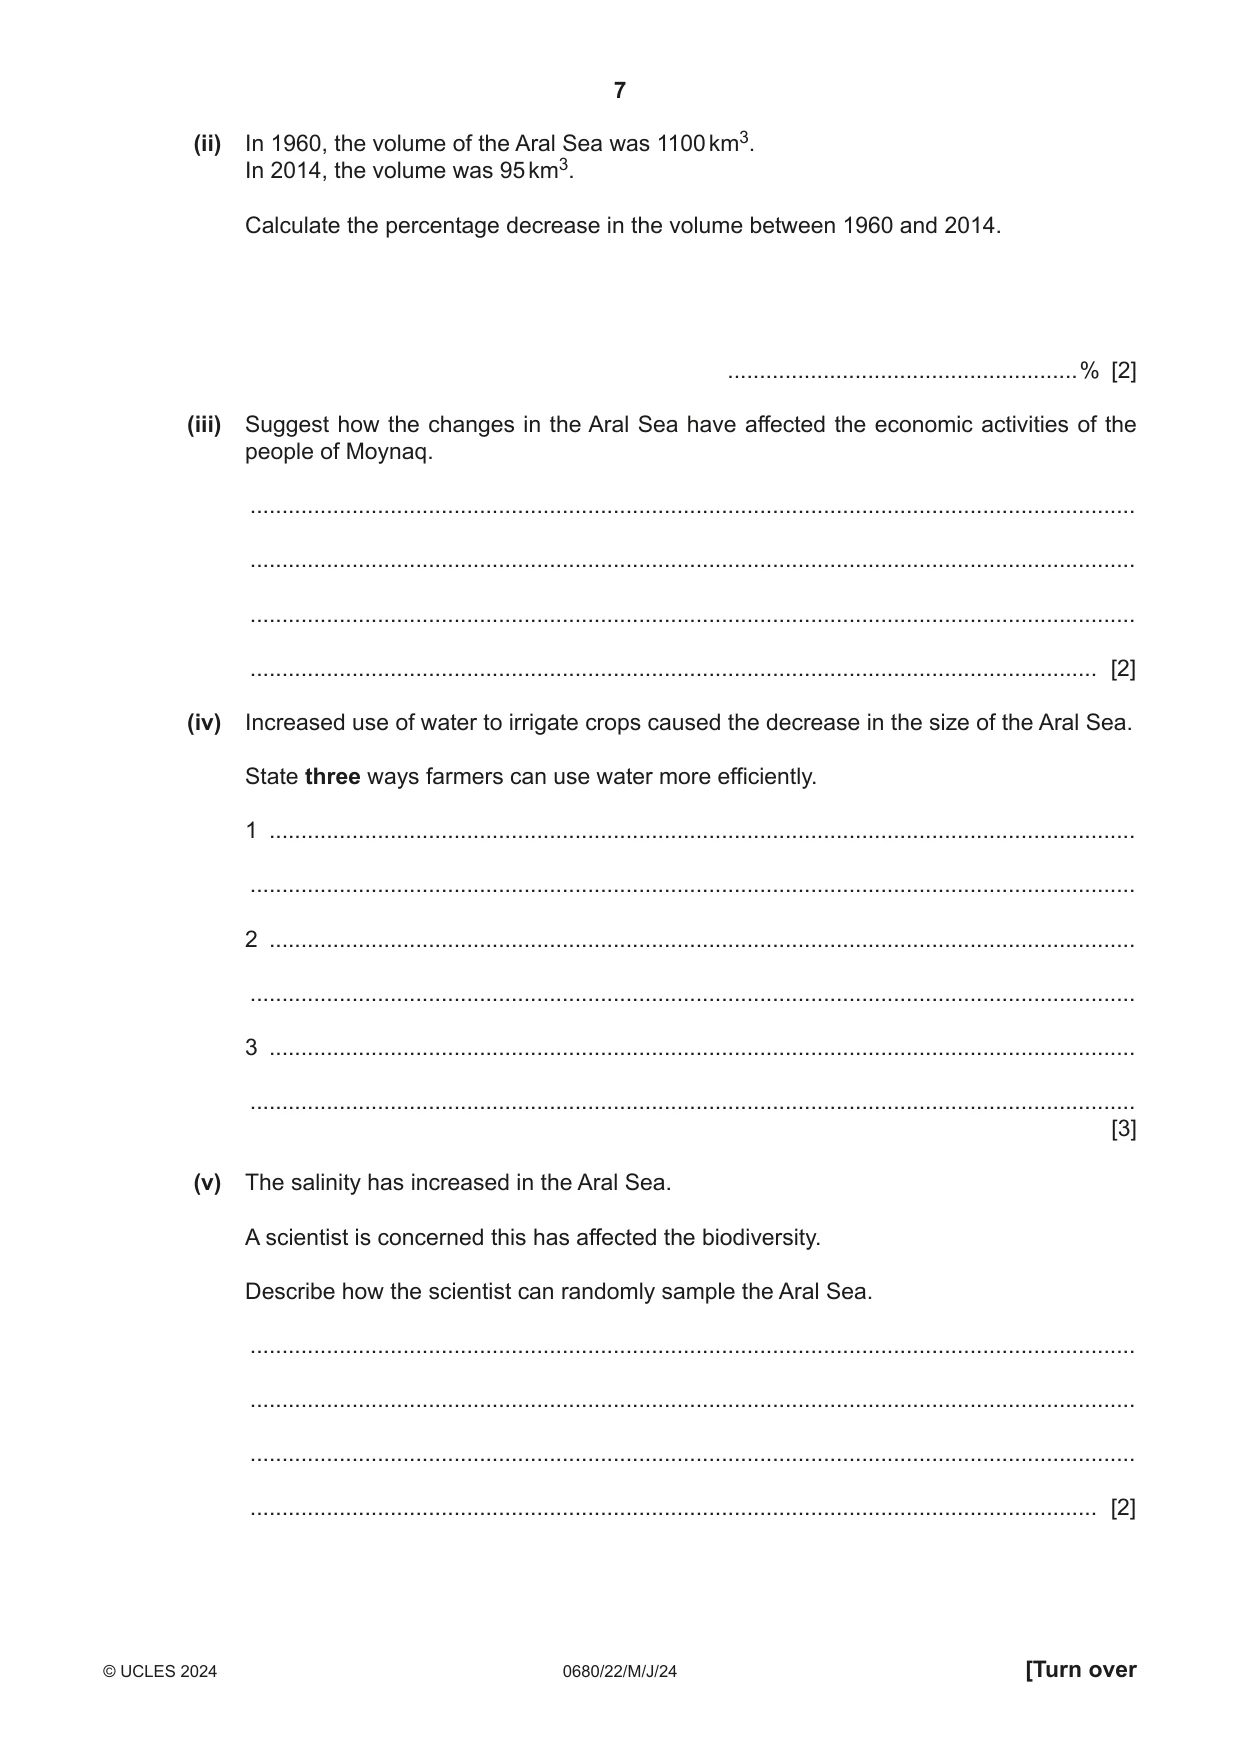
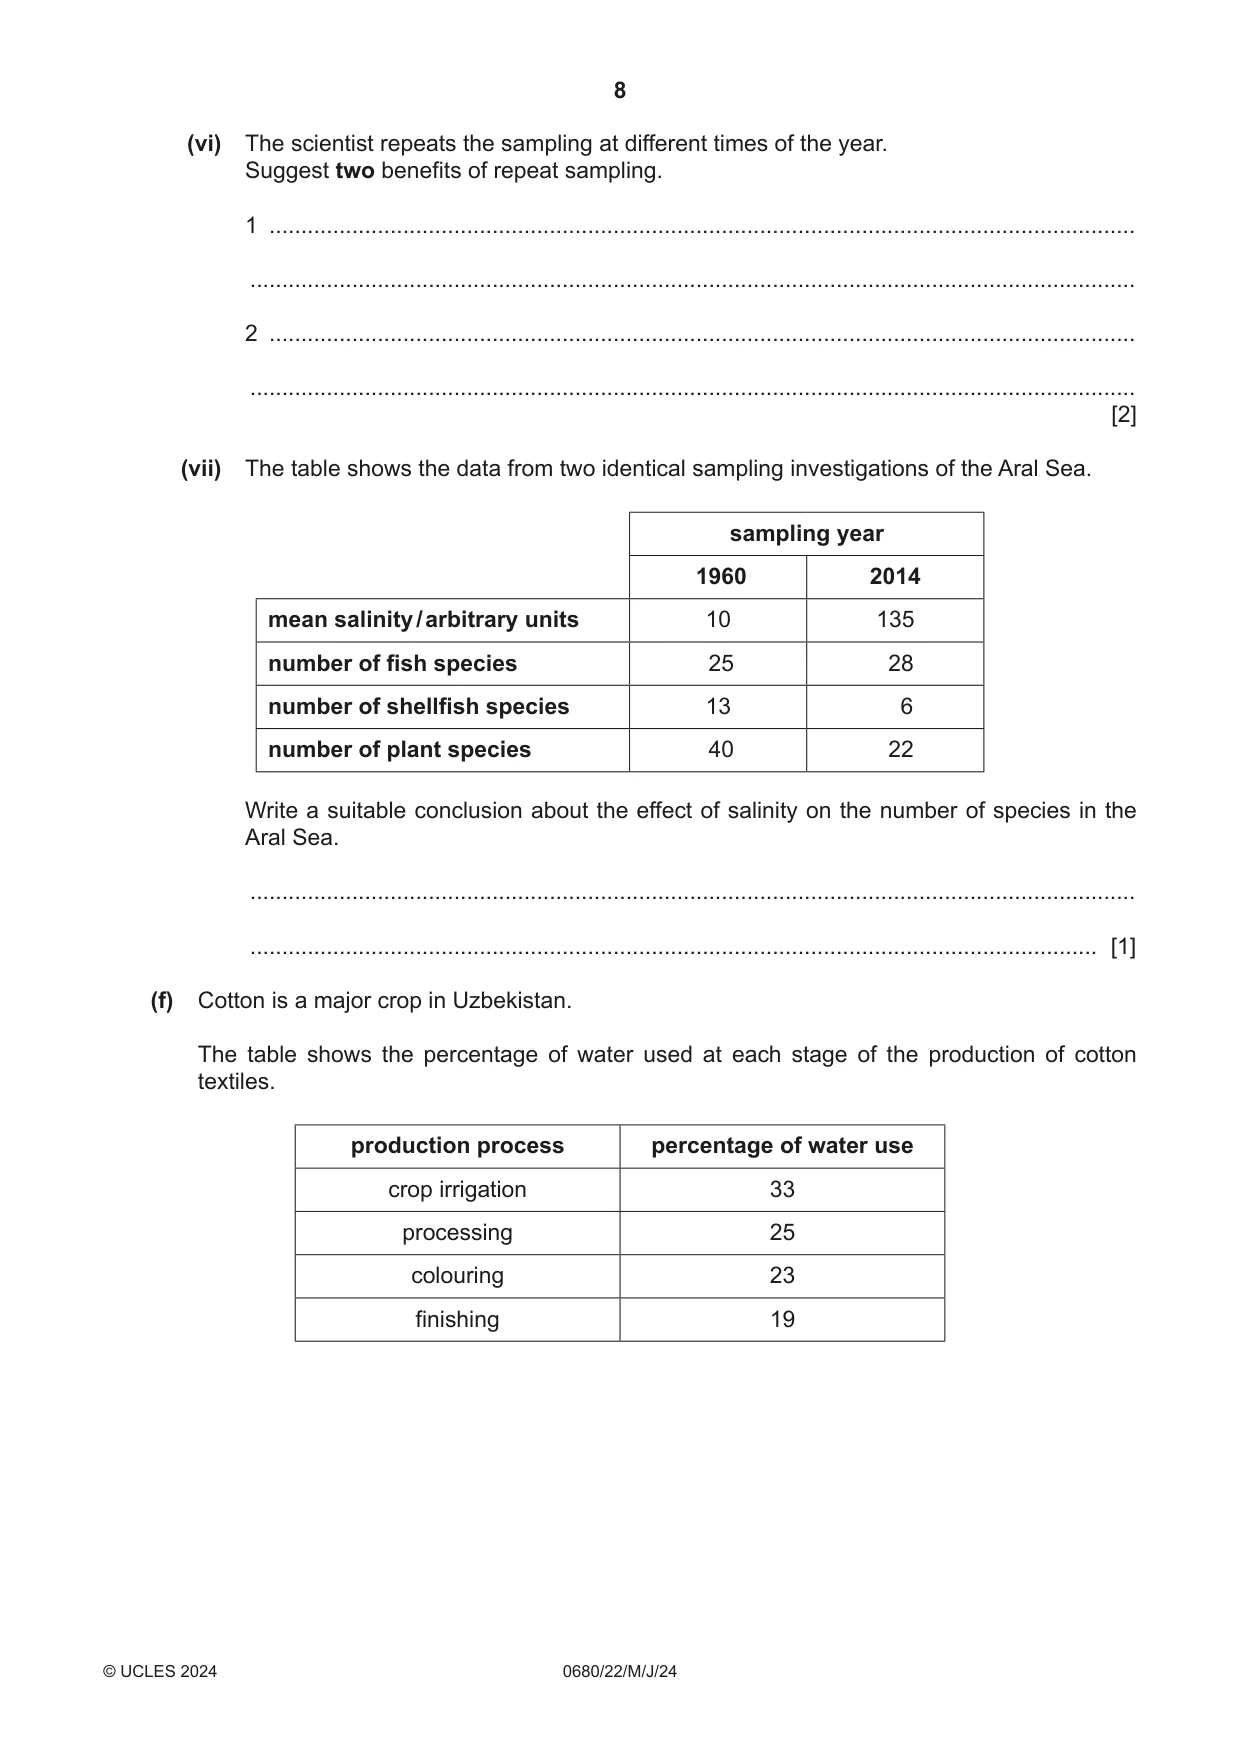
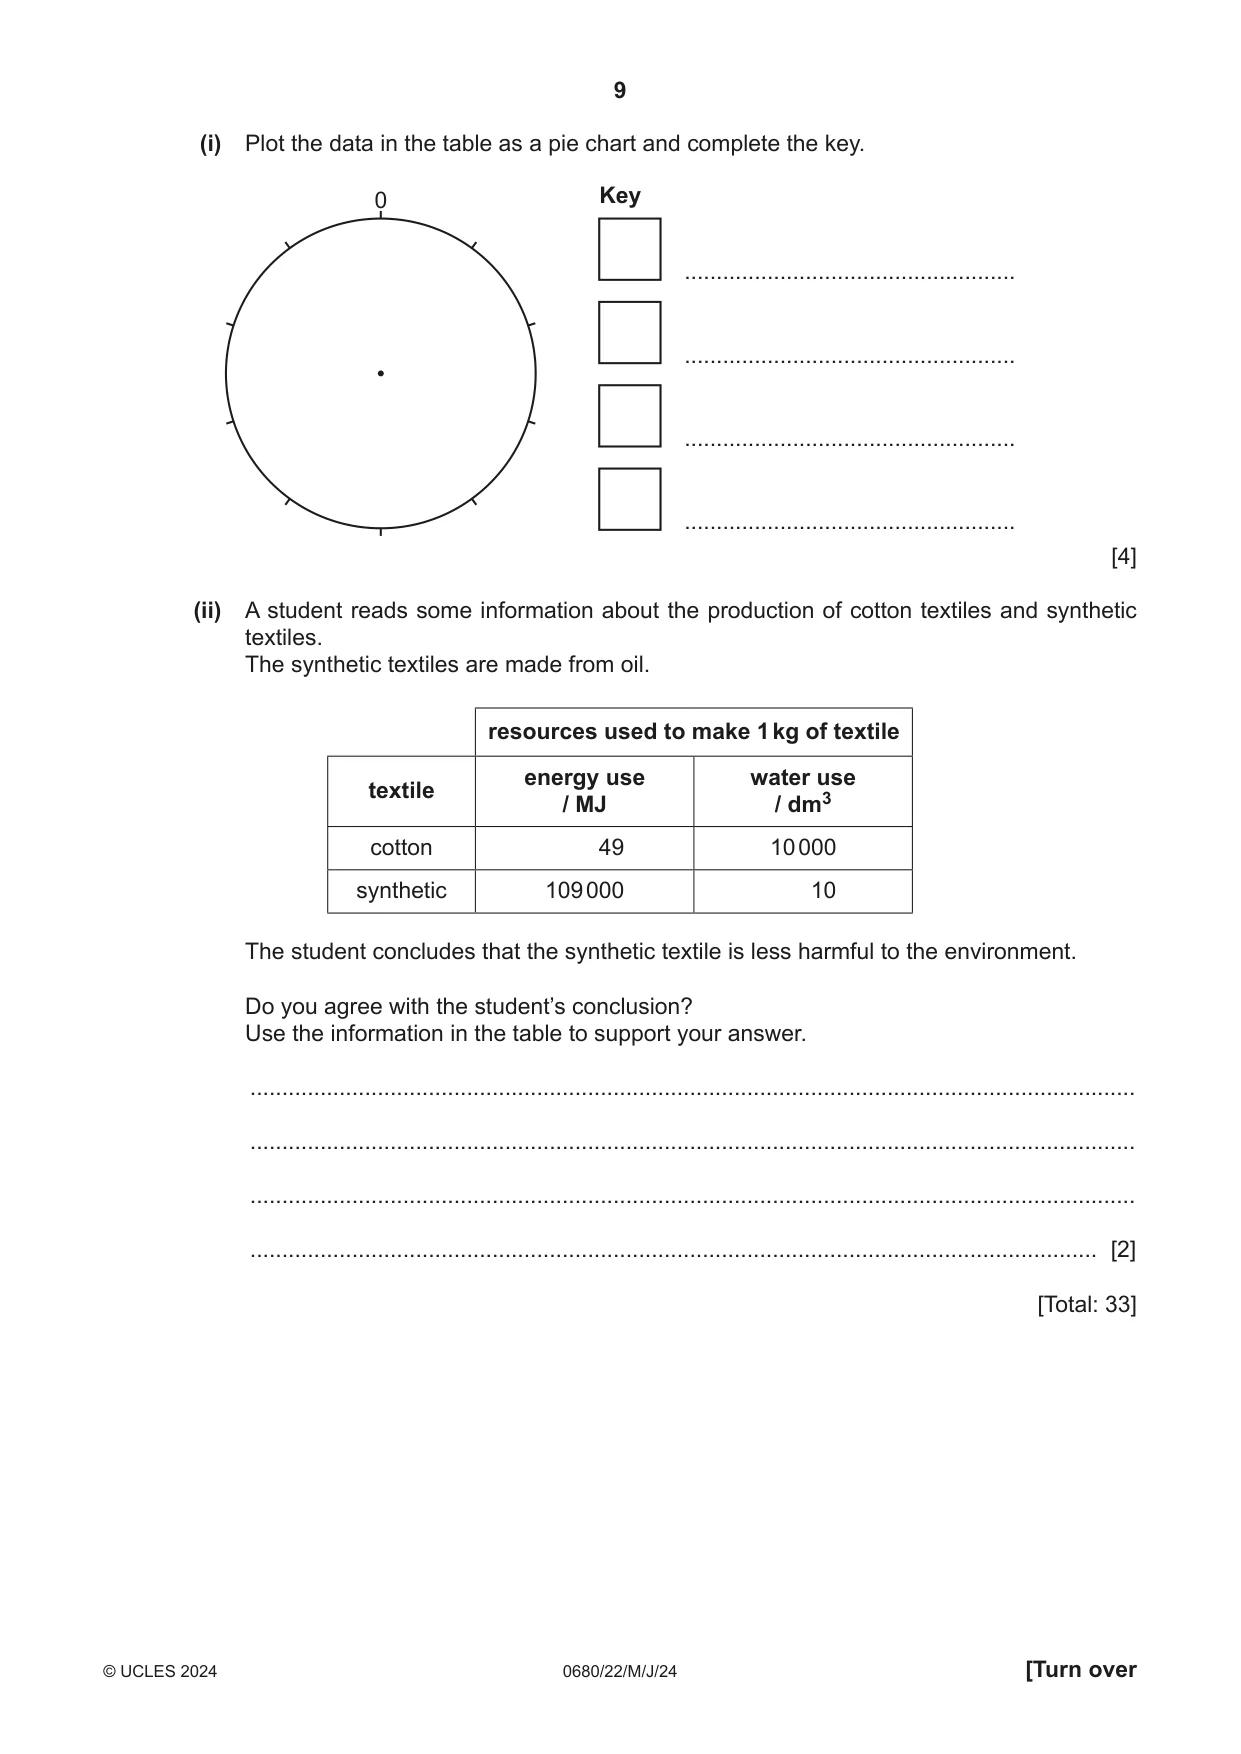
1 (a) (i) Calculate the population density in Uzbekistan in 2021. .......................................people / km2 [1] (ii) 51% of the population of Uzbekistan live in urban areas. Suggest two reasons why the population is not evenly distributed across the country. 1 ........................................................................................................................................ ........................................................................................................................................... 2 ........................................................................................................................................ ........................................................................................................................................... [2] (b) The diagram shows the population pyramid for Uzbekistan in 2021. 100+ 95–99 90–94 85–89 male female 80–84 75–79 70–74 65–69 60–64 55–59 age 50–54 45–49 40–44 35–39 30–34 25–29 20–24 15–19 10–14 5–9 0–4 2.0 1.5 1.0 0.5 0 0.5 1.0 1.5 2.0 population / million (i) Calculate the number of females between the ages of 25 and 34. ............................................... million [1] (ii) Compare the population of males to females in the age ranges: 0–54 years ........................................................................................................................ ........................................................................................................................................... 55–100+ years. ................................................................................................................. ........................................................................................................................................... [2] (iii) The birth rate of Uzbekistan has decreased in the past 30 years. Suggest two reasons why there are fewer people aged 10–14 than people aged 25–29. 1 ........................................................................................................................................ ........................................................................................................................................... 2 ........................................................................................................................................ ........................................................................................................................................... [2] (iv) Suggest how a reduction in birth rate affects the economy of a country in the future. ........................................................................................................................................... ........................................................................................................................................... ........................................................................................................................................... ...................................................................................................................................... [2] (c) The table compares three economic sectors in Uzbekistan. percentage contribution to economic sector percentage of people employed the economy agriculture 25.9 17.9 industry 13.2 33.6 services 60.9 48.5 State the economic sector which produces the greatest percentage contribution to the economy per person employed. ............................................................................................................................................. [1] (d) Improving irrigation systems increases agricultural yields. State three other ways to increase agricultural yields. 1 ................................................................................................................................................ ................................................................................................................................................... 2 ................................................................................................................................................ ................................................................................................................................................... 3 ................................................................................................................................................ ................................................................................................................................................... [3] (e) The Aral Sea is an area of salt water in Uzbekistan. The size of the Aral Sea has changed over time. The maps show this change. Key international boundary 1960 coastline river water 0 30 km coastline in Kazakhstan coastline in Kazakhstan Aral Aral 1960 2014 Kok-Aral Dike Moynaq Moynaq Uzbekistan Uzbekistan (i) Calculate the straight‑line distance from Aral to Moynaq in km. distance = .................................................... km [1] (ii) In 1960, the volume of the Aral Sea was 1100 km3. In 2014, the volume was 95 km3. Calculate the percentage decrease in the volume between 1960 and 2014. .......................................................% [2] (iii) Suggest how the changes in the Aral Sea have affected the economic activities of the people of Moynaq. ........................................................................................................................................... ........................................................................................................................................... ........................................................................................................................................... ..................................................................................................................................... [2] (iv) Increased use of water to irrigate crops caused the decrease in the size of the Aral Sea. State three ways farmers can use water more efficiently. 1 ........................................................................................................................................ ........................................................................................................................................... 2 ........................................................................................................................................ ........................................................................................................................................... 3 ........................................................................................................................................ ........................................................................................................................................... [3] (v) The salinity has increased in the Aral Sea. A scientist is concerned this has affected the biodiversity. Describe how the scientist can randomly sample the Aral Sea. ........................................................................................................................................... ........................................................................................................................................... ........................................................................................................................................... ..................................................................................................................................... [2] (vi) The scientist repeats the sampling at different times of the year. Suggest two benefits of repeat sampling. 1 ........................................................................................................................................ ........................................................................................................................................... 2 ........................................................................................................................................ ........................................................................................................................................... [2] (vii) The table shows the data from two identical sampling investigations of the Aral Sea. sampling year 1960 2014 mean salinity / arbitrary units 10 135 number of fish species 25 28 number of shellfish species 13 6 number of plant species 40 22 Write a suitable conclusion about the effect of salinity on the number of species in the Aral Sea. ........................................................................................................................................... ..................................................................................................................................... [1] (f) Cotton is a major crop in Uzbekistan. The table shows the percentage of water used at each stage of the production of cotton textiles. production process percentage of water use crop irrigation 33 processing 25 colouring 23 finishing 19 (i) Plot the data in the table as a pie chart and complete the key. 0 Key .................................................... .................................................... .................................................... .................................................... [4] (ii) A student reads some information about the production of cotton textiles and synthetic textiles. The synthetic textiles are made from oil. resources used to make 1 kg of textile energy use water use textile / MJ / dm3 cotton 49 10 000 synthetic 109 000 10 The student concludes that the synthetic textile is less harmful to the environment. Do you agree with the student’s conclusion? Use the information in the table to support your answer. ........................................................................................................................................... ........................................................................................................................................... ........................................................................................................................................... ..................................................................................................................................... [2] [Total: 33]
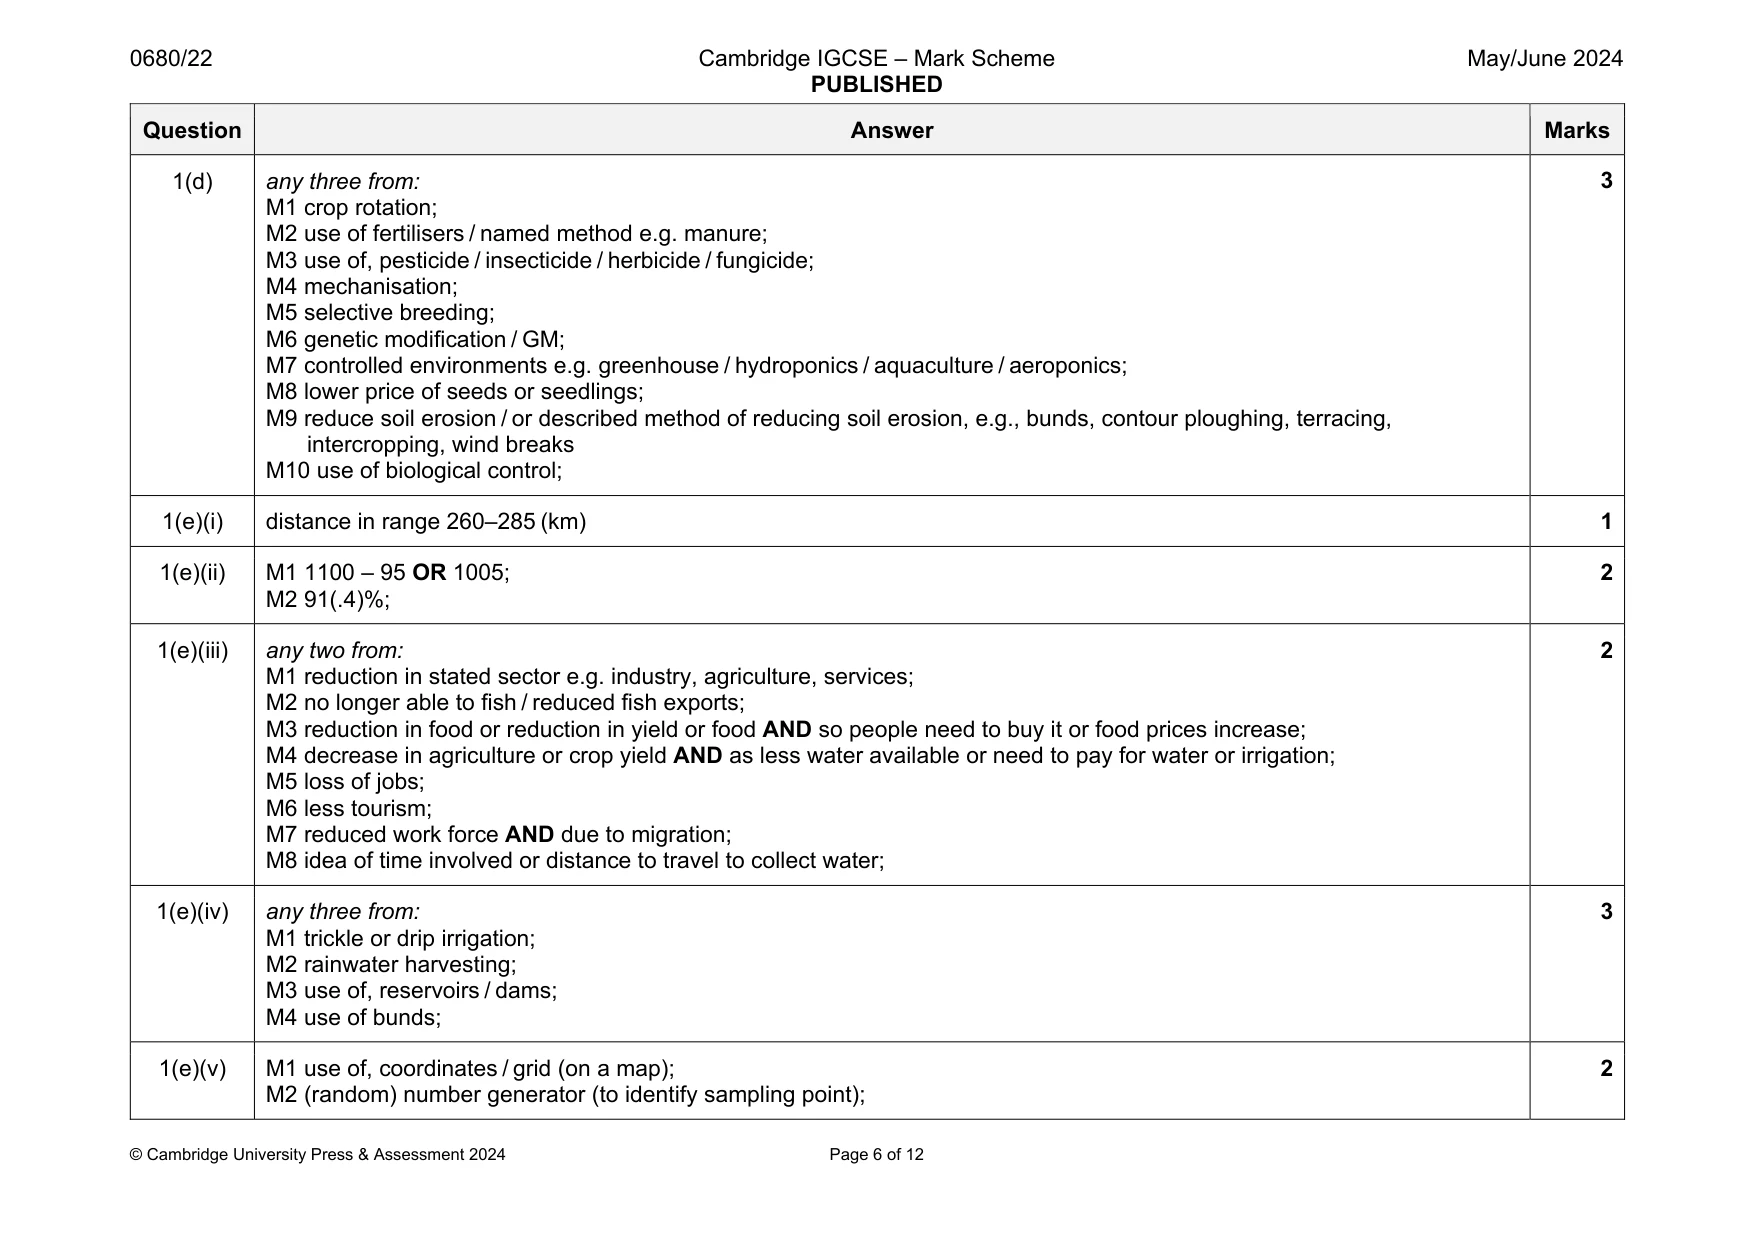
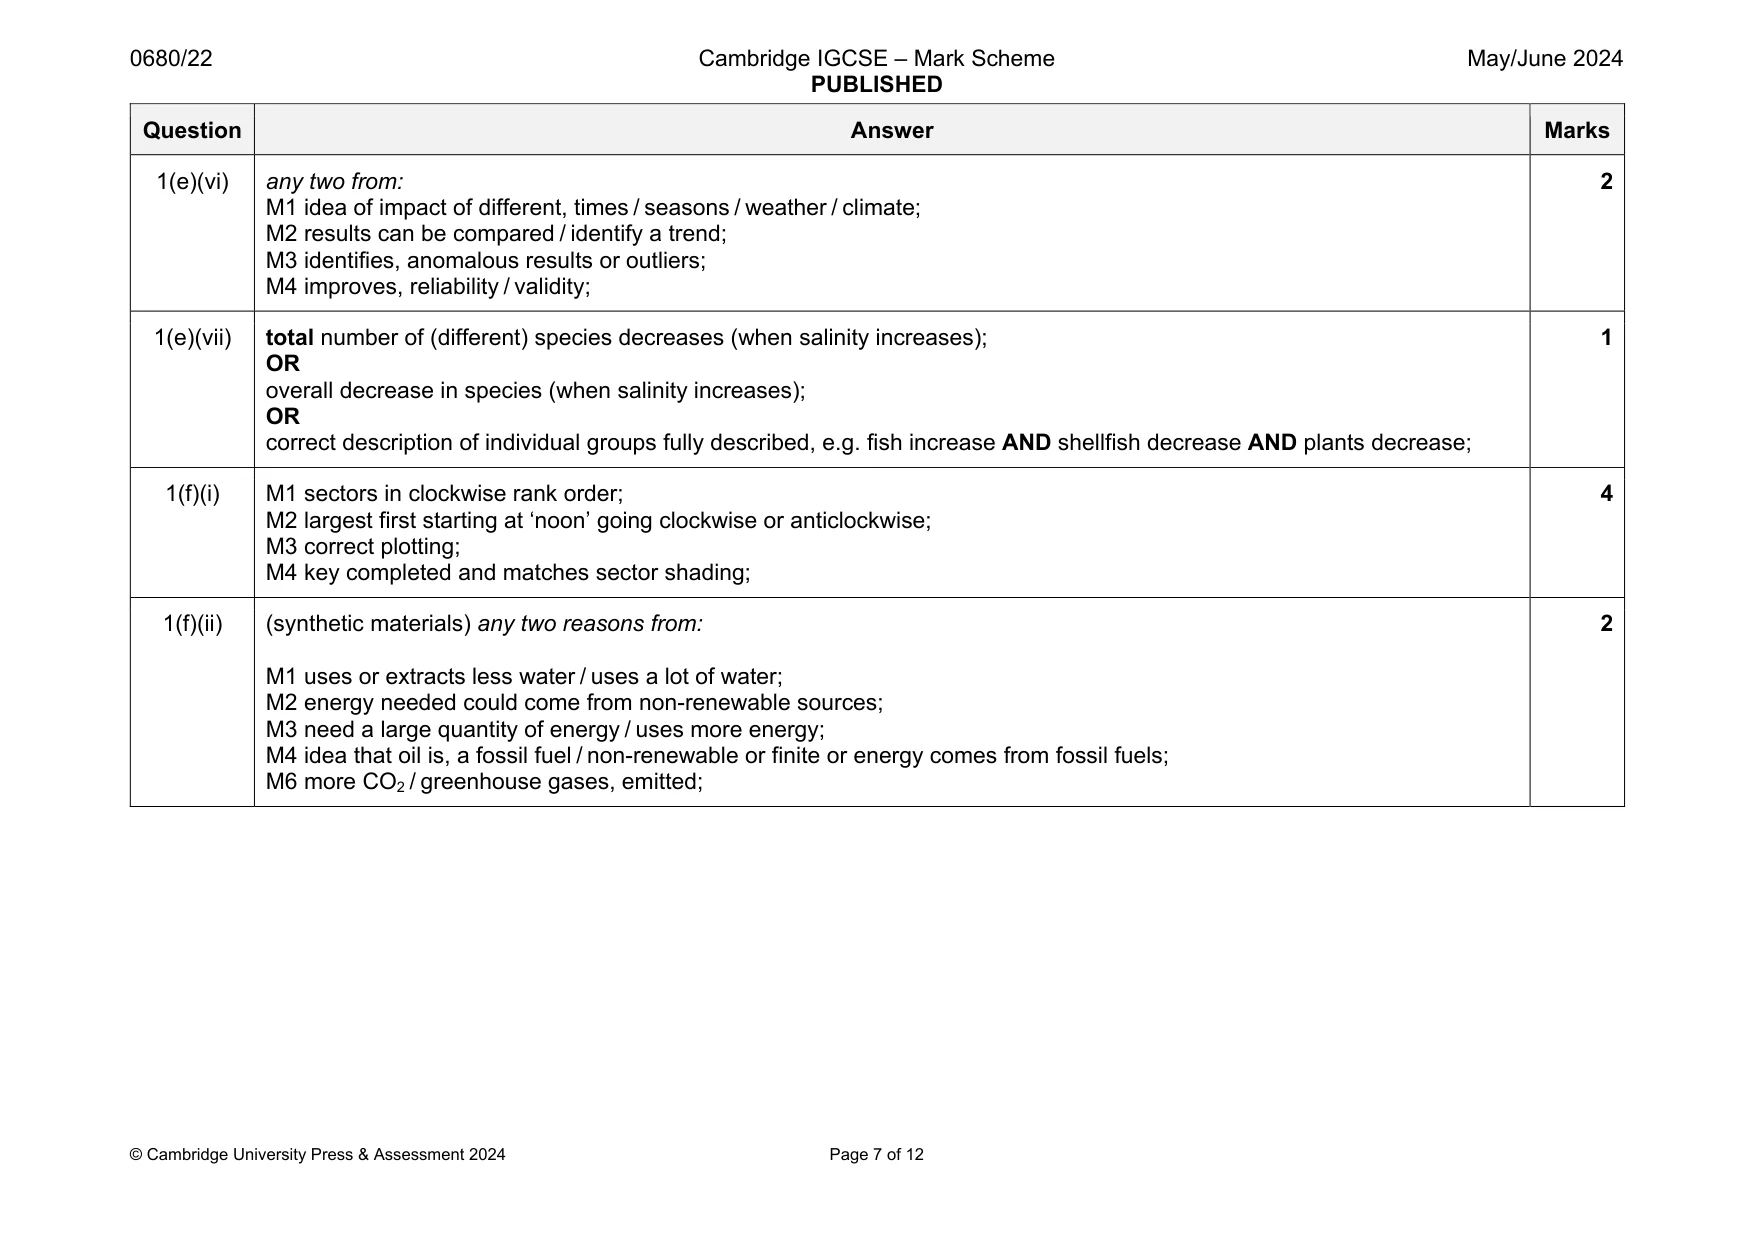
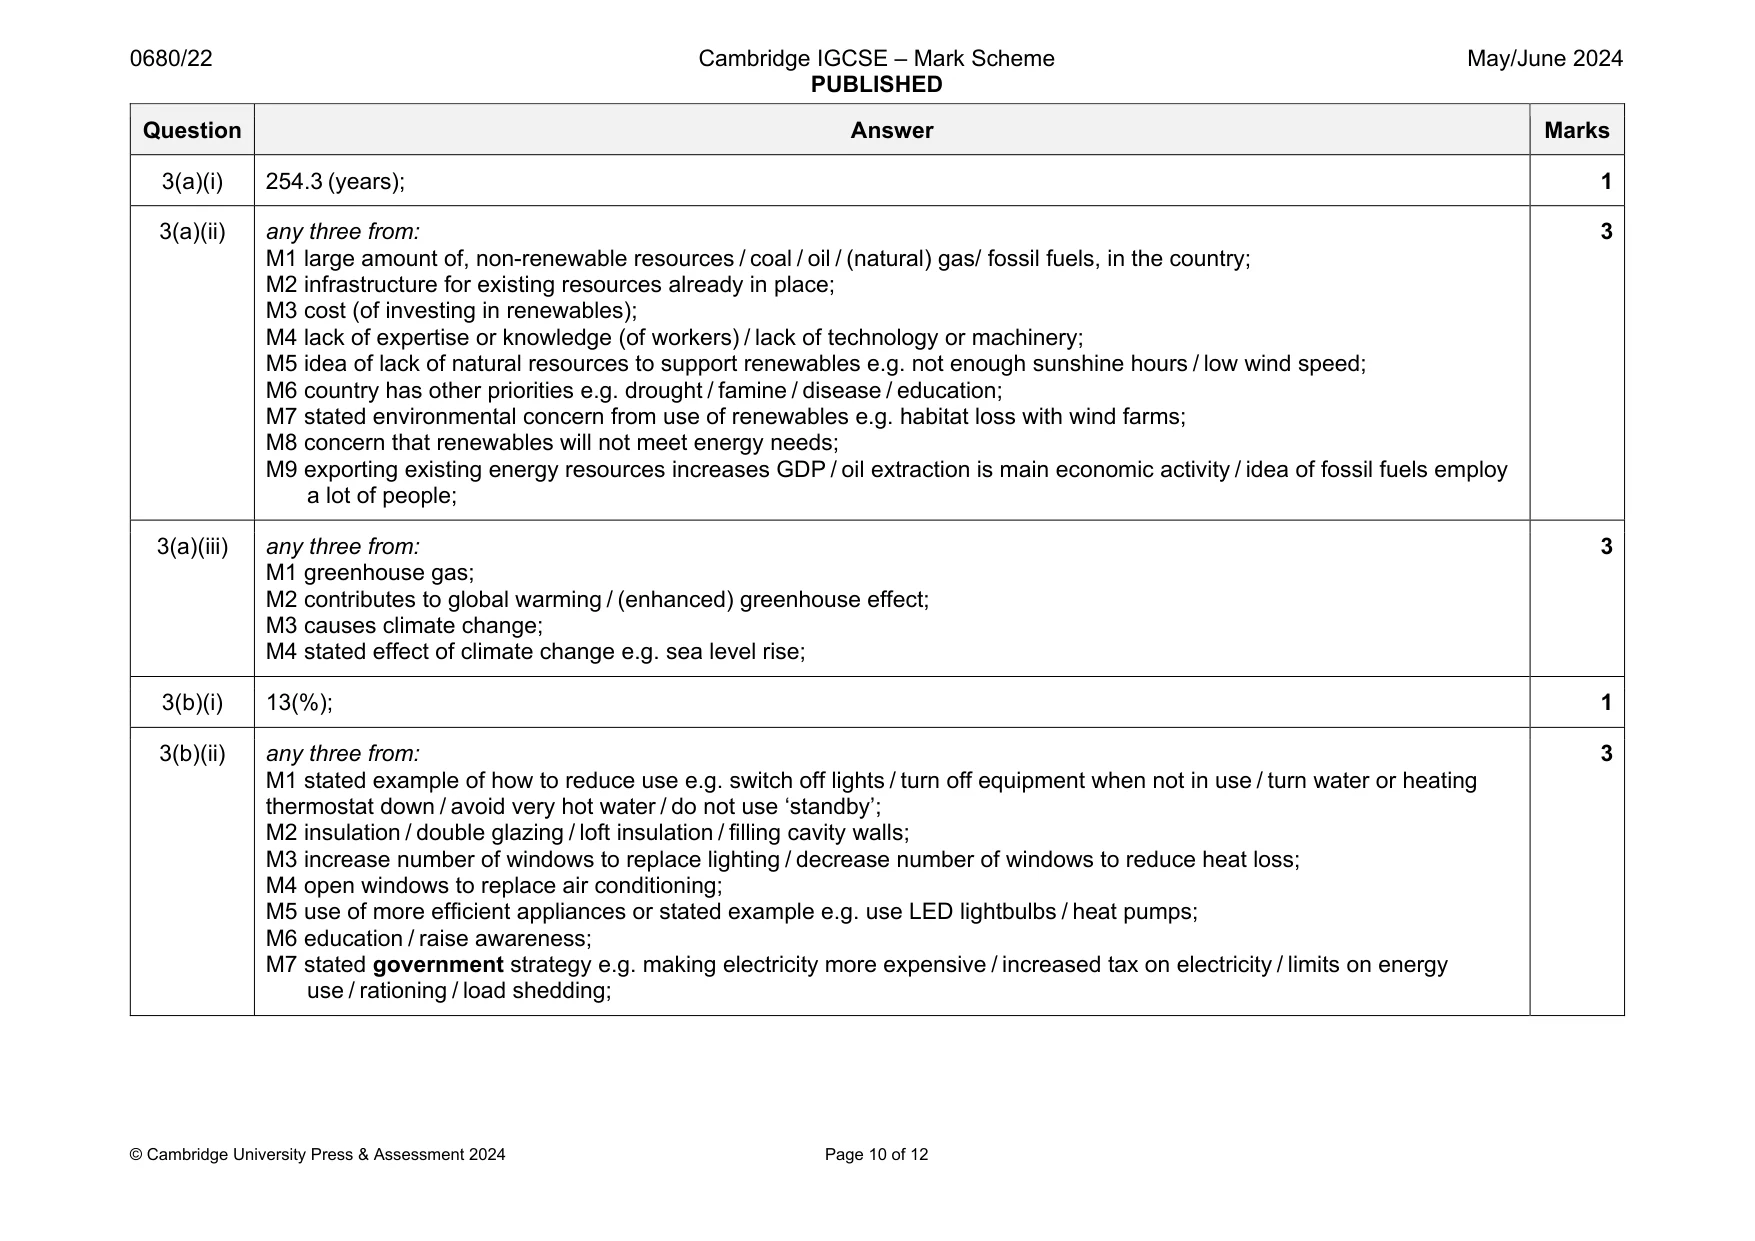
Mark scheme: 1(a)(i) 69(.3); 1 1(a)(ii) any two from: M1 mainly desert; M2 soil is infertile (most of country) / (only) fertile in east or valleys; M3 availability of jobs; M4 availability of stated resource e.g. water / food / agriculture / energy; M5 availability of infrastructure or named example e.g. roads; M6 availability of education; M7 availability of healthcare / sanitation or named example e.g. hospitals; M8 risk of natural disasters e.g. drought; 2 1(b)(i) 3.1 (million); 1 1(b)(ii) M1 0–54: (approximately) the same / similar / even; M2 55–100+: more females than males / females live longer / for both males and females from 55 to 100 population decreasing; 2 1(b)(iii) any two from: M1 education, use or access to or lower cost of, birth control/contraceptives; M2 stated or described government policy that limits or discourages number of children born e.g. anti-natalist; M3 idea of change healthcare; M4 reduction in availability of stated resource e.g. food, (clean) water; M5 improved education / increased opportunities for women; M6 disease; 2 1(b)(iv) any two from: M1 reduced, economy / GDP; M2 less taxation / less income, (for government or country); M3 reduction in, work force / economically active people / less people available to work; M4 idea of increase in share of cost to workers or younger people for, healthcare / education / pensions / elder care; M5 less spending on, schools / education; 2 1(c) industry; 1 Question Answer Marks 1(d) any three from: M1 crop rotation; M2 use of fertilisers / named method e.g. manure; M3 use of, pesticide / insecticide / herbicide / fungicide; M4 mechanisation; M5 selective breeding; M6 genetic modification / GM; M7 controlled environments e.g. greenhouse / hydroponics / aquaculture / aeroponics; M8 lower price of seeds or seedlings; M9 reduce soil erosion / or described method of reducing soil erosion, e.g., bunds, contour ploughing, terracing, intercropping, wind breaks M10 use of biological control; 3 1(e)(i) distance in range 260–285 (km) 1 1(e)(ii) M1 1100 – 95 OR 1005; M2 91(.4)%; 2 1(e)(iii) any two from: M1 reduction in stated sector e.g. industry, agriculture, services; M2 no longer able to fish / reduced fish exports; M3 reduction in food or reduction in yield or food AND so people need to buy it or food prices increase; M4 decrease in agriculture or crop yield AND as less water available or need to pay for water or irrigation; M5 loss of jobs; M6 less tourism; M7 reduced work force AND due to migration; M8 idea of time involved or distance to travel to collect water; 2 1(e)(iv) any three from: M1 trickle or drip irrigation; M2 rainwater harvesting; M3 use of, reservoirs / dams; M4 use of bunds; 3 1(e)(v) M1 use of, coordinates / grid (on a map); M2 (random) number generator (to identify sampling point); 2 Question Answer Marks 1(e)(vi) any two from: M1 idea of impact of different, times / seasons / weather / climate; M2 results can be compared / identify a trend; M3 identifies, anomalous results or outliers; M4 improves, reliability / validity; 2 1(e)(vii) total number of (different) species decreases (when salinity increases); OR overall decrease in species (when salinity increases); OR correct description of individual groups fully described, e.g. fish increase AND shellfish decrease AND plants decrease; 1 1(f)(i) M1 sectors in clockwise rank order; M2 largest first starting at ‘noon’ going clockwise or anticlockwise; M3 correct plotting; M4 key completed and matches sector shading; 4 1(f)(ii) (synthetic materials) any two reasons from: M1 uses or extracts less water / uses a lot of water; M2 energy needed could come from non-renewable sources; M3 need a large quantity of energy / uses more energy; M4 idea that oil is, a fossil fuel / non-renewable or finite or energy comes from fossil fuels; M6 more CO2 / greenhouse gases, emitted; 2
Q2 · The government of Uzbekistan has introduced strategies to conserve biodiversity
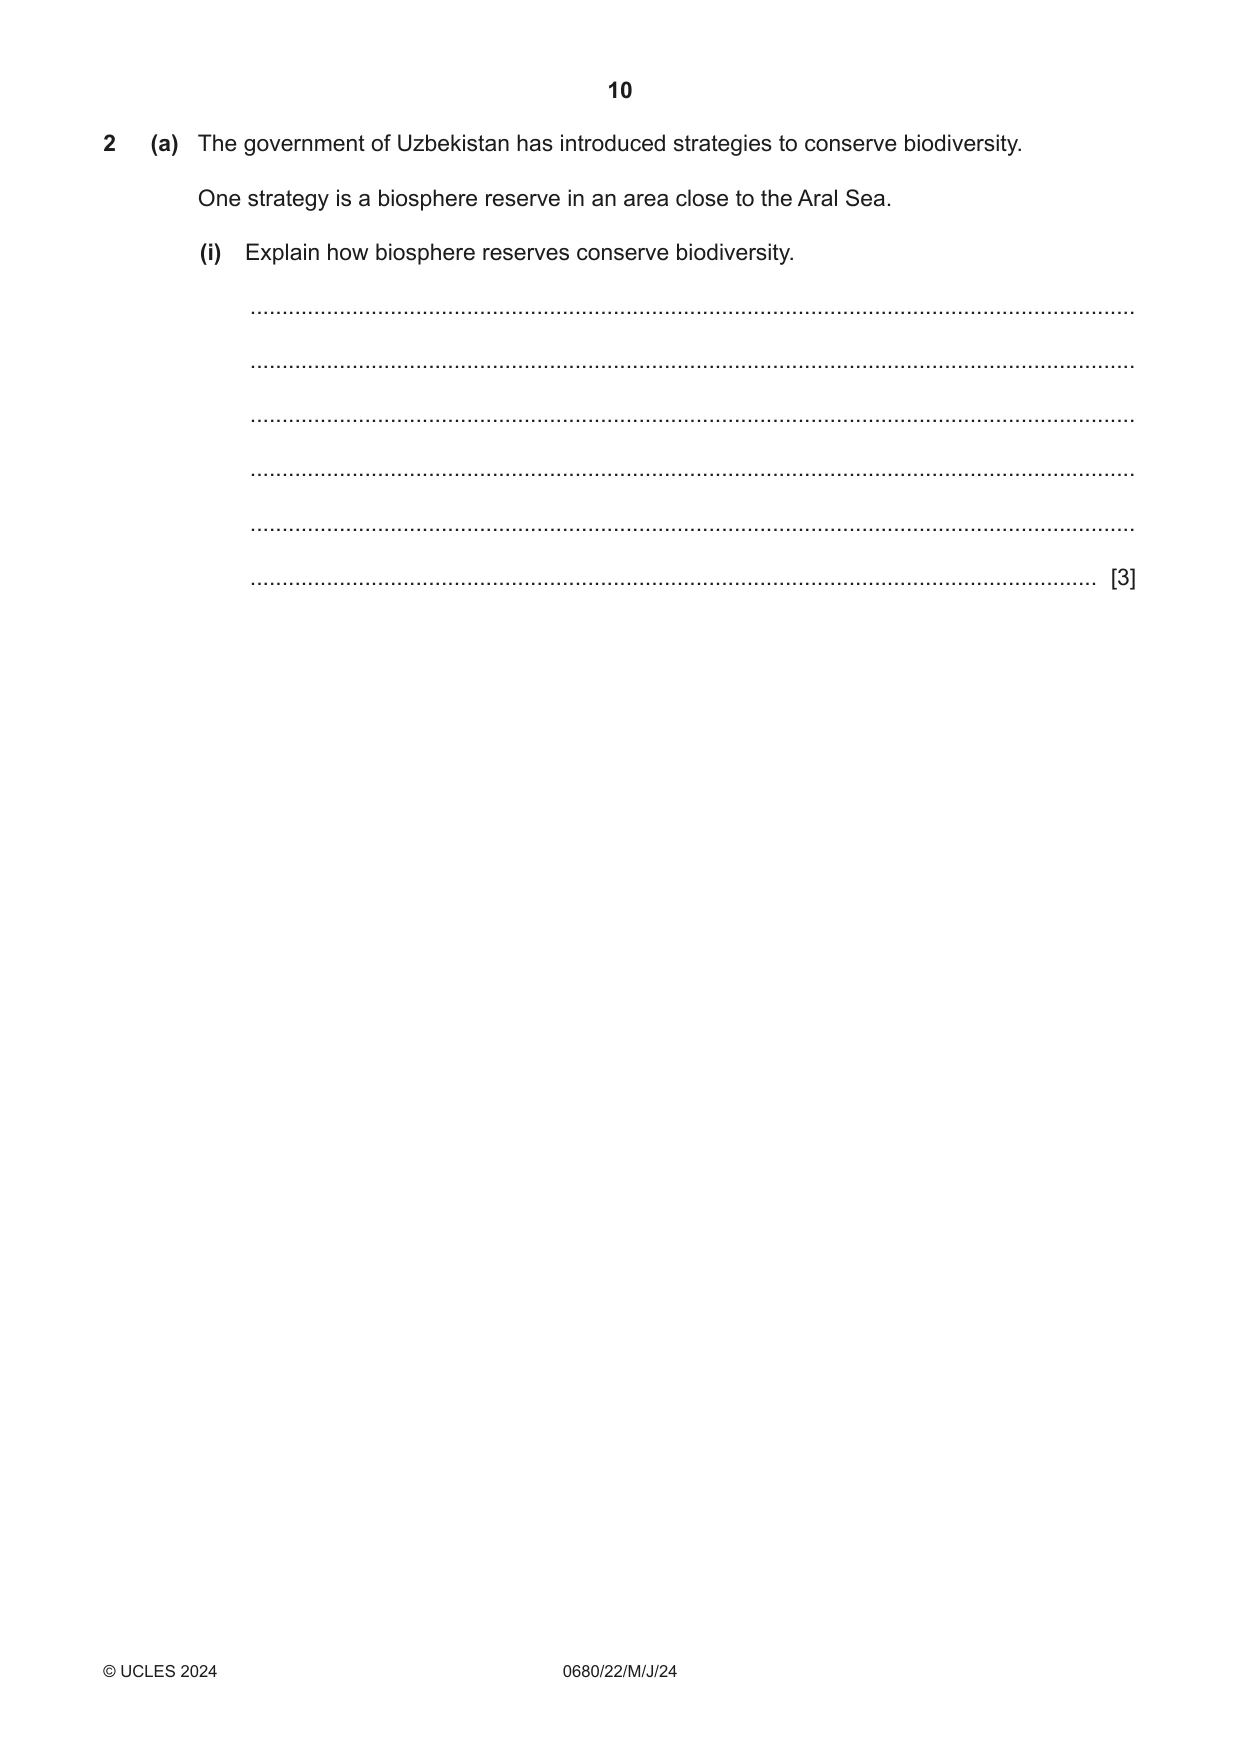
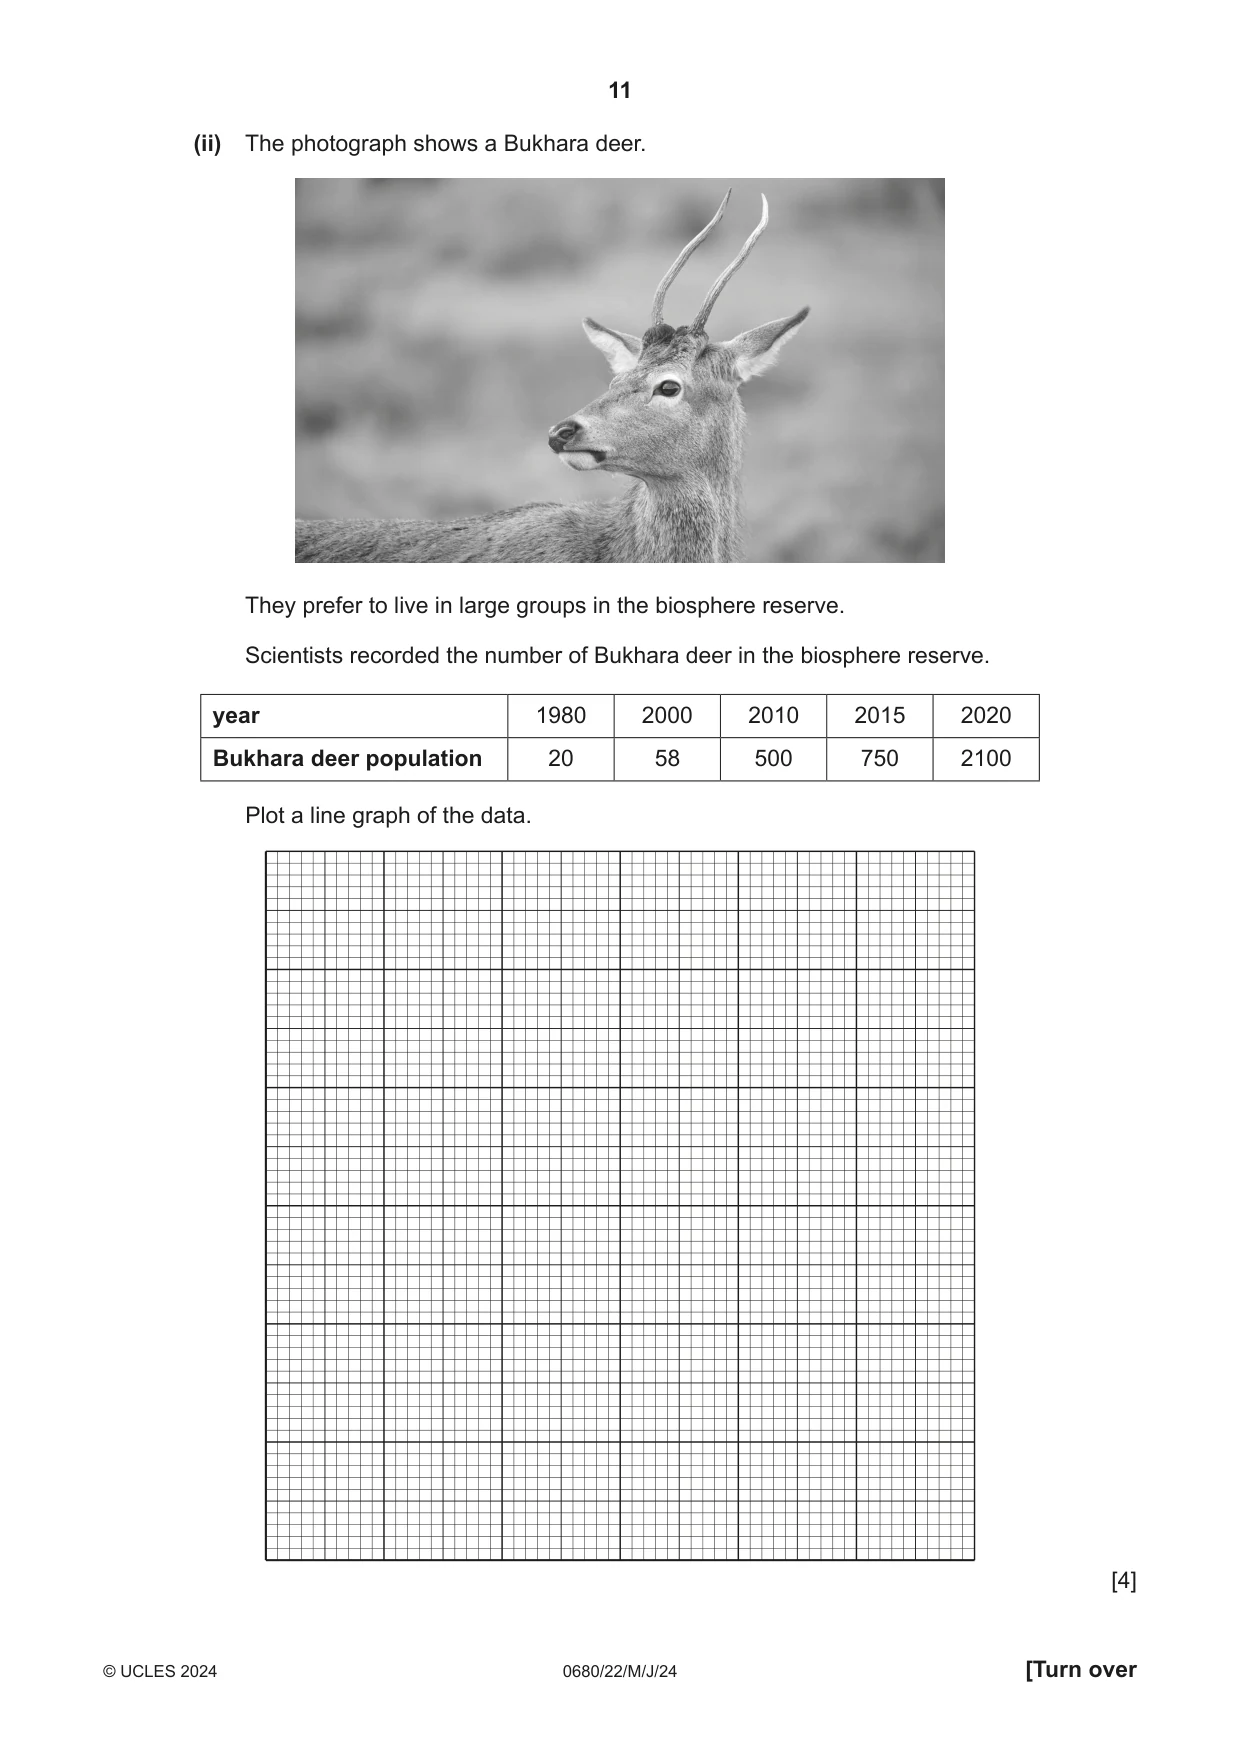
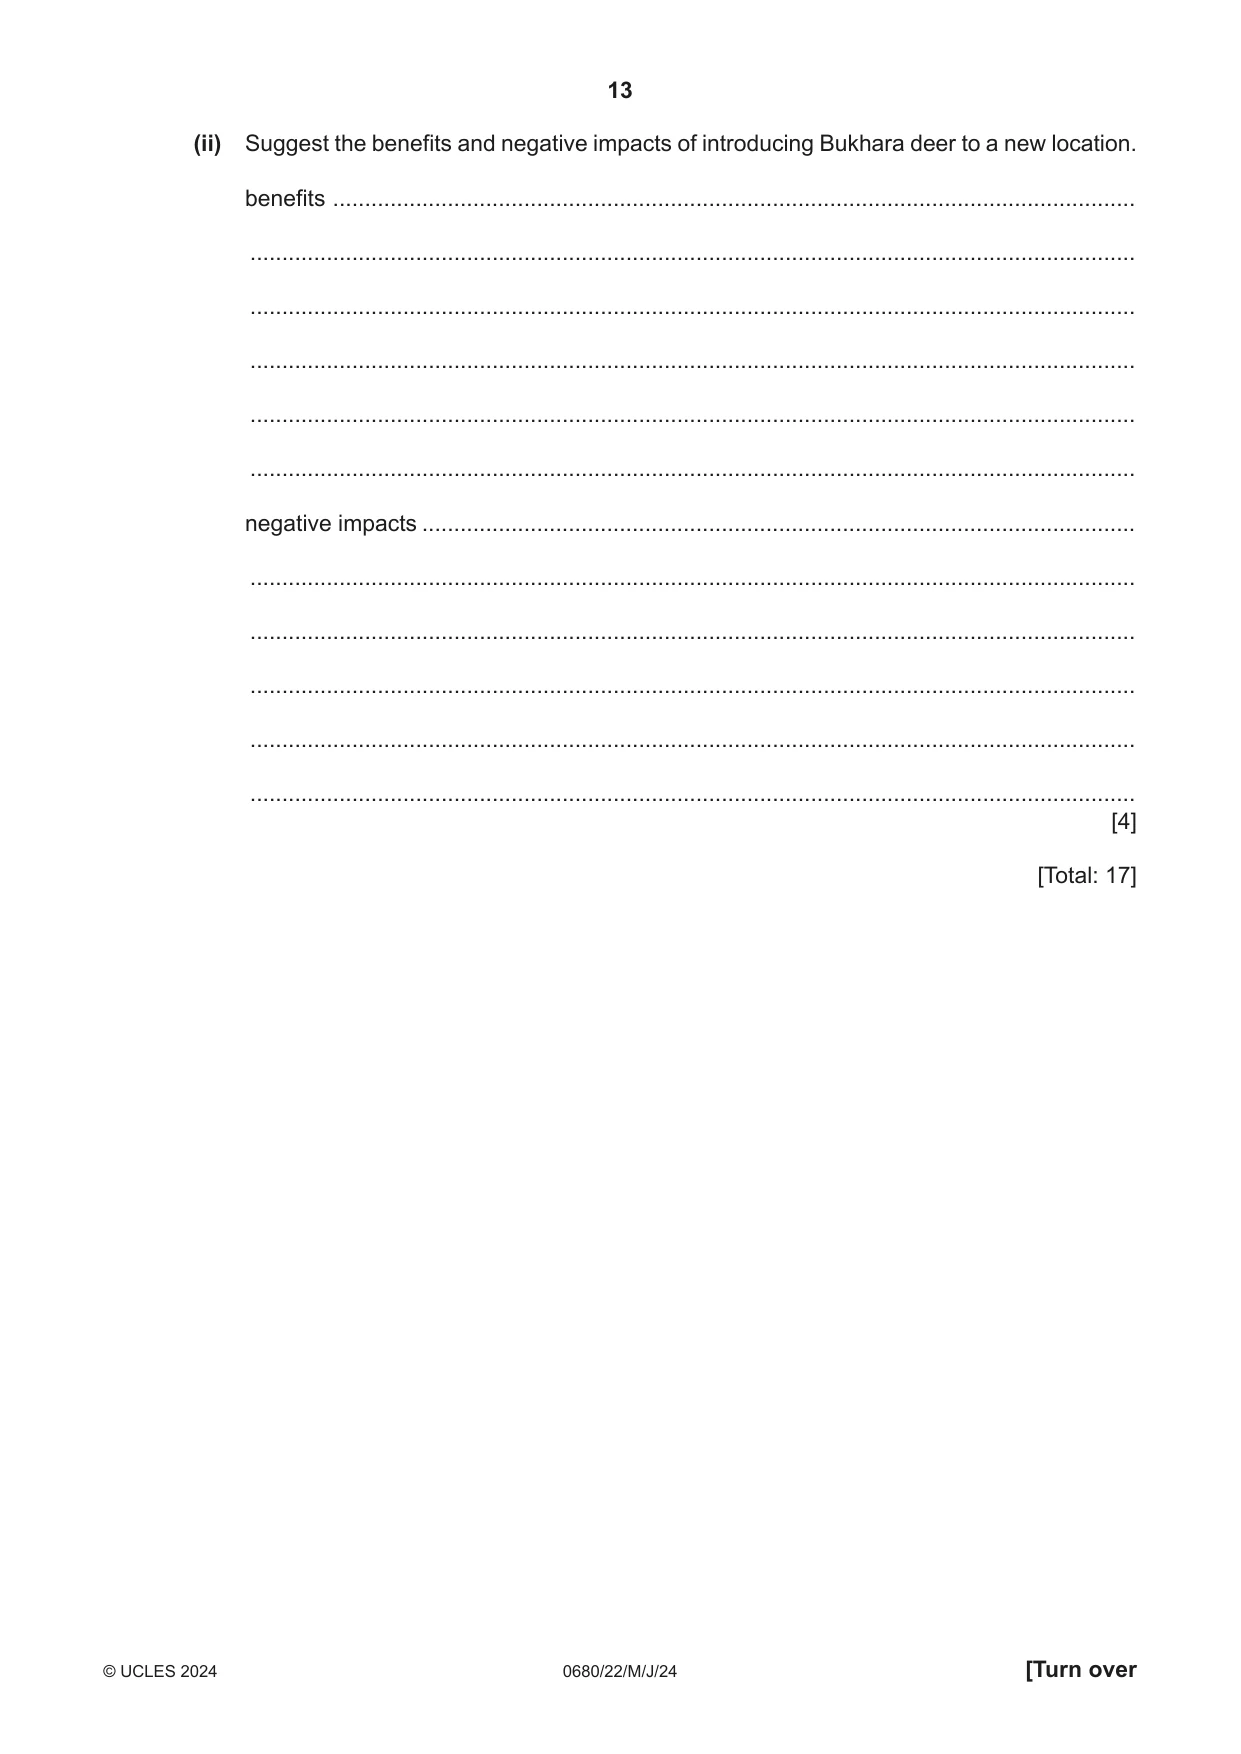
2 (a) The government of Uzbekistan has introduced strategies to conserve biodiversity. One strategy is a biosphere reserve in an area close to the Aral Sea. (i) Explain how biosphere reserves conserve biodiversity. ........................................................................................................................................... ........................................................................................................................................... ........................................................................................................................................... ........................................................................................................................................... ........................................................................................................................................... ..................................................................................................................................... [3] (ii) The photograph shows a Bukhara deer. They prefer to live in large groups in the biosphere reserve. Scientists recorded the number of Bukhara deer in the biosphere reserve. year 1980 2000 2010 2015 2020 Bukhara deer population 20 58 500 750 2100 Plot a line graph of the data. [4] (b) A scientist is concerned that the population of Bukhara deer is now greater than the carrying capacity of the biosphere reserve. (i) Define the term carrying capacity. ........................................................................................................................................... ..................................................................................................................................... [1] (ii) Suggest what will happen if the Bukhara deer population continues to increase in the biosphere reserve. ........................................................................................................................................... ........................................................................................................................................... ........................................................................................................................................... ..................................................................................................................................... [2] (c) Scientists want to move some Bukhara deer to a new location to start a new population. The location is a disused surface mine. (i) Describe what must be done to this disused surface mine before the Bukhara deer are introduced. ........................................................................................................................................... ........................................................................................................................................... ........................................................................................................................................... ........................................................................................................................................... ........................................................................................................................................... ..................................................................................................................................... [3] (ii) Suggest the benefits and negative impacts of introducing Bukhara deer to a new location. benefits .............................................................................................................................. ........................................................................................................................................... ........................................................................................................................................... ........................................................................................................................................... ........................................................................................................................................... ........................................................................................................................................... negative impacts ................................................................................................................ ........................................................................................................................................... ........................................................................................................................................... ........................................................................................................................................... ........................................................................................................................................... ........................................................................................................................................... [4] [Total: 17]
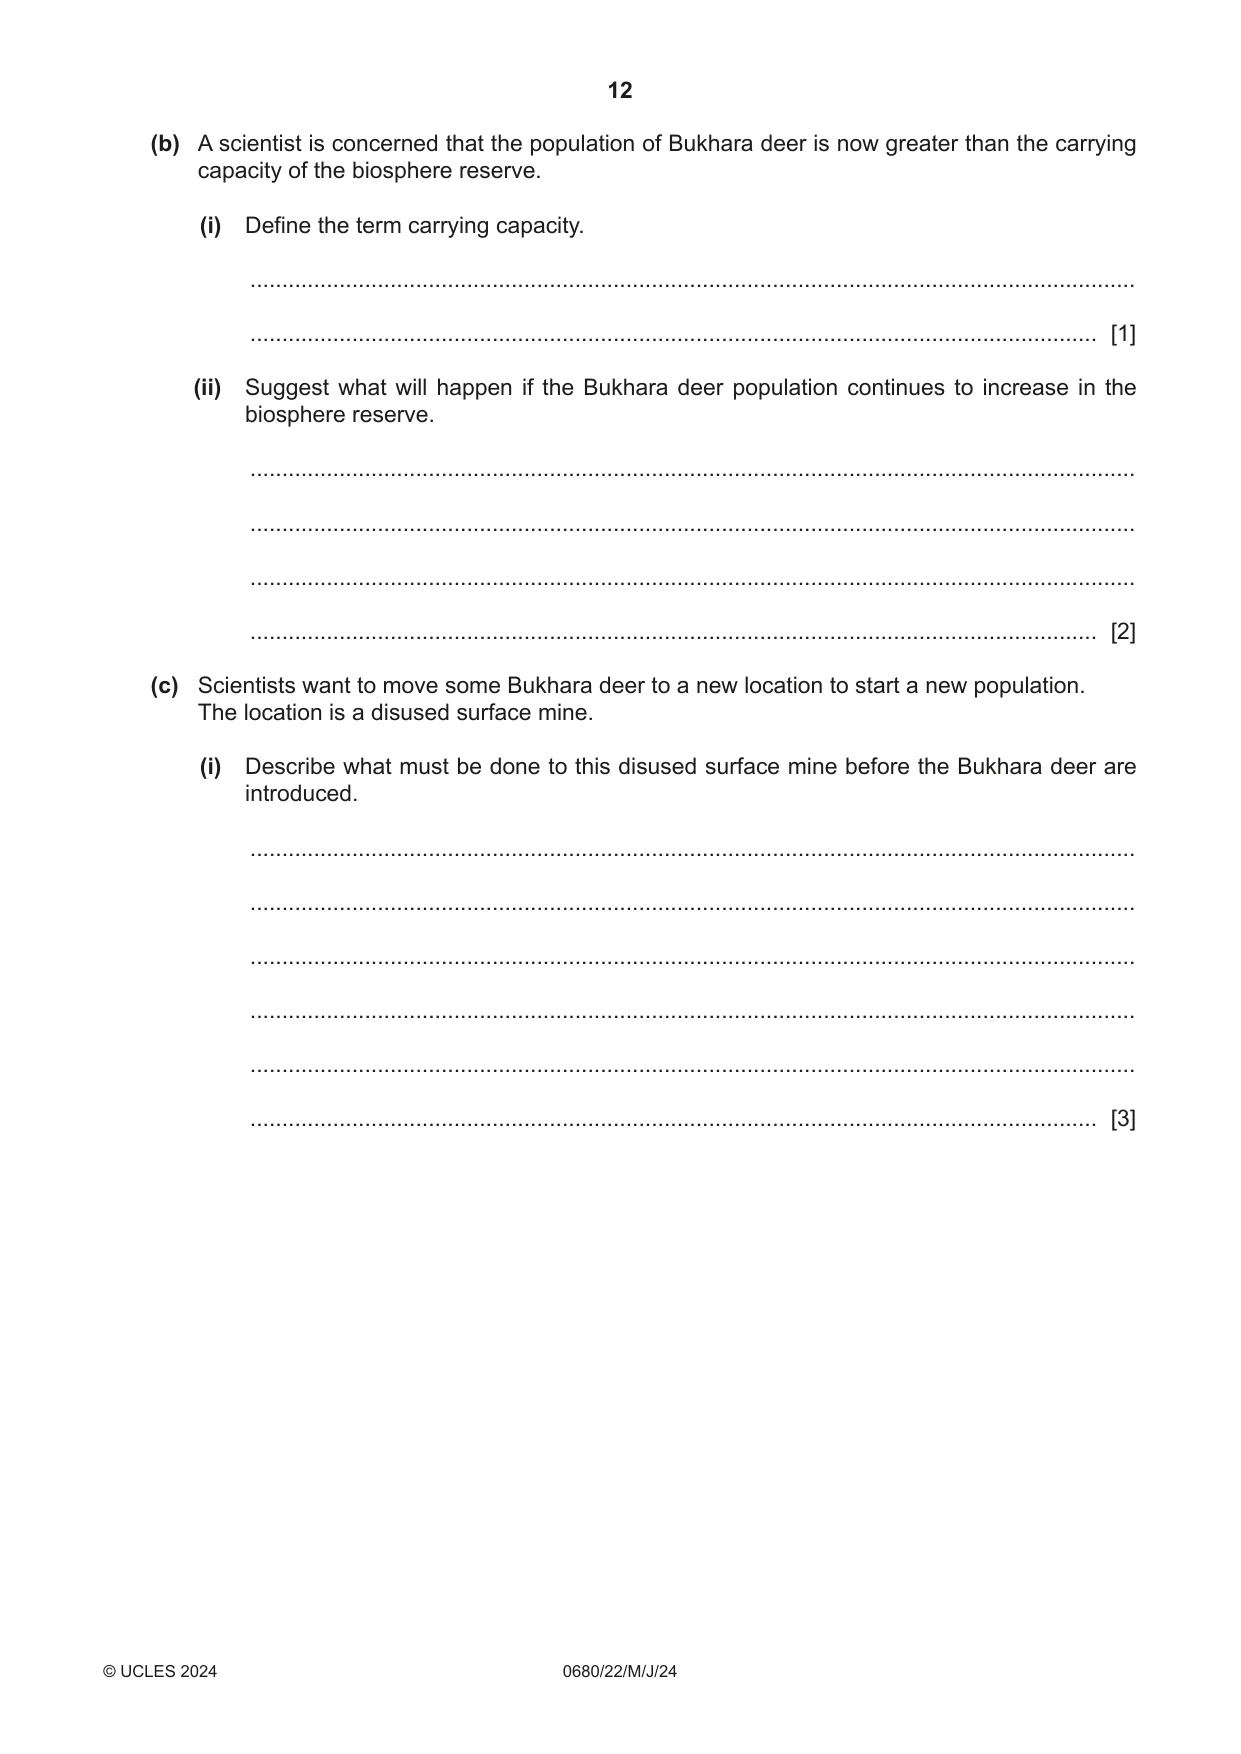
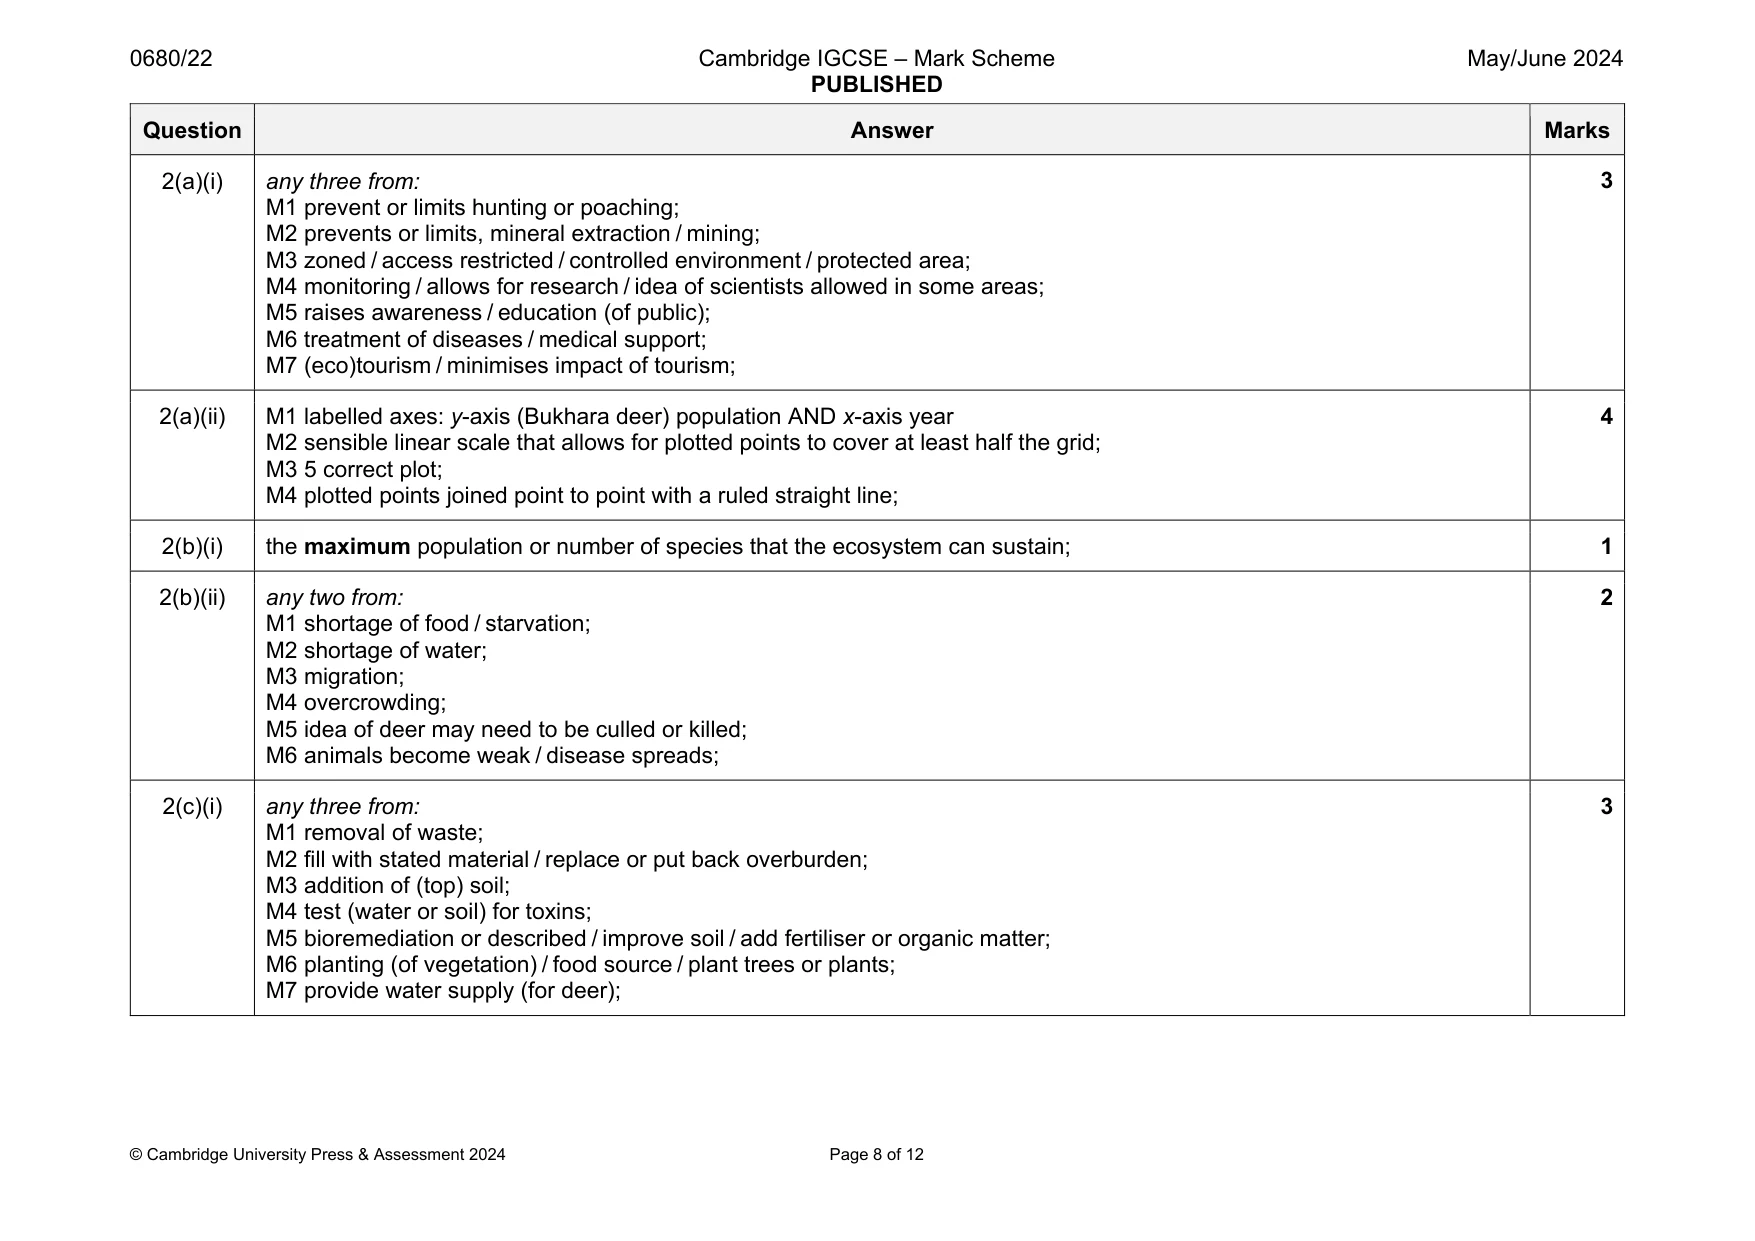
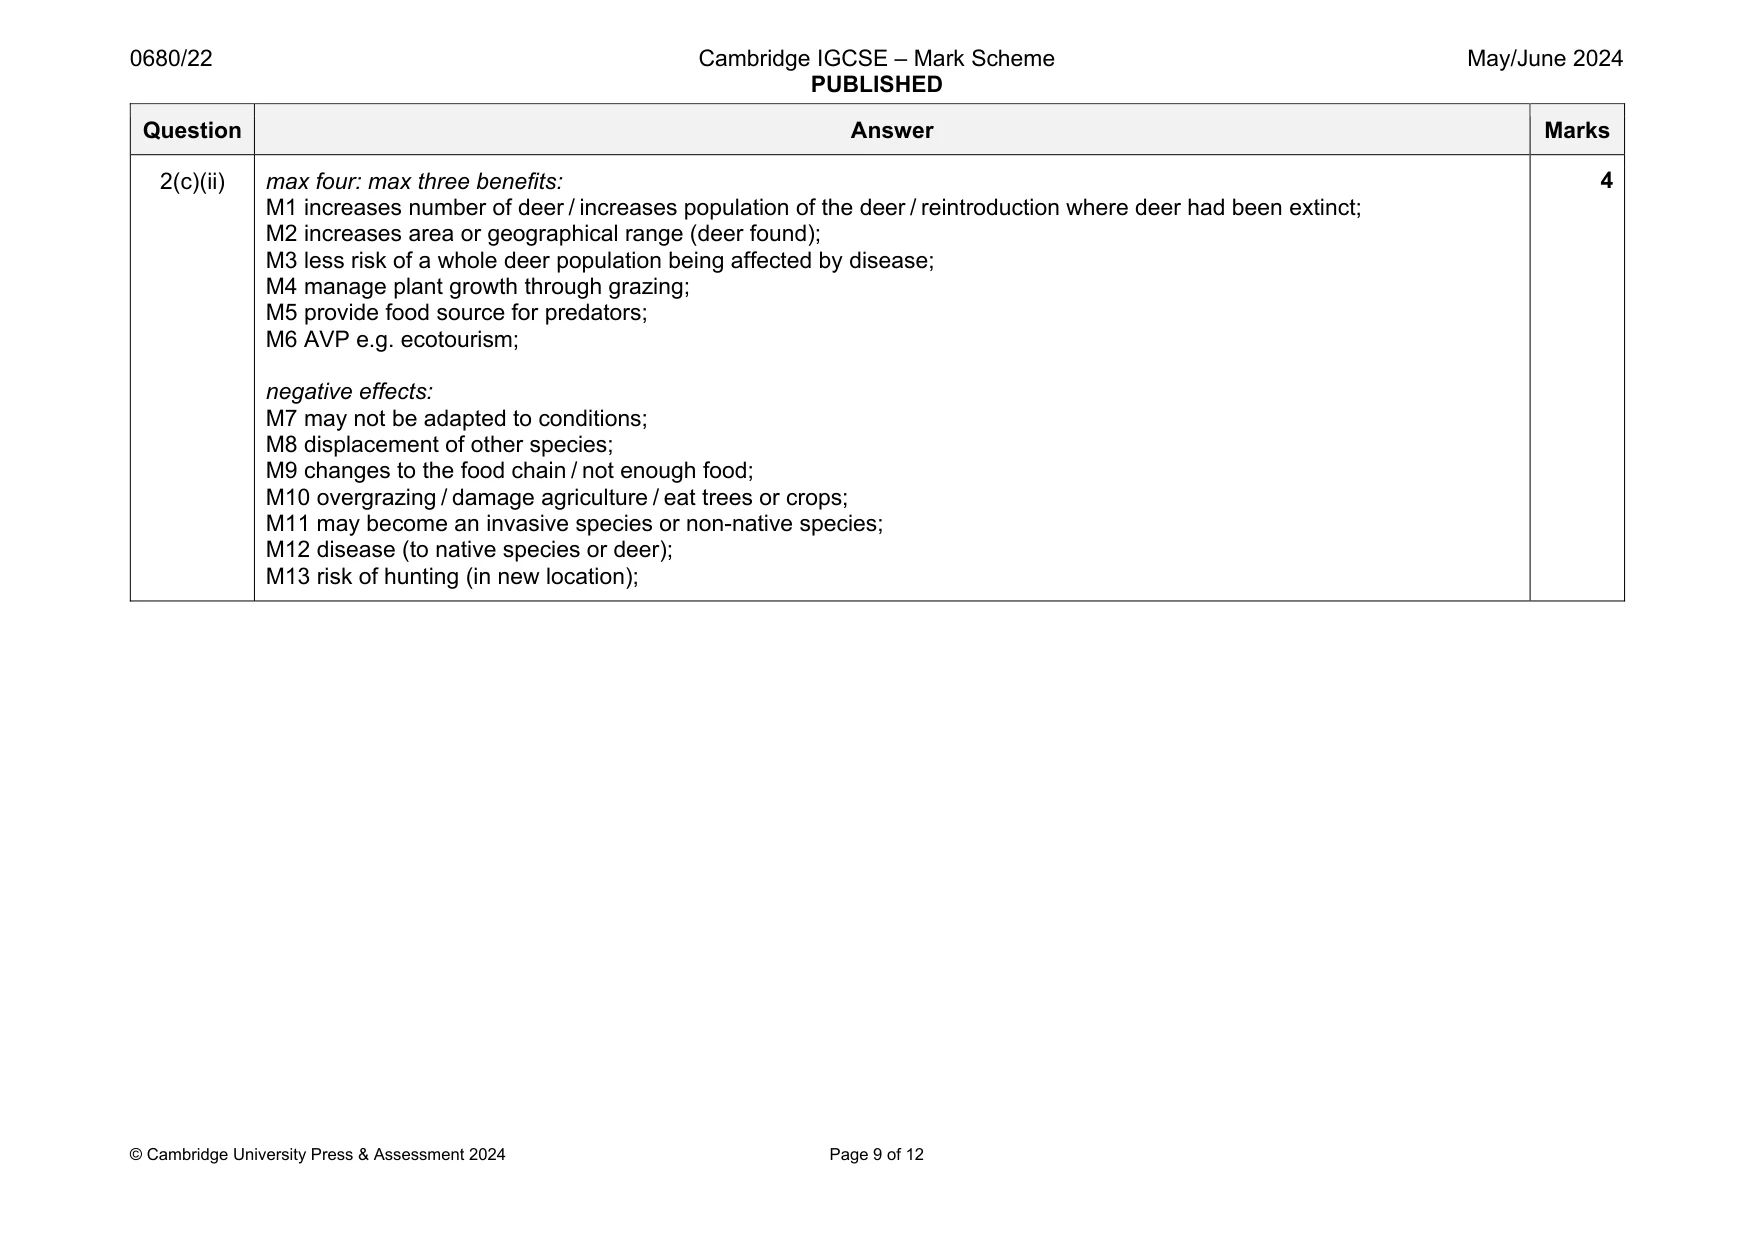
Mark scheme: 2(a)(i) any three from: M1 prevent or limits hunting or poaching; M2 prevents or limits, mineral extraction / mining; M3 zoned / access restricted / controlled environment / protected area; M4 monitoring / allows for research / idea of scientists allowed in some areas; M5 raises awareness / education (of public); M6 treatment of diseases / medical support; M7 (eco)tourism / minimises impact of tourism; 2(a)(ii) M1 labelled axes: y-axis (Bukhara deer) population AND x-axis year M2 sensible linear scale that allows for plotted points to cover at least half the grid; M3 5 correct plot; M4 plotted points joined point to point with a ruled straight line; 4 2(b)(i) the maximum population or number of species that the ecosystem can sustain; 1 2(b)(ii) any two from: M1 shortage of food / starvation; M2 shortage of water; M3 migration; M4 overcrowding; M5 idea of deer may need to be culled or killed; M6 animals become weak / disease spreads; 2 2(c)(i) any three from: M1 removal of waste; M2 fill with stated material / replace or put back overburden; M3 addition of (top) soil; M4 test (water or soil) for toxins; M5 bioremediation or described / improve soil / add fertiliser or organic matter; M6 planting (of vegetation) / food source / plant trees or plants; M7 provide water supply (for deer); 3 Question Answer Marks 2(c)(ii) max four: max three benefits: M1 increases number of deer / increases population of the deer / reintroduction where deer had been extinct; M2 increases area or geographical range (deer found); M3 less risk of a whole deer population being affected by disease; M4 manage plant growth through grazing; M5 provide food source for predators; M6 AVP e.g. ecotourism; negative effects: M7 may not be adapted to conditions; M8 displacement of other species; M9 changes to the food chain / not enough food; M10 overgrazing / damage agriculture / eat trees or crops; M11 may become an invasive species or non-native species; M12 disease (to native species or deer); M13 risk of hunting (in new location); 4
Q3 · Uzbekistan is rich in energy resources
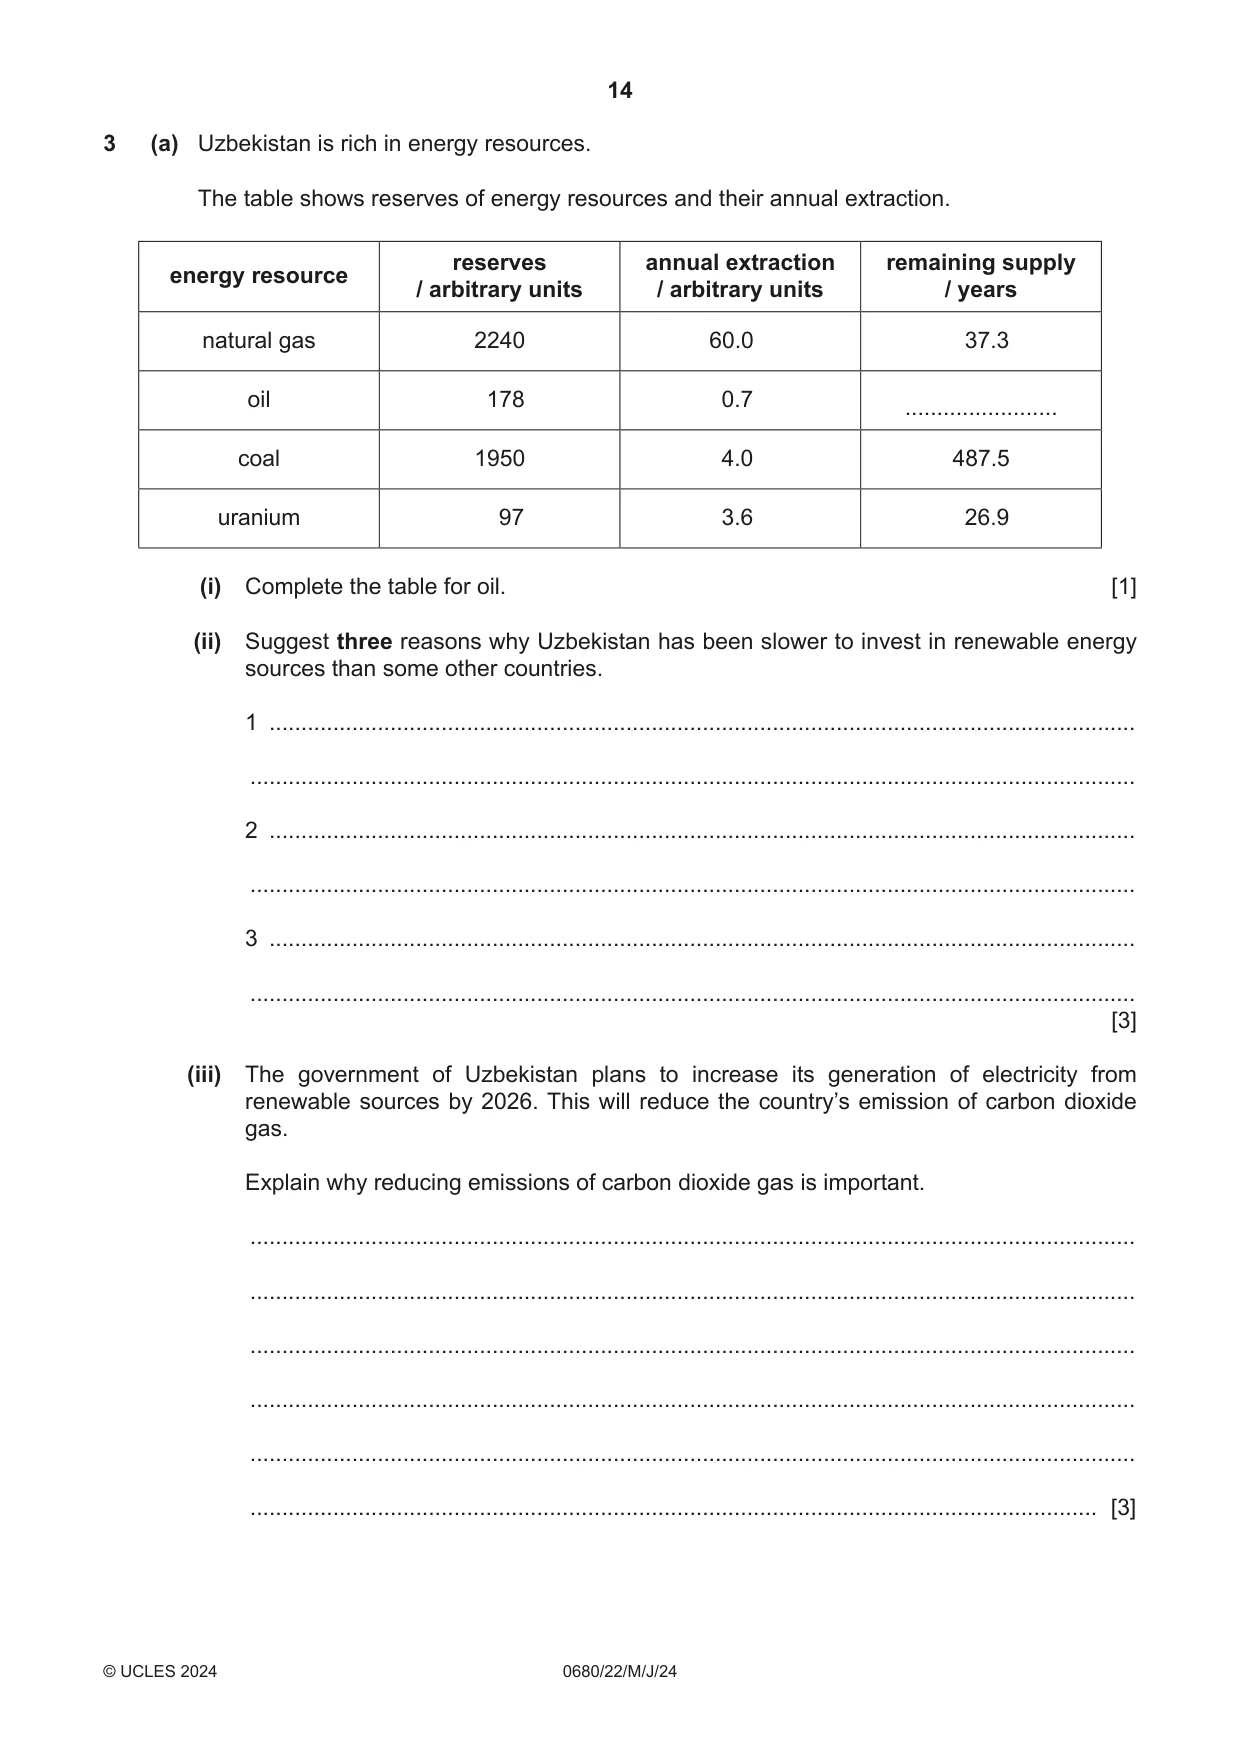
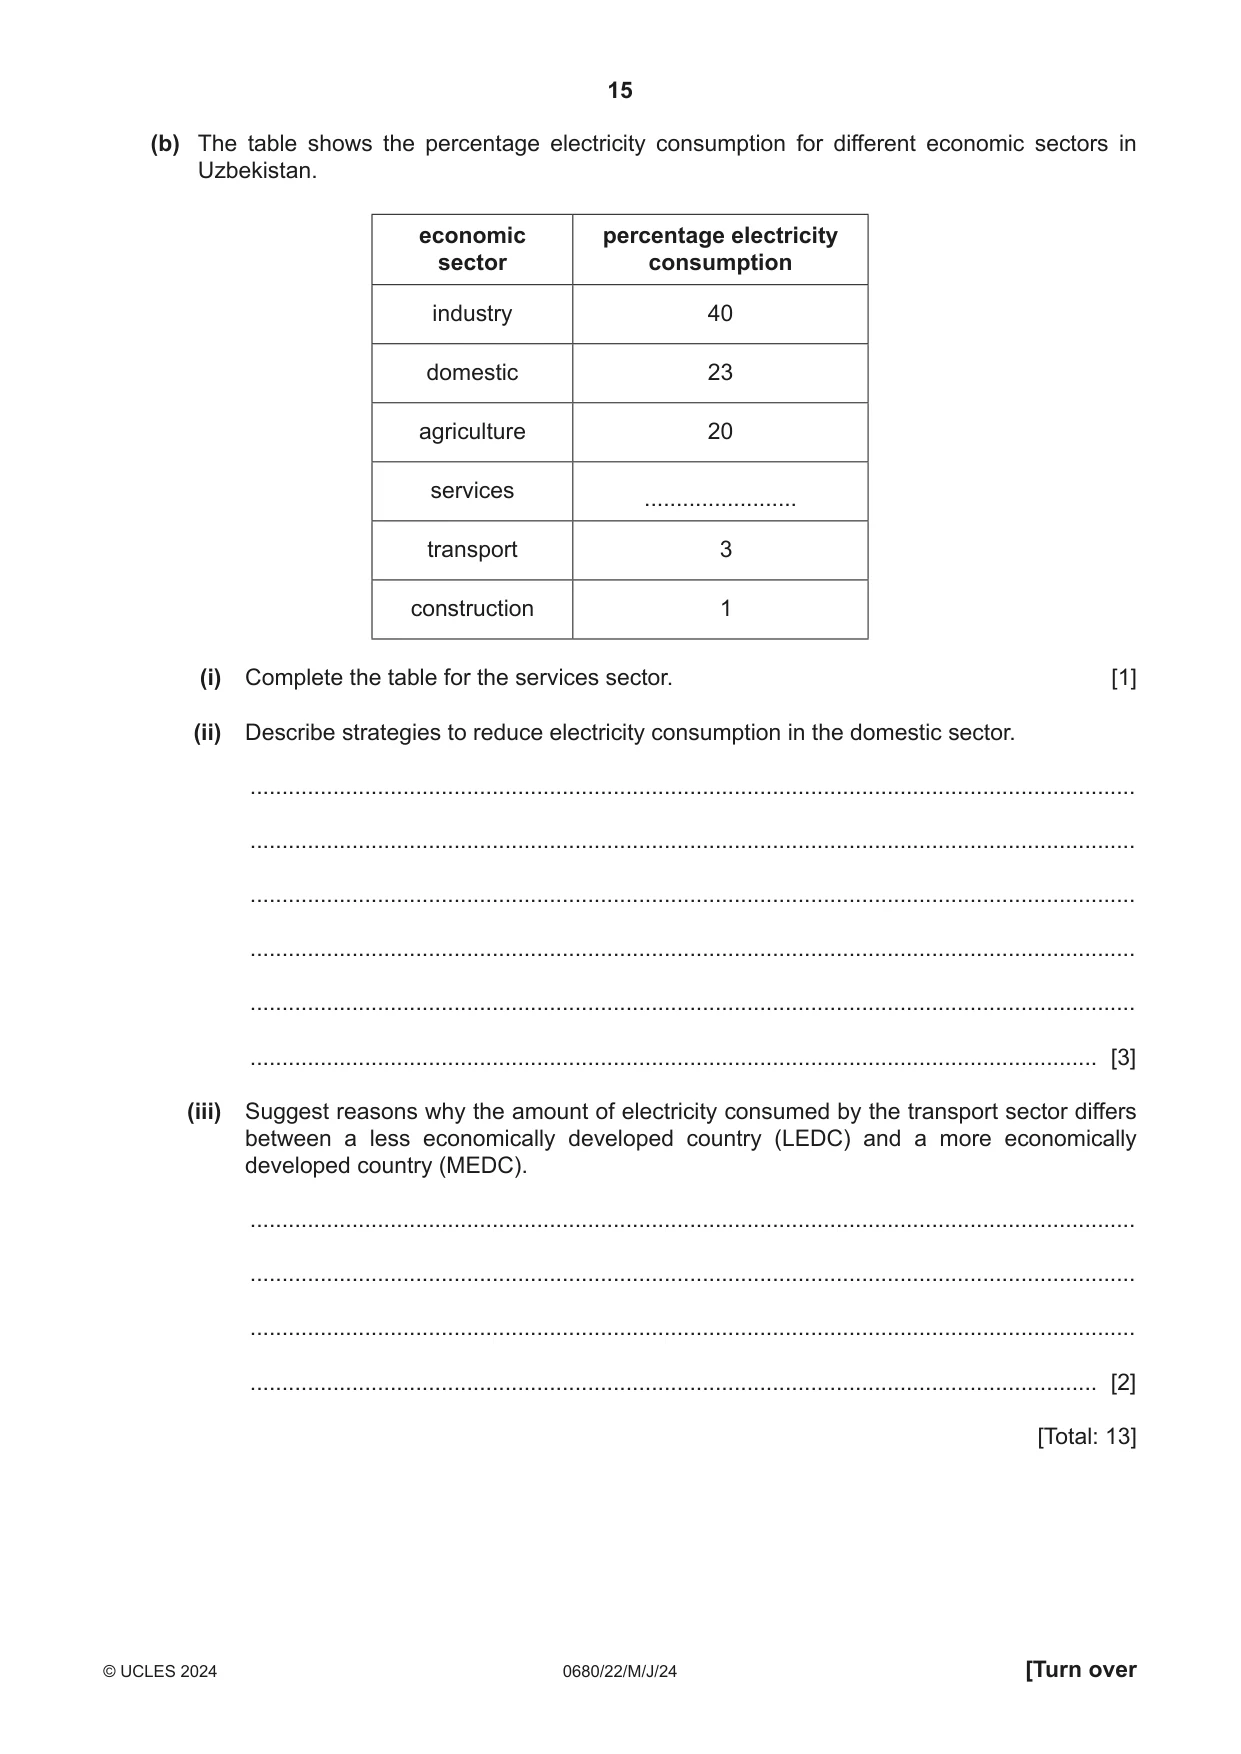
3 (a) Uzbekistan is rich in energy resources. The table shows reserves of energy resources and their annual extraction. reserves annual extraction remaining supply energy resource / arbitrary units / arbitrary units / years natural gas 2240 60.0 37.3 oil 178 0.7 ........................ coal 1950 4.0 487.5 uranium 97 3.6 26.9 (i) Complete the table for oil. [1] (ii) Suggest three reasons why Uzbekistan has been slower to invest in renewable energy sources than some other countries. 1 ........................................................................................................................................ ........................................................................................................................................... 2 ........................................................................................................................................ ........................................................................................................................................... 3 ........................................................................................................................................ ........................................................................................................................................... [3] (iii) The government of Uzbekistan plans to increase its generation of electricity from renewable sources by 2026. This will reduce the country’s emission of carbon dioxide gas. Explain why reducing emissions of carbon dioxide gas is important. ........................................................................................................................................... ........................................................................................................................................... ........................................................................................................................................... ........................................................................................................................................... ........................................................................................................................................... ..................................................................................................................................... [3] (b) The table shows the percentage electricity consumption for different economic sectors in Uzbekistan. economic percentage electricity sector consumption industry 40 domestic 23 agriculture 20 services ........................ transport 3 construction 1 (i) Complete the table for the services sector. [1] (ii) Describe strategies to reduce electricity consumption in the domestic sector. ........................................................................................................................................... ........................................................................................................................................... ........................................................................................................................................... ........................................................................................................................................... ........................................................................................................................................... ..................................................................................................................................... [3] (iii) Suggest reasons why the amount of electricity consumed by the transport sector differs between a less economically developed country (LEDC) and a more economically developed country (MEDC). ........................................................................................................................................... ........................................................................................................................................... ........................................................................................................................................... ..................................................................................................................................... [2] [Total: 13]
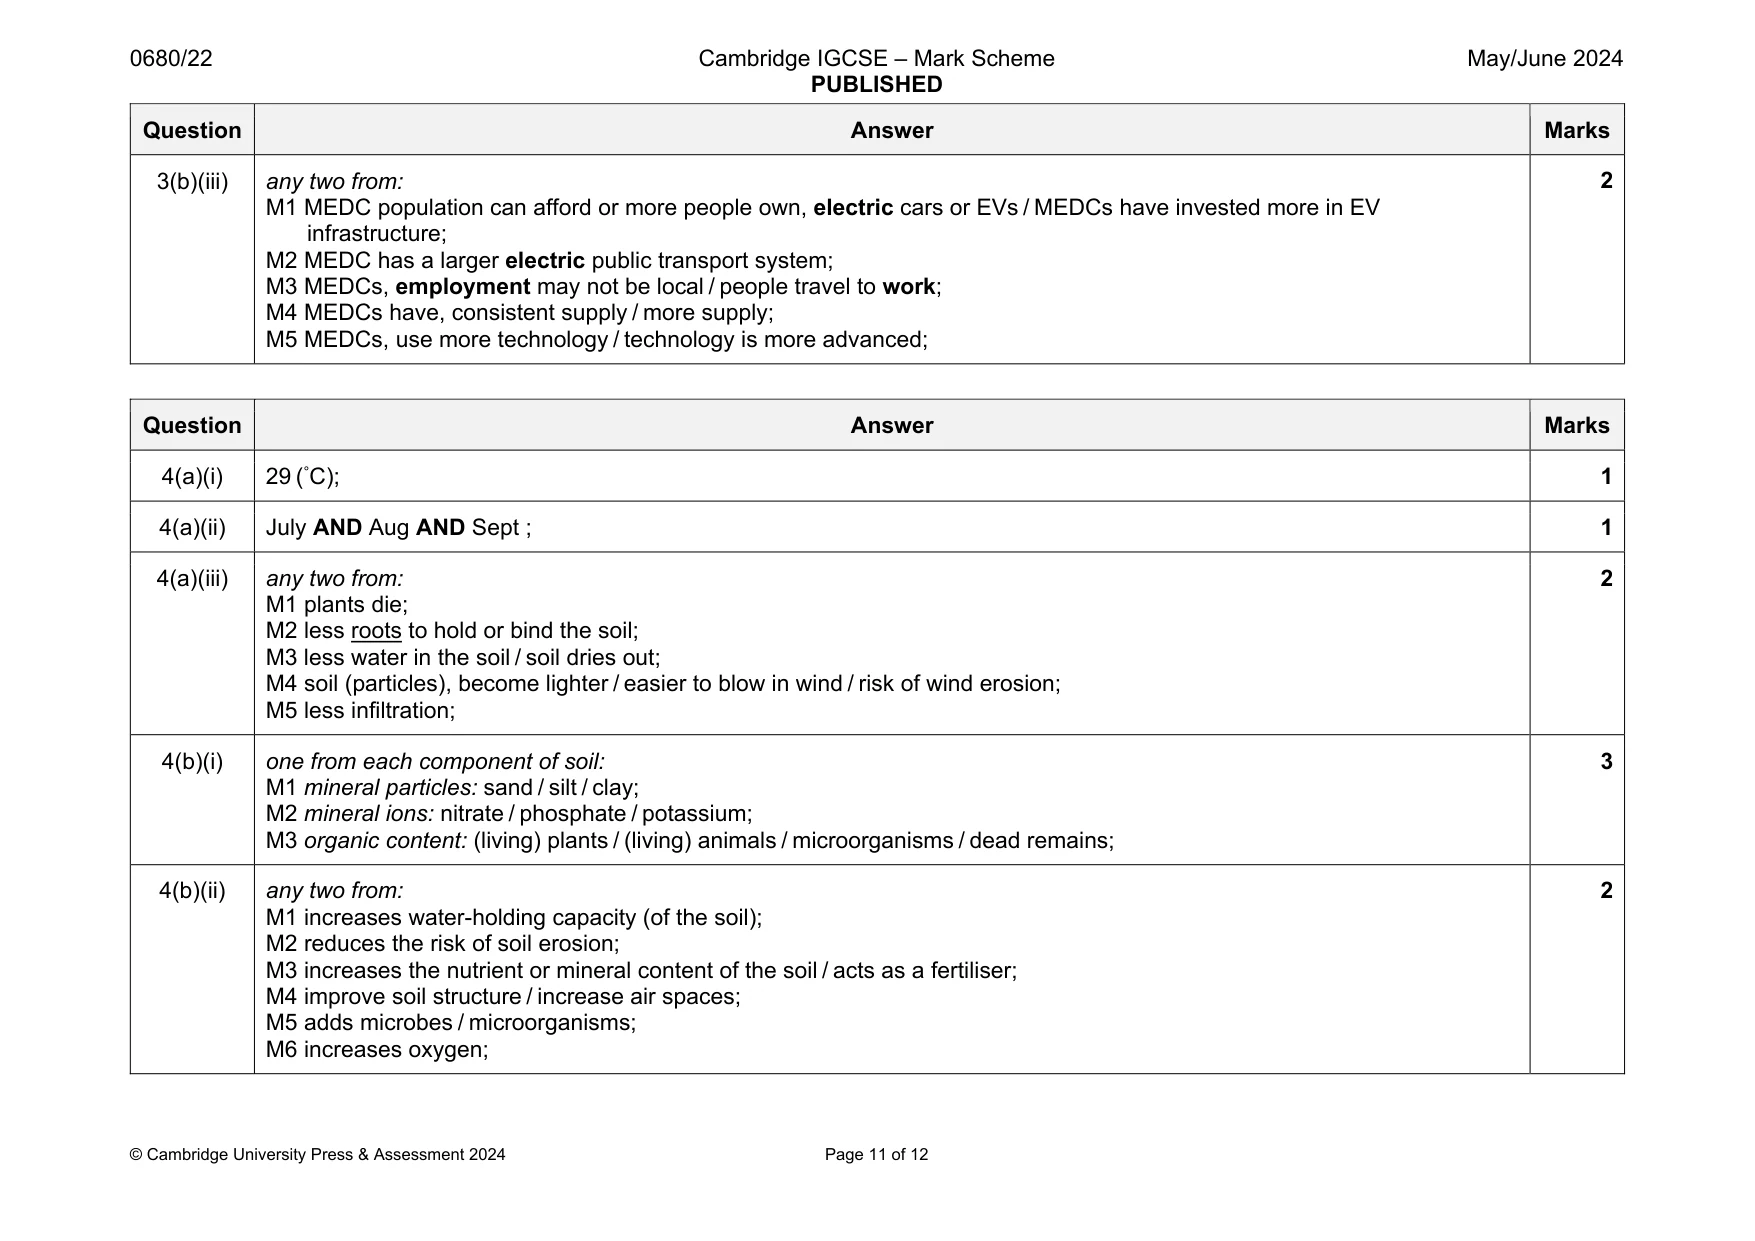
Mark scheme: 3(a)(i) 254.3 (years); 1 3(a)(ii) any three from: M1 large amount of, non-renewable resources / coal / oil / (natural) gas/ fossil fuels, in the country; M2 infrastructure for existing resources already in place; M3 cost (of investing in renewables); M4 lack of expertise or knowledge (of workers) / lack of technology or machinery; M5 idea of lack of natural resources to support renewables e.g. not enough sunshine hours / low wind speed; M6 country has other priorities e.g. drought / famine / disease / education; M7 stated environmental concern from use of renewables e.g. habitat loss with wind farms; M8 concern that renewables will not meet energy needs; M9 exporting existing energy resources increases GDP / oil extraction is main economic activity / idea of fossil fuels employ a lot of people; 3 3(a)(iii) any three from: M1 greenhouse gas; M2 contributes to global warming / (enhanced) greenhouse effect; M3 causes climate change; M4 stated effect of climate change e.g. sea level rise; 3 3(b)(i) 13(%); 1 3(b)(ii) any three from: M1 stated example of how to reduce use e.g. switch off lights / turn off equipment when not in use / turn water or heating thermostat down / avoid very hot water / do not use ‘standby’; M2 insulation / double glazing / loft insulation / filling cavity walls; M3 increase number of windows to replace lighting / decrease number of windows to reduce heat loss; M4 open windows to replace air conditioning; M5 use of more efficient appliances or stated example e.g. use LED lightbulbs / heat pumps; M6 education / raise awareness; M7 stated government strategy e.g. making electricity more expensive / increased tax on electricity / limits on energy use / rationing / load shedding; 3 Question Answer Marks 3(b)(iii) any two from: M1 MEDC population can afford or more people own, electric cars or EVs / MEDCs have invested more in EV infrastructure; M2 MEDC has a larger electric public transport system; M3 MEDCs, employment may not be local / people travel to work; M4 MEDCs have, consistent supply / more supply; M5 MEDCs, use more technology / technology is more advanced; 2
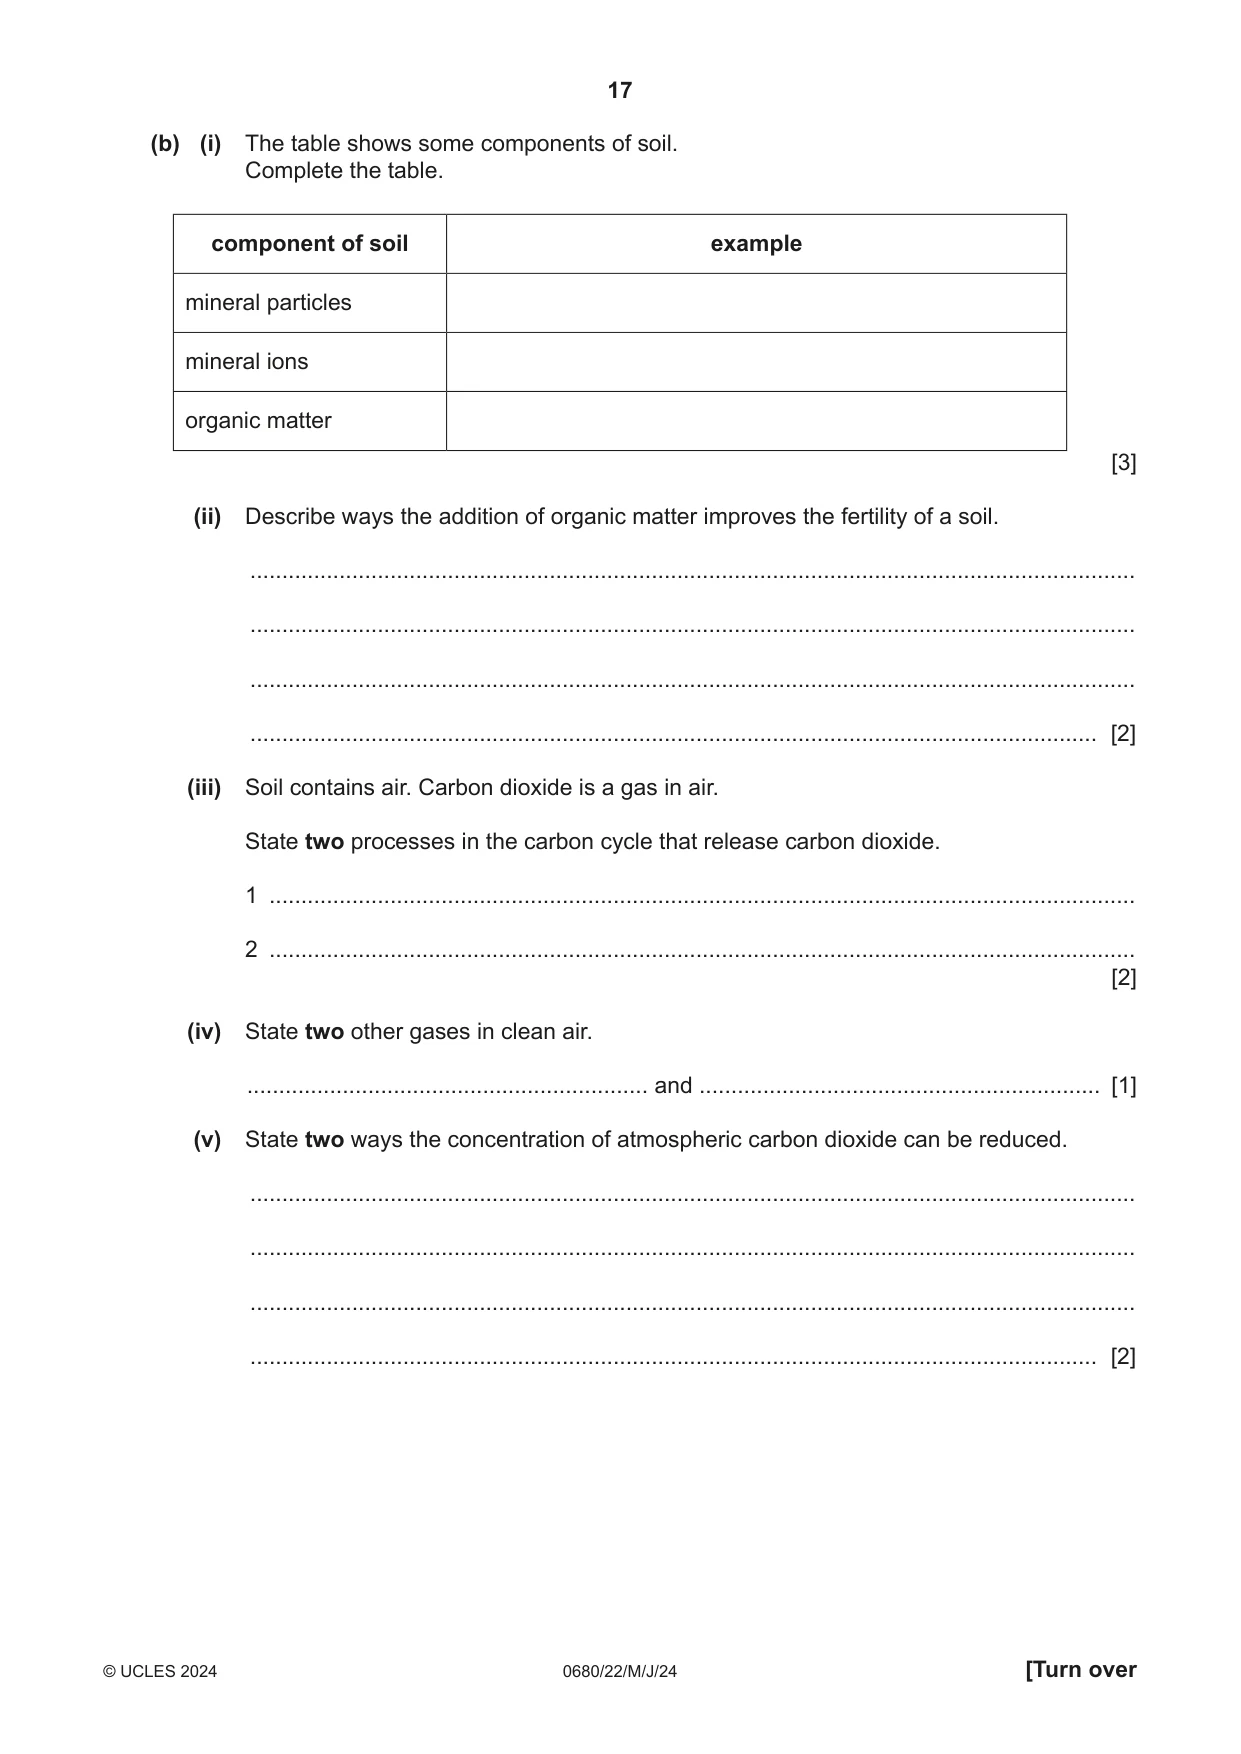
Q4 · The graph shows the mean temperature and precipitation at a weather station in Uzbekistan…
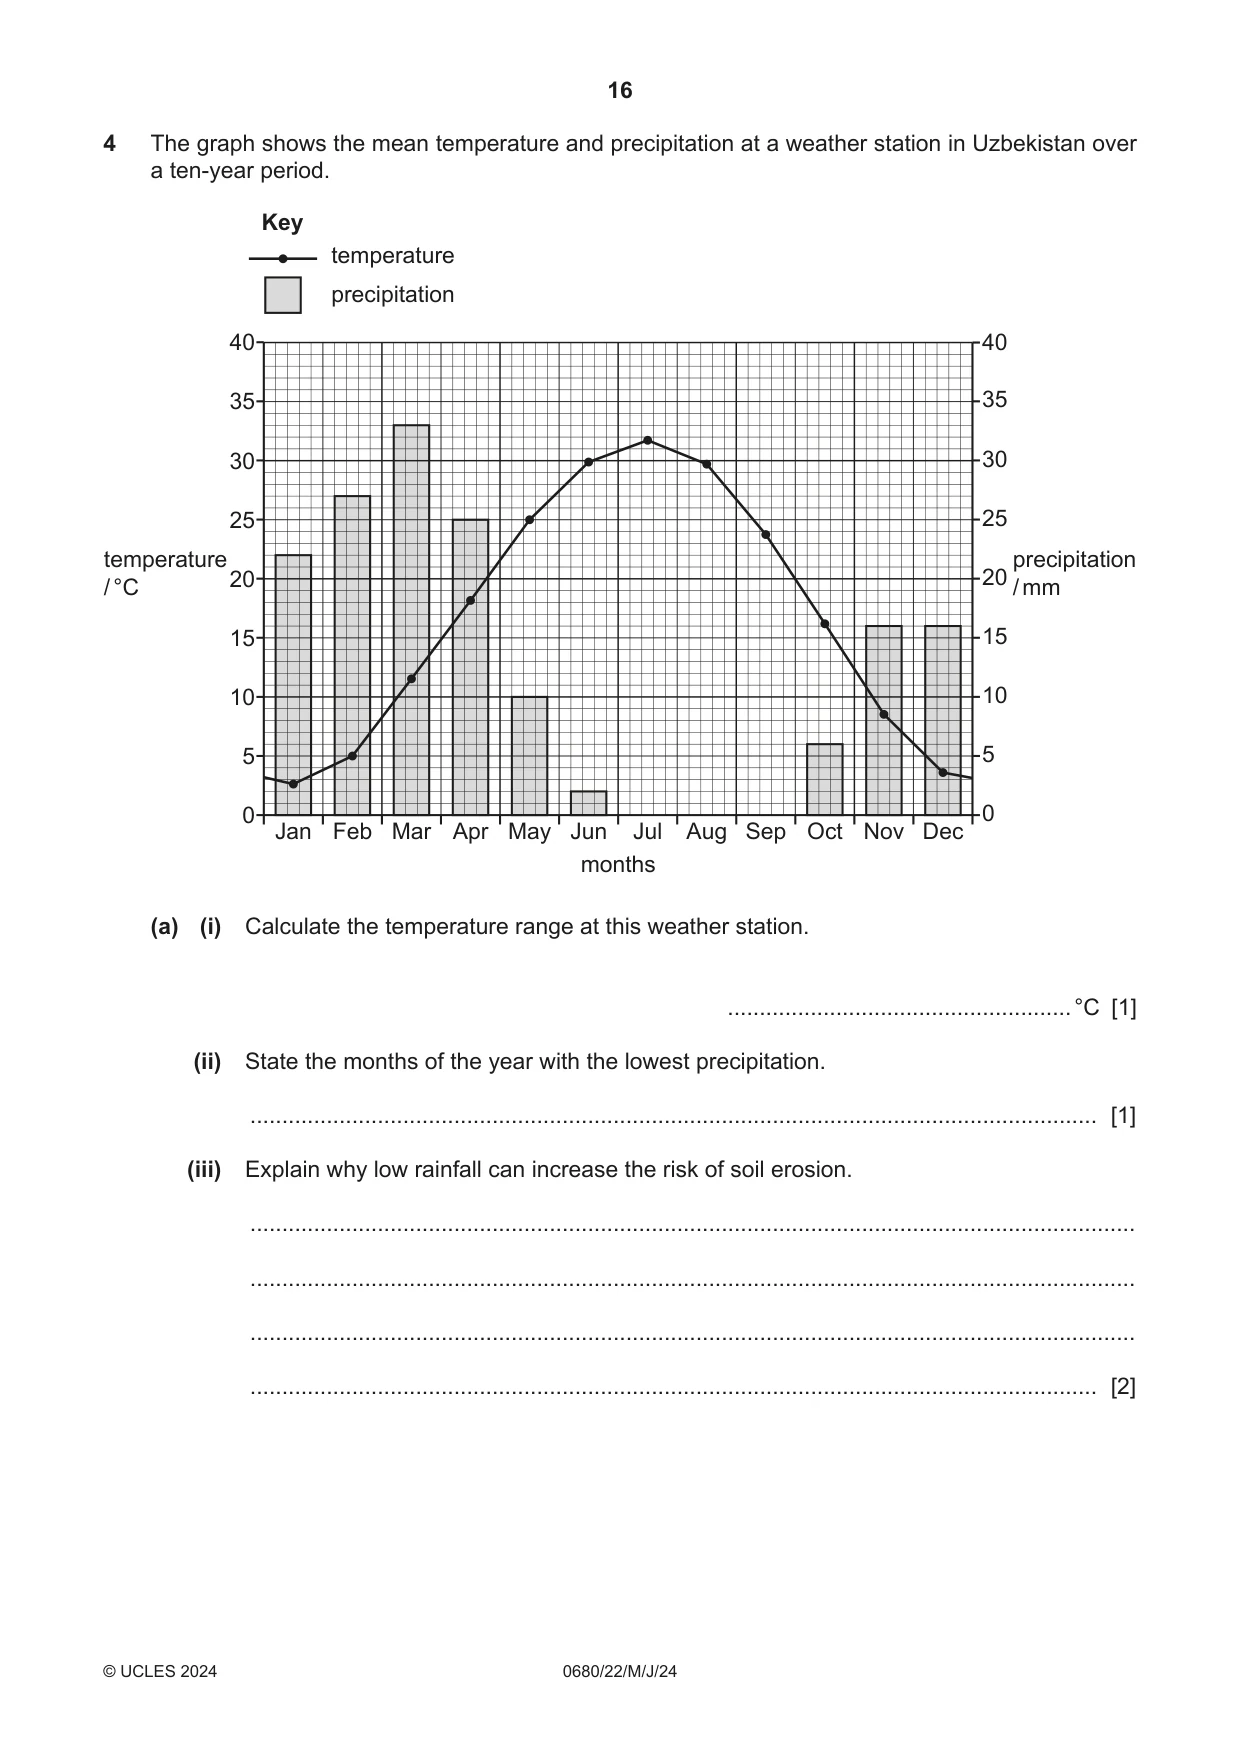
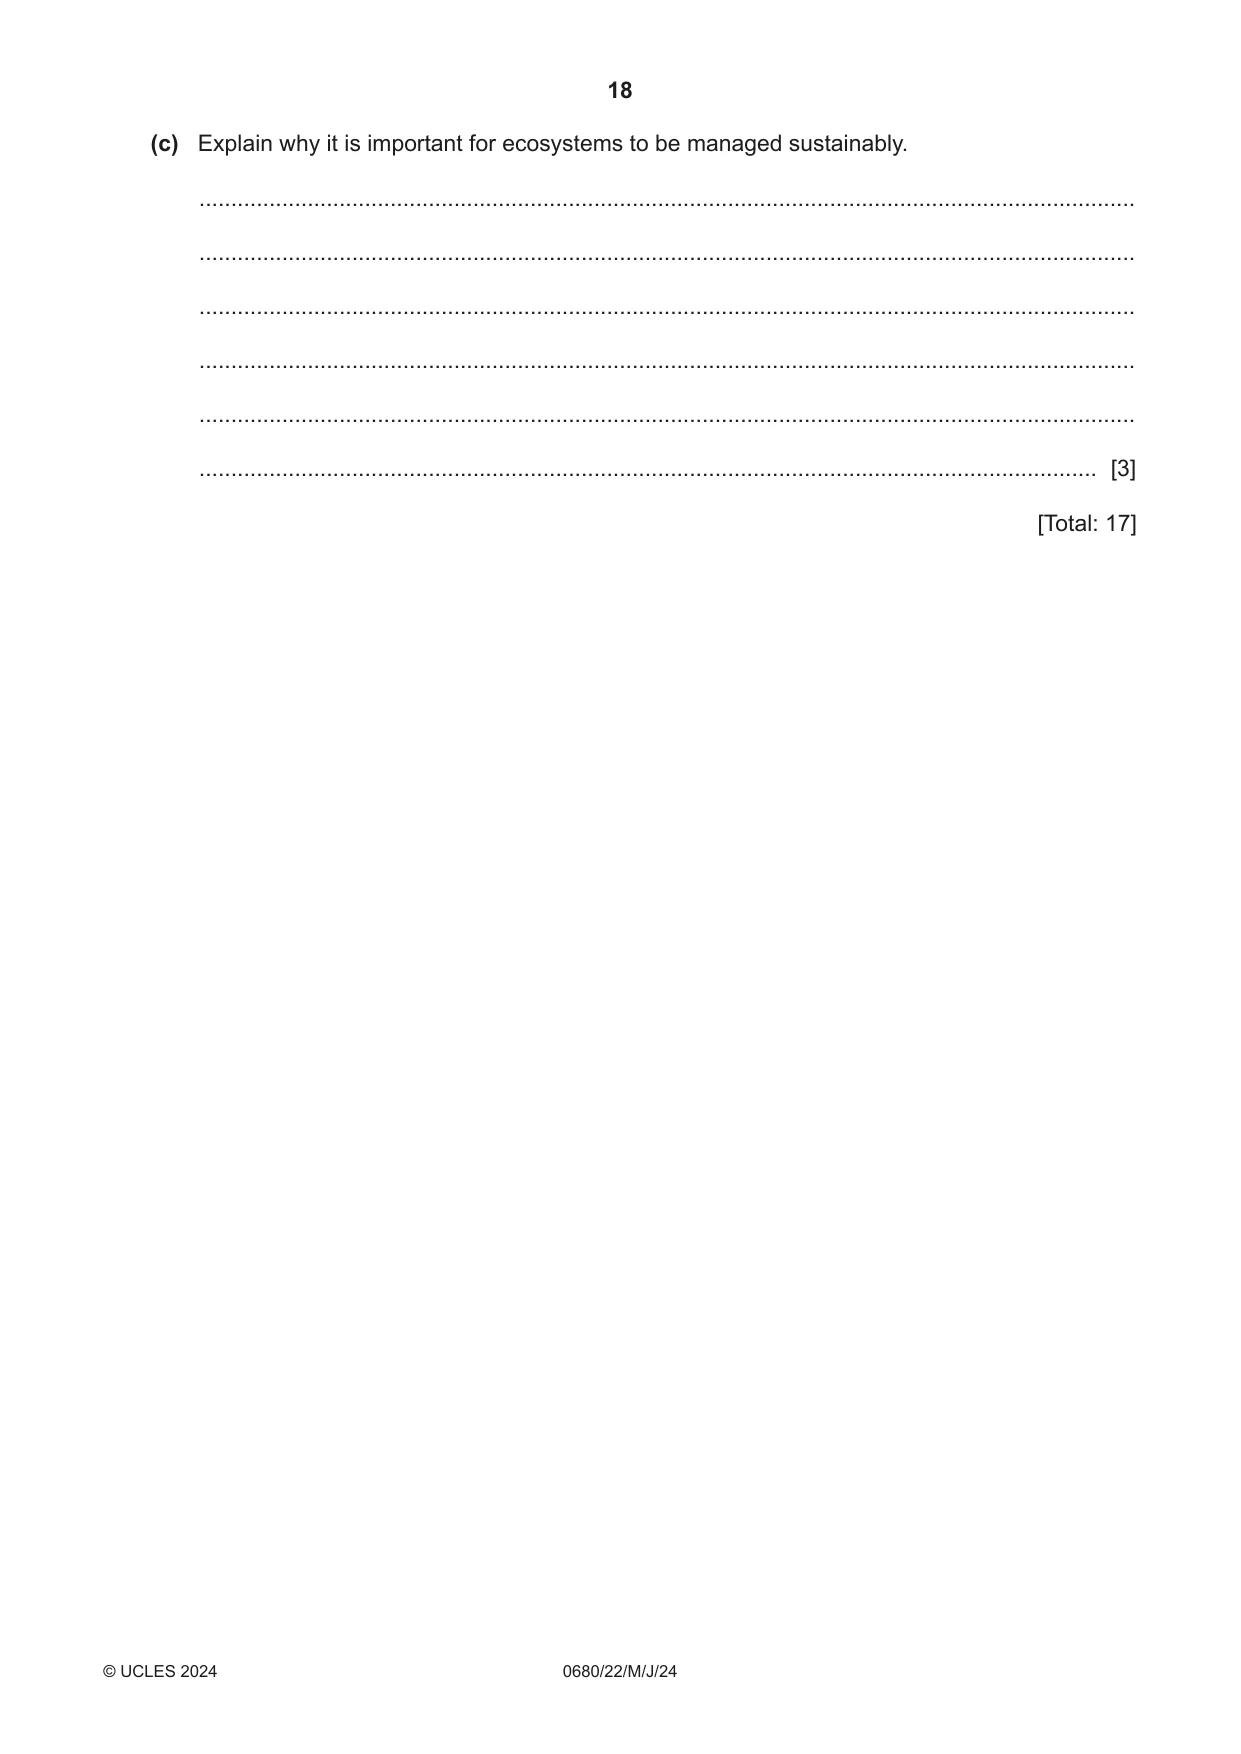
4 The graph shows the mean temperature and precipitation at a weather station in Uzbekistan over a ten‑year period. Key temperature precipitation 40 40 35 35 30 30 25 25 temperature precipitation 20 20/ °C / mm 15 15 10 10 5 5 0 0 Jan Feb Mar Apr May Jun Jul Aug Sep Oct Nov Dec months (a) (i) Calculate the temperature range at this weather station. ...................................................... °C [1] (ii) State the months of the year with the lowest precipitation. ..................................................................................................................................... [1] (iii) Explain why low rainfall can increase the risk of soil erosion. ........................................................................................................................................... ........................................................................................................................................... ........................................................................................................................................... ..................................................................................................................................... [2] (b) (i) The table shows some components of soil. Complete the table. component of soil example mineral particles mineral ions organic matter [3] (ii) Describe ways the addition of organic matter improves the fertility of a soil. ........................................................................................................................................... ........................................................................................................................................... ........................................................................................................................................... ..................................................................................................................................... [2] (iii) Soil contains air. Carbon dioxide is a gas in air. State two processes in the carbon cycle that release carbon dioxide. 1 ........................................................................................................................................ 2 ........................................................................................................................................ [2] (iv) State two other gases in clean air. ............................................................... and ............................................................... [1] (v) State two ways the concentration of atmospheric carbon dioxide can be reduced. ........................................................................................................................................... ........................................................................................................................................... ........................................................................................................................................... ..................................................................................................................................... [2] (c) Explain why it is important for ecosystems to be managed sustainably. ................................................................................................................................................... ................................................................................................................................................... ................................................................................................................................................... ................................................................................................................................................... ................................................................................................................................................... ............................................................................................................................................. [3] [Total: 17]
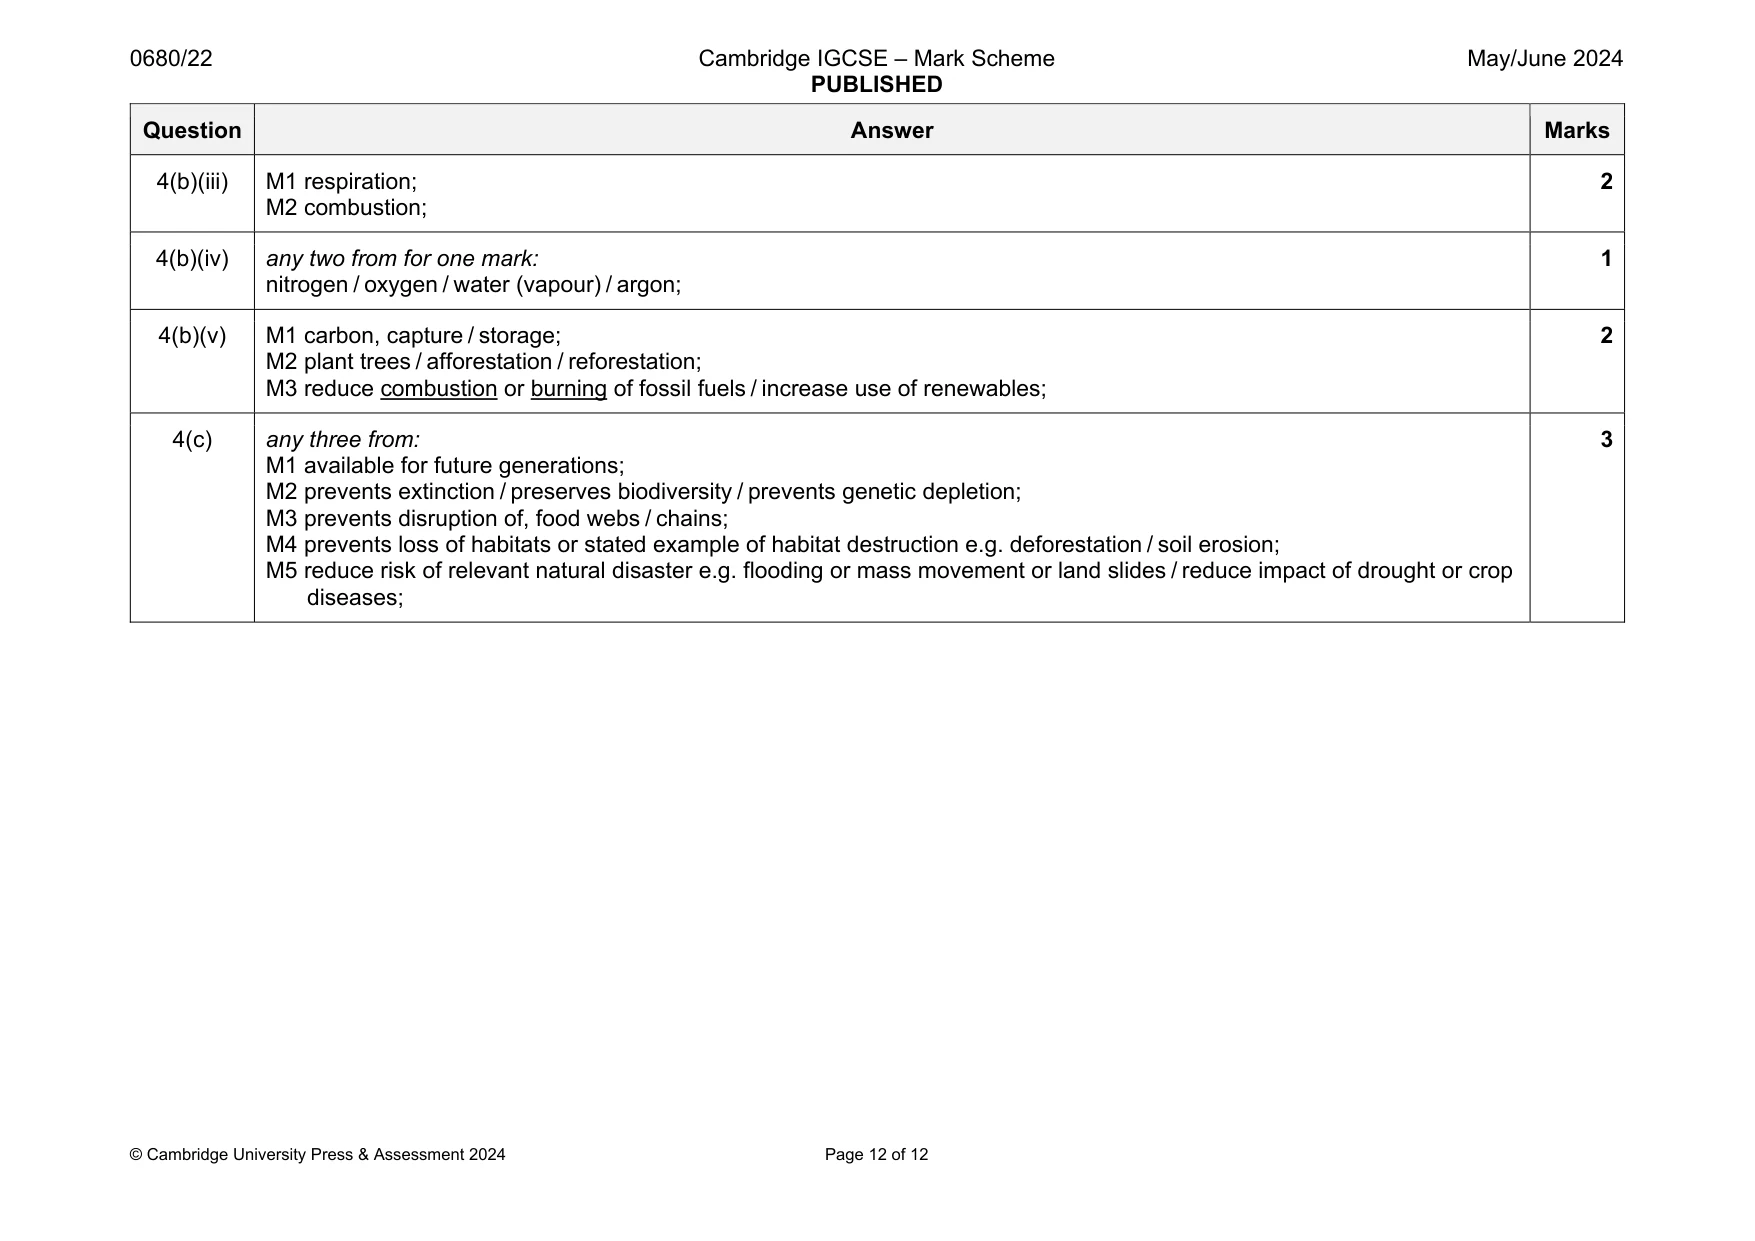
Mark scheme: 4(a)(i) 29 (°C); 1 4(a)(ii) July AND Aug AND Sept ; 1 4(a)(iii) any two from: M1 plants die; M2 less roots to hold or bind the soil; M3 less water in the soil / soil dries out; M4 soil (particles), become lighter / easier to blow in wind / risk of wind erosion; M5 less infiltration; 2 4(b)(i) one from each component of soil: M1 mineral particles: sand / silt / clay; M2 mineral ions: nitrate / phosphate / potassium; M3 organic content: (living) plants / (living) animals / microorganisms / dead remains; 3 4(b)(ii) any two from: M1 increases water-holding capacity (of the soil); M2 reduces the risk of soil erosion; M3 increases the nutrient or mineral content of the soil / acts as a fertiliser; M4 improve soil structure / increase air spaces; M5 adds microbes / microorganisms; M6 increases oxygen; 2 Question Answer Marks 4(b)(iii) M1 respiration; M2 combustion; 2 4(b)(iv) any two from for one mark: nitrogen / oxygen / water (vapour) / argon; 1 4(b)(v) M1 carbon, capture / storage; M2 plant trees / afforestation / reforestation; M3 reduce combustion or burning of fossil fuels / increase use of renewables; 2 4(c) any three from: M1 available for future generations; M2 prevents extinction / preserves biodiversity / prevents genetic depletion; M3 prevents disruption of, food webs / chains; M4 prevents loss of habitats or stated example of habitat destruction e.g. deforestation / soil erosion; M5 reduce risk of relevant natural disaster e.g. flooding or mass movement or land slides / reduce impact of drought or crop diseases; 3
What was in this paper
The subtopics covered by these 4 questions, and how many questions each got. Open one in a new tab to see every Cambridge question on it.
What you needed in this session
Cambridge’s own grade thresholds for 2024 May/June, Paper 2 · Variant 2. A higher threshold means an easier paper — the bar moves with how the cohort did.