Cambridge IGCSE Environmental Management 0680 — 2025 Feb/March Paper 2 · Variant 2
0680/22/F/M/25 · 4 questions · 80 marks · 105 min
The question paper and its mark scheme, free to read here and free to download. This is Cambridge’s own paper, exactly as it was sat.
Question paper20 pages
Mark scheme12 pages
Answers below. Sit the paper first if you are practising.
Questions as text
Q1 · The map shows the location of the Guerrero Negro sea salt factory on the Baja California…
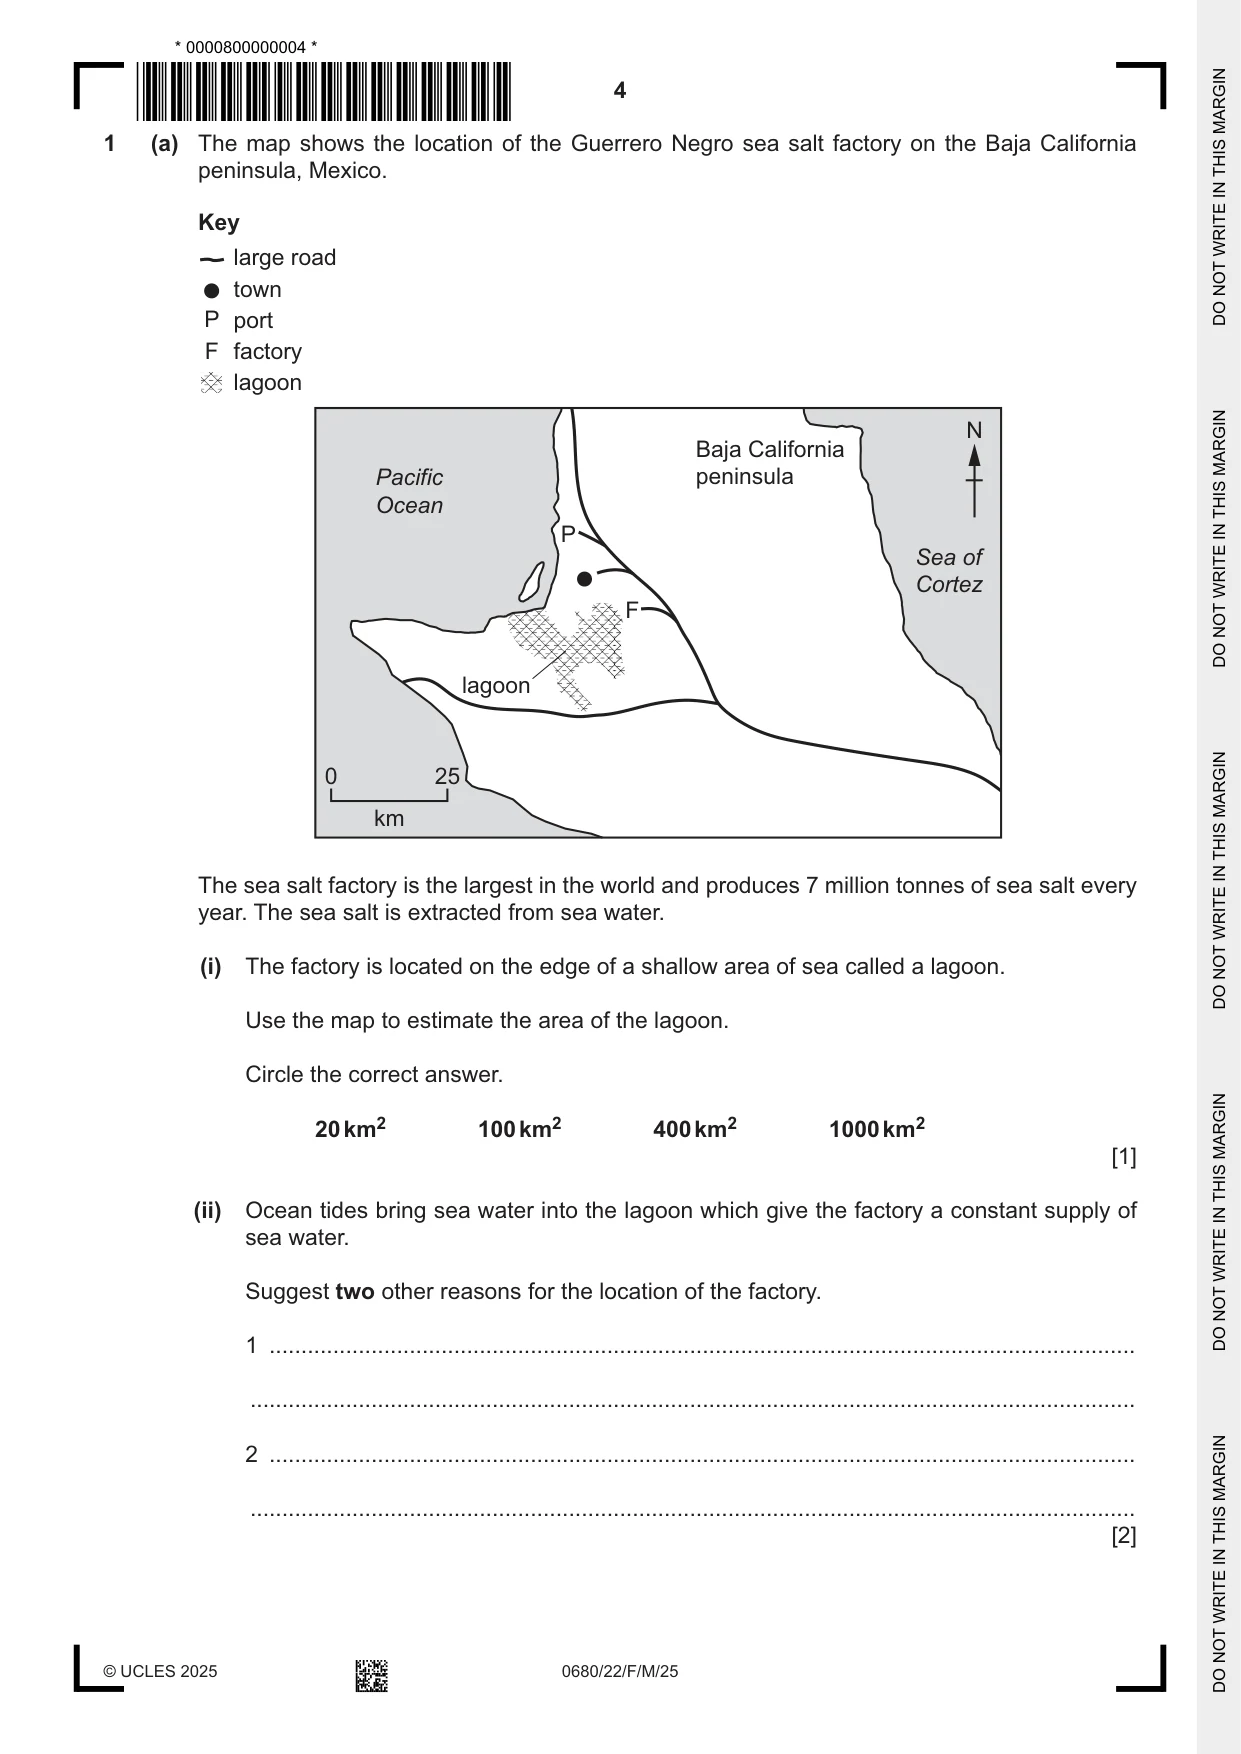
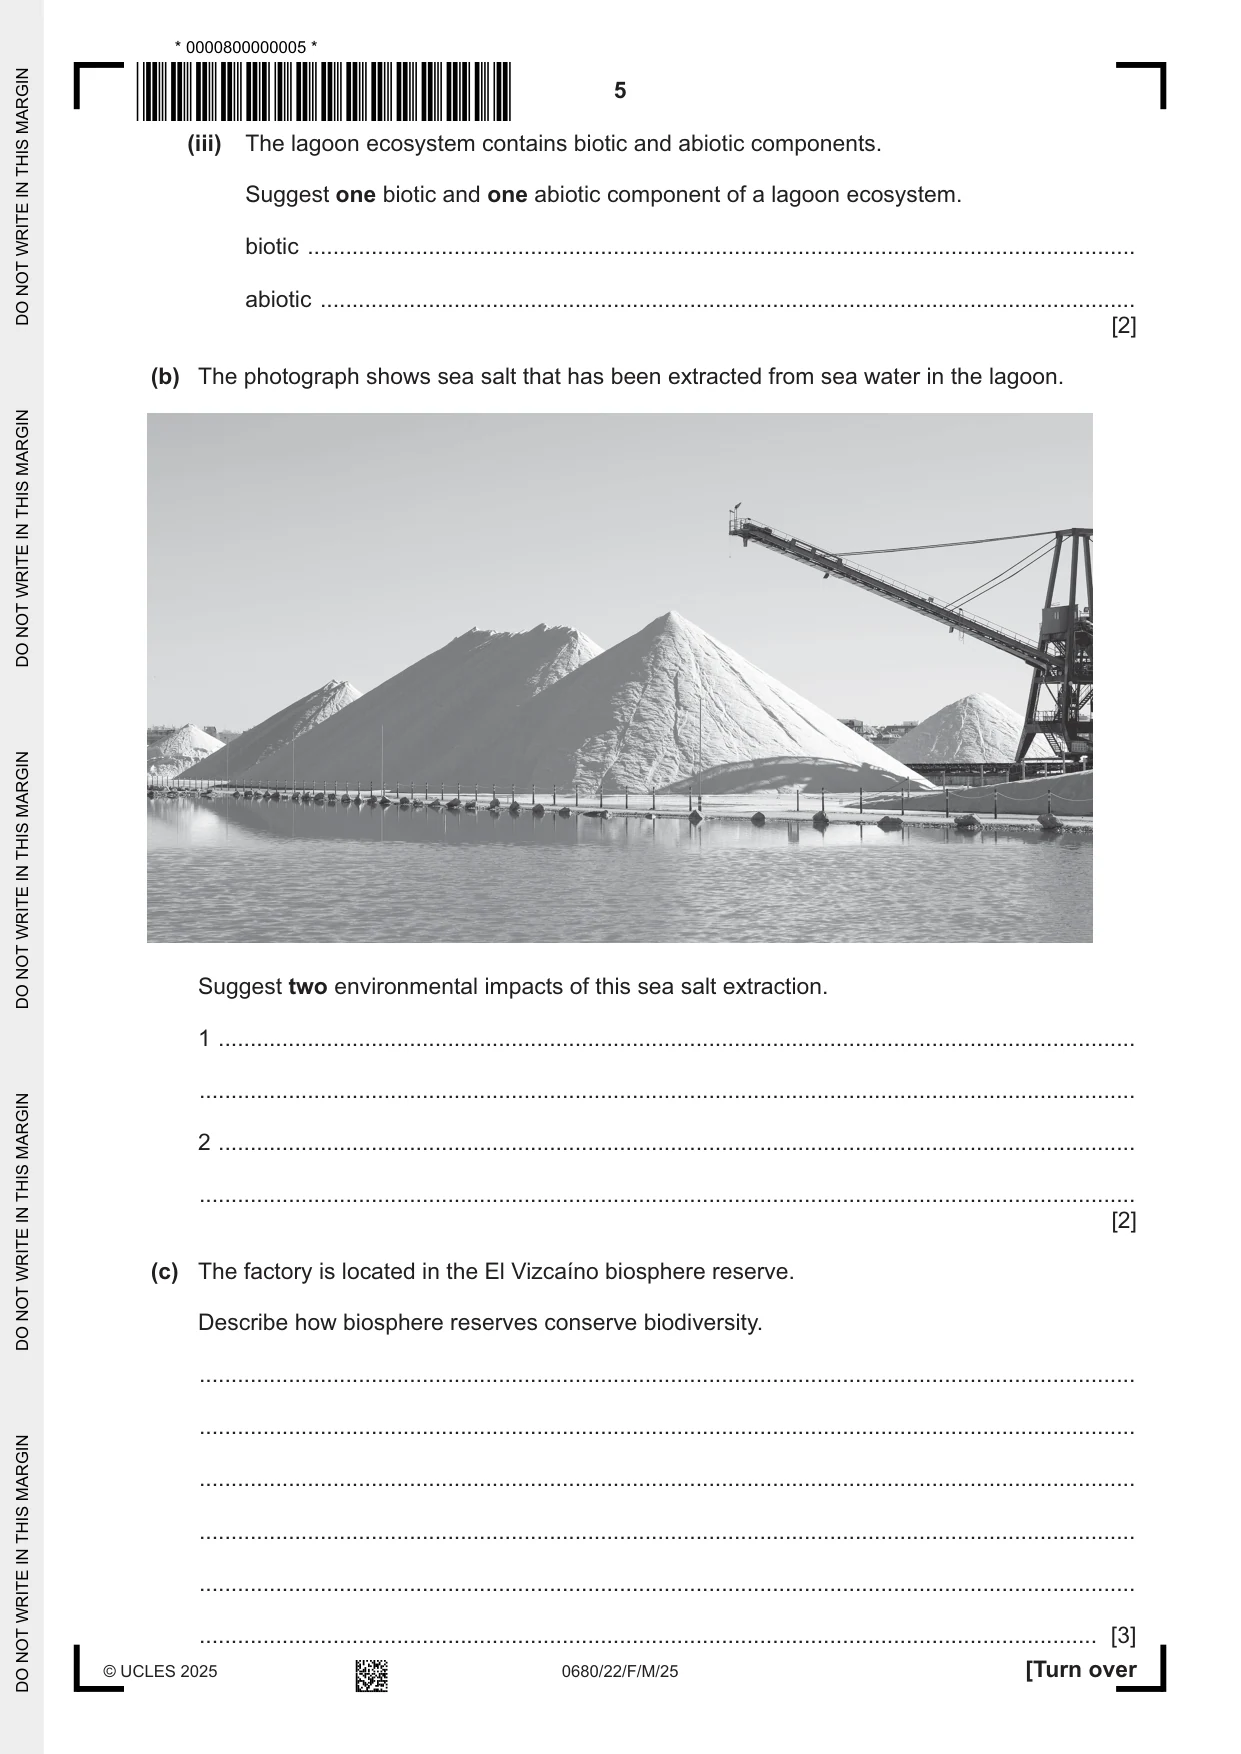
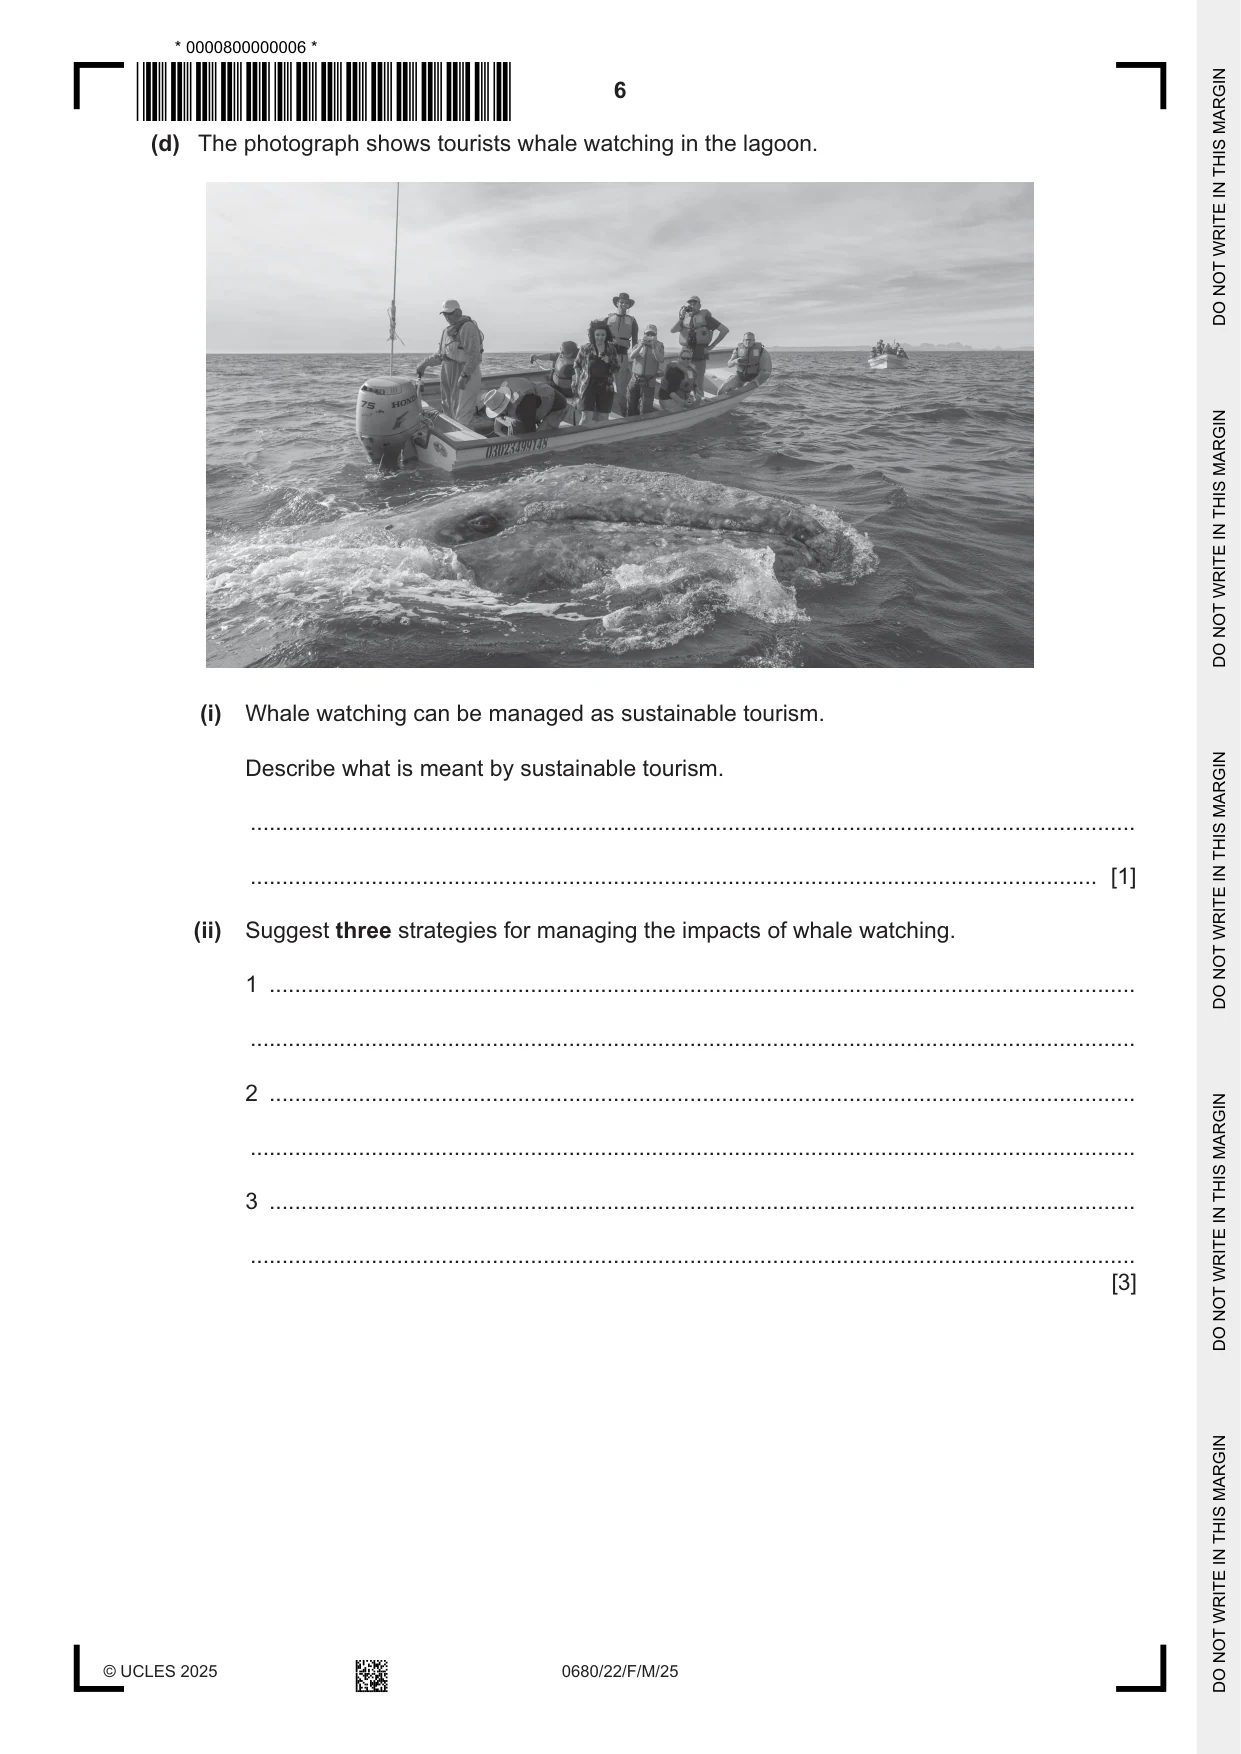
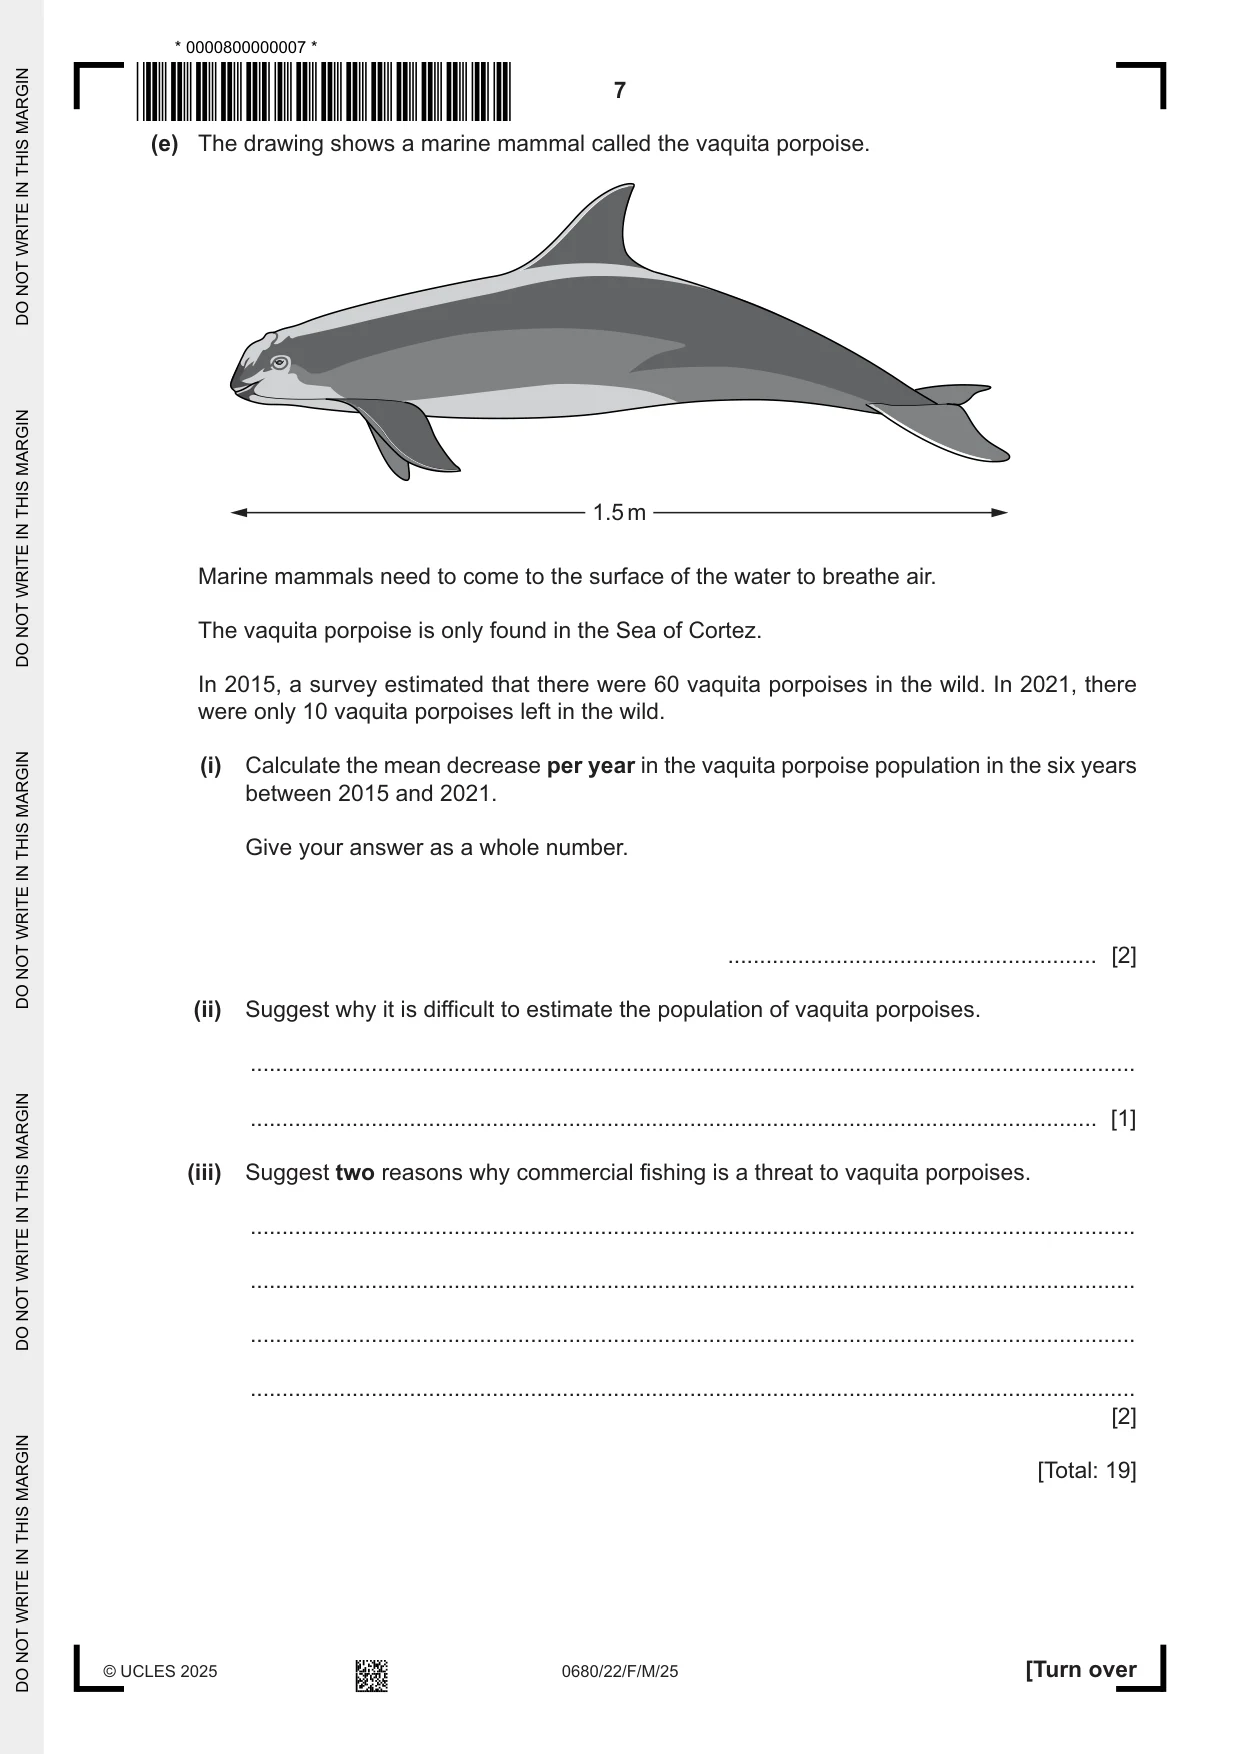
1 (a) The map shows the location of the Guerrero Negro sea salt factory on the Baja California peninsula, Mexico. Key large road town P port F factory lagoon N Baja California Pacific peninsula Ocean P Sea of Cortez F lagoon 0 25 km The sea salt factory is the largest in the world and produces 7 million tonnes of sea salt every year. The sea salt is extracted from sea water. (i) The factory is located on the edge of a shallow area of sea called a lagoon. Use the map to estimate the area of the lagoon. Circle the correct answer. 20 km2 100 km2 400 km2 1000 km2 [1] (ii) Ocean tides bring sea water into the lagoon which give the factory a constant supply of sea water. Suggest two other reasons for the location of the factory. 1 ........................................................................................................................................ ........................................................................................................................................... 2 ........................................................................................................................................ ........................................................................................................................................... [2] (iii) The lagoon ecosystem contains biotic and abiotic components. Suggest one biotic and one abiotic component of a lagoon ecosystem. biotic .................................................................................................................................. abiotic ................................................................................................................................ [2] (b) The photograph shows sea salt that has been extracted from sea water in the lagoon. Suggest two environmental impacts of this sea salt extraction. 1 ................................................................................................................................................ ................................................................................................................................................... 2 ................................................................................................................................................ ................................................................................................................................................... [2] (c) The factory is located in the El Vizcaíno biosphere reserve. Describe how biosphere reserves conserve biodiversity. ................................................................................................................................................... ................................................................................................................................................... ................................................................................................................................................... ................................................................................................................................................... ................................................................................................................................................... ............................................................................................................................................. [3] (d) The photograph shows tourists whale watching in the lagoon. (i) Whale watching can be managed as sustainable tourism. Describe what is meant by sustainable tourism. ........................................................................................................................................... ..................................................................................................................................... [1] (ii) Suggest three strategies for managing the impacts of whale watching. 1 ........................................................................................................................................ ........................................................................................................................................... 2 ........................................................................................................................................ ........................................................................................................................................... 3 ........................................................................................................................................ ........................................................................................................................................... [3] (e) The drawing shows a marine mammal called the vaquita porpoise. 1.5 m Marine mammals need to come to the surface of the water to breathe air. The vaquita porpoise is only found in the Sea of Cortez. In 2015, a survey estimated that there were 60 vaquita porpoises in the wild. In 2021, there were only 10 vaquita porpoises left in the wild. (i) Calculate the mean decrease per year in the vaquita porpoise population in the six years between 2015 and 2021. Give your answer as a whole number. .......................................................... [2] (ii) Suggest why it is difficult to estimate the population of vaquita porpoises. ........................................................................................................................................... ..................................................................................................................................... [1] (iii) Suggest two reasons why commercial fishing is a threat to vaquita porpoises. ........................................................................................................................................... ........................................................................................................................................... ........................................................................................................................................... ........................................................................................................................................... [2] [Total: 19]
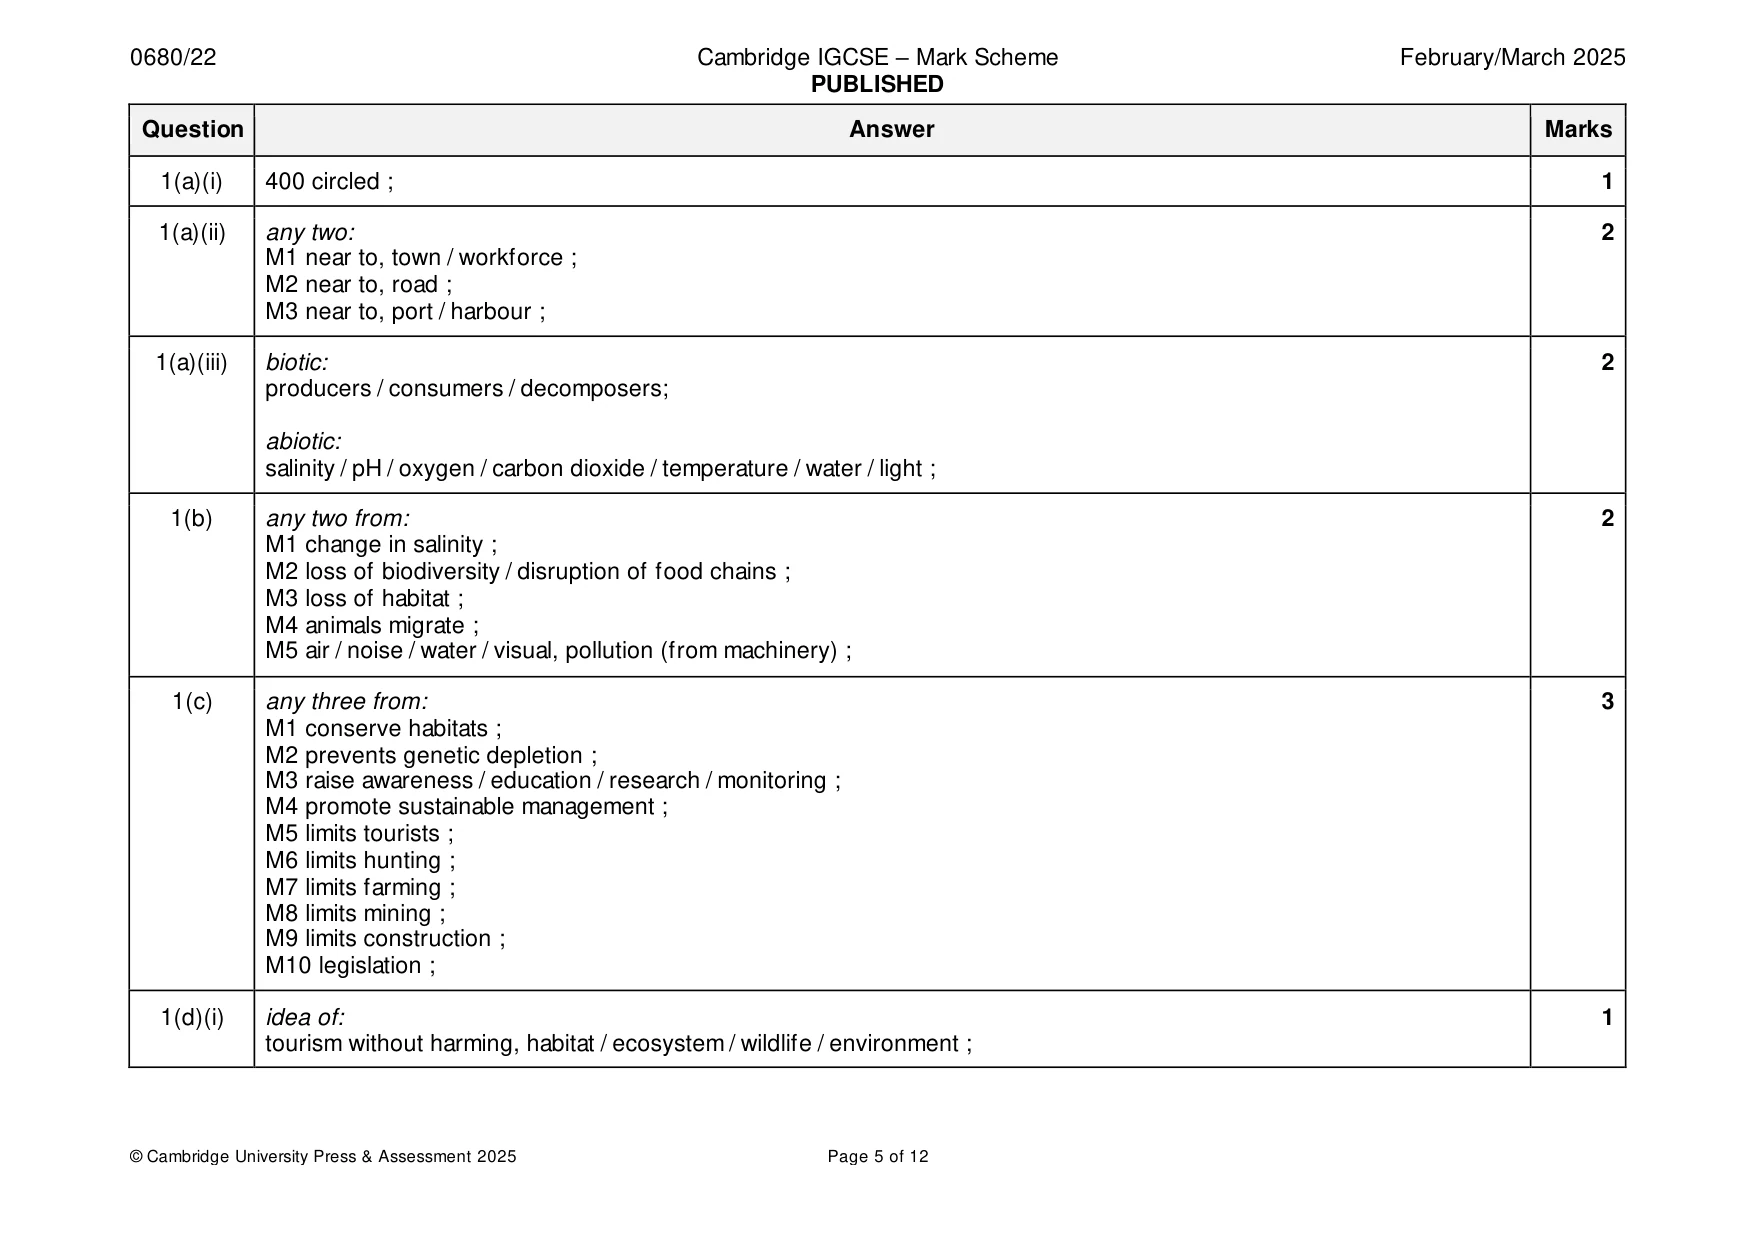
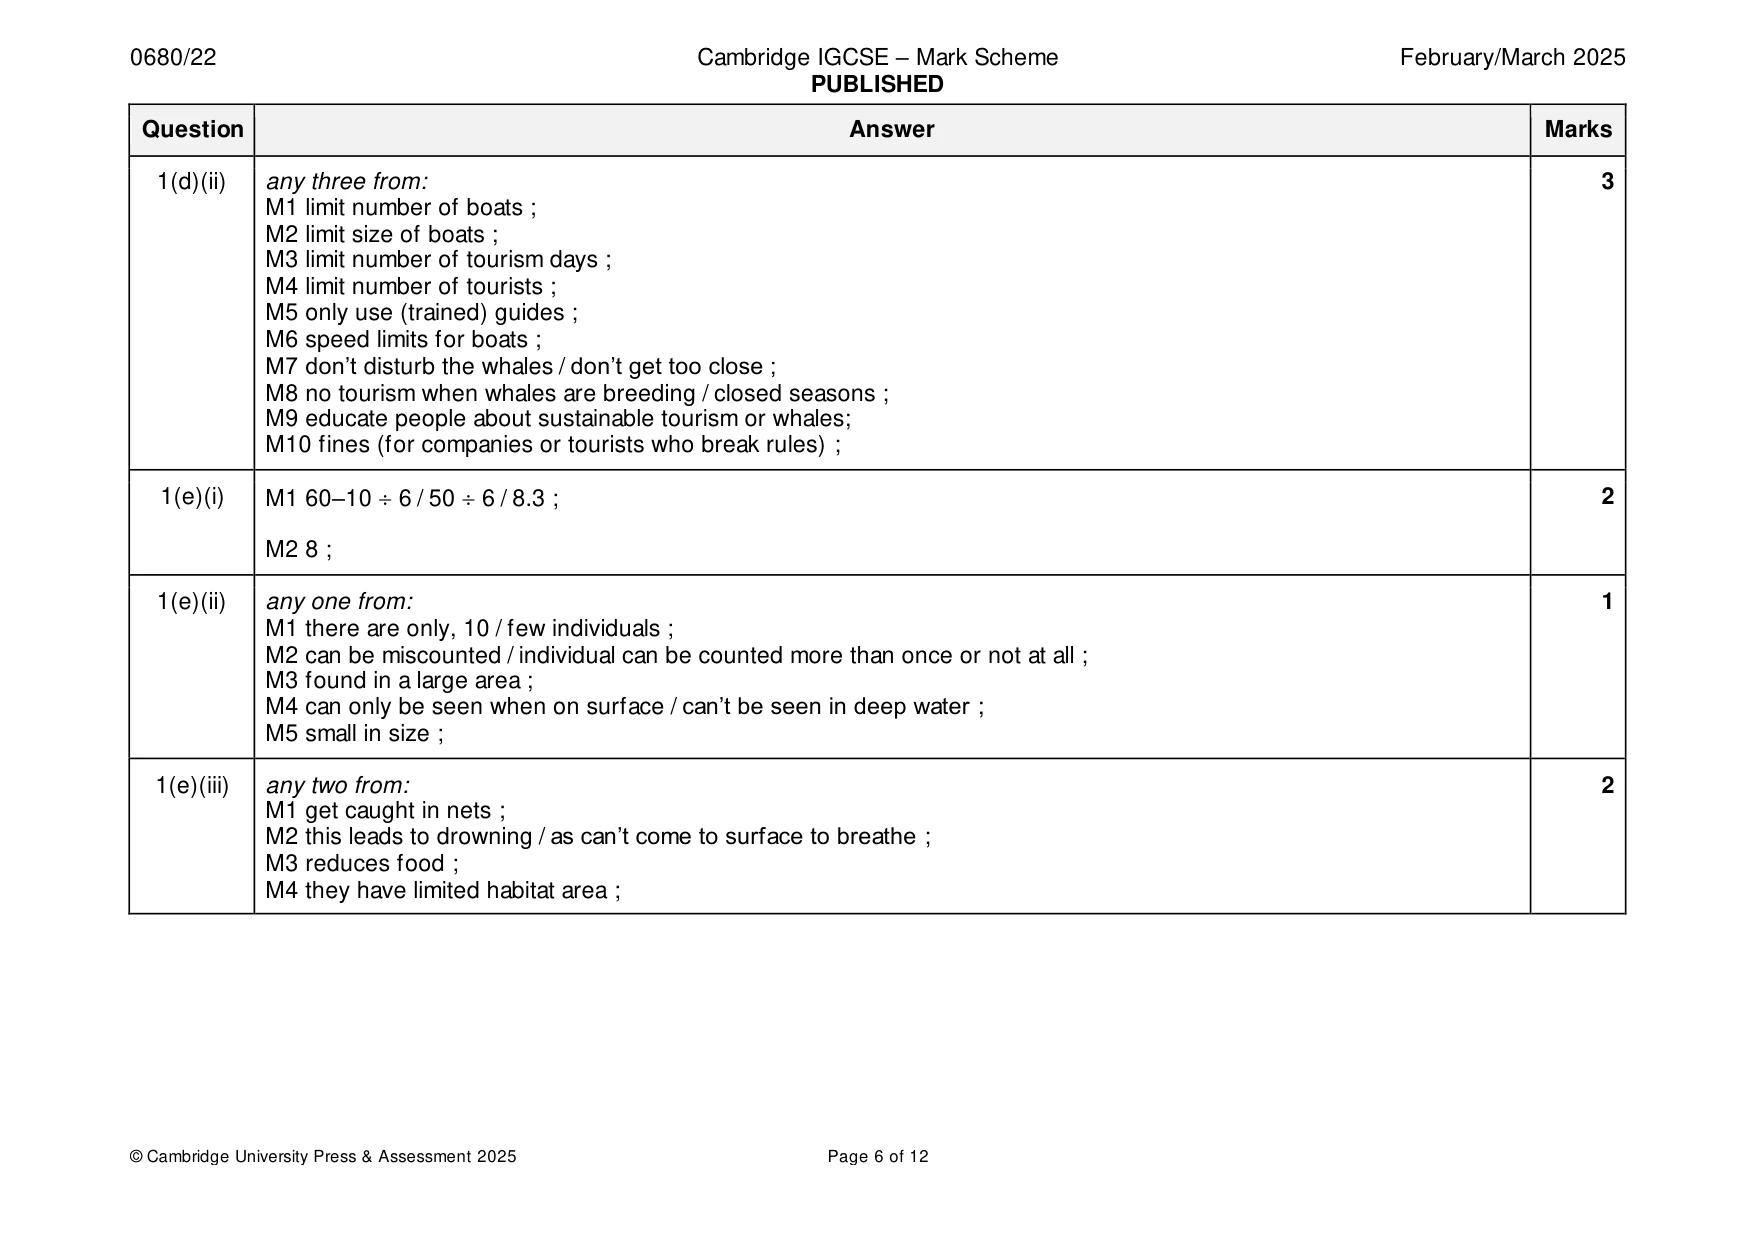
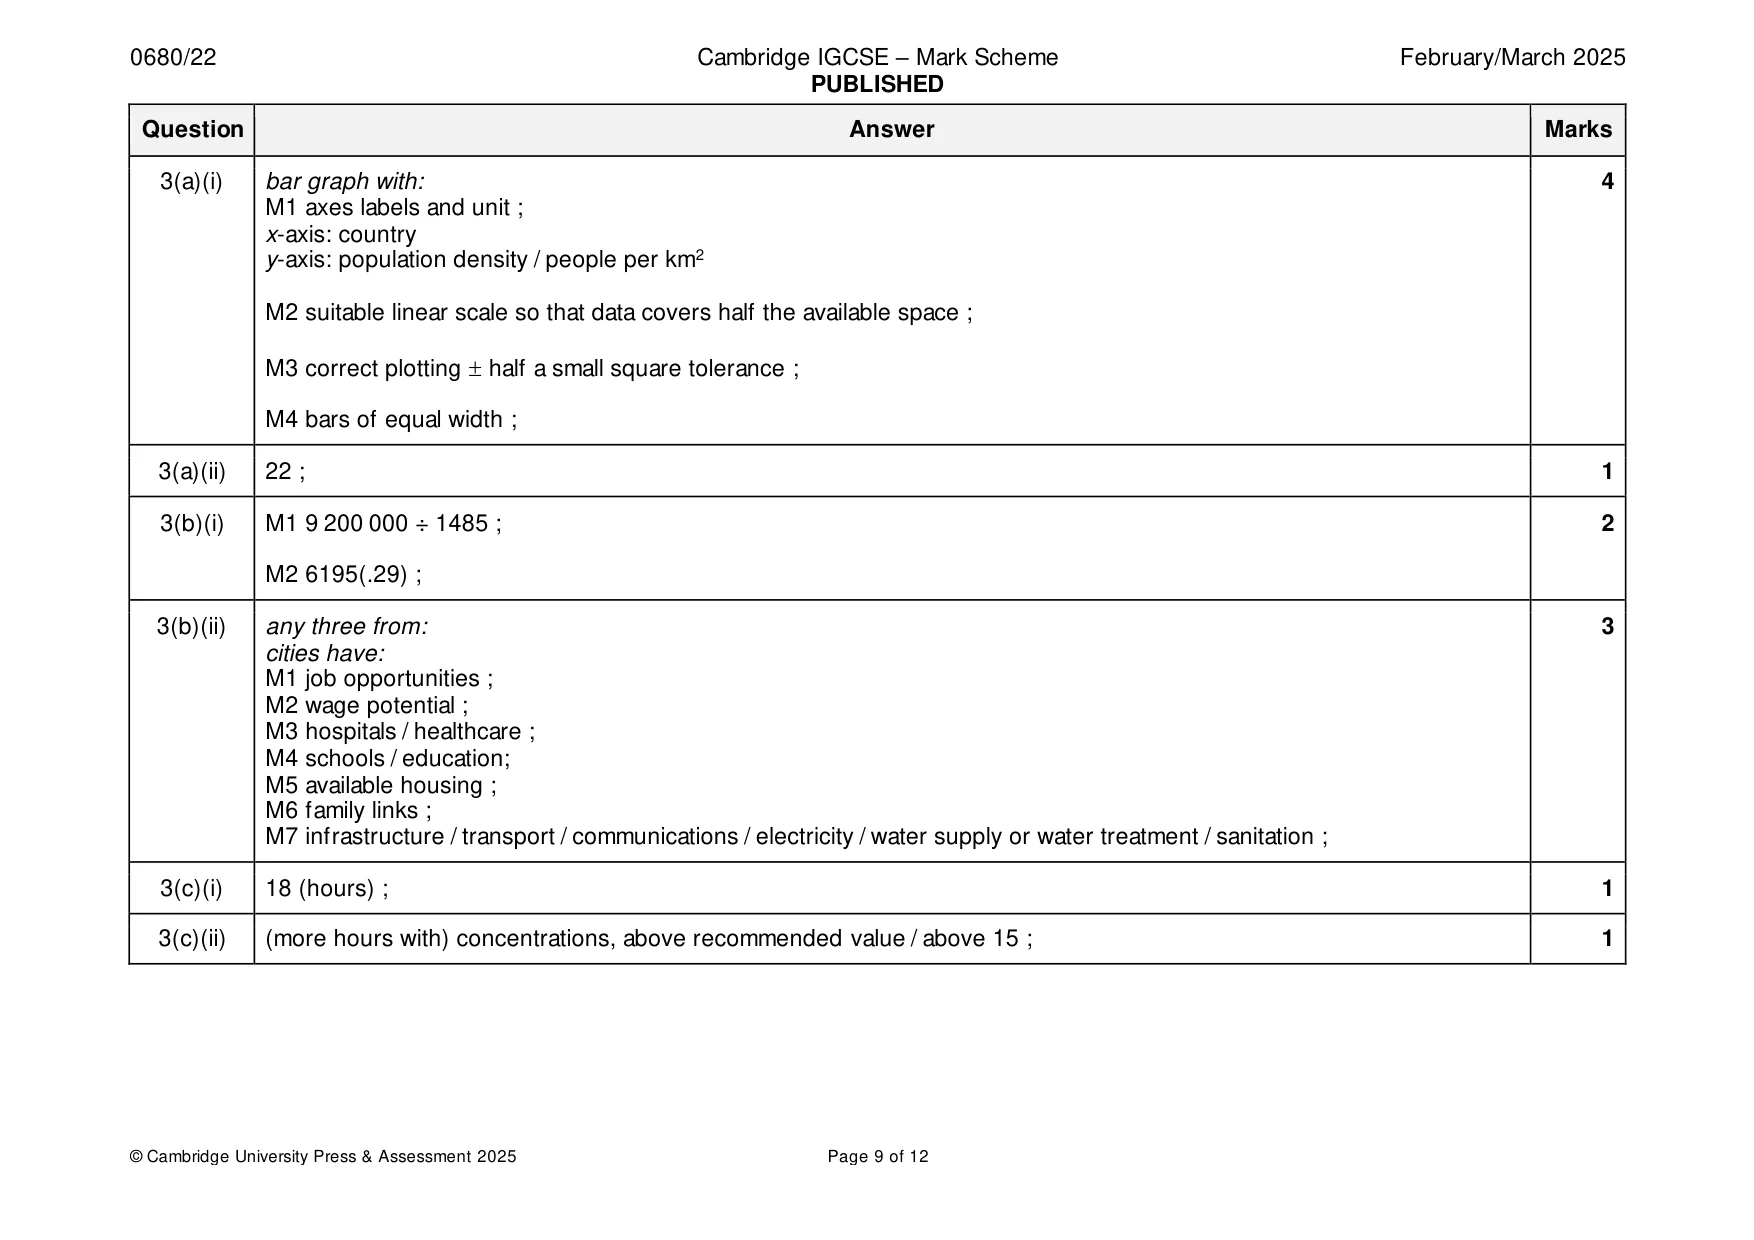
Mark scheme: Question Answer Marks 1(a)(i) 400 circled ; 1 1(a)(ii) any two: 2 M1 near to, town / workforce ; M2 near to, road ; M3 near to, port / harbour ; 1(a)(iii) biotic: 2 producers / consumers / decomposers; abiotic: salinity / pH / oxygen / carbon dioxide / temperature / water / light ; 1(b) any two from: 2 M1 change in salinity ; M2 loss of biodiversity / disruption of food chains ; M3 loss of habitat ; M4 animals migrate ; M5 air / noise / water / visual, pollution (from machinery) ; 1(c) any three from: 3 M1 conserve habitats ; M2 prevents genetic depletion ; M3 raise awareness / education / research / monitoring ; M4 promote sustainable management ; M5 limits tourists ; M6 limits hunting ; M7 limits farming ; M8 limits mining ; M9 limits construction ; M10 legislation ; 1(d)(i) idea of: 1 tourism without harming, habitat / ecosystem / wildlife / environment ; 1(d)(ii) any three from: 3 M1 limit number of boats ; M2 limit size of boats ; M3 limit number of tourism days ; M4 limit number of tourists ; M5 only use (trained) guides ; M6 speed limits for boats ; M7 don’t disturb the whales / don’t get too close ; M8 no tourism when whales are breeding / closed seasons ; M9 educate people about sustainable tourism or whales; M10 fines (for companies or tourists who break rules) ; 1(e)(i) M1 60–10 6 / 50 6 / 8.3 ; 2 M2 8 ; 1(e)(ii) any one from: 1 M1 there are only, 10 / few individuals ; M2 can be miscounted / individual can be counted more than once or not at all ; M3 found in a large area ; M4 can only be seen when on surface / can’t be seen in deep water ; M5 small in size ; 1(e)(iii) any two from: 2 M1 get caught in nets ; M2 this leads to drowning / as can’t come to surface to breathe ; M3 reduces food ; M4 they have limited habitat area ;
Q2 · The graphs show climate data for Mexico City and the Baja California peninsula
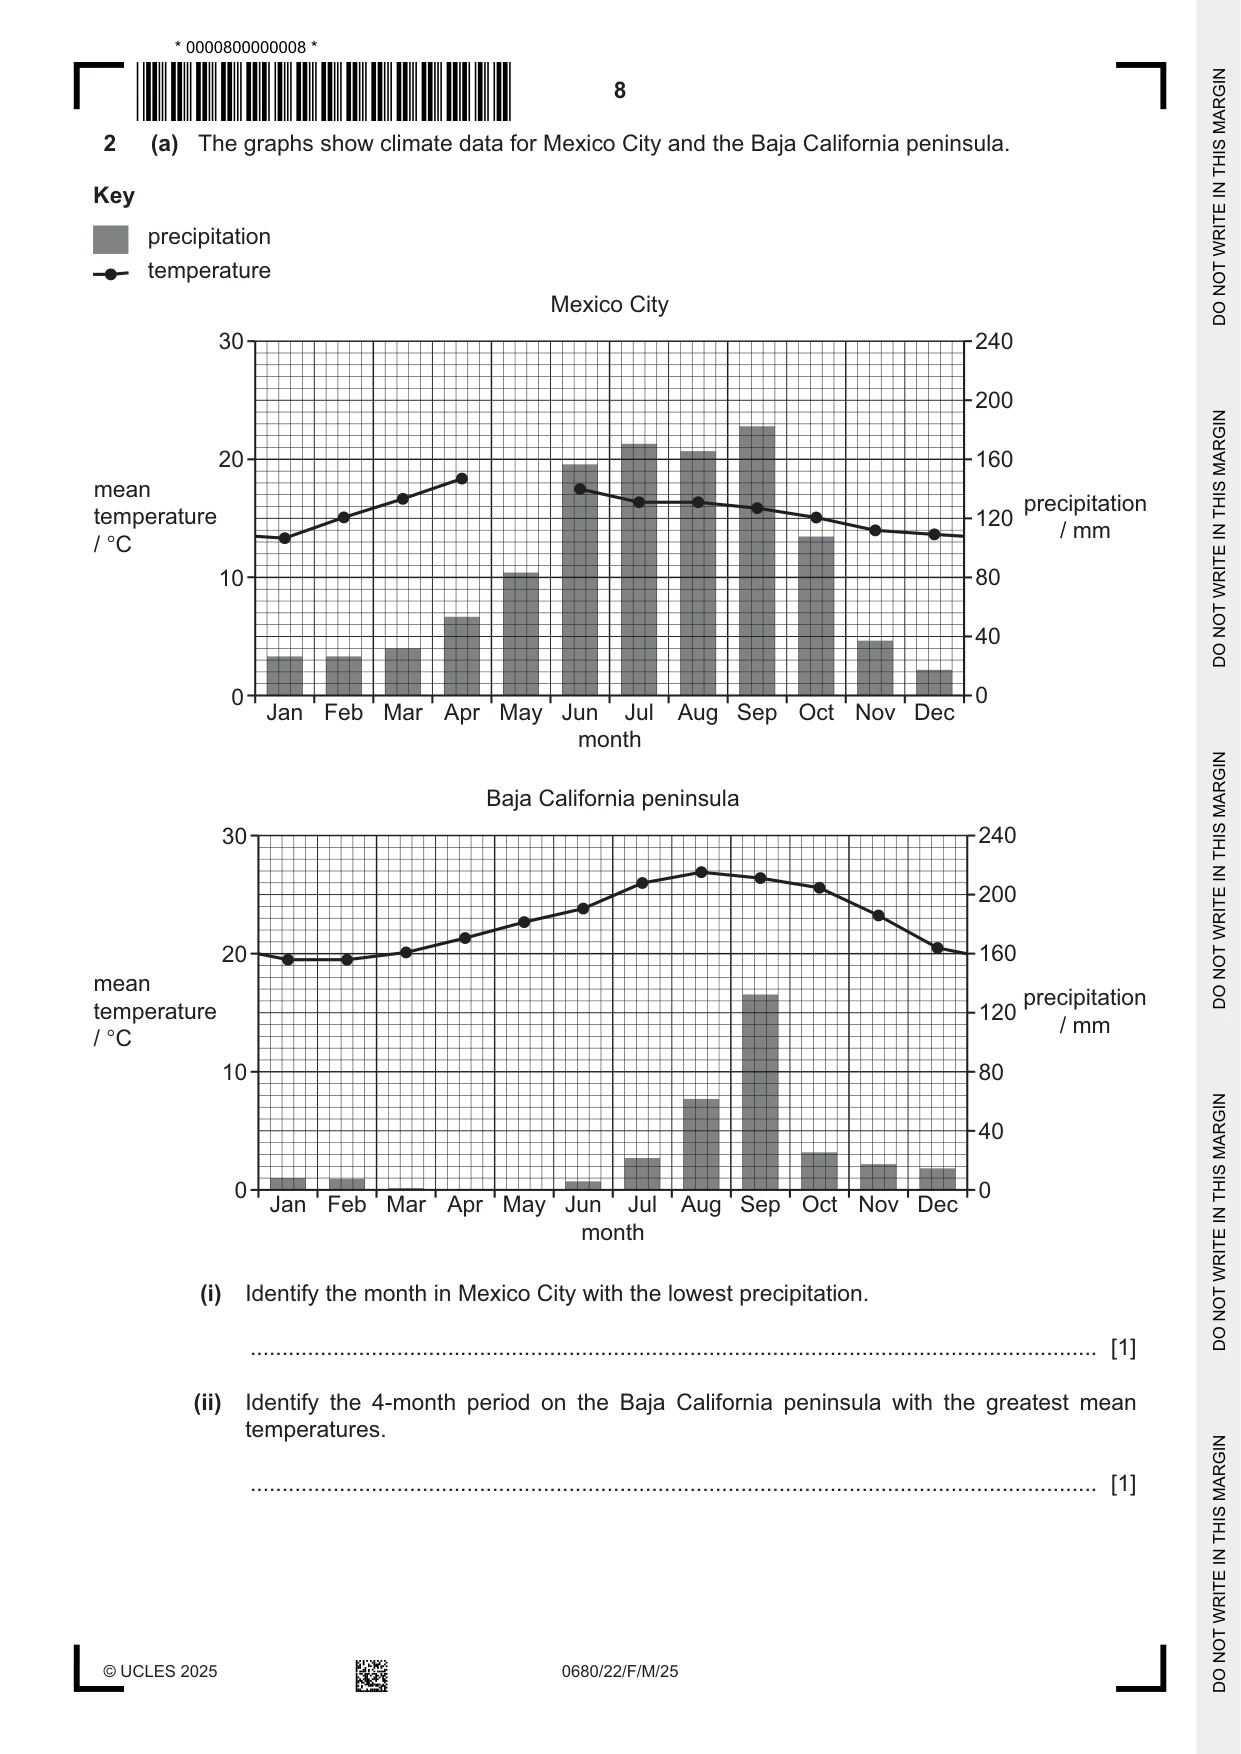
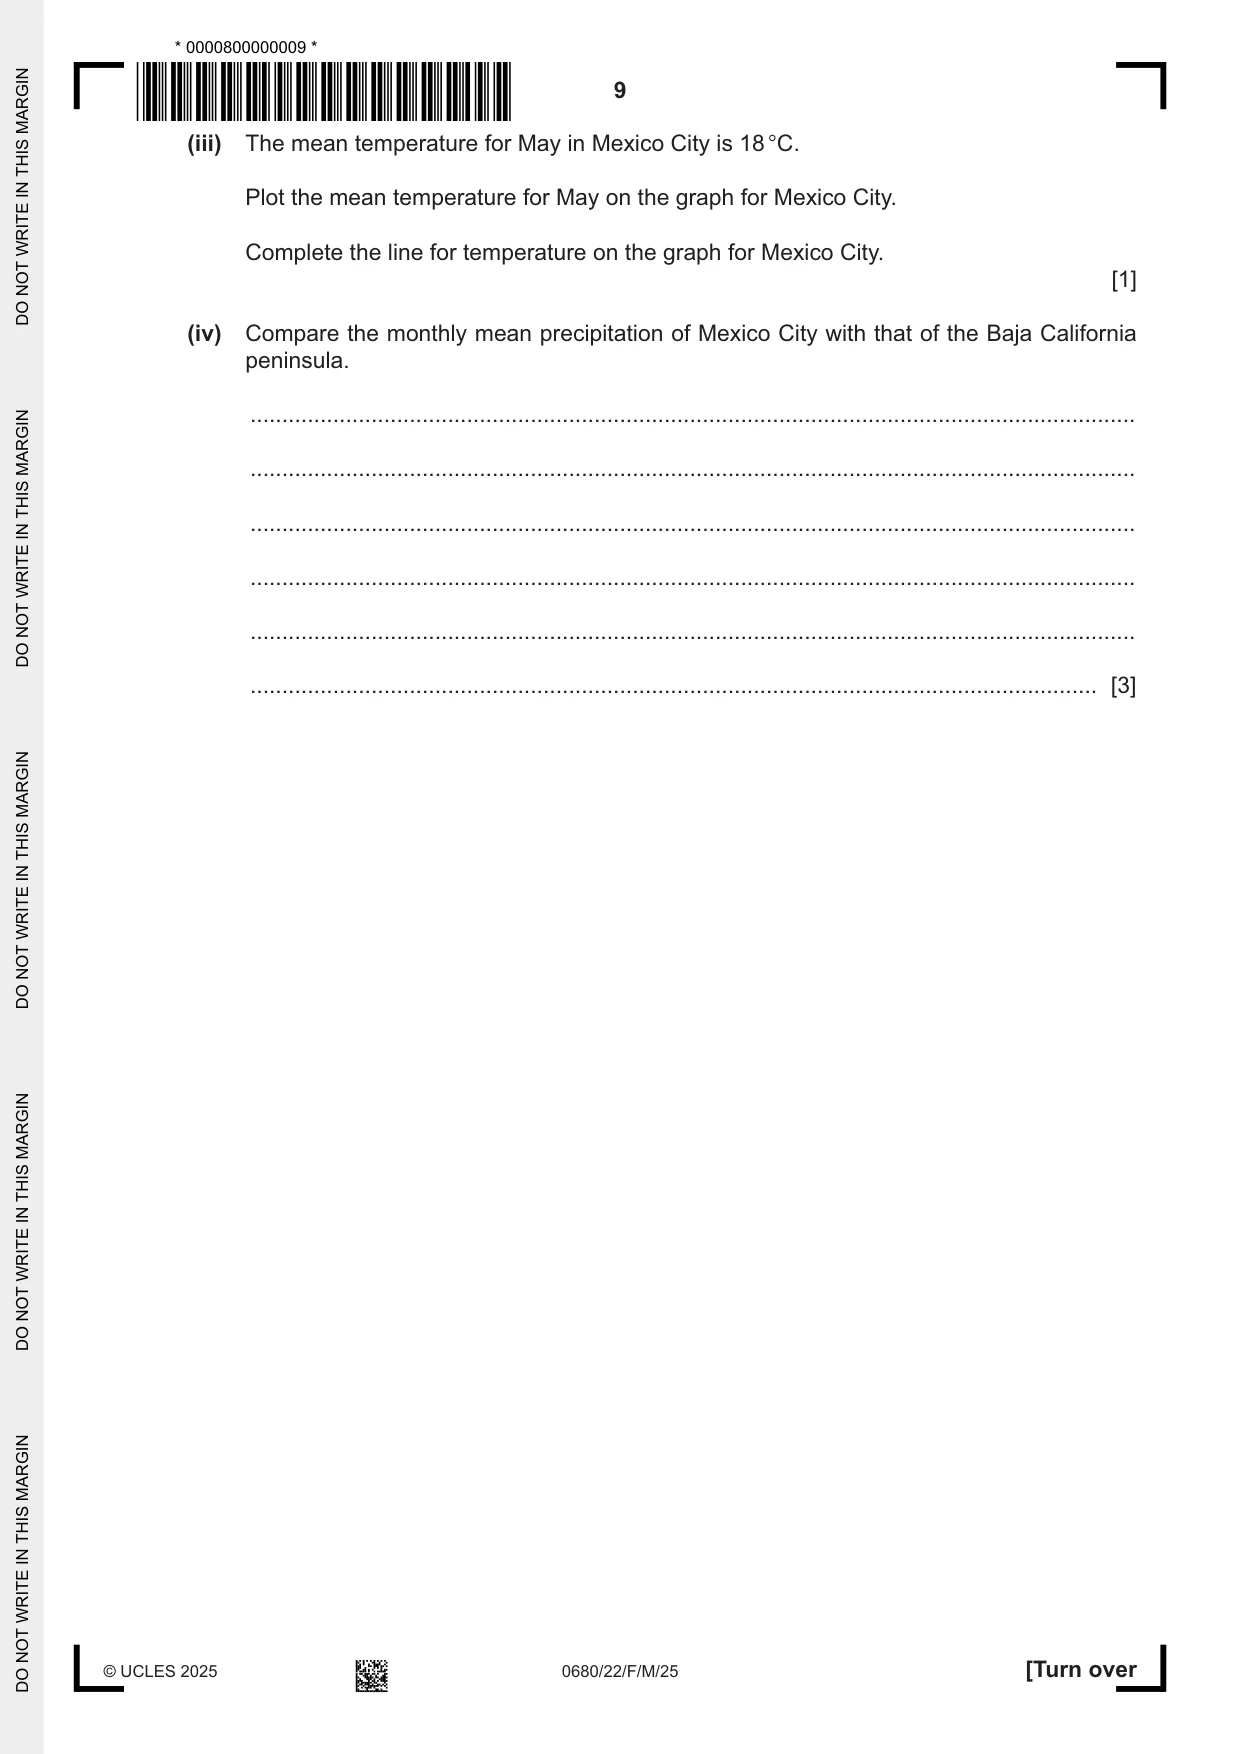
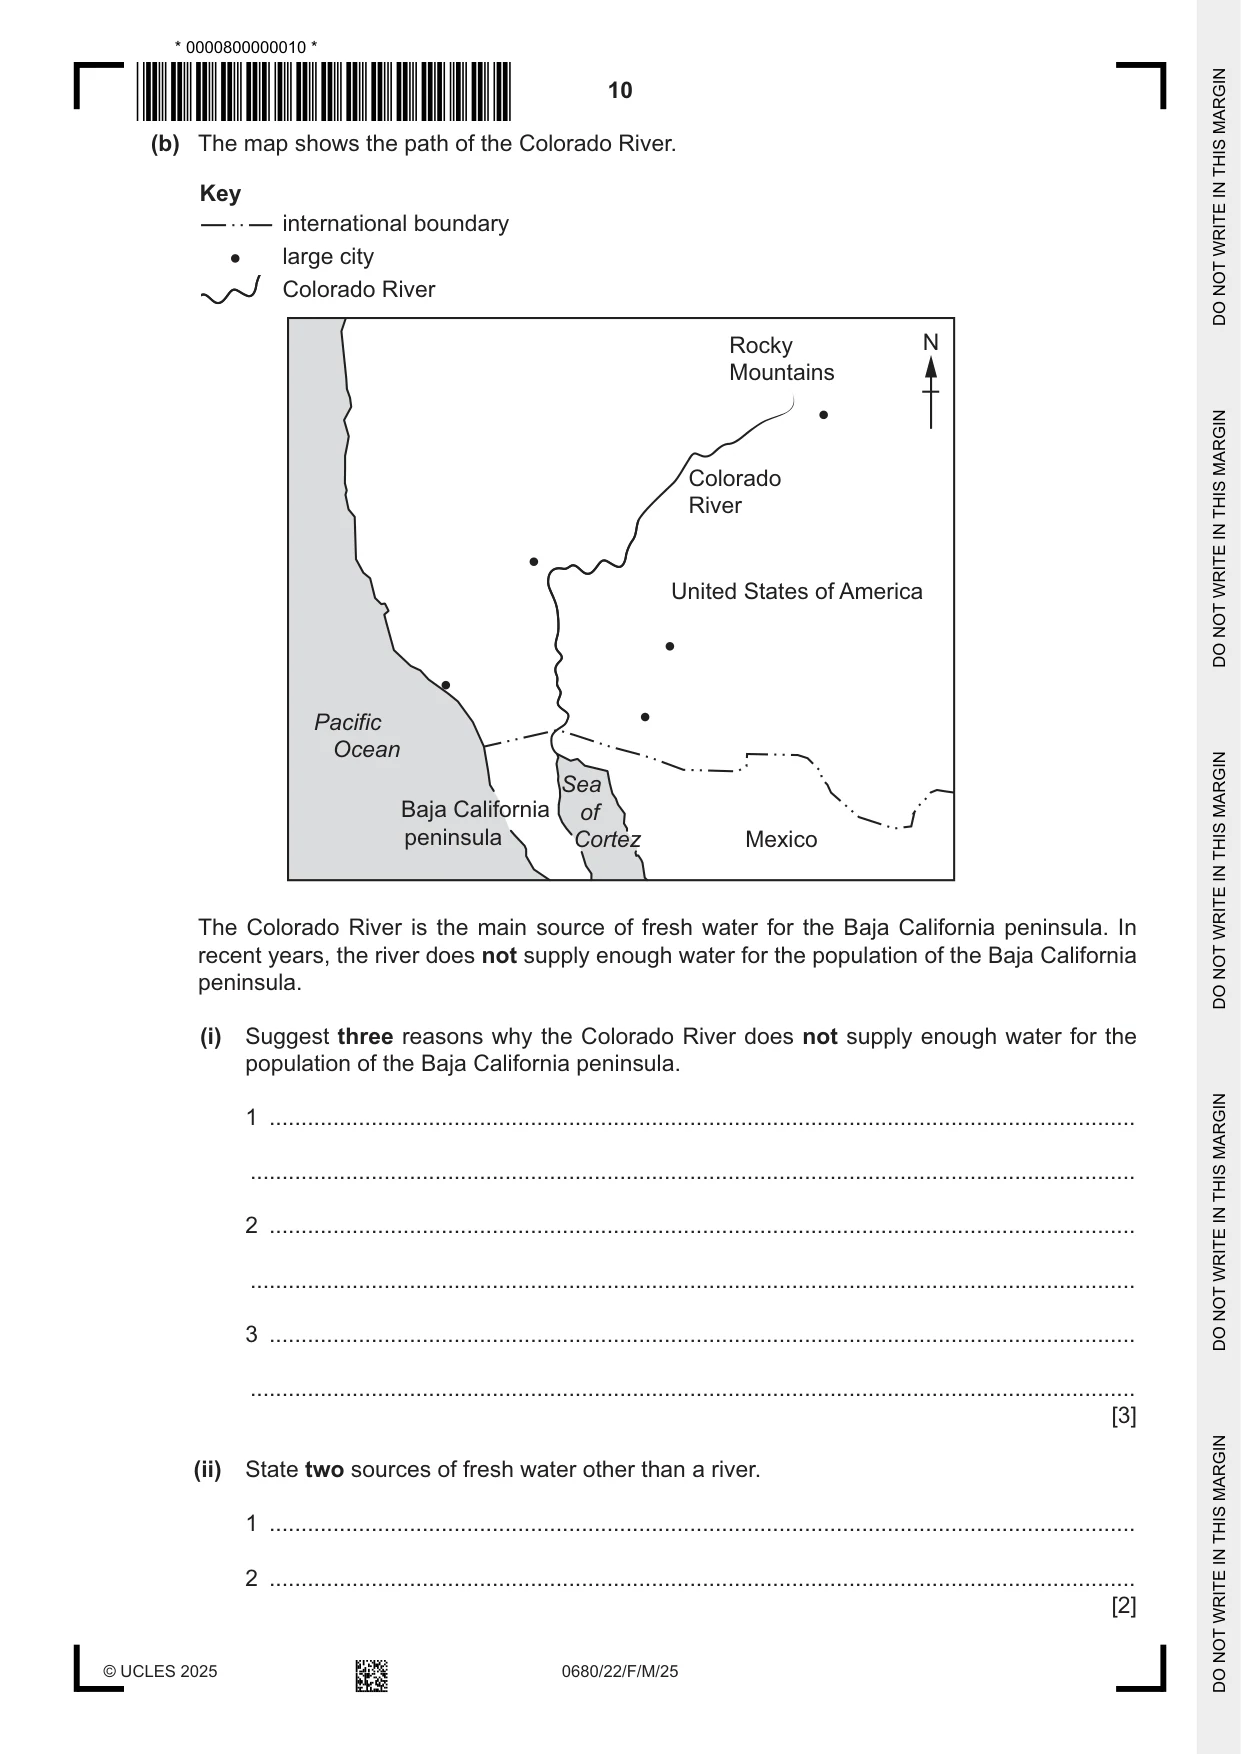
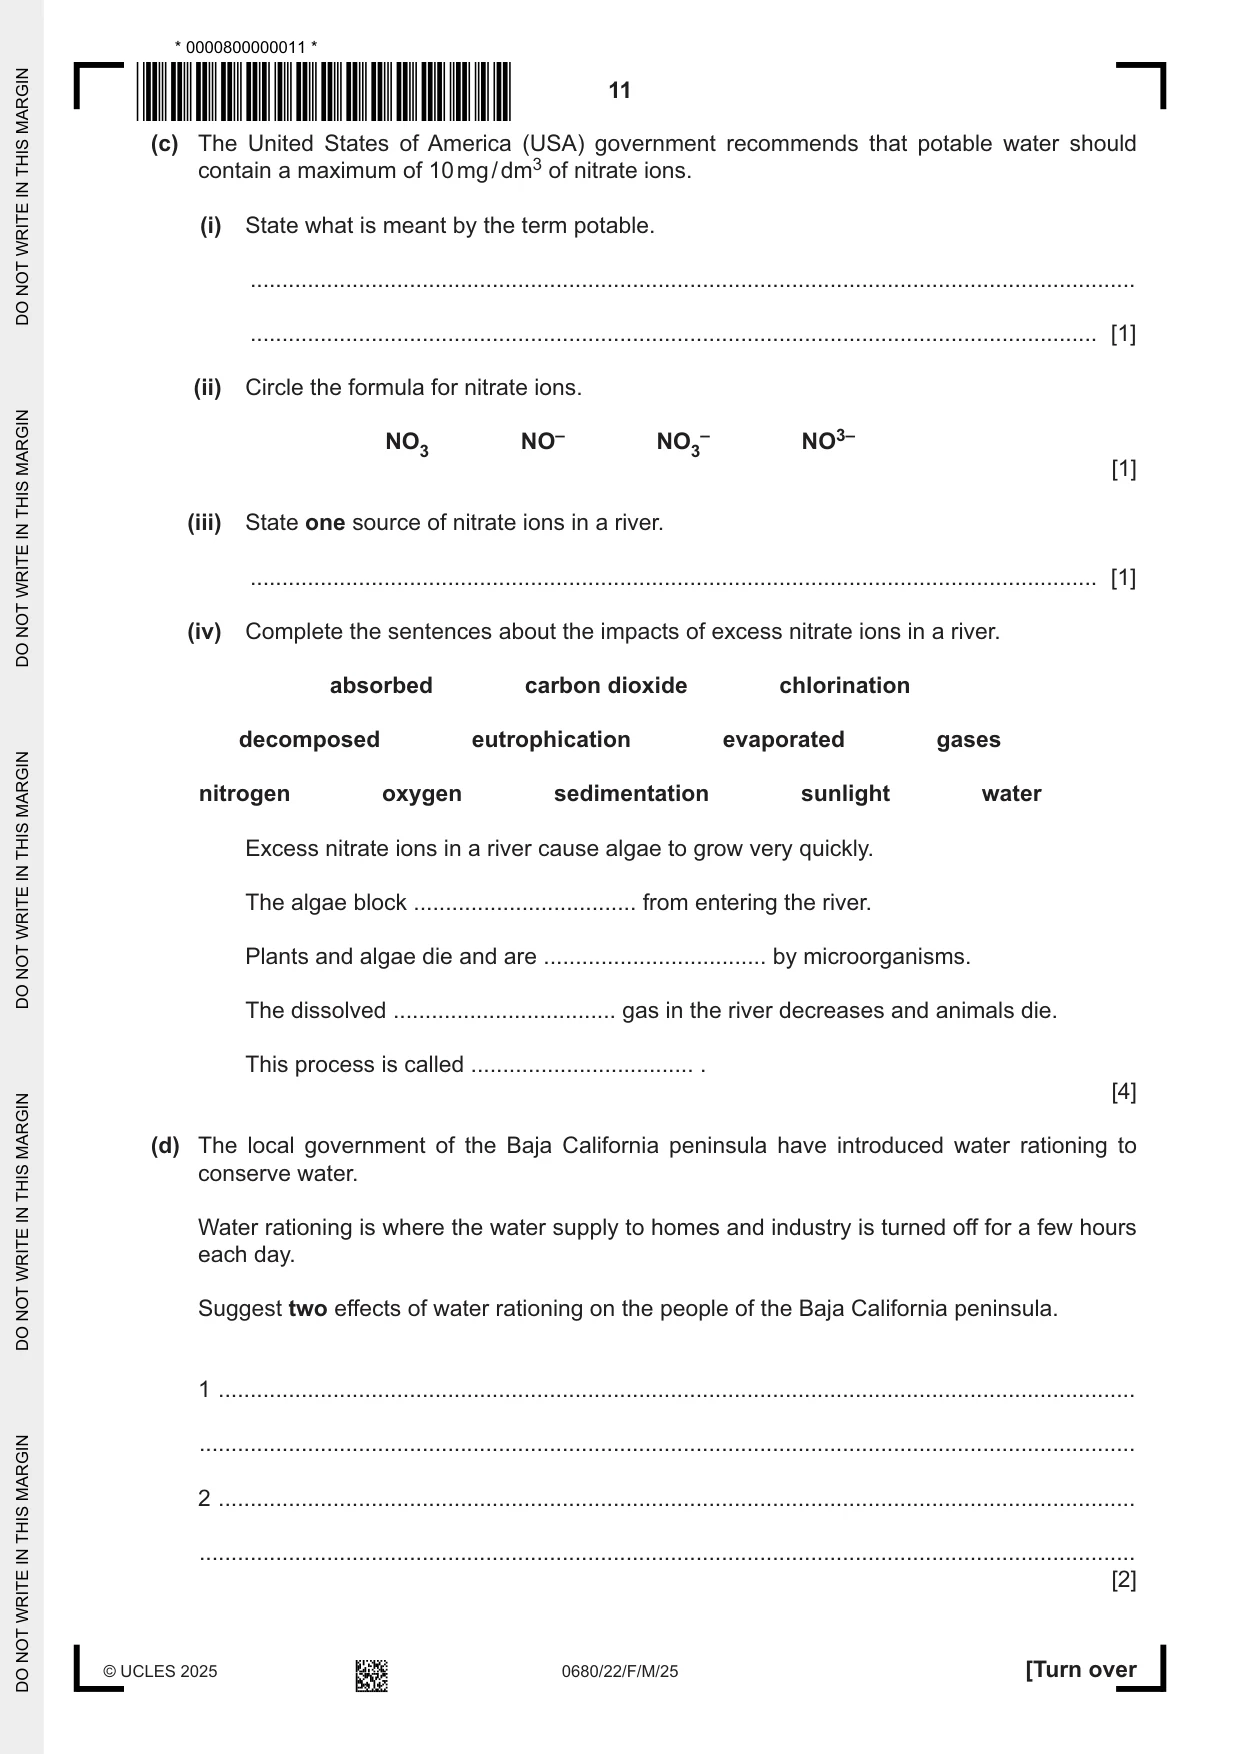
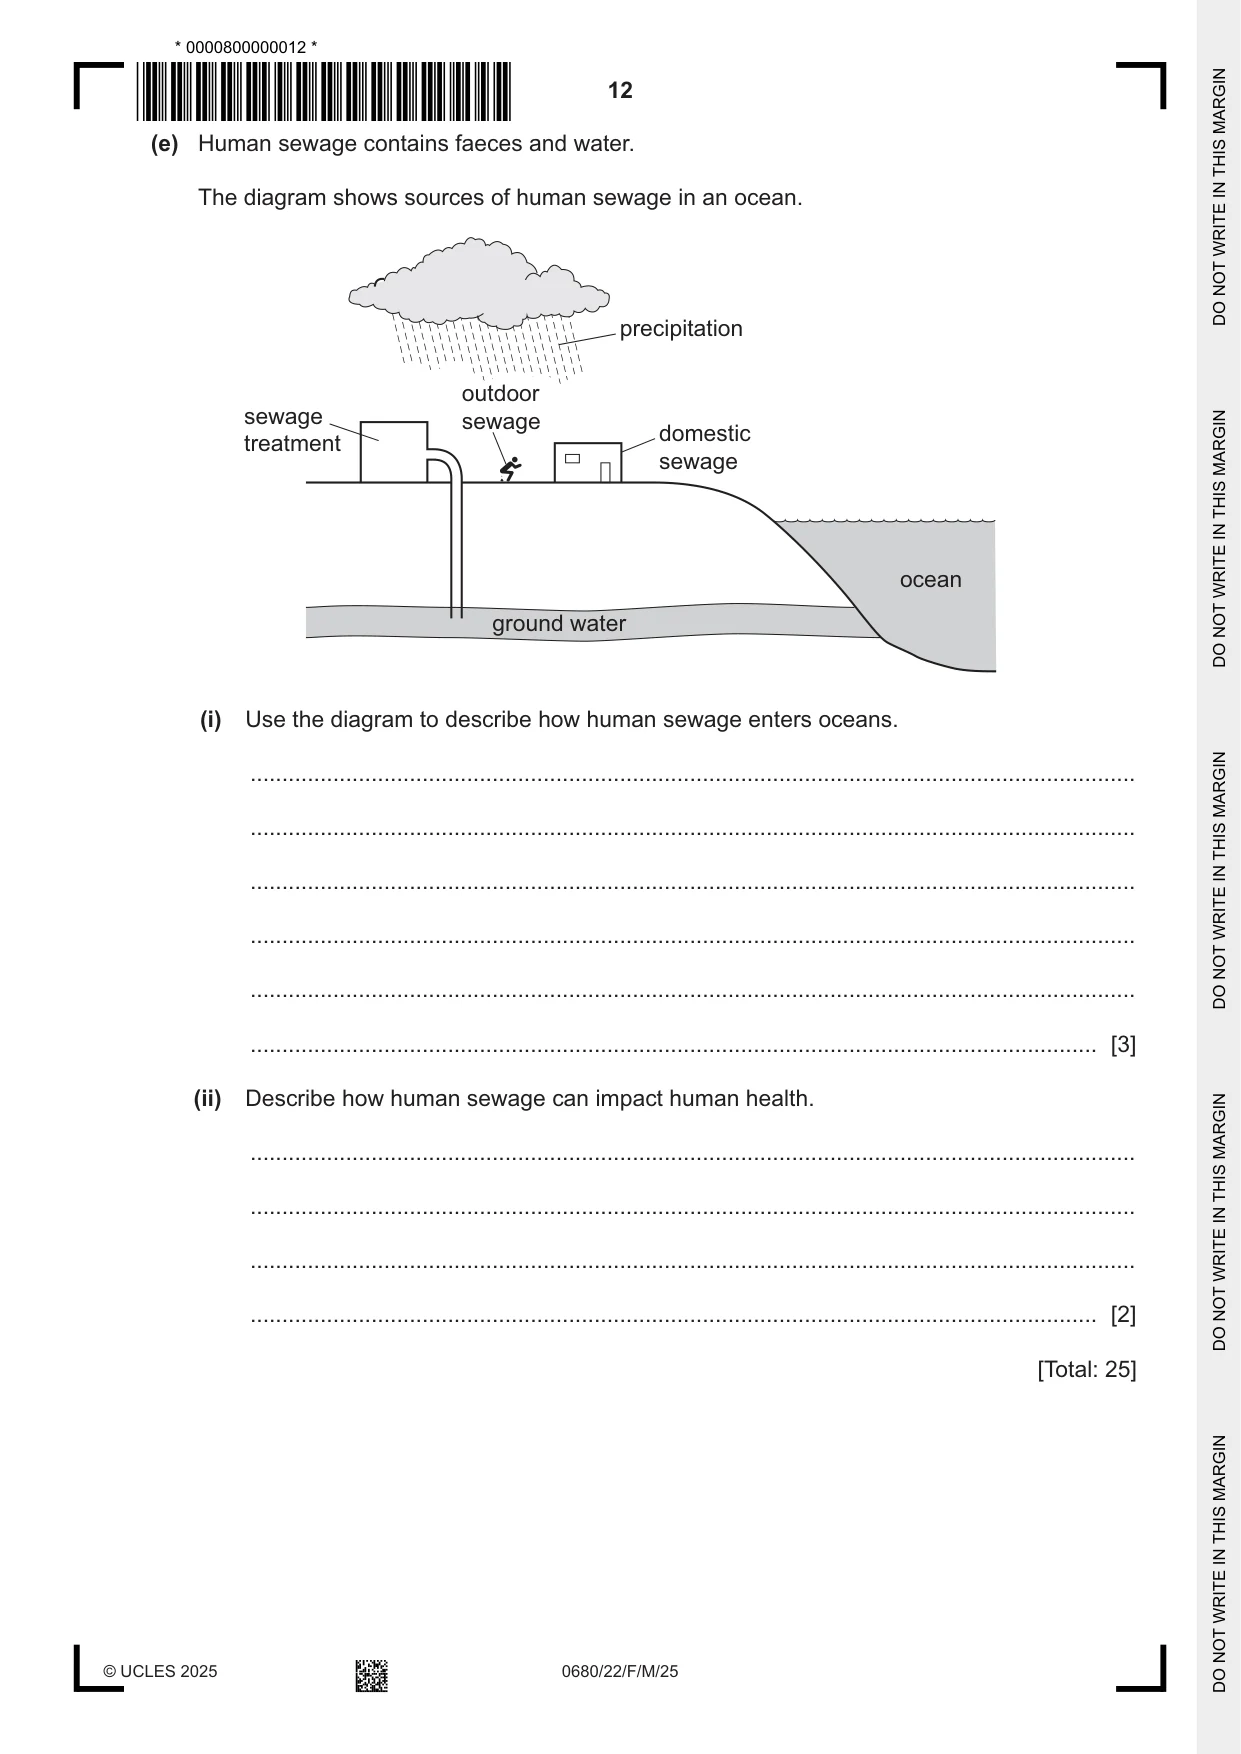
2 (a) The graphs show climate data for Mexico City and the Baja California peninsula. Key precipitation temperature Mexico City 30 240 200 20 160 mean precipitation temperature 120 / mm / °C 10 80 40 0 0 Jan Feb Mar Apr May Jun Jul Aug Sep Oct Nov Dec month Baja California peninsula 30 240 200 20 160 mean precipitation temperature 120 / mm / °C 10 80 40 0 0 Jan Feb Mar Apr May Jun Jul Aug Sep Oct Nov Dec month (i) Identify the month in Mexico City with the lowest precipitation. ..................................................................................................................................... [1] (ii) Identify the 4-month period on the Baja California peninsula with the greatest mean temperatures. ..................................................................................................................................... [1] (iii) The mean temperature for May in Mexico City is 18 °C. Plot the mean temperature for May on the graph for Mexico City. Complete the line for temperature on the graph for Mexico City. [1] (iv) Compare the monthly mean precipitation of Mexico City with that of the Baja California peninsula. ........................................................................................................................................... ........................................................................................................................................... ........................................................................................................................................... ........................................................................................................................................... ........................................................................................................................................... ..................................................................................................................................... [3] (b) The map shows the path of the Colorado River. Key international boundary large city Colorado River Rocky N Mountains Colorado River United States of America Pacific Ocean Sea Baja California of peninsula Cortez Mexico The Colorado River is the main source of fresh water for the Baja California peninsula. In recent years, the river does not supply enough water for the population of the Baja California peninsula. (i) Suggest three reasons why the Colorado River does not supply enough water for the population of the Baja California peninsula. 1 ........................................................................................................................................ ........................................................................................................................................... 2 ........................................................................................................................................ ........................................................................................................................................... 3 ........................................................................................................................................ ........................................................................................................................................... [3] (ii) State two sources of fresh water other than a river. 1 ........................................................................................................................................ 2 ........................................................................................................................................ [2] (c) The United States of America (USA) government recommends that potable water should contain a maximum of 10 mg / dm3 of nitrate ions. (i) State what is meant by the term potable. ........................................................................................................................................... ..................................................................................................................................... [1] (ii) Circle the formula for nitrate ions. NO3 NO– NO3– NO3– [1] (iii) State one source of nitrate ions in a river. ..................................................................................................................................... [1] (iv) Complete the sentences about the impacts of excess nitrate ions in a river. absorbed carbon dioxide chlorination decomposed eutrophication evaporated gases nitrogen oxygen sedimentation sunlight water Excess nitrate ions in a river cause algae to grow very quickly. The algae block ................................... from entering the river. Plants and algae die and are ................................... by microorganisms. The dissolved ................................... gas in the river decreases and animals die. This process is called ................................... . [4] (d) The local government of the Baja California peninsula have introduced water rationing to conserve water. Water rationing is where the water supply to homes and industry is turned off for a few hours each day. Suggest two effects of water rationing on the people of the Baja California peninsula. 1 ................................................................................................................................................ ................................................................................................................................................... 2 ................................................................................................................................................ ................................................................................................................................................... [2] (e) Human sewage contains faeces and water. The diagram shows sources of human sewage in an ocean. precipitation outdoor sewage sewage domestic treatment sewage ocean ground water (i) Use the diagram to describe how human sewage enters oceans. ........................................................................................................................................... ........................................................................................................................................... ........................................................................................................................................... ........................................................................................................................................... ........................................................................................................................................... ..................................................................................................................................... [3] (ii) Describe how human sewage can impact human health. ........................................................................................................................................... ........................................................................................................................................... ........................................................................................................................................... ..................................................................................................................................... [2] [Total: 25]
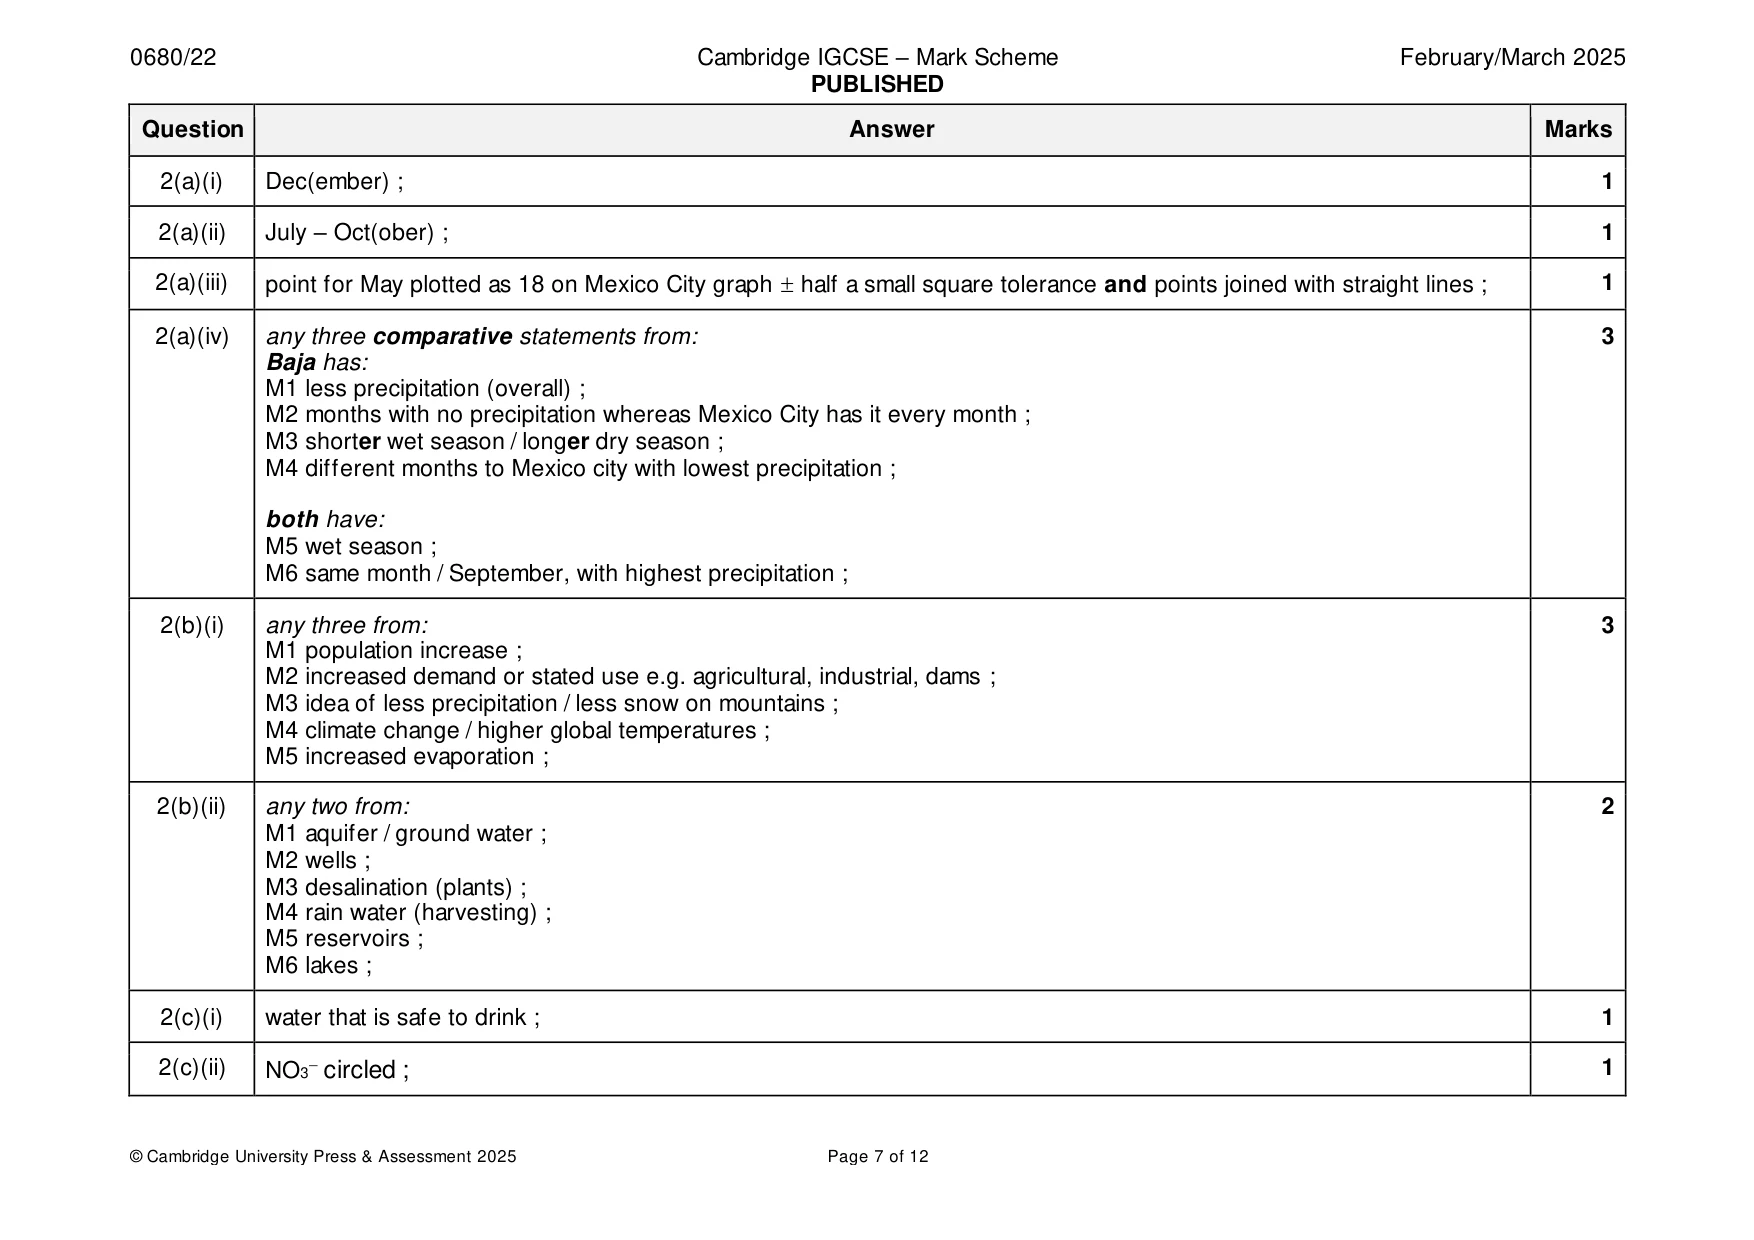
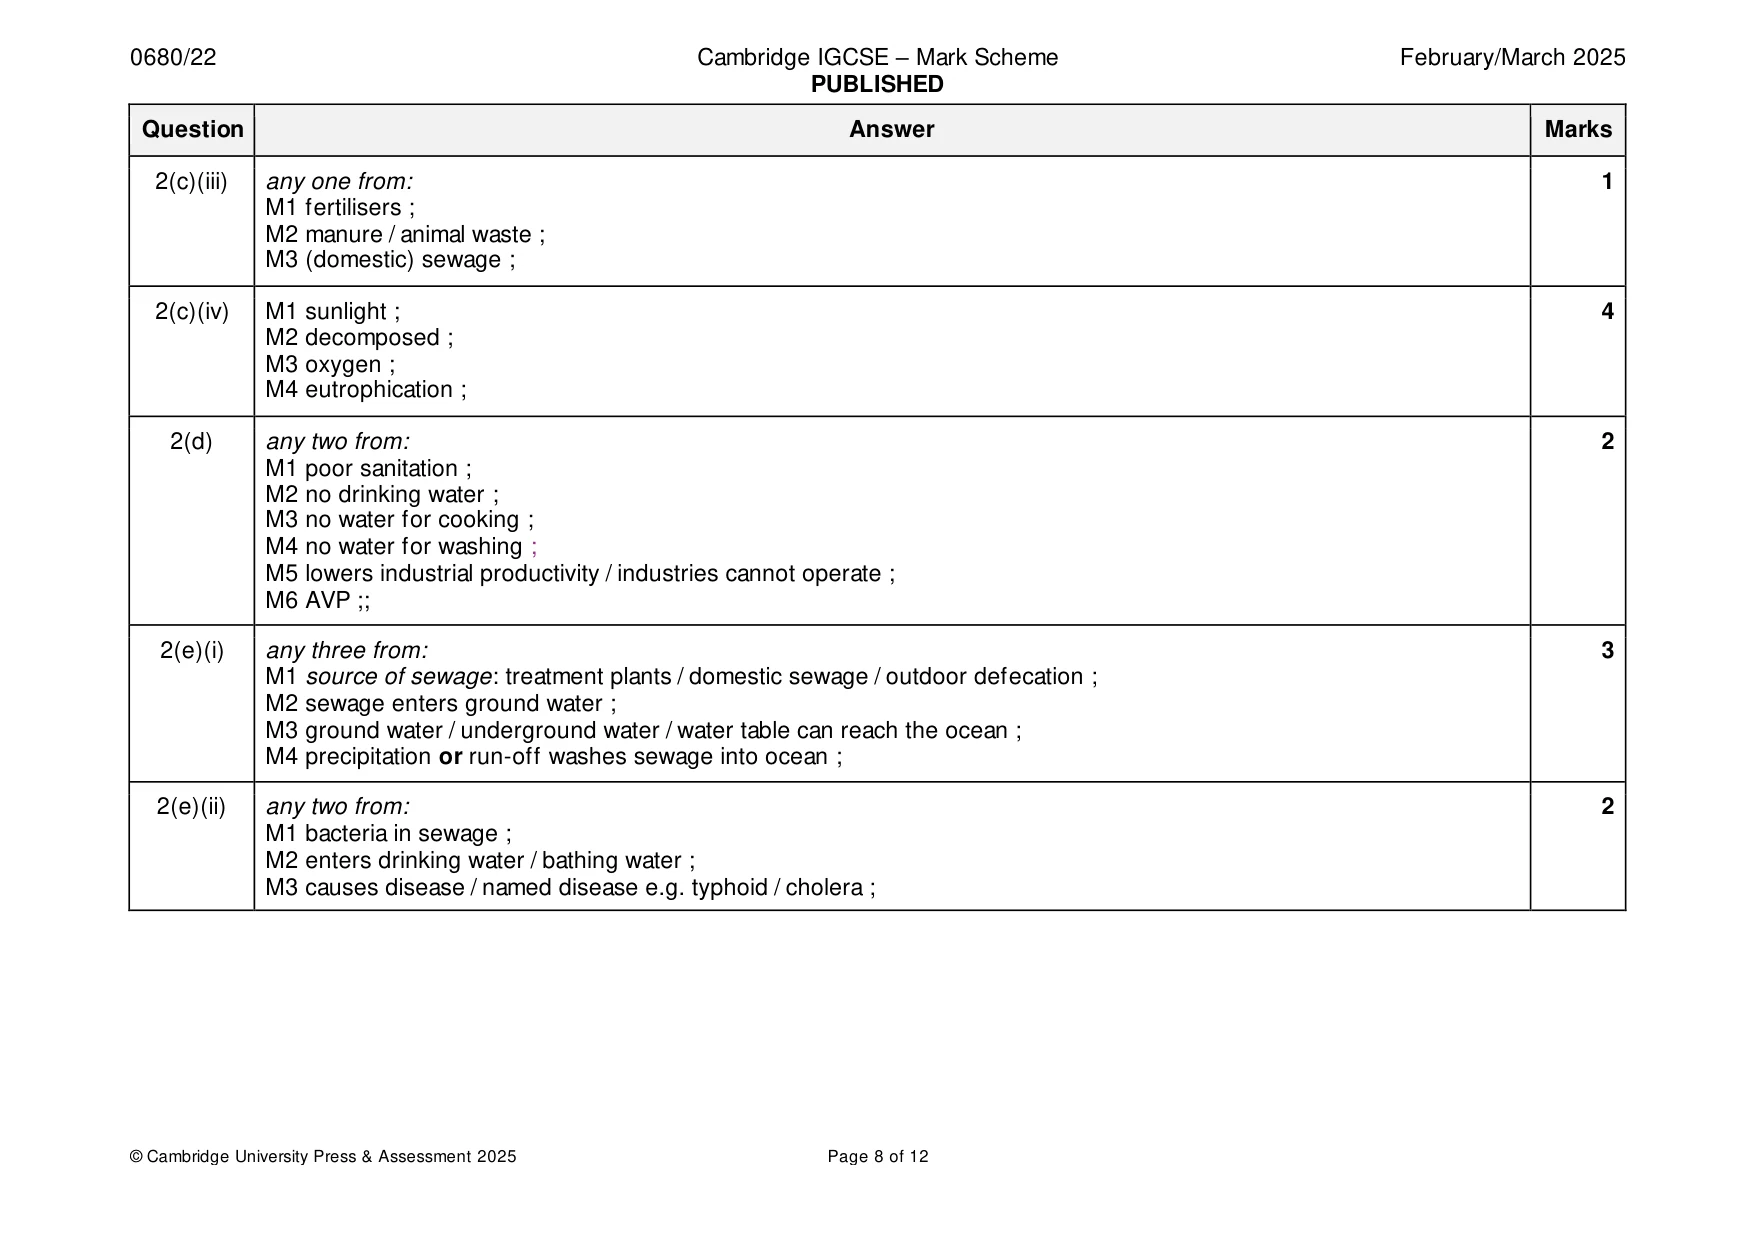
Mark scheme: 2(a)(i) Dec(ember) ; 1 2(a)(ii) July – Oct(ober) ; 1 2(a)(iii) point for May plotted as 18 on Mexico City graph half a small square tolerance and points joined with straight lines ; 1 2(a)(iv) any three comparative statements from: 3 Baja has: M1 less precipitation (overall) ; M2 months with no precipitation whereas Mexico City has it every month ; M3 shorter wet season / longer dry season ; M4 different months to Mexico city with lowest precipitation ; both have: M5 wet season ; M6 same month / September, with highest precipitation ; 2(b)(i) any three from: 3 M1 population increase ; M2 increased demand or stated use e.g. agricultural, industrial, dams ; M3 idea of less precipitation / less snow on mountains ; M4 climate change / higher global temperatures ; M5 increased evaporation ; 2(b)(ii) any two from: 2 M1 aquifer / ground water ; M2 wells ; M3 desalination (plants) ; M4 rain water (harvesting) ; M5 reservoirs ; M6 lakes ; 2(c)(i) water that is safe to drink ; 1 2(c)(ii) NO3− circled ; 1 2(c)(iii) any one from: 1 M1 fertilisers ; M2 manure / animal waste ; M3 (domestic) sewage ; 2(c)(iv) M1 sunlight ; 4 M2 decomposed ; M3 oxygen ; M4 eutrophication ; 2(d) any two from: 2 M1 poor sanitation ; M2 no drinking water ; M3 no water for cooking ; M4 no water for washing ; M5 lowers industrial productivity / industries cannot operate ; M6 AVP ;; 2(e)(i) any three from: 3 M1 source of sewage: treatment plants / domestic sewage / outdoor defecation ; M2 sewage enters ground water ; M3 ground water / underground water / water table can reach the ocean ; M4 precipitation or run-off washes sewage into ocean ; 2(e)(ii) any two from: 2 M1 bacteria in sewage ; M2 enters drinking water / bathing water ; M3 causes disease / named disease e.g. typhoid / cholera ;
Q3 · The table shows the population density of 5 countries
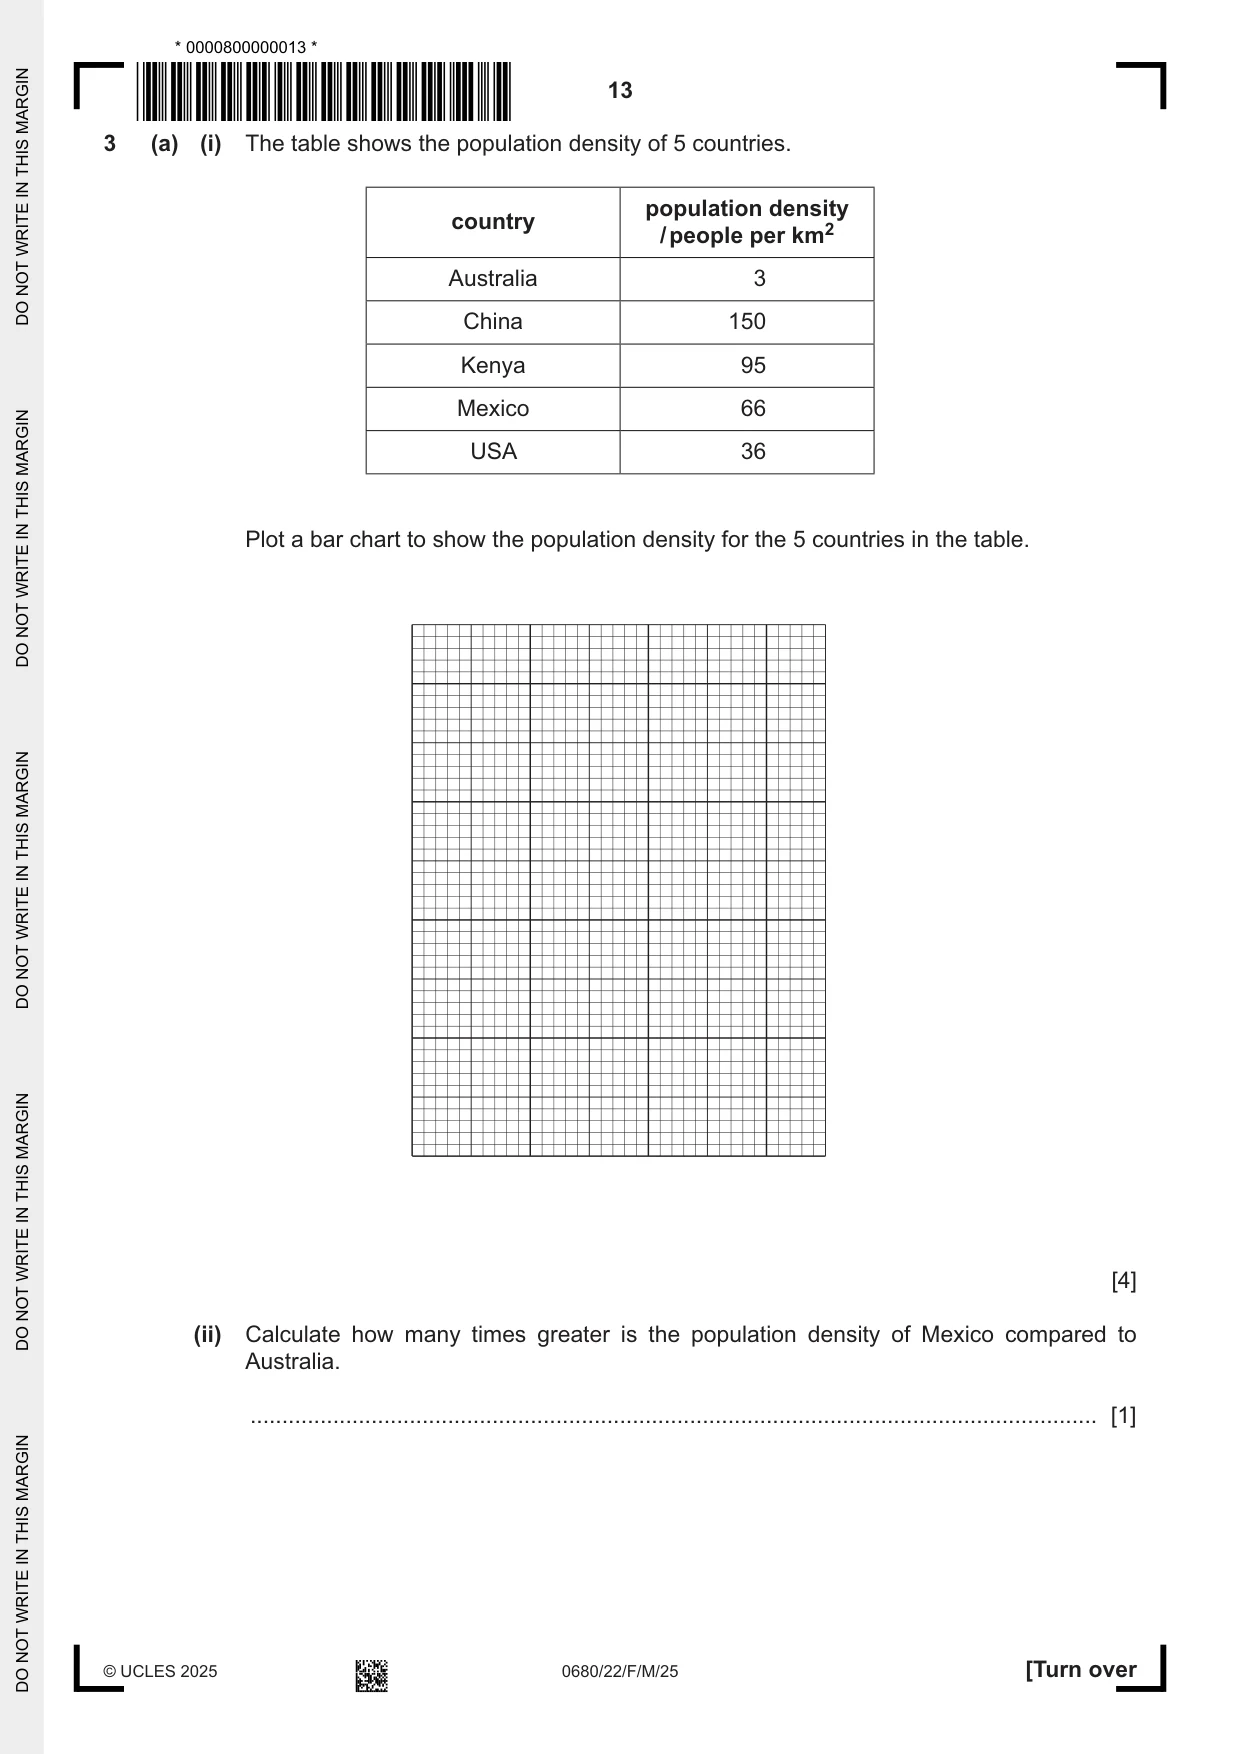
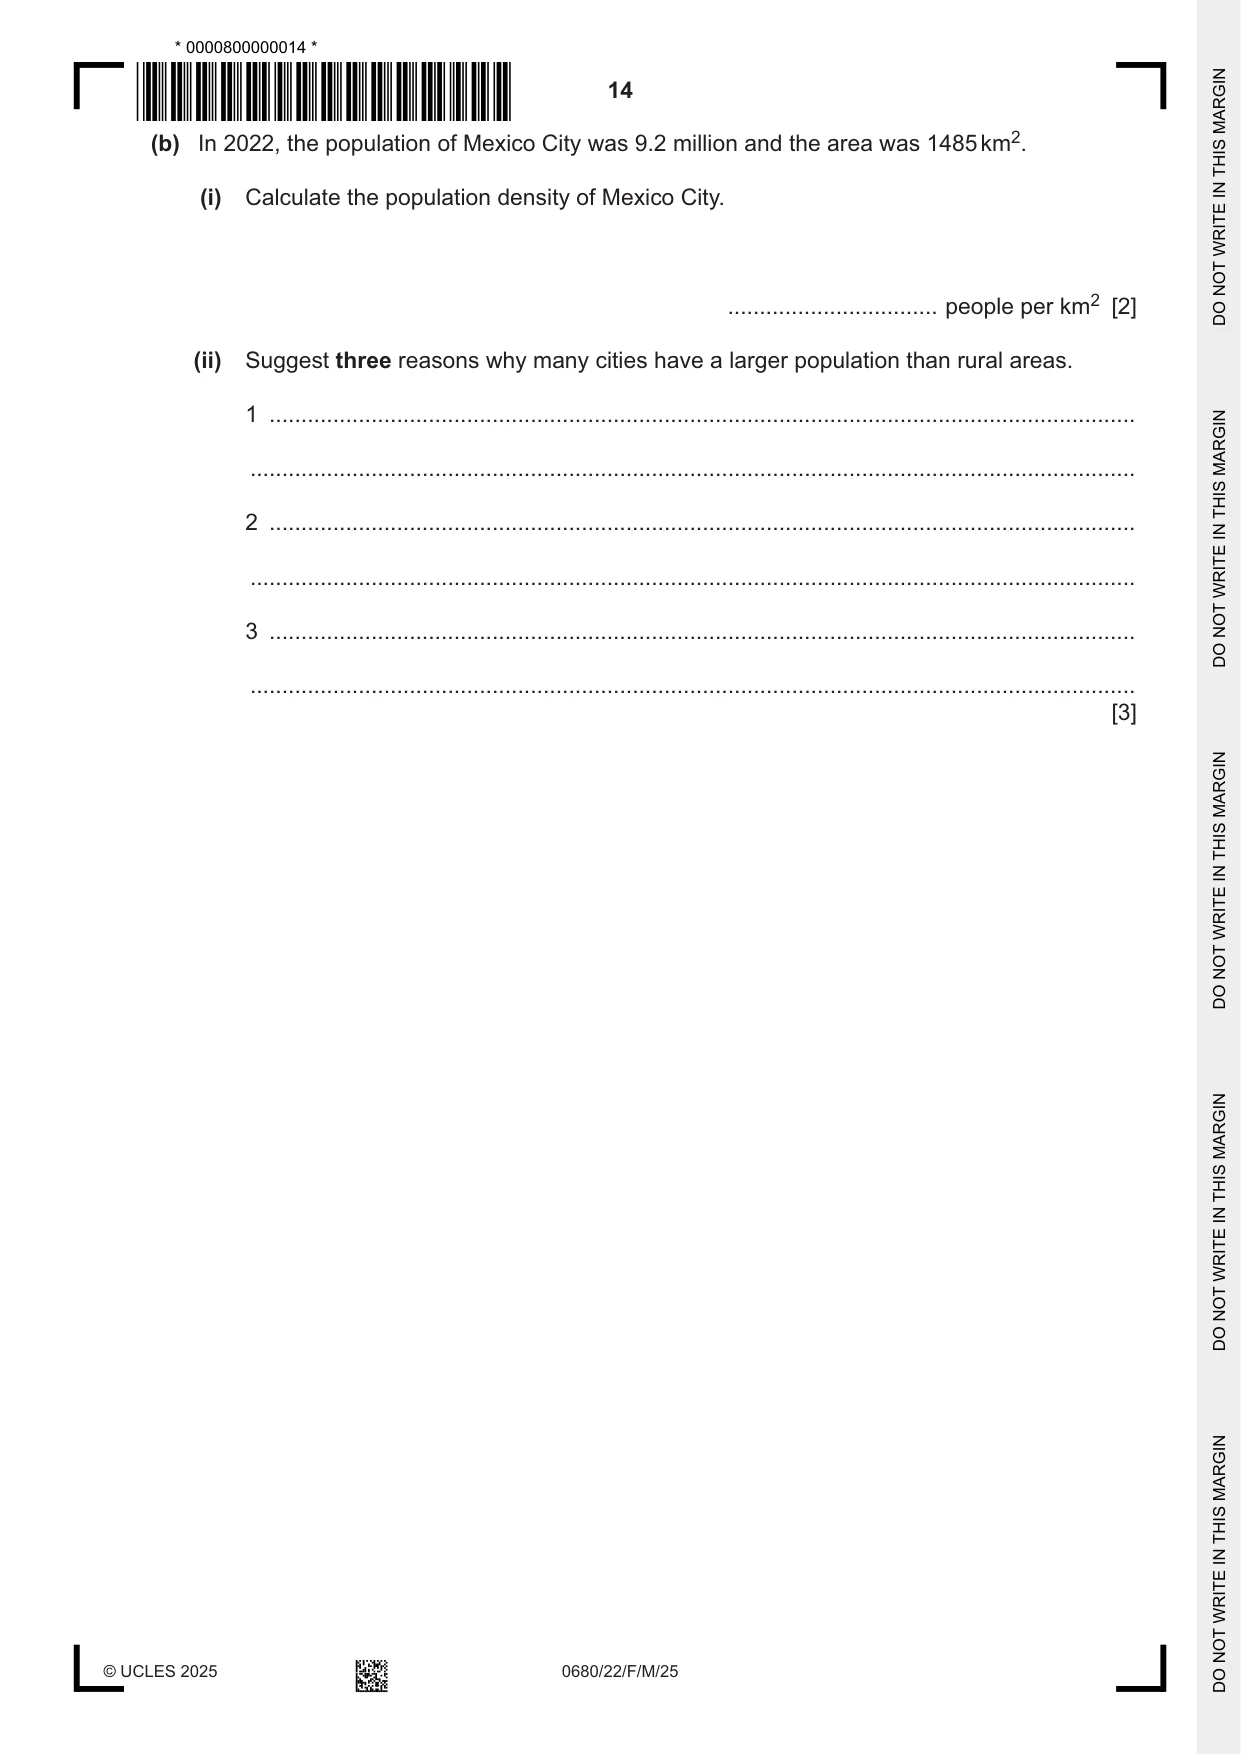
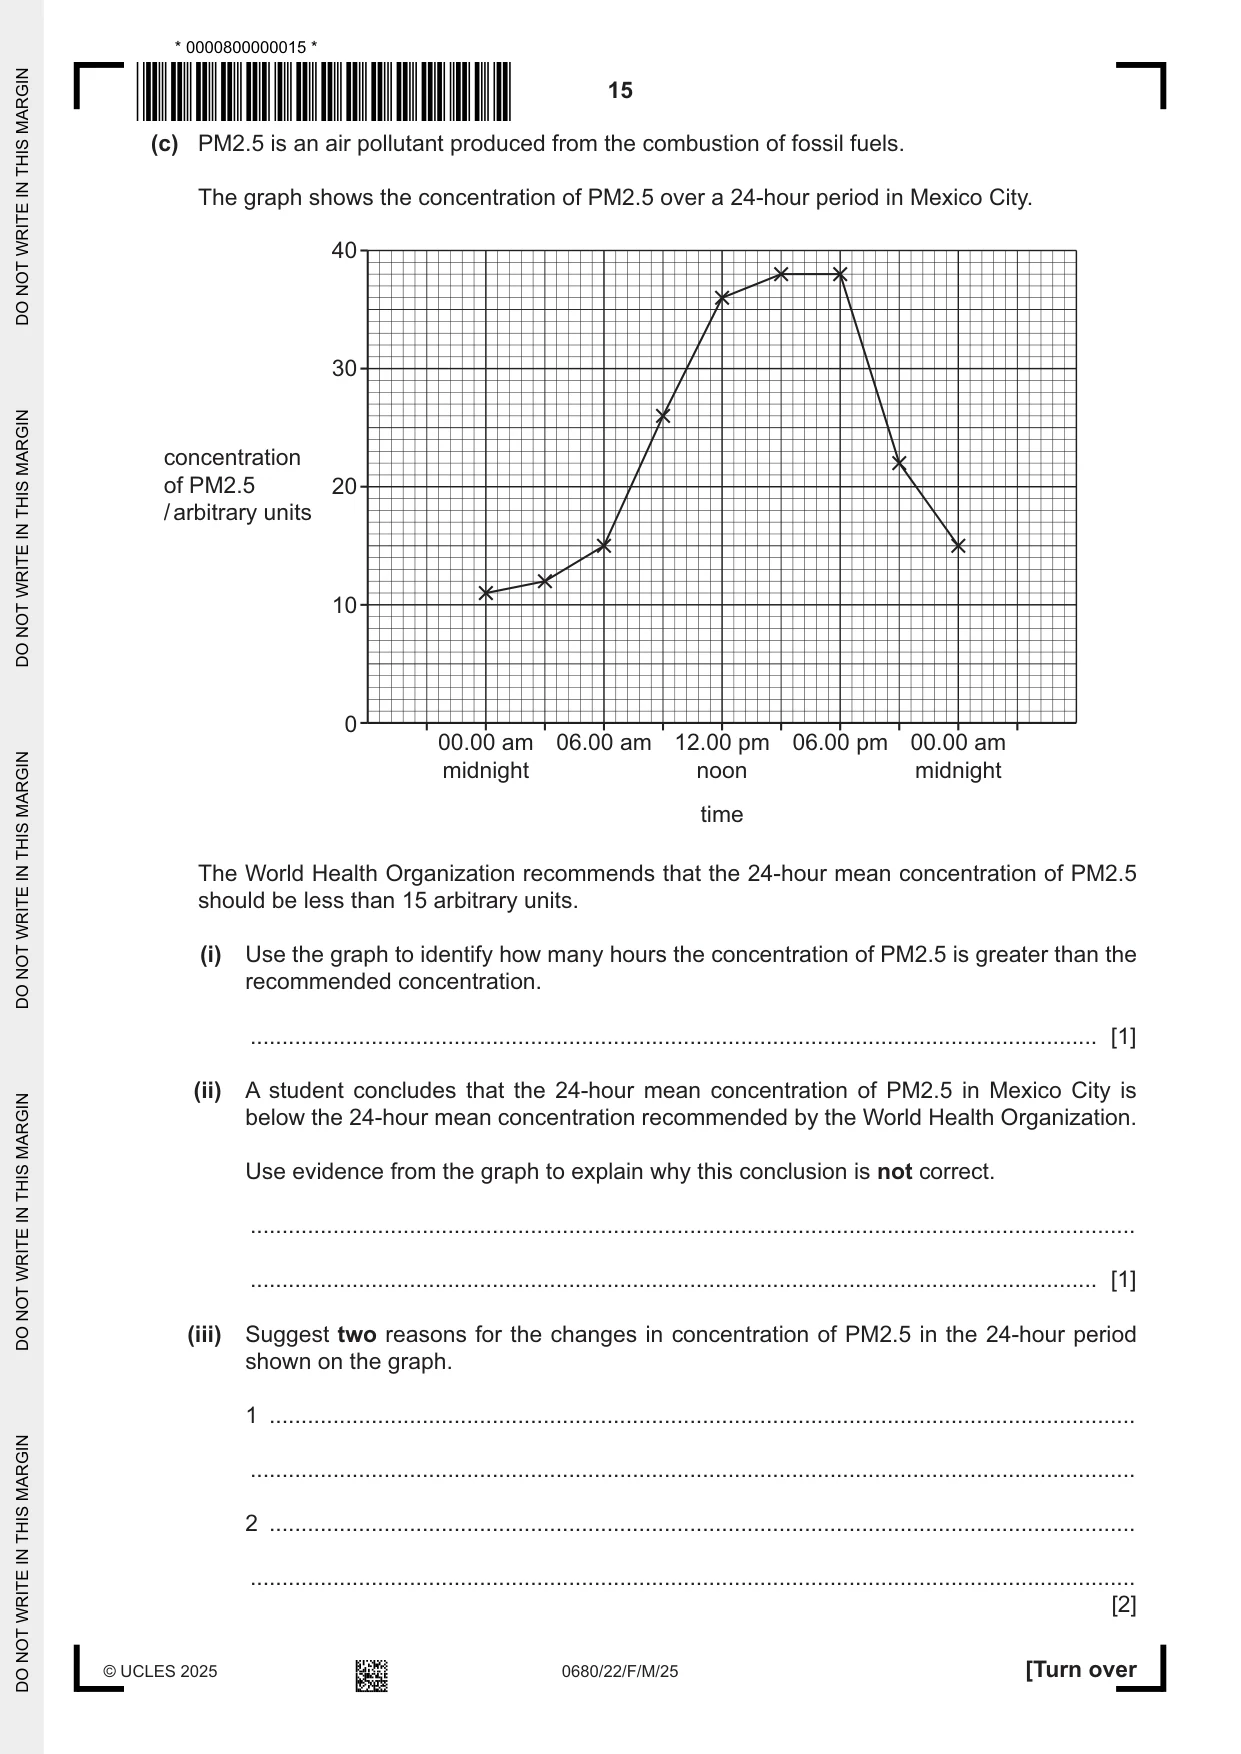
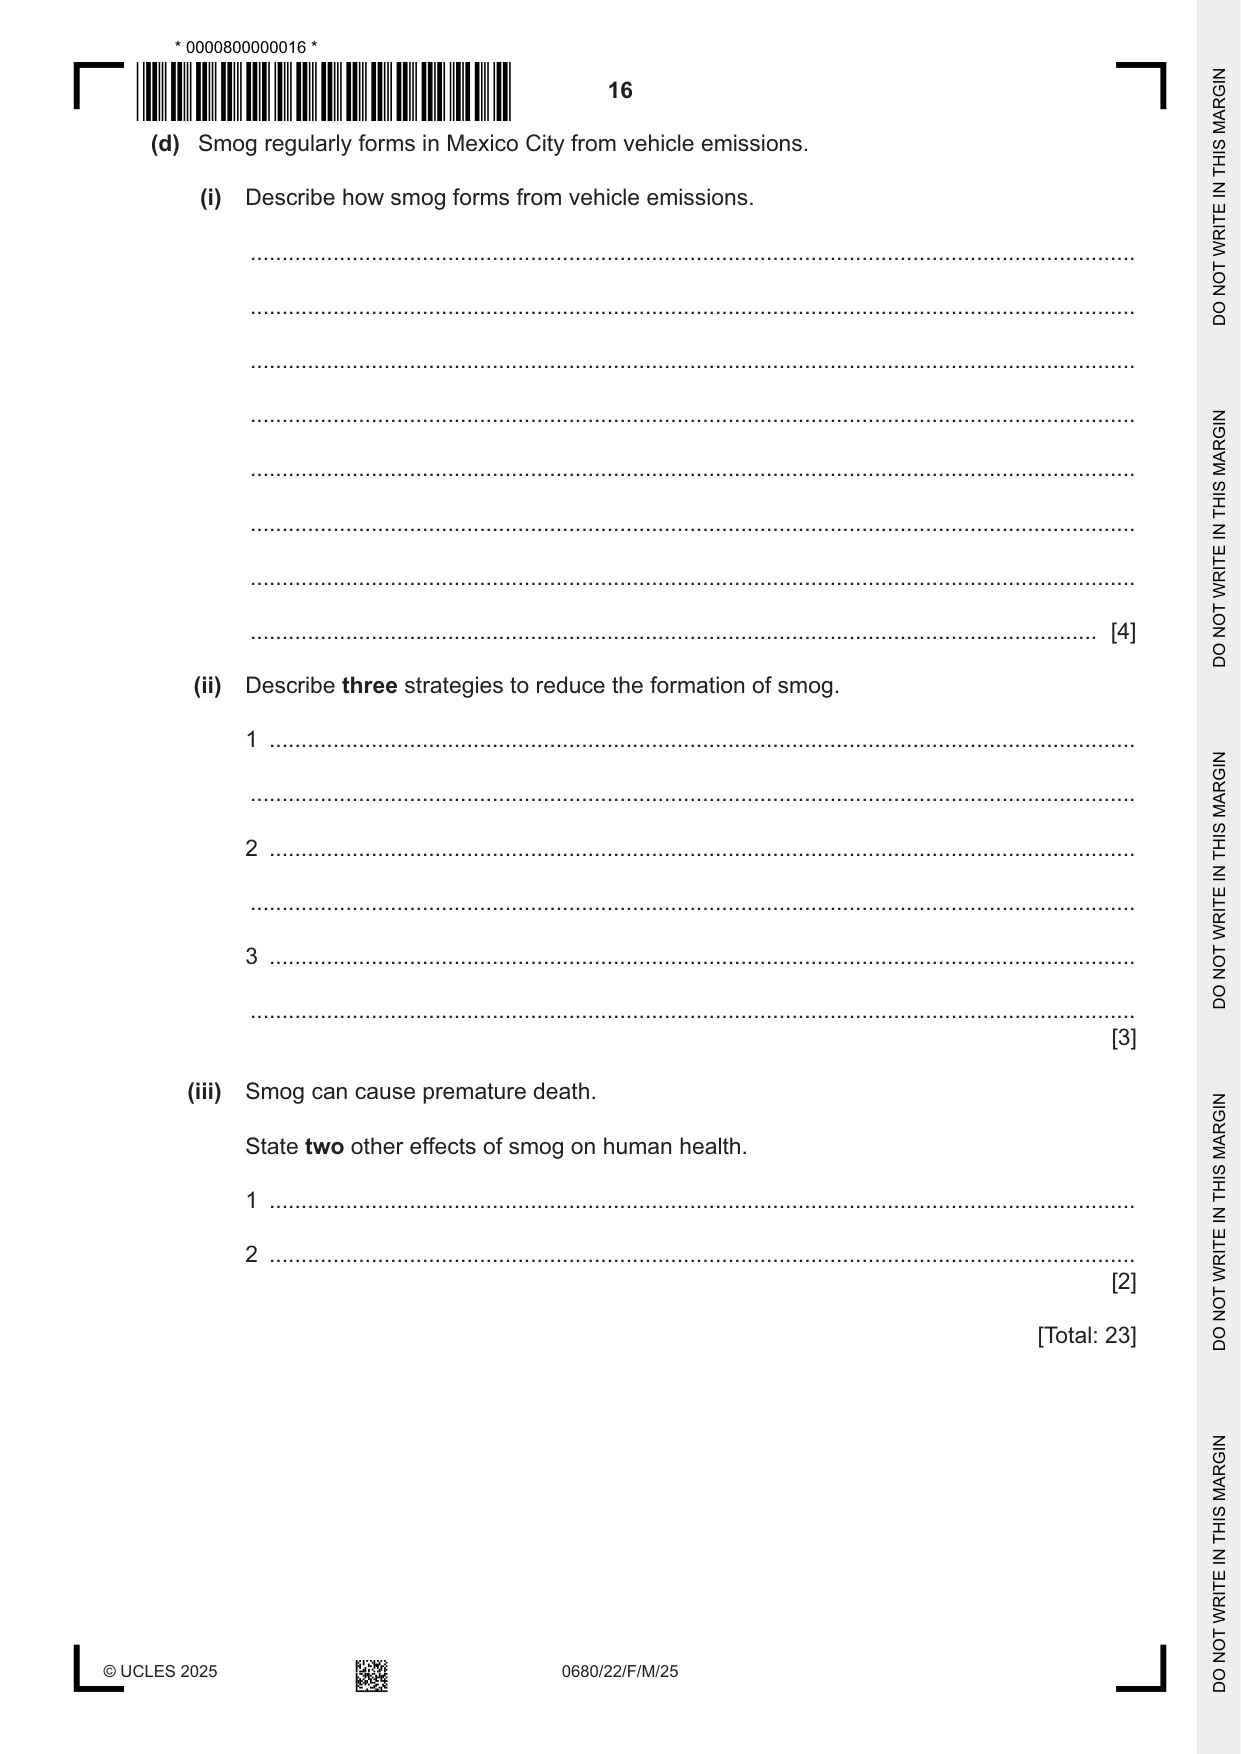
3 (a) (i) The table shows the population density of 5 countries. population density country / people per km2 Australia 3 China 150 Kenya 95 Mexico 66 USA 36 Plot a bar chart to show the population density for the 5 countries in the table. [4] (ii) Calculate how many times greater is the population density of Mexico compared to Australia. ..................................................................................................................................... [1] (b) In 2022, the population of Mexico City was 9.2 million and the area was 1485 km2. (i) Calculate the population density of Mexico City. ................................. people per km2 [2] (ii) Suggest three reasons why many cities have a larger population than rural areas. 1 ........................................................................................................................................ ........................................................................................................................................... 2 ........................................................................................................................................ ........................................................................................................................................... 3 ........................................................................................................................................ ........................................................................................................................................... [3] (c) PM2.5 is an air pollutant produced from the combustion of fossil fuels. The graph shows the concentration of PM2.5 over a 24-hour period in Mexico City. 40 30 concentration of PM2.5 20 / arbitrary units 10 0 00.00 am 06.00 am 12.00 pm 06.00 pm 00.00 am midnight noon midnight time The World Health Organization recommends that the 24-hour mean concentration of PM2.5 should be less than 15 arbitrary units. (i) Use the graph to identify how many hours the concentration of PM2.5 is greater than the recommended concentration. ..................................................................................................................................... [1] (ii) A student concludes that the 24-hour mean concentration of PM2.5 in Mexico City is below the 24-hour mean concentration recommended by the World Health Organization. Use evidence from the graph to explain why this conclusion is not correct. ........................................................................................................................................... ..................................................................................................................................... [1] (iii) Suggest two reasons for the changes in concentration of PM2.5 in the 24-hour period shown on the graph. 1 ........................................................................................................................................ ........................................................................................................................................... 2 ........................................................................................................................................ ........................................................................................................................................... [2] (d) Smog regularly forms in Mexico City from vehicle emissions. (i) Describe how smog forms from vehicle emissions. ........................................................................................................................................... ........................................................................................................................................... ........................................................................................................................................... ........................................................................................................................................... ........................................................................................................................................... ........................................................................................................................................... ........................................................................................................................................... ..................................................................................................................................... [4] (ii) Describe three strategies to reduce the formation of smog. 1 ........................................................................................................................................ ........................................................................................................................................... 2 ........................................................................................................................................ ........................................................................................................................................... 3 ........................................................................................................................................ ........................................................................................................................................... [3] (iii) Smog can cause premature death. State two other effects of smog on human health. 1 ........................................................................................................................................ 2 ........................................................................................................................................ [2] [Total: 23]
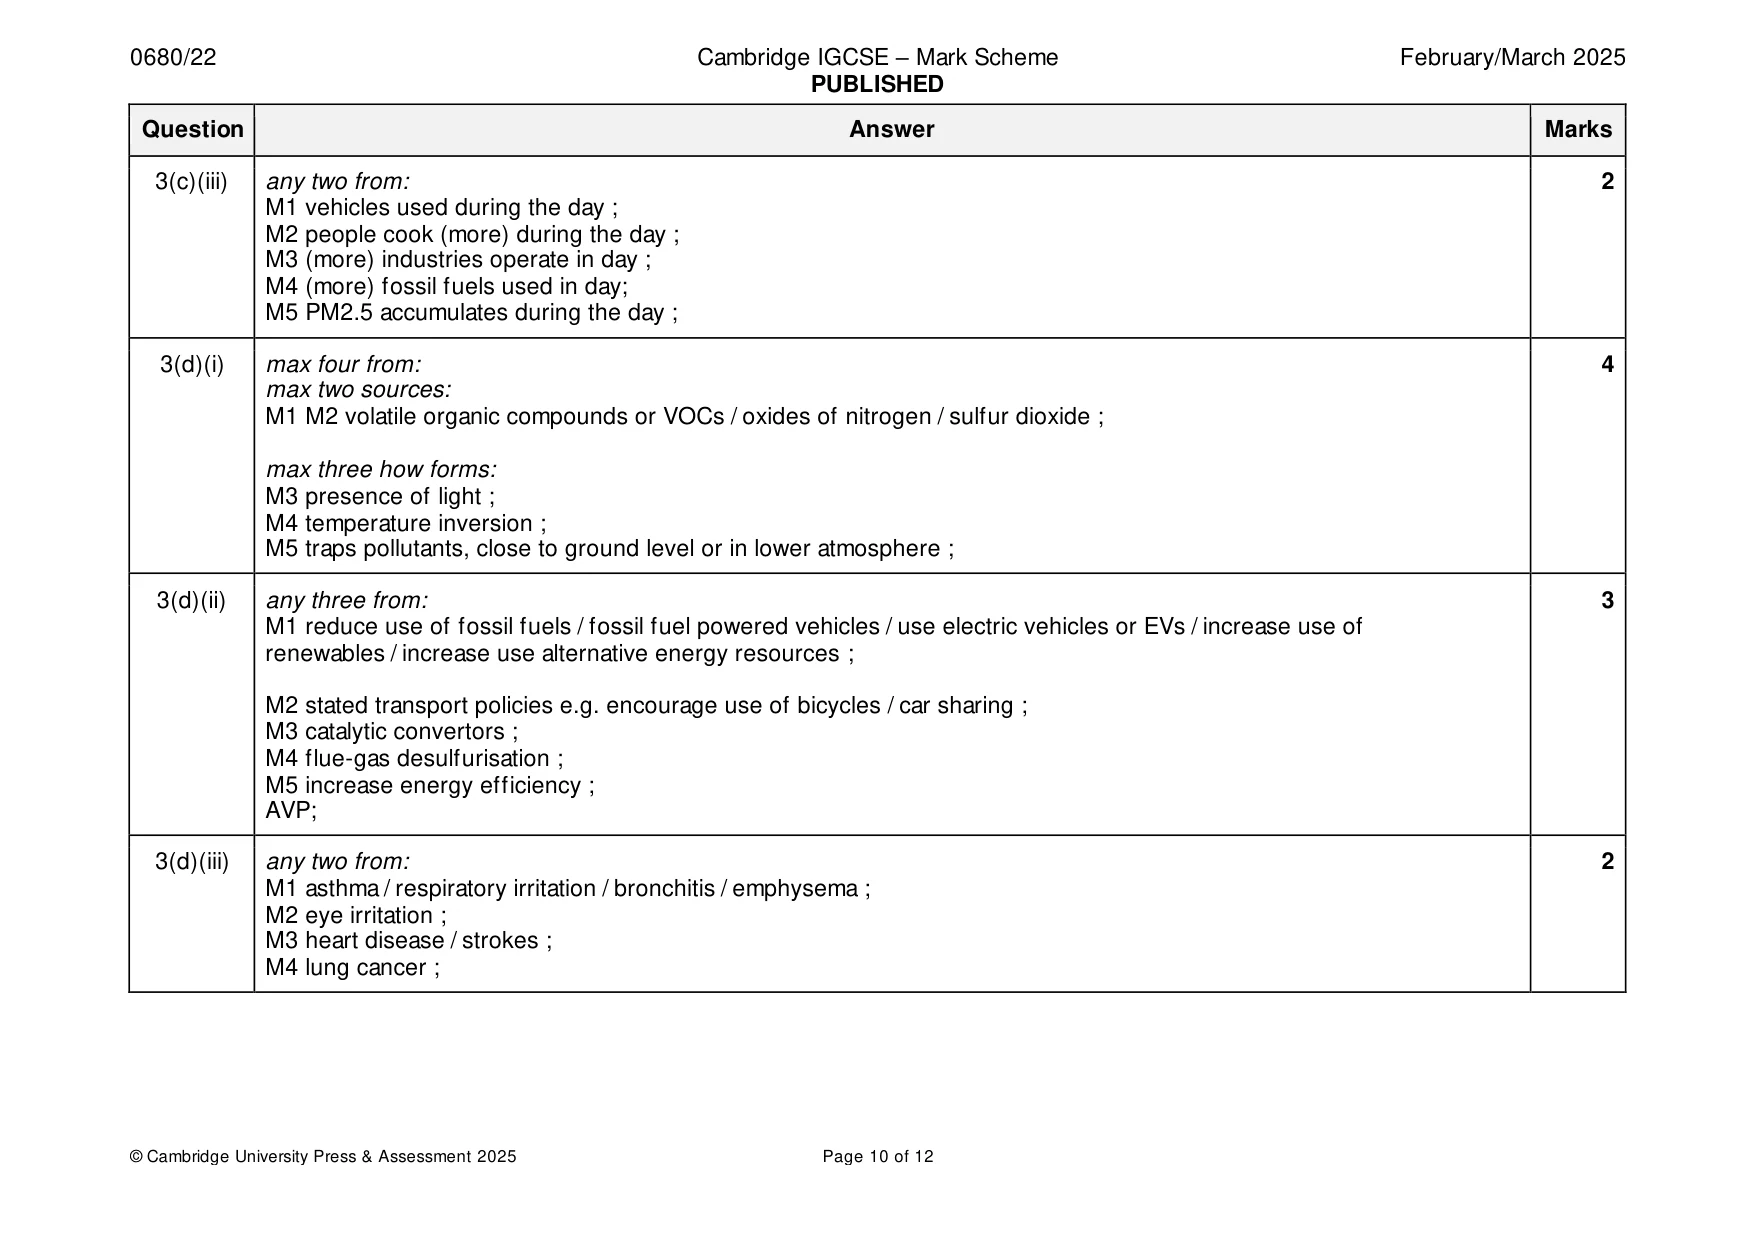
Mark scheme: 3(a)(i) bar graph with: 4 M1 axes labels and unit ; x-axis: country y-axis: population density / people per km2 M2 suitable linear scale so that data covers half the available space ; M3 correct plotting half a small square tolerance ; M4 bars of equal width ; 3(a)(ii) 22 ; 1 3(b)(i) M1 9 200 000 ÷ 1485 ; 2 M2 6195(.29) ; 3(b)(ii) any three from: 3 cities have: M1 job opportunities ; M2 wage potential ; M3 hospitals / healthcare ; M4 schools / education; M5 available housing ; M6 family links ; M7 infrastructure / transport / communications / electricity / water supply or water treatment / sanitation ; 3(c)(i) 18 (hours) ; 1 3(c)(ii) (more hours with) concentrations, above recommended value / above 15 ; 1 3(c)(iii) any two from: 2 M1 vehicles used during the day ; M2 people cook (more) during the day ; M3 (more) industries operate in day ; M4 (more) fossil fuels used in day; M5 PM2.5 accumulates during the day ; 3(d)(i) max four from: 4 max two sources: M1 M2 volatile organic compounds or VOCs / oxides of nitrogen / sulfur dioxide ; max three how forms: M3 presence of light ; M4 temperature inversion ; M5 traps pollutants, close to ground level or in lower atmosphere ; 3(d)(ii) any three from: 3 M1 reduce use of fossil fuels / fossil fuel powered vehicles / use electric vehicles or EVs / increase use of renewables / increase use alternative energy resources ; M2 stated transport policies e.g. encourage use of bicycles / car sharing ; M3 catalytic convertors ; M4 flue-gas desulfurisation ; M5 increase energy efficiency ; AVP; 3(d)(iii) any two from: 2 M1 asthma / respiratory irritation / bronchitis / emphysema ; M2 eye irritation ; M3 heart disease / strokes ; M4 lung cancer ;
Q4 · The drawing shows a white nun orchid
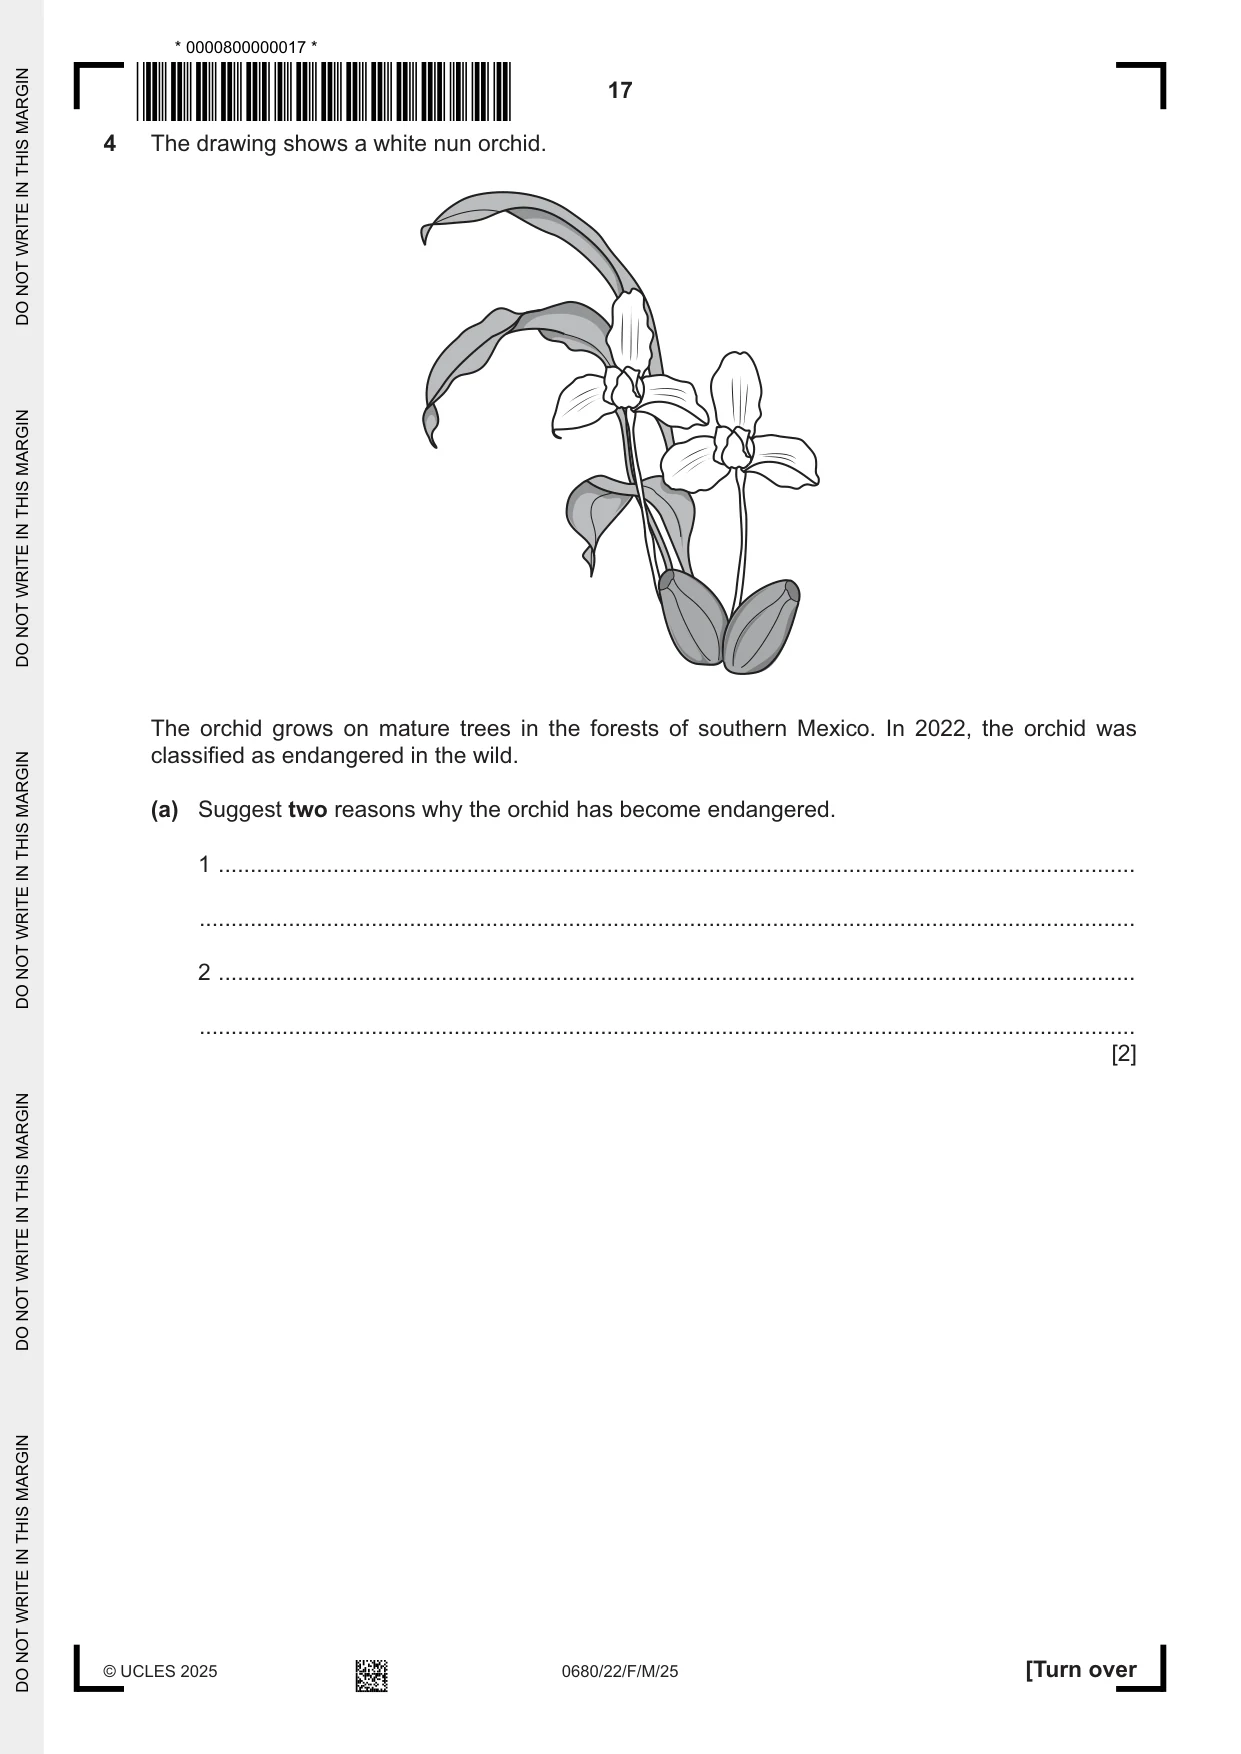
4 The drawing shows a white nun orchid. The orchid grows on mature trees in the forests of southern Mexico. In 2022, the orchid was classified as endangered in the wild. (a) Suggest two reasons why the orchid has become endangered. 1 ................................................................................................................................................ ................................................................................................................................................... 2 ................................................................................................................................................ ................................................................................................................................................... [2] (b) A scientist investigates the population of white nun orchids in a 1000 km2 area of forest, using a systematic sampling technique. (i) Describe how the scientist: • uses systematic sampling • collects the data using a transect • records the data collected • obtains an estimate for the population of orchids in the forest. ........................................................................................................................................... ........................................................................................................................................... ........................................................................................................................................... ........................................................................................................................................... ........................................................................................................................................... ........................................................................................................................................... ........................................................................................................................................... ........................................................................................................................................... ........................................................................................................................................... ..................................................................................................................................... [4] (ii) Suggest two limitations of sampling white nun orchids in a 1000 km2 forest using a transect. 1 ........................................................................................................................................ ........................................................................................................................................... 2 ........................................................................................................................................ ........................................................................................................................................... [2] (c) Seeds from the white nun orchid have been stored in seed banks. (i) Explain why seeds are stored in seed banks. ........................................................................................................................................... ........................................................................................................................................... ........................................................................................................................................... ..................................................................................................................................... [2] (ii) State three limitations of seed banks. 1 ........................................................................................................................................ ........................................................................................................................................... 2 ........................................................................................................................................ ........................................................................................................................................... 3 ........................................................................................................................................ ........................................................................................................................................... [3] [Total: 13]
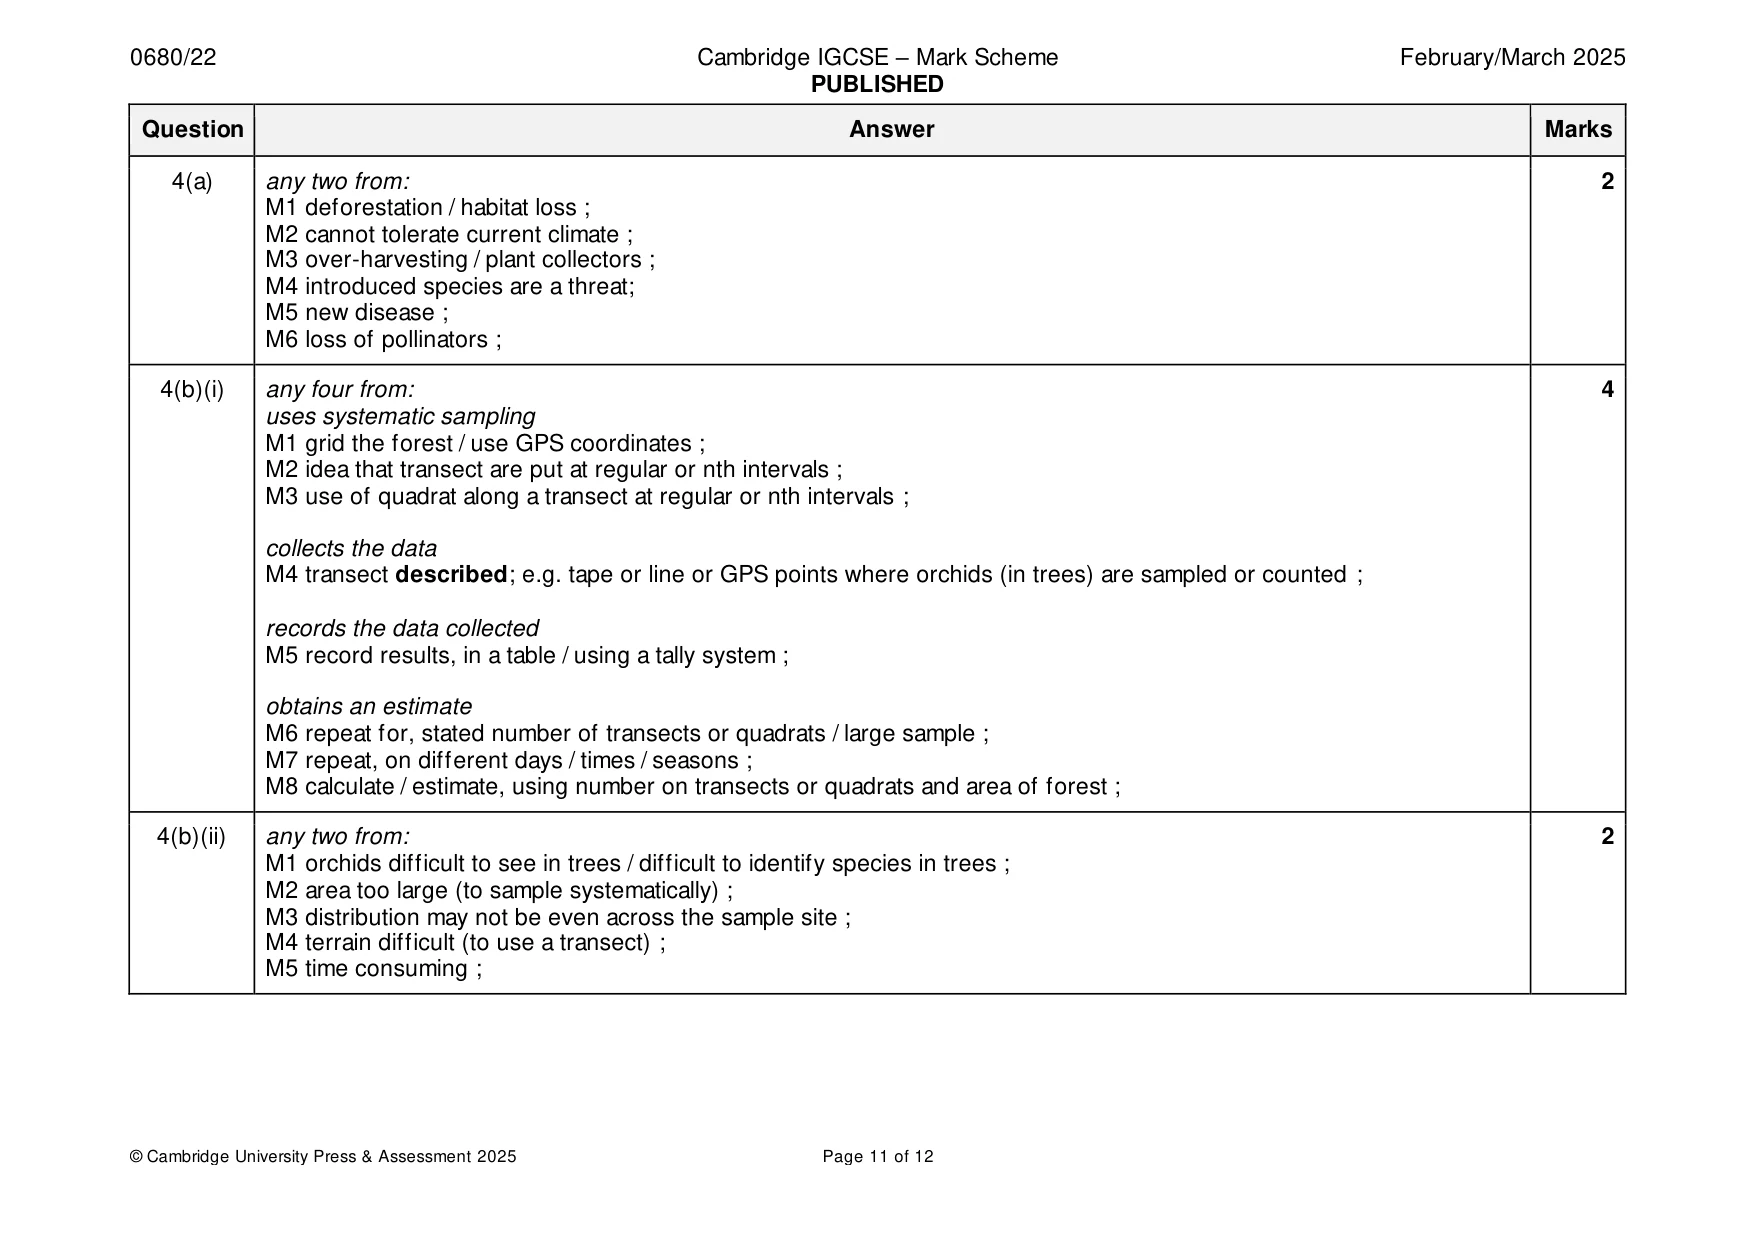
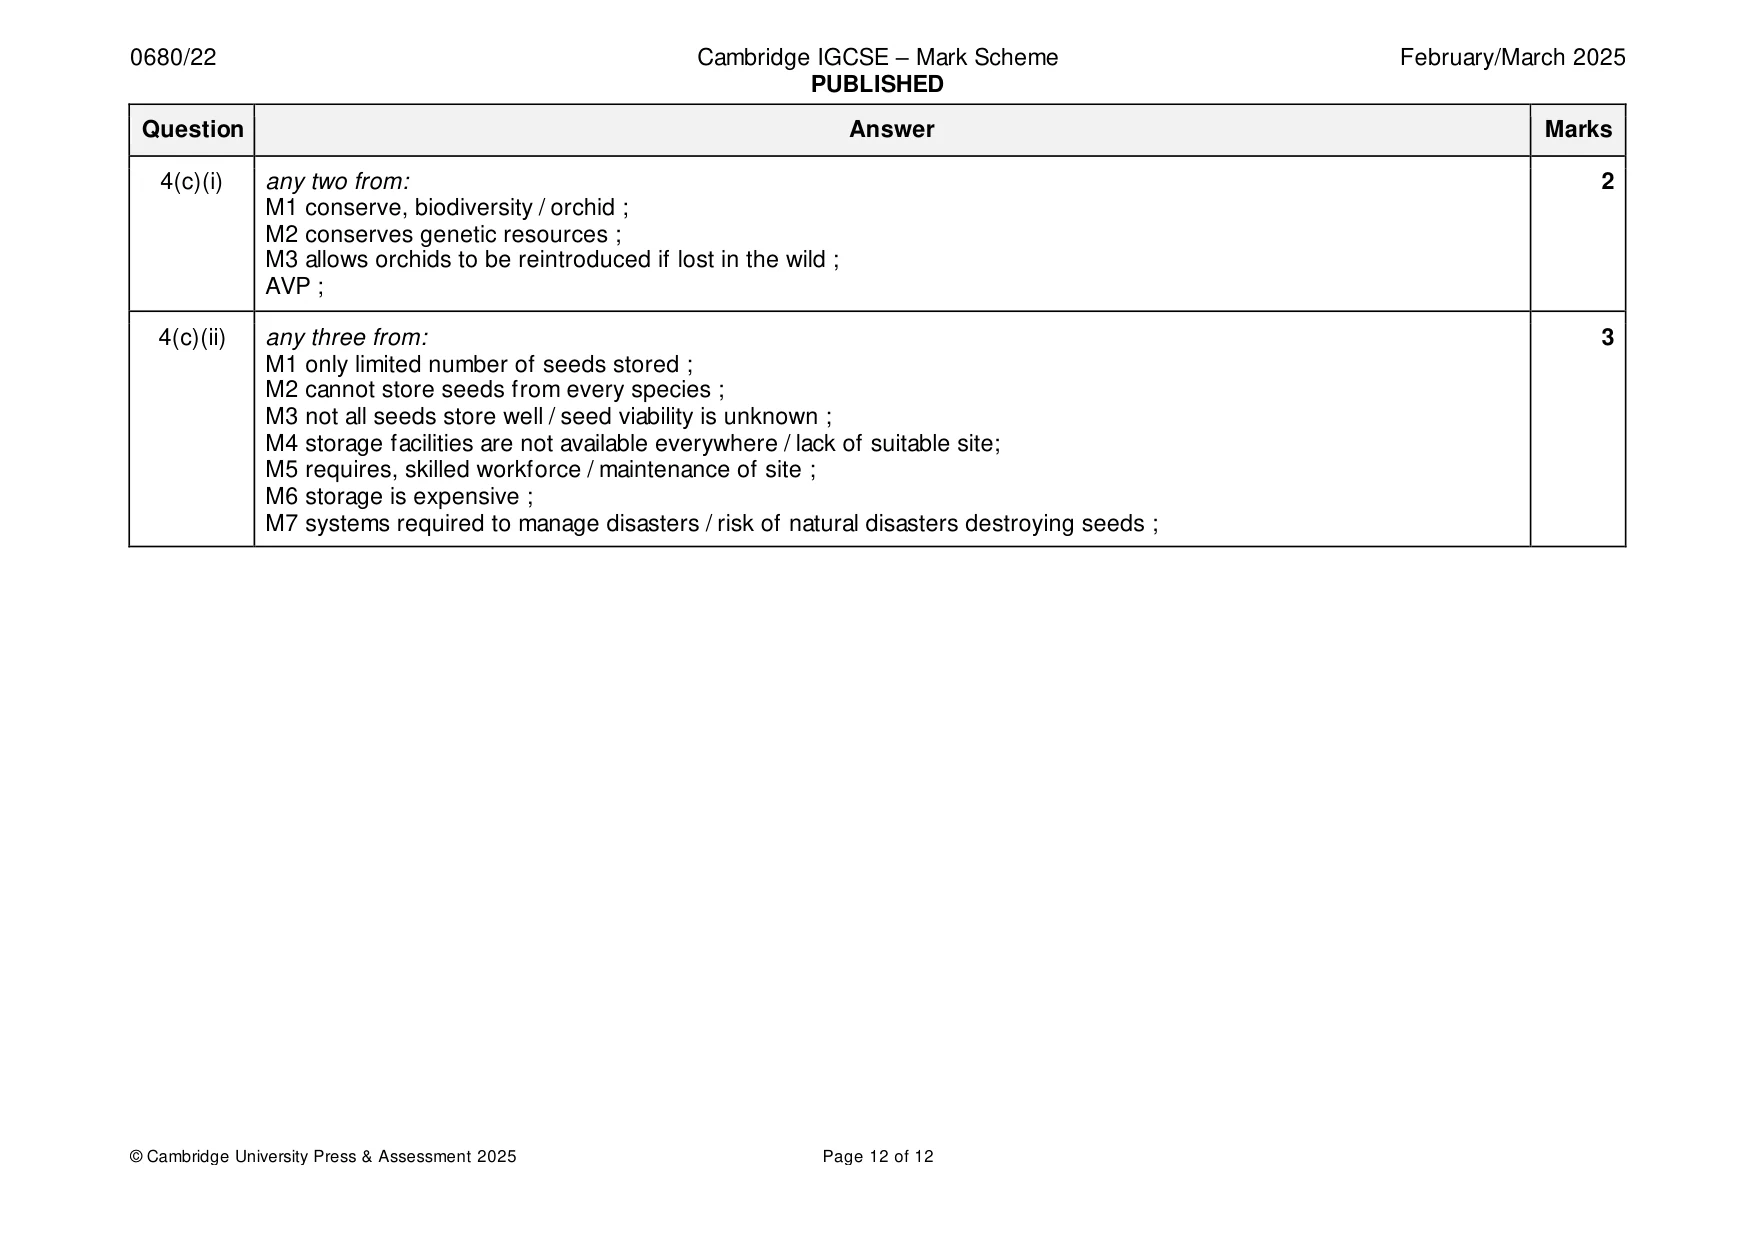
Mark scheme: 4(a) any two from: 2 M1 deforestation / habitat loss ; M2 cannot tolerate current climate ; M3 over-harvesting / plant collectors ; M4 introduced species are a threat; M5 new disease ; M6 loss of pollinators ; 4(b)(i) any four from: 4 uses systematic sampling M1 grid the forest / use GPS coordinates ; M2 idea that transect are put at regular or nth intervals ; M3 use of quadrat along a transect at regular or nth intervals ; collects the data M4 transect described; e.g. tape or line or GPS points where orchids (in trees) are sampled or counted ; records the data collected M5 record results, in a table / using a tally system ; obtains an estimate M6 repeat for, stated number of transects or quadrats / large sample ; M7 repeat, on different days / times / seasons ; M8 calculate / estimate, using number on transects or quadrats and area of forest ; 4(b)(ii) any two from: 2 M1 orchids difficult to see in trees / difficult to identify species in trees ; M2 area too large (to sample systematically) ; M3 distribution may not be even across the sample site ; M4 terrain difficult (to use a transect) ; M5 time consuming ; 4(c)(i) any two from: 2 M1 conserve, biodiversity / orchid ; M2 conserves genetic resources ; M3 allows orchids to be reintroduced if lost in the wild ; AVP ; 4(c)(ii) any three from: 3 M1 only limited number of seeds stored ; M2 cannot store seeds from every species ; M3 not all seeds store well / seed viability is unknown ; M4 storage facilities are not available everywhere / lack of suitable site; M5 requires, skilled workforce / maintenance of site ; M6 storage is expensive ; M7 systems required to manage disasters / risk of natural disasters destroying seeds ;
What was in this paper
The subtopics covered by these 4 questions, and how many questions each got. Open one in a new tab to see every Cambridge question on it.
What you needed in this session
Cambridge’s own grade thresholds for 2025 Feb/March, Paper 2 · Variant 2. A higher threshold means an easier paper — the bar moves with how the cohort did.