Cambridge IGCSE Environmental Management 0680 — 2021 Oct/Nov Paper 2 · Variant 2
0680/22/O/N/21 · 3 questions · 80 marks · ≈90 min
The question paper and its mark scheme, free to read here and free to download. This is Cambridge’s own paper, exactly as it was sat.
Question paper24 pages
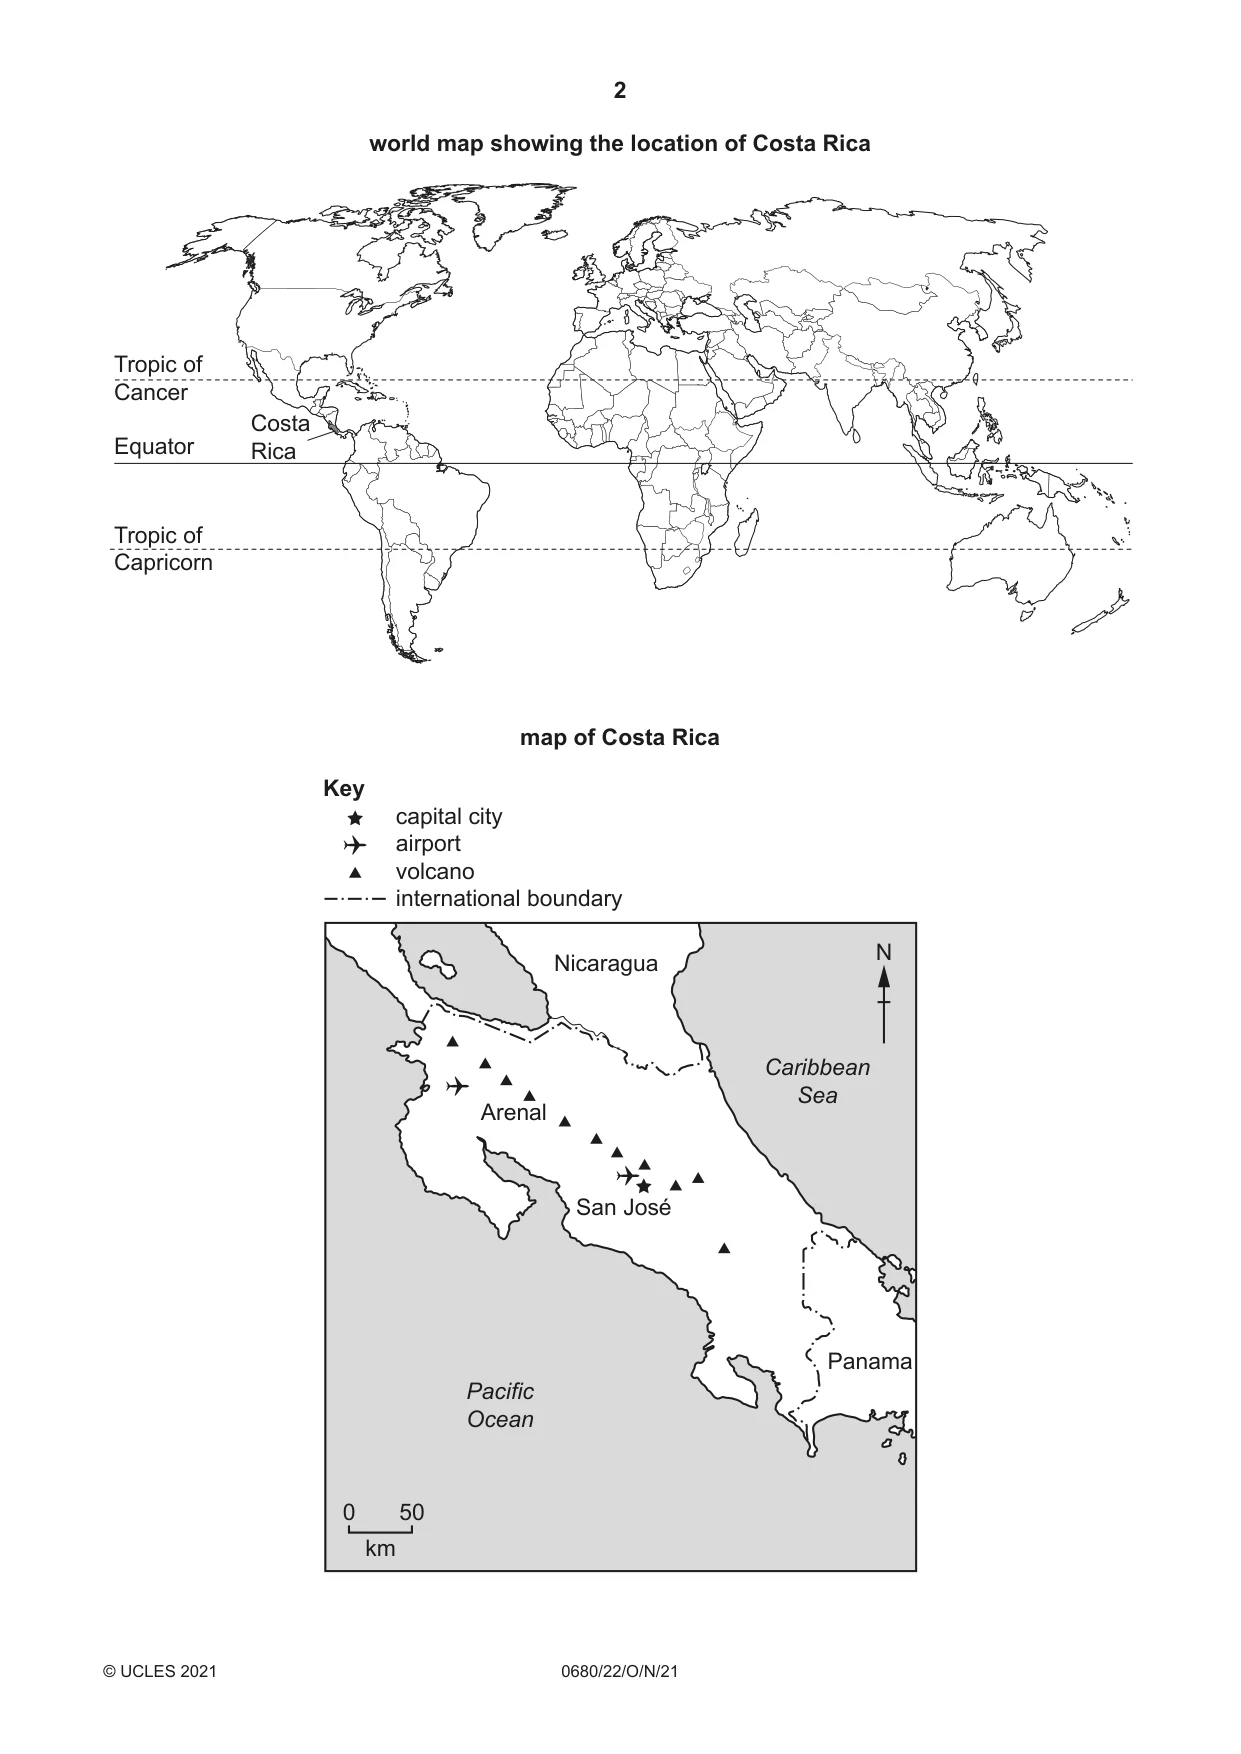
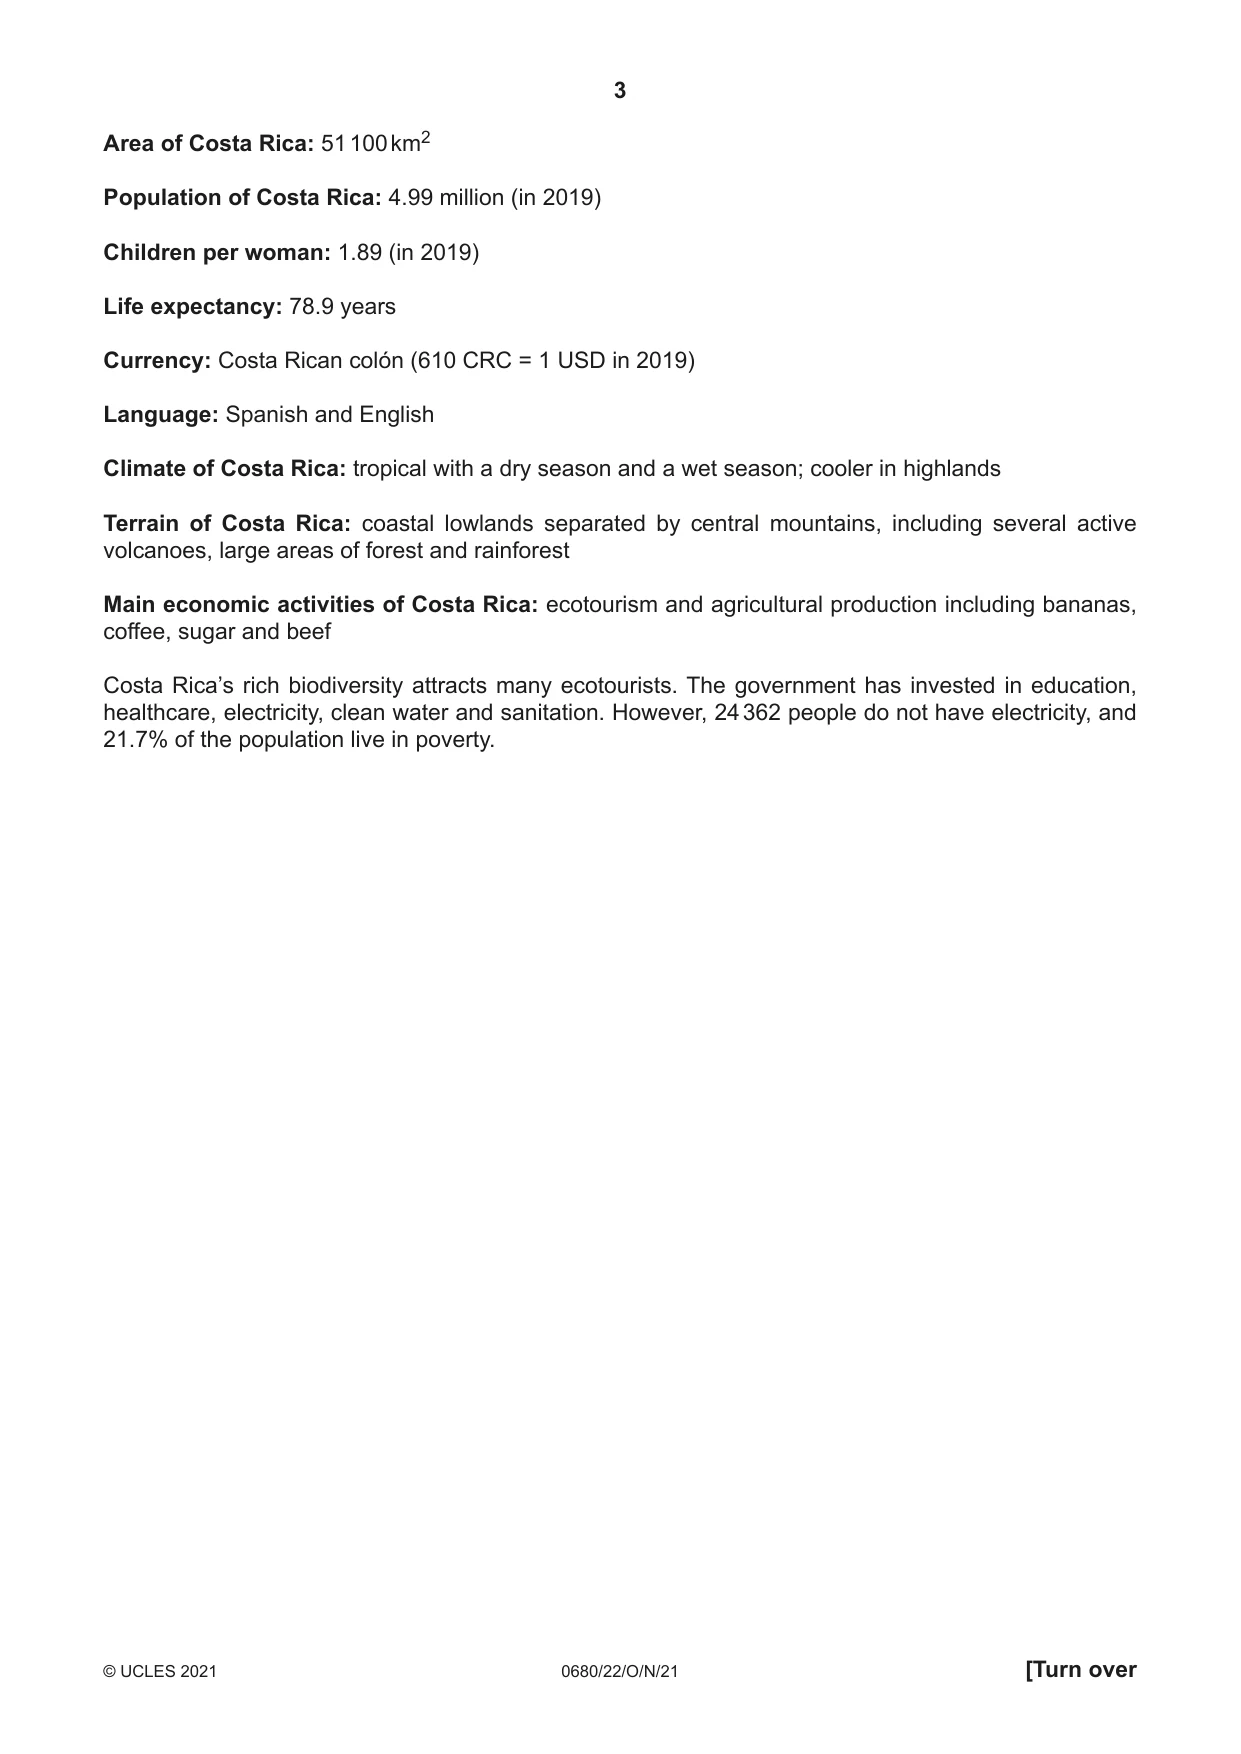









Mark scheme14 pages
Answers below. Sit the paper first if you are practising.
Questions as text
Q1 · The graph shows the percentage of the population of Costa Rica living in urban areas…
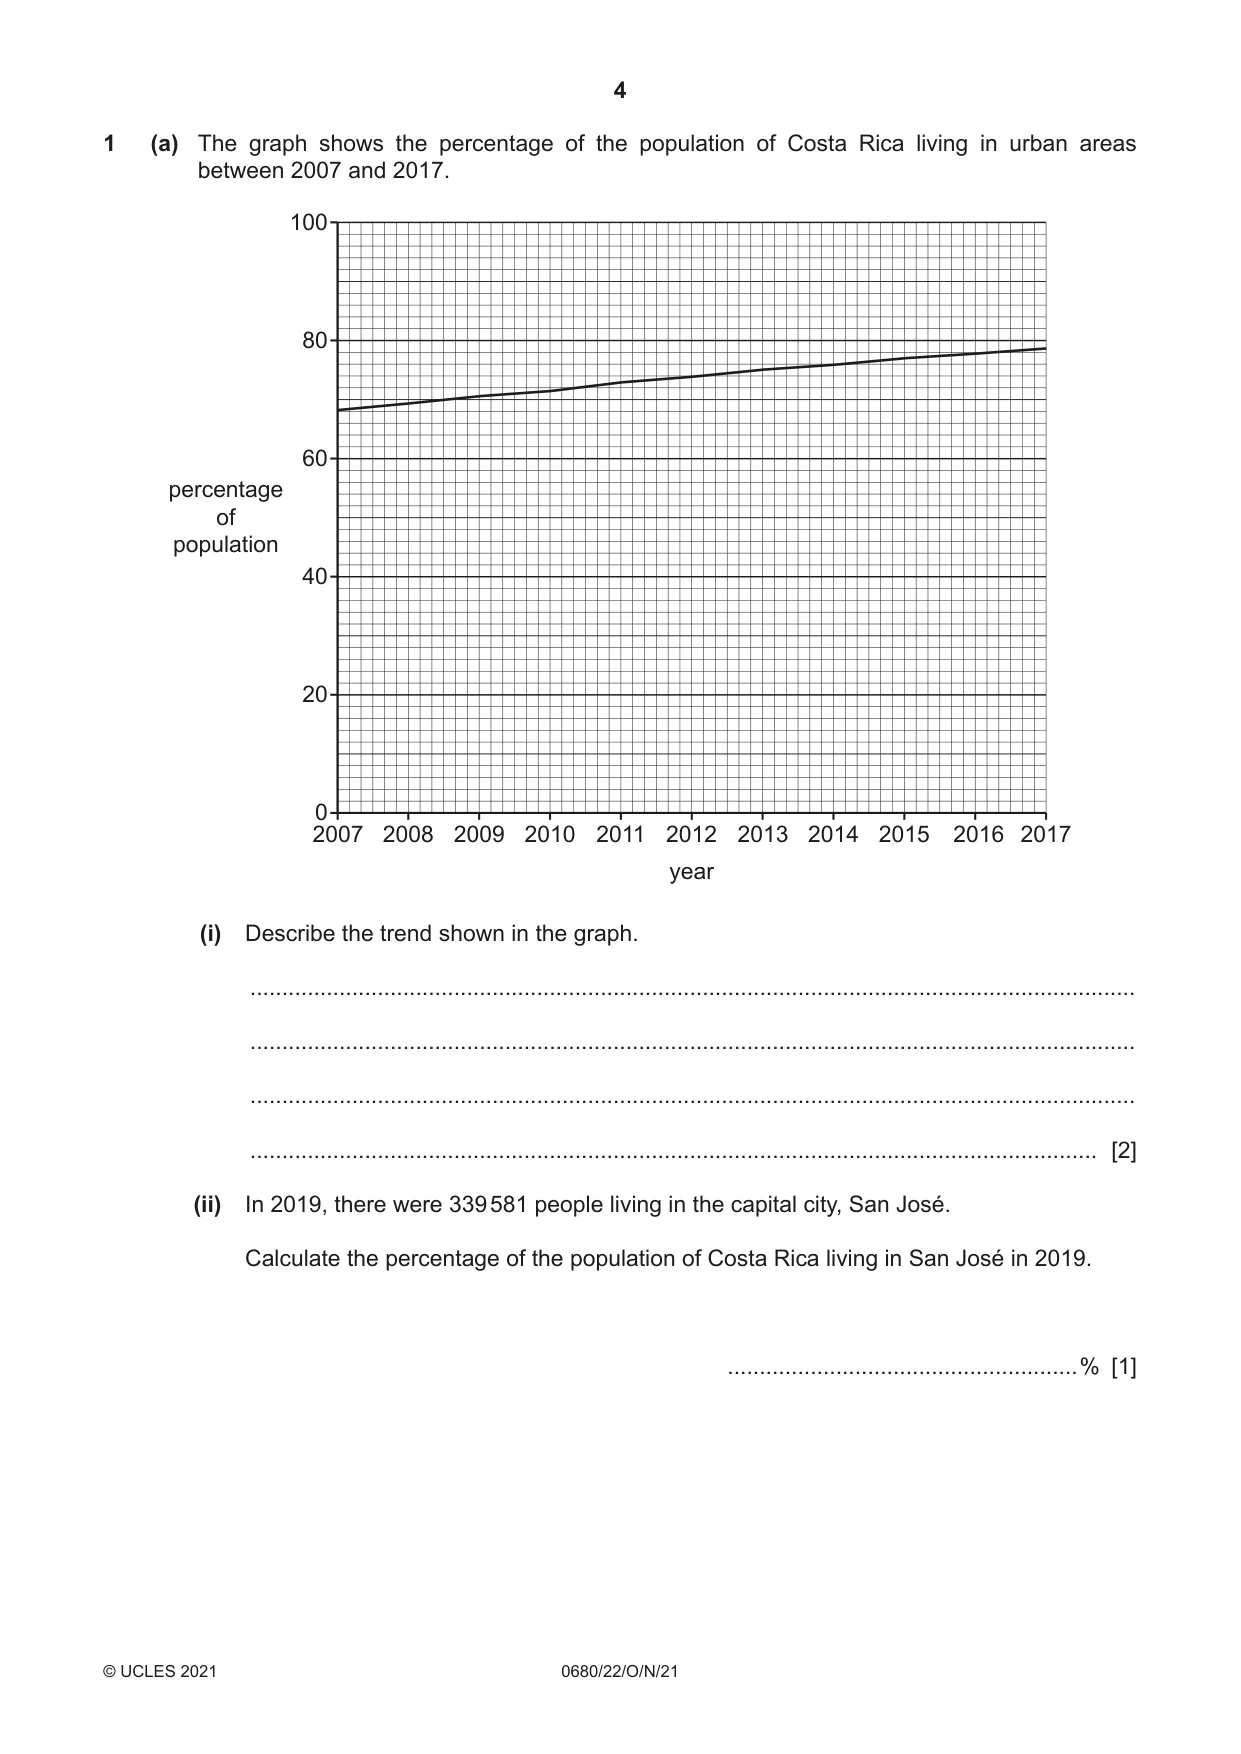
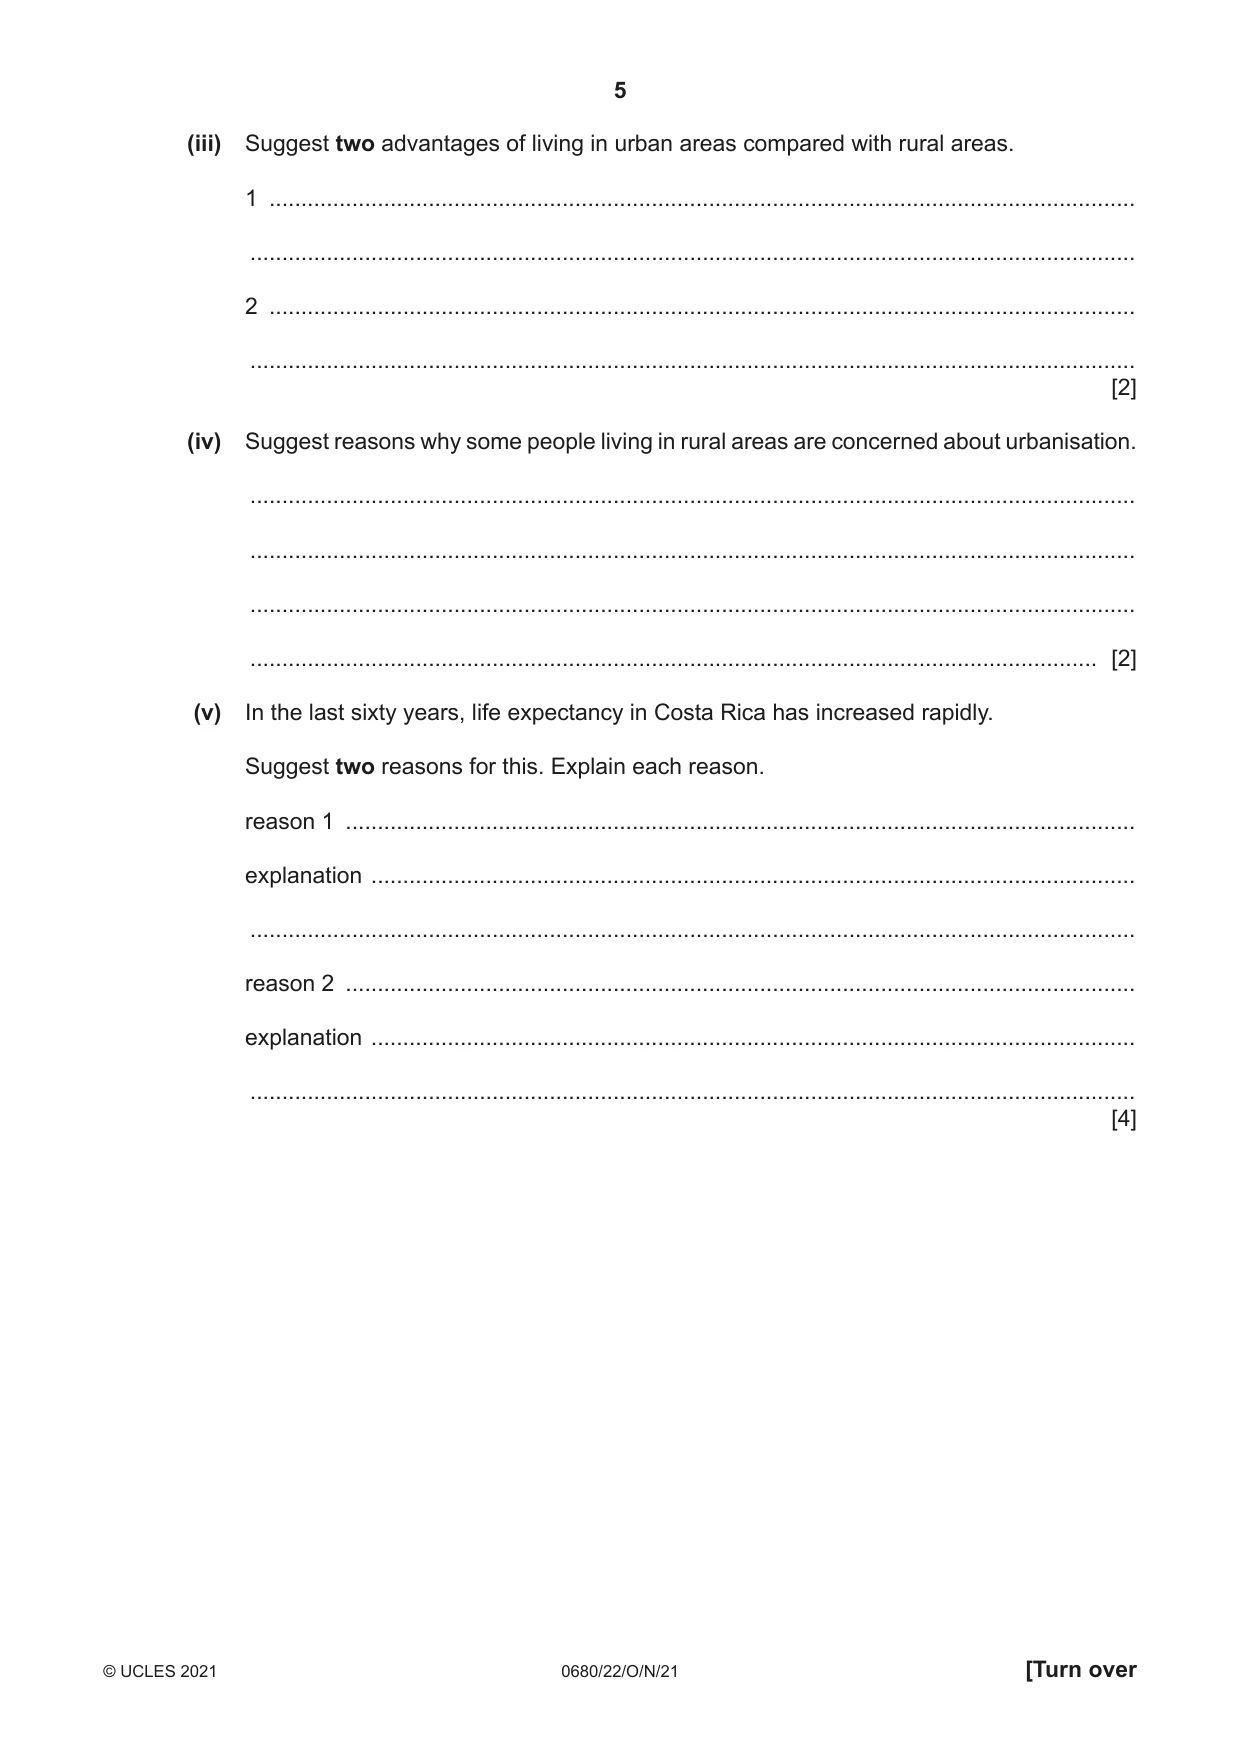
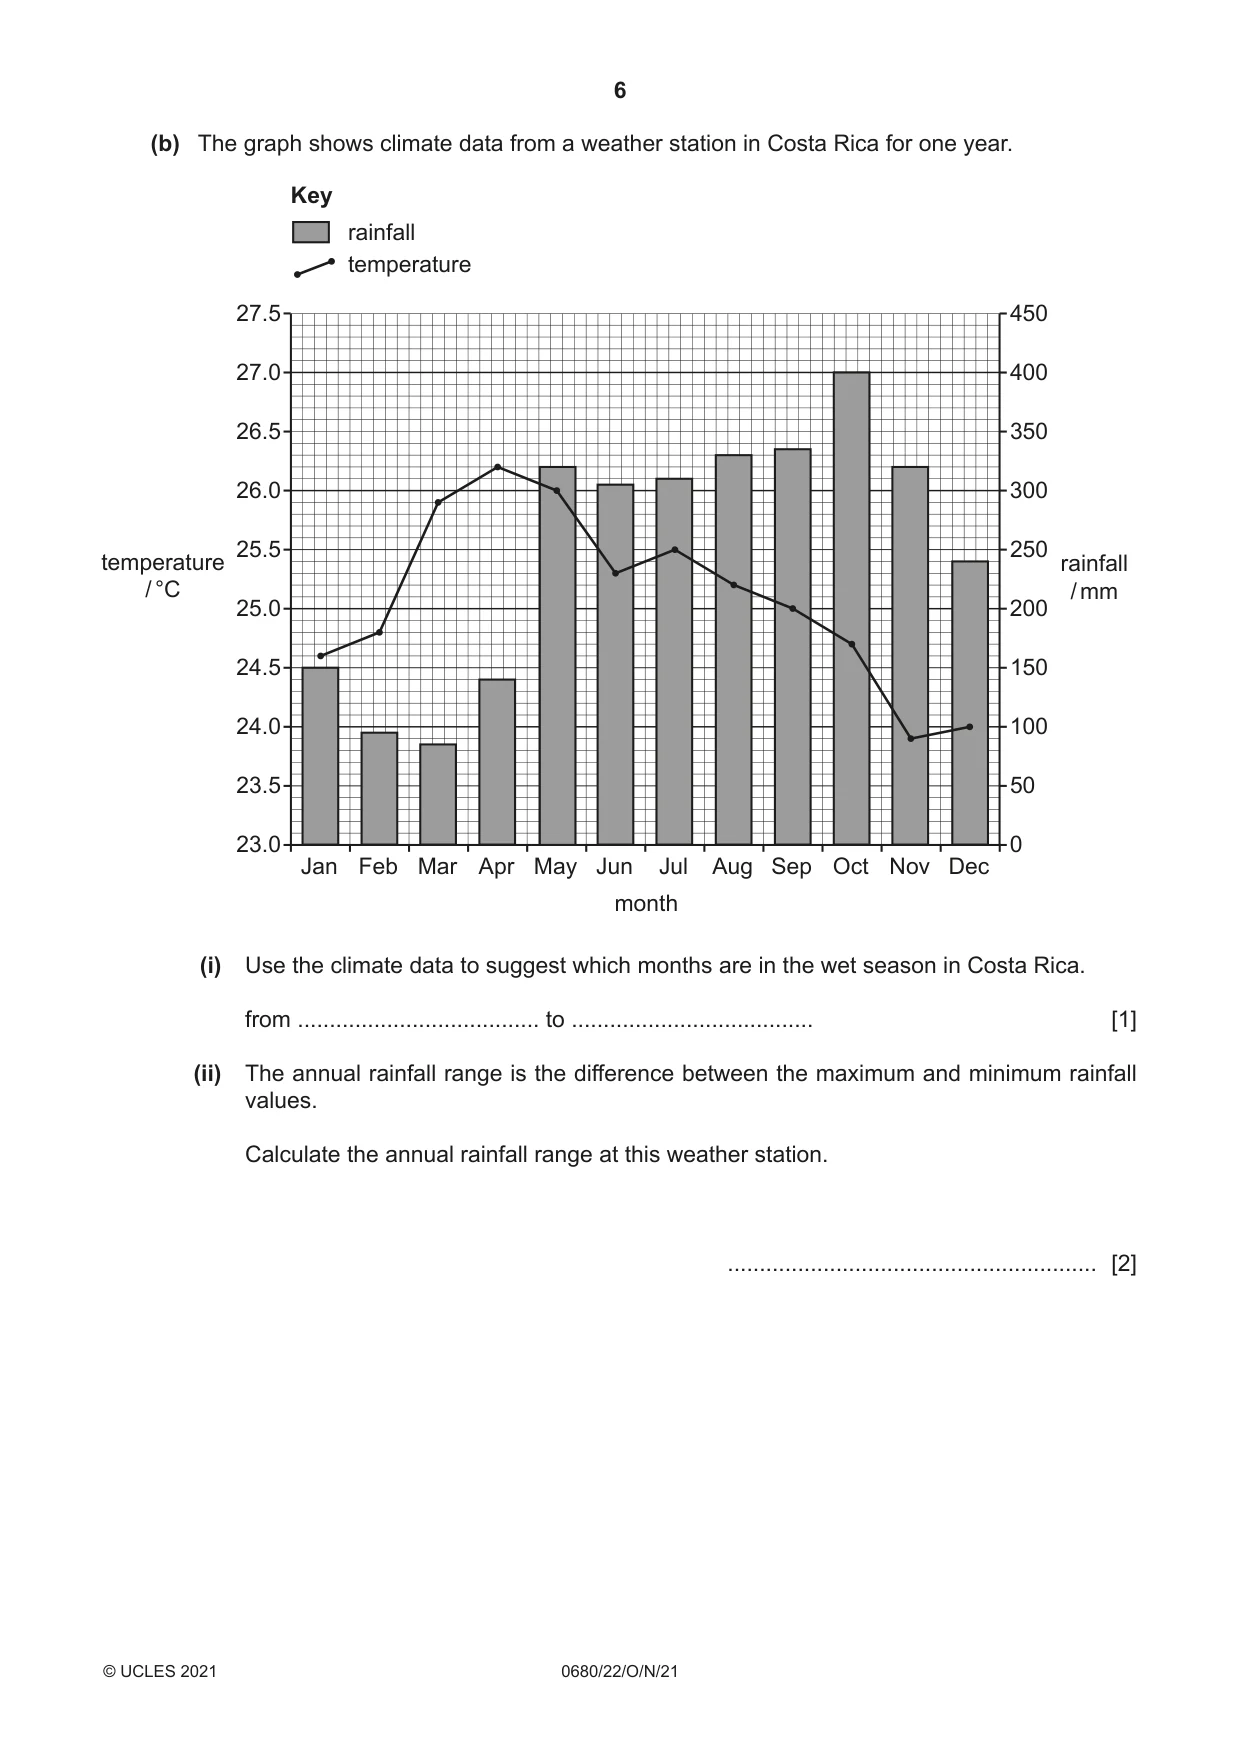
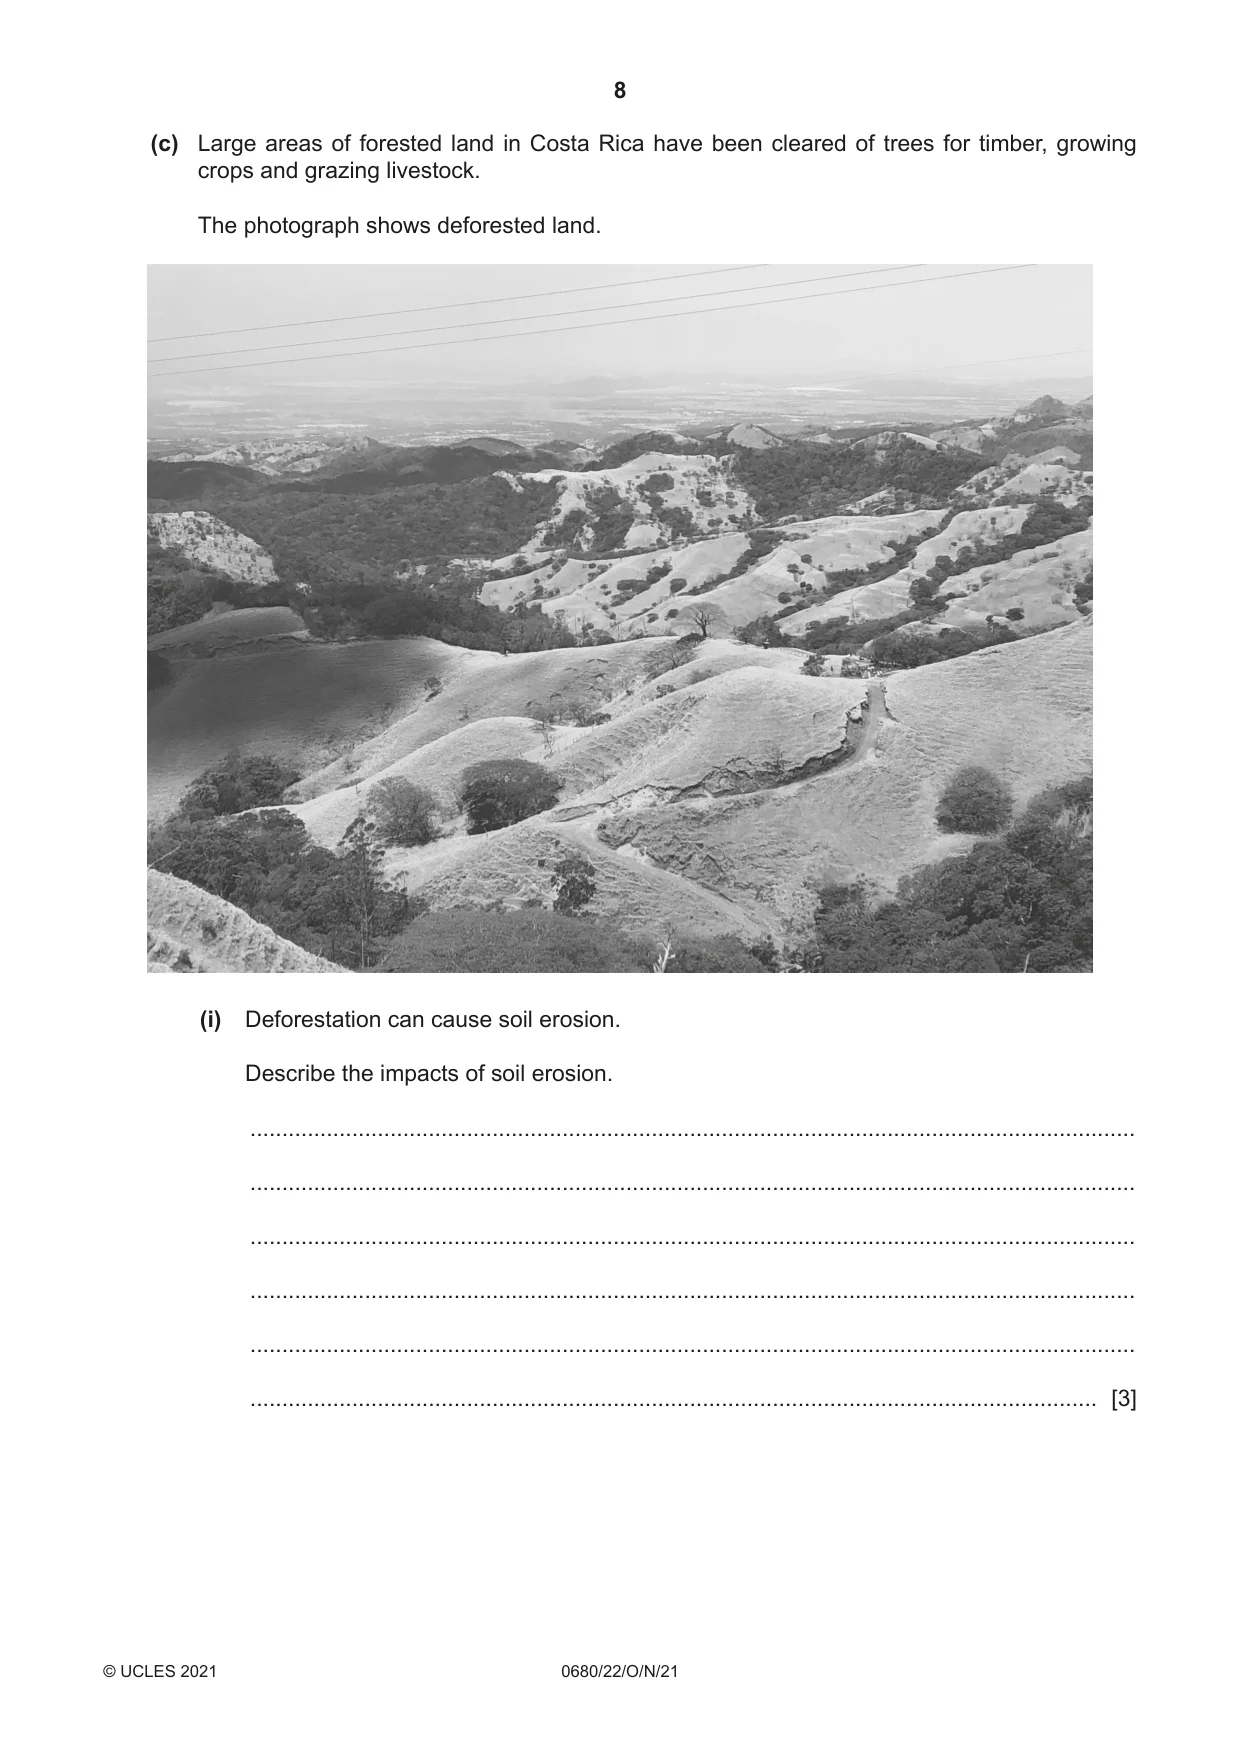
1 (a) The graph shows the percentage of the population of Costa Rica living in urban areas between 2007 and 2017. 100 80 60 percentage of population 40 20 0 2007 2008 2009 2010 2011 2012 2013 2014 2015 2016 2017 year (i) Describe the trend shown in the graph. ........................................................................................................................................... ........................................................................................................................................... ........................................................................................................................................... ..................................................................................................................................... [2] (ii) In 2019, there were 339 581 people living in the capital city, San José. Calculate the percentage of the population of Costa Rica living in San José in 2019. .......................................................% [1] (iii) Suggest two advantages of living in urban areas compared with rural areas. 1 ........................................................................................................................................ ........................................................................................................................................... 2 ........................................................................................................................................ ........................................................................................................................................... [2] (iv) Suggest reasons why some people living in rural areas are concerned about urbanisation. ........................................................................................................................................... ........................................................................................................................................... ........................................................................................................................................... ..................................................................................................................................... [2] (v) In the last sixty years, life expectancy in Costa Rica has increased rapidly. Suggest two reasons for this. Explain each reason. reason 1 ............................................................................................................................ explanation ........................................................................................................................ ........................................................................................................................................... reason 2 ............................................................................................................................ explanation ........................................................................................................................ ........................................................................................................................................... [4] (b) The graph shows climate data from a weather station in Costa Rica for one year. Key rainfall temperature 27.5 450 27.0 400 26.5 350 26.0 300 25.5 250temperature rainfall / °C / mm 25.0 200 24.5 150 24.0 100 23.5 50 23.0 0 Jan Feb Mar Apr May Jun Jul Aug Sep Oct Nov Dec month (i) Use the climate data to suggest which months are in the wet season in Costa Rica. from ...................................... to ...................................... [1] (ii) The annual rainfall range is the difference between the maximum and minimum rainfall values. Calculate the annual rainfall range at this weather station. .......................................................... [2] (iii) Use the climate data to suggest ways that the climate affects the growing of crops in Costa Rica. ........................................................................................................................................... ........................................................................................................................................... ........................................................................................................................................... ........................................................................................................................................... ........................................................................................................................................... ........................................................................................................................................... ........................................................................................................................................... ..................................................................................................................................... [4] (c) Large areas of forested land in Costa Rica have been cleared of trees for timber, growing crops and grazing livestock. The photograph shows deforested land. (i) Deforestation can cause soil erosion. Describe the impacts of soil erosion. ........................................................................................................................................... ........................................................................................................................................... ........................................................................................................................................... ........................................................................................................................................... ........................................................................................................................................... ..................................................................................................................................... [3] (ii) Explain how intercropping and bunds can reduce soil erosion. intercropping ..................................................................................................................... ........................................................................................................................................... ........................................................................................................................................... ........................................................................................................................................... bunds ................................................................................................................................ ........................................................................................................................................... ........................................................................................................................................... ........................................................................................................................................... [4] (iii) The table shows the total area of forest cover in Costa Rica between 1940 and 2019. year 1940 1960 1980 1990 2000 2005 2010 2019 total area of forest cover 38 295 27 062 12 212 25 640 23 760 24 910 26 050 38 550 / km2 Use the data to describe how the total area of forest cover in Costa Rica changed between 1940 and 2019. ........................................................................................................................................... ........................................................................................................................................... ........................................................................................................................................... ........................................................................................................................................... ........................................................................................................................................... ..................................................................................................................................... [3] (iv) A scheme called ‘payments for ecosystem services’ (PES) was introduced in Costa Rica to protect forested land. Three local landowners talk about the PES scheme. Landowner A: I am paid by the government to not cut down trees for timber on my land. I have decided not to grow coffee for export because I can earn more money in the PES scheme. Landowner B: There are lots of forms to fill in every year to stay in the PES scheme. The scheme is not compulsory. It’s up to me whether I stay in the scheme. Landowner C: I use the regular PES payment to feed my family. I make a lot of money as a tourist guide in the forest. Discuss whether the PES scheme is a good environmental management strategy. Use information from the comments of the three local landowners to support your view. ........................................................................................................................................... ........................................................................................................................................... ........................................................................................................................................... ........................................................................................................................................... ........................................................................................................................................... ........................................................................................................................................... ........................................................................................................................................... ..................................................................................................................................... [4] (v) Explain why climate change is an impact of deforestation. ........................................................................................................................................... ........................................................................................................................................... ........................................................................................................................................... ........................................................................................................................................... ........................................................................................................................................... ........................................................................................................................................... ........................................................................................................................................... ..................................................................................................................................... [4] (vi) Costa Rica accounts for only 0.03% of the Earth’s land but contains 6% of the Earth’s biodiversity. Suggest one reason why people are concerned that climate change could affect biodiversity in Costa Rica. ........................................................................................................................................... ..................................................................................................................................... [1] [Total: 37]
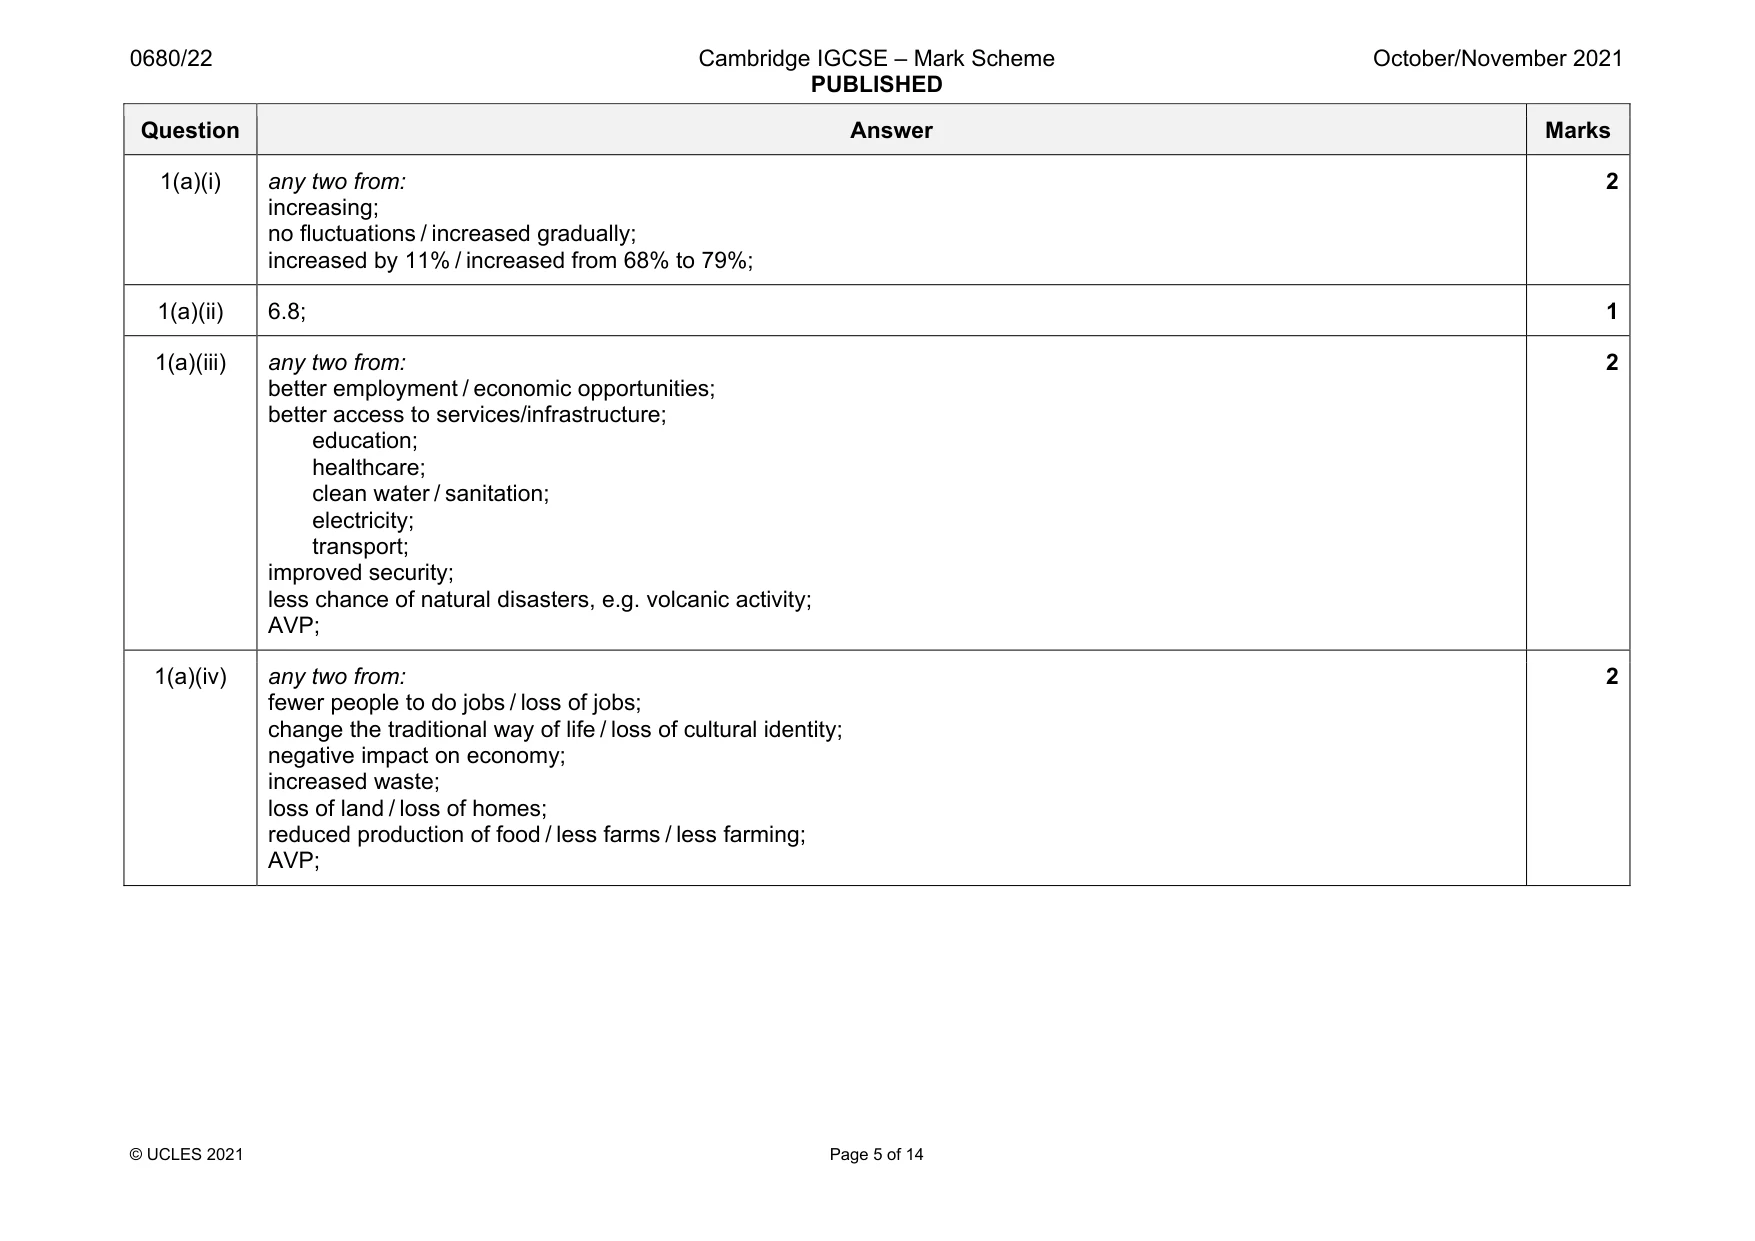
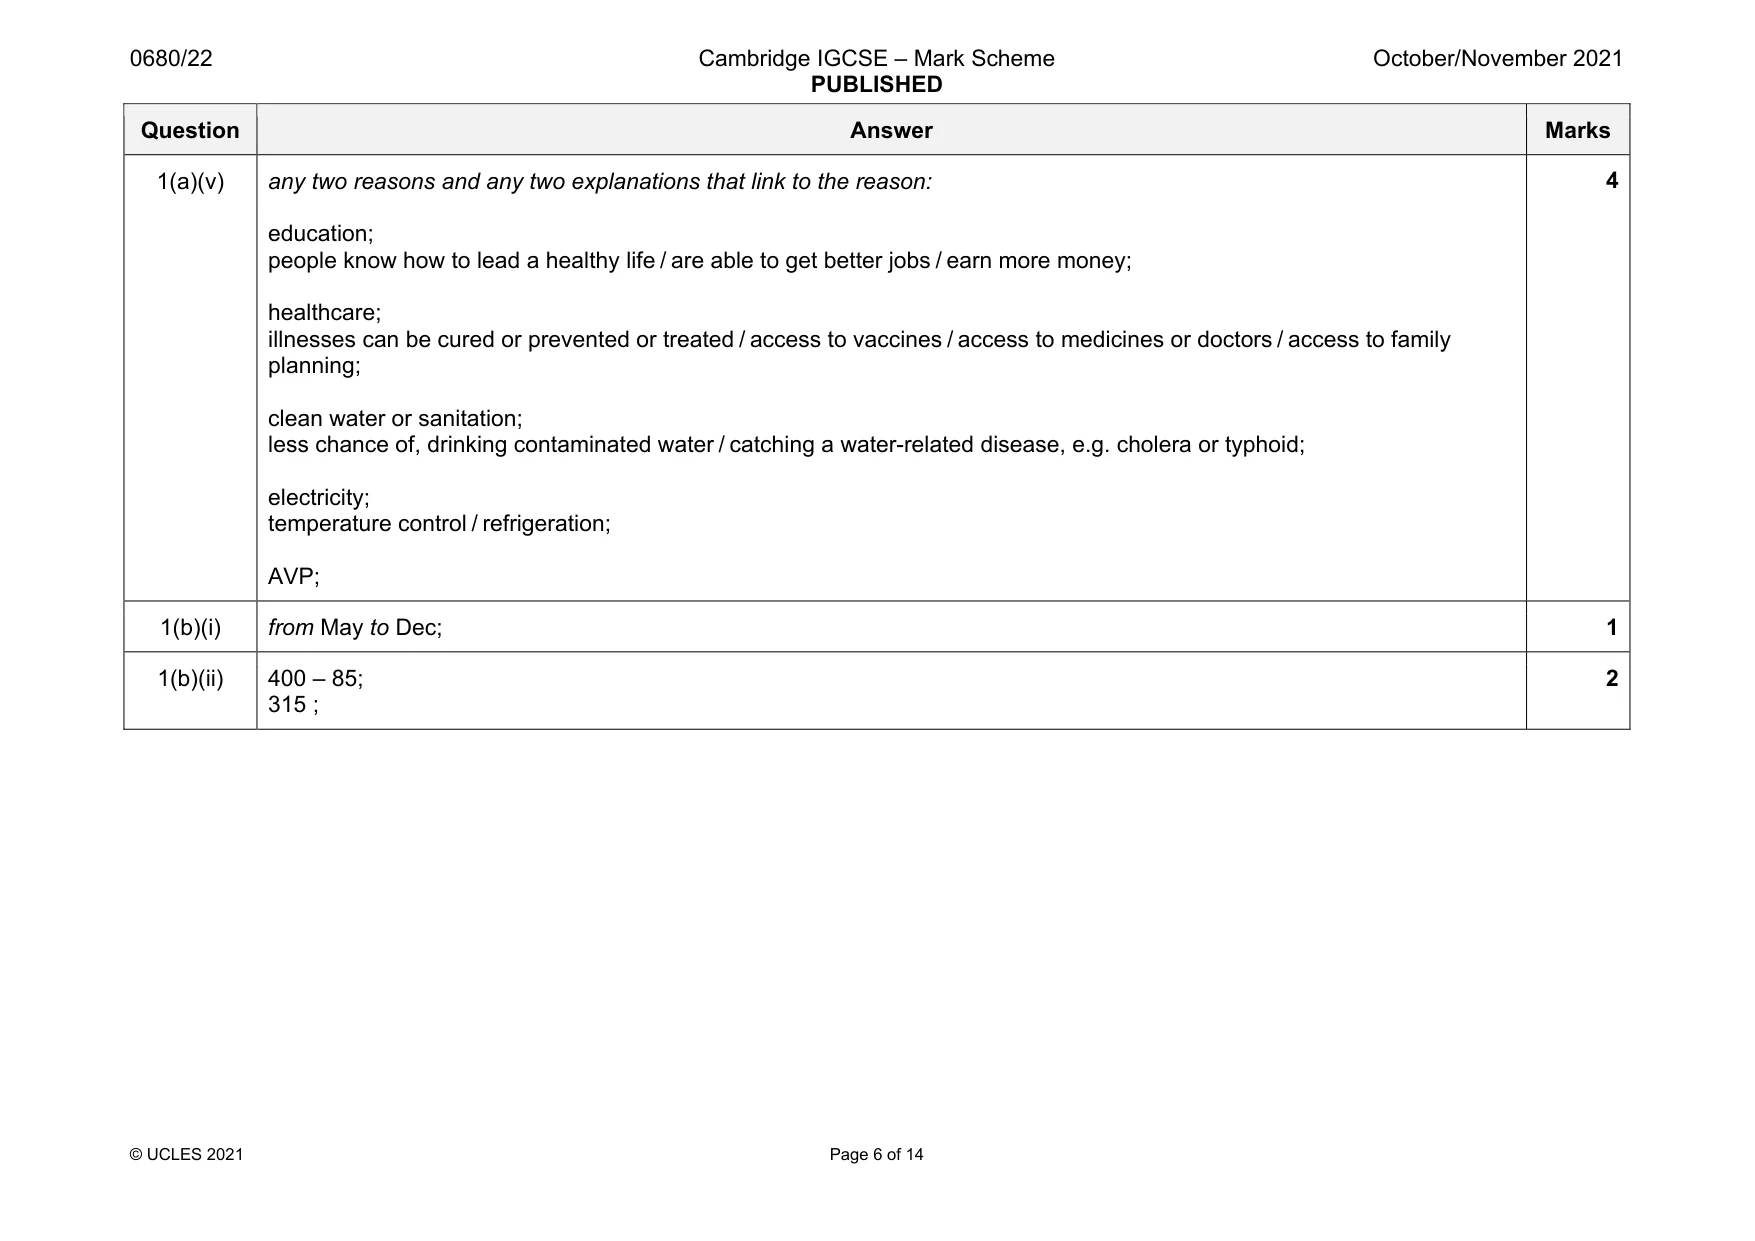
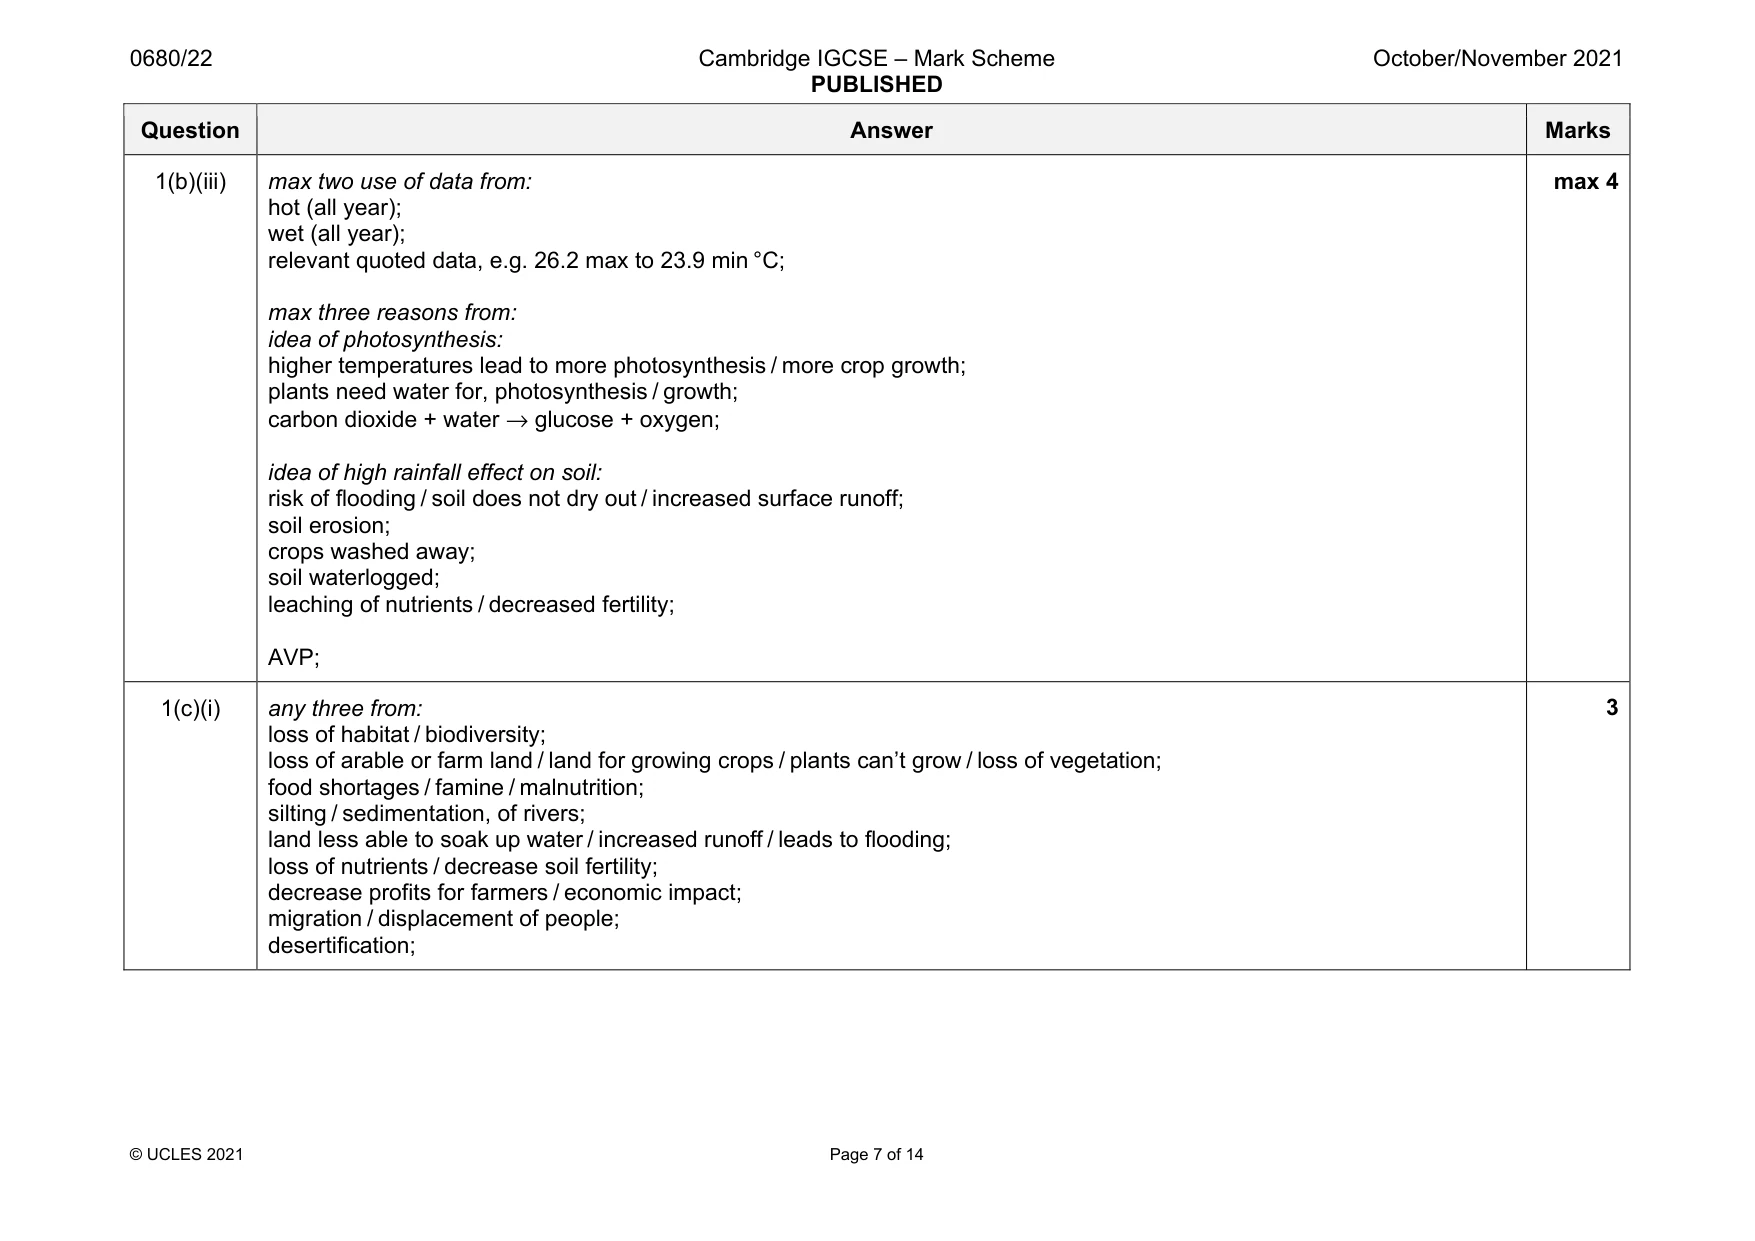
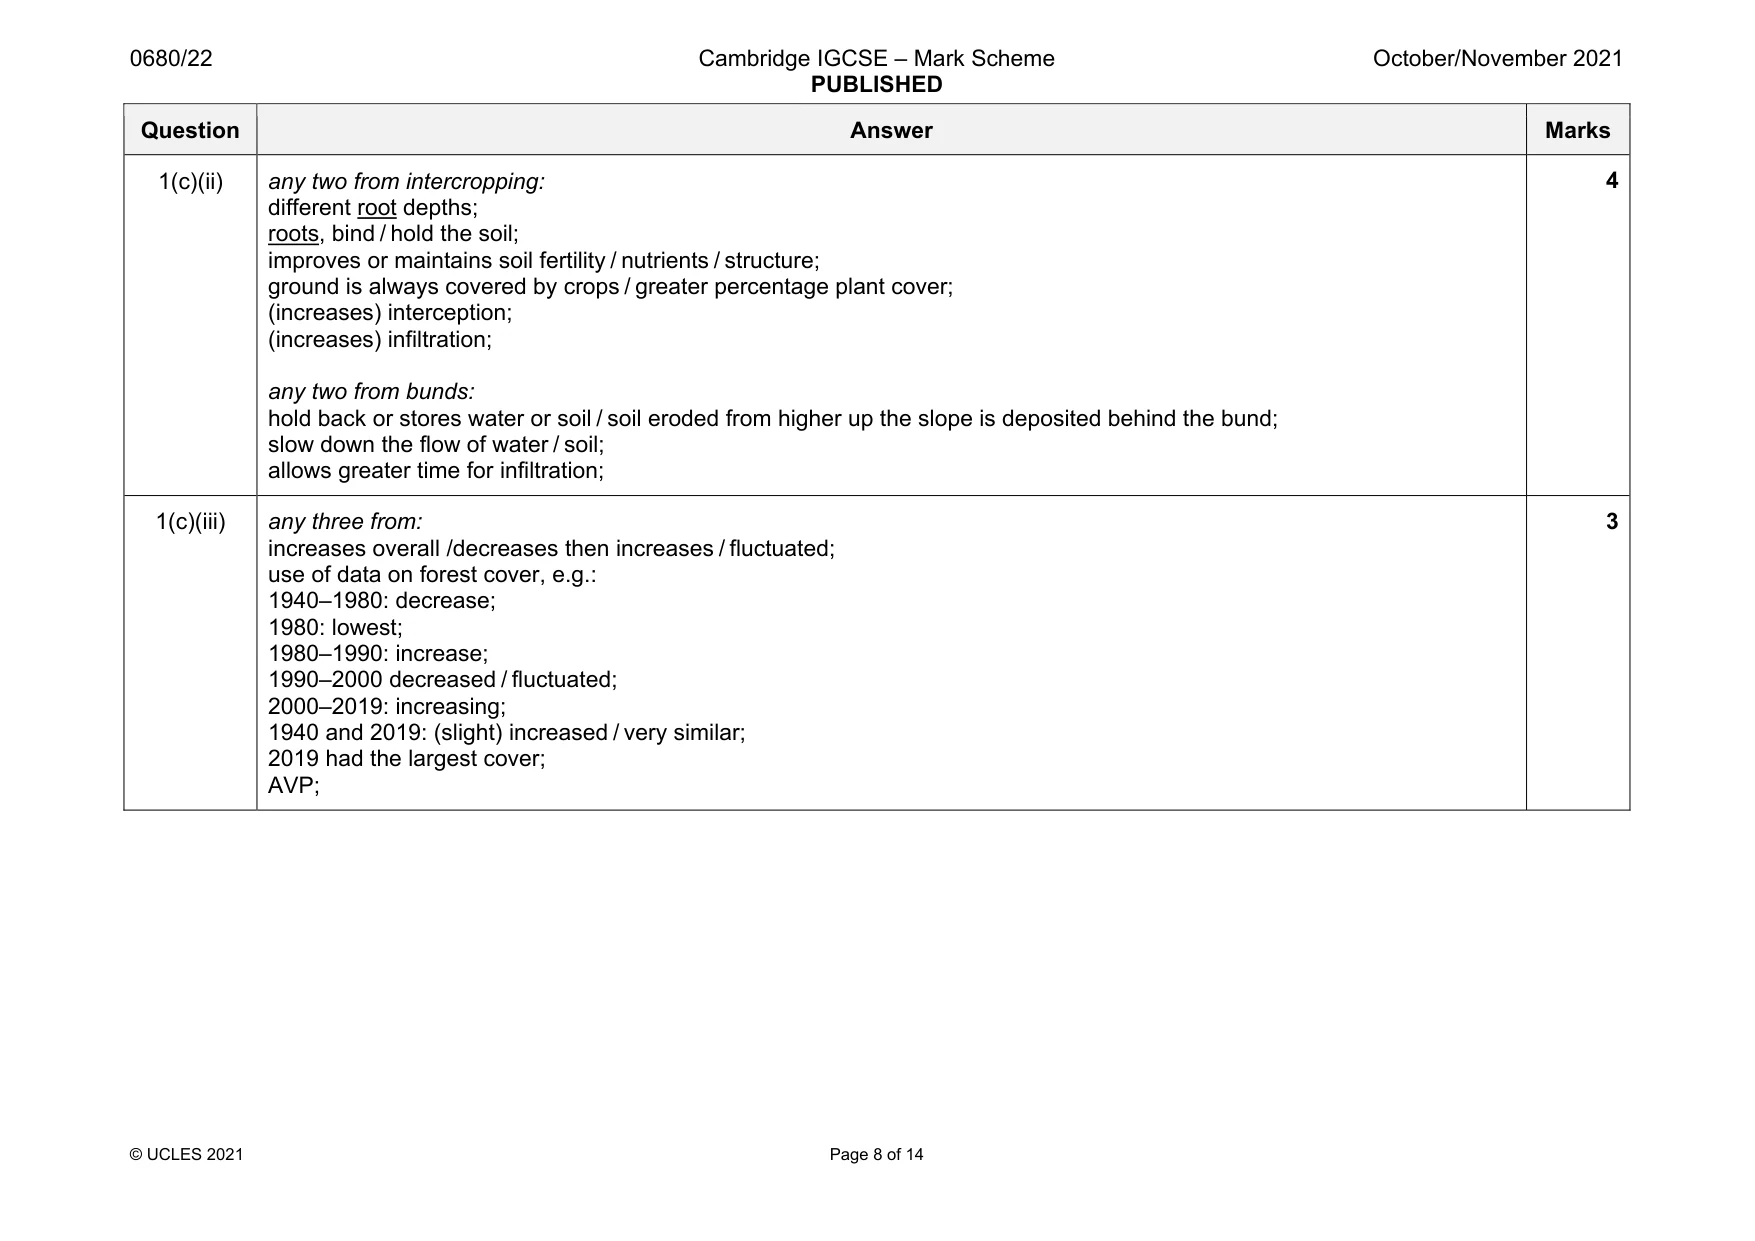
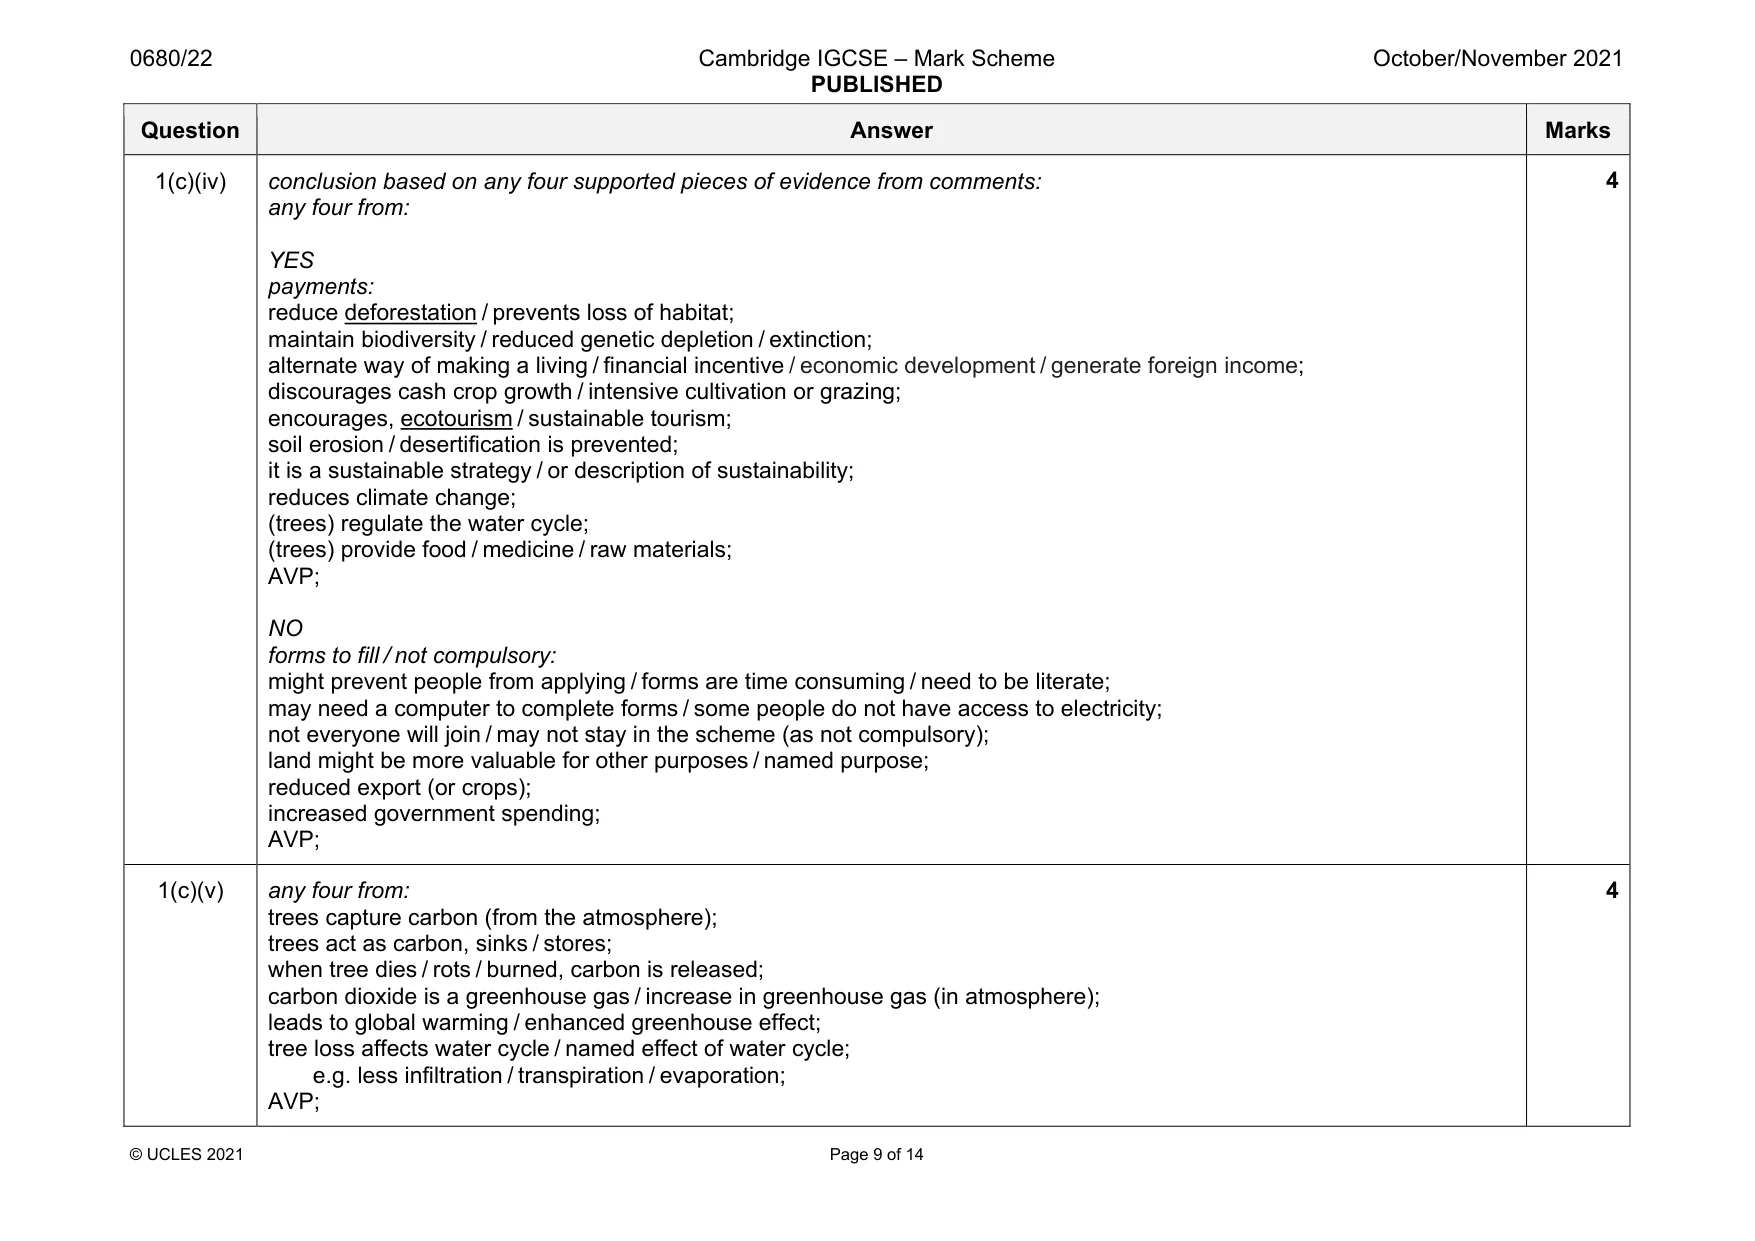
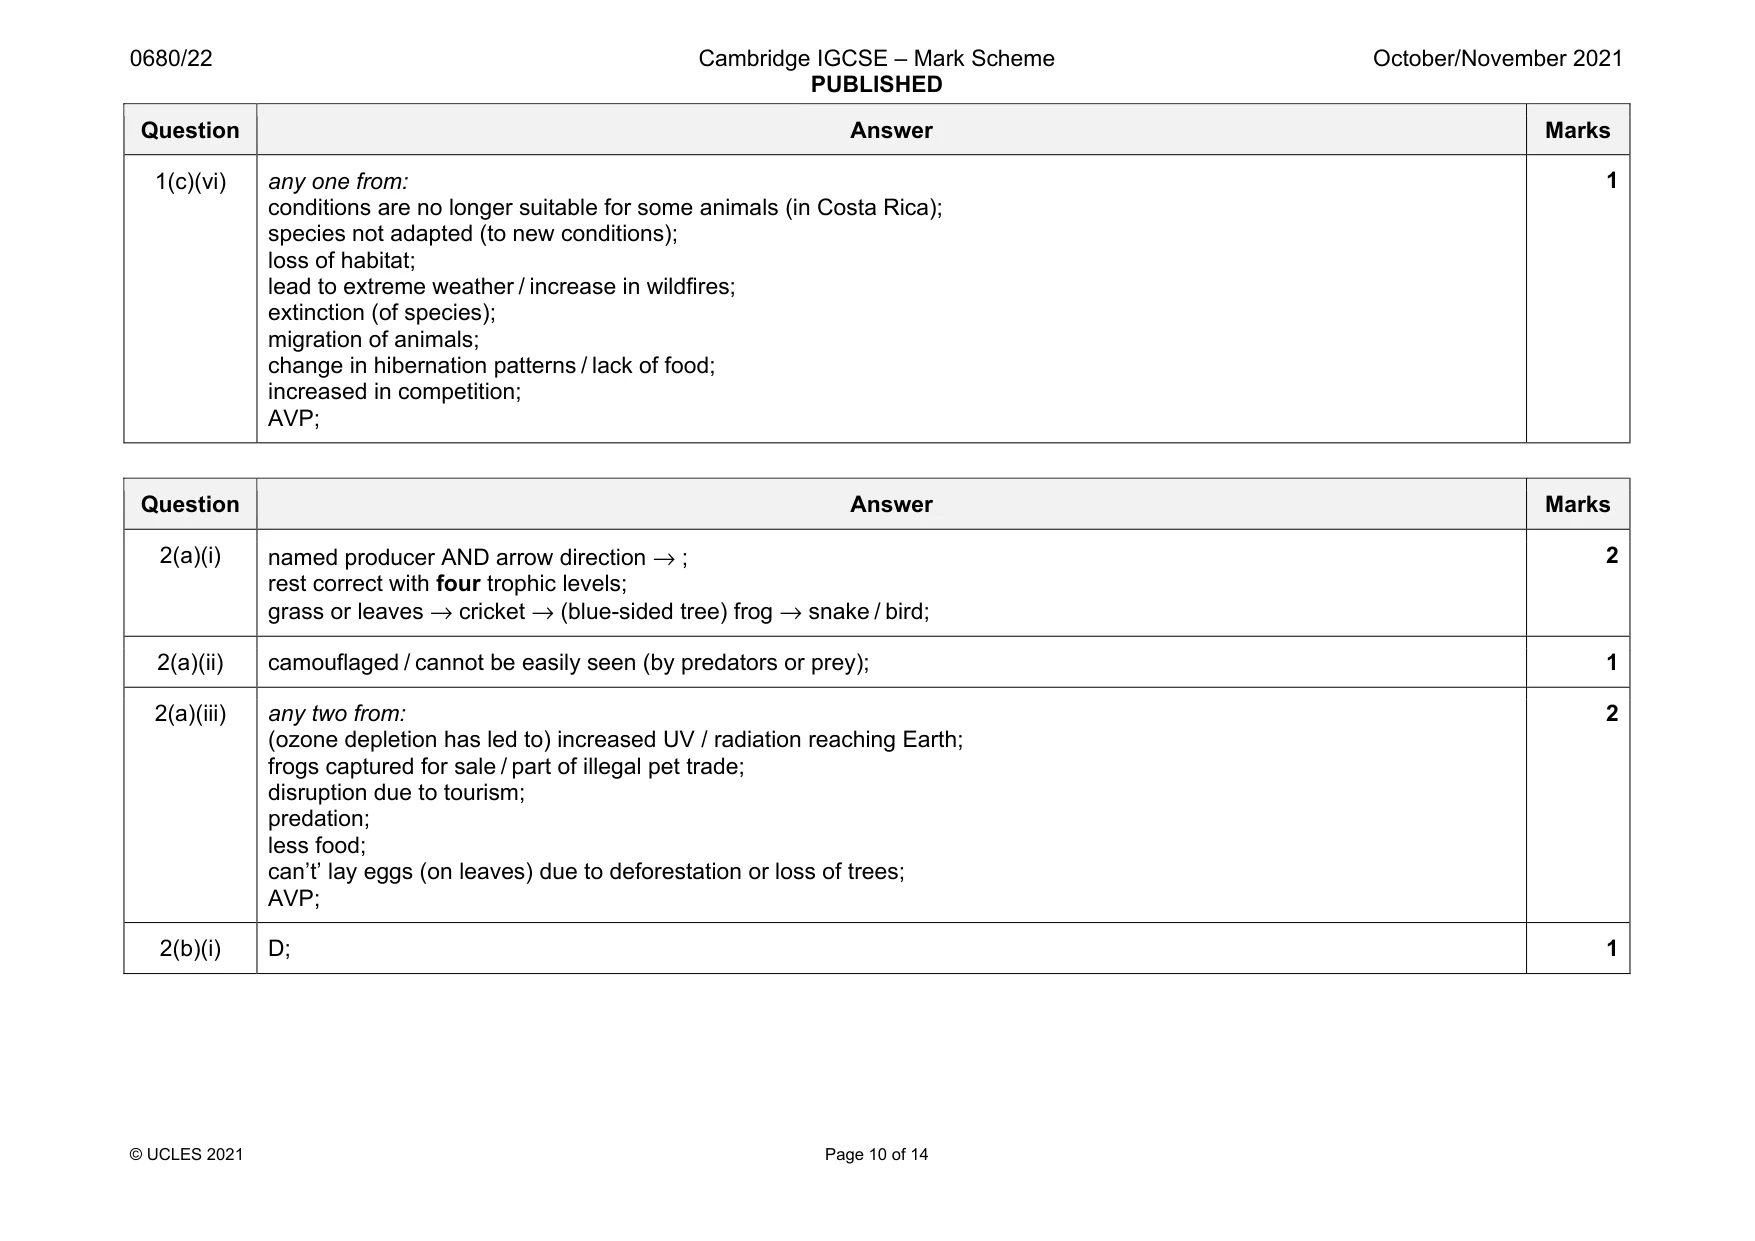
Mark scheme: 1(a)(i) any two from: increasing; no fluctuations / increased gradually; increased by 11% / increased from 68% to 79%; 2 1(a)(ii) 6.8; 1 1(a)(iii) any two from: better employment / economic opportunities; better access to services/infrastructure; education; healthcare; clean water / sanitation; electricity; transport; improved security; less chance of natural disasters, e.g. volcanic activity; AVP; 2 1(a)(iv) any two from: fewer people to do jobs / loss of jobs; change the traditional way of life / loss of cultural identity; negative impact on economy; increased waste; loss of land / loss of homes; reduced production of food / less farms / less farming; AVP; 2 Question Answer Marks 1(a)(v) any two reasons and any two explanations that link to the reason: education; people know how to lead a healthy life / are able to get better jobs / earn more money; healthcare; illnesses can be cured or prevented or treated / access to vaccines / access to medicines or doctors / access to family planning; clean water or sanitation; less chance of, drinking contaminated water / catching a water-related disease, e.g. cholera or typhoid; electricity; temperature control / refrigeration; AVP; 4 1(b)(i) from May to Dec; 1 1(b)(ii) 400 – 85; 315 ; 2 Question Answer Marks 1(b)(iii) max two use of data from: hot (all year); wet (all year); relevant quoted data, e.g. 26.2 max to 23.9 min °C; max three reasons from: idea of photosynthesis: higher temperatures lead to more photosynthesis / more crop growth; plants need water for, photosynthesis / growth; carbon dioxide + water → glucose + oxygen; idea of high rainfall effect on soil: risk of flooding / soil does not dry out / increased surface runoff; soil erosion; crops washed away; soil waterlogged; leaching of nutrients / decreased fertility; AVP; max 4 1(c)(i) any three from: loss of habitat / biodiversity; loss of arable or farm land / land for growing crops / plants can’t grow / loss of vegetation; food shortages / famine / malnutrition; silting / sedimentation, of rivers; land less able to soak up water / increased runoff / leads to flooding; loss of nutrients / decrease soil fertility; decrease profits for farmers / economic impact; migration / displacement of people; desertification; 3 Question Answer Marks 1(c)(ii) any two from intercropping: different root depths; roots, bind / hold the soil; improves or maintains soil fertility / nutrients / structure; ground is always covered by crops / greater percentage plant cover; (increases) interception; (increases) infiltration; any two from bunds: hold back or stores water or soil / soil eroded from higher up the slope is deposited behind the bund; slow down the flow of water / soil; allows greater time for infiltration; 4 1(c)(iii) any three from: increases overall /decreases then increases / fluctuated; use of data on forest cover, e.g.: 1940–1980: decrease; 1980: lowest; 1980–1990: increase; 1990–2000 decreased / fluctuated; 2000–2019: increasing; 1940 and 2019: (slight) increased / very similar; 2019 had the largest cover; AVP; 3 Question Answer Marks 1(c)(iv) conclusion based on any four supported pieces of evidence from comments: any four from: YES payments: reduce deforestation / prevents loss of habitat; maintain biodiversity / reduced genetic depletion / extinction; alternate way of making a living / financial incentive / economic development / generate foreign income; discourages cash crop growth / intensive cultivation or grazing; encourages, ecotourism / sustainable tourism; soil erosion / desertification is prevented; it is a sustainable strategy / or description of sustainability; reduces climate change; (trees) regulate the water cycle; (trees) provide food / medicine / raw materials; AVP; NO forms to fill / not compulsory: might prevent people from applying / forms are time consuming / need to be literate; may need a computer to complete forms / some people do not have access to electricity; not everyone will join / may not stay in the scheme (as not compulsory); land might be more valuable for other purposes / named purpose; reduced export (or crops); increased government spending; AVP; 4 1(c)(v) any four from: trees capture carbon (from the atmosphere); trees act as carbon, sinks / stores; when tree dies / rots / burned, carbon is released; carbon dioxide is a greenhouse gas / increase in greenhouse gas (in atmosphere); leads to global warming / enhanced greenhouse effect; tree loss affects water cycle / named effect of water cycle; e.g. less infiltration / transpiration / evaporation; AVP; 4 Question Answer Marks 1(c)(vi) any one from: conditions are no longer suitable for some animals (in Costa Rica); species not adapted (to new conditions); loss of habitat; lead to extreme weather / increase in wildfires; extinction (of species); migration of animals; change in hibernation patterns / lack of food; increased in competition; AVP; 1
Q2 · The fact sheet shows information on the blue‑sided treefrog
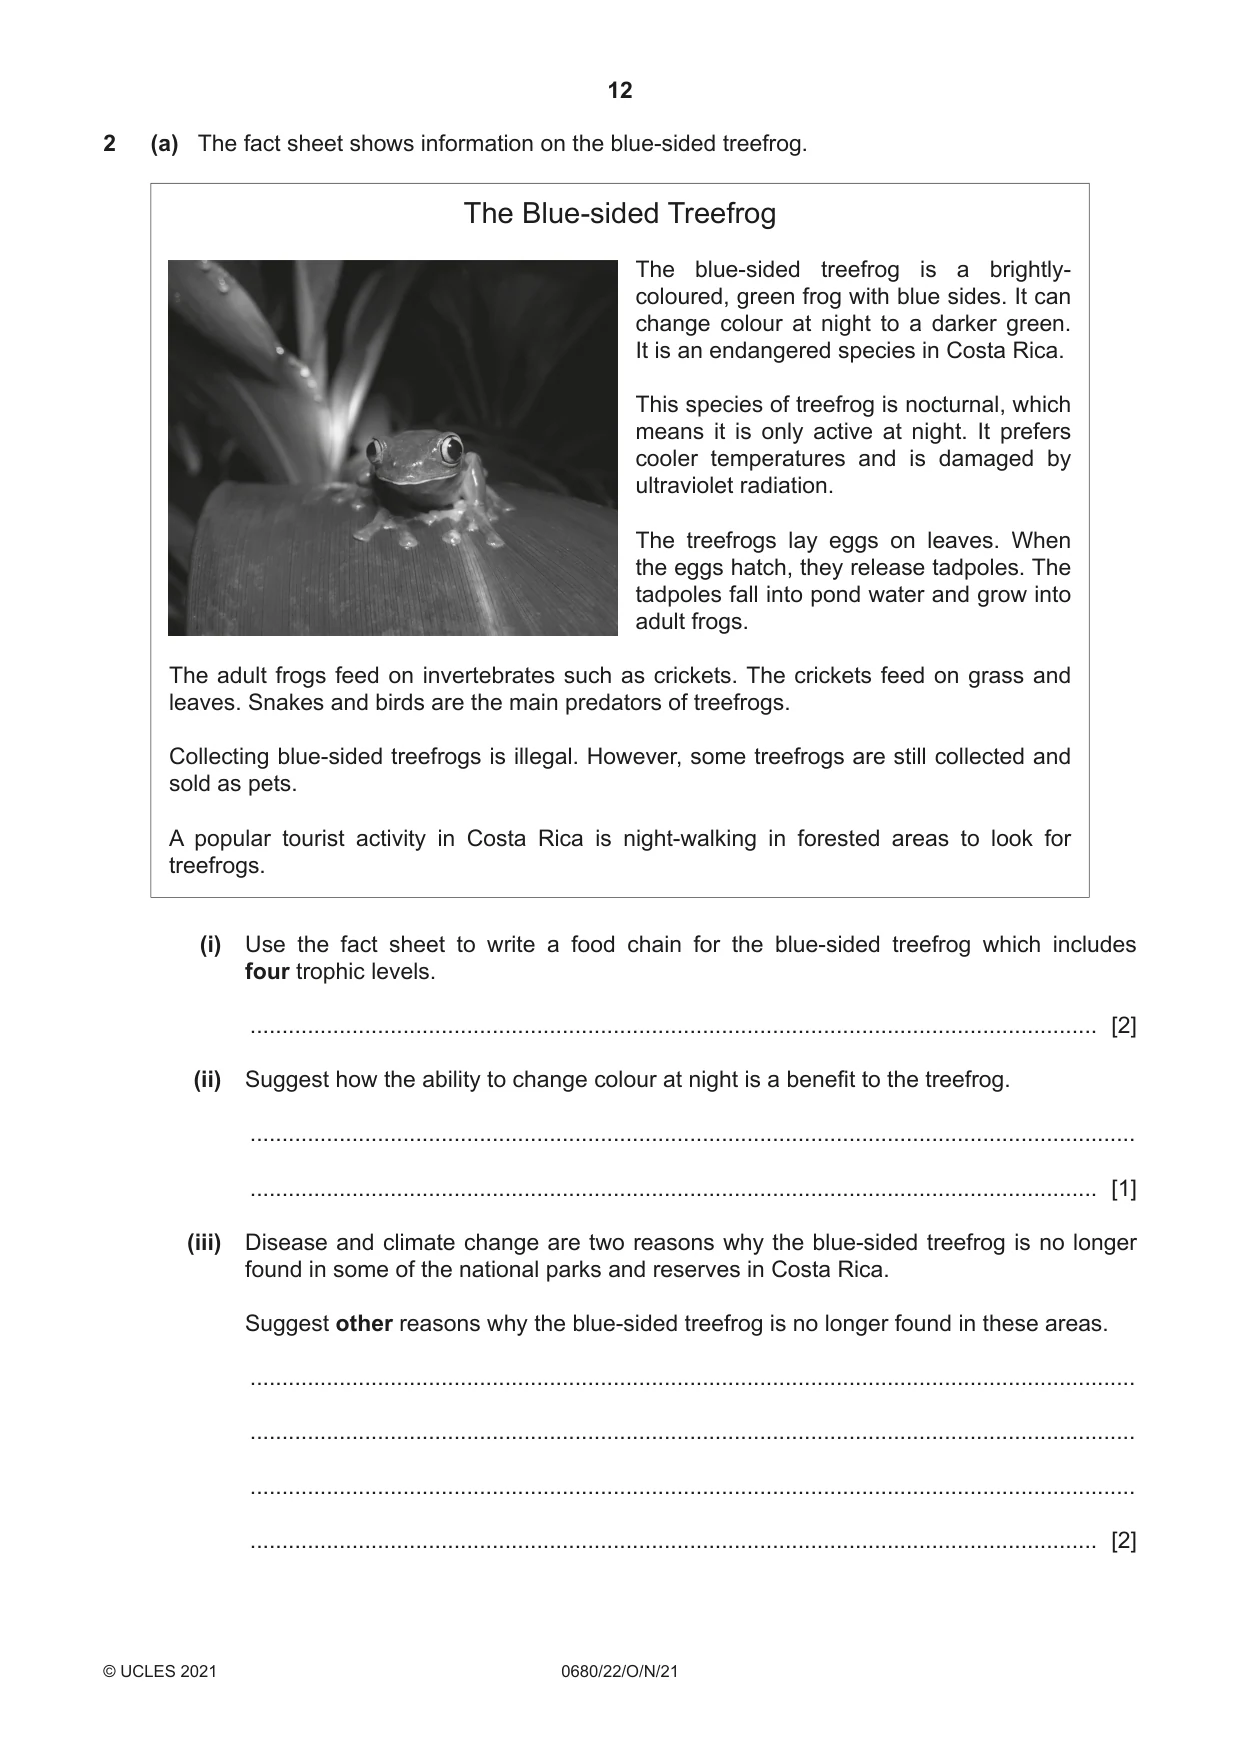
2 (a) The fact sheet shows information on the blue‑sided treefrog. The Blue‑sided Treefrog The blue‑sided treefrog is a brightly‑ coloured, green frog with blue sides. It can change colour at night to a darker green. It is an endangered species in Costa Rica. This species of treefrog is nocturnal, which means it is only active at night. It prefers cooler temperatures and is damaged by ultraviolet radiation. The treefrogs lay eggs on leaves. When the eggs hatch, they release tadpoles. The tadpoles fall into pond water and grow into adult frogs. The adult frogs feed on invertebrates such as crickets. The crickets feed on grass and leaves. Snakes and birds are the main predators of treefrogs. Collecting blue‑sided treefrogs is illegal. However, some treefrogs are still collected and sold as pets. A popular tourist activity in Costa Rica is night‑walking in forested areas to look for treefrogs. (i) Use the fact sheet to write a food chain for the blue‑sided treefrog which includes four trophic levels. ..................................................................................................................................... [2] (ii) Suggest how the ability to change colour at night is a benefit to the treefrog. ........................................................................................................................................... ..................................................................................................................................... [1] (iii) Disease and climate change are two reasons why the blue‑sided treefrog is no longer found in some of the national parks and reserves in Costa Rica. Suggest other reasons why the blue‑sided treefrog is no longer found in these areas. ........................................................................................................................................... ........................................................................................................................................... ........................................................................................................................................... ..................................................................................................................................... [2] (b) A student reviews some online data about captive breeding programmes for the blue‑sided treefrog. The table shows the data. percentage of percentage of percentage of breeding eggs hatching tadpoles growing adult frogs still living programme into tadpoles into adult frogs after one year A 30 43 45 B 52 67 12 C 88 75 92 D 10 32 42 (i) Identify which captive breeding programme is the least successful at hatching eggs into tadpoles. ..................................................................................................................................... [1] (ii) On the grid, plot a bar chart for the percentage of adult frogs still living after one year for the four breeding programmes. [4] (iii) Suggest a limitation of the data set in the table. ........................................................................................................................................... ..................................................................................................................................... [1] (c) The blue‑sided treefrog is killed by a disease caused by a fungus. Most blue‑sided treefrogs are now found living near small ponds in urban areas. Some of these ponds are very polluted. A student has a theory that the fungus that kills the treefrogs cannot survive in these polluted ponds. The student tests this theory by: • visiting five ponds during the night • analysing the pond water for common pollutants • testing the pond water for the fungus • using a quadrat to sample an area all round the edge of the pond • counting the number of blue‑sided treefrogs. (i) The five ponds are chosen at random. State one benefit of choosing these ponds at random. ........................................................................................................................................... ..................................................................................................................................... [1] (ii) The student repeats the method on three different days. Suggest why this is good sampling practice. ........................................................................................................................................... ..................................................................................................................................... [1] (iii) Suggest two limitations of this method. 1 ........................................................................................................................................ ........................................................................................................................................... 2 ........................................................................................................................................ ........................................................................................................................................... [2] (iv) The diagram shows a pond where blue‑sided treefrogs live. Key N sampling area pond 0 2 m Describe how you could use a quadrat to record the number of blue‑sided treefrogs at this pond. ........................................................................................................................................... ........................................................................................................................................... ........................................................................................................................................... ........................................................................................................................................... ........................................................................................................................................... ........................................................................................................................................... ........................................................................................................................................... ..................................................................................................................................... [4] [Total: 19]
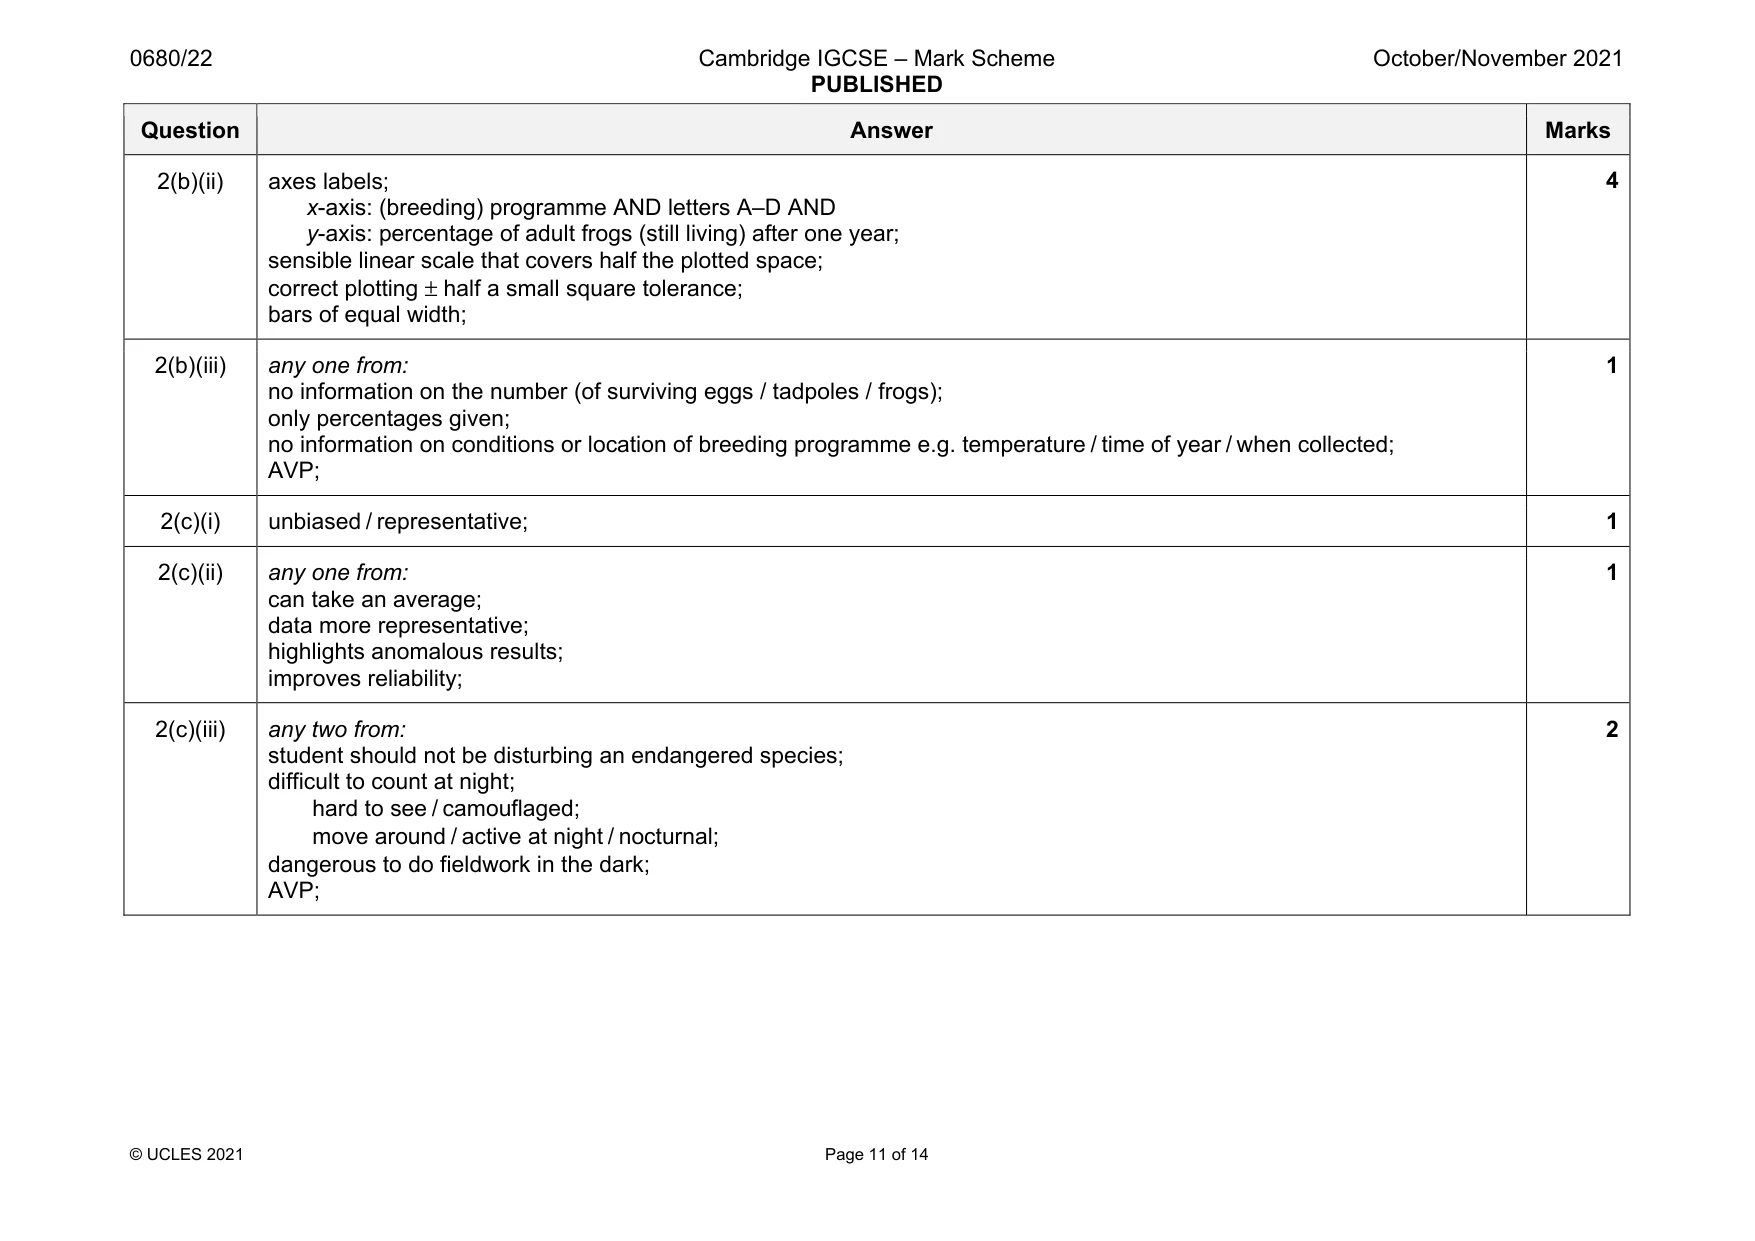
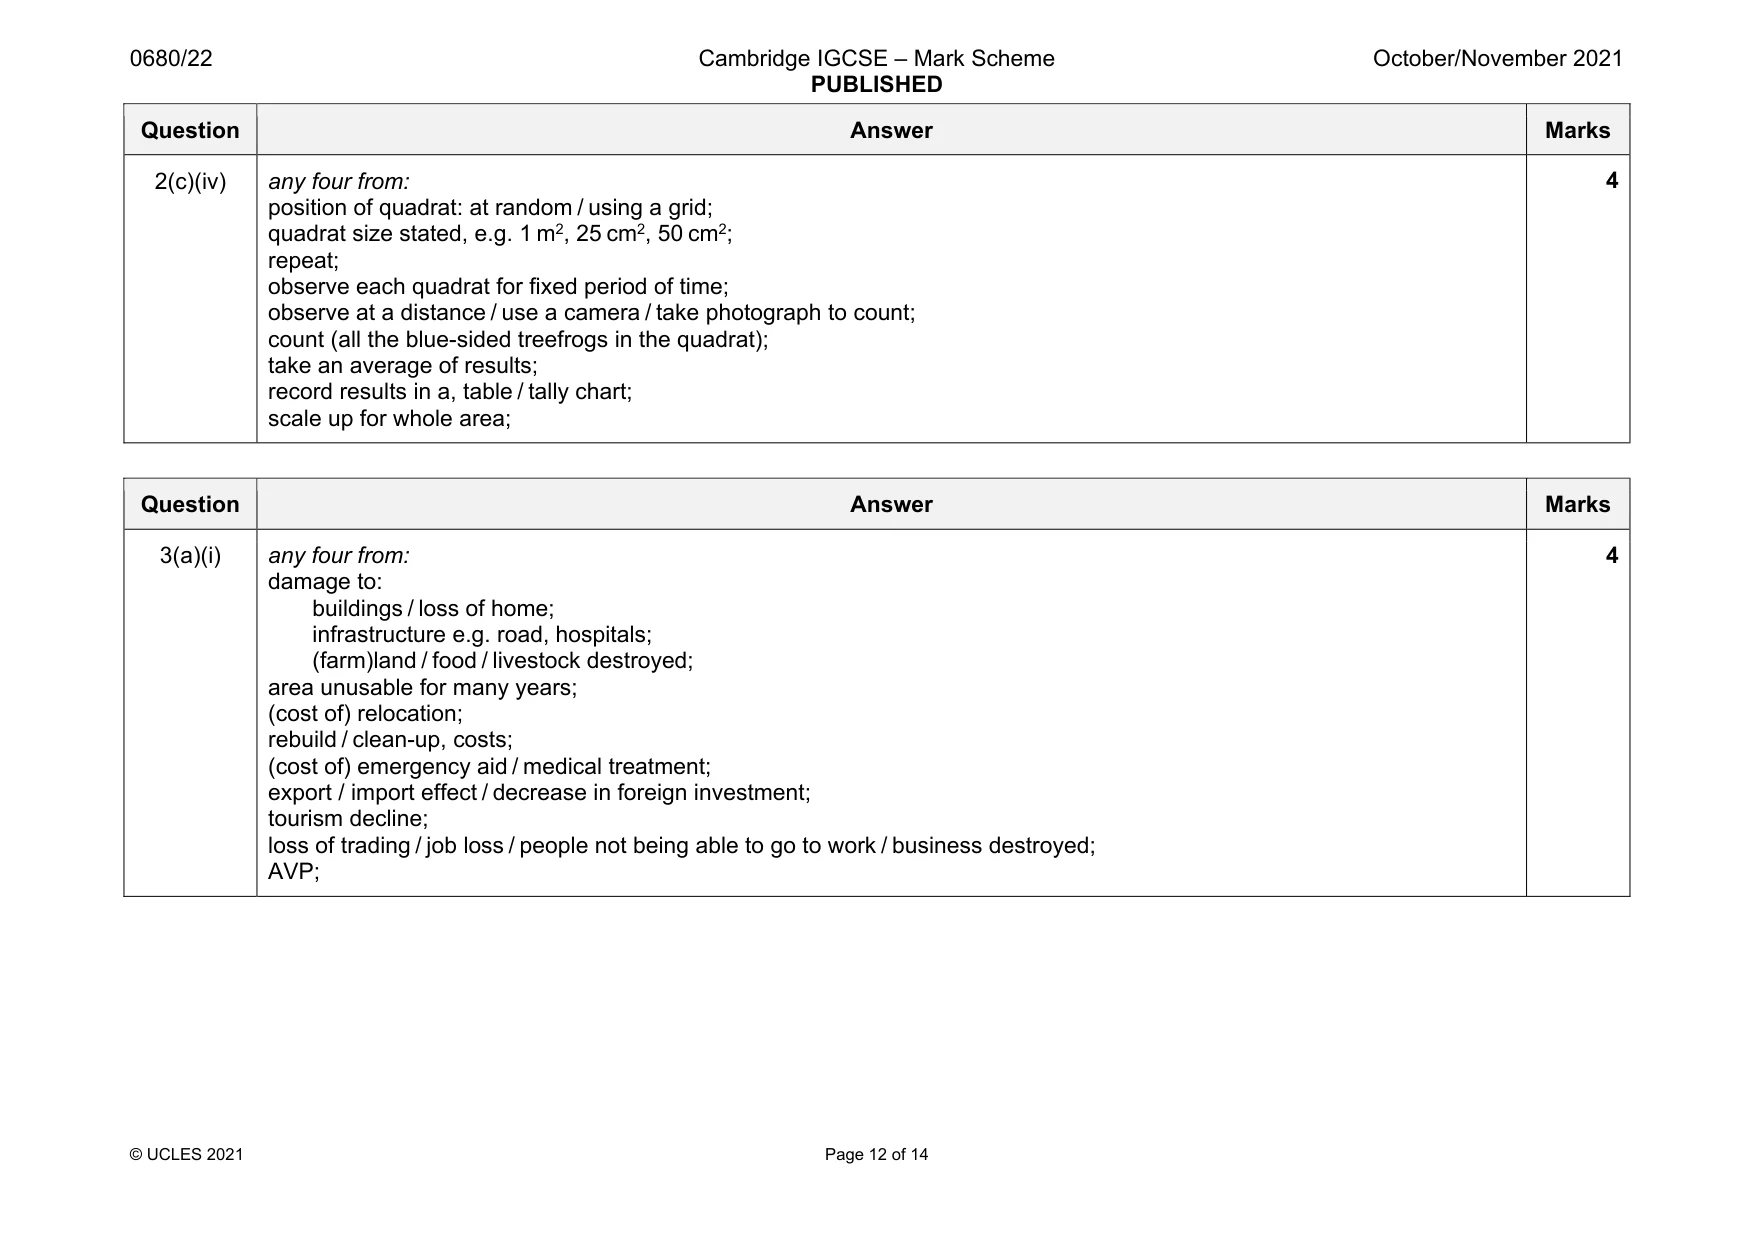
Mark scheme: 2(a)(i) named producer AND arrow direction → ; rest correct with four trophic levels; grass or leaves → cricket → (blue-sided tree) frog → snake / bird; 2 2(a)(ii) camouflaged / cannot be easily seen (by predators or prey); 1 2(a)(iii) any two from: (ozone depletion has led to) increased UV / radiation reaching Earth; frogs captured for sale / part of illegal pet trade; disruption due to tourism; predation; less food; can’t’ lay eggs (on leaves) due to deforestation or loss of trees; AVP; 2 2(b)(i) D; 1 Question Answer Marks 2(b)(ii) axes labels; x-axis: (breeding) programme AND letters A–D AND y-axis: percentage of adult frogs (still living) after one year; sensible linear scale that covers half the plotted space; correct plotting ± half a small square tolerance; bars of equal width; 4 2(b)(iii) any one from: no information on the number (of surviving eggs / tadpoles / frogs); only percentages given; no information on conditions or location of breeding programme e.g. temperature / time of year / when collected; AVP; 1 2(c)(i) unbiased / representative; 1 2(c)(ii) any one from: can take an average; data more representative; highlights anomalous results; improves reliability; 1 2(c)(iii) any two from: student should not be disturbing an endangered species; difficult to count at night; hard to see / camouflaged; move around / active at night / nocturnal; dangerous to do fieldwork in the dark; AVP; 2 Question Answer Marks 2(c)(iv) any four from: position of quadrat: at random / using a grid; quadrat size stated, e.g. 1 m2, 25 cm2, 50 cm2; repeat; observe each quadrat for fixed period of time; observe at a distance / use a camera / take photograph to count; count (all the blue-sided treefrogs in the quadrat); take an average of results; record results in a, table / tally chart; scale up for whole area; 4
Q3 · The photograph shows the Arenal Volcano and the town of La Fortuna in Costa Rica
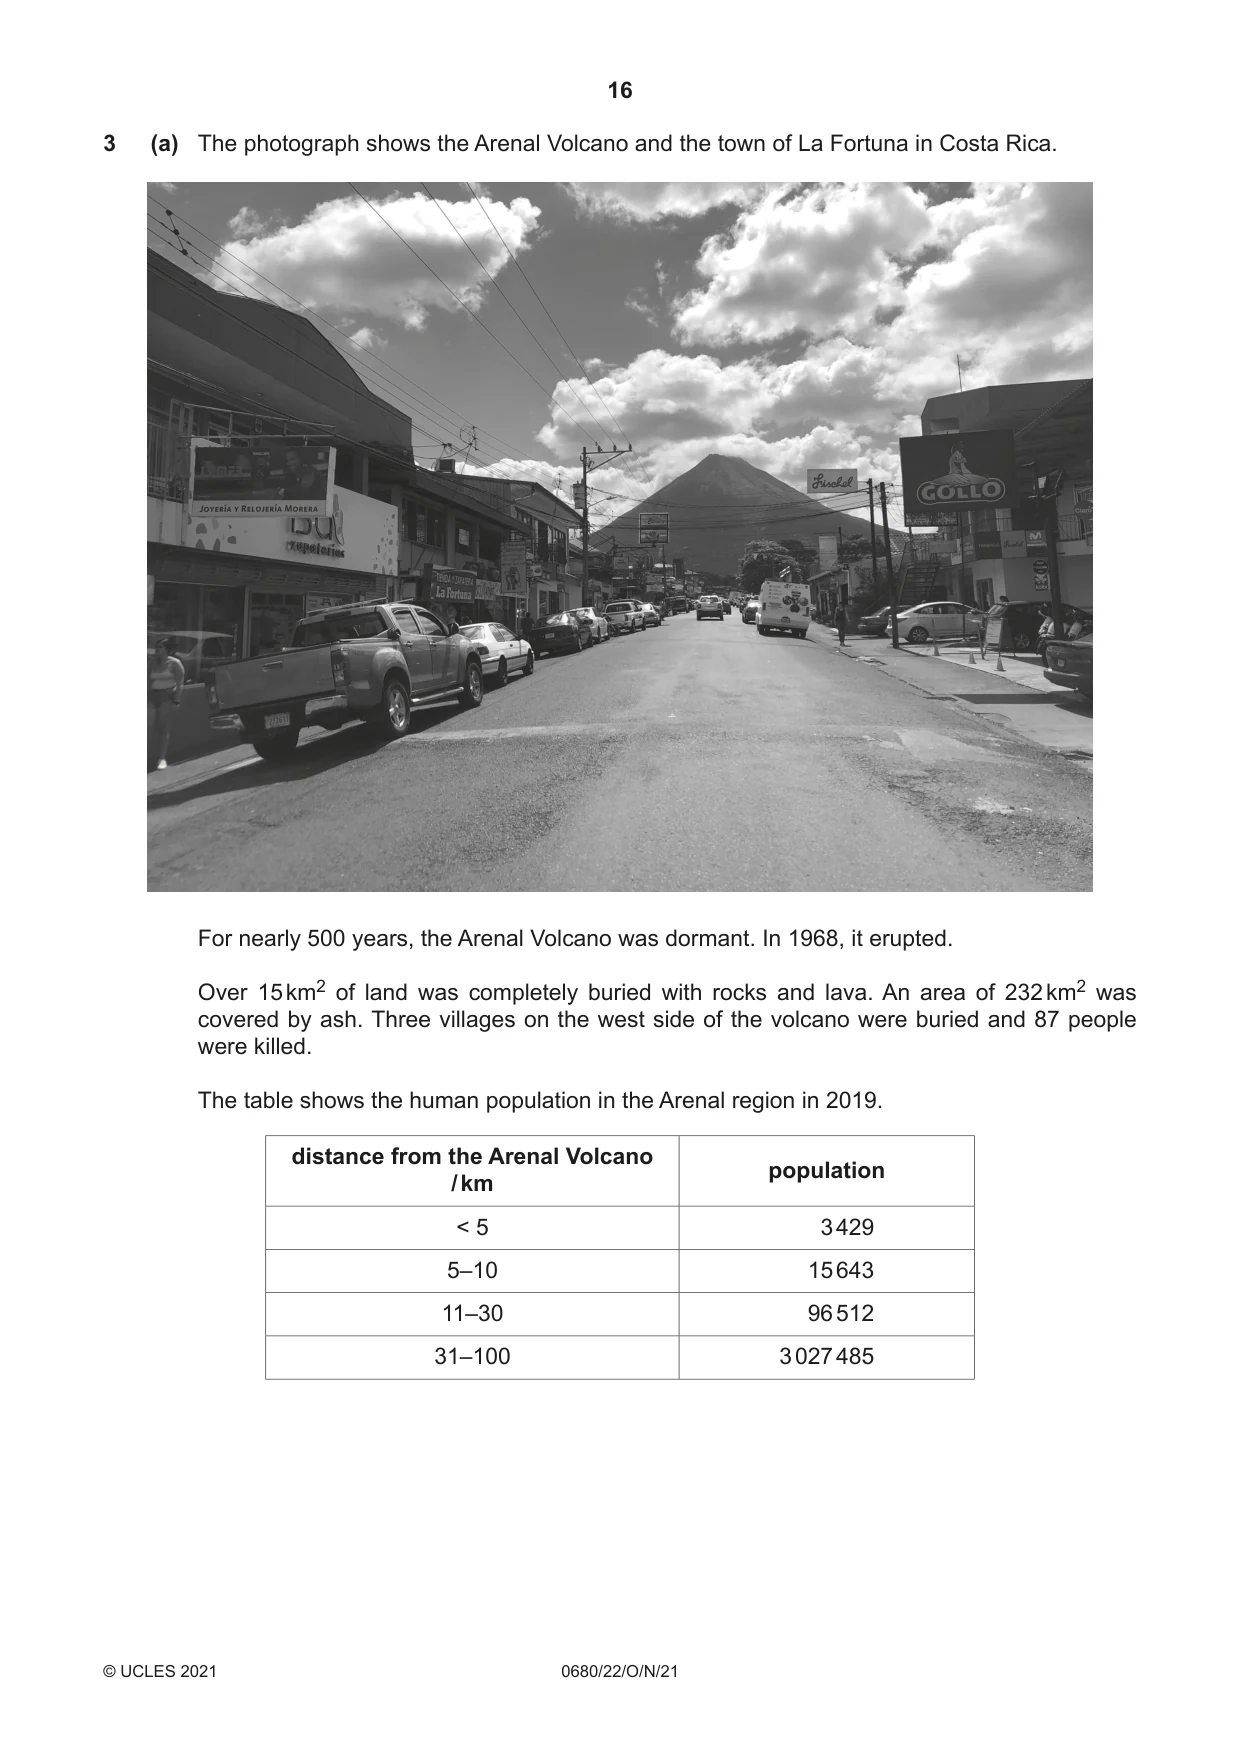
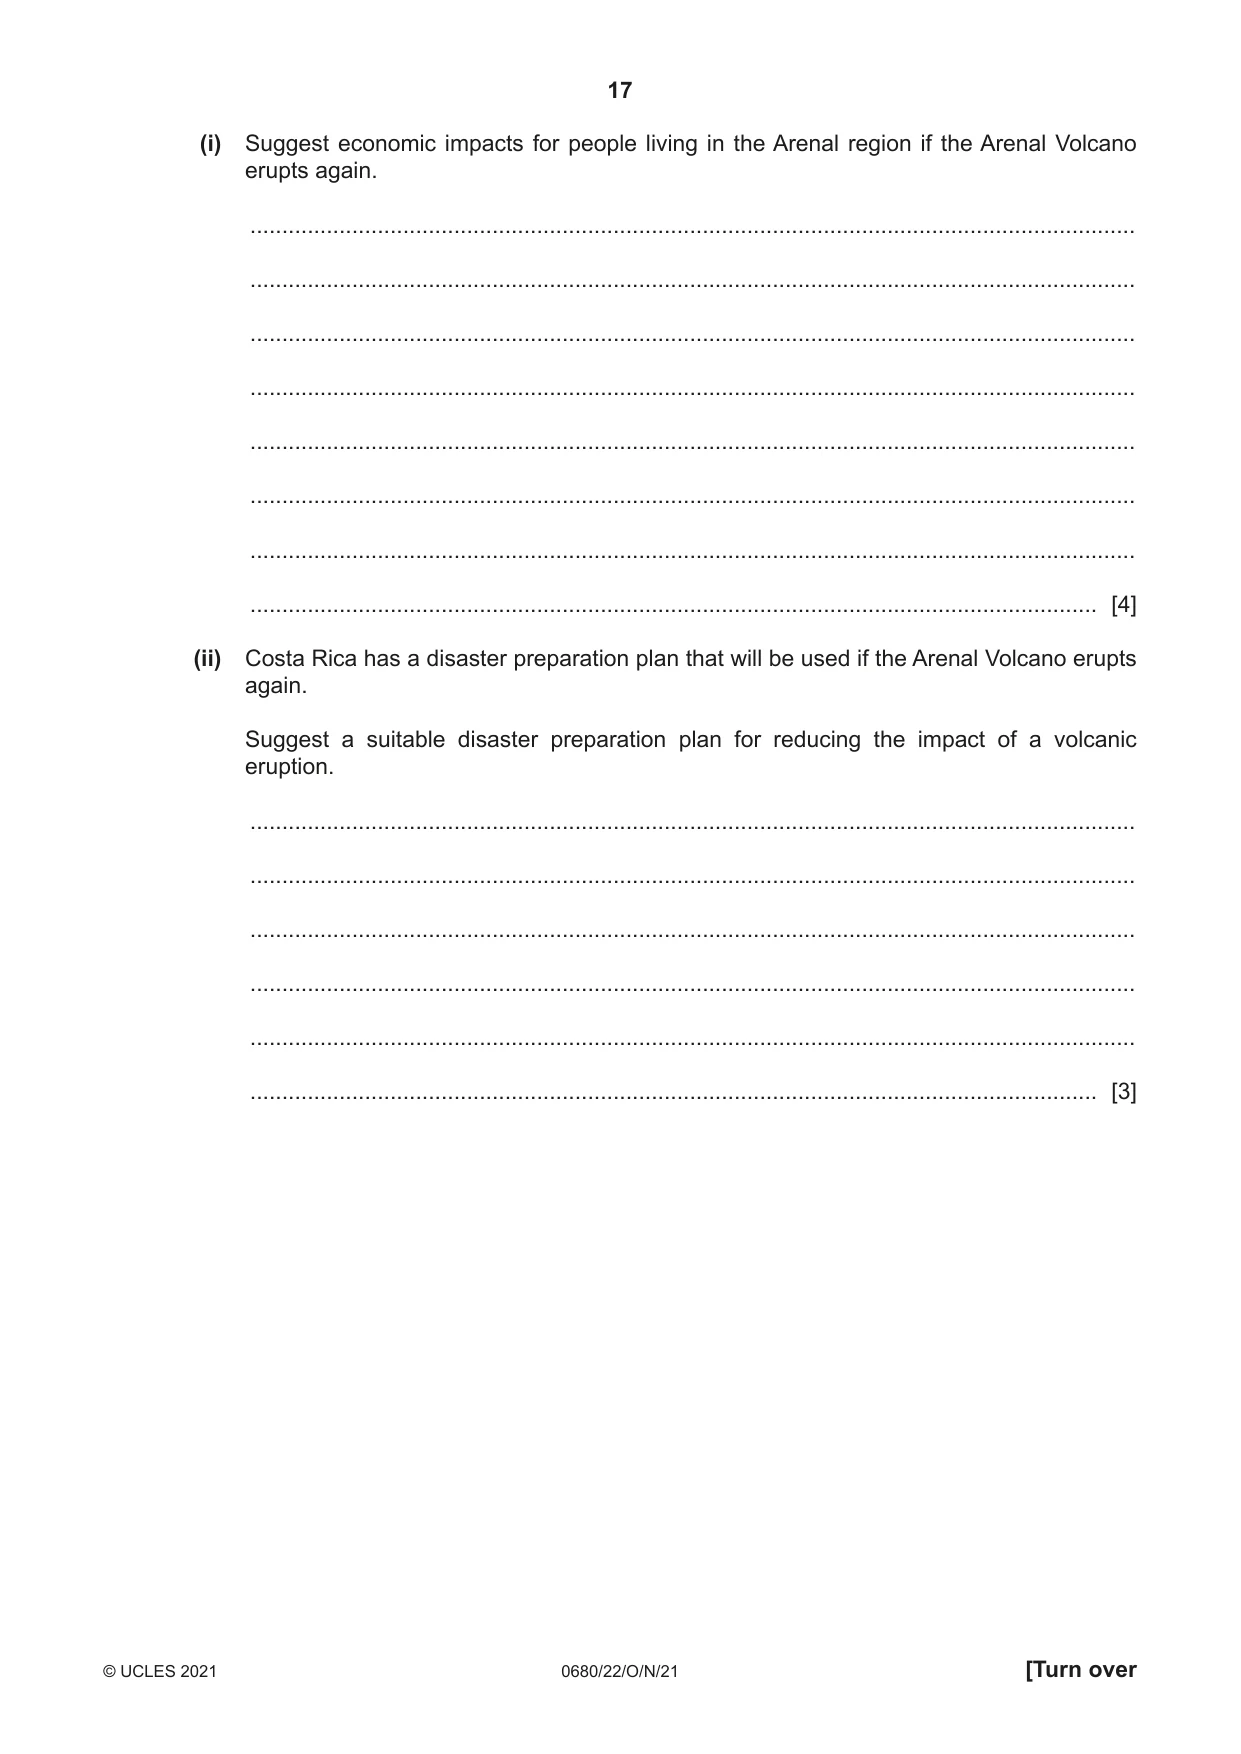
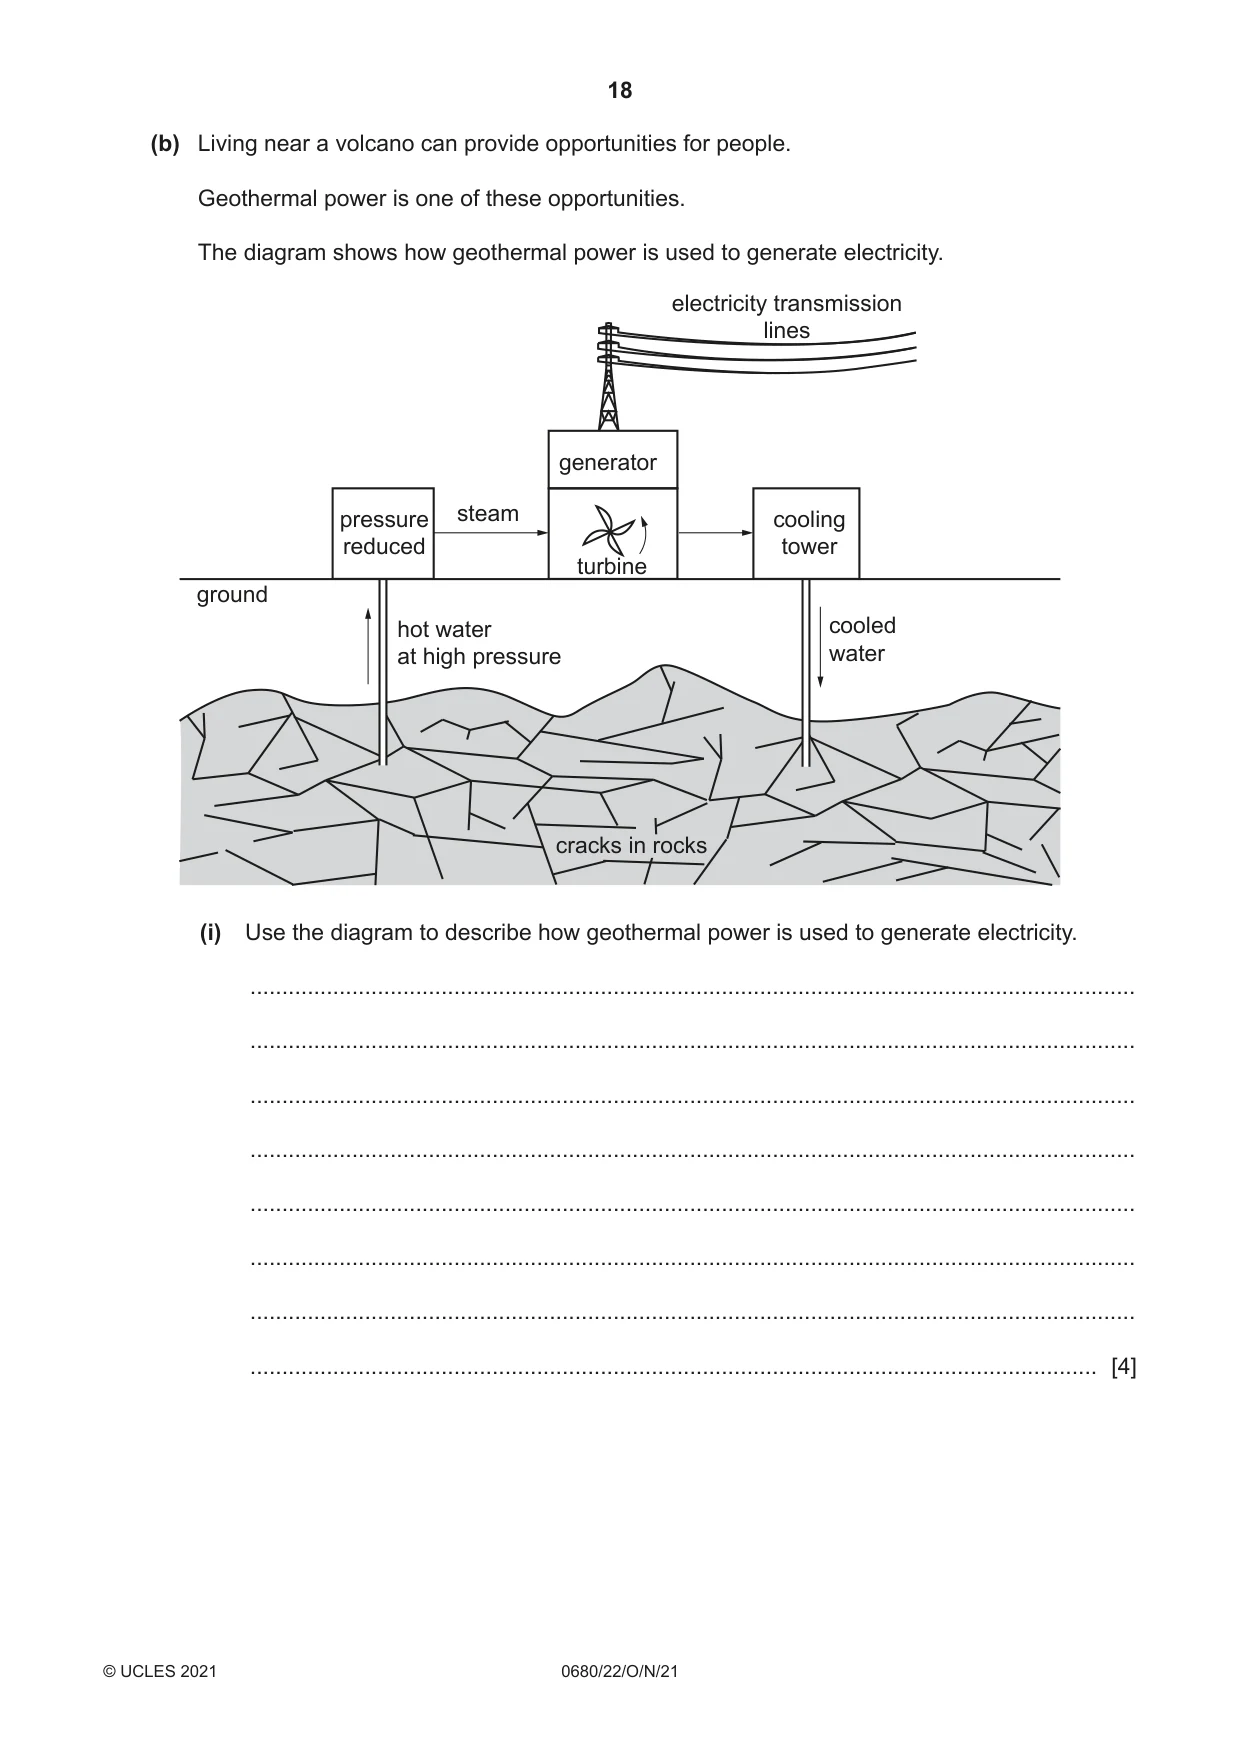
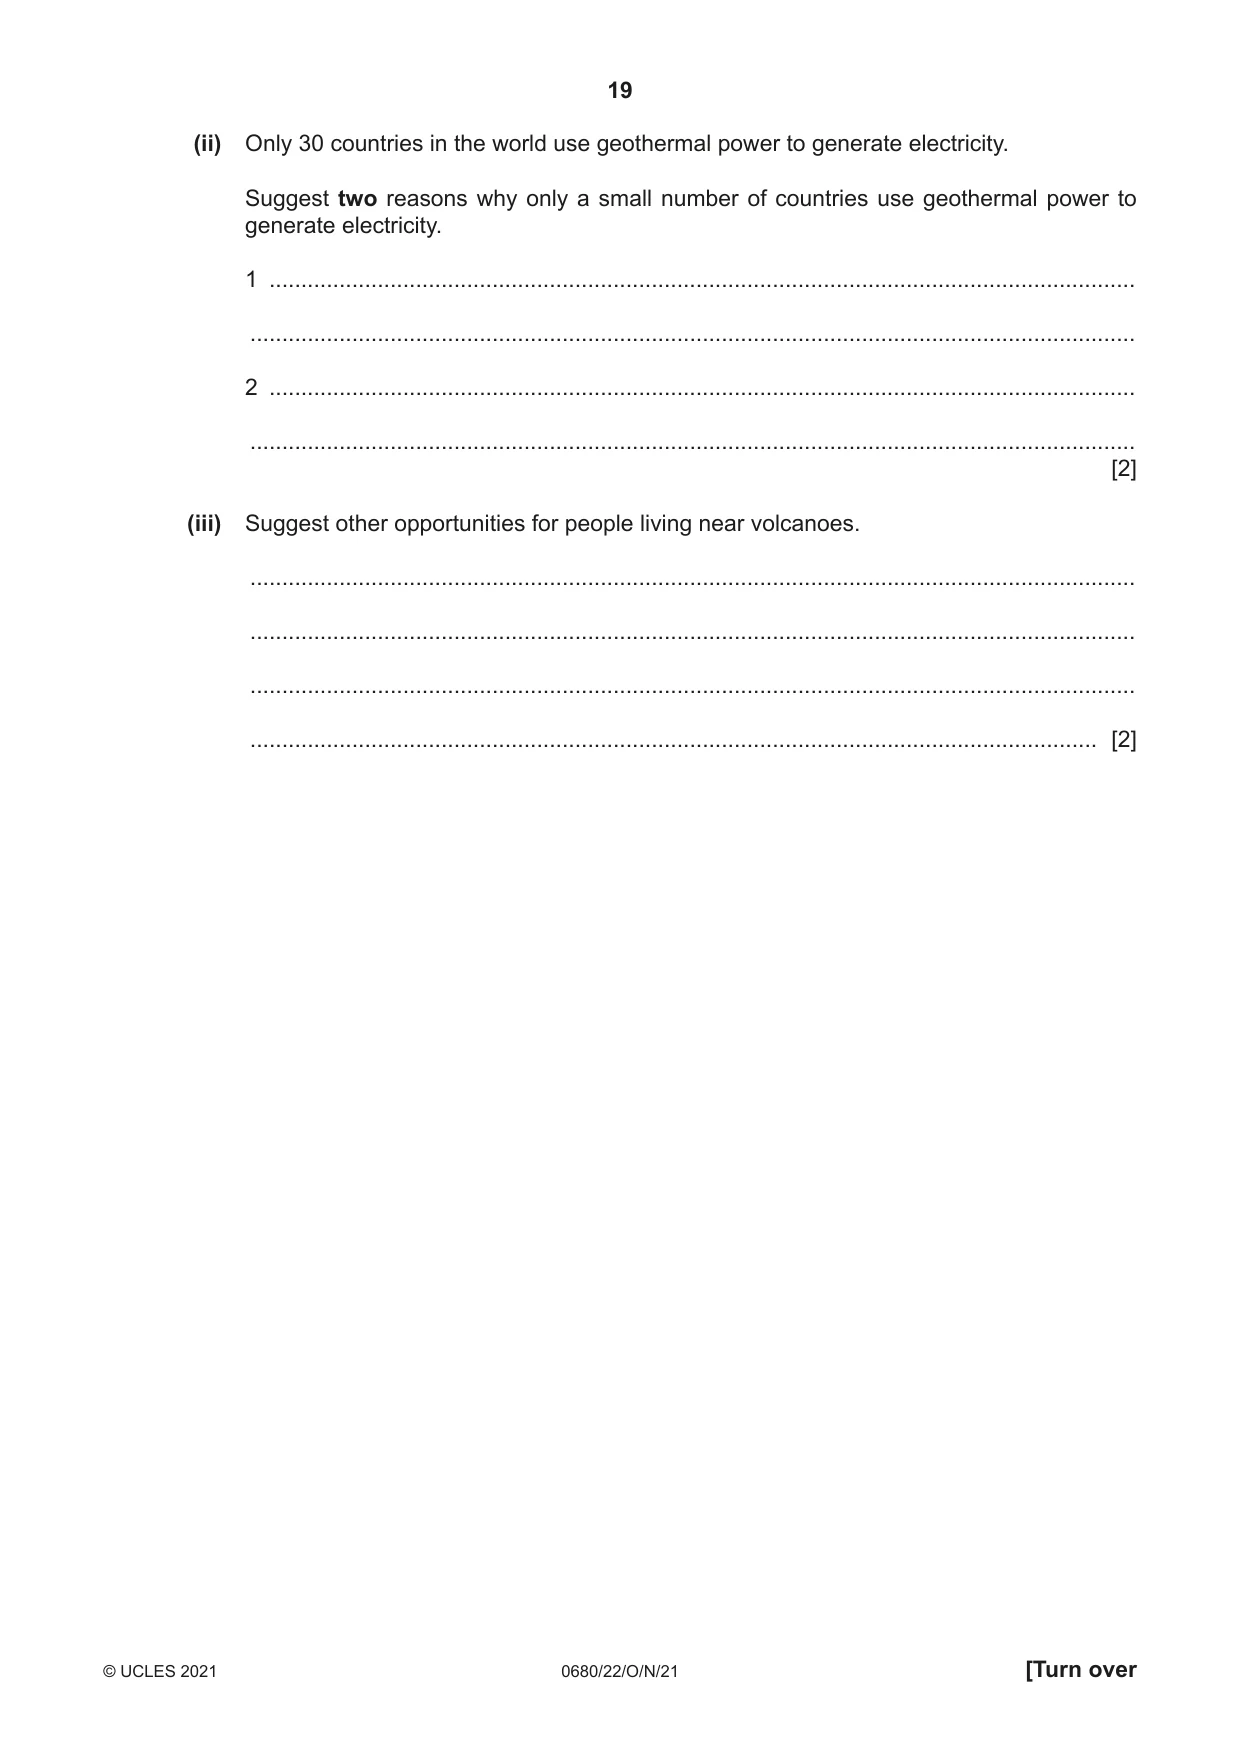
3 (a) The photograph shows the Arenal Volcano and the town of La Fortuna in Costa Rica. For nearly 500 years, the Arenal Volcano was dormant. In 1968, it erupted. Over 15 km2 of land was completely buried with rocks and lava. An area of 232 km2 was covered by ash. Three villages on the west side of the volcano were buried and 87 people were killed. The table shows the human population in the Arenal region in 2019. distance from the Arenal Volcano population / km < 5 3 429 5–10 15 643 11–30 96 512 31–100 3 027 485 (i) Suggest economic impacts for people living in the Arenal region if the Arenal Volcano erupts again. ........................................................................................................................................... ........................................................................................................................................... ........................................................................................................................................... ........................................................................................................................................... ........................................................................................................................................... ........................................................................................................................................... ........................................................................................................................................... ..................................................................................................................................... [4] (ii) Costa Rica has a disaster preparation plan that will be used if the Arenal Volcano erupts again. Suggest a suitable disaster preparation plan for reducing the impact of a volcanic eruption. ........................................................................................................................................... ........................................................................................................................................... ........................................................................................................................................... ........................................................................................................................................... ........................................................................................................................................... ..................................................................................................................................... [3] (b) Living near a volcano can provide opportunities for people. Geothermal power is one of these opportunities. The diagram shows how geothermal power is used to generate electricity. electricity transmission lines generator pressure steam cooling reduced tower turbine ground hot water cooled at high pressure water cracks in rocks (i) Use the diagram to describe how geothermal power is used to generate electricity. ........................................................................................................................................... ........................................................................................................................................... ........................................................................................................................................... ........................................................................................................................................... ........................................................................................................................................... ........................................................................................................................................... ........................................................................................................................................... ..................................................................................................................................... [4]
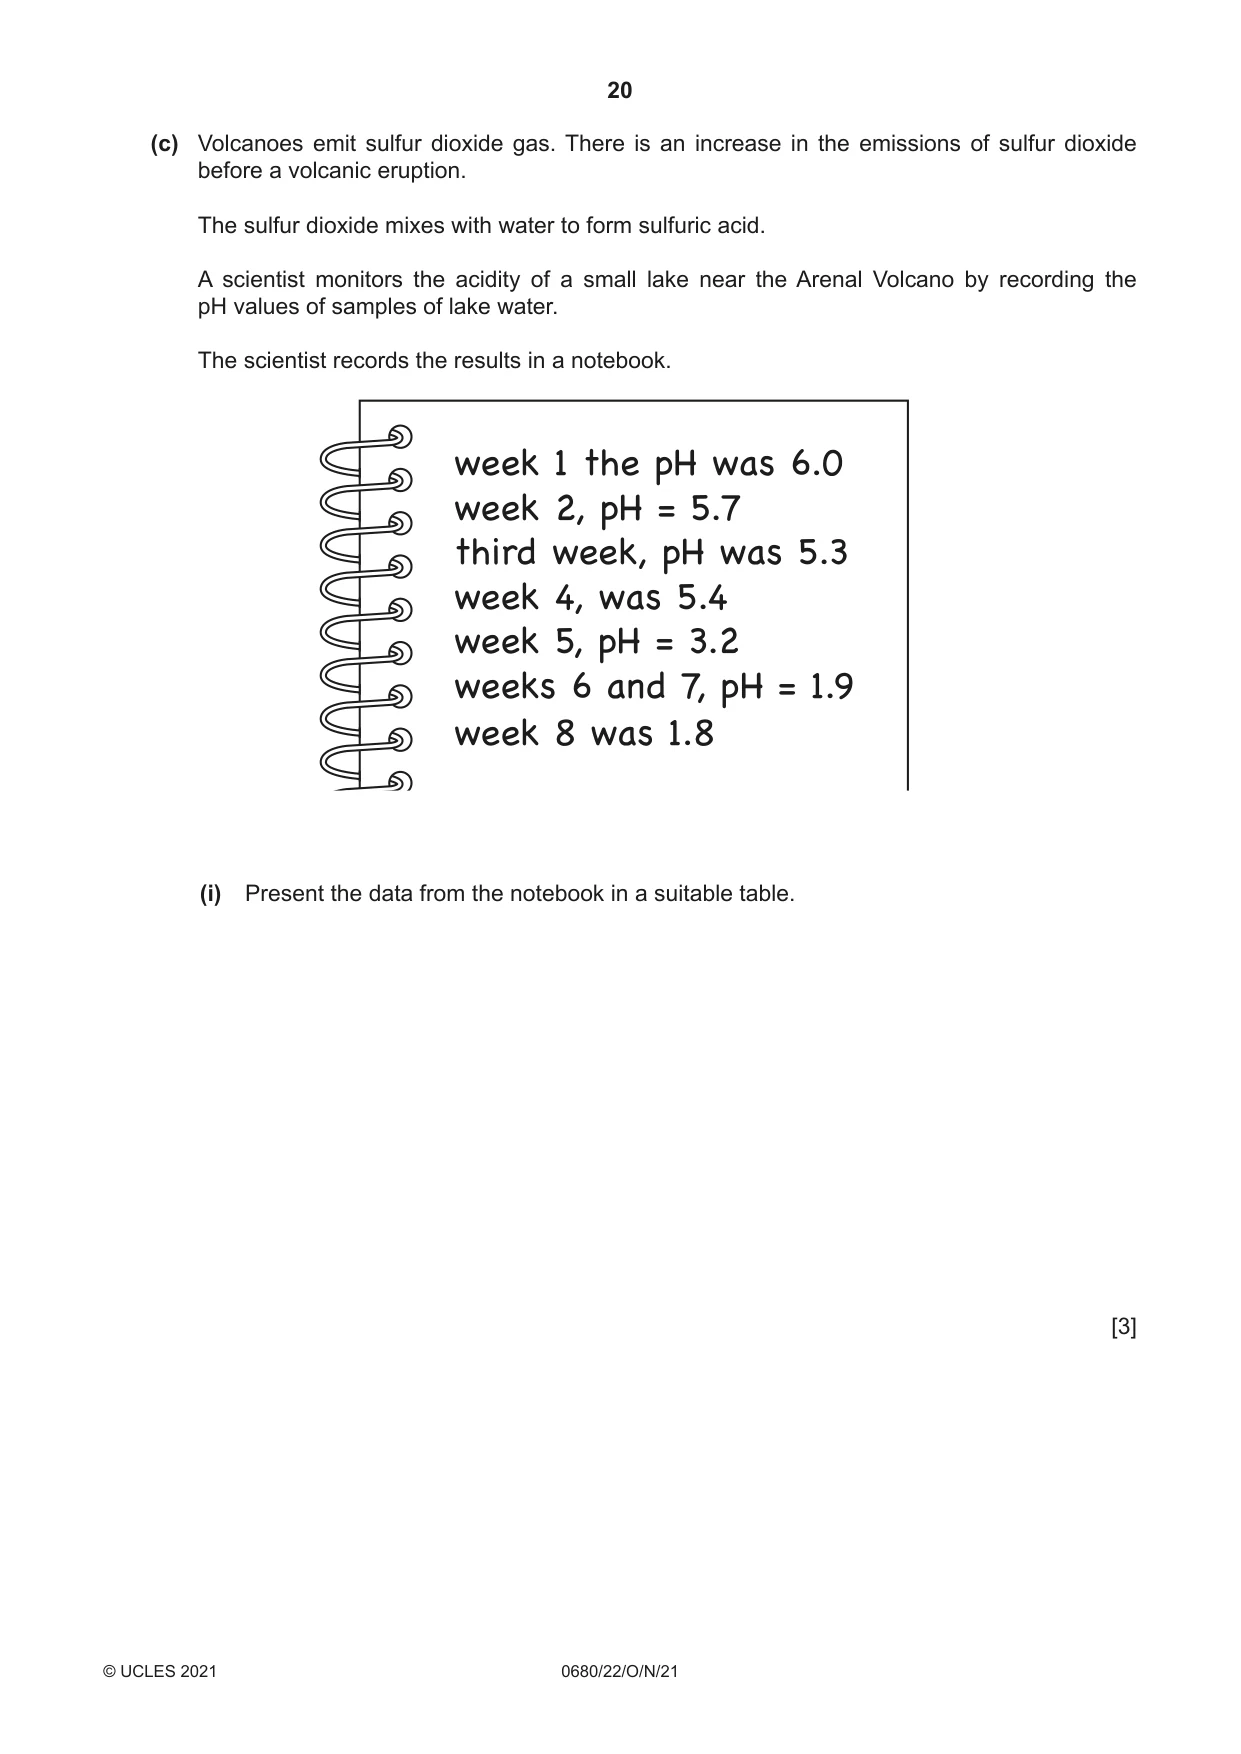
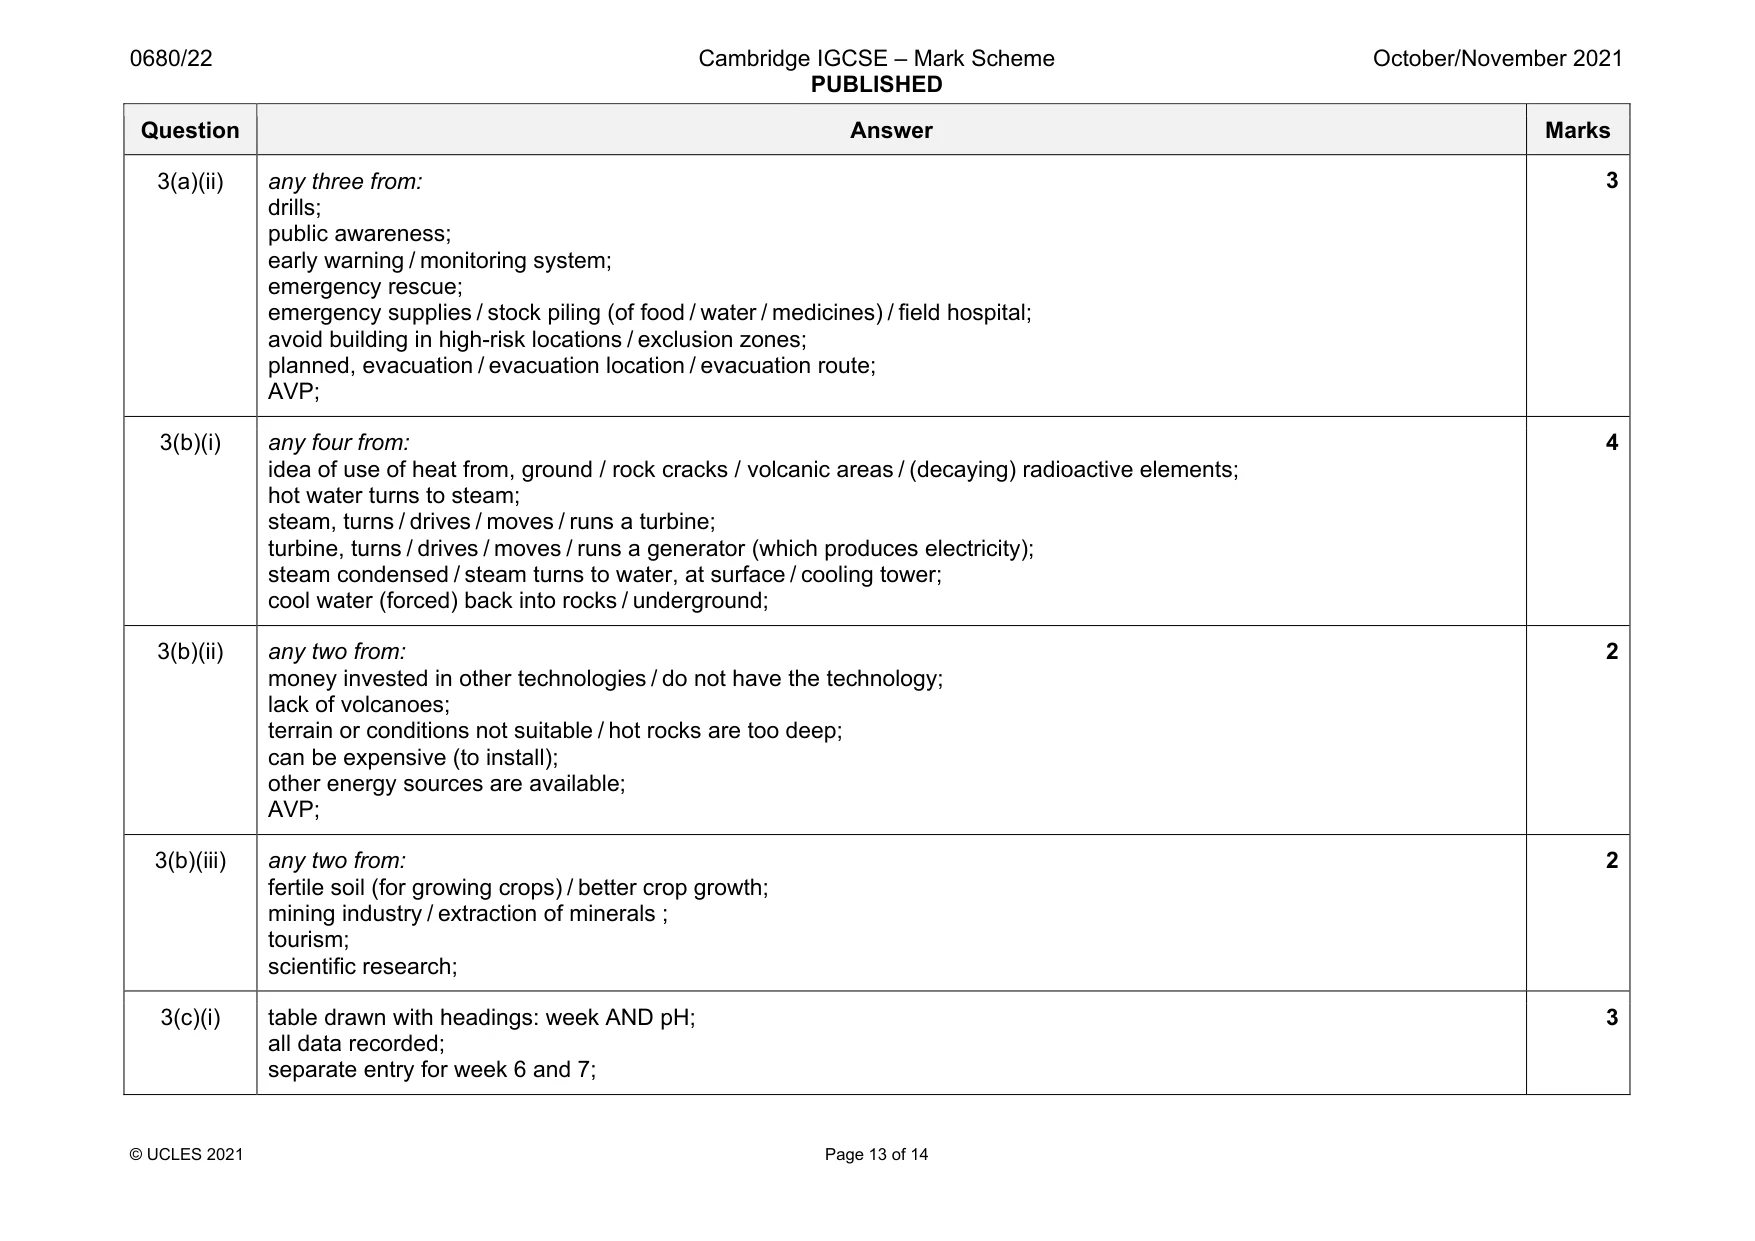
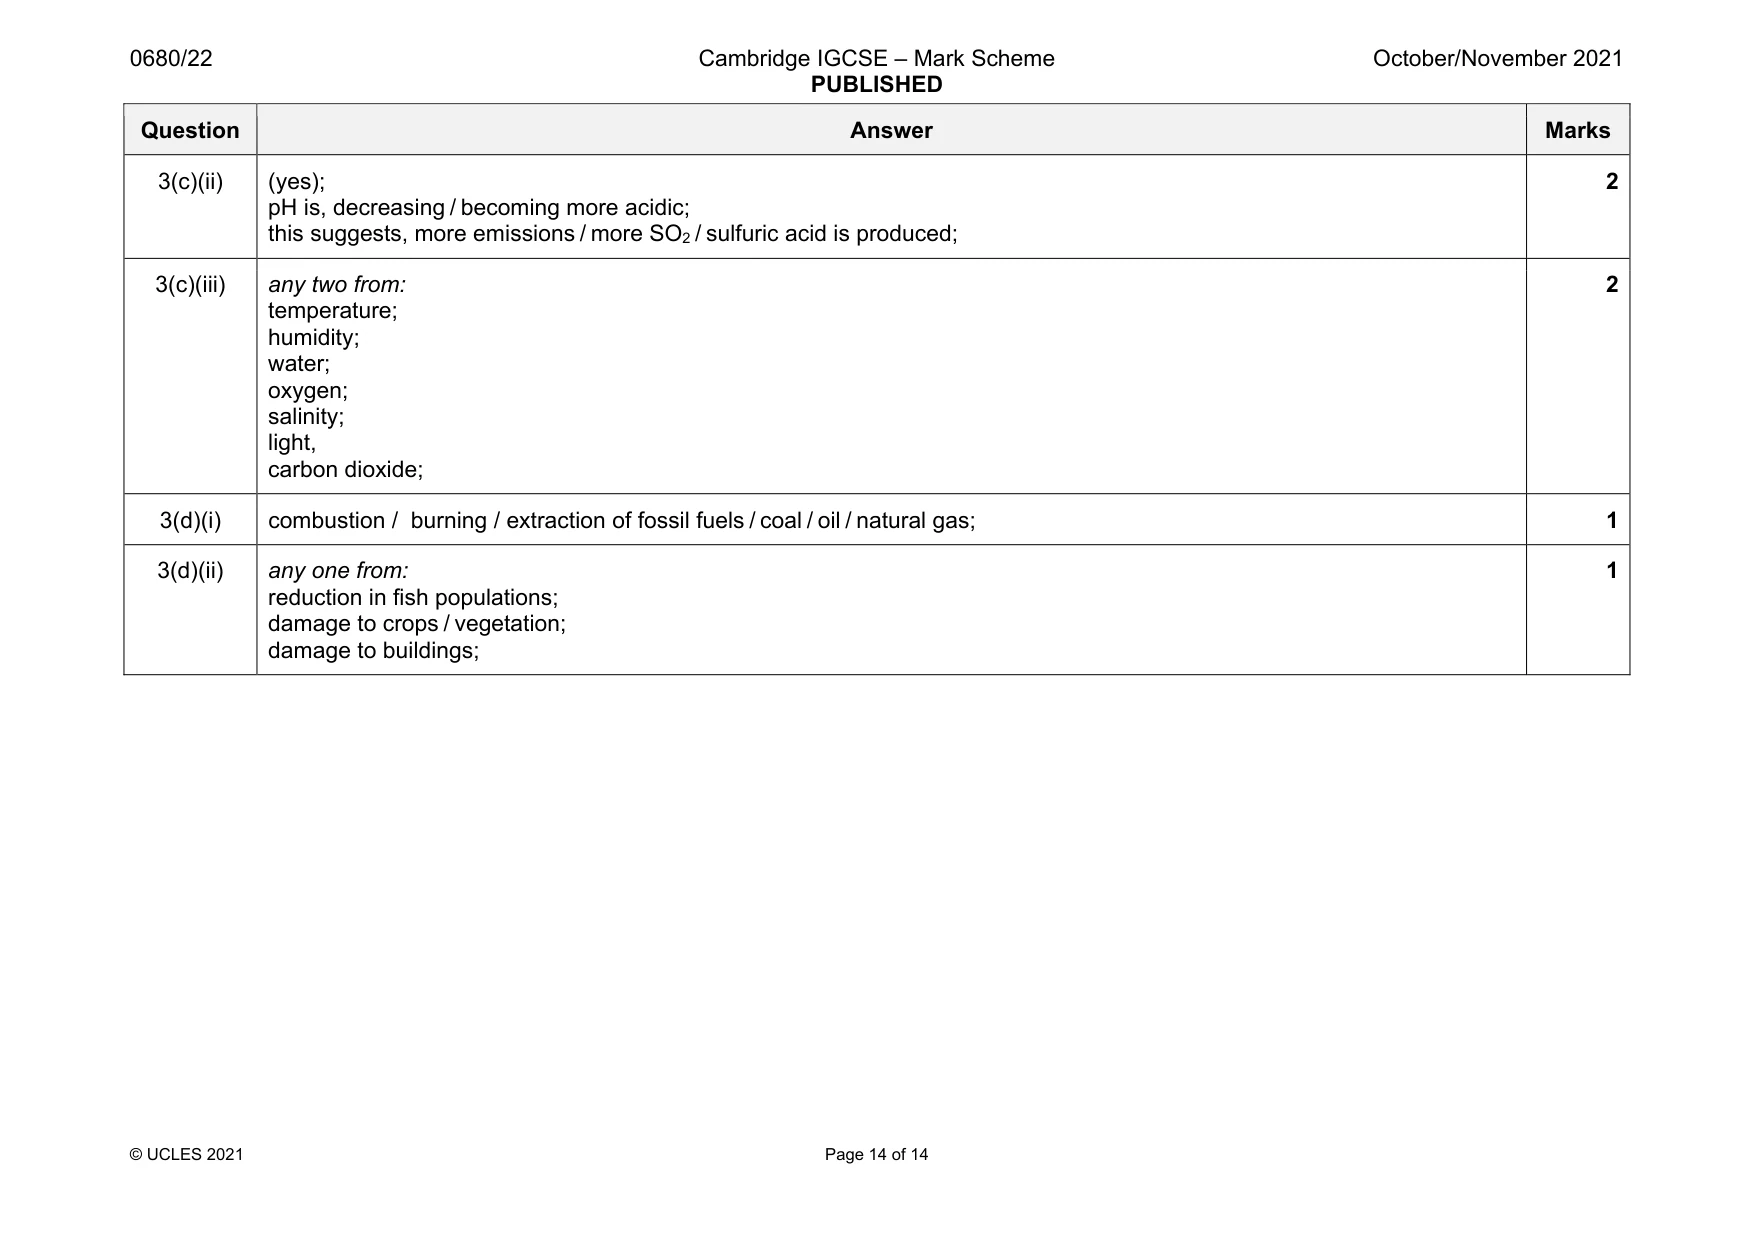
Mark scheme: 3(a)(i) any four from: damage to: buildings / loss of home; infrastructure e.g. road, hospitals; (farm)land / food / livestock destroyed; area unusable for many years; (cost of) relocation; rebuild / clean-up, costs; (cost of) emergency aid / medical treatment; export / import effect / decrease in foreign investment; tourism decline; loss of trading / job loss / people not being able to go to work / business destroyed; AVP; 4 Question Answer Marks 3(a)(ii) any three from: drills; public awareness; early warning / monitoring system; emergency rescue; emergency supplies / stock piling (of food / water / medicines) / field hospital; avoid building in high-risk locations / exclusion zones; planned, evacuation / evacuation location / evacuation route; AVP; 3 3(b)(i) any four from: idea of use of heat from, ground / rock cracks / volcanic areas / (decaying) radioactive elements; hot water turns to steam; steam, turns / drives / moves / runs a turbine; turbine, turns / drives / moves / runs a generator (which produces electricity); steam condensed / steam turns to water, at surface / cooling tower; cool water (forced) back into rocks / underground; 4 3(b)(ii) any two from: money invested in other technologies / do not have the technology; lack of volcanoes; terrain or conditions not suitable / hot rocks are too deep; can be expensive (to install); other energy sources are available; AVP; 2 3(b)(iii) any two from: fertile soil (for growing crops) / better crop growth; mining industry / extraction of minerals ; tourism; scientific research; 2 3(c)(i) table drawn with headings: week AND pH; all data recorded; separate entry for week 6 and 7; 3 Question Answer Marks 3(c)(ii) (yes); pH is, decreasing / becoming more acidic; this suggests, more emissions / more SO2 / sulfuric acid is produced; 2 3(c)(iii) any two from: temperature; humidity; water; oxygen; salinity; light, carbon dioxide; 2 3(d)(i) combustion / burning / extraction of fossil fuels / coal / oil / natural gas; 1 3(d)(ii) any one from: reduction in fish populations; damage to crops / vegetation; damage to buildings; 1
What was in this paper
The subtopics covered by these 3 questions, and how many questions each got. Open one in a new tab to see every Cambridge question on it.
What you needed in this session
Cambridge’s own grade thresholds for 2021 Oct/Nov, Paper 2 · Variant 2. A higher threshold means an easier paper — the bar moves with how the cohort did.