Cambridge IGCSE Environmental Management 0680 — 2021 Oct/Nov Paper 2 · Variant 1
0680/21/O/N/21 · 3 questions · 80 marks · ≈90 min
The question paper and its mark scheme, free to read here and free to download. This is Cambridge’s own paper, exactly as it was sat.
Question paper24 pages






Mark scheme12 pages
Answers below. Sit the paper first if you are practising.
Questions as text
Q1 · The graph shows the population of Costa Rica from 1950 to 2019
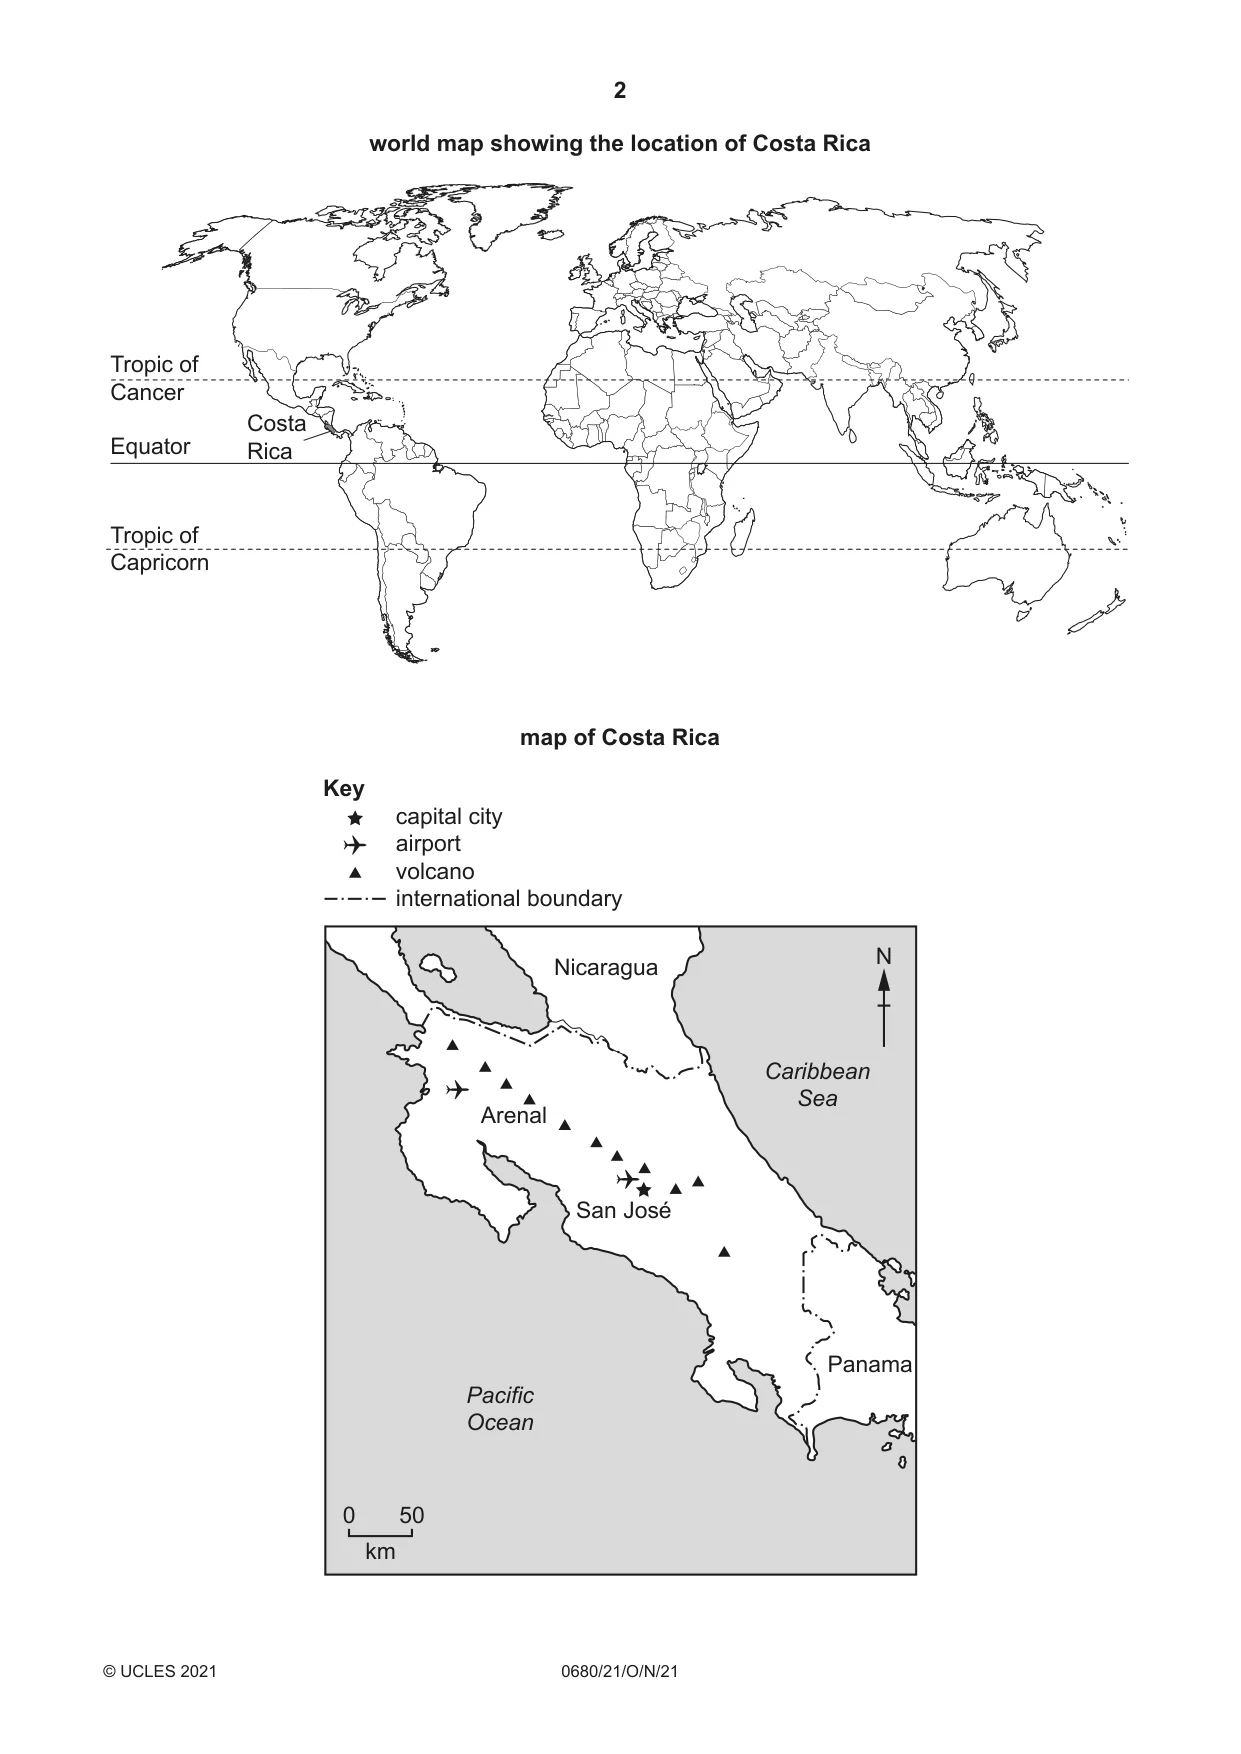
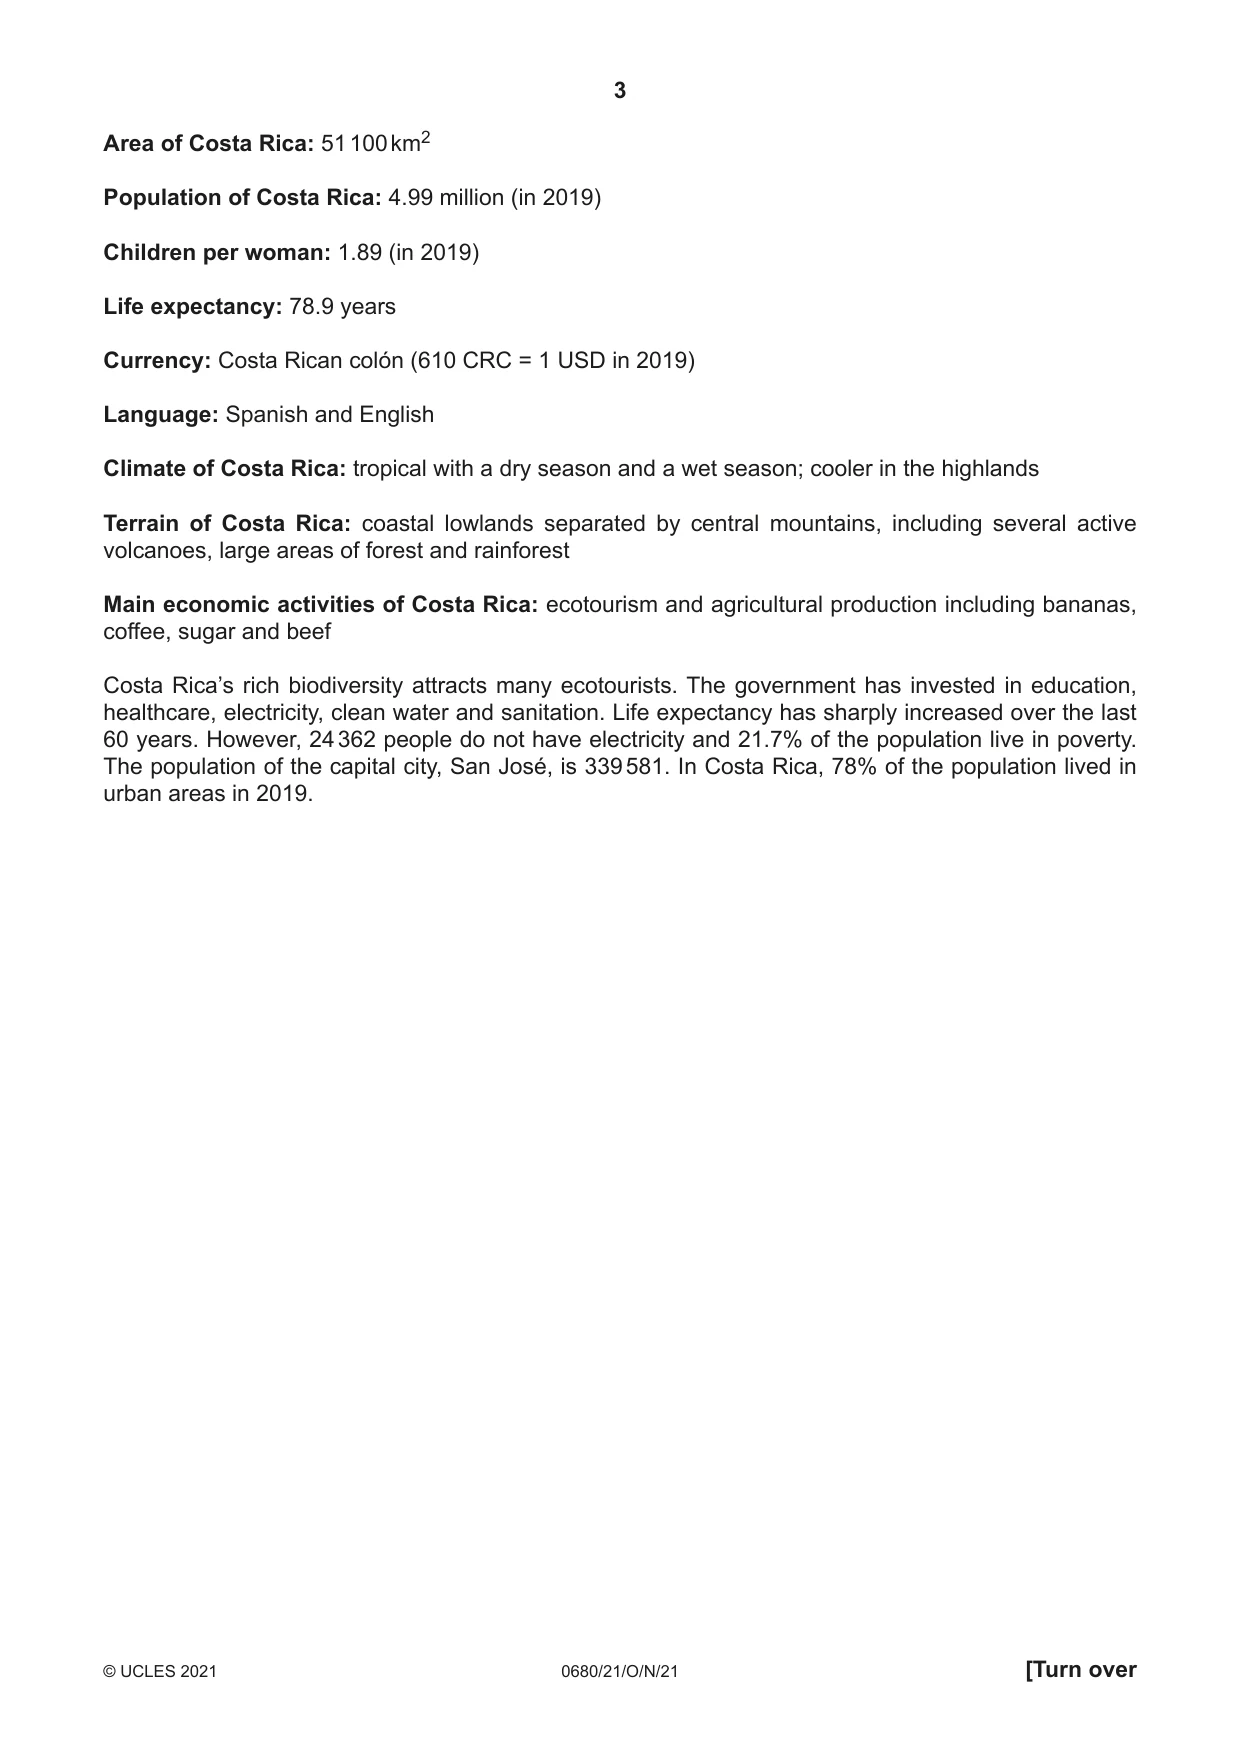
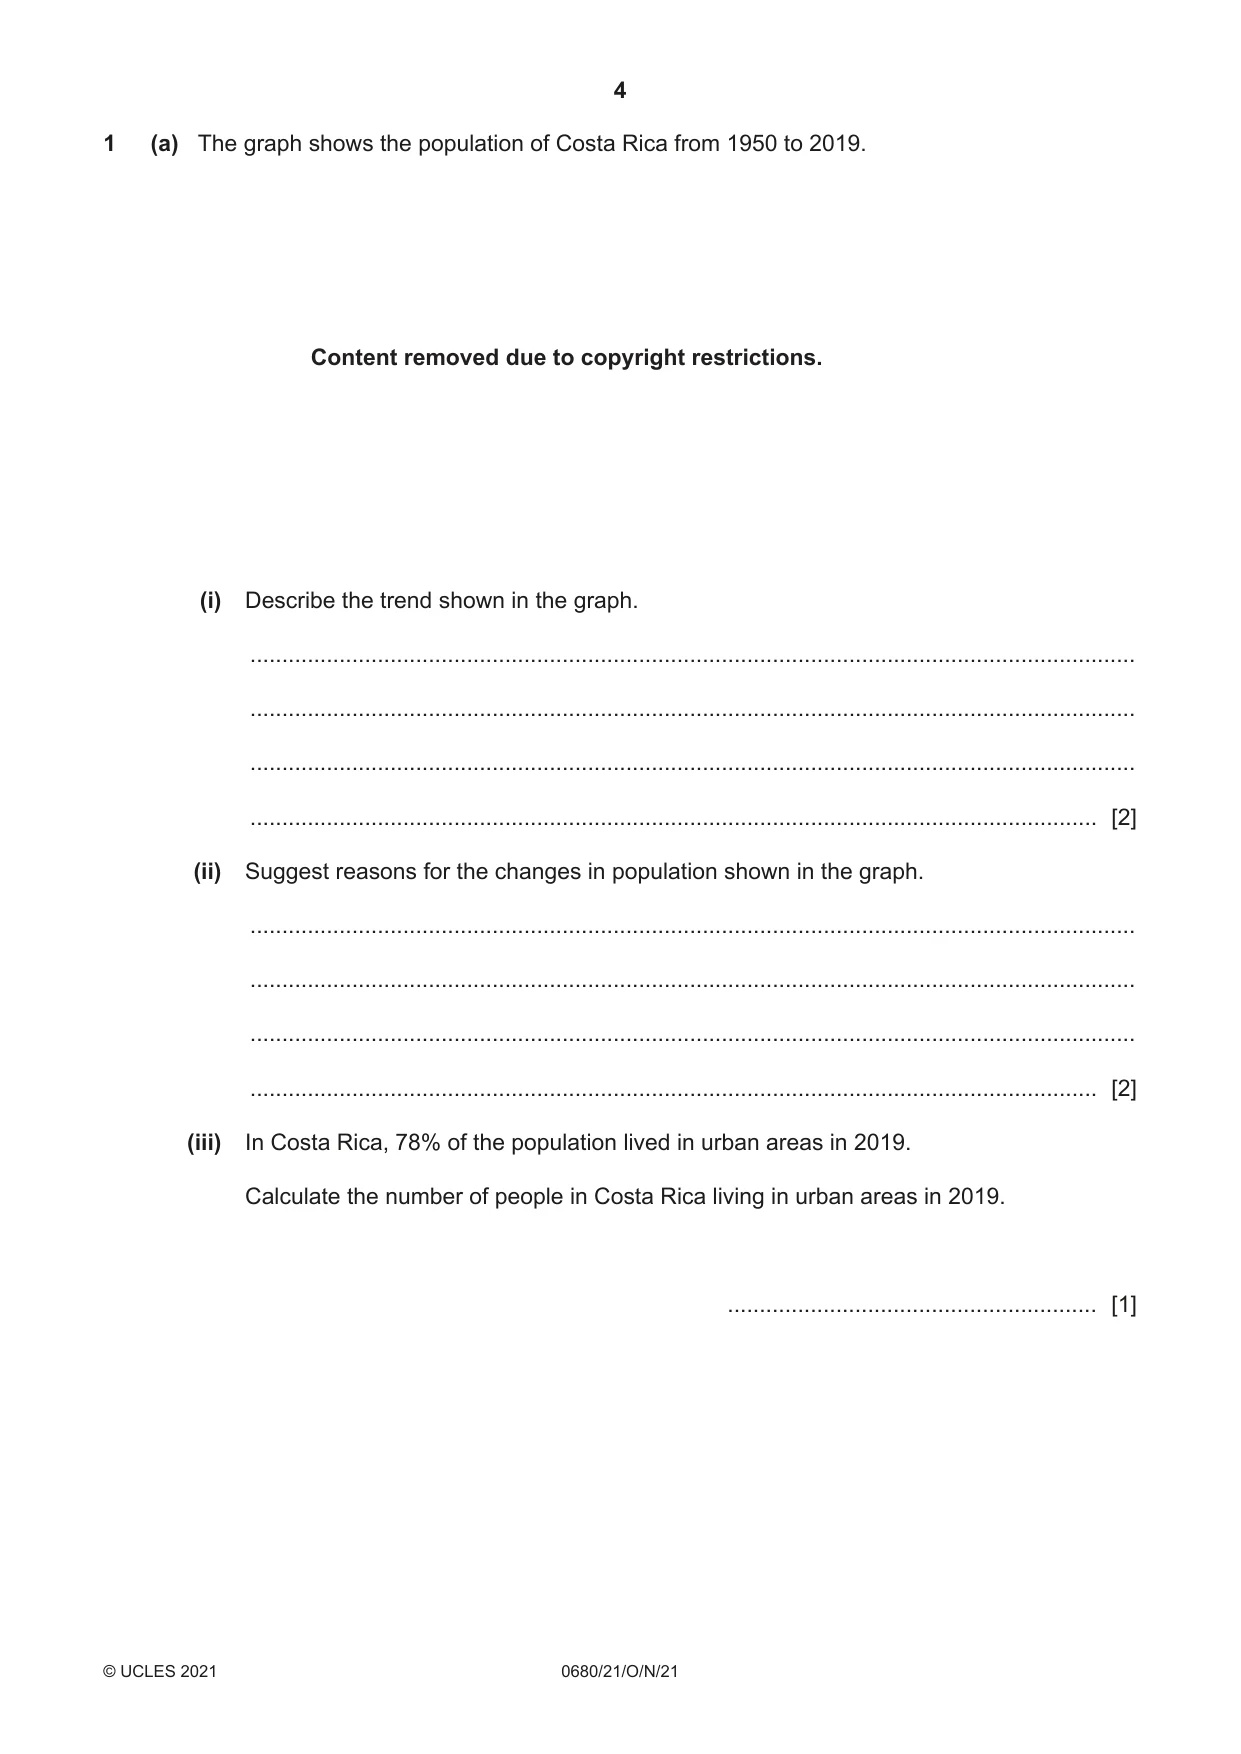
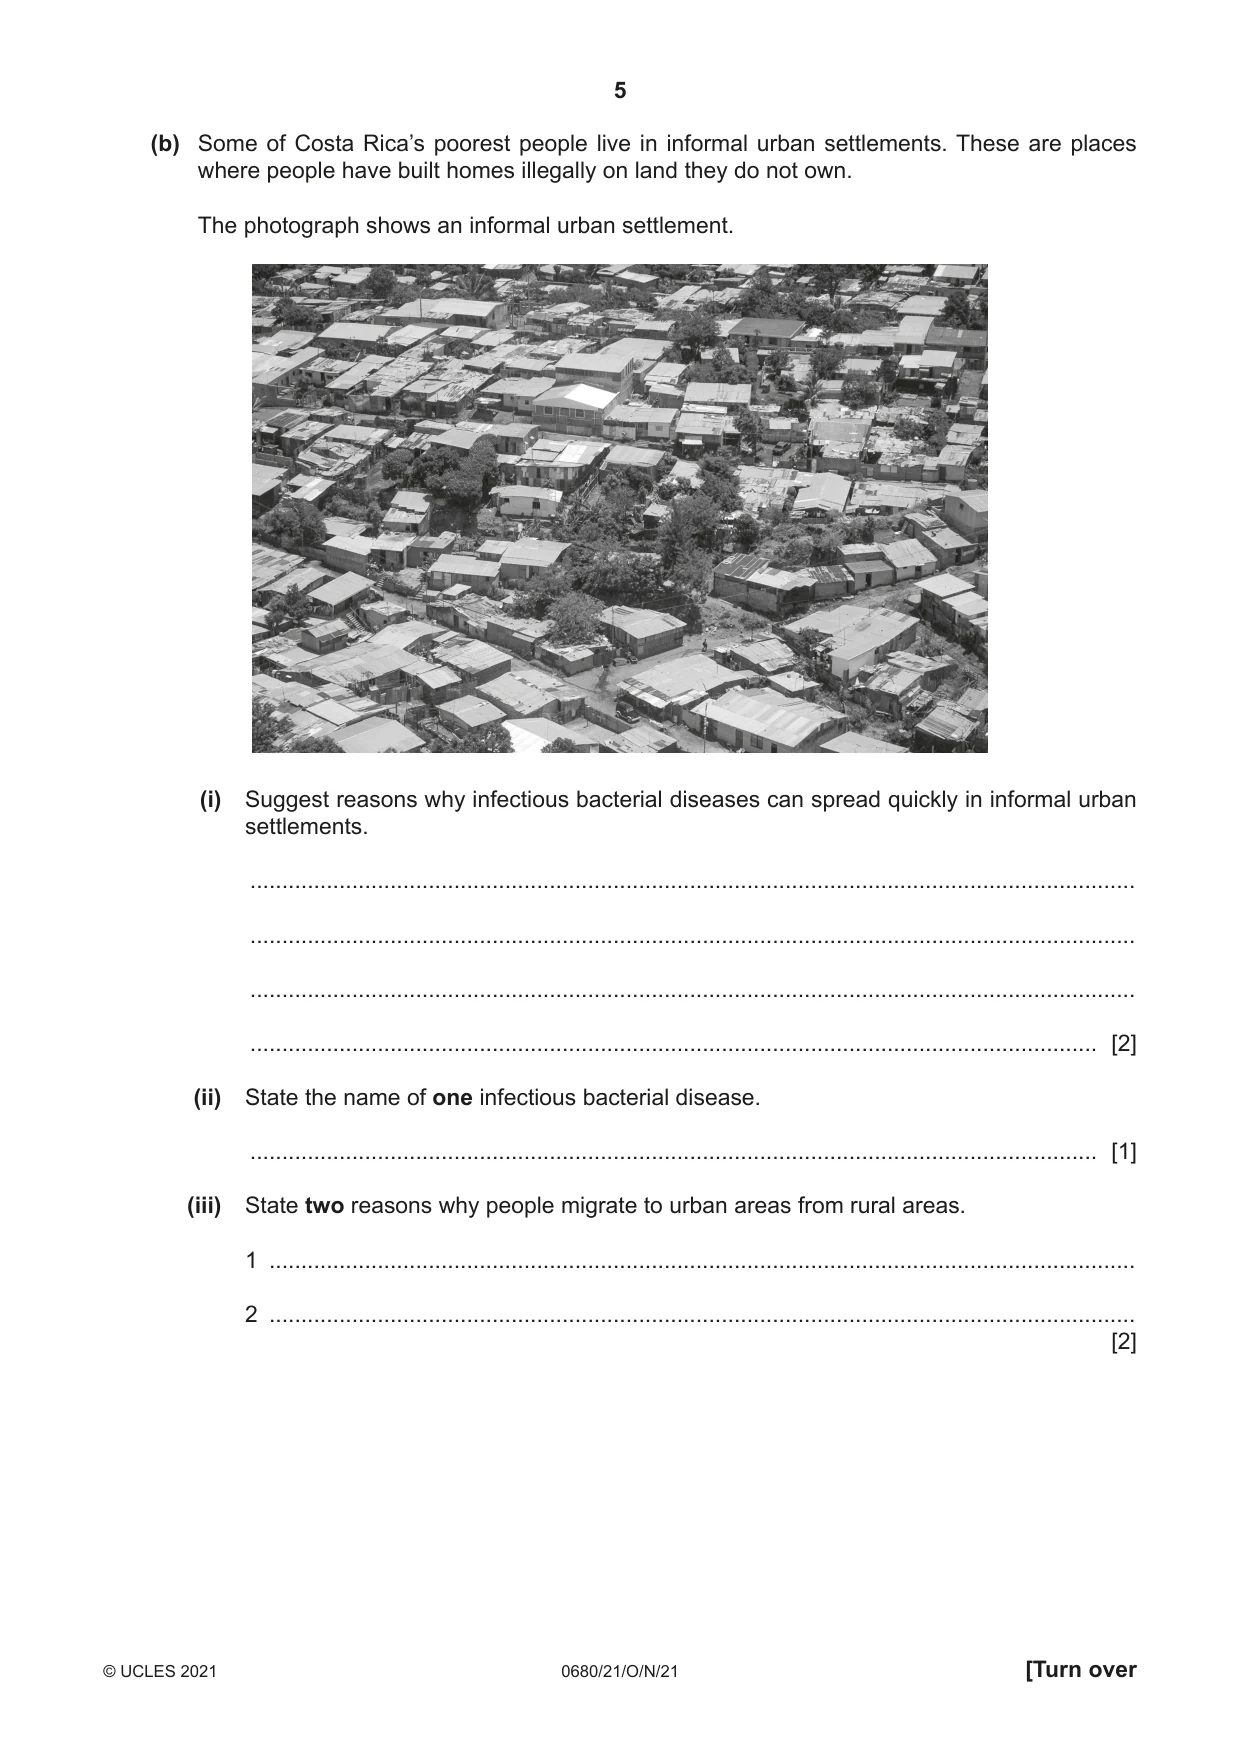
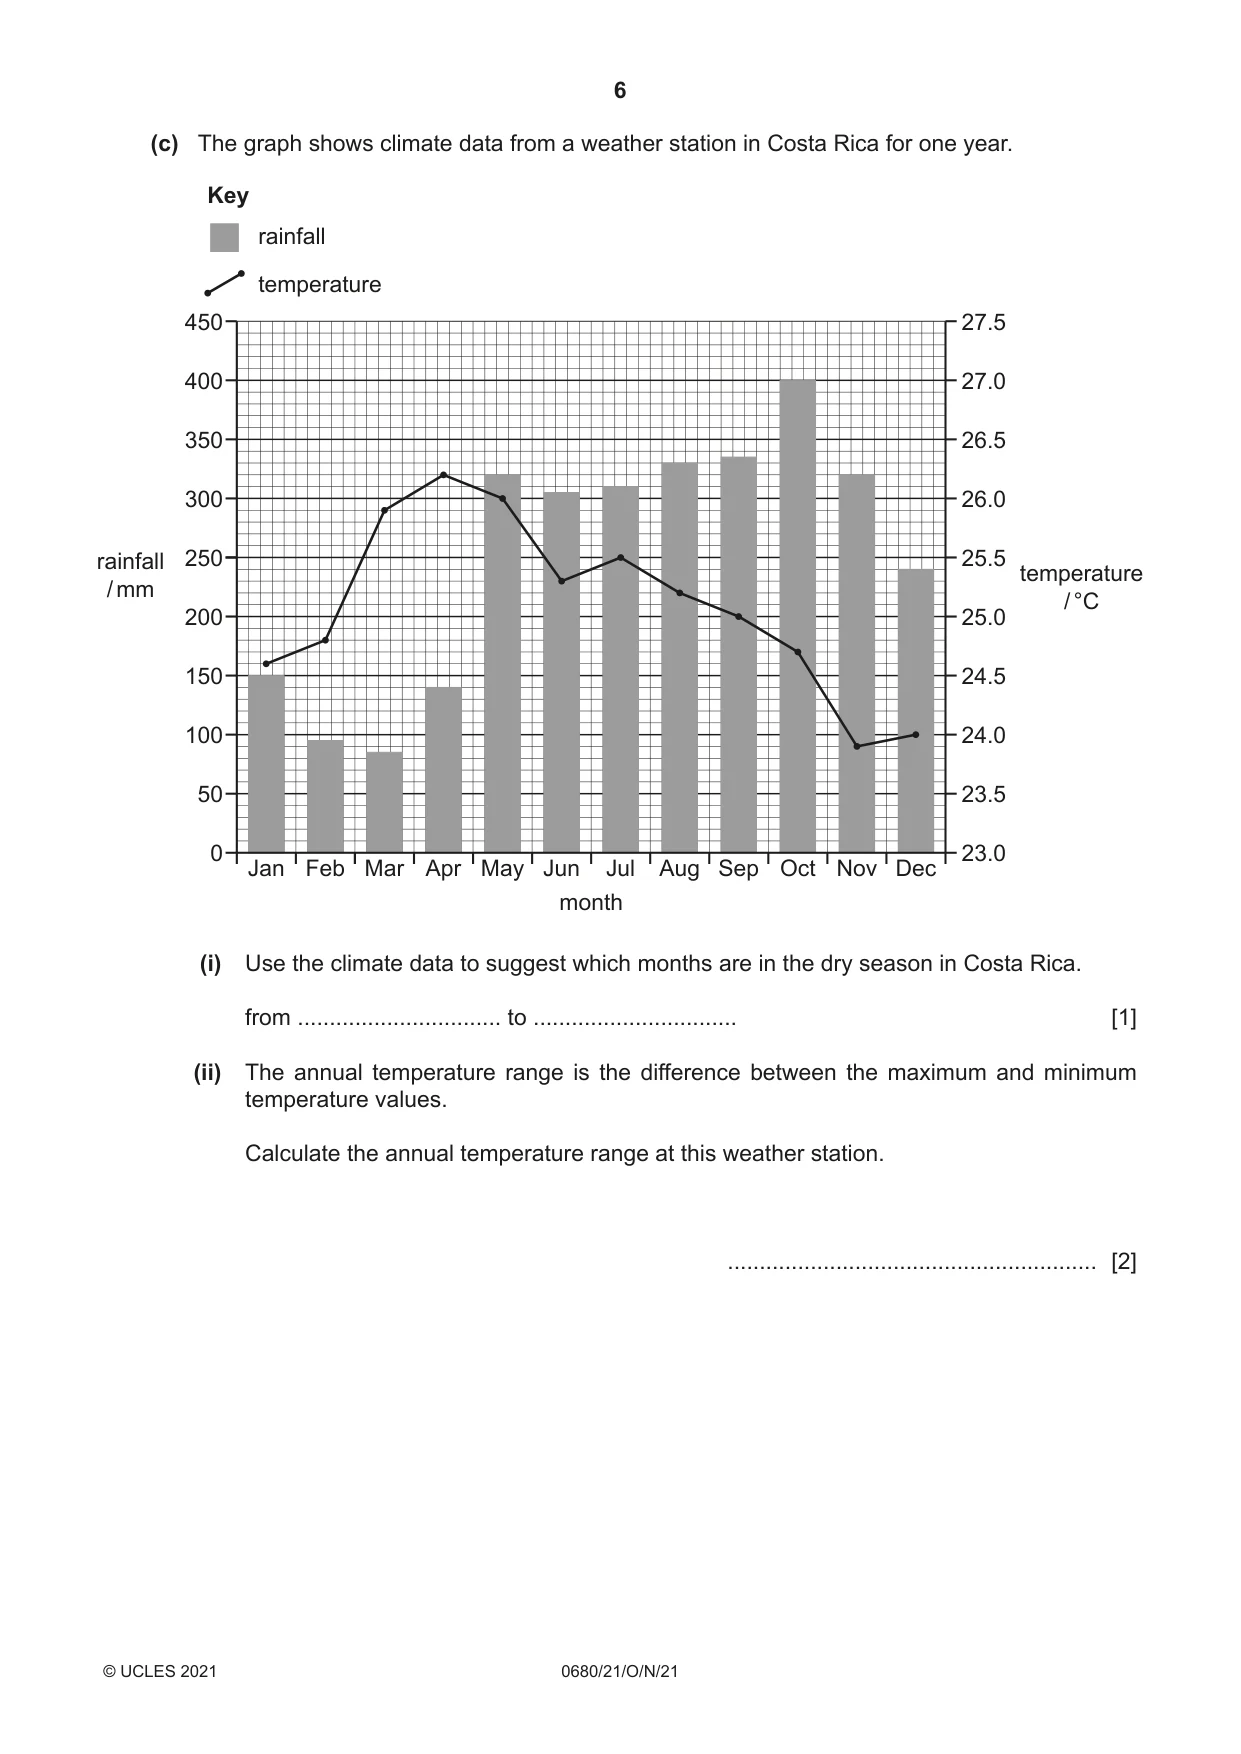
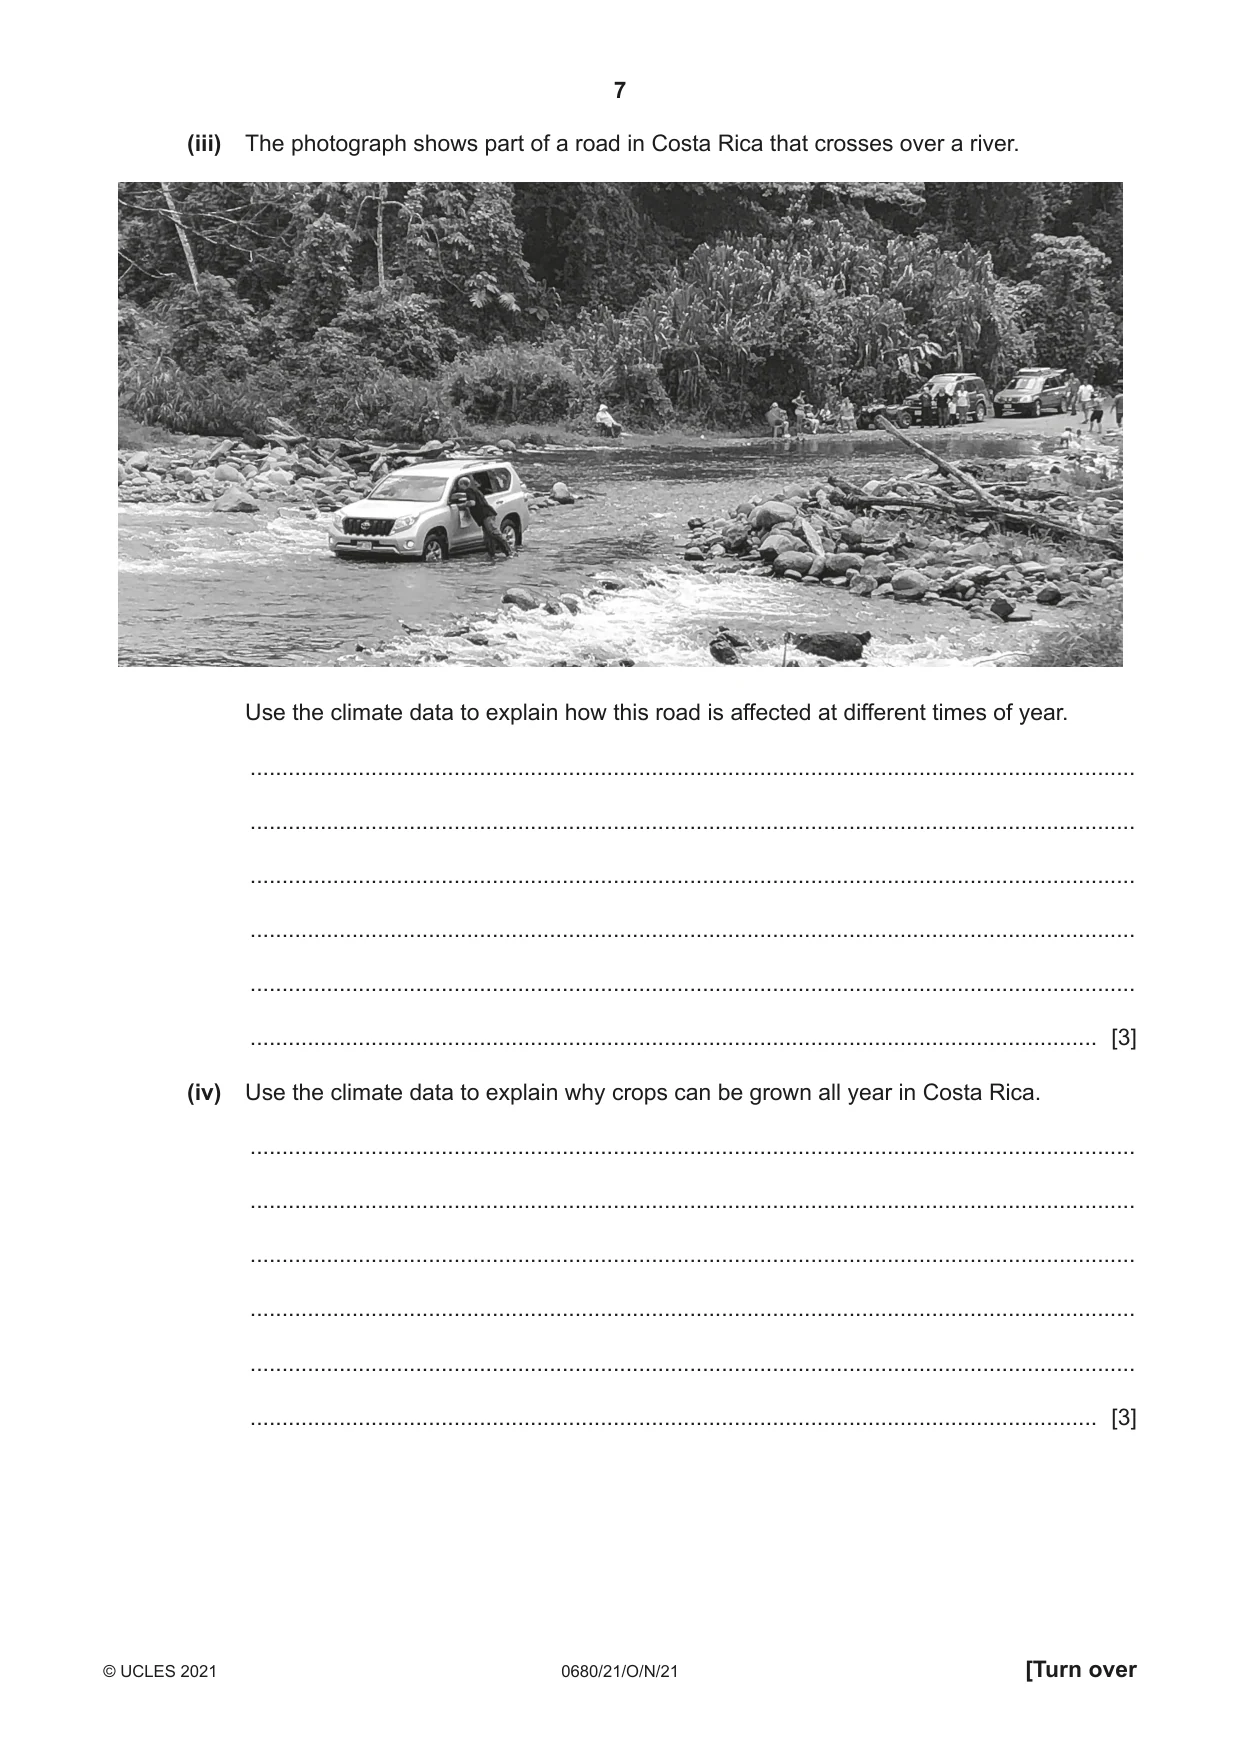
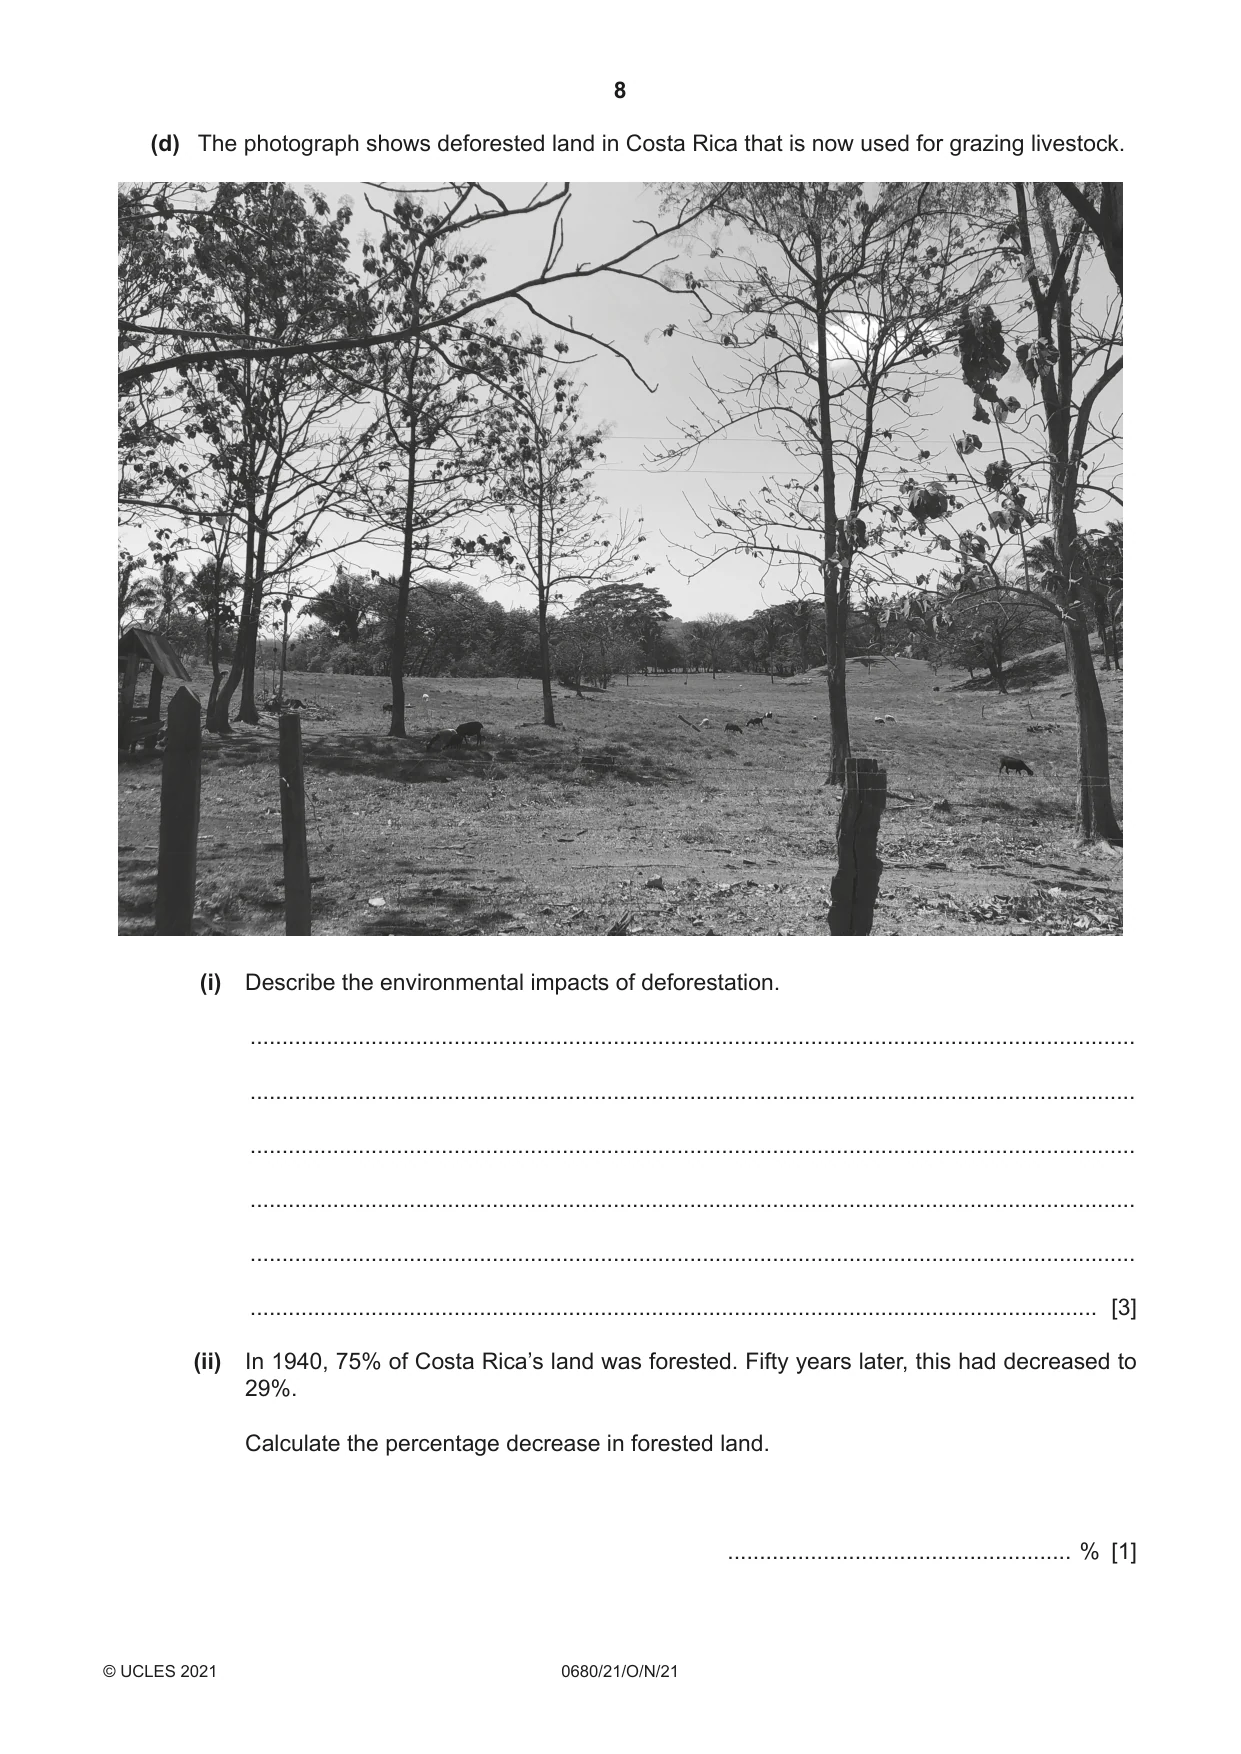
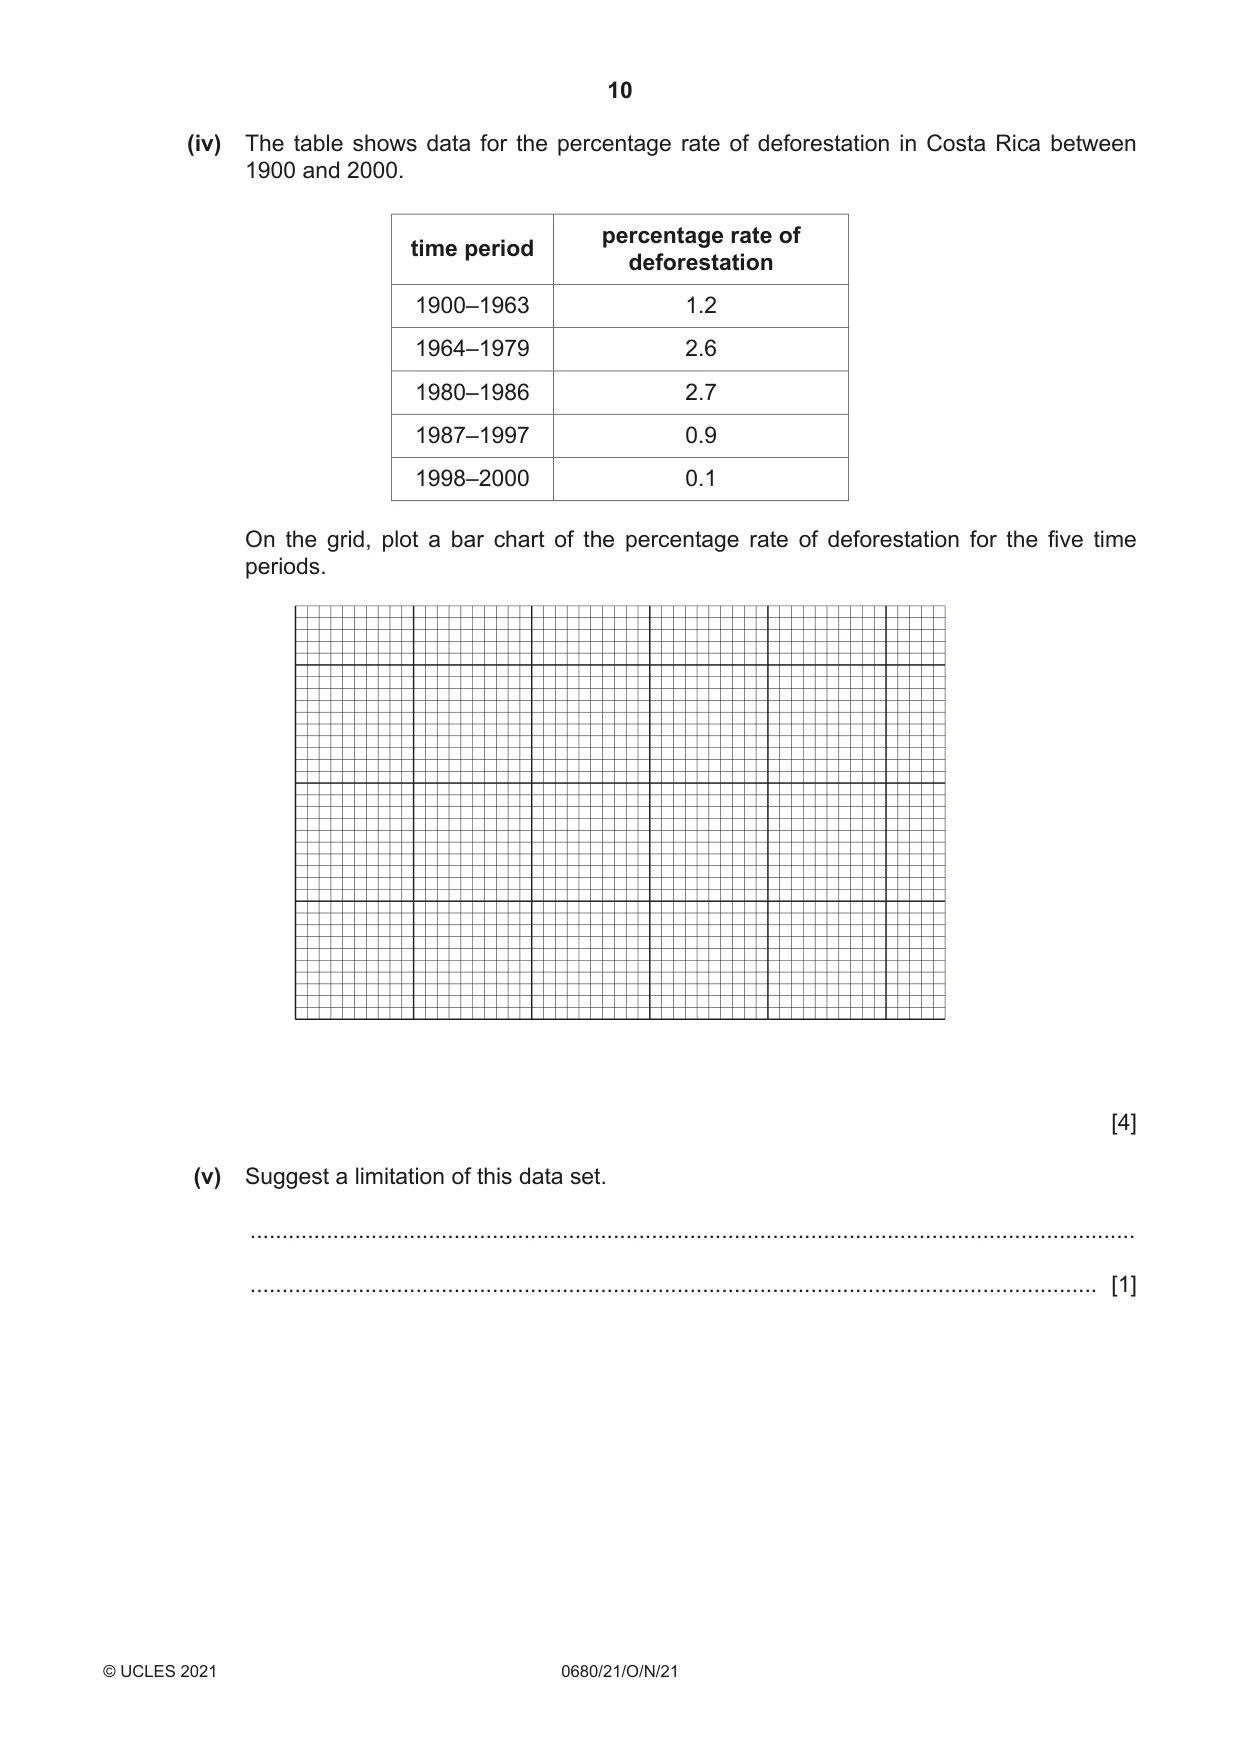
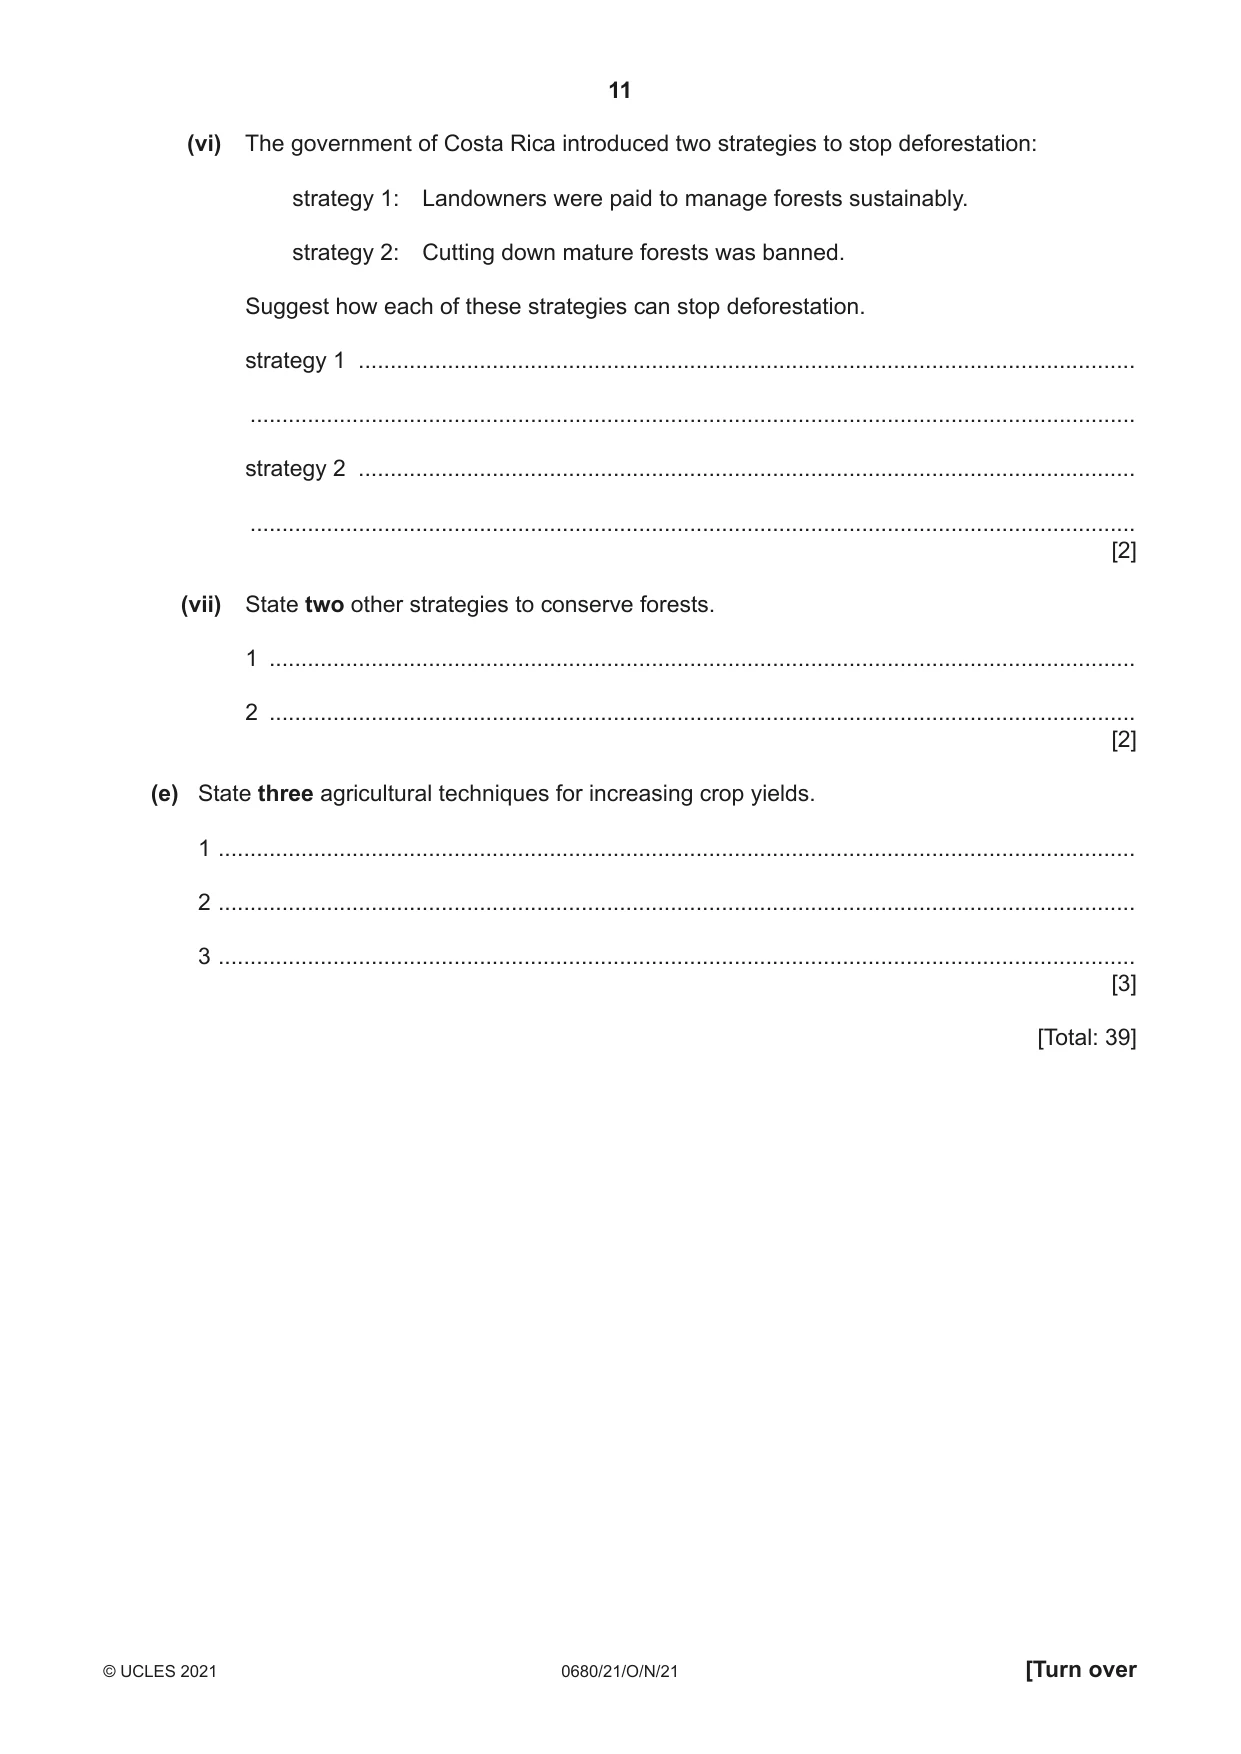
1 (a) The graph shows the population of Costa Rica from 1950 to 2019. Content removed due to copyright restrictions. (i) Describe the trend shown in the graph. ........................................................................................................................................... ........................................................................................................................................... ........................................................................................................................................... ..................................................................................................................................... [2] (ii) Suggest reasons for the changes in population shown in the graph. ........................................................................................................................................... ........................................................................................................................................... ........................................................................................................................................... ..................................................................................................................................... [2] (iii) In Costa Rica, 78% of the population lived in urban areas in 2019. Calculate the number of people in Costa Rica living in urban areas in 2019. .......................................................... [1] (b) Some of Costa Rica’s poorest people live in informal urban settlements. These are places where people have built homes illegally on land they do not own. The photograph shows an informal urban settlement. (i) Suggest reasons why infectious bacterial diseases can spread quickly in informal urban settlements. ........................................................................................................................................... ........................................................................................................................................... ........................................................................................................................................... ..................................................................................................................................... [2] (ii) State the name of one infectious bacterial disease. ..................................................................................................................................... [1] (iii) State two reasons why people migrate to urban areas from rural areas. 1 ........................................................................................................................................ 2 ........................................................................................................................................ [2] (c) The graph shows climate data from a weather station in Costa Rica for one year. Key rainfall temperature 450 27.5 400 27.0 350 26.5 300 26.0 rainfall 250 25.5 temperature / mm / °C 200 25.0 150 24.5 100 24.0 50 23.5 0 23.0 Jan Feb Mar Apr May Jun Jul Aug Sep Oct Nov Dec month (i) Use the climate data to suggest which months are in the dry season in Costa Rica. from ................................ to ................................ [1] (ii) The annual temperature range is the difference between the maximum and minimum temperature values. Calculate the annual temperature range at this weather station. .......................................................... [2] (iii) The photograph shows part of a road in Costa Rica that crosses over a river. Use the climate data to explain how this road is affected at different times of year. ........................................................................................................................................... ........................................................................................................................................... ........................................................................................................................................... ........................................................................................................................................... ........................................................................................................................................... ..................................................................................................................................... [3] (iv) Use the climate data to explain why crops can be grown all year in Costa Rica. ........................................................................................................................................... ........................................................................................................................................... ........................................................................................................................................... ........................................................................................................................................... ........................................................................................................................................... ..................................................................................................................................... [3] (d) The photograph shows deforested land in Costa Rica that is now used for grazing livestock. (i) Describe the environmental impacts of deforestation. ........................................................................................................................................... ........................................................................................................................................... ........................................................................................................................................... ........................................................................................................................................... ........................................................................................................................................... ..................................................................................................................................... [3] (ii) In 1940, 75% of Costa Rica’s land was forested. Fifty years later, this had decreased to 29%. Calculate the percentage decrease in forested land. ...................................................... % [1] (iii) Information relevant to land use in Costa Rica between 1900 and 2000 is shown. • other countries gave farmers in Costa Rica bank loans to produce beef for export • coffee became a popular drink worldwide • bananas were exported • demand for wood increased • tourists started to visit Costa Rica Use the information to explain the causes of deforestation in Costa Rica. ........................................................................................................................................... ........................................................................................................................................... ........................................................................................................................................... ........................................................................................................................................... ........................................................................................................................................... ........................................................................................................................................... ........................................................................................................................................... ..................................................................................................................................... [4] (iv) The table shows data for the percentage rate of deforestation in Costa Rica between 1900 and 2000. percentage rate of time period deforestation 1900–1963 1.2 1964–1979 2.6 1980–1986 2.7 1987–1997 0.9 1998–2000 0.1 On the grid, plot a bar chart of the percentage rate of deforestation for the five time periods. [4] (v) Suggest a limitation of this data set. ........................................................................................................................................... ..................................................................................................................................... [1] (vi) The government of Costa Rica introduced two strategies to stop deforestation: strategy 1: Landowners were paid to manage forests sustainably. strategy 2: Cutting down mature forests was banned. Suggest how each of these strategies can stop deforestation. strategy 1 .......................................................................................................................... ........................................................................................................................................... strategy 2 .......................................................................................................................... ........................................................................................................................................... [2] (vii) State two other strategies to conserve forests. 1 ........................................................................................................................................ 2 ........................................................................................................................................ [2] (e) State three agricultural techniques for increasing crop yields. 1 ................................................................................................................................................ 2 ................................................................................................................................................ 3 ................................................................................................................................................ [3] [Total: 39]
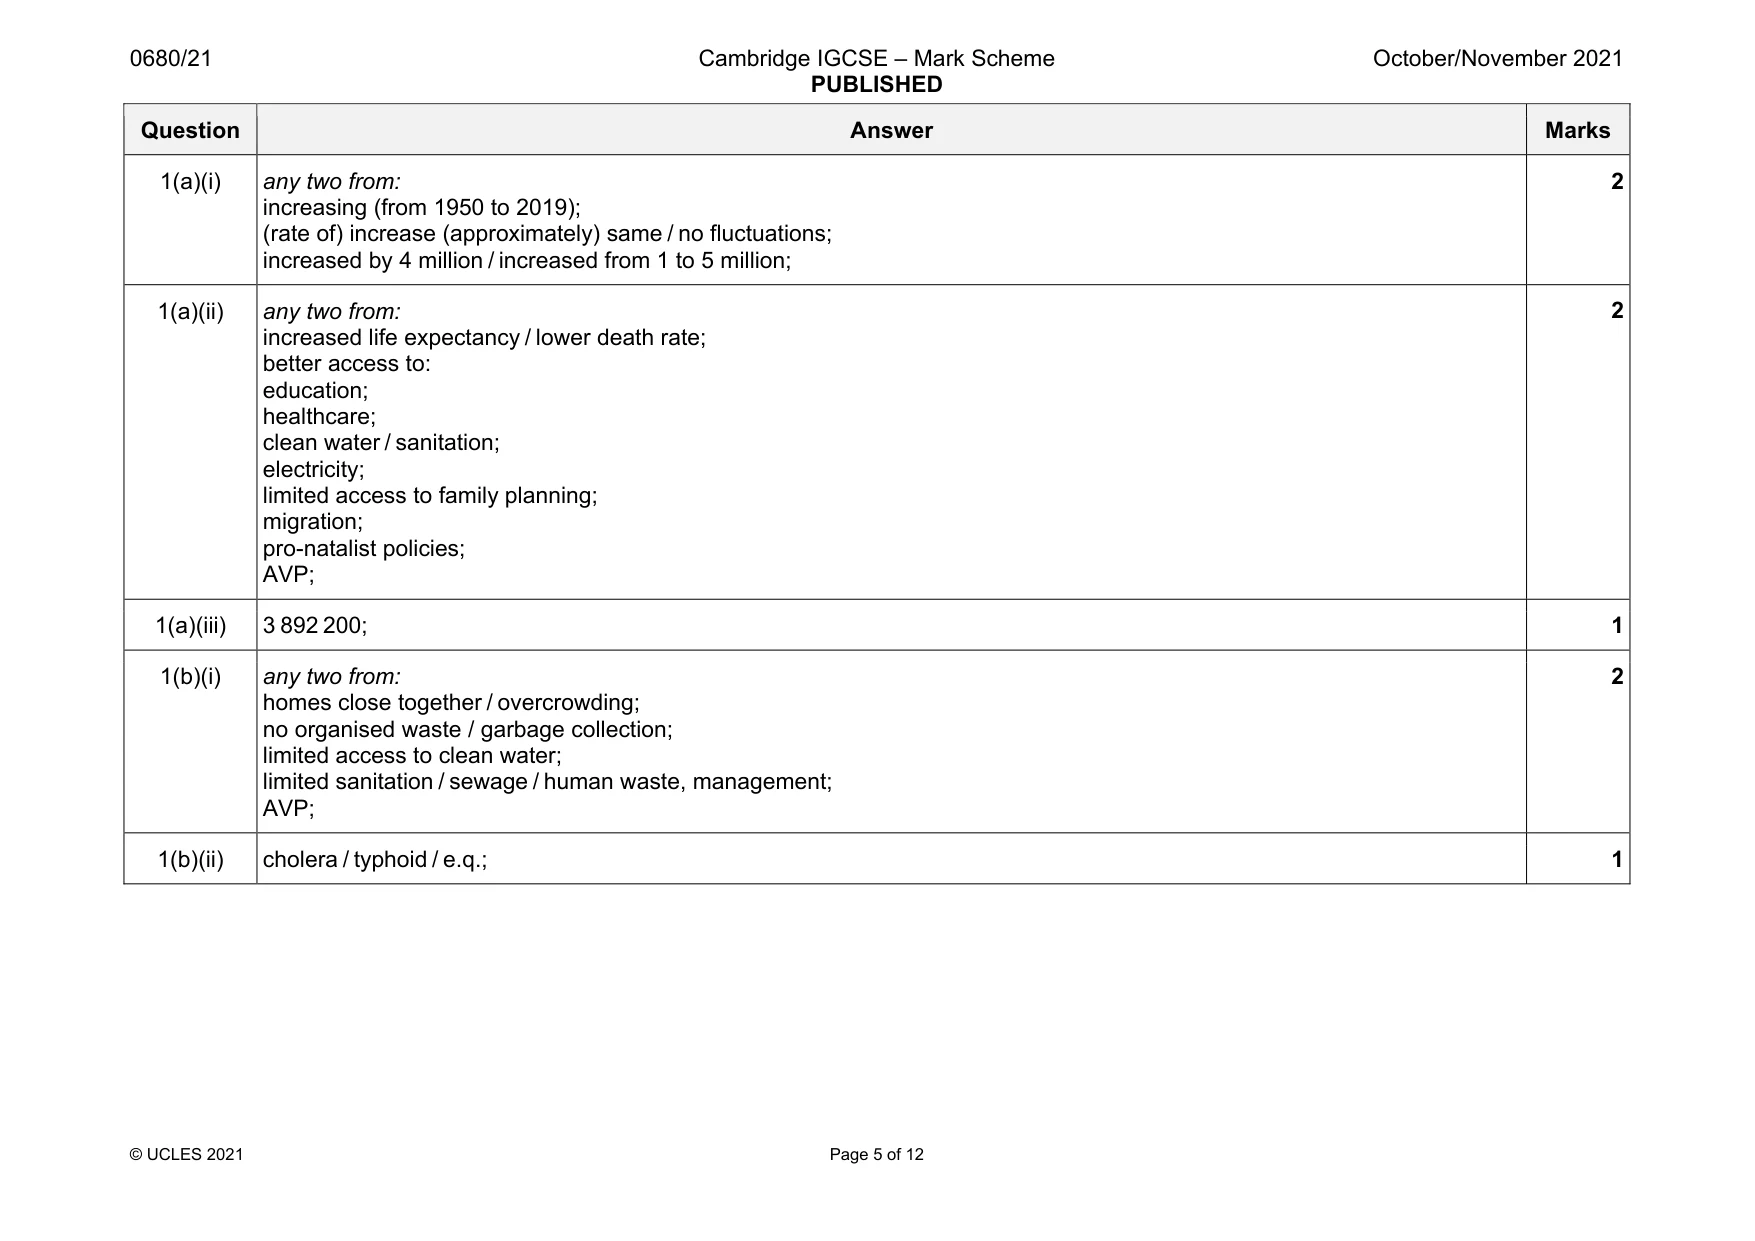
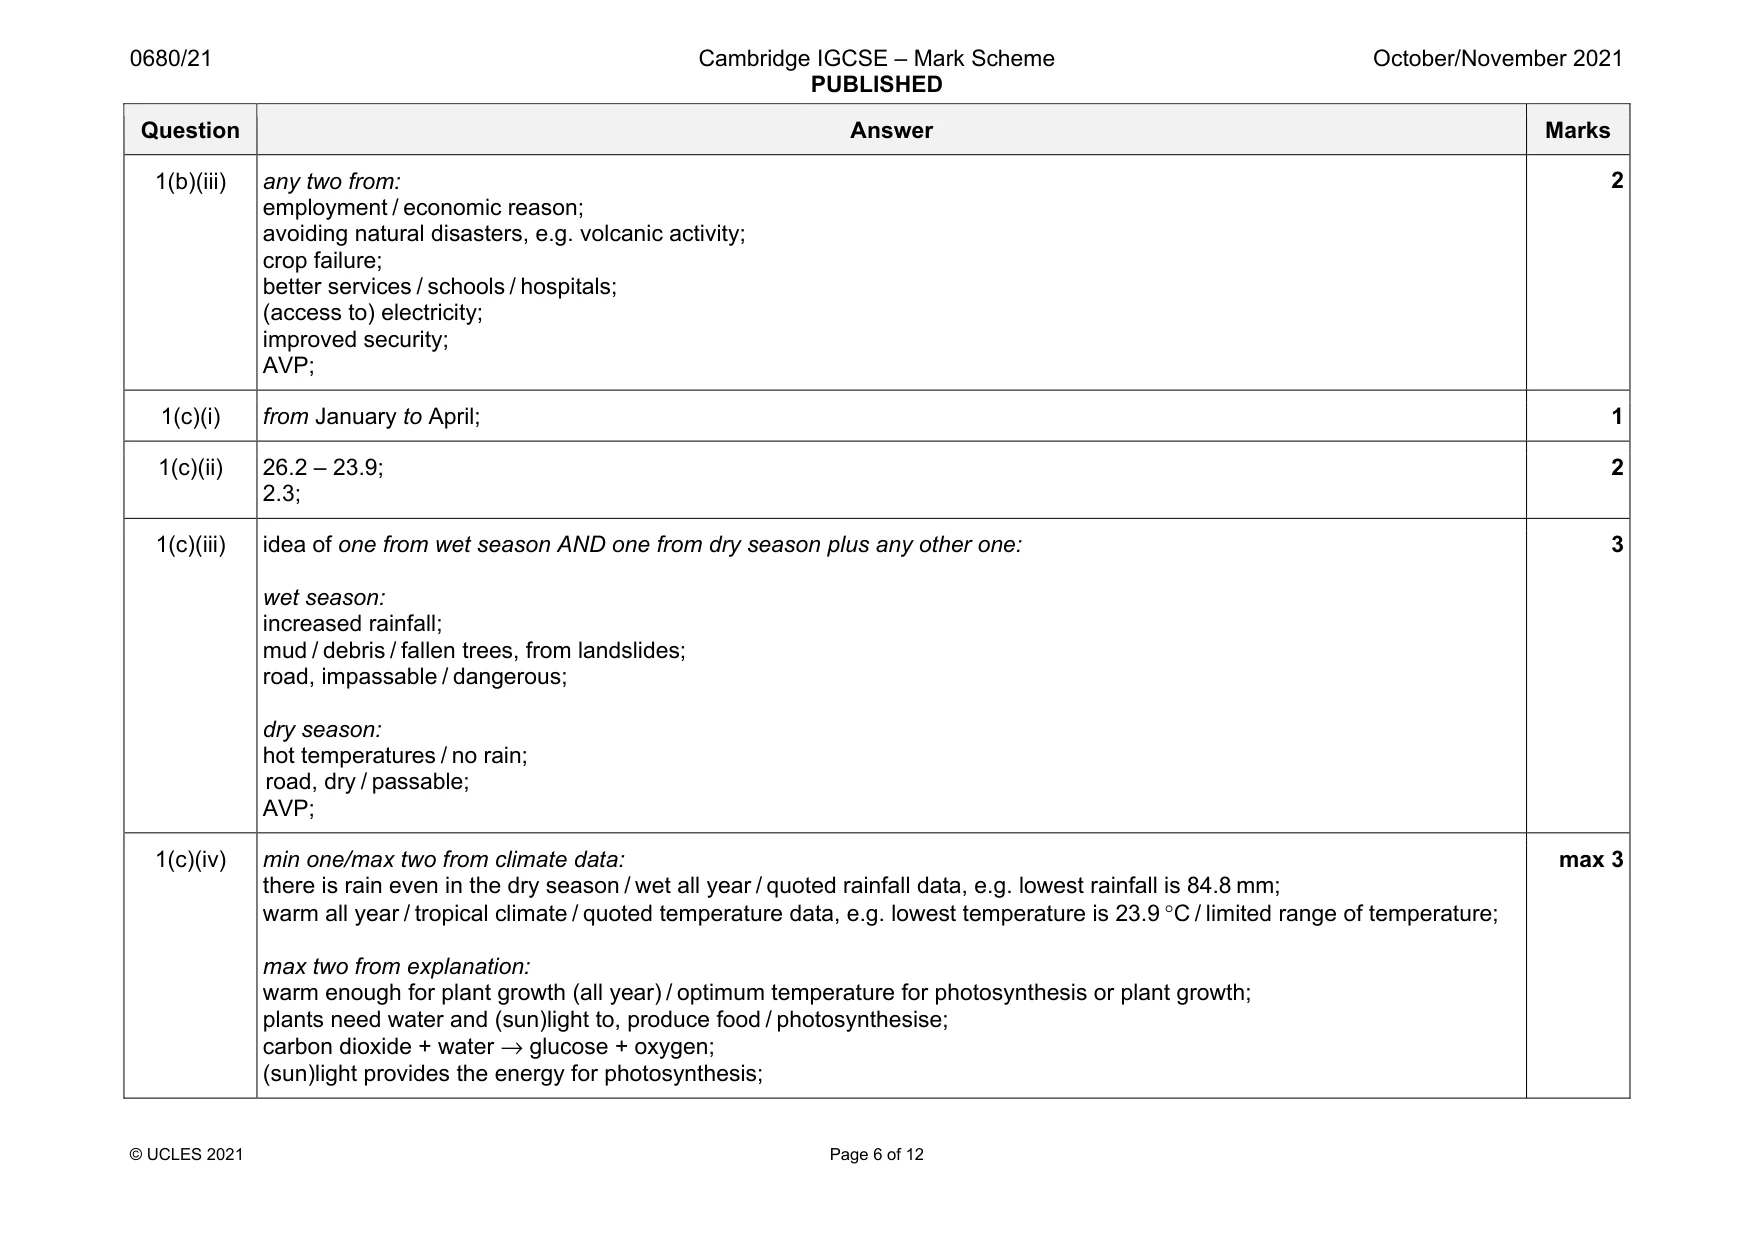
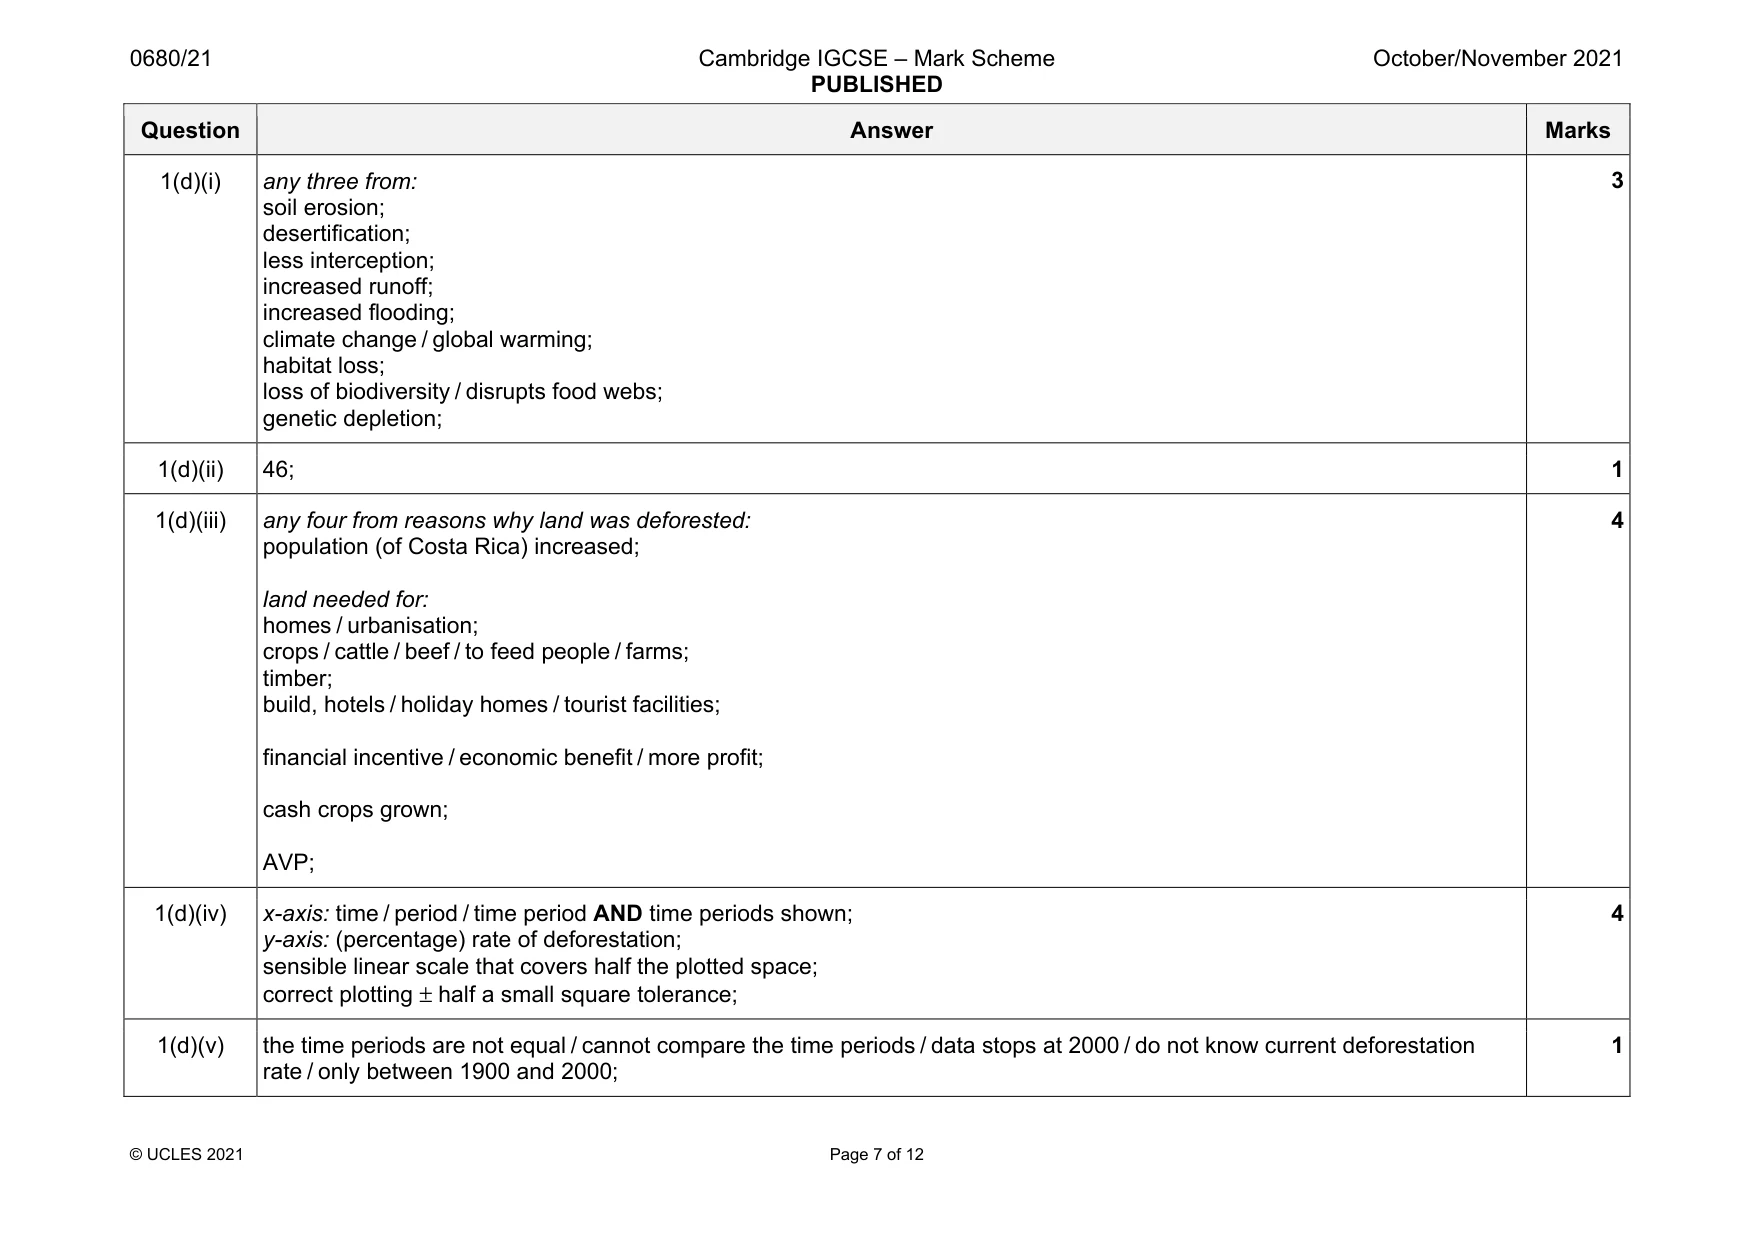
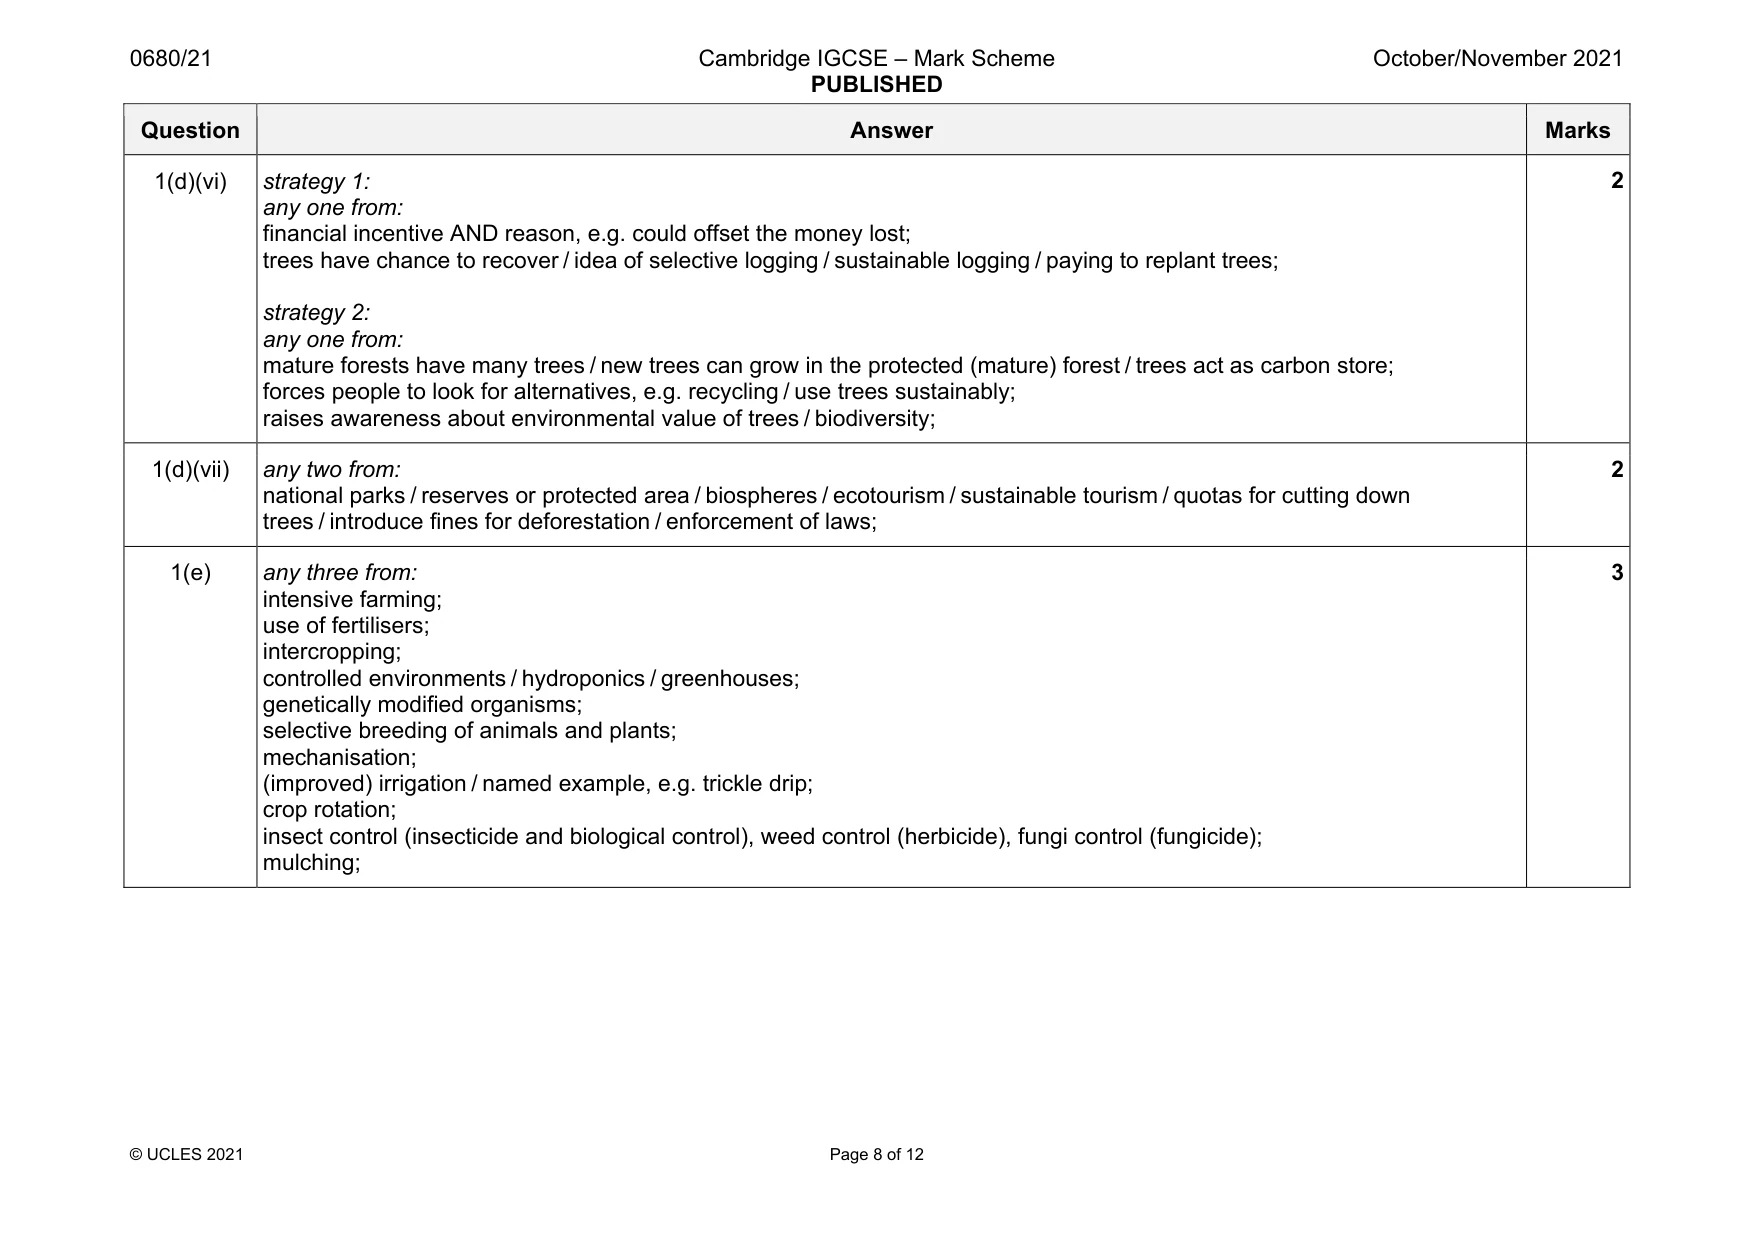
Mark scheme: 1(a)(i) any two from: increasing (from 1950 to 2019); (rate of) increase (approximately) same / no fluctuations; increased by 4 million / increased from 1 to 5 million; 2 1(a)(ii) any two from: increased life expectancy / lower death rate; better access to: education; healthcare; clean water / sanitation; electricity; limited access to family planning; migration; pro-natalist policies; AVP; 2 1(a)(iii) 3 892 200; 1 1(b)(i) any two from: homes close together / overcrowding; no organised waste / garbage collection; limited access to clean water; limited sanitation / sewage / human waste, management; AVP; 2 1(b)(ii) cholera / typhoid / e.q.; 1 Question Answer Marks 1(b)(iii) any two from: employment / economic reason; avoiding natural disasters, e.g. volcanic activity; crop failure; better services / schools / hospitals; (access to) electricity; improved security; AVP; 2 1(c)(i) from January to April; 1 1(c)(ii) 26.2 – 23.9; 2.3; 2 1(c)(iii) idea of one from wet season AND one from dry season plus any other one: wet season: increased rainfall; mud / debris / fallen trees, from landslides; road, impassable / dangerous; dry season: hot temperatures / no rain; road, dry / passable; AVP; 3 1(c)(iv) min one/max two from climate data: there is rain even in the dry season / wet all year / quoted rainfall data, e.g. lowest rainfall is 84.8 mm; warm all year / tropical climate / quoted temperature data, e.g. lowest temperature is 23.9 °C / limited range of temperature; max two from explanation: warm enough for plant growth (all year) / optimum temperature for photosynthesis or plant growth; plants need water and (sun)light to, produce food / photosynthesise; carbon dioxide + water → glucose + oxygen; (sun)light provides the energy for photosynthesis; max 3 Question Answer Marks 1(d)(i) any three from: soil erosion; desertification; less interception; increased runoff; increased flooding; climate change / global warming; habitat loss; loss of biodiversity / disrupts food webs; genetic depletion; 3 1(d)(ii) 46; 1 1(d)(iii) any four from reasons why land was deforested: population (of Costa Rica) increased; land needed for: homes / urbanisation; crops / cattle / beef / to feed people / farms; timber; build, hotels / holiday homes / tourist facilities; financial incentive / economic benefit / more profit; cash crops grown; AVP; 4 1(d)(iv) x-axis: time / period / time period AND time periods shown; y-axis: (percentage) rate of deforestation; sensible linear scale that covers half the plotted space; correct plotting ± half a small square tolerance; 4 1(d)(v) the time periods are not equal / cannot compare the time periods / data stops at 2000 / do not know current deforestation rate / only between 1900 and 2000; 1 Question Answer Marks 1(d)(vi) strategy 1: any one from: financial incentive AND reason, e.g. could offset the money lost; trees have chance to recover / idea of selective logging / sustainable logging / paying to replant trees; strategy 2: any one from: mature forests have many trees / new trees can grow in the protected (mature) forest / trees act as carbon store; forces people to look for alternatives, e.g. recycling / use trees sustainably; raises awareness about environmental value of trees / biodiversity; 2 1(d)(vii) any two from: national parks / reserves or protected area / biospheres / ecotourism / sustainable tourism / quotas for cutting down trees / introduce fines for deforestation / enforcement of laws; 2 1(e) any three from: intensive farming; use of fertilisers; intercropping; controlled environments / hydroponics / greenhouses; genetically modified organisms; selective breeding of animals and plants; mechanisation; (improved) irrigation / named example, e.g. trickle drip; crop rotation; insect control (insecticide and biological control), weed control (herbicide), fungi control (fungicide); mulching; 3
Q2 · The fact sheet shows information on the Resplendent Quetzal bird
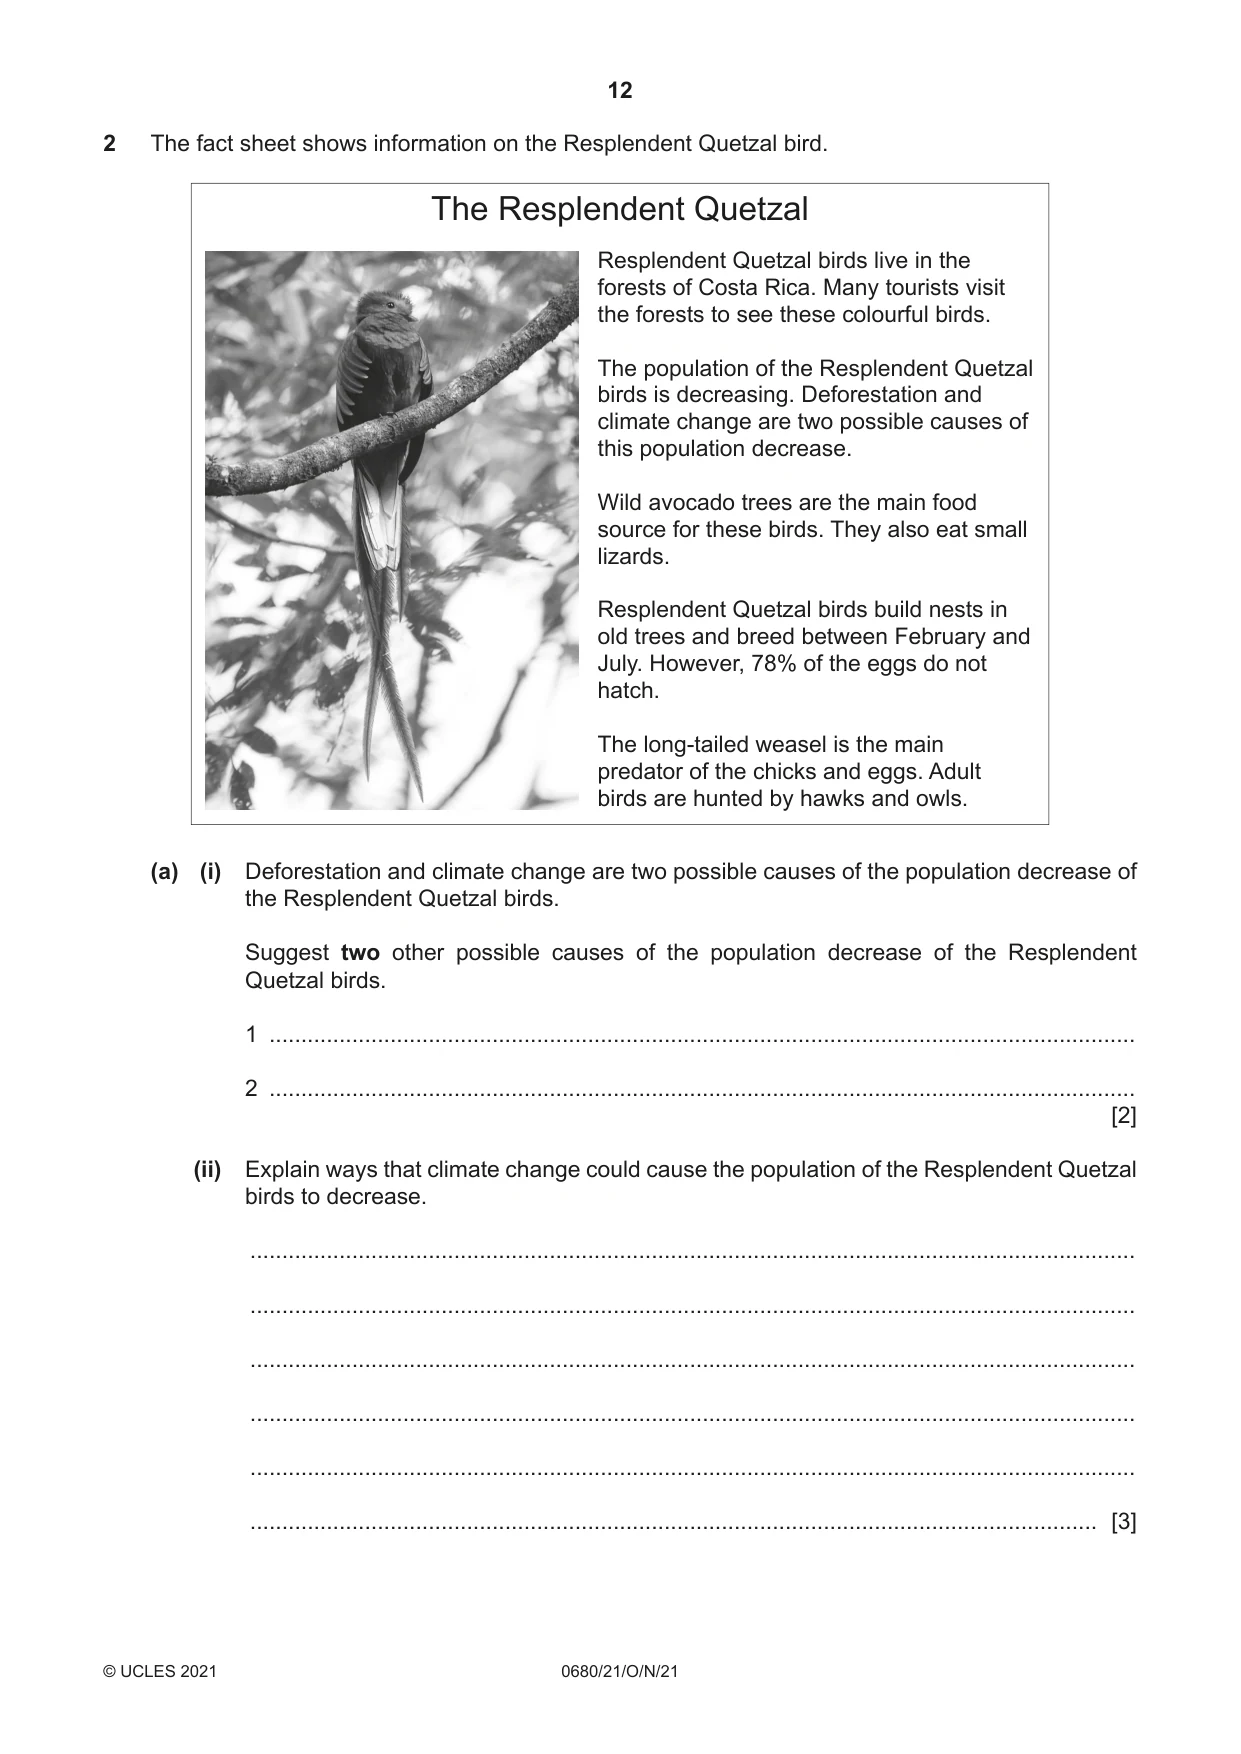
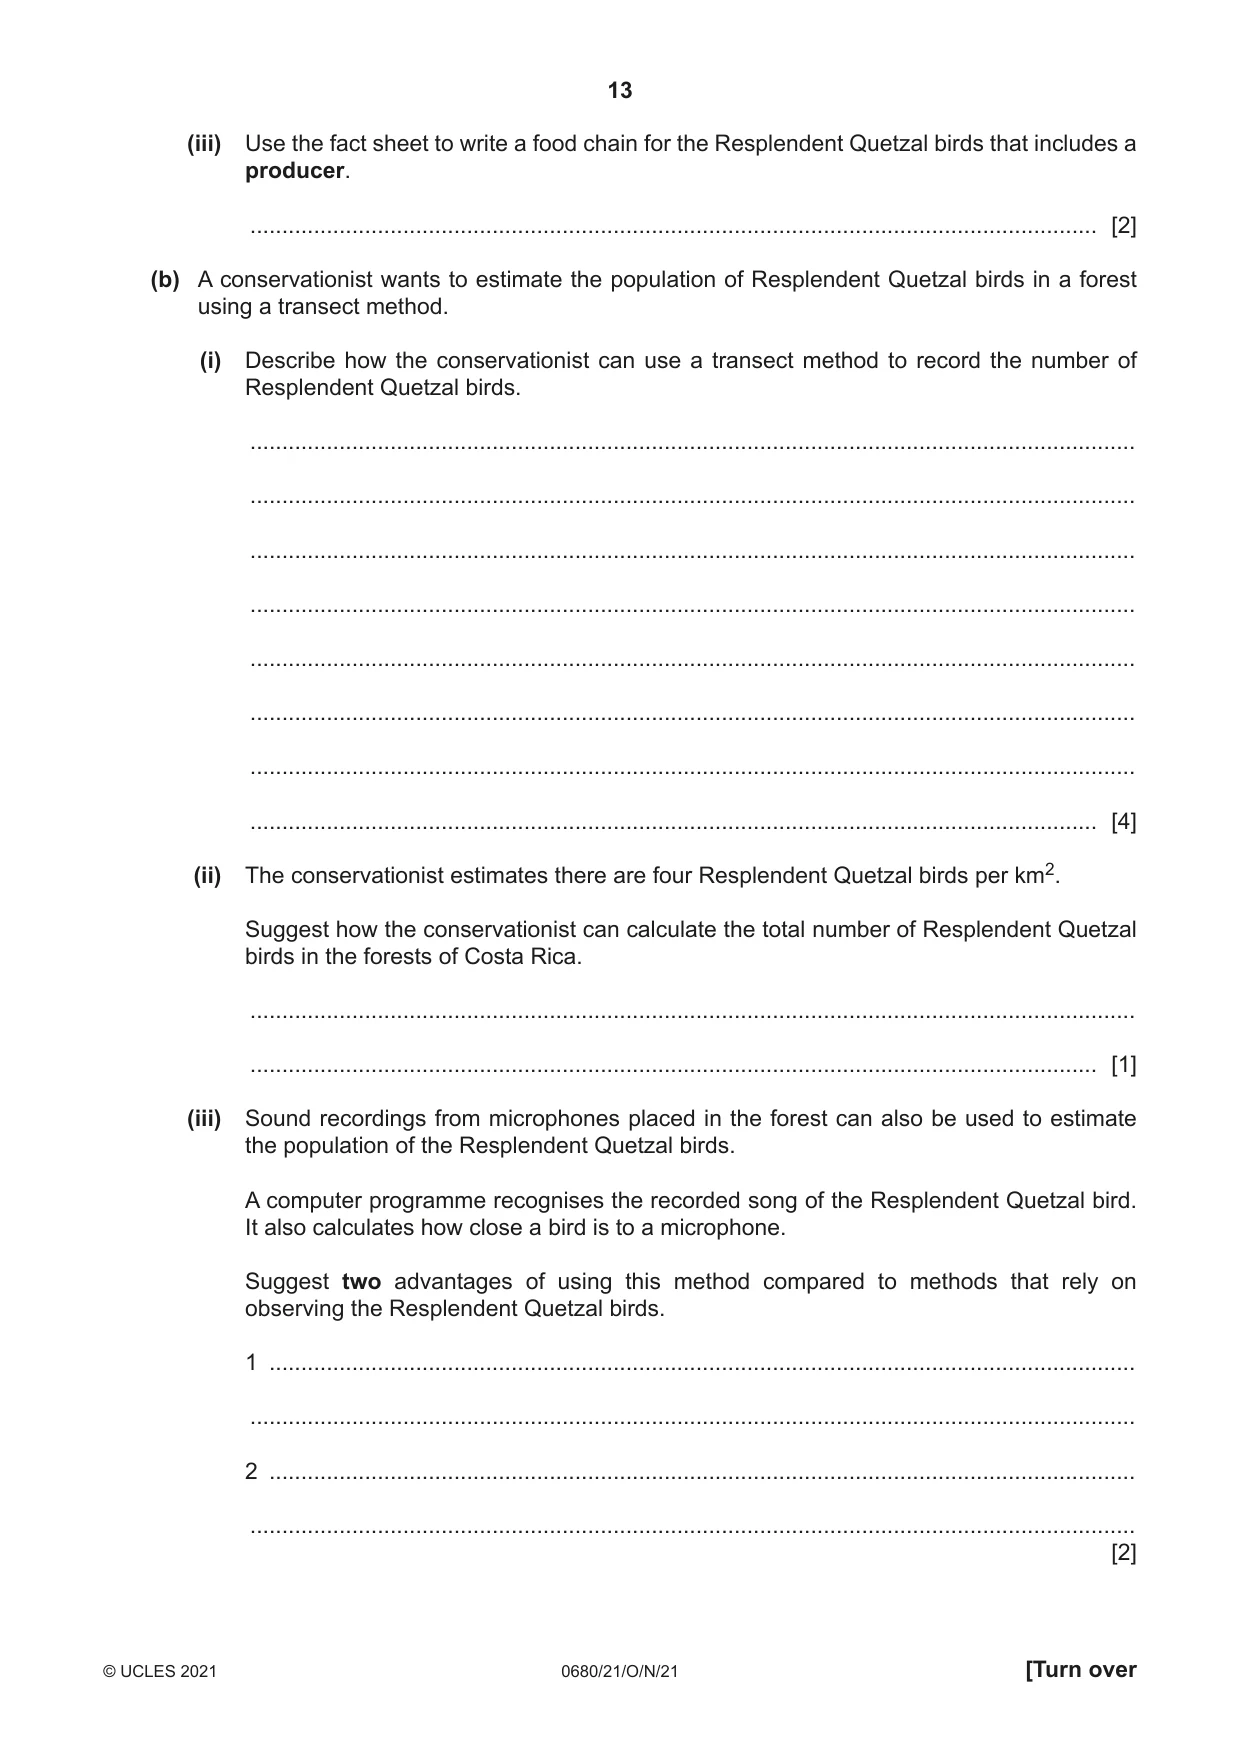
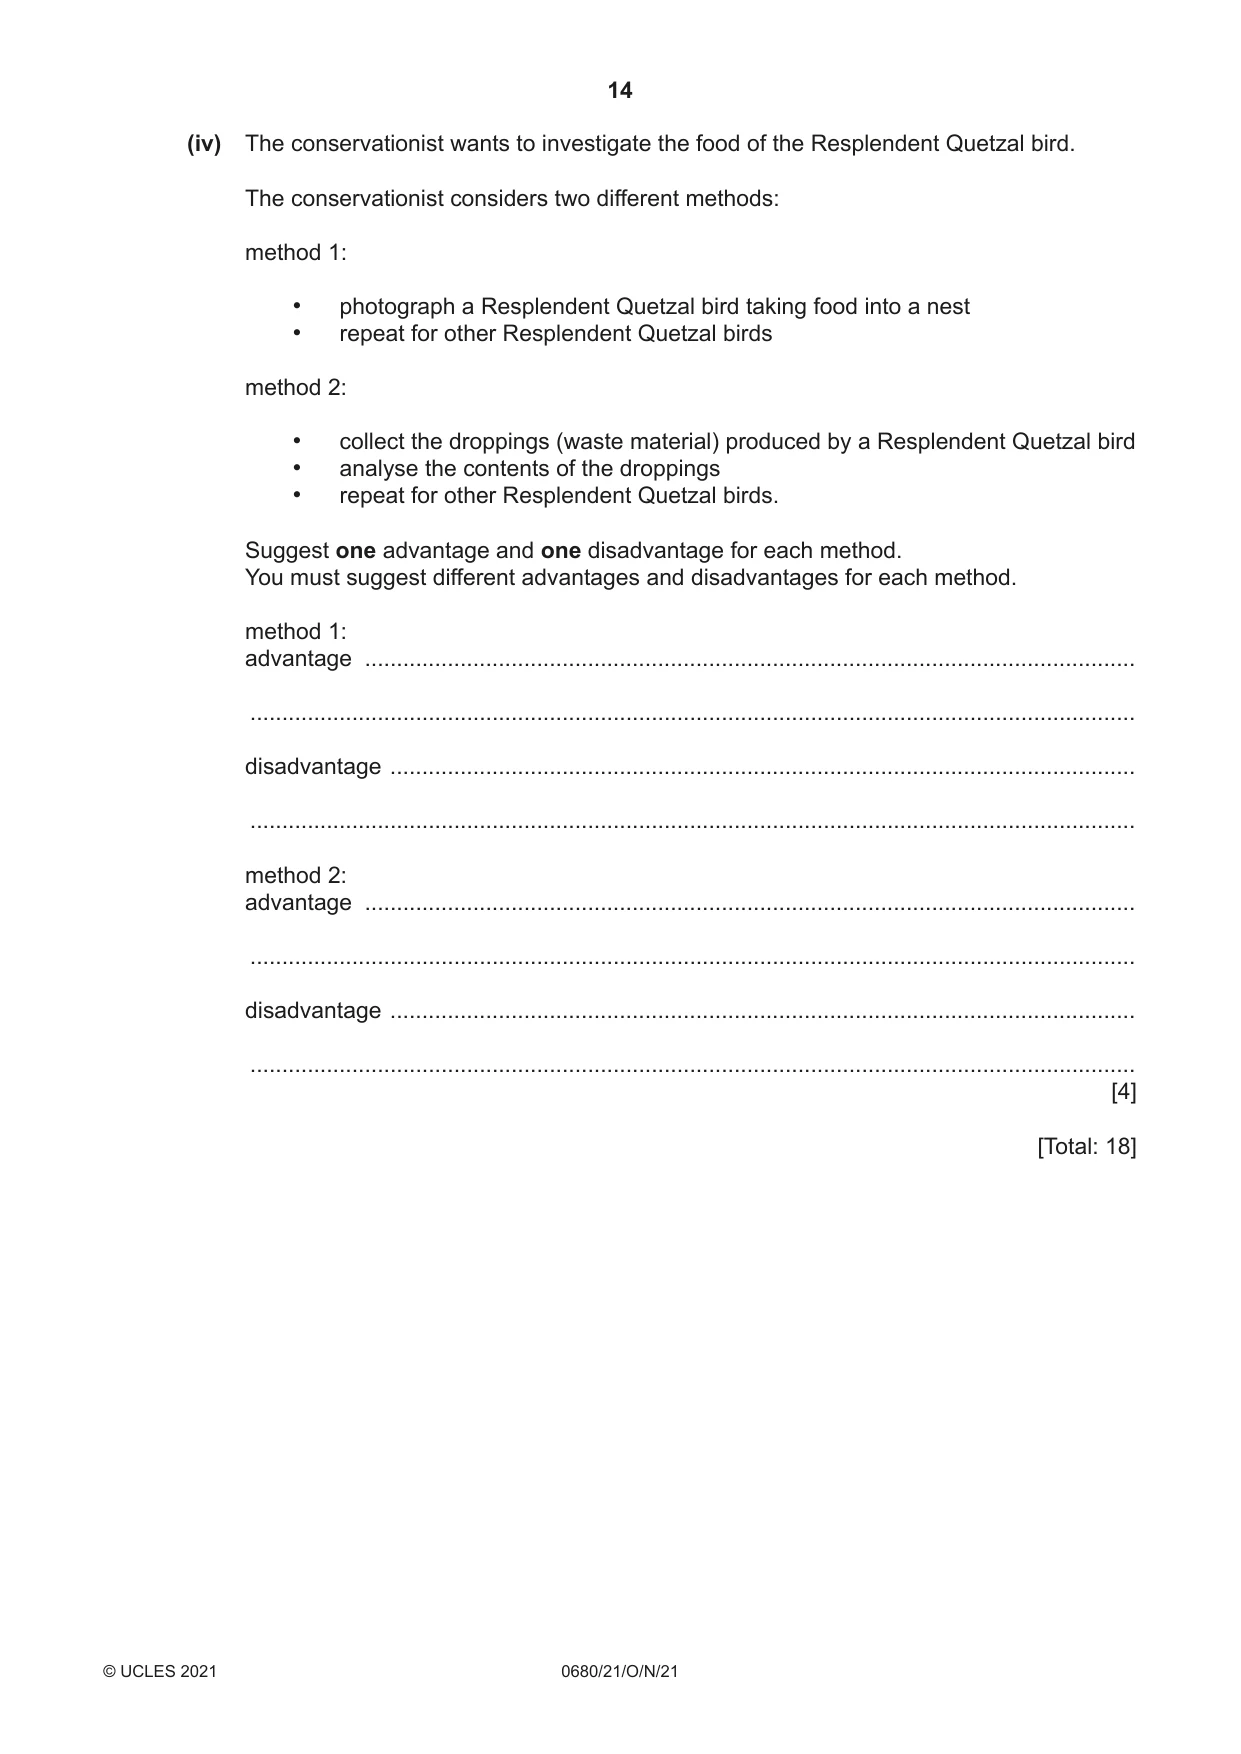
2 The fact sheet shows information on the Resplendent Quetzal bird. The Resplendent Quetzal Resplendent Quetzal birds live in the forests of Costa Rica. Many tourists visit the forests to see these colourful birds. The population of the Resplendent Quetzal birds is decreasing. Deforestation and climate change are two possible causes of this population decrease. Wild avocado trees are the main food source for these birds. They also eat small lizards. Resplendent Quetzal birds build nests in old trees and breed between February and July. However, 78% of the eggs do not hatch. The long-tailed weasel is the main predator of the chicks and eggs. Adult birds are hunted by hawks and owls. (a) (i) Deforestation and climate change are two possible causes of the population decrease of the Resplendent Quetzal birds. Suggest two other possible causes of the population decrease of the Resplendent Quetzal birds. 1 ........................................................................................................................................ 2 ........................................................................................................................................ [2] (ii) Explain ways that climate change could cause the population of the Resplendent Quetzal birds to decrease. ........................................................................................................................................... ........................................................................................................................................... ........................................................................................................................................... ........................................................................................................................................... ........................................................................................................................................... ..................................................................................................................................... [3] (iii) Use the fact sheet to write a food chain for the Resplendent Quetzal birds that includes a producer. ..................................................................................................................................... [2] (b) A conservationist wants to estimate the population of Resplendent Quetzal birds in a forest using a transect method. (i) Describe how the conservationist can use a transect method to record the number of Resplendent Quetzal birds. ........................................................................................................................................... ........................................................................................................................................... ........................................................................................................................................... ........................................................................................................................................... ........................................................................................................................................... ........................................................................................................................................... ........................................................................................................................................... ..................................................................................................................................... [4] (ii) The conservationist estimates there are four Resplendent Quetzal birds per km2. Suggest how the conservationist can calculate the total number of Resplendent Quetzal birds in the forests of Costa Rica. ........................................................................................................................................... ..................................................................................................................................... [1] (iii) Sound recordings from microphones placed in the forest can also be used to estimate the population of the Resplendent Quetzal birds. A computer programme recognises the recorded song of the Resplendent Quetzal bird. It also calculates how close a bird is to a microphone. Suggest two advantages of using this method compared to methods that rely on observing the Resplendent Quetzal birds. 1 ........................................................................................................................................ ........................................................................................................................................... 2 ........................................................................................................................................ ........................................................................................................................................... [2] (iv) The conservationist wants to investigate the food of the Resplendent Quetzal bird. The conservationist considers two different methods: method 1: • photograph a Resplendent Quetzal bird taking food into a nest • repeat for other Resplendent Quetzal birds method 2: • collect the droppings (waste material) produced by a Resplendent Quetzal bird • analyse the contents of the droppings • repeat for other Resplendent Quetzal birds. Suggest one advantage and one disadvantage for each method. You must suggest different advantages and disadvantages for each method. method 1: advantage ......................................................................................................................... ........................................................................................................................................... disadvantage ..................................................................................................................... ........................................................................................................................................... method 2: advantage ......................................................................................................................... ........................................................................................................................................... disadvantage ..................................................................................................................... ........................................................................................................................................... [4] [Total: 18]
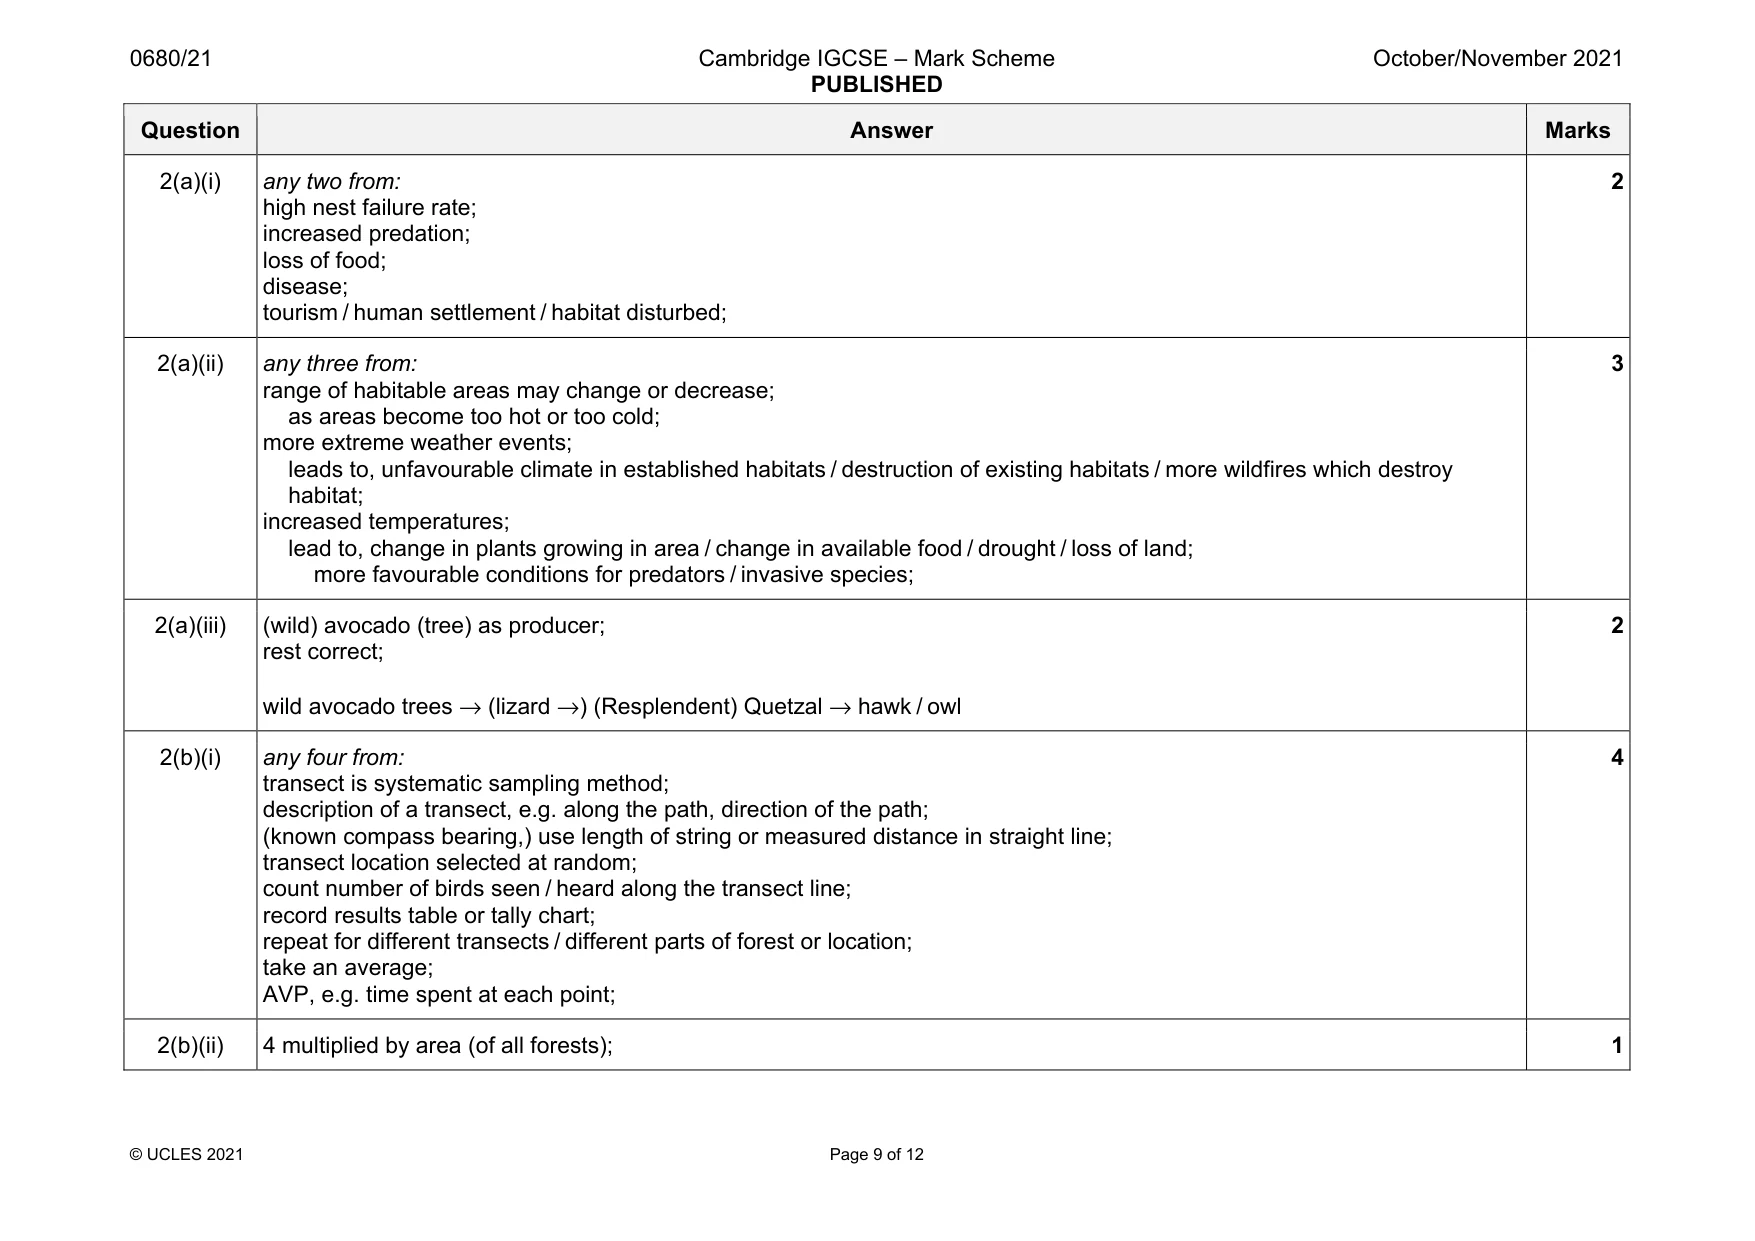
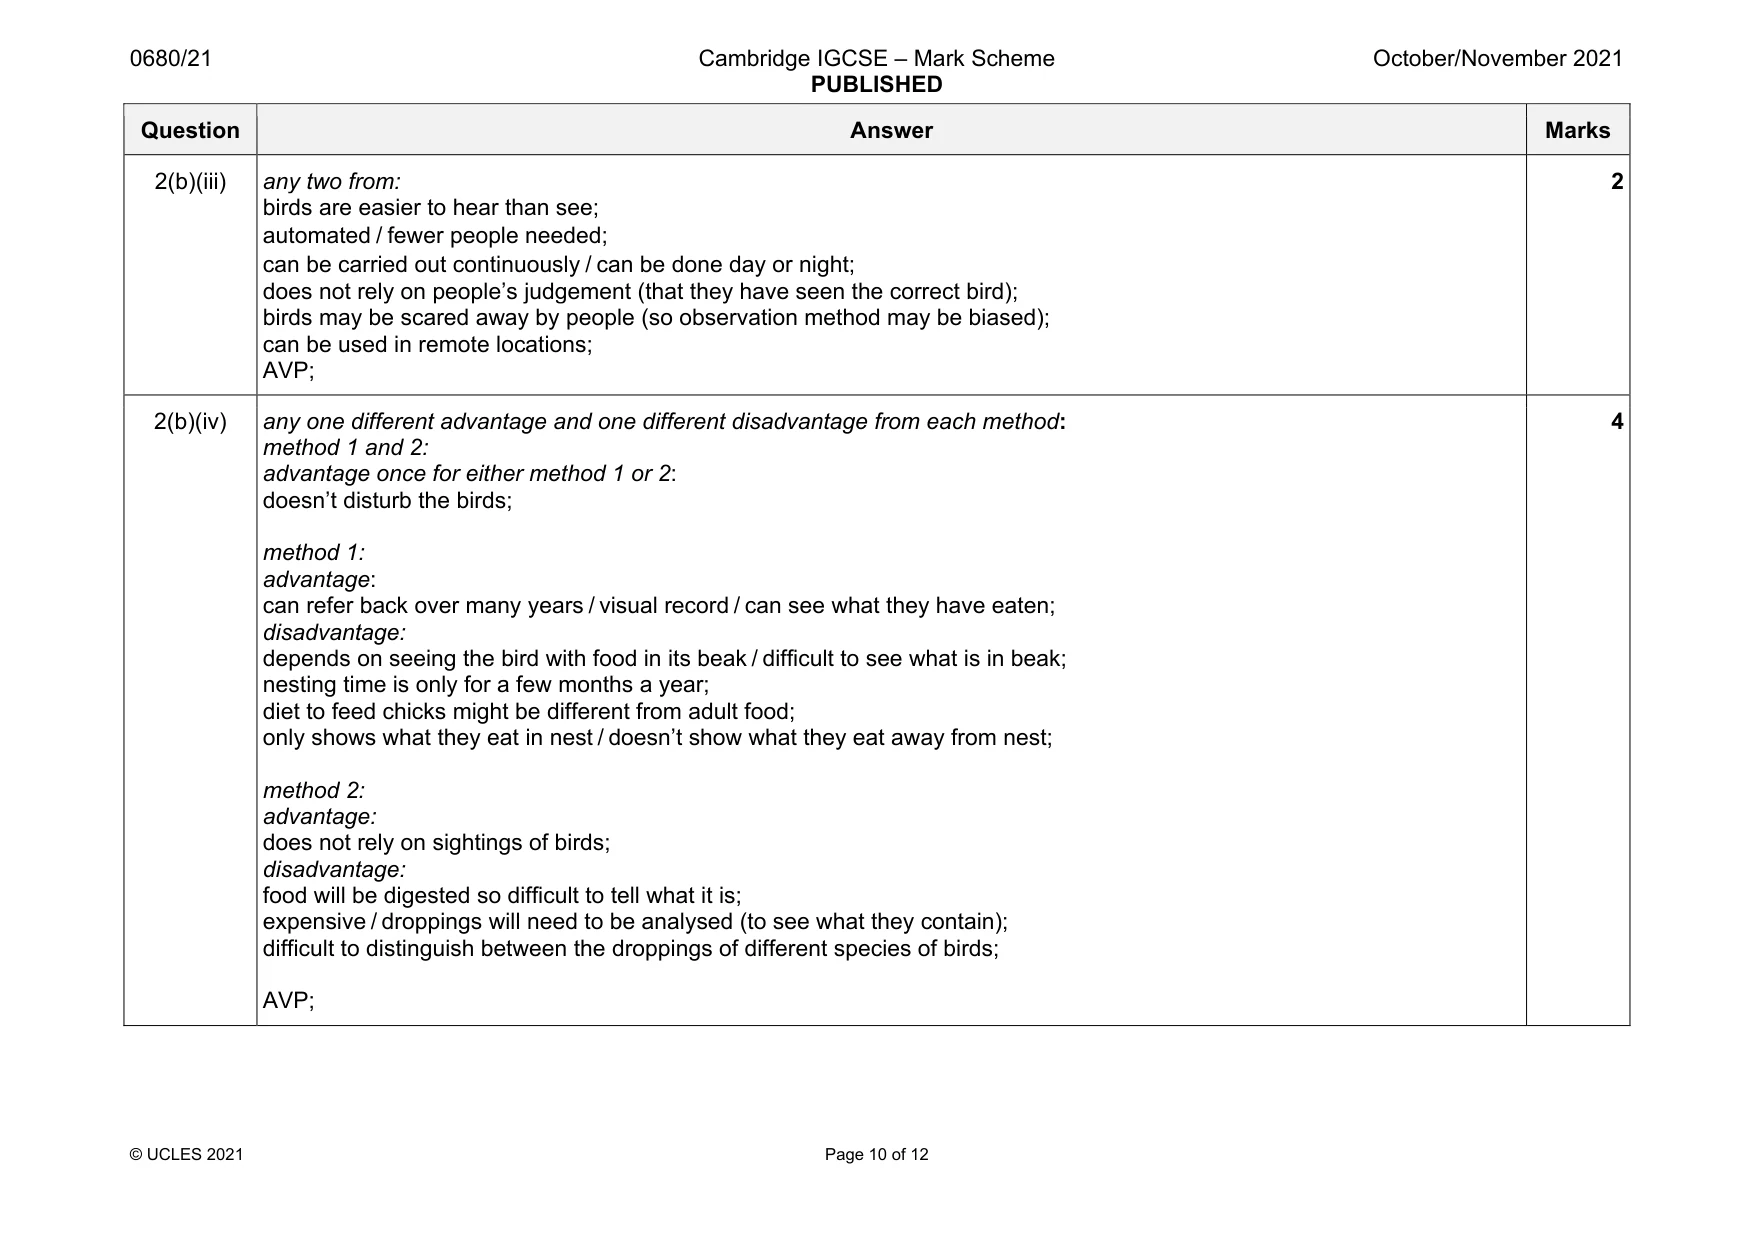
Mark scheme: 2(a)(i) any two from: high nest failure rate; increased predation; loss of food; disease; tourism / human settlement / habitat disturbed; 2 2(a)(ii) any three from: range of habitable areas may change or decrease; as areas become too hot or too cold; more extreme weather events; leads to, unfavourable climate in established habitats / destruction of existing habitats / more wildfires which destroy habitat; increased temperatures; lead to, change in plants growing in area / change in available food / drought / loss of land; more favourable conditions for predators / invasive species; 3 2(a)(iii) (wild) avocado (tree) as producer; rest correct; wild avocado trees → (lizard →) (Resplendent) Quetzal → hawk / owl 2 2(b)(i) any four from: transect is systematic sampling method; description of a transect, e.g. along the path, direction of the path; (known compass bearing,) use length of string or measured distance in straight line; transect location selected at random; count number of birds seen / heard along the transect line; record results table or tally chart; repeat for different transects / different parts of forest or location; take an average; AVP, e.g. time spent at each point; 4 2(b)(ii) 4 multiplied by area (of all forests); 1 Question Answer Marks 2(b)(iii) any two from: birds are easier to hear than see; automated / fewer people needed; can be carried out continuously / can be done day or night; does not rely on people’s judgement (that they have seen the correct bird); birds may be scared away by people (so observation method may be biased); can be used in remote locations; AVP; 2 2(b)(iv) any one different advantage and one different disadvantage from each method: method 1 and 2: advantage once for either method 1 or 2: doesn’t disturb the birds; method 1: advantage: can refer back over many years / visual record / can see what they have eaten; disadvantage: depends on seeing the bird with food in its beak / difficult to see what is in beak; nesting time is only for a few months a year; diet to feed chicks might be different from adult food; only shows what they eat in nest / doesn’t show what they eat away from nest; method 2: advantage: does not rely on sightings of birds; disadvantage: food will be digested so difficult to tell what it is; expensive / droppings will need to be analysed (to see what they contain); difficult to distinguish between the droppings of different species of birds; AVP; 4
Q3 · Costa Rica plans to be carbon neutral in the future
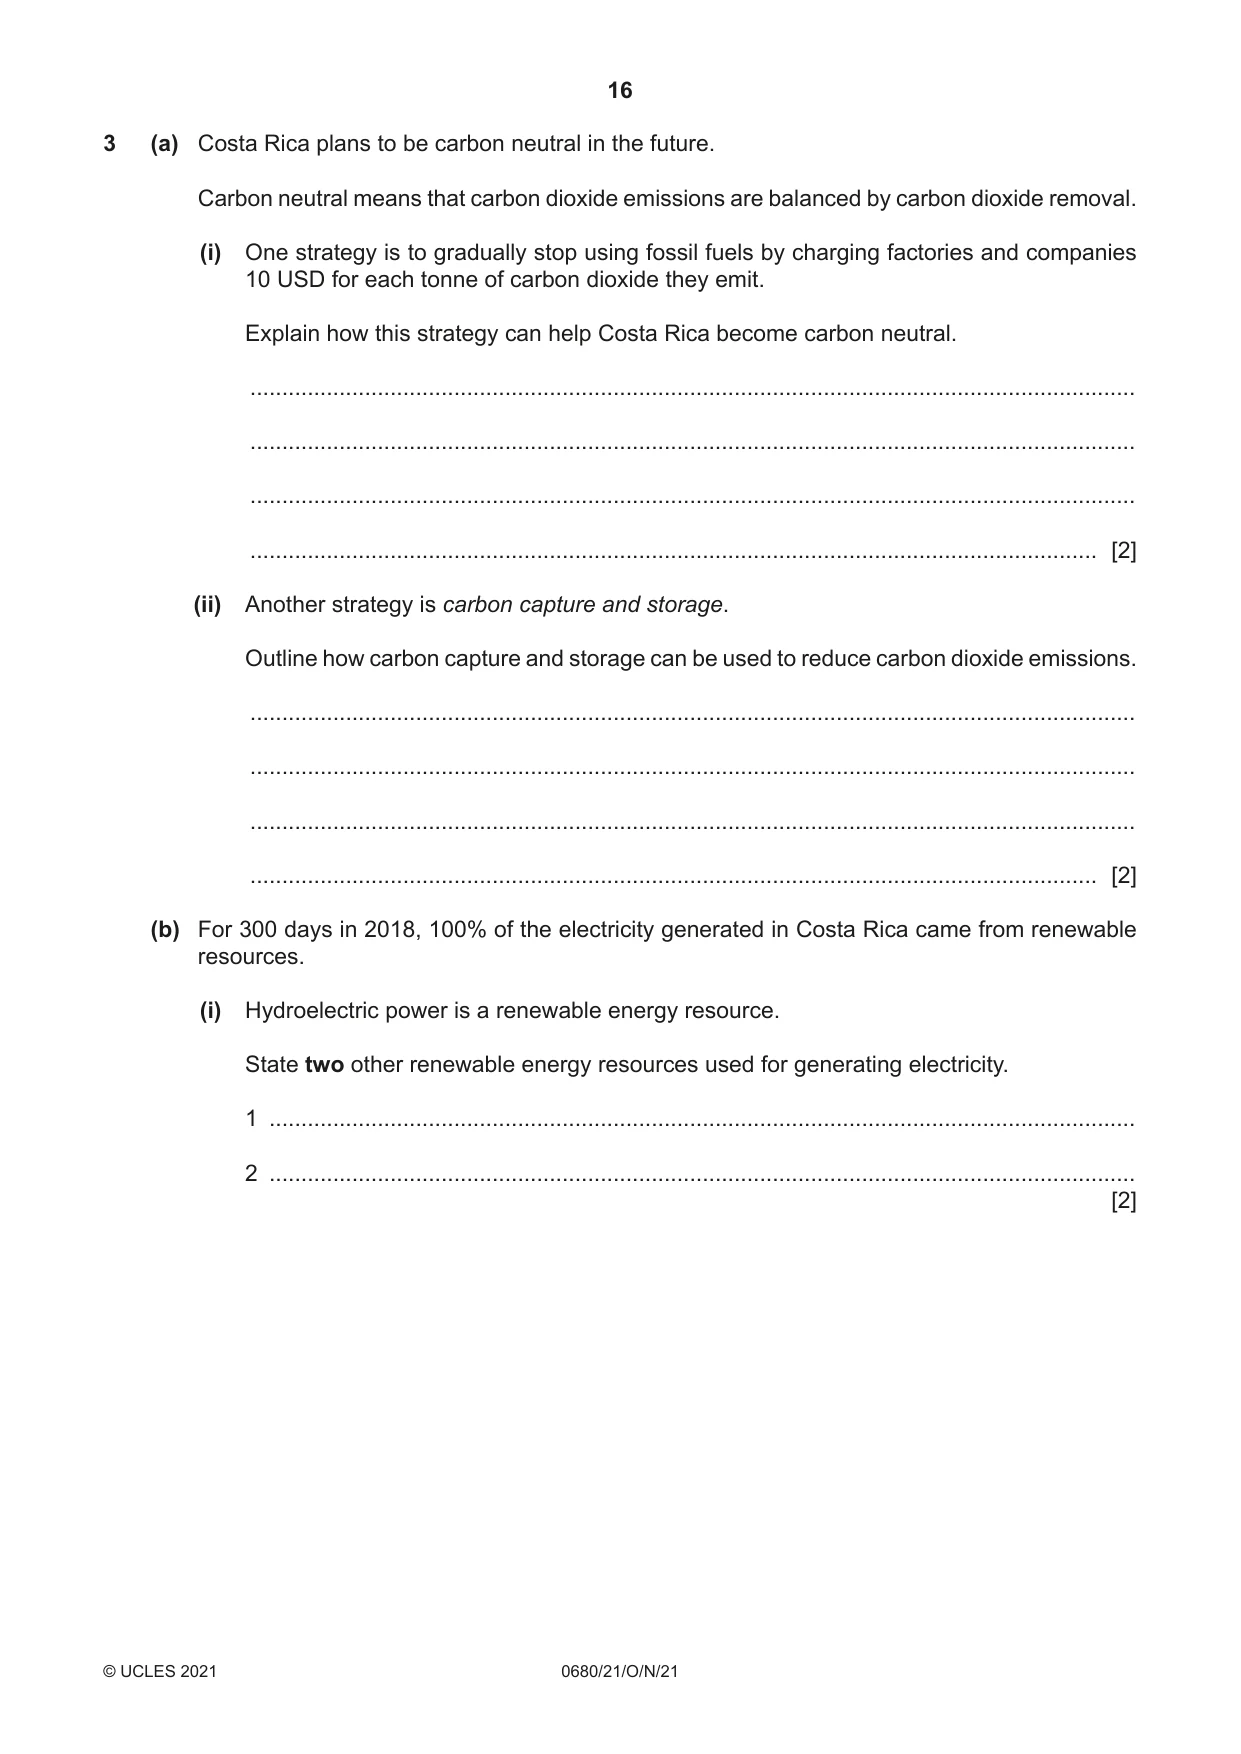
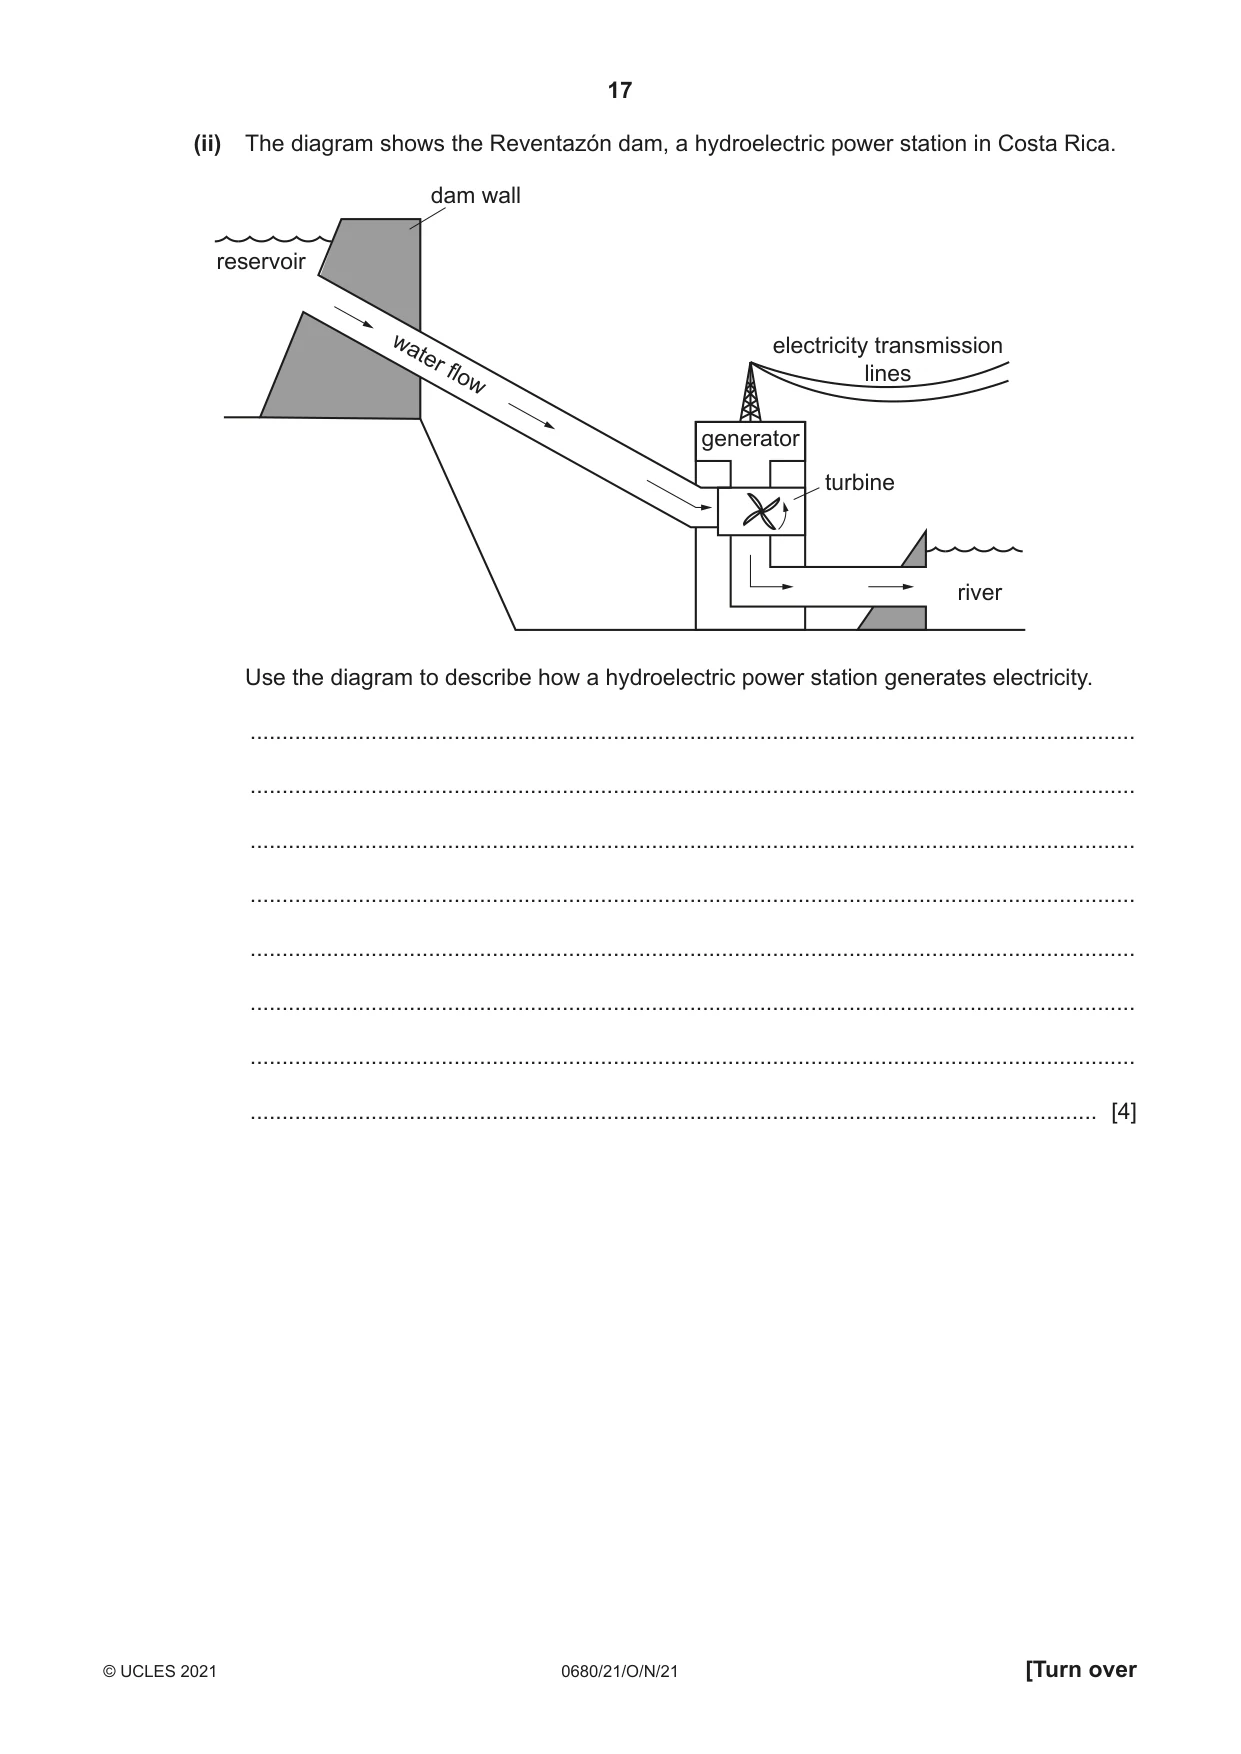
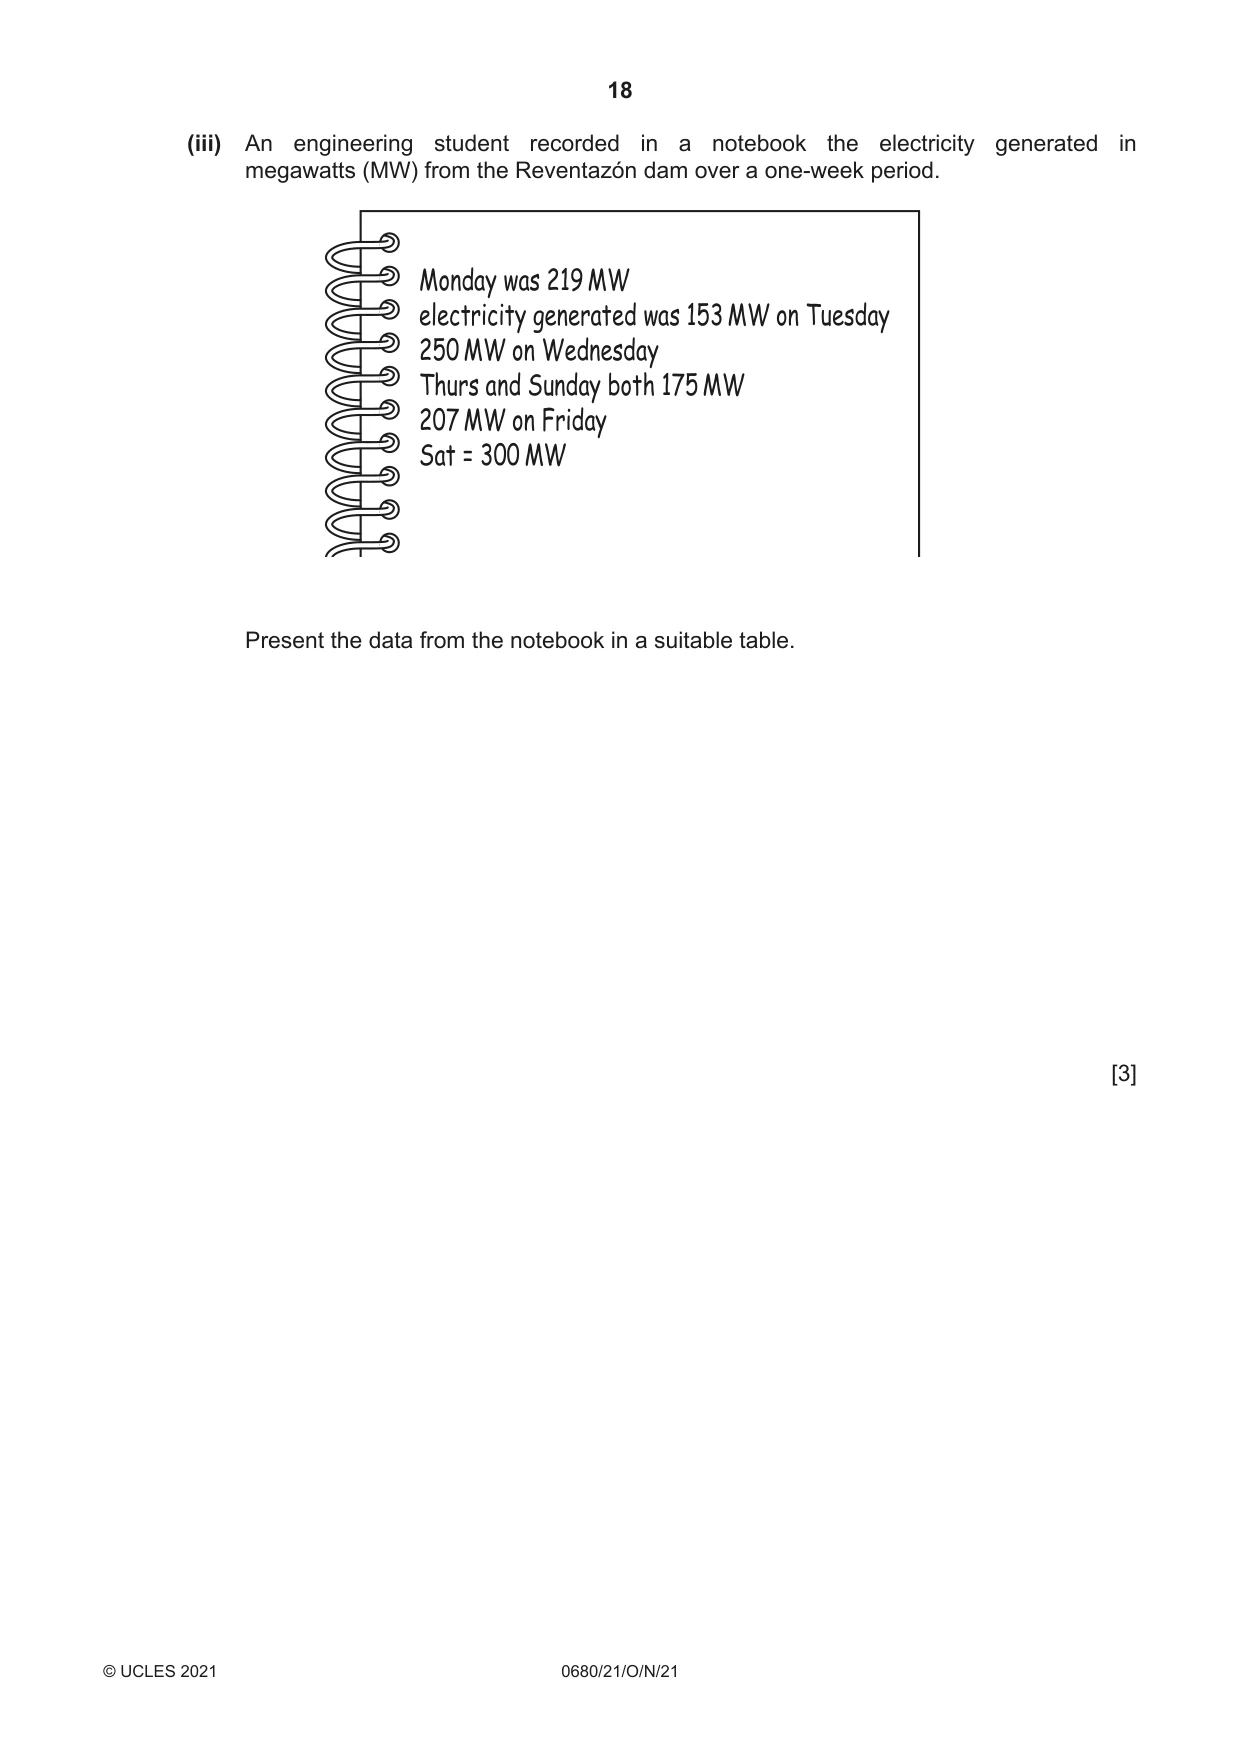
3 (a) Costa Rica plans to be carbon neutral in the future. Carbon neutral means that carbon dioxide emissions are balanced by carbon dioxide removal. (i) One strategy is to gradually stop using fossil fuels by charging factories and companies 10 USD for each tonne of carbon dioxide they emit. Explain how this strategy can help Costa Rica become carbon neutral. ........................................................................................................................................... ........................................................................................................................................... ........................................................................................................................................... ..................................................................................................................................... [2] (ii) Another strategy is carbon capture and storage. Outline how carbon capture and storage can be used to reduce carbon dioxide emissions. ........................................................................................................................................... ........................................................................................................................................... ........................................................................................................................................... ..................................................................................................................................... [2] (b) For 300 days in 2018, 100% of the electricity generated in Costa Rica came from renewable resources. (i) Hydroelectric power is a renewable energy resource. State two other renewable energy resources used for generating electricity. 1 ........................................................................................................................................ 2 ........................................................................................................................................ [2] (ii) The diagram shows the Reventazón dam, a hydroelectric power station in Costa Rica. dam wall reservoir water electricity transmission flow lines generator turbine river Use the diagram to describe how a hydroelectric power station generates electricity. ........................................................................................................................................... ........................................................................................................................................... ........................................................................................................................................... ........................................................................................................................................... ........................................................................................................................................... ........................................................................................................................................... ........................................................................................................................................... ..................................................................................................................................... [4] (iii) An engineering student recorded in a notebook the electricity generated in megawatts (MW) from the Reventazón dam over a one-week period. Monday was 219 MW electricity generated was 153 MW on Tuesday 250 MW on Wednesday Thurs and Sunday both 175 MW 207 MW on Friday Sat = 300 MW Present the data from the notebook in a suitable table. [3]
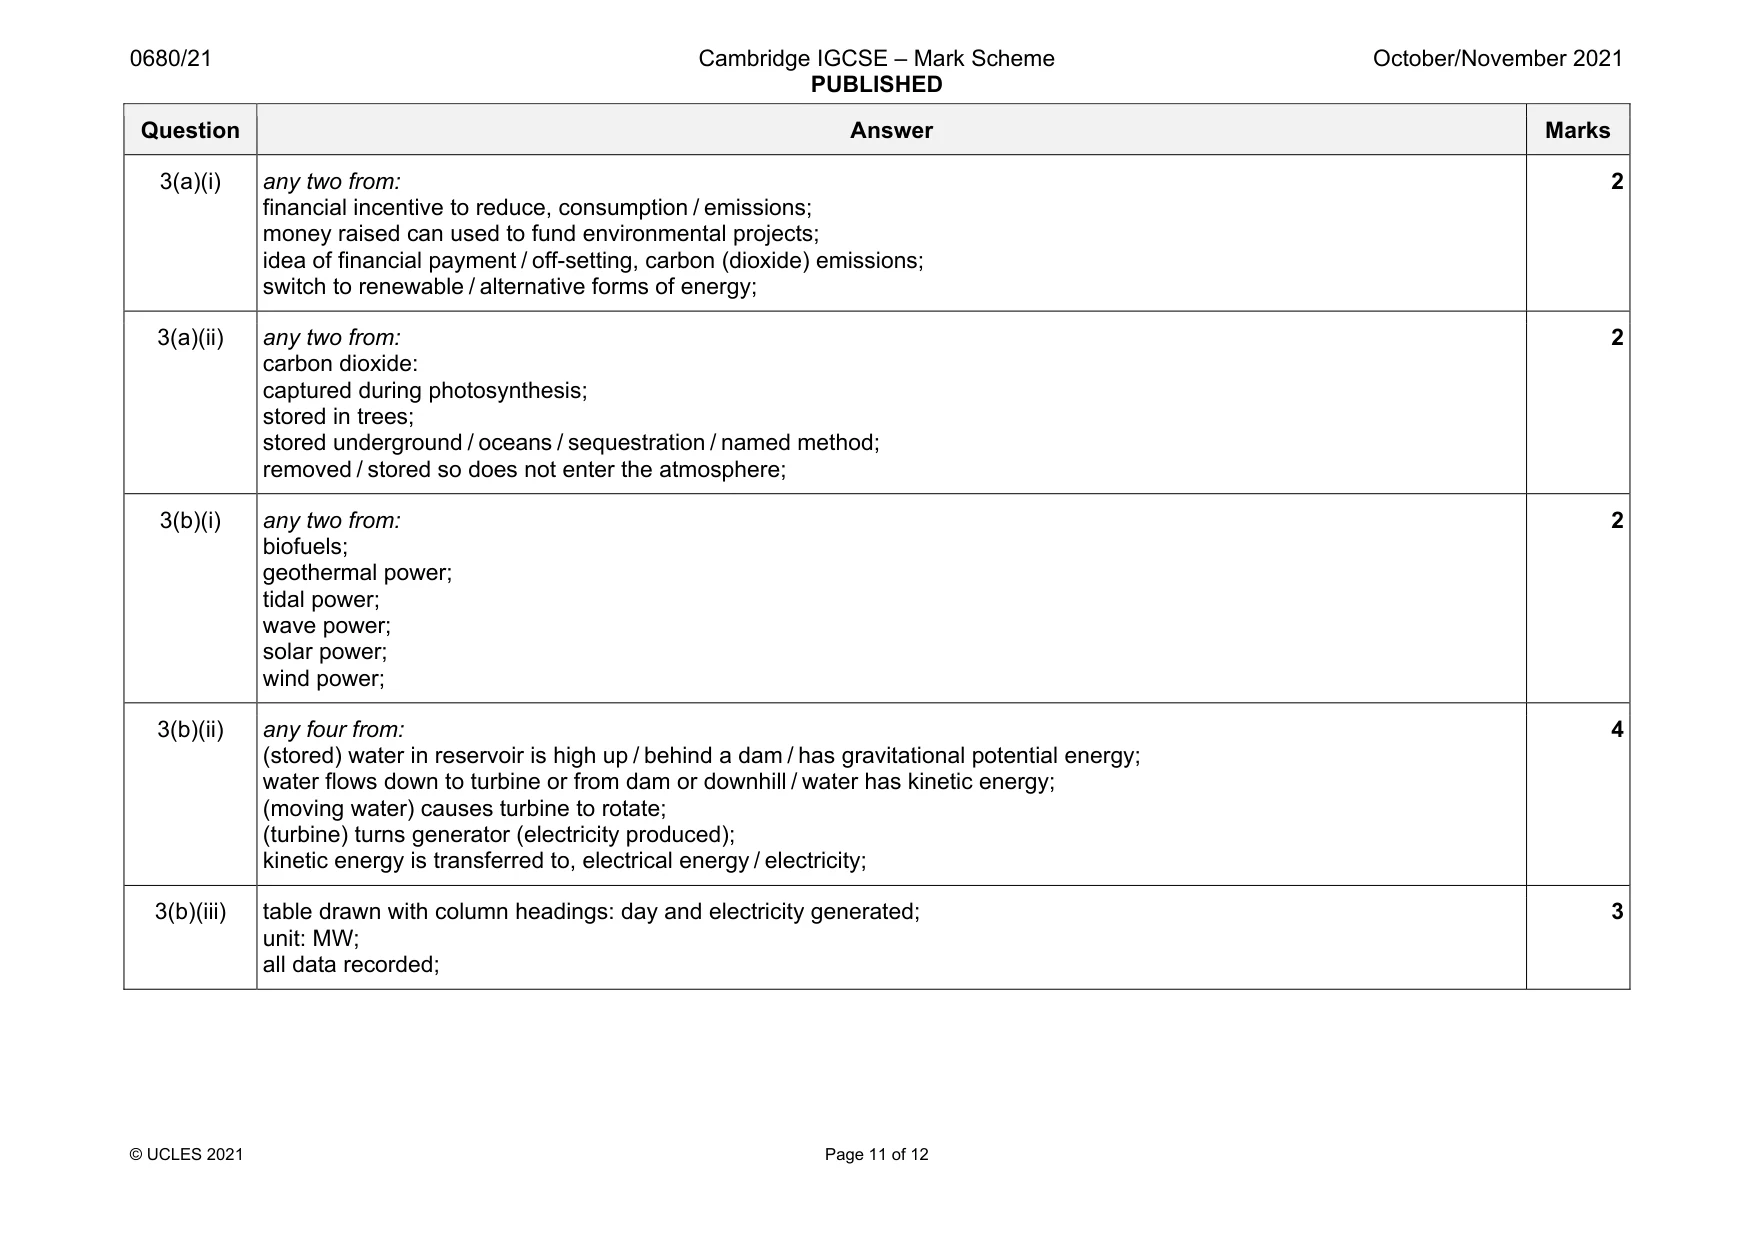
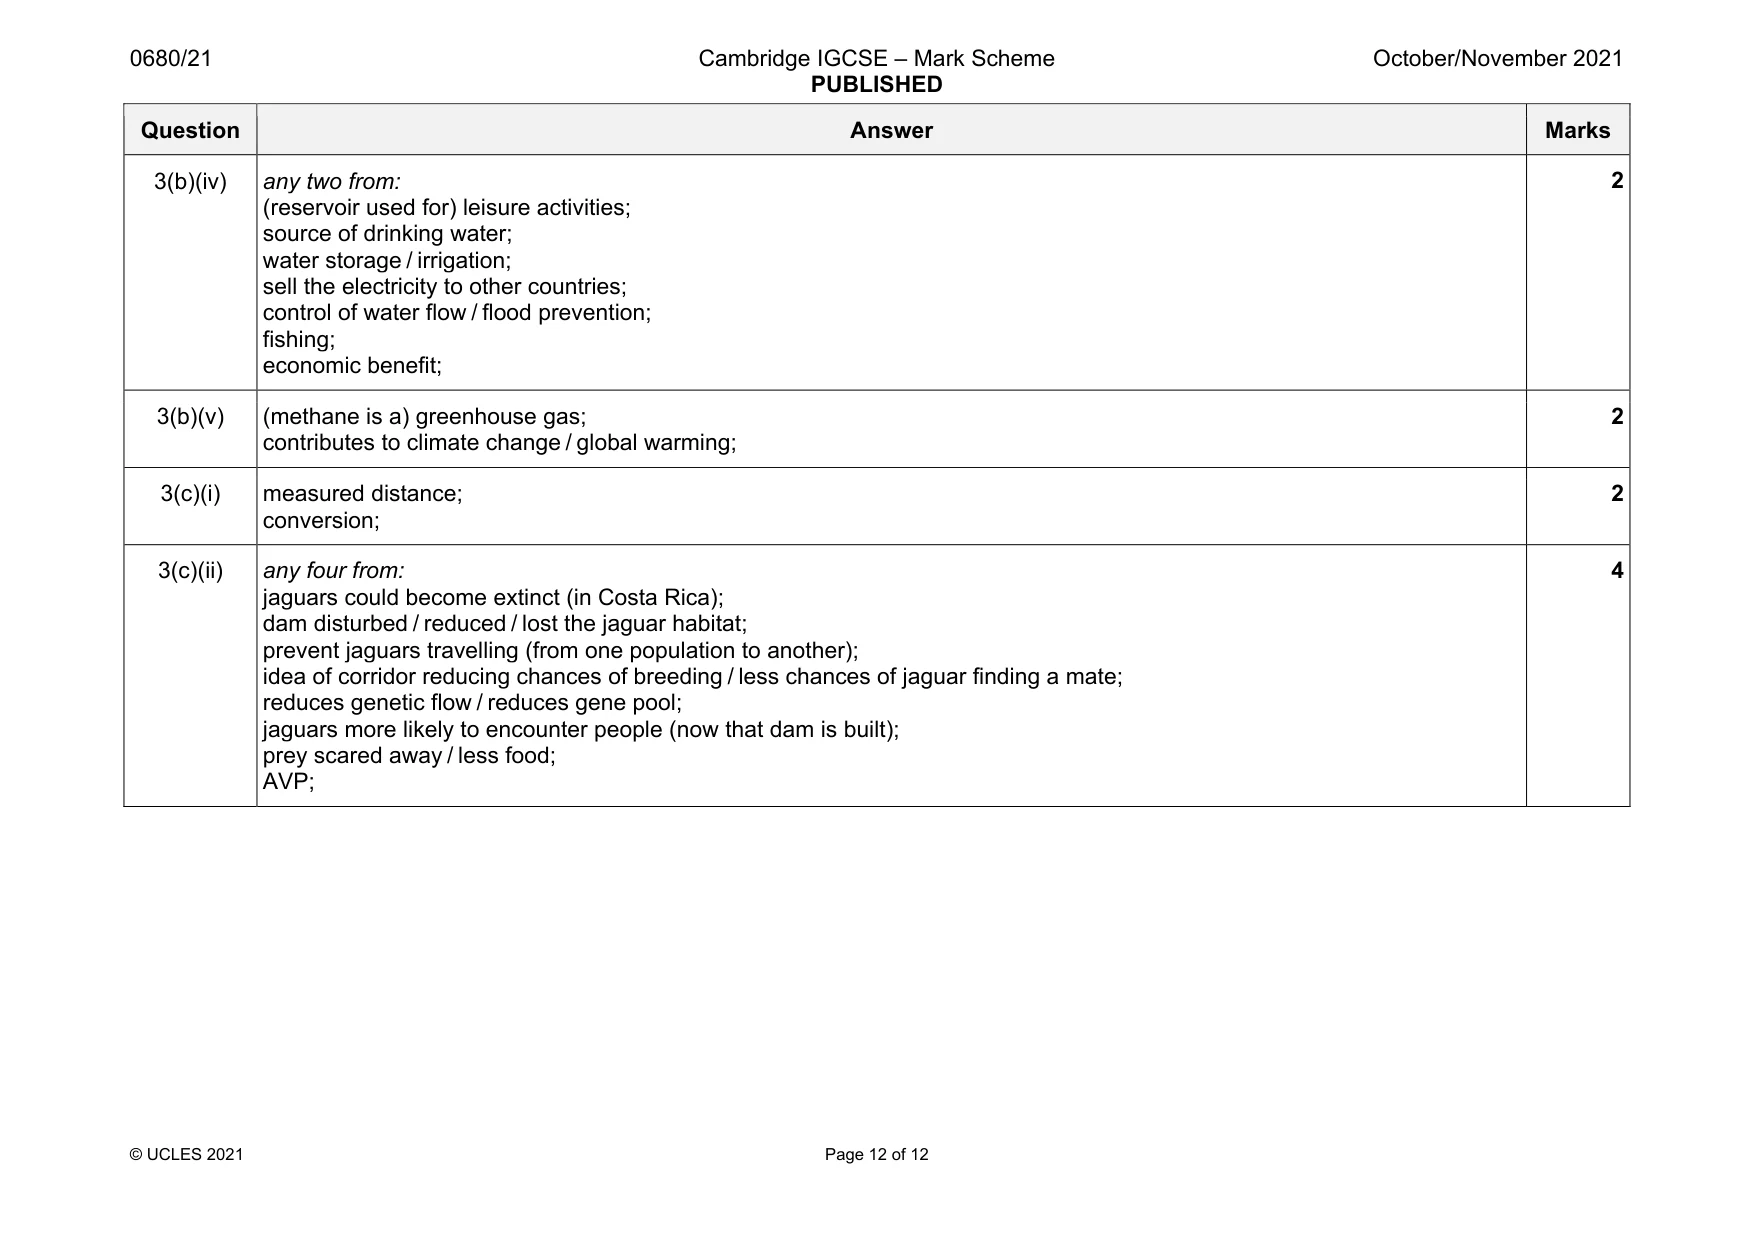
Mark scheme: 3(a)(i) any two from: financial incentive to reduce, consumption / emissions; money raised can used to fund environmental projects; idea of financial payment / off-setting, carbon (dioxide) emissions; switch to renewable / alternative forms of energy; 2 3(a)(ii) any two from: carbon dioxide: captured during photosynthesis; stored in trees; stored underground / oceans / sequestration / named method; removed / stored so does not enter the atmosphere; 2 3(b)(i) any two from: biofuels; geothermal power; tidal power; wave power; solar power; wind power; 2 3(b)(ii) any four from: (stored) water in reservoir is high up / behind a dam / has gravitational potential energy; water flows down to turbine or from dam or downhill / water has kinetic energy; (moving water) causes turbine to rotate; (turbine) turns generator (electricity produced); kinetic energy is transferred to, electrical energy / electricity; 4 3(b)(iii) table drawn with column headings: day and electricity generated; unit: MW; all data recorded; 3 Question Answer Marks 3(b)(iv) any two from: (reservoir used for) leisure activities; source of drinking water; water storage / irrigation; sell the electricity to other countries; control of water flow / flood prevention; fishing; economic benefit; 2 3(b)(v) (methane is a) greenhouse gas; contributes to climate change / global warming; 2 3(c)(i) measured distance; conversion; 2 3(c)(ii) any four from: jaguars could become extinct (in Costa Rica); dam disturbed / reduced / lost the jaguar habitat; prevent jaguars travelling (from one population to another); idea of corridor reducing chances of breeding / less chances of jaguar finding a mate; reduces genetic flow / reduces gene pool; jaguars more likely to encounter people (now that dam is built); prey scared away / less food; AVP; 4
What was in this paper
The subtopics covered by these 3 questions, and how many questions each got. Open one in a new tab to see every Cambridge question on it.
What you needed in this session
Cambridge’s own grade thresholds for 2021 Oct/Nov, Paper 2 · Variant 1. A higher threshold means an easier paper — the bar moves with how the cohort did.