Cambridge IGCSE Environmental Management 0680 — 2018 May/June Paper 2 · Variant 2
0680/22/M/J/18 · 2 questions · 80 marks · ≈90 min
The question paper and its mark scheme, free to read here and free to download. This is Cambridge’s own paper, exactly as it was sat.
Question paper16 pages


Mark scheme10 pages
Answers below. Sit the paper first if you are practising.
Questions as text
Q1 · The diagram shows the structure of the atmosphere
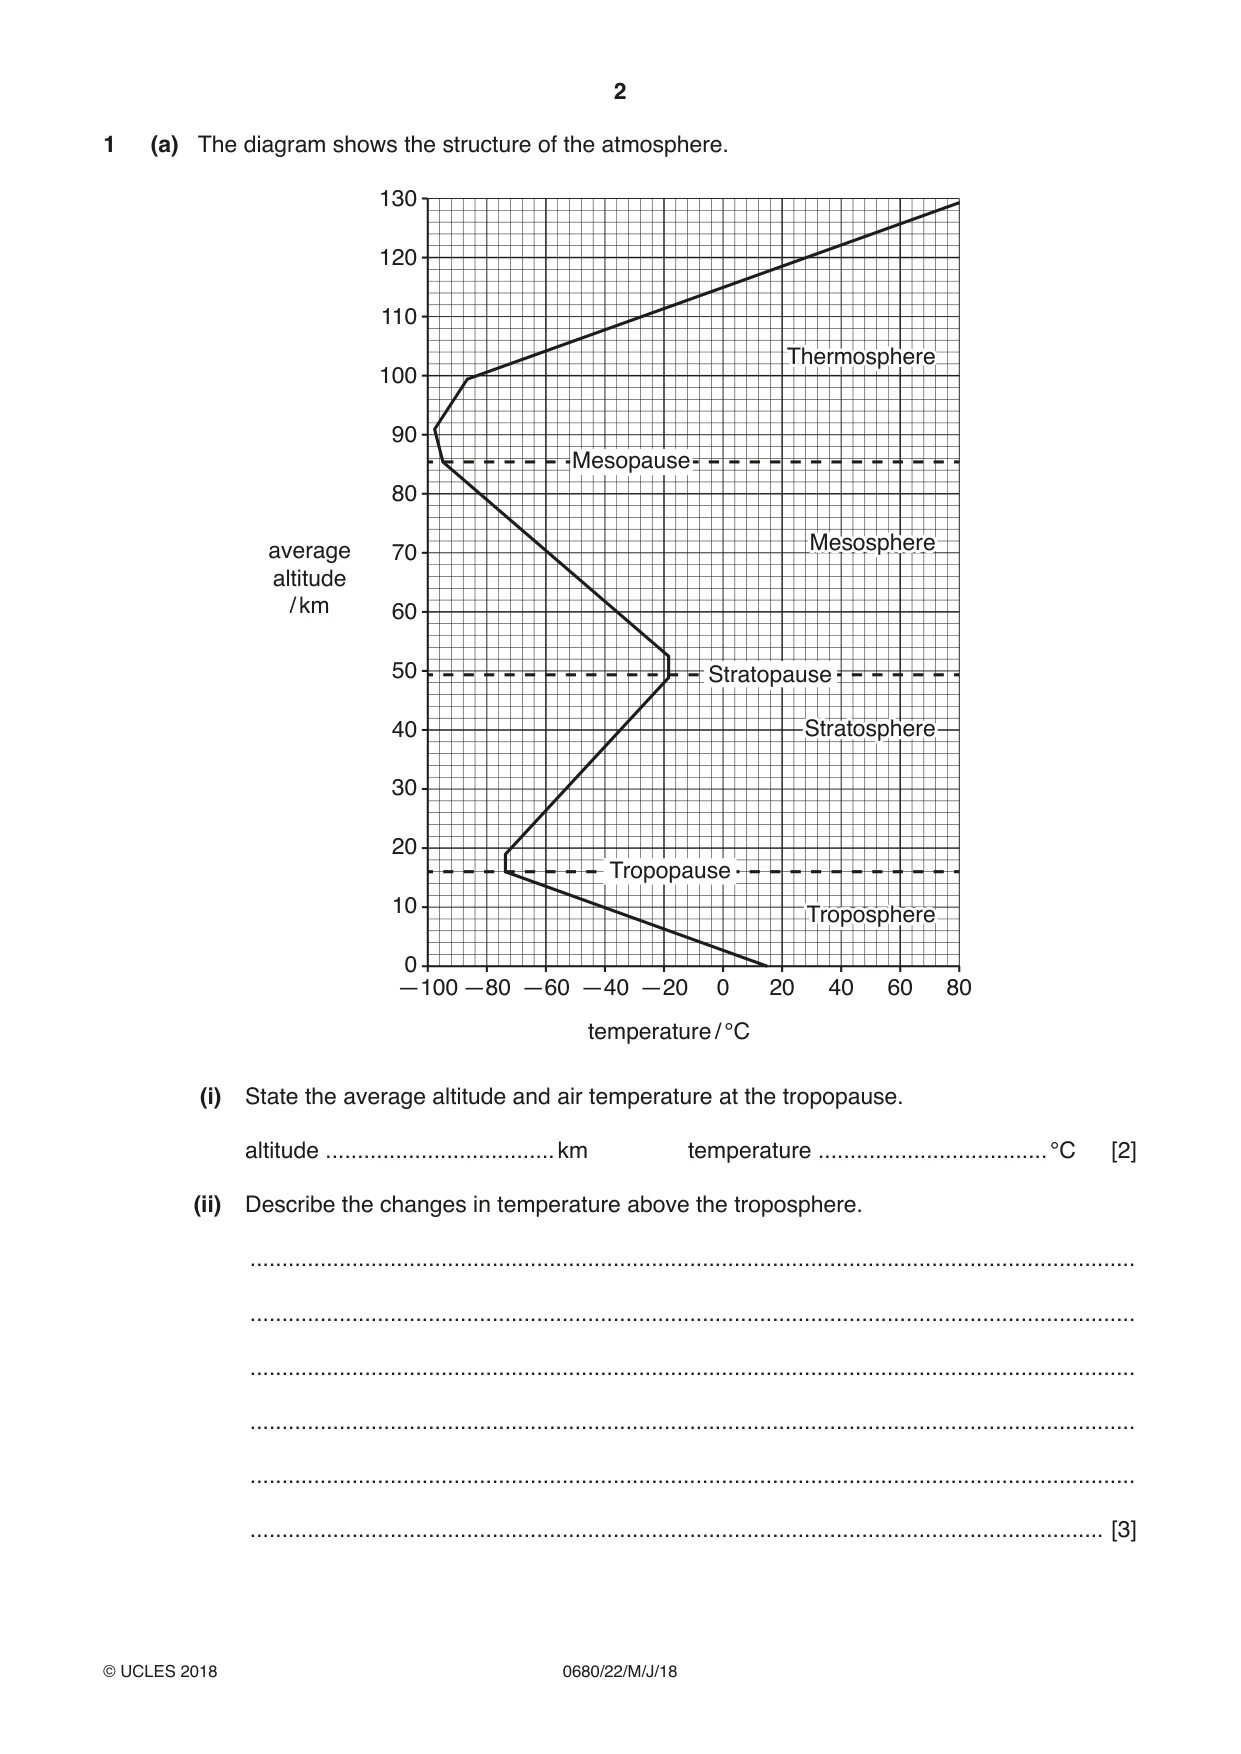
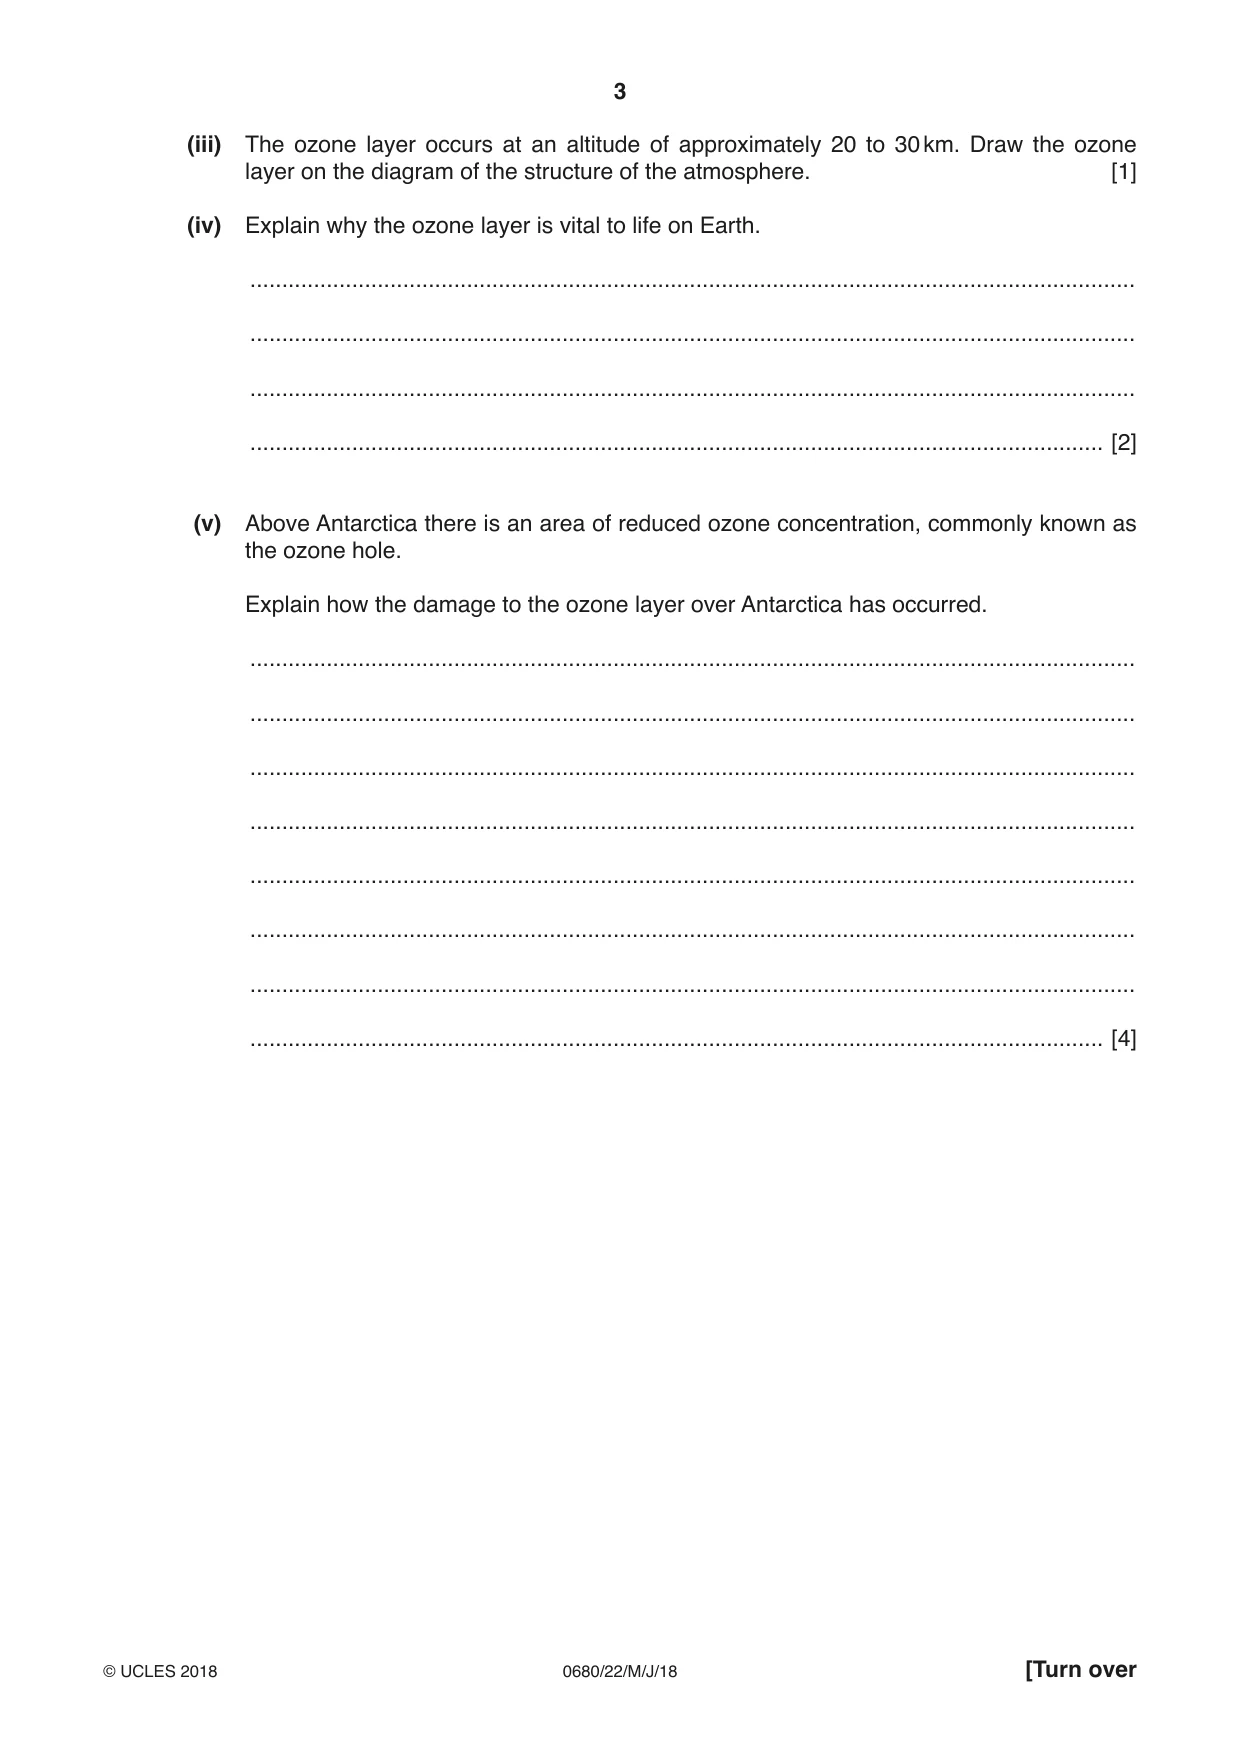
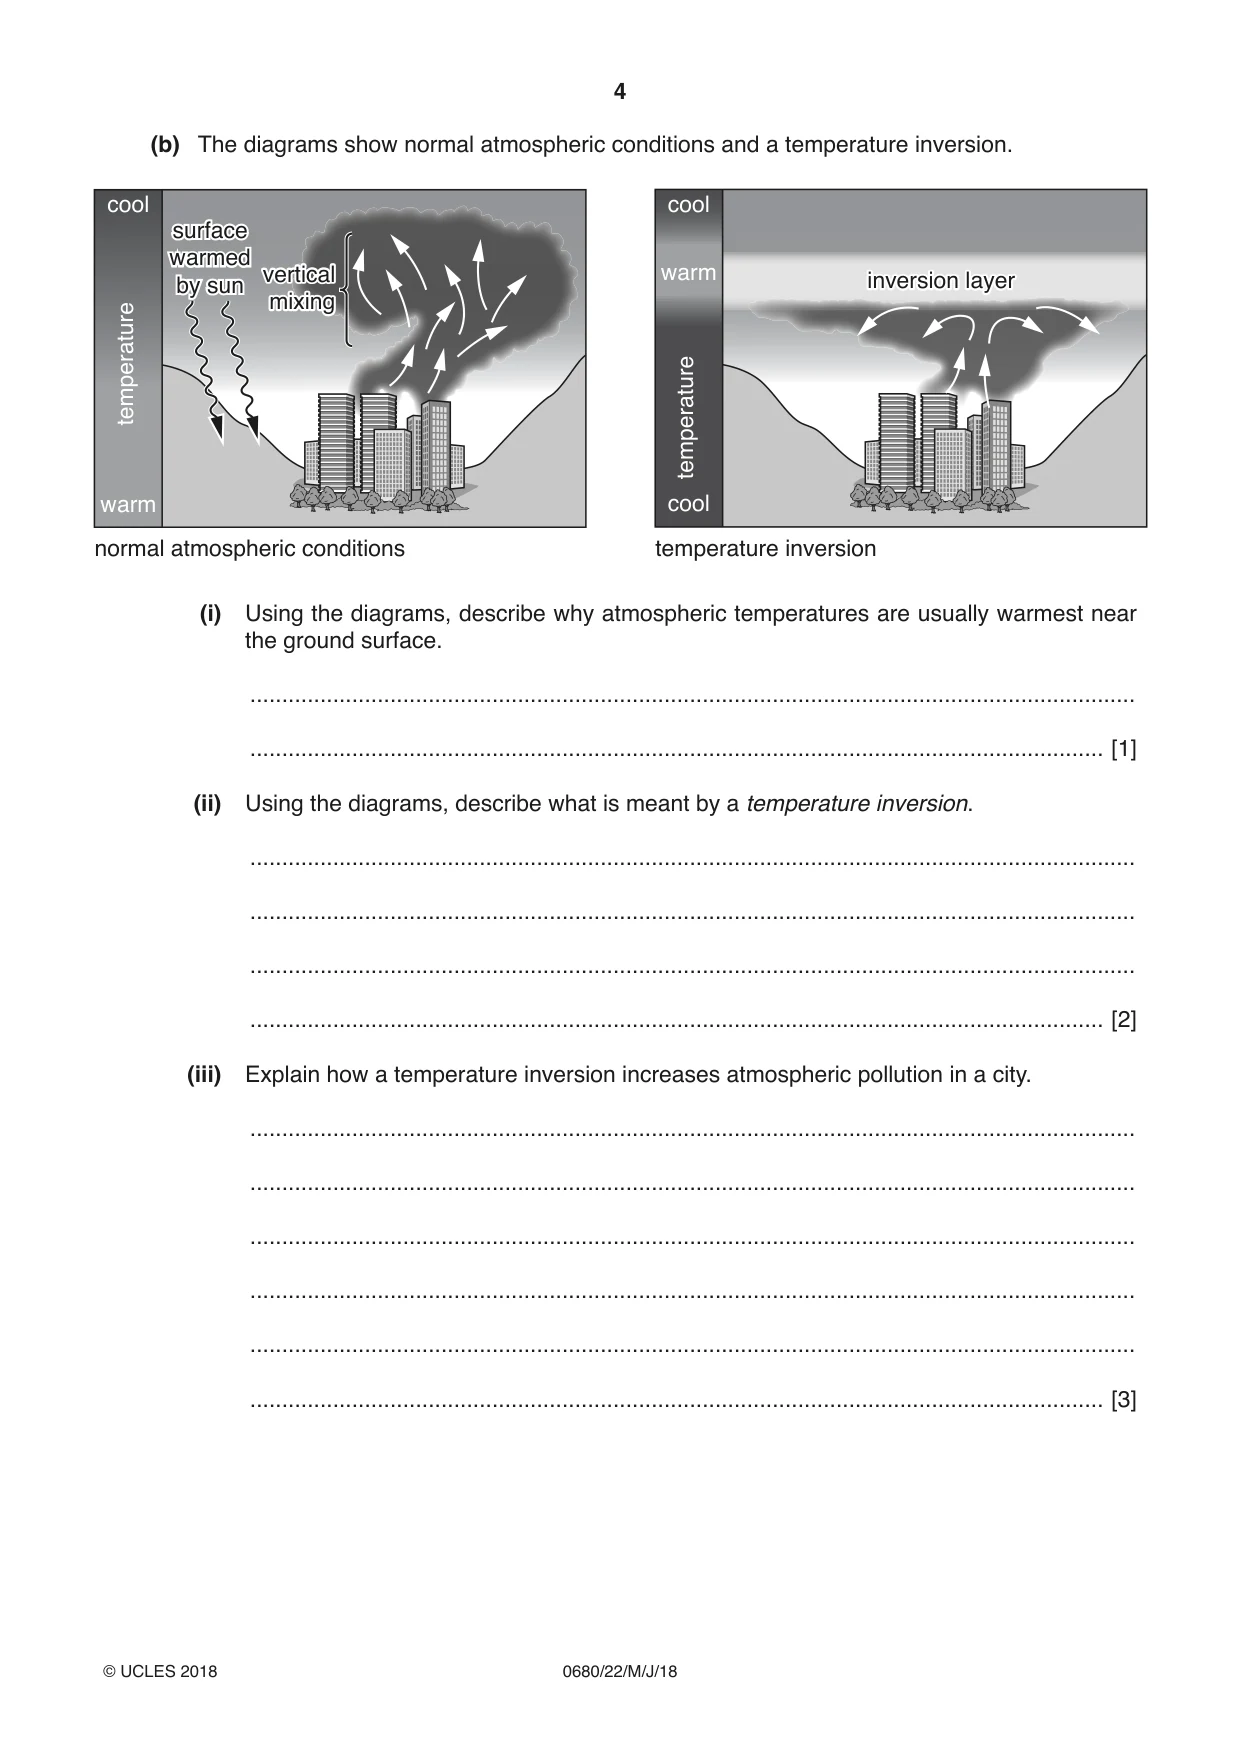
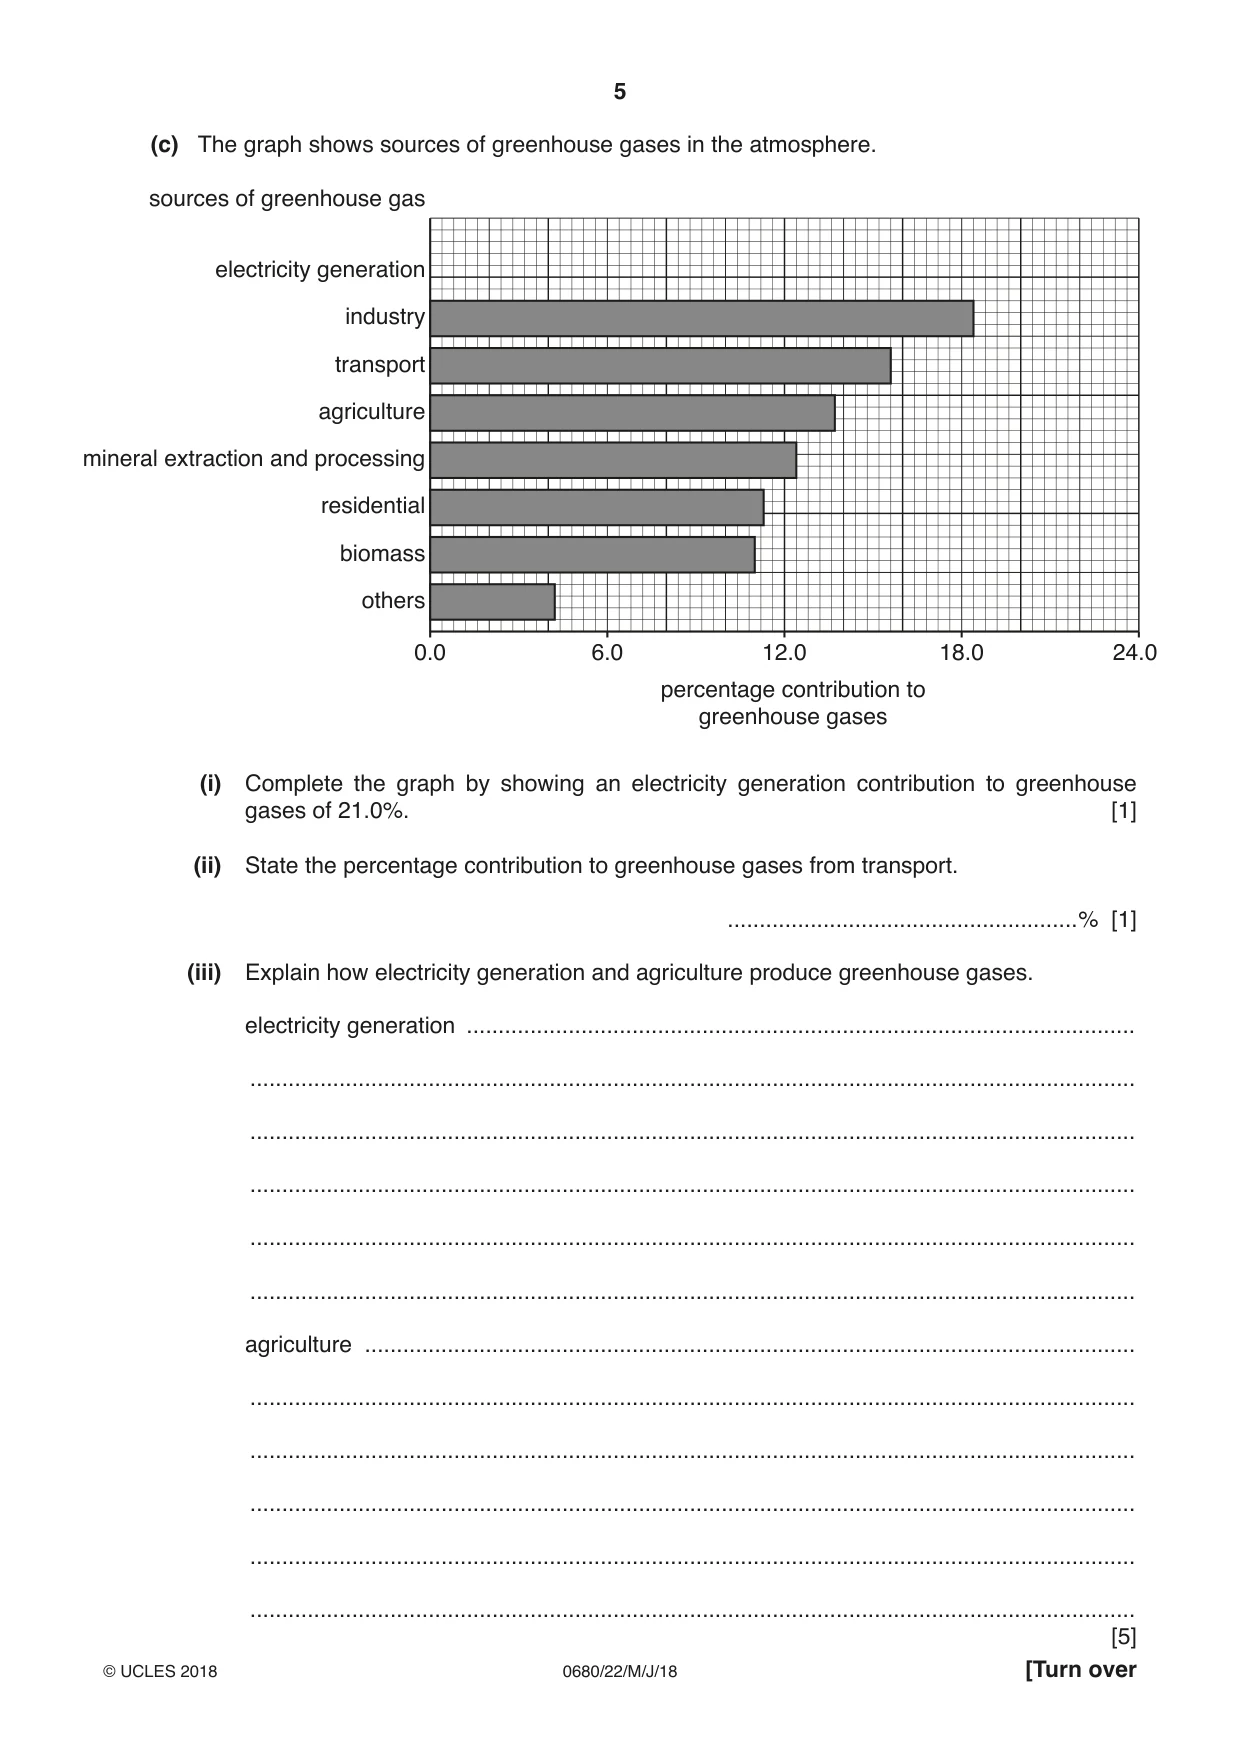
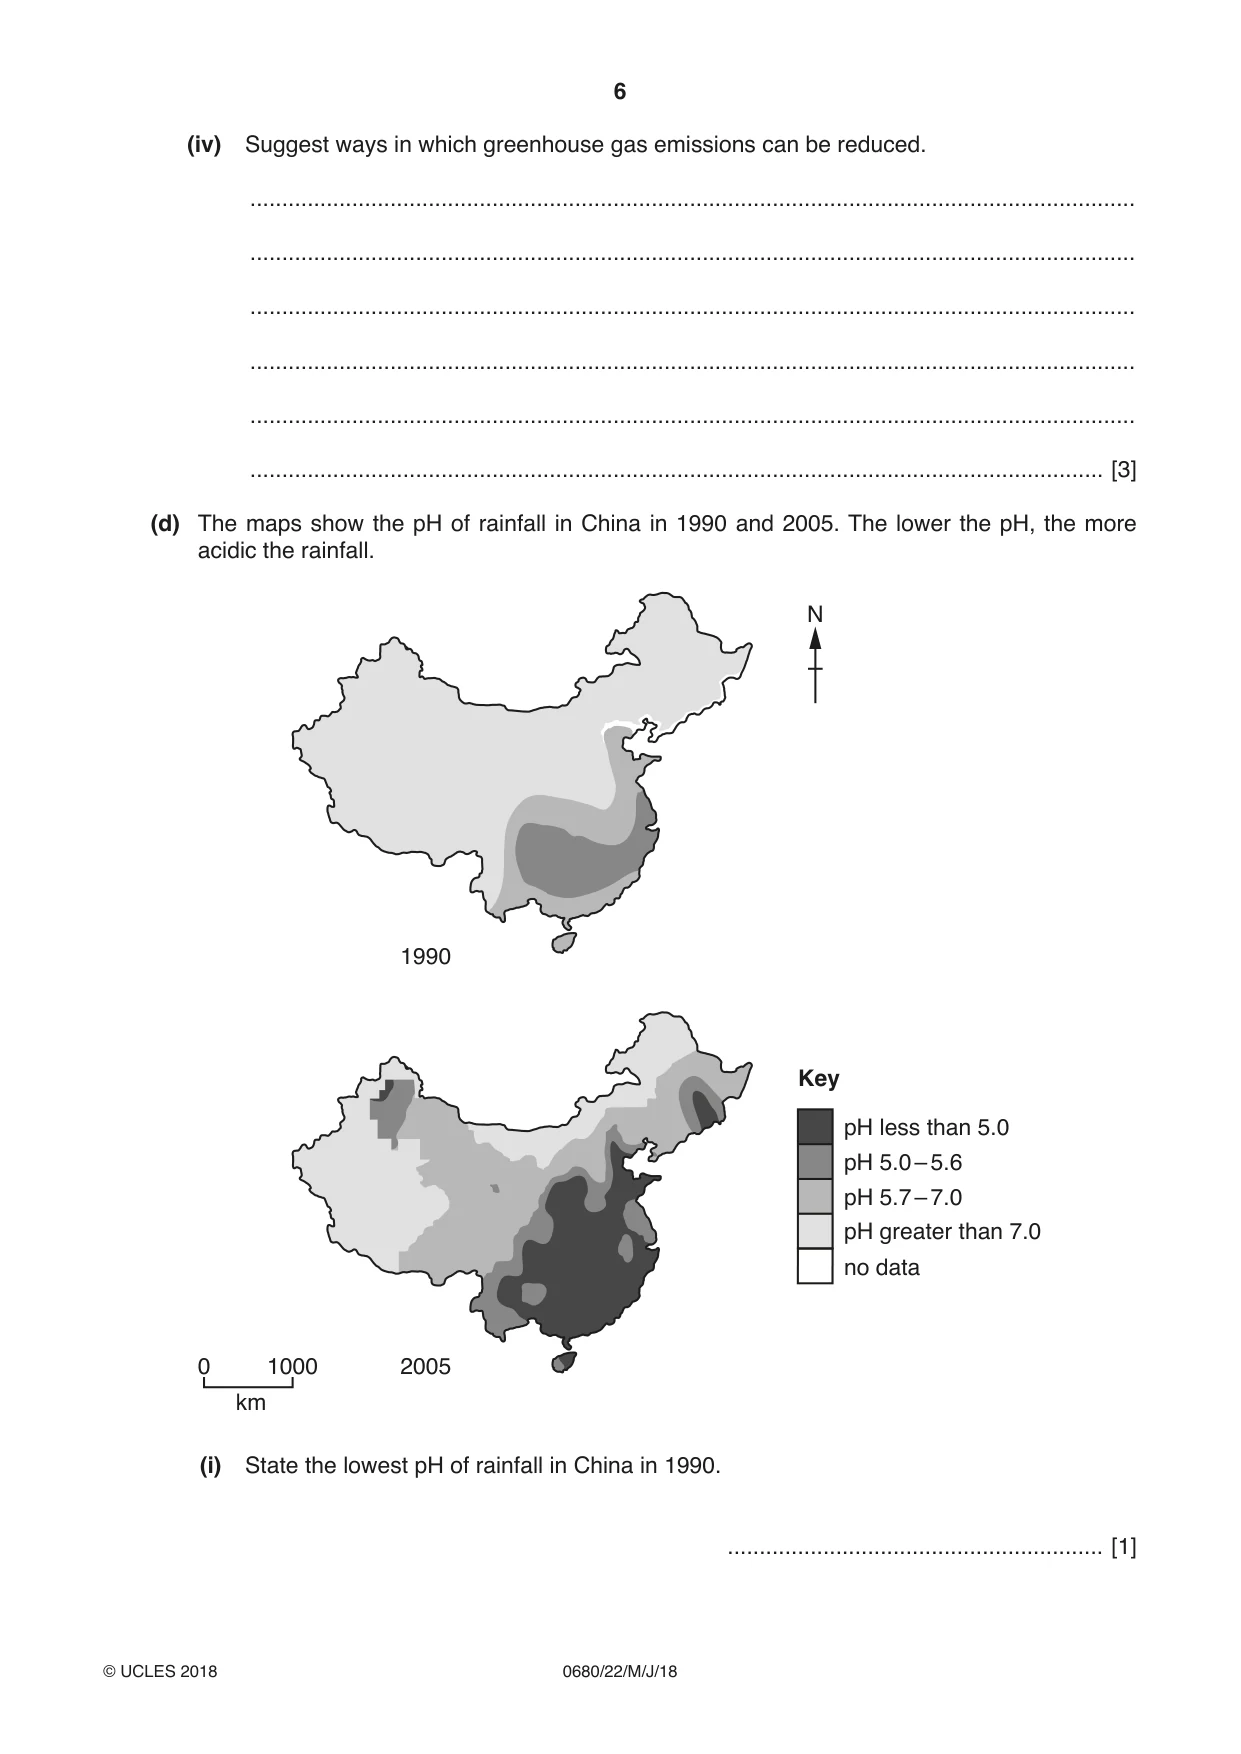
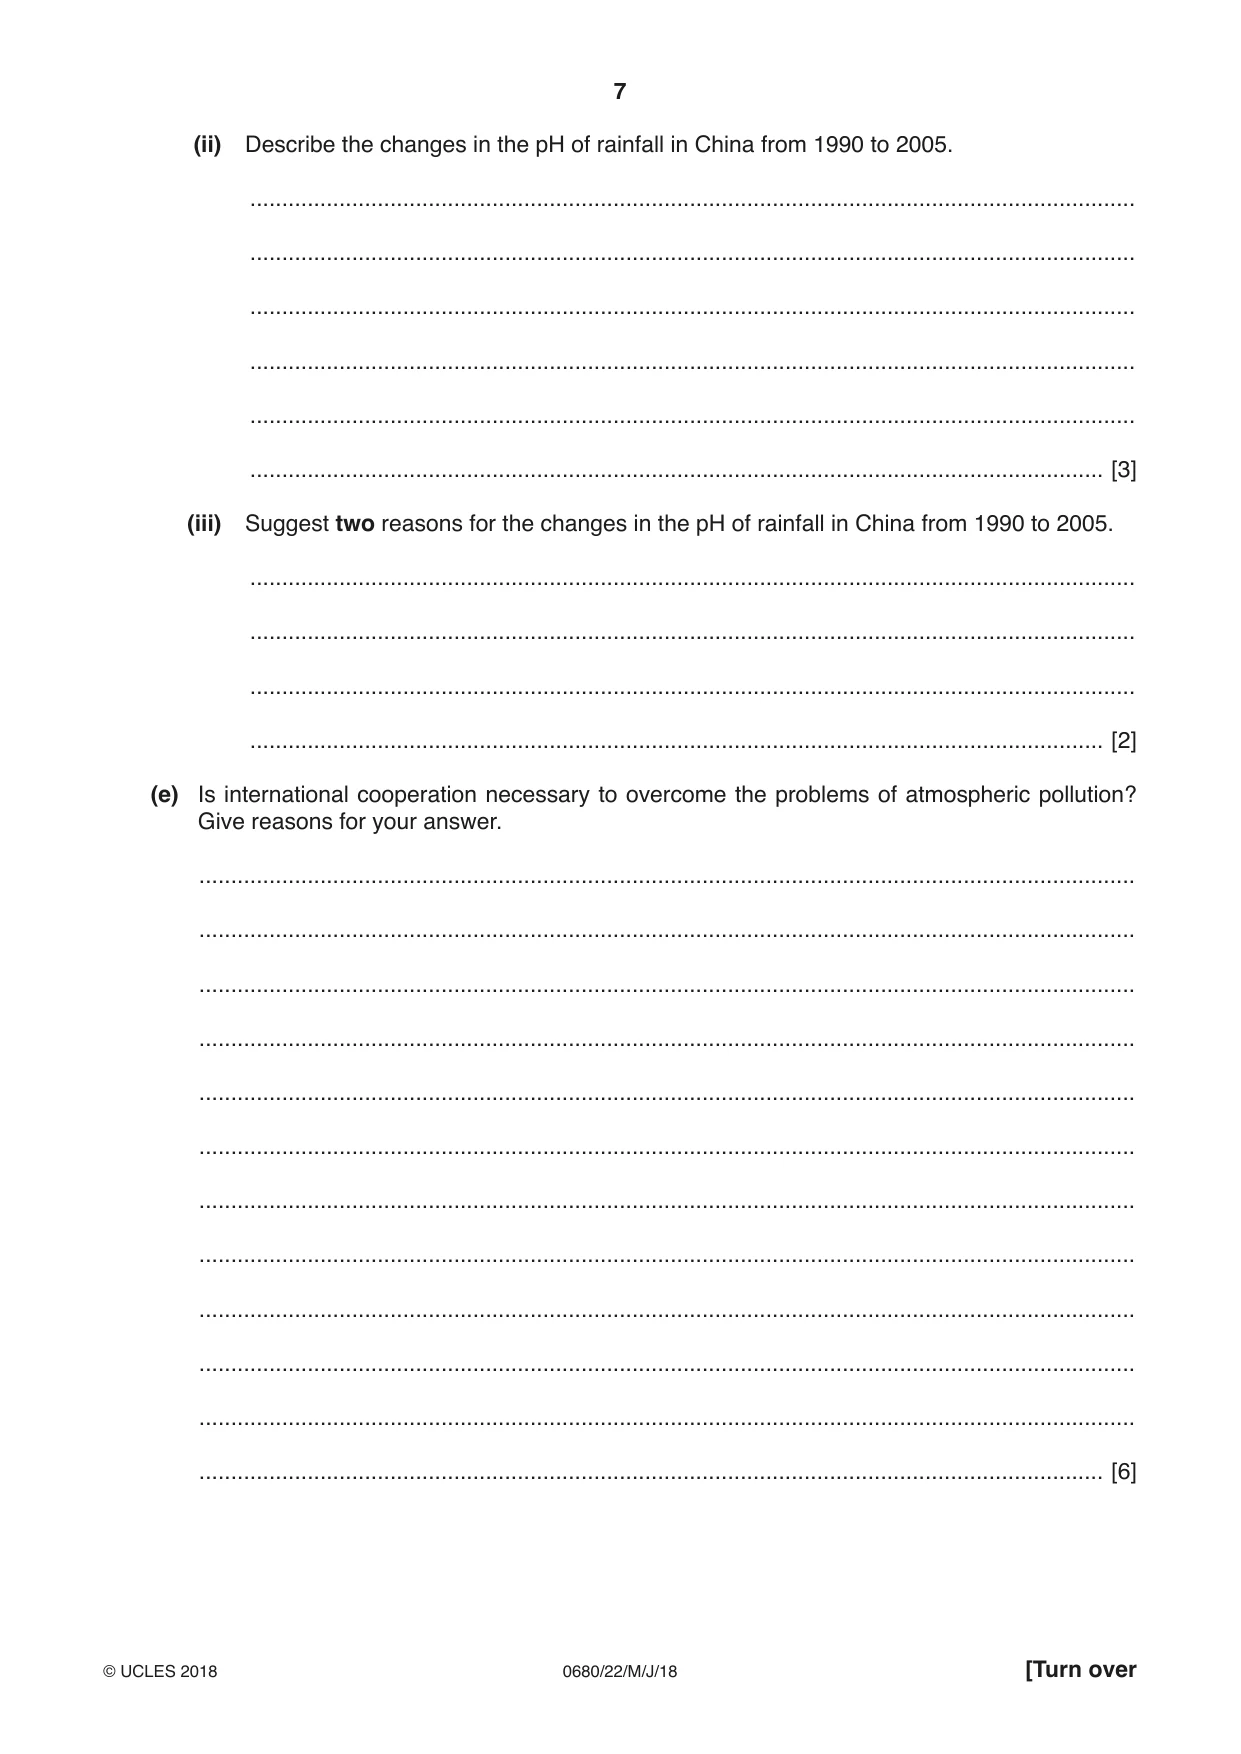
1 (a) The diagram shows the structure of the atmosphere. 130 120 110 ThermosphereThermosphere 100 90 MesopauseMesopause 80 MesosphereMesosphere average 70 altitude / km 60 50 StratopauseStratopause 40 StratosphereStratosphere 30 20 TropopauseTropopause 10 TroposphereTroposphere 0 —100 —80 —60 —40 —20 0 20 40 60 80 temperature / °C (i) State the average altitude and air temperature at the tropopause. altitude .................................... km temperature .................................... °C [2] (ii) Describe the changes in temperature above the troposphere. ........................................................................................................................................... ........................................................................................................................................... ........................................................................................................................................... ........................................................................................................................................... ........................................................................................................................................... ...................................................................................................................................... [3] (iii) The ozone layer occurs at an altitude of approximately 20 to 30 km. Draw the ozone layer on the diagram of the structure of the atmosphere. [1] (iv) Explain why the ozone layer is vital to life on Earth. ........................................................................................................................................... ........................................................................................................................................... ........................................................................................................................................... ...................................................................................................................................... [2] (v) Above Antarctica there is an area of reduced ozone concentration, commonly known as the ozone hole. Explain how the damage to the ozone layer over Antarctica has occurred. ........................................................................................................................................... ........................................................................................................................................... ........................................................................................................................................... ........................................................................................................................................... ........................................................................................................................................... ........................................................................................................................................... ........................................................................................................................................... ...................................................................................................................................... [4] (b) The diagrams show normal atmospheric conditions and a temperature inversion. cool cool surfacesurface warmedwarmed verticalvertical warm byby sunsun inversioninversion layerlayer mixingmixing temperature temperature warm cool normal atmospheric conditions temperature inversion (i) Using the diagrams, describe why atmospheric temperatures are usually warmest near the ground surface. ........................................................................................................................................... ...................................................................................................................................... [1] (ii) Using the diagrams, describe what is meant by a temperature inversion. ........................................................................................................................................... ........................................................................................................................................... ........................................................................................................................................... ...................................................................................................................................... [2] (iii) Explain how a temperature inversion increases atmospheric pollution in a city. ........................................................................................................................................... ........................................................................................................................................... ........................................................................................................................................... ........................................................................................................................................... ........................................................................................................................................... ...................................................................................................................................... [3] (c) The graph shows sources of greenhouse gases in the atmosphere. sources of greenhouse gas electricity generation industry transport agriculture mineral extraction and processing residential biomass others 0.0 6.0 12.0 18.0 24.0 percentage contribution to greenhouse gases (i) Complete the graph by showing an electricity generation contribution to greenhouse gases of 21.0%. [1] (ii) State the percentage contribution to greenhouse gases from transport. .......................................................% [1] (iii) Explain how electricity generation and agriculture produce greenhouse gases. electricity generation ......................................................................................................... ........................................................................................................................................... ........................................................................................................................................... ........................................................................................................................................... ........................................................................................................................................... ........................................................................................................................................... agriculture ......................................................................................................................... ........................................................................................................................................... ........................................................................................................................................... ........................................................................................................................................... ........................................................................................................................................... ........................................................................................................................................... (iv) Suggest ways in which greenhouse gas emissions can be reduced. ........................................................................................................................................... ........................................................................................................................................... ........................................................................................................................................... ........................................................................................................................................... ........................................................................................................................................... ...................................................................................................................................... [3] (d) The maps show the pH of rainfall in China in 1990 and 2005. The lower the pH, the more acidic the rainfall. N 1990 Key pH less than 5.0 pH 5.0 – 5.6 pH 5.7 – 7.0 pH greater than 7.0 no data 0 1000 2005 km (i) State the lowest pH of rainfall in China in 1990. ........................................................... [1] (ii) Describe the changes in the pH of rainfall in China from 1990 to 2005. ........................................................................................................................................... ........................................................................................................................................... ........................................................................................................................................... ........................................................................................................................................... ........................................................................................................................................... ...................................................................................................................................... [3] (iii) Suggest two reasons for the changes in the pH of rainfall in China from 1990 to 2005. ........................................................................................................................................... ........................................................................................................................................... ........................................................................................................................................... ...................................................................................................................................... [2] (e) Is international cooperation necessary to overcome the problems of atmospheric pollution? Give reasons for your answer. ................................................................................................................................................... ................................................................................................................................................... ................................................................................................................................................... ................................................................................................................................................... ................................................................................................................................................... ................................................................................................................................................... ................................................................................................................................................... ................................................................................................................................................... ................................................................................................................................................... ................................................................................................................................................... ................................................................................................................................................... .............................................................................................................................................. [6]
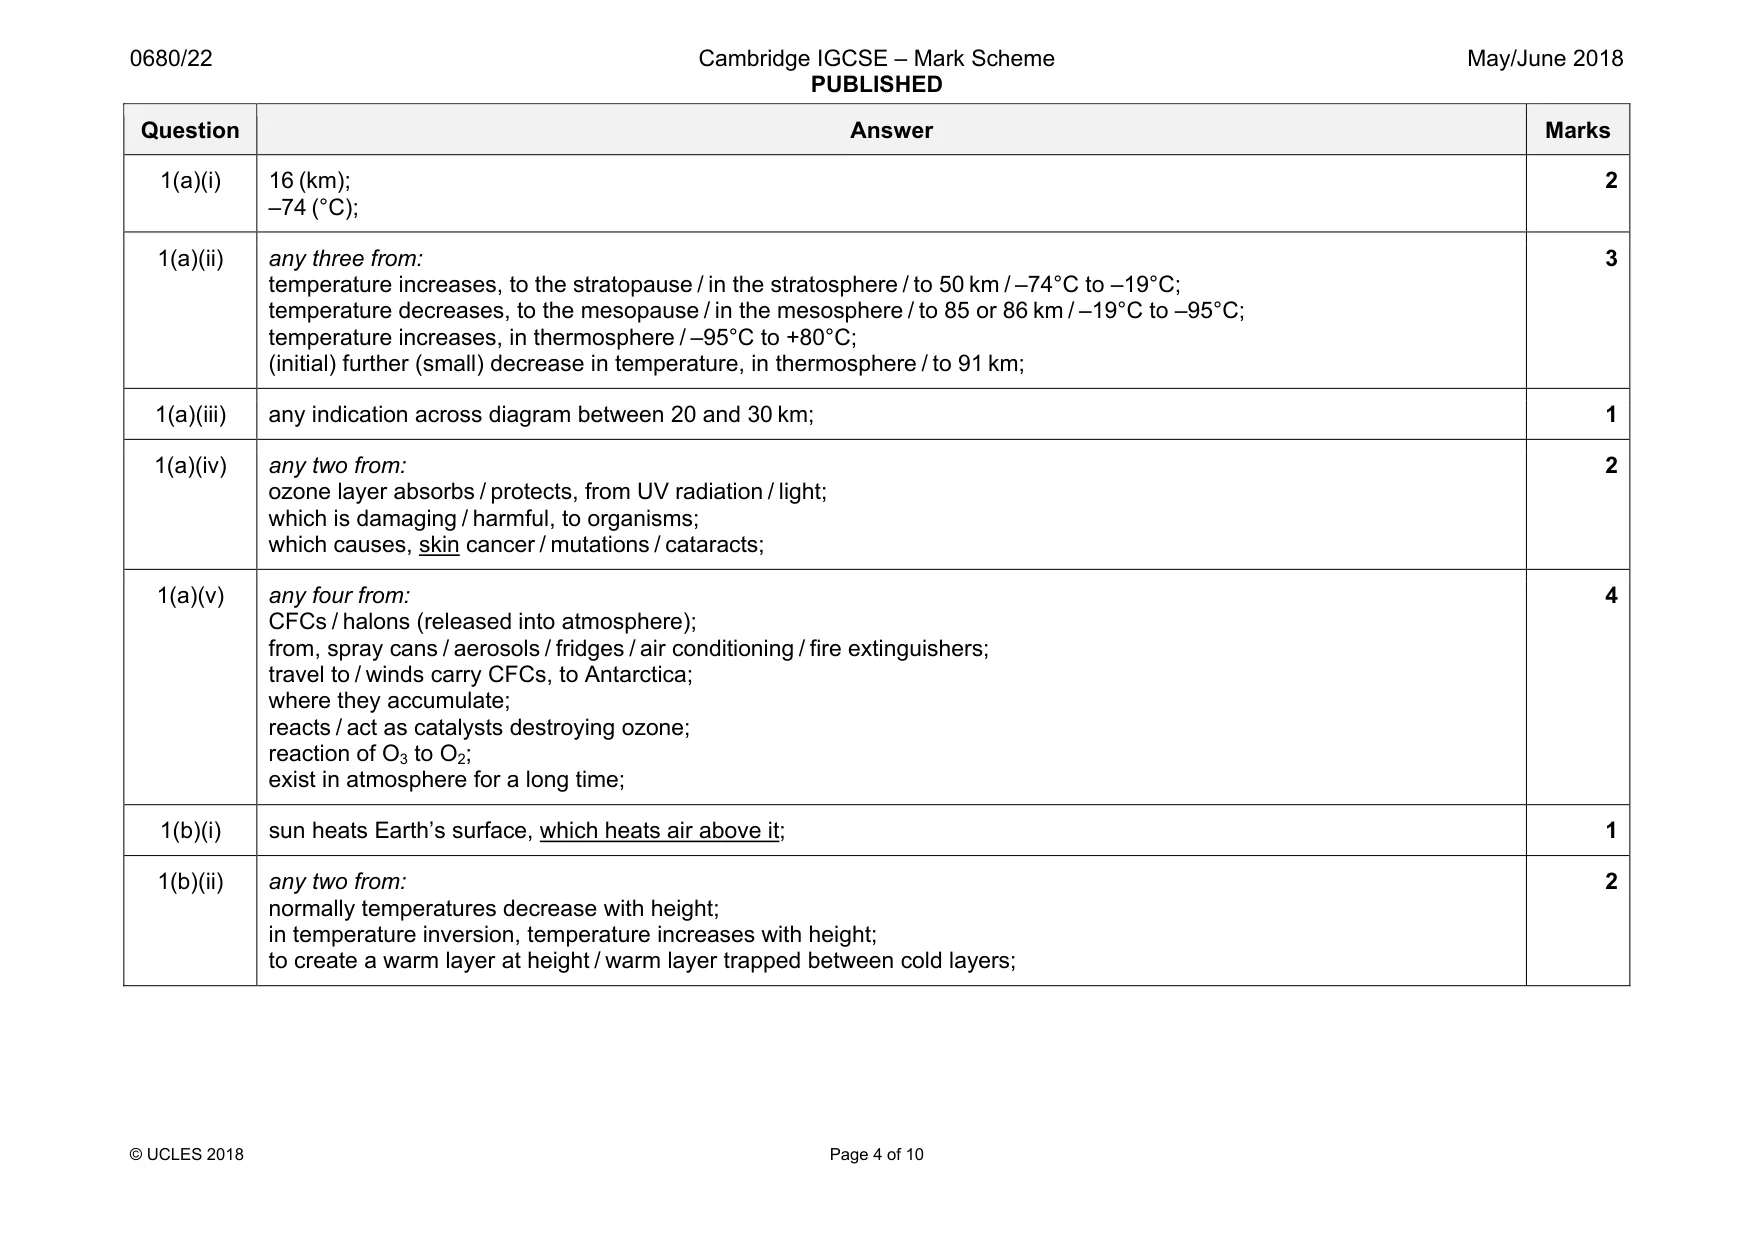
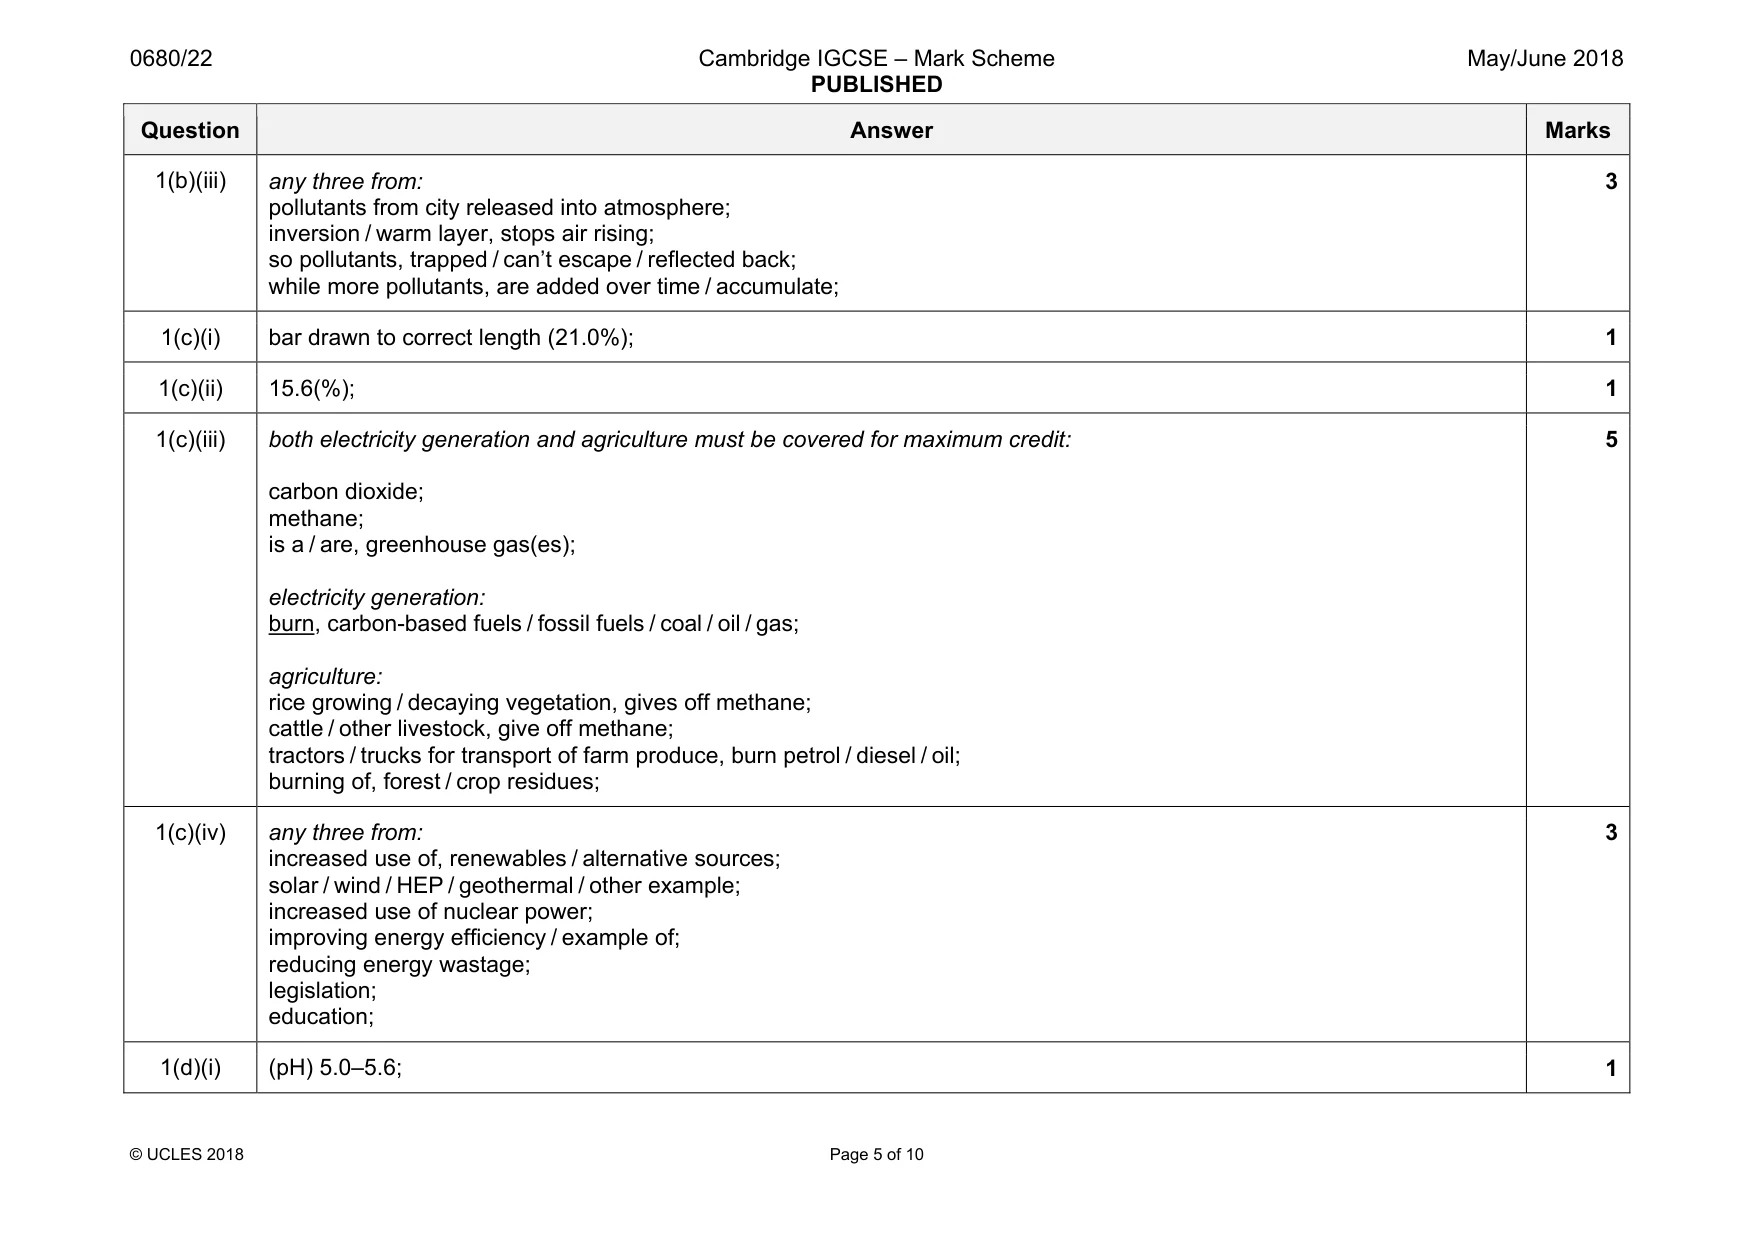
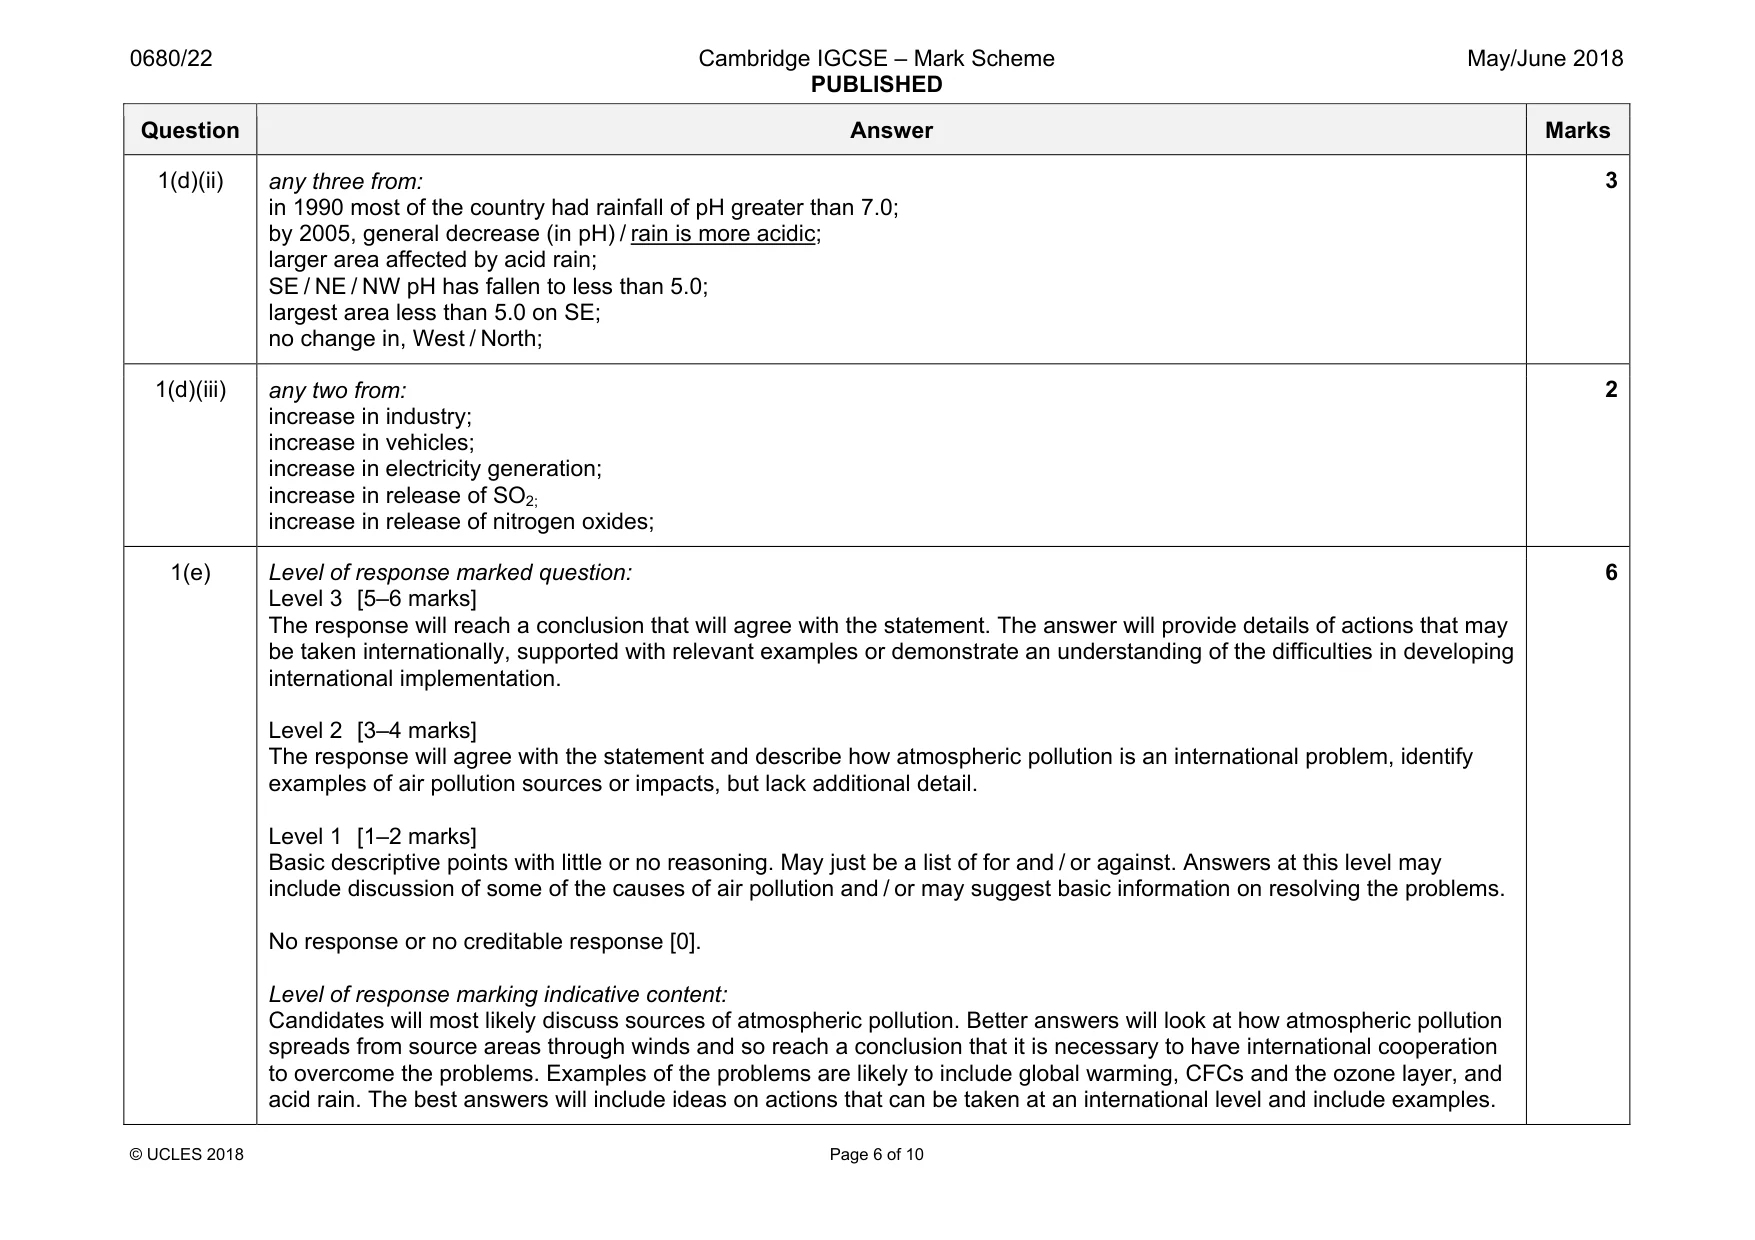
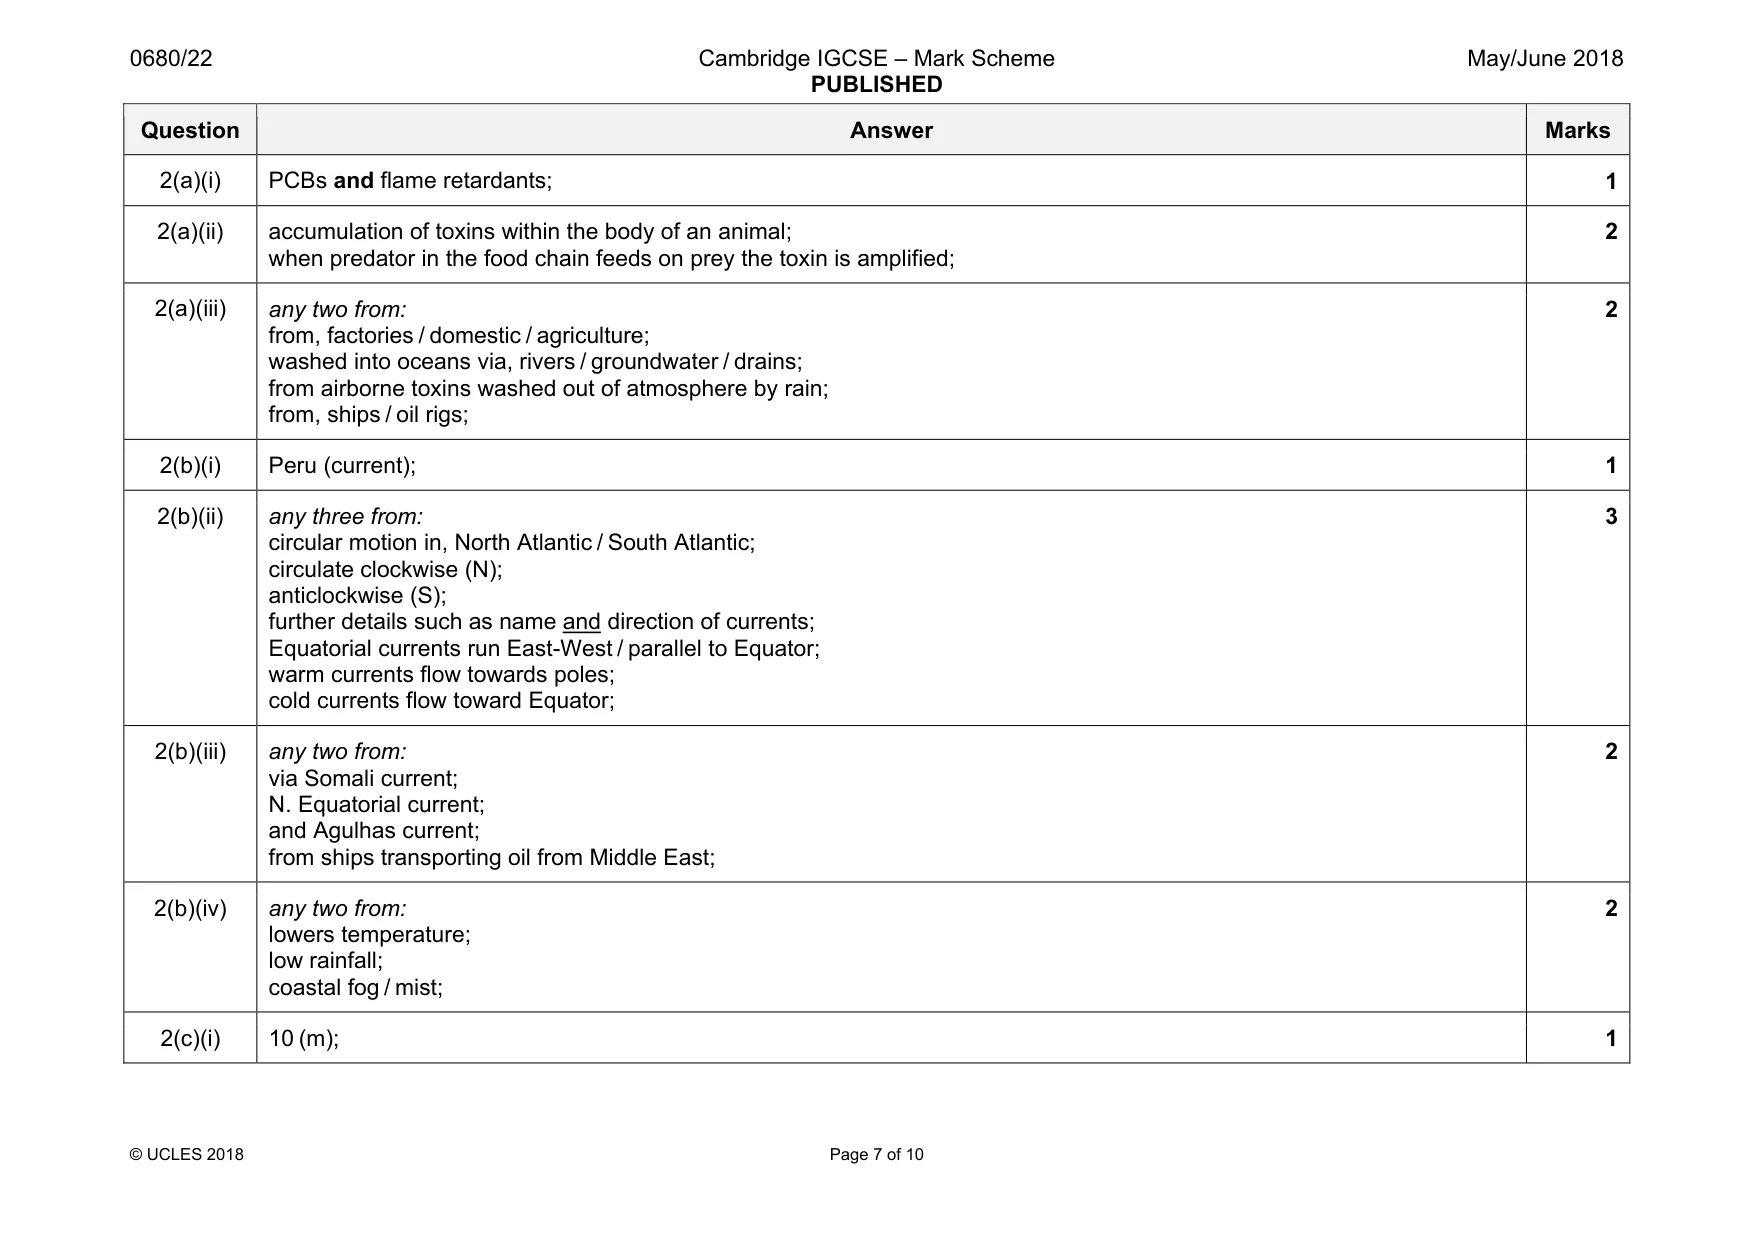
Mark scheme: 1(a)(i) 16 (km); –74 (°C); 2 1(a)(ii) any three from: temperature increases, to the stratopause / in the stratosphere / to 50 km / –74°C to –19°C; temperature decreases, to the mesopause / in the mesosphere / to 85 or 86 km / –19°C to –95°C; temperature increases, in thermosphere / –95°C to +80°C; (initial) further (small) decrease in temperature, in thermosphere / to 91 km; 3 1(a)(iii) any indication across diagram between 20 and 30 km; 1 1(a)(iv) any two from: ozone layer absorbs / protects, from UV radiation / light; which is damaging / harmful, to organisms; which causes, skin cancer / mutations / cataracts; 2 1(a)(v) any four from: CFCs / halons (released into atmosphere); from, spray cans / aerosols / fridges / air conditioning / fire extinguishers; travel to / winds carry CFCs, to Antarctica; where they accumulate; reacts / act as catalysts destroying ozone; reaction of O3 to O2; exist in atmosphere for a long time; 4 1(b)(i) sun heats Earth’s surface, which heats air above it; 1 1(b)(ii) any two from: normally temperatures decrease with height; in temperature inversion, temperature increases with height; to create a warm layer at height / warm layer trapped between cold layers; 2 Question Answer Marks 1(b)(iii) any three from: pollutants from city released into atmosphere; inversion / warm layer, stops air rising; so pollutants, trapped / can’t escape / reflected back; while more pollutants, are added over time / accumulate; 3 1(c)(i) bar drawn to correct length (21.0%); 1 1(c)(ii) 15.6(%); 1 1(c)(iii) both electricity generation and agriculture must be covered for maximum credit: carbon dioxide; methane; is a / are, greenhouse gas(es); electricity generation: burn, carbon-based fuels / fossil fuels / coal / oil / gas; agriculture: rice growing / decaying vegetation, gives off methane; cattle / other livestock, give off methane; tractors / trucks for transport of farm produce, burn petrol / diesel / oil; burning of, forest / crop residues; 5 1(c)(iv) any three from: increased use of, renewables / alternative sources; solar / wind / HEP / geothermal / other example; increased use of nuclear power; improving energy efficiency / example of; reducing energy wastage; legislation; education; 3 1(d)(i) (pH) 5.0–5.6; 1 Question Answer Marks 1(d)(ii) any three from: in 1990 most of the country had rainfall of pH greater than 7.0; by 2005, general decrease (in pH) / rain is more acidic; larger area affected by acid rain; SE / NE / NW pH has fallen to less than 5.0; largest area less than 5.0 on SE; no change in, West / North; 3 1(d)(iii) any two from: increase in industry; increase in vehicles; increase in electricity generation; increase in release of SO2; increase in release of nitrogen oxides; 2 1(e) Level of response marked question: Level 3 [5–6 marks] The response will reach a conclusion that will agree with the statement. The answer will provide details of actions that may be taken internationally, supported with relevant examples or demonstrate an understanding of the difficulties in developing international implementation. Level 2 [3–4 marks] The response will agree with the statement and describe how atmospheric pollution is an international problem, identify examples of air pollution sources or impacts, but lack additional detail. Level 1 [1–2 marks] Basic descriptive points with little or no reasoning. May just be a list of for and / or against. Answers at this level may include discussion of some of the causes of air pollution and / or may suggest basic information on resolving the problems. No response or no creditable response [0]. Level of response marking indicative content: Candidates will most likely discuss sources of atmospheric pollution. Better answers will look at how atmospheric pollution spreads from source areas through winds and so reach a conclusion that it is necessary to have international cooperation to overcome the problems. Examples of the problems are likely to include global warming, CFCs and the ozone layer, and acid rain. The best answers will include ideas on actions that can be taken at an international level and include examples. 6
Q2 · The newspaper article is about the link between toxins (pollutants) in the oceans and the…
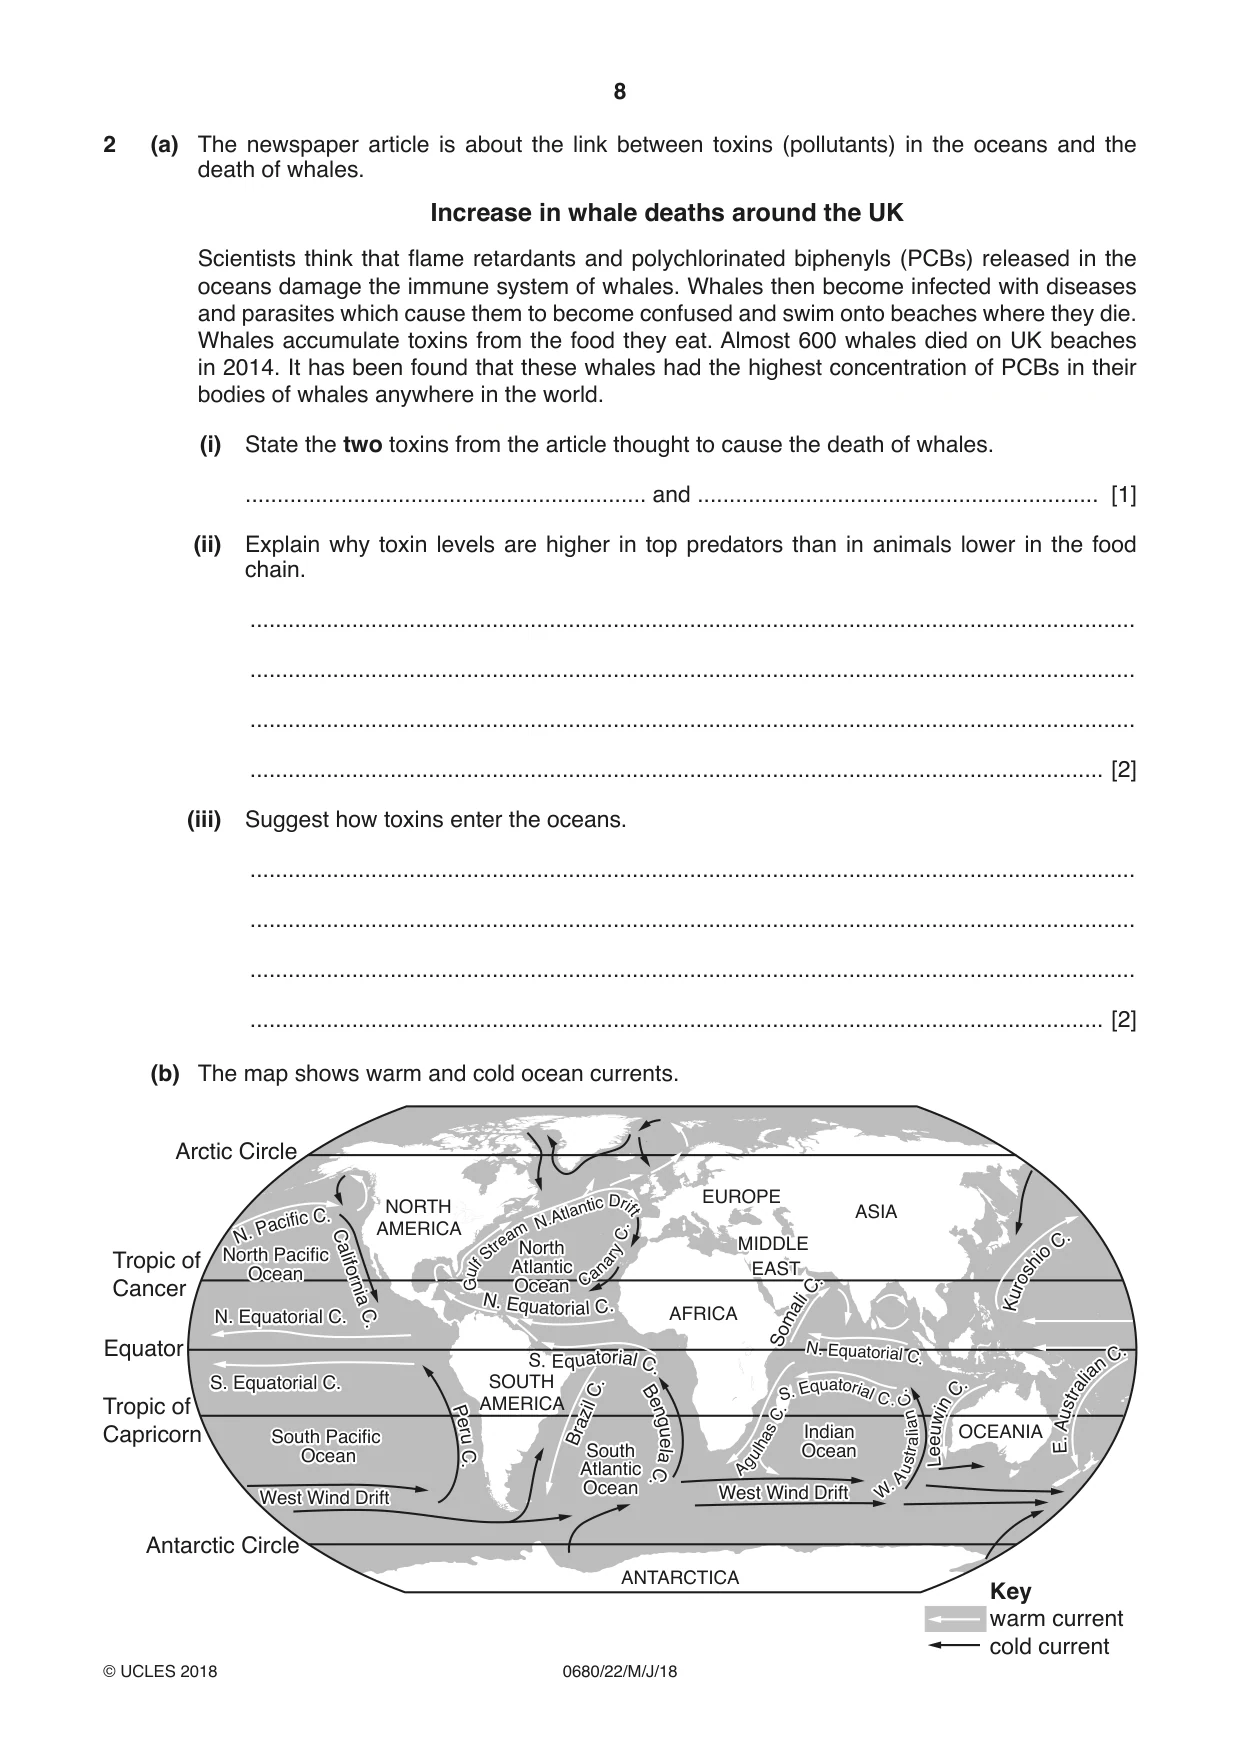
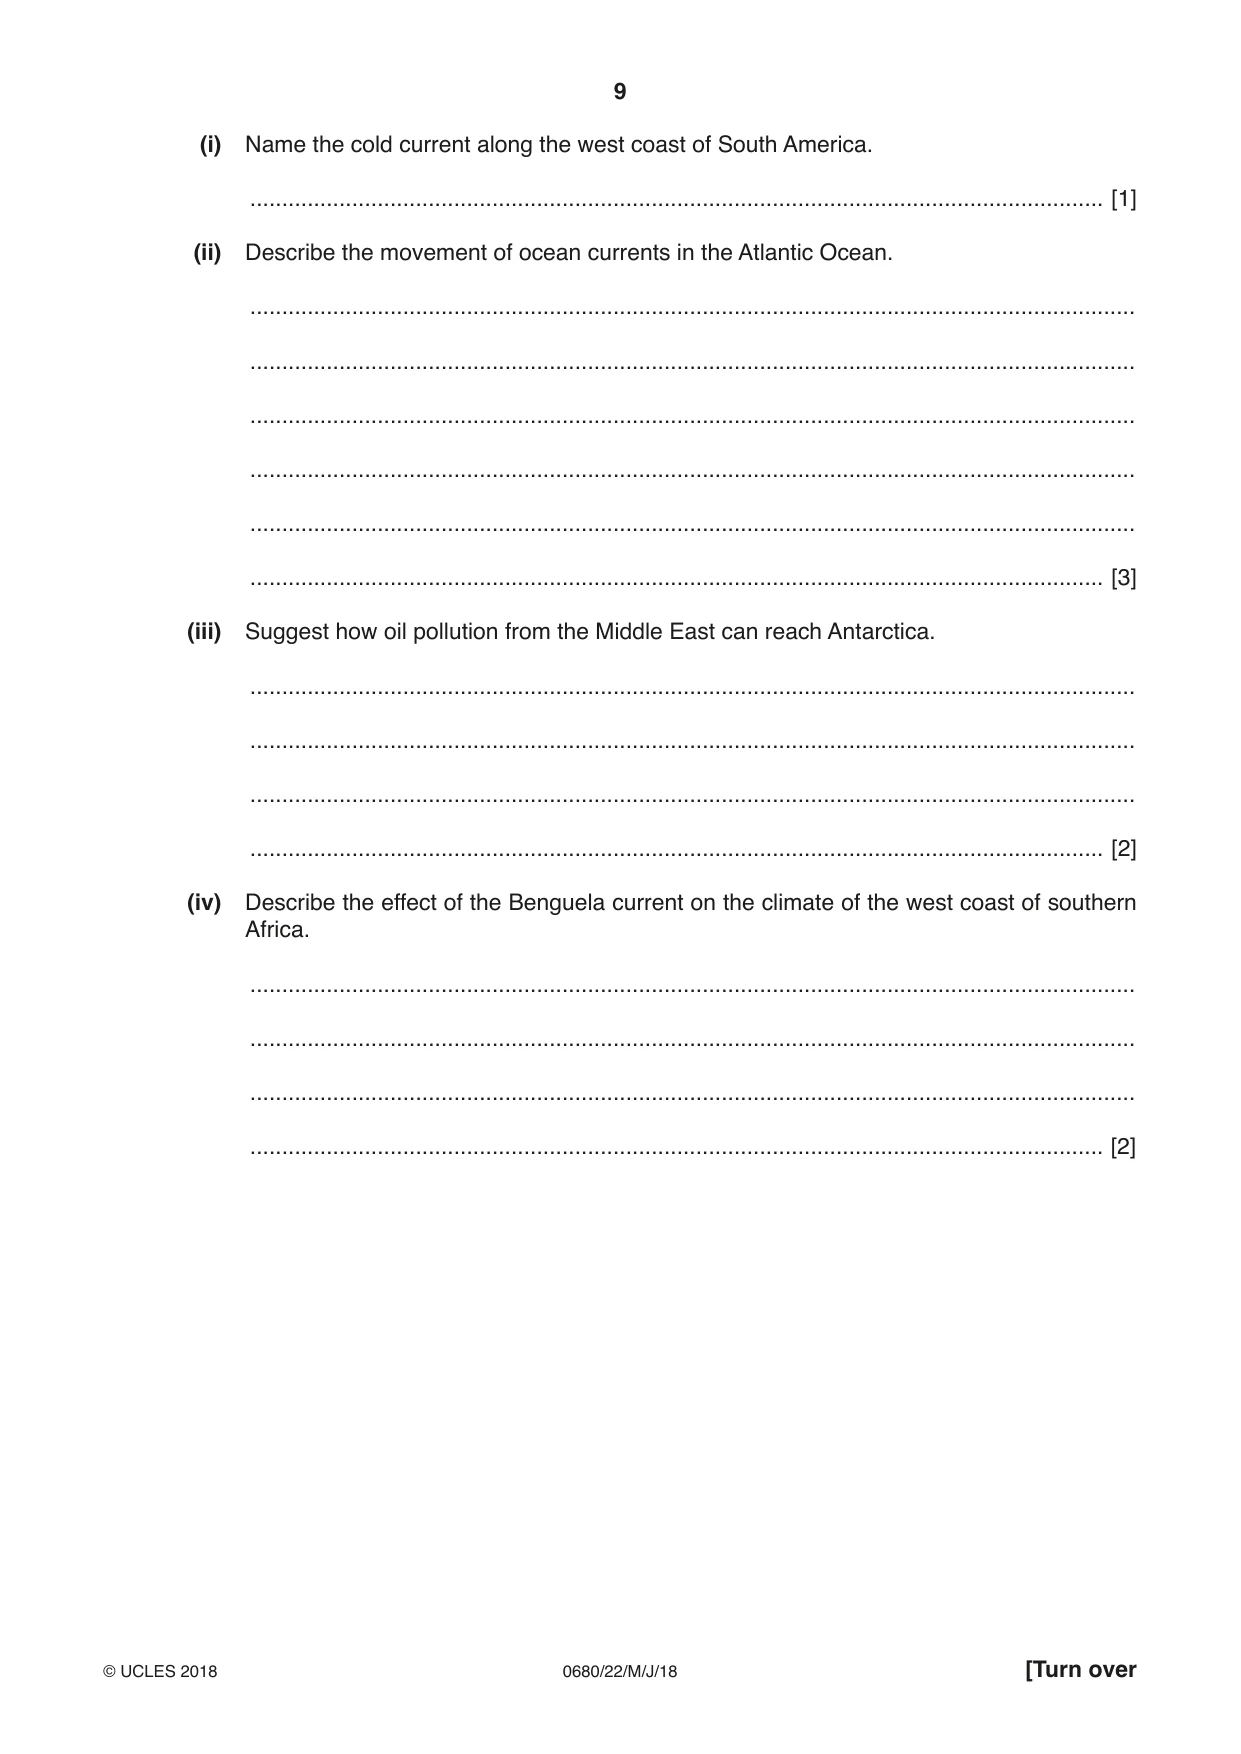
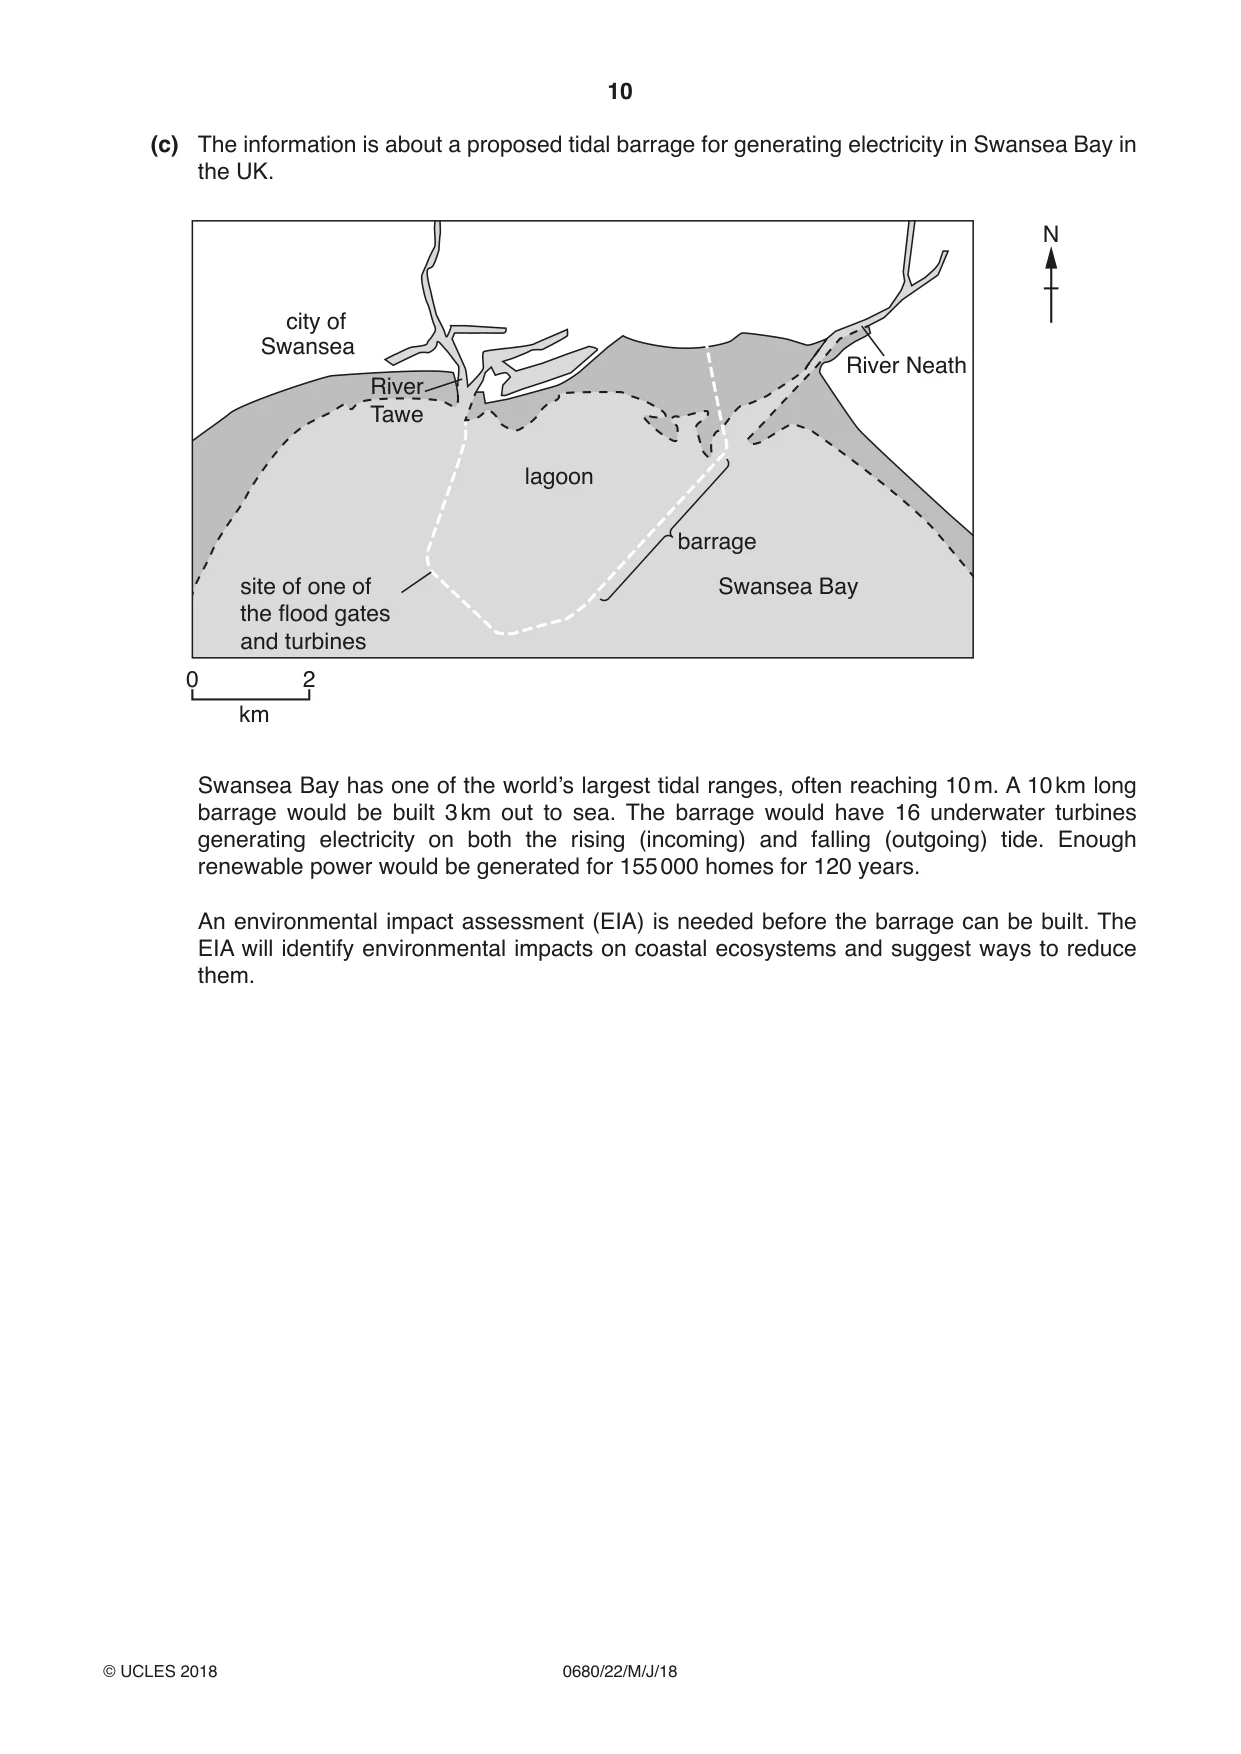
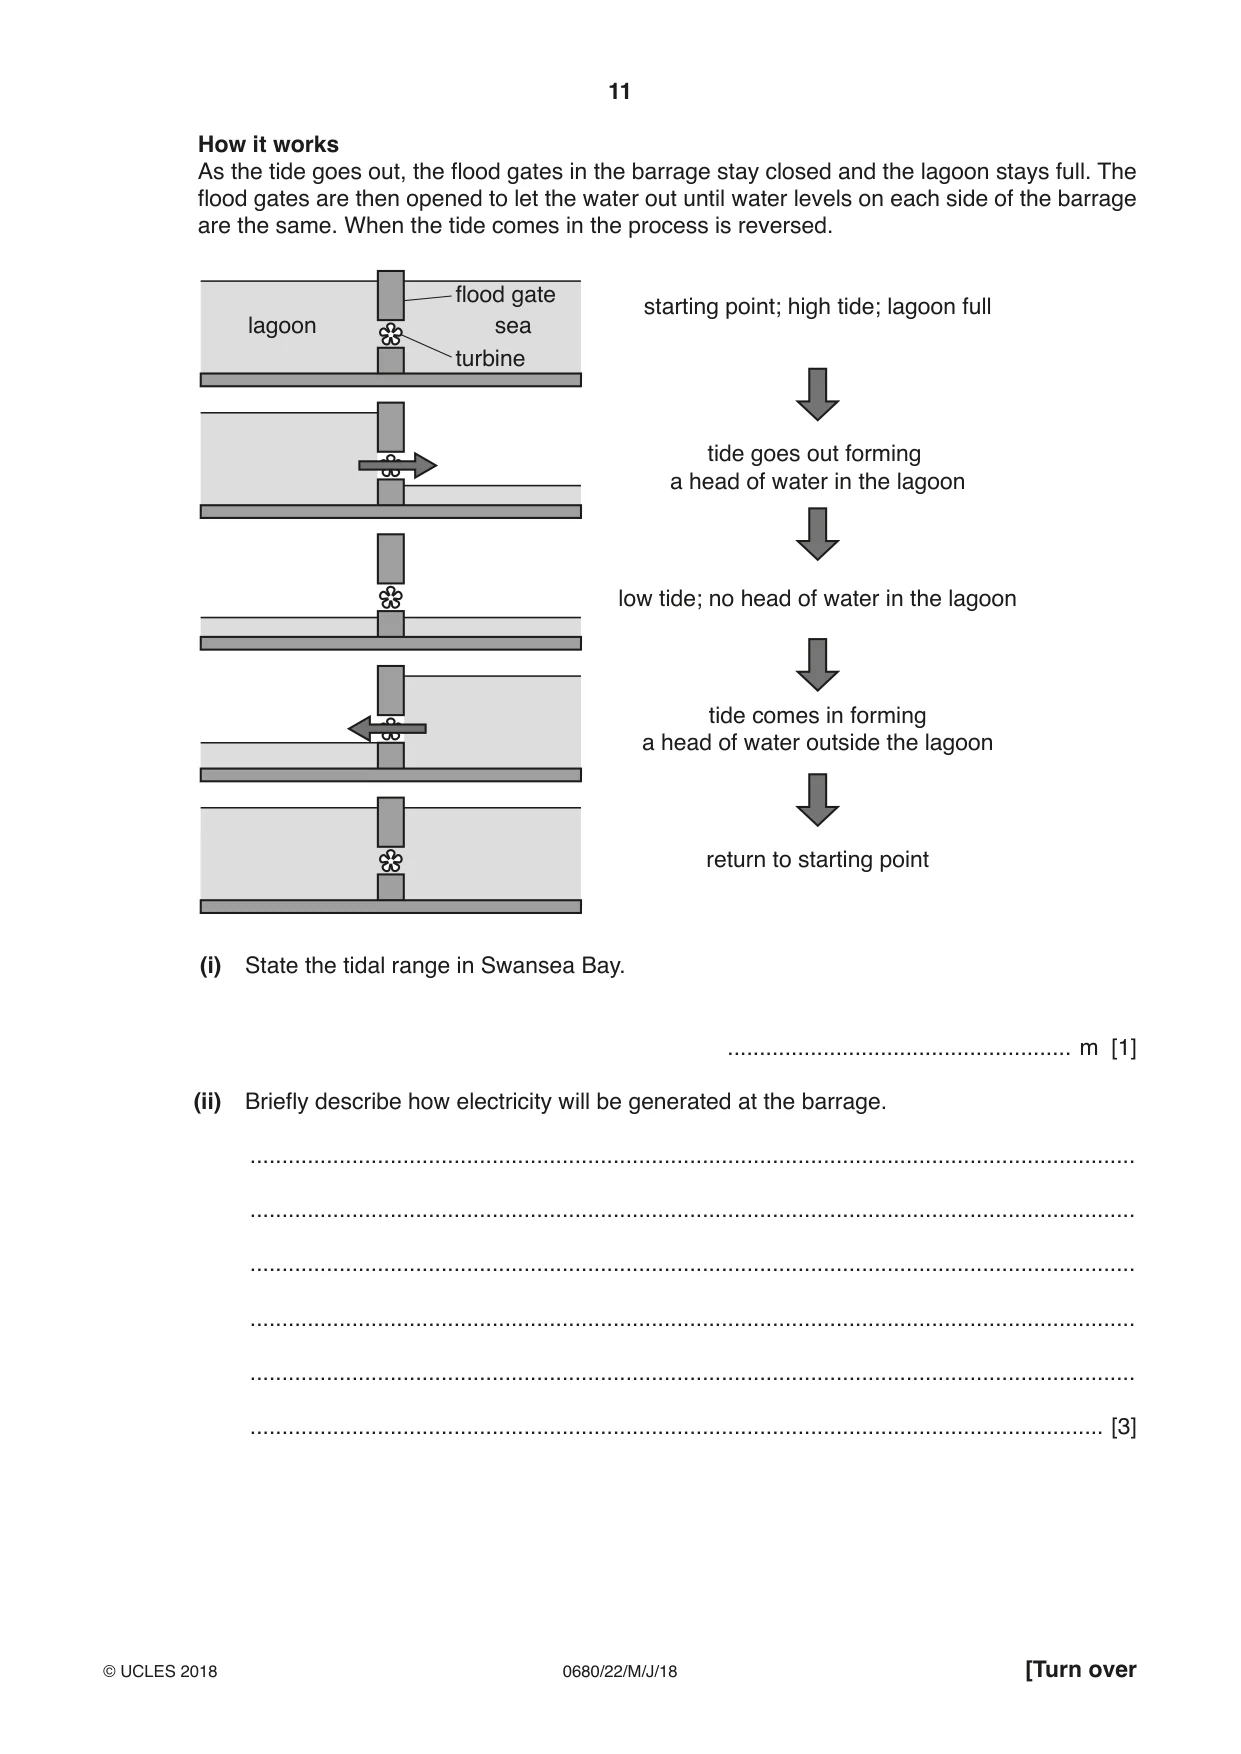
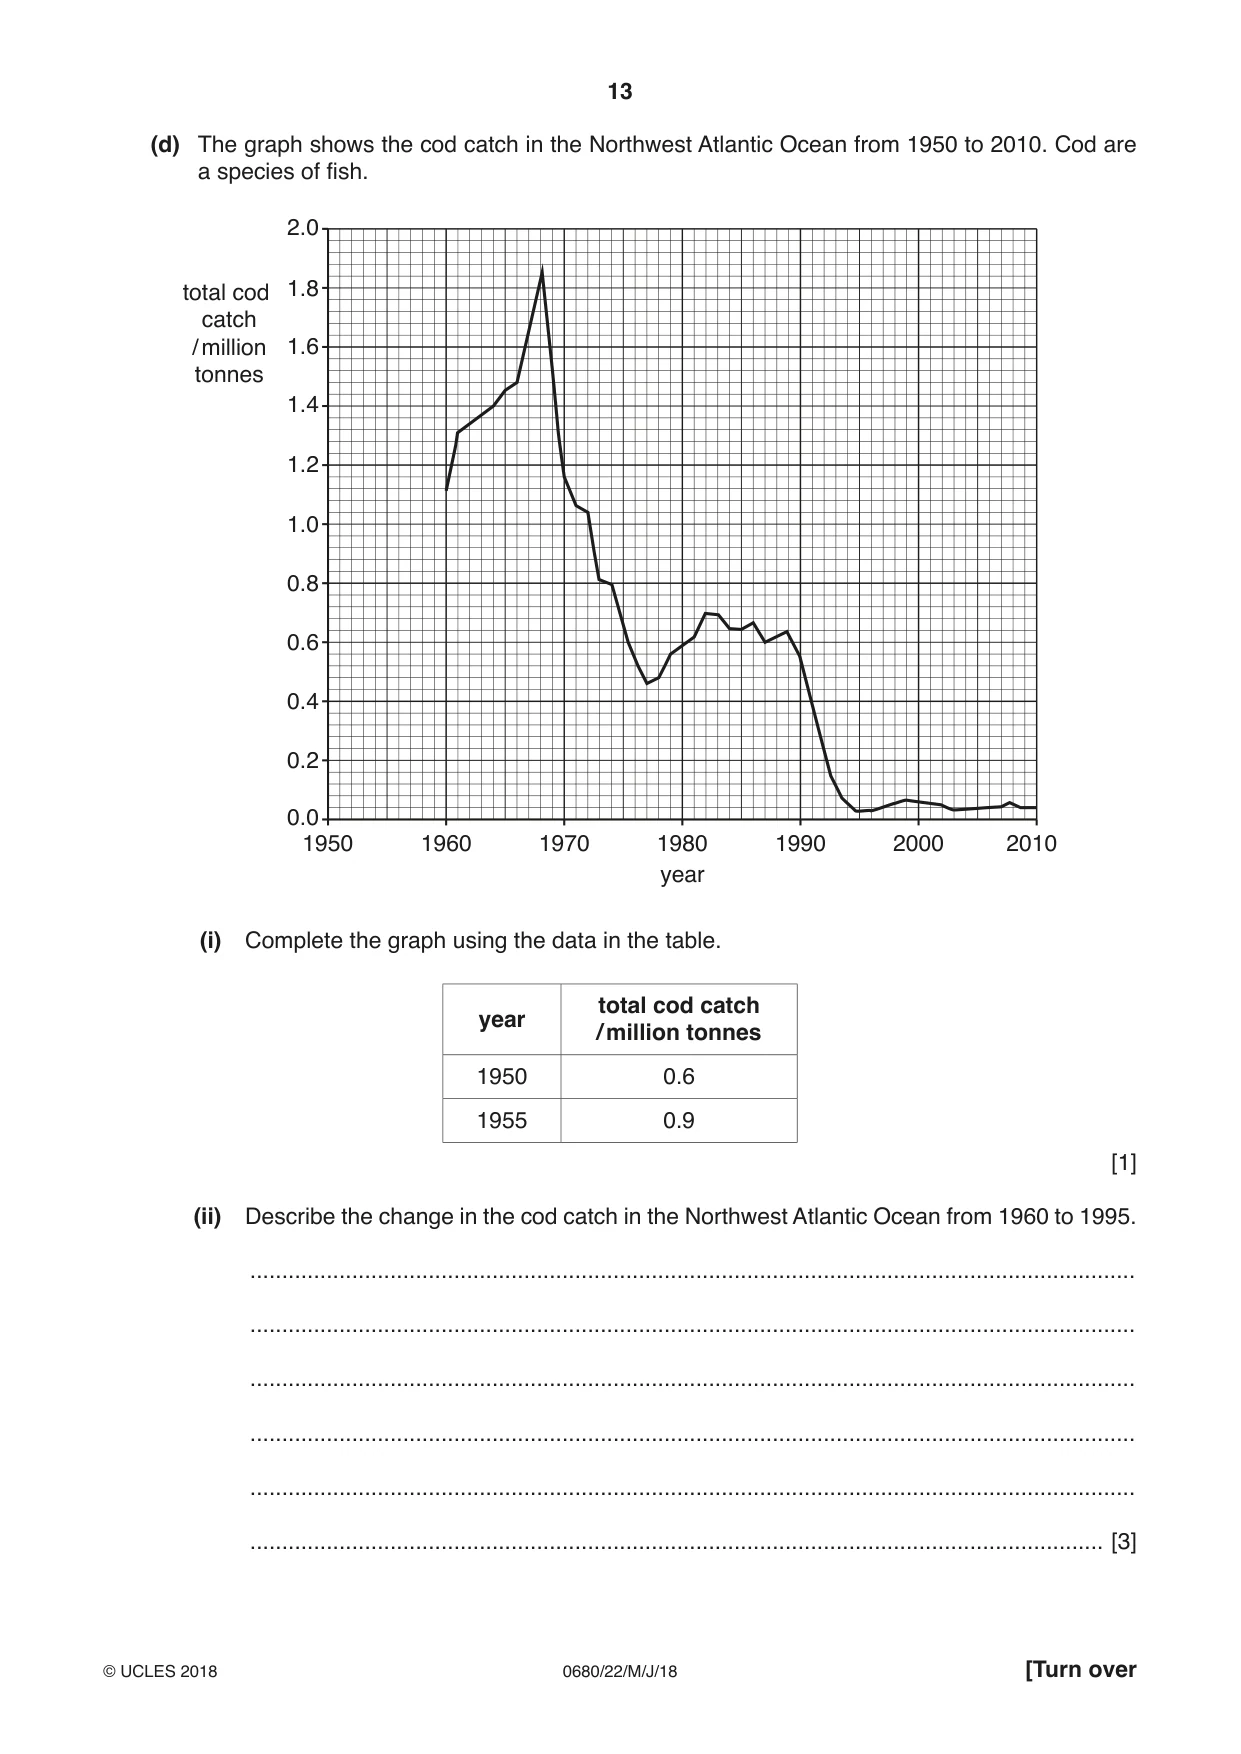
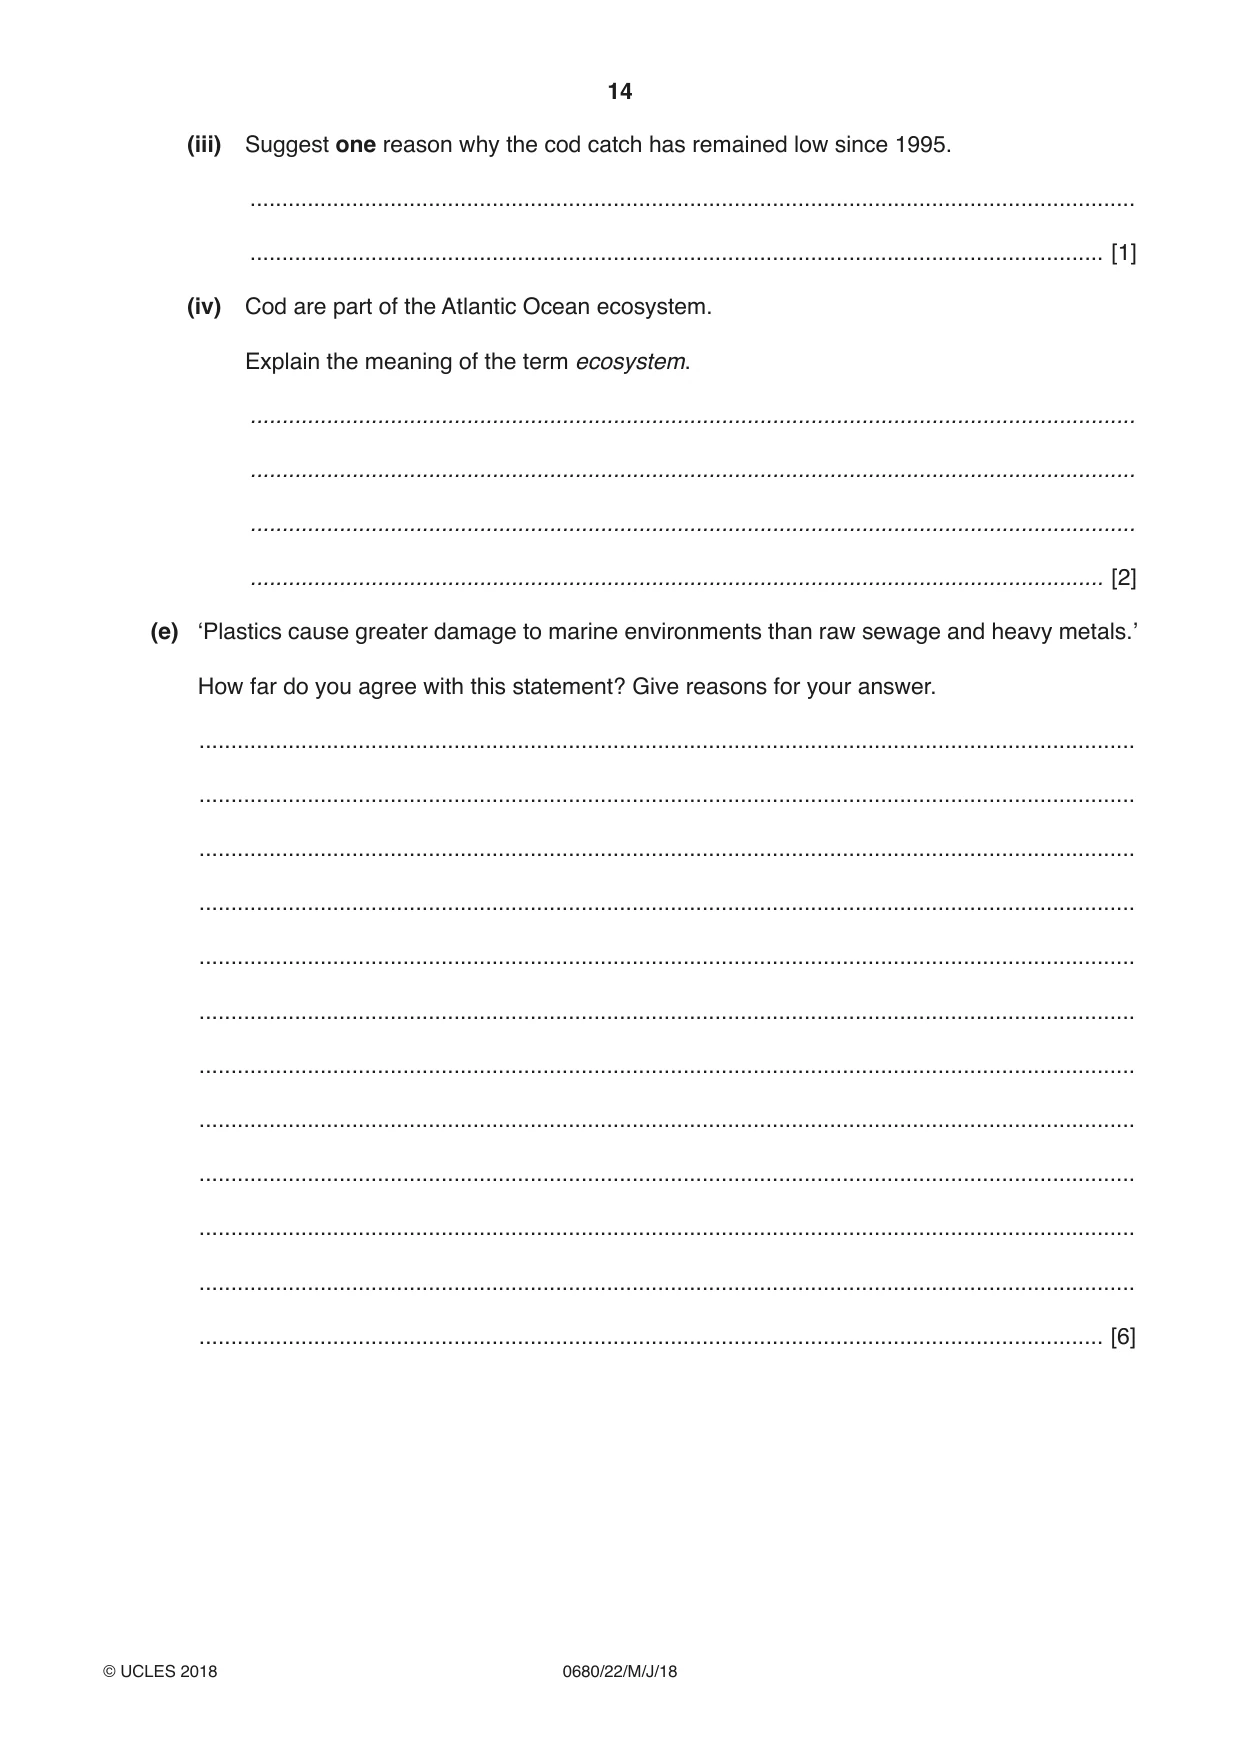
2 (a) The newspaper article is about the link between toxins (pollutants) in the oceans and the death of whales. Increase in whale deaths around the UK Scientists think that flame retardants and polychlorinated biphenyls (PCBs) released in the oceans damage the immune system of whales. Whales then become infected with diseases and parasites which cause them to become confused and swim onto beaches where they die. Whales accumulate toxins from the food they eat. Almost 600 whales died on UK beaches in 2014. It has been found that these whales had the highest concentration of PCBs in their bodies of whales anywhere in the world. (i) State the two toxins from the article thought to cause the death of whales. ............................................................... and ............................................................... [1] (ii) Explain why toxin levels are higher in top predators than in animals lower in the food chain. ........................................................................................................................................... ........................................................................................................................................... ........................................................................................................................................... ...................................................................................................................................... [2] (iii) Suggest how toxins enter the oceans. ........................................................................................................................................... ........................................................................................................................................... ........................................................................................................................................... ...................................................................................................................................... [2] (b) The map shows warm and cold ocean currents. Arctic Circle EUROPEEurope DD icic Asia rriifftt antant ASIA .. .. NORTHNorth ifiificc CC N.AtlN.Atl CC PPacac AMERICA amam N.N. America rere C.C. yy MIDDLEMIDDLE NorthNorth oo StSt NorthNorth PacificPacific aarr hhii Tropic of nn uullff AtlanticAtlantic ss EASTEAST OceanOcean GG CCaa rroo OceanOcean CC.. uu Cancer CaliforniaCalifornia lili KK N.N. aa .. EqEq Africa CC uaua ll totoriaria AFRICA mm N.N. EquatorialEquatorial C.C. C.C. oo Equator CC.. SS NN.. EquatoriEquatorialal CC.. nn S.S. EEqquauattooririaallCC.. liliaa SOUTHSouth S.S. EquatorialEquatorial C.C. C.C. rraa CC.. BB S.S.EE ee qquuaattoorriialalCC C.C... sstt iinn nn AMERICAAmerica PP nn uuTropic of CC.. ww gg aa AA iill eerr uu uu asas uu ee OCEANIAOceania IndianIndian aa BrazilBrazil SouthSouth PacificPacificCapricorn EE.. llee ee lhlh CC OceanOcean SouthSouth uu aa strstr LL .. OceanOcean uu AAgg AtlanticAtlantic AA ..CC OceanOcean WestWest WindWind DriftDrift W.W. WestWest WindWind DriftDrift Antarctic Circle ANTARCTICA Key warm current (i) Name the cold current along the west coast of South America. ...................................................................................................................................... [1] (ii) Describe the movement of ocean currents in the Atlantic Ocean. ........................................................................................................................................... ........................................................................................................................................... ........................................................................................................................................... ........................................................................................................................................... ........................................................................................................................................... ...................................................................................................................................... [3] (iii) Suggest how oil pollution from the Middle East can reach Antarctica. ........................................................................................................................................... ........................................................................................................................................... ........................................................................................................................................... ...................................................................................................................................... [2] (iv) Describe the effect of the Benguela current on the climate of the west coast of southern Africa. ........................................................................................................................................... ........................................................................................................................................... ........................................................................................................................................... ...................................................................................................................................... [2] (c) The information is about a proposed tidal barrage for generating electricity in Swansea Bay in the UK. N city of Swansea River Neath River Tawe lagoon barrage site of one of Swansea Bay the flood gates and turbines 0 2 km Swansea Bay has one of the world’s largest tidal ranges, often reaching 10 m. A 10 km long barrage would be built 3 km out to sea. The barrage would have 16 underwater turbines generating electricity on both the rising (incoming) and falling (outgoing) tide. Enough renewable power would be generated for 155 000 homes for 120 years. An environmental impact assessment (EIA) is needed before the barrage can be built. The EIA will identify environmental impacts on coastal ecosystems and suggest ways to reduce them.
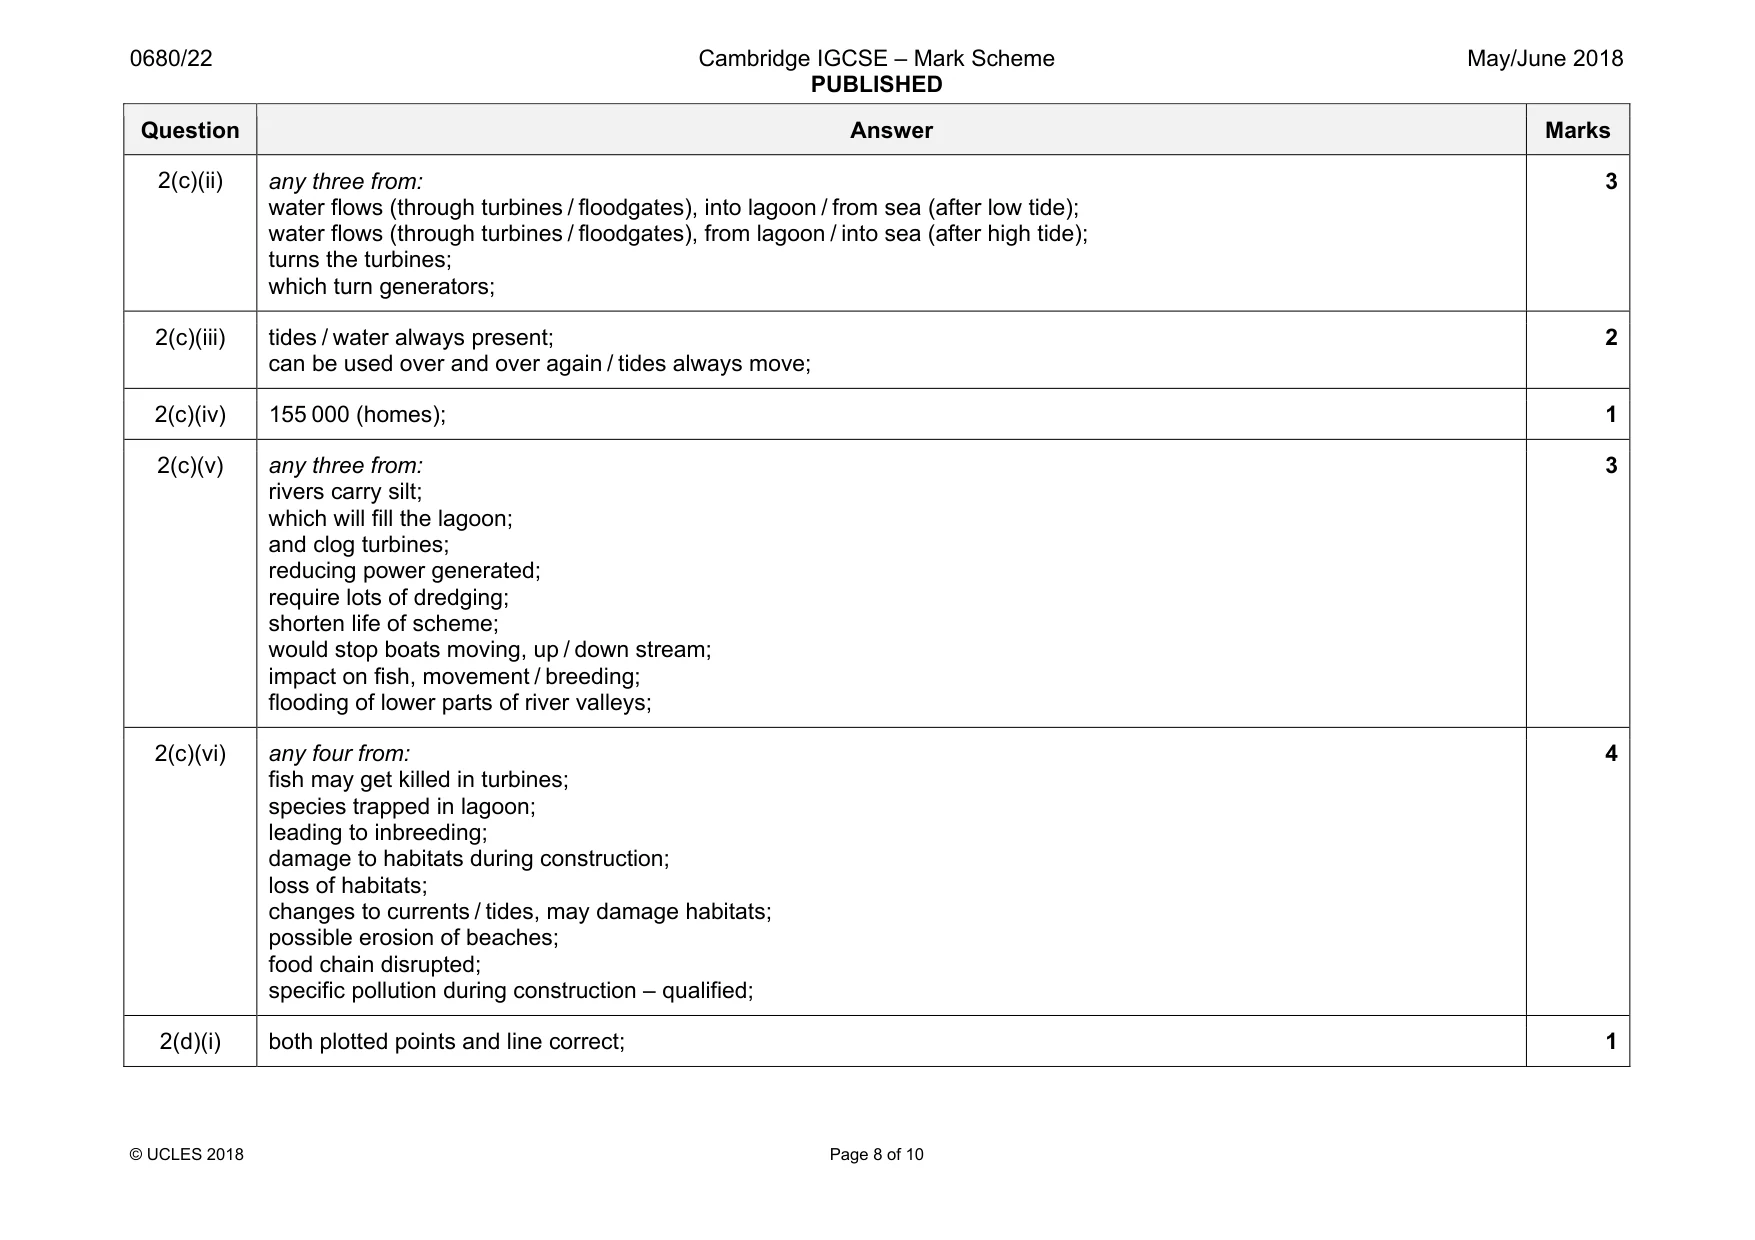
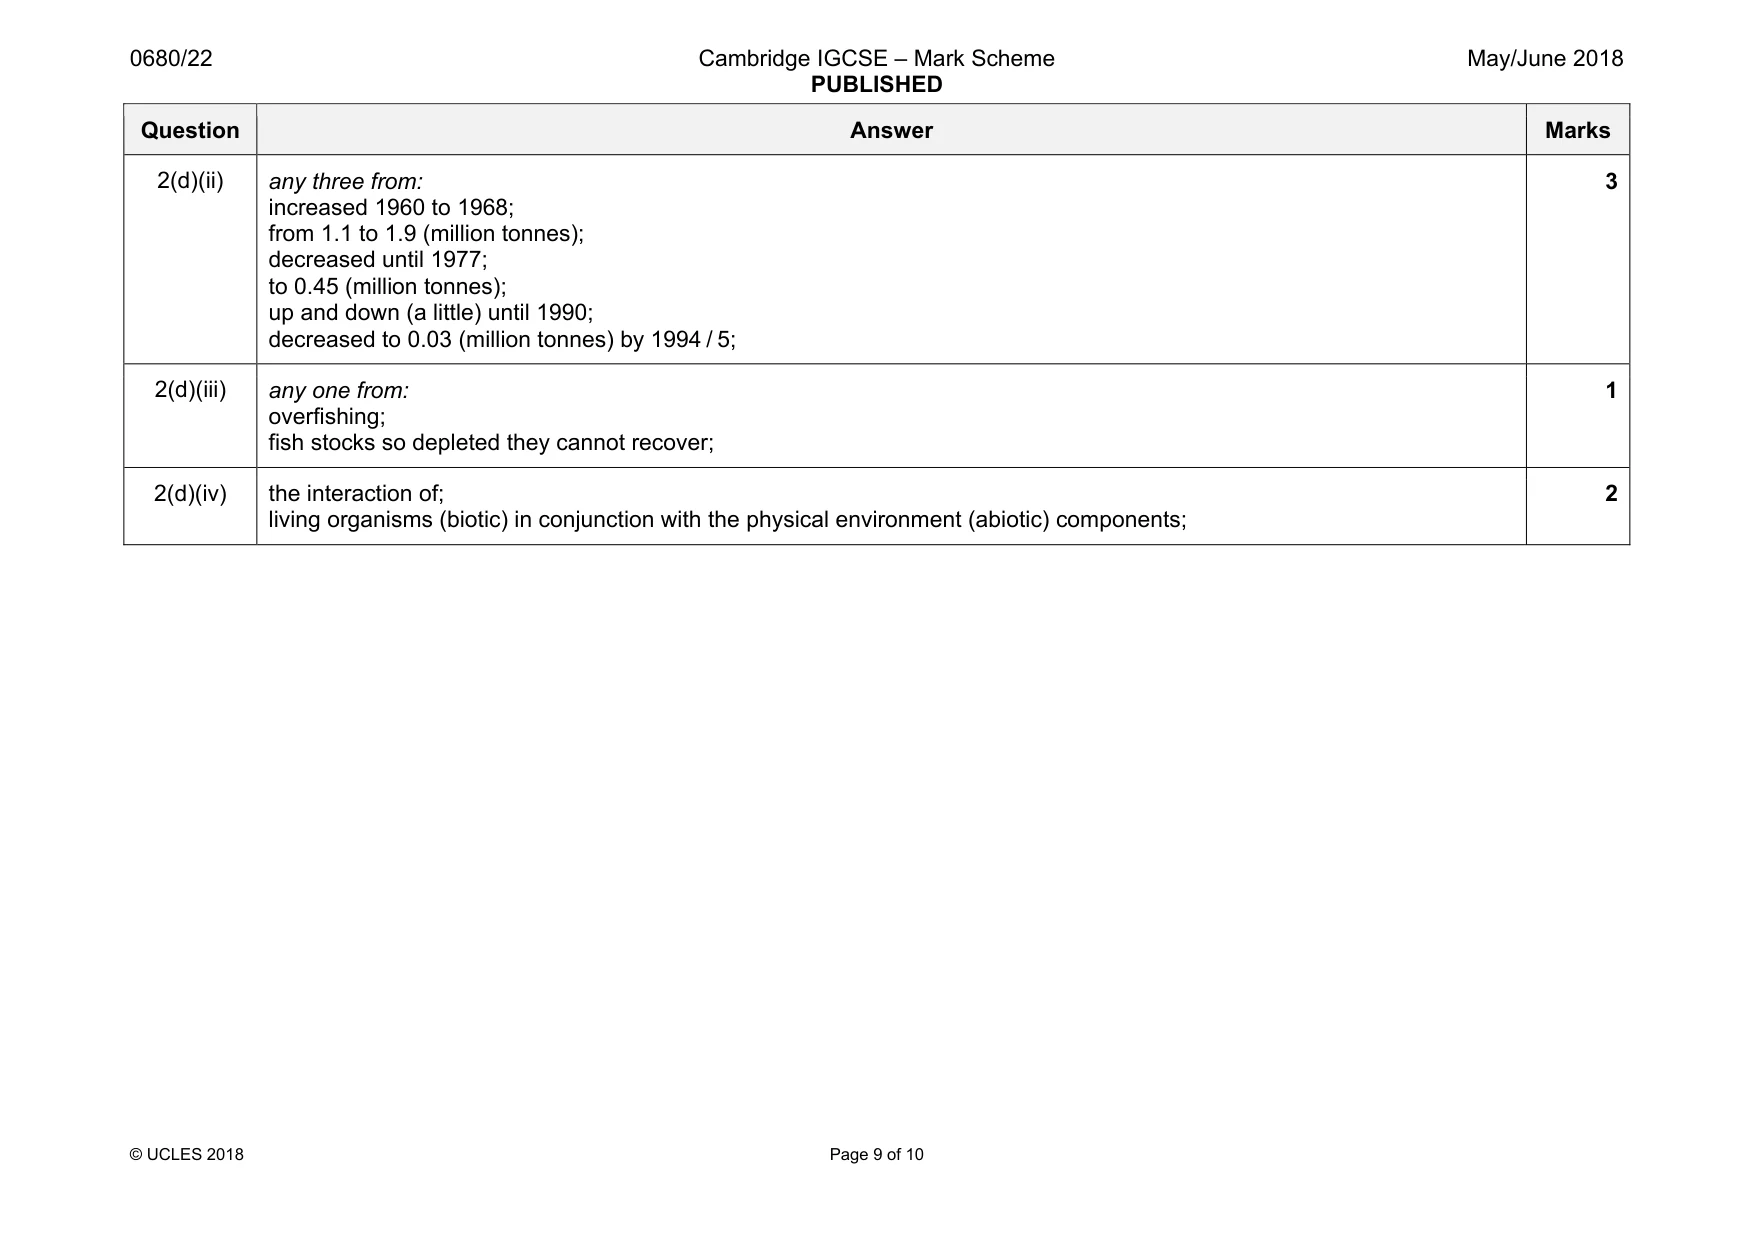
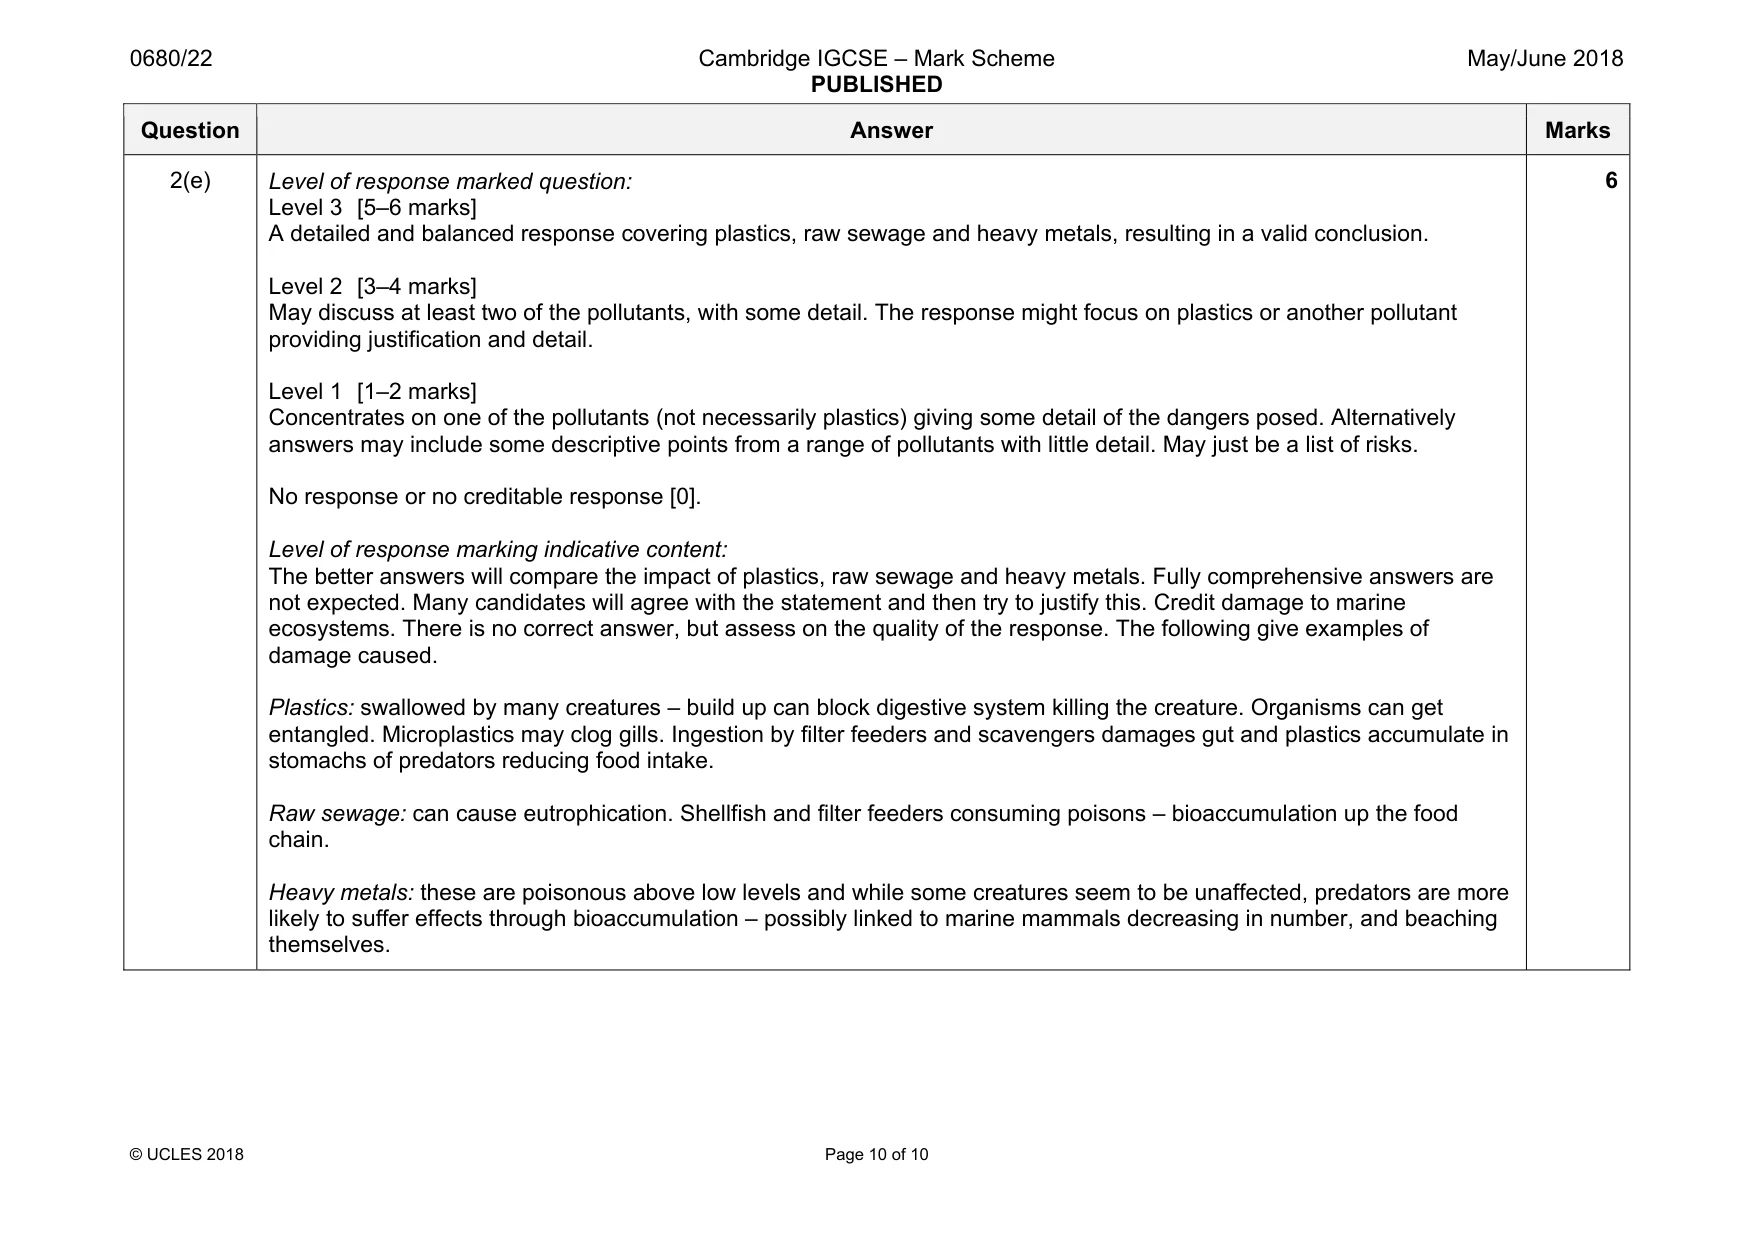
Mark scheme: 2(a)(i) PCBs and flame retardants; 1 2(a)(ii) accumulation of toxins within the body of an animal; when predator in the food chain feeds on prey the toxin is amplified; 2 2(a)(iii) any two from: from, factories / domestic / agriculture; washed into oceans via, rivers / groundwater / drains; from airborne toxins washed out of atmosphere by rain; from, ships / oil rigs; 2 2(b)(i) Peru (current); 1 2(b)(ii) any three from: circular motion in, North Atlantic / South Atlantic; circulate clockwise (N); anticlockwise (S); further details such as name and direction of currents; Equatorial currents run East-West / parallel to Equator; warm currents flow towards poles; cold currents flow toward Equator; 3 2(b)(iii) any two from: via Somali current; N. Equatorial current; and Agulhas current; from ships transporting oil from Middle East; 2 2(b)(iv) any two from: lowers temperature; low rainfall; coastal fog / mist; 2 2(c)(i) 10 (m); 1 Question Answer Marks 2(c)(ii) any three from: water flows (through turbines / floodgates), into lagoon / from sea (after low tide); water flows (through turbines / floodgates), from lagoon / into sea (after high tide); turns the turbines; which turn generators; 3 2(c)(iii) tides / water always present; can be used over and over again / tides always move; 2 2(c)(iv) 155 000 (homes); 1 2(c)(v) any three from: rivers carry silt; which will fill the lagoon; and clog turbines; reducing power generated; require lots of dredging; shorten life of scheme; would stop boats moving, up / down stream; impact on fish, movement / breeding; flooding of lower parts of river valleys; 3 2(c)(vi) any four from: fish may get killed in turbines; species trapped in lagoon; leading to inbreeding; damage to habitats during construction; loss of habitats; changes to currents / tides, may damage habitats; possible erosion of beaches; food chain disrupted; specific pollution during construction – qualified; 4 2(d)(i) both plotted points and line correct; 1 Question Answer Marks 2(d)(ii) any three from: increased 1960 to 1968; from 1.1 to 1.9 (million tonnes); decreased until 1977; to 0.45 (million tonnes); up and down (a little) until 1990; decreased to 0.03 (million tonnes) by 1994 / 5; 3 2(d)(iii) any one from: overfishing; fish stocks so depleted they cannot recover; 1 2(d)(iv) the interaction of; living organisms (biotic) in conjunction with the physical environment (abiotic) components; 2 Question Answer Marks 2(e) Level of response marked question: Level 3 [5–6 marks] A detailed and balanced response covering plastics, raw sewage and heavy metals, resulting in a valid conclusion. Level 2 [3–4 marks] May discuss at least two of the pollutants, with some detail. The response might focus on plastics or another pollutant providing justification and detail. Level 1 [1–2 marks] Concentrates on one of the pollutants (not necessarily plastics) giving some detail of the dangers posed. Alternatively answers may include some descriptive points from a range of pollutants with little detail. May just be a list of risks. No response or no creditable response [0]. Level of response marking indicative content: The better answers will compare the impact of plastics, raw sewage and heavy metals. Fully comprehensive answers are not expected. Many candidates will agree with the statement and then try to justify this. Credit damage to marine ecosystems. There is no correct answer, but assess on the quality of the response. The following give examples of damage caused. Plastics: swallowed by many creatures – build up can block digestive system killing the creature. Organisms can get entangled. Microplastics may clog gills. Ingestion by filter feeders and scavengers damages gut and plastics accumulate in stomachs of predators reducing food intake. Raw sewage: can cause eutrophication. Shellfish and filter feeders consuming poisons – bioaccumulation up the food chain. Heavy metals: these are poisonous above low levels and while some creatures seem to be unaffected, predators are more likely to suffer effects through bioaccumulation – possibly linked to marine mammals decreasing in number, and beaching themselves. 6
What was in this paper
The subtopics covered by these 2 questions, and how many questions each got. Open one in a new tab to see every Cambridge question on it.
What you needed in this session
Cambridge’s own grade thresholds for 2018 May/June, Paper 2 · Variant 2. A higher threshold means an easier paper — the bar moves with how the cohort did.