Cambridge IGCSE Environmental Management 0680 — 2018 May/June Paper 2 · Variant 3
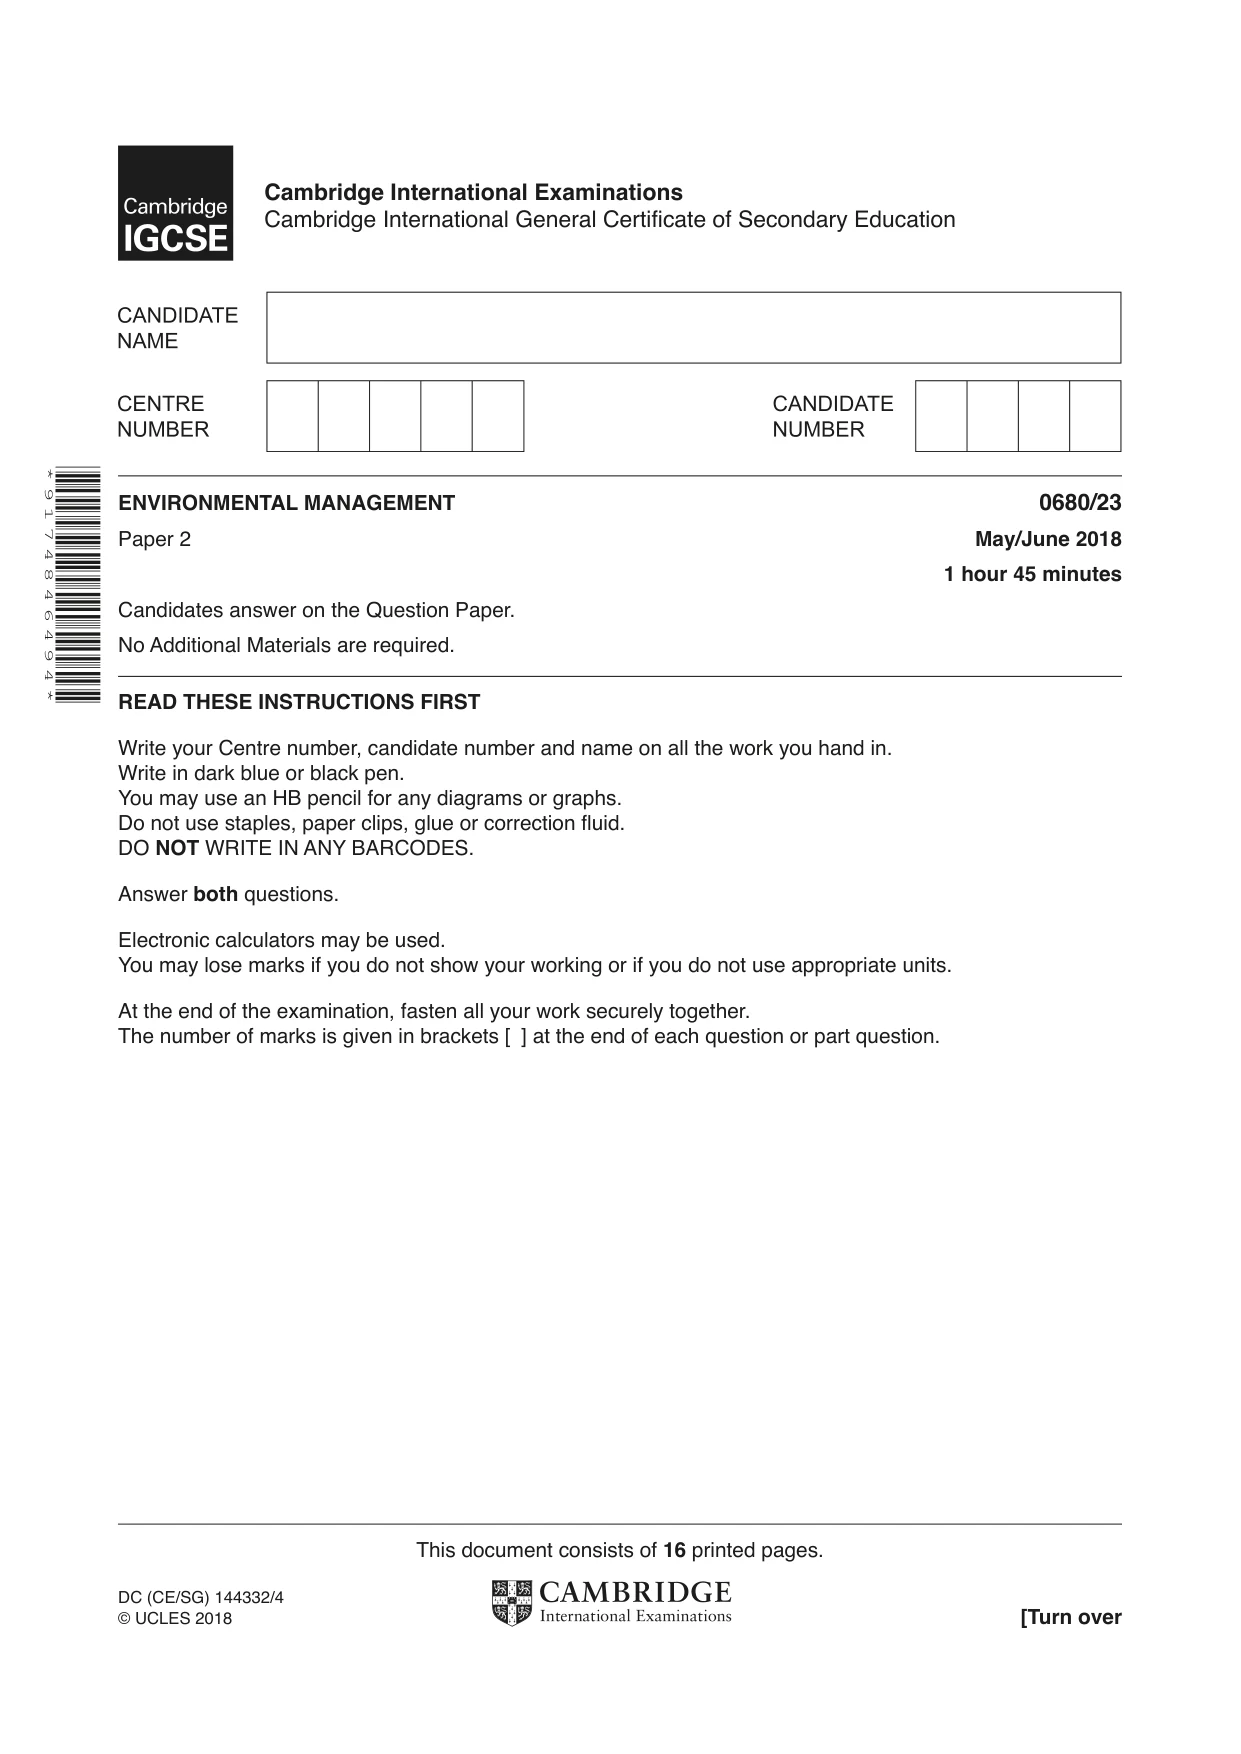
0680/23/M/J/18 · 80 marks · ≈90 min
The question paper and its mark scheme, free to read here and free to download. This is Cambridge’s own paper, exactly as it was sat.
Question paper16 pages
Mark scheme10 pages
Answers below. Sit the paper first if you are practising.
Paper as text
Question paper, page 1
* 9 1 7 4 8 4 6 4 9 4 * This document consists of 16 printed pages. DC (CE/SG) 144332/4 © UCLES 2018 [Turn over Cambridge International Examinations Cambridge International General Certificate of Secondary Education ENVIRONMENTAL MANAGEMENT 0680/23 Paper 2 May/June 2018 1 hour 45 minutes Candidates answer on the Question Paper. No Additional Materials are required. READ THESE INSTRUCTIONS FIRST Write your Centre number, candidate number and name on all the work you hand in. Write in dark blue or black pen. You may use an HB pencil for any diagrams or graphs. Do not use staples, paper clips, glue or correction fluid. DO NOT WRITE IN ANY BARCODES. Answer both questions. Electronic calculators may be used. You may lose marks if you do not show your working or if you do not use appropriate units. At the end of the examination, fasten all your work securely together. The number of marks is given in brackets [ ] at the end of each question or part question.
Question paper, page 2
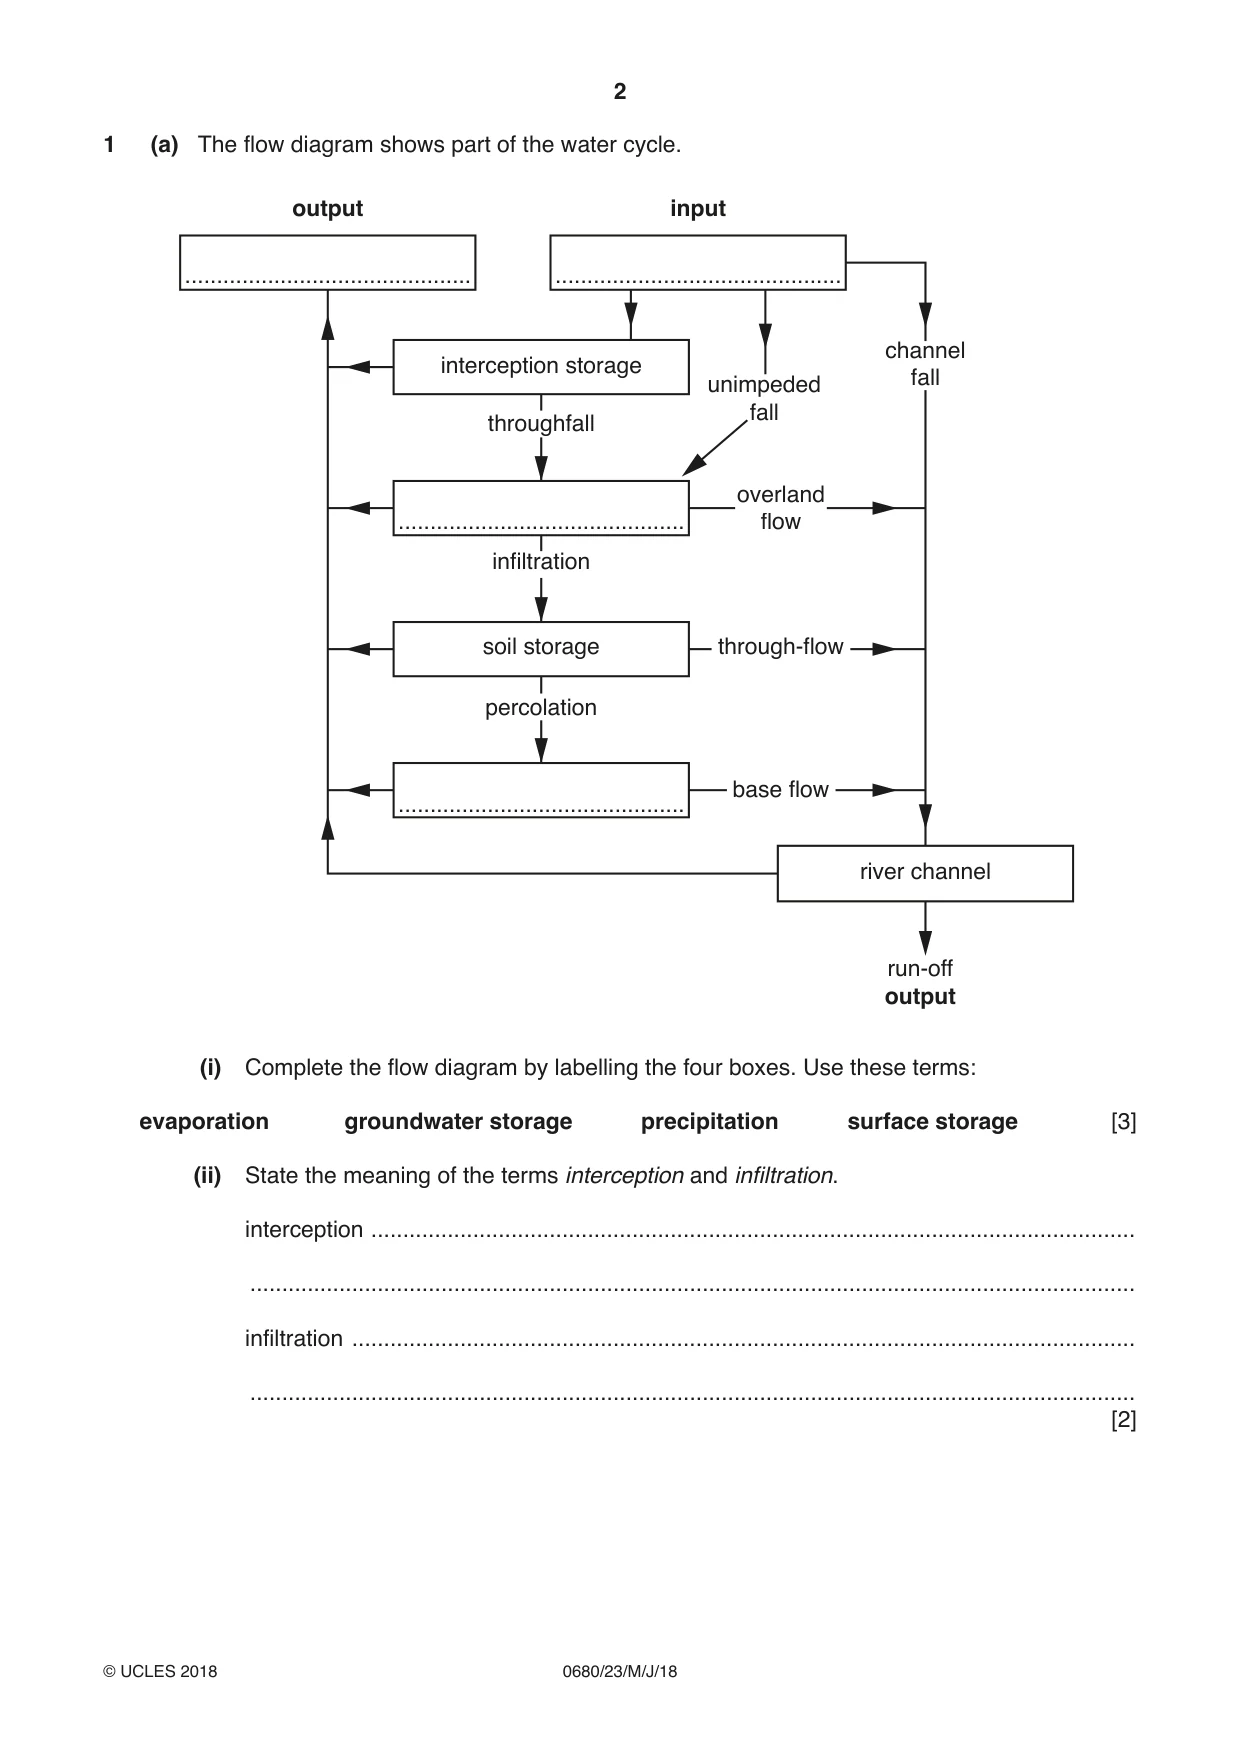
2 0680/23/M/J/18 © UCLES 2018 1 (a) The flow diagram shows part of the water cycle. output run-off output input channel fall river channel base flow through-flow overland flow percolation infiltration throughfall unimpeded fall soil storage interception storage … … … … (i) Complete the flow diagram by labelling the four boxes. Use these terms: evaporation groundwater storage precipitation surface storage [3] (ii) State the meaning of the terms interception and infiltration. interception … … infiltration … … [2]
Question paper, page 3
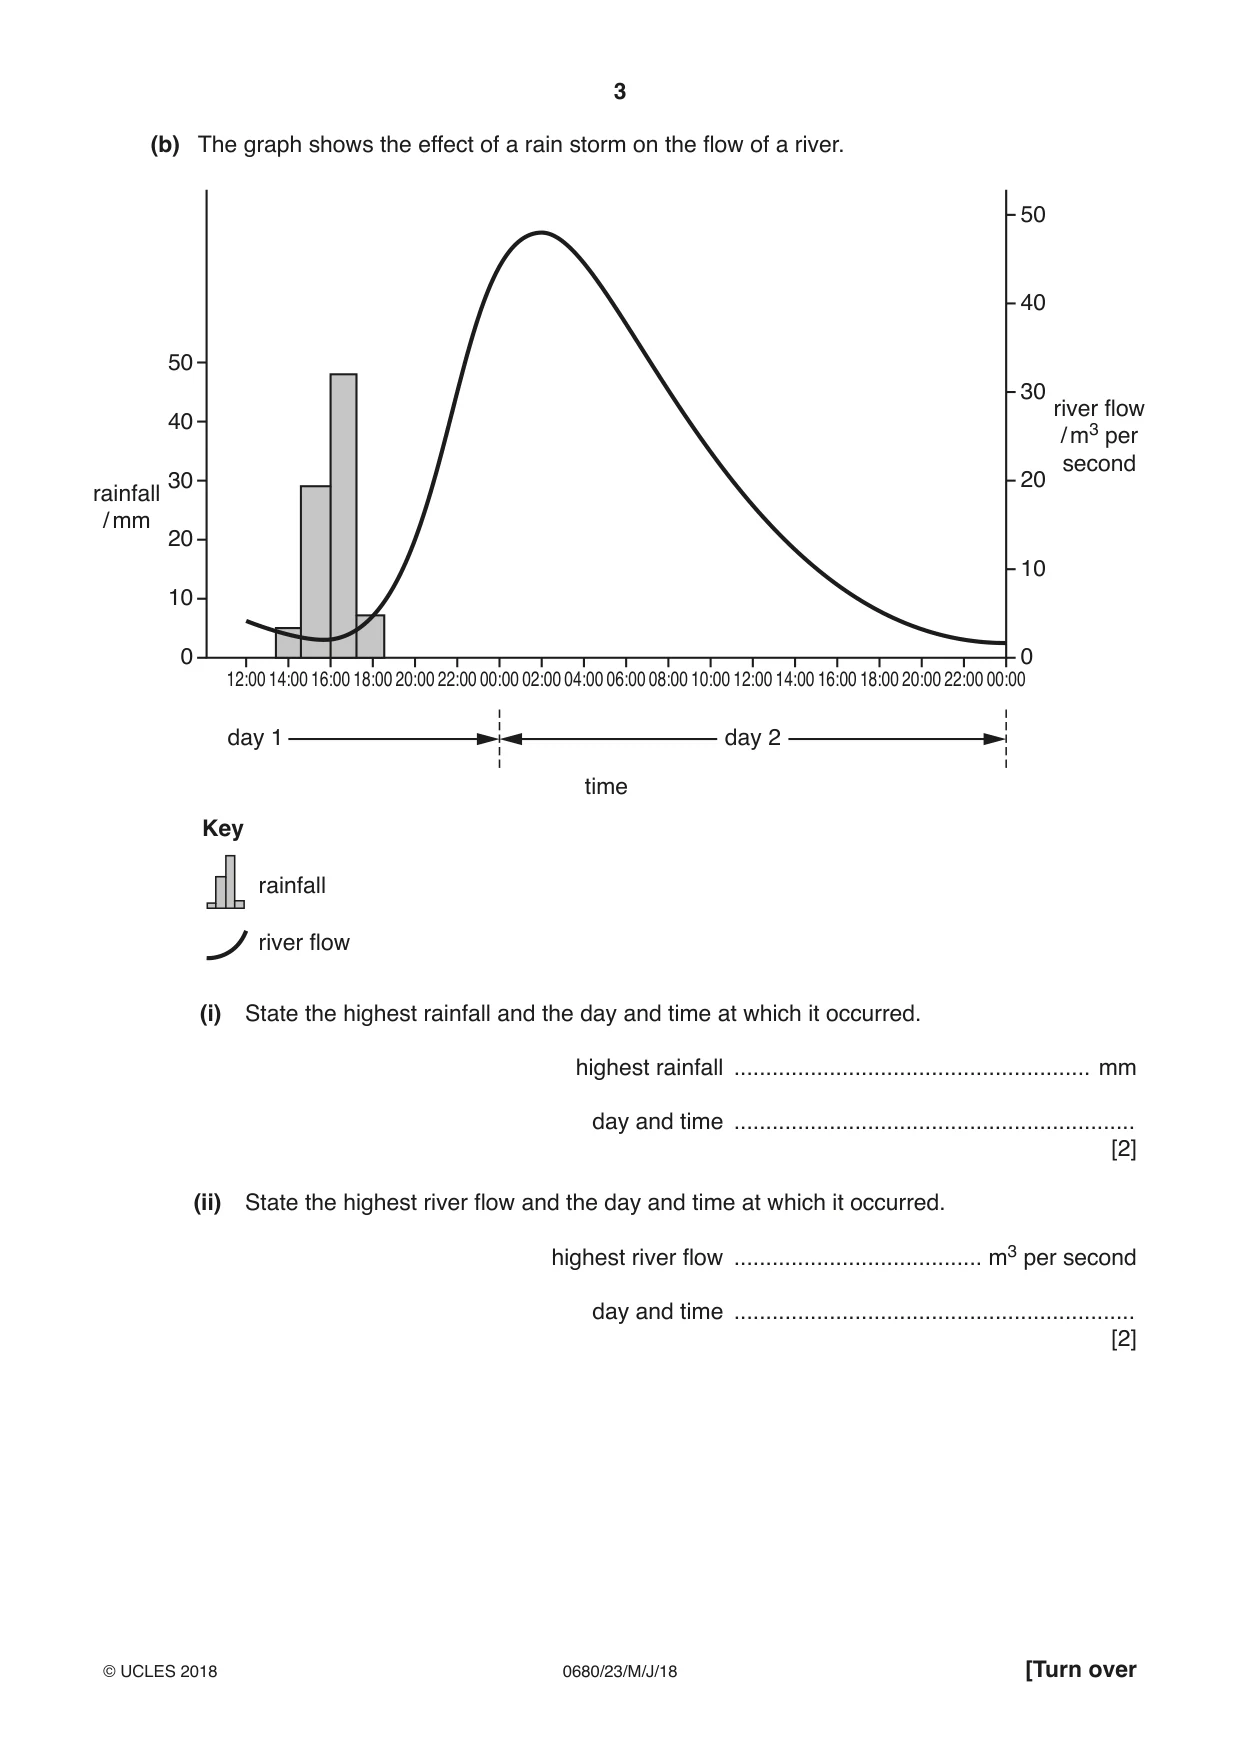
3 0680/23/M/J/18 © UCLES 2018 [Turn over (b) The graph shows the effect of a rain storm on the flow of a river. 12:00 14:00 16:00 18:00 20:00 22:00 00:00 02:00 04:00 06:00 08:00 10:00 12:00 14:00 16:00 18:00 20:00 22:00 00:00 river flow / m3 per second rainfall / mm 50 40 30 20 10 0 50 40 30 20 10 0 day 1 day 2 time Key rainfall river flow (i) State the highest rainfall and the day and time at which it occurred. highest rainfall … mm day and time … [2] (ii) State the highest river flow and the day and time at which it occurred. highest river flow … m3 per second day and time … [2]
Question paper, page 4
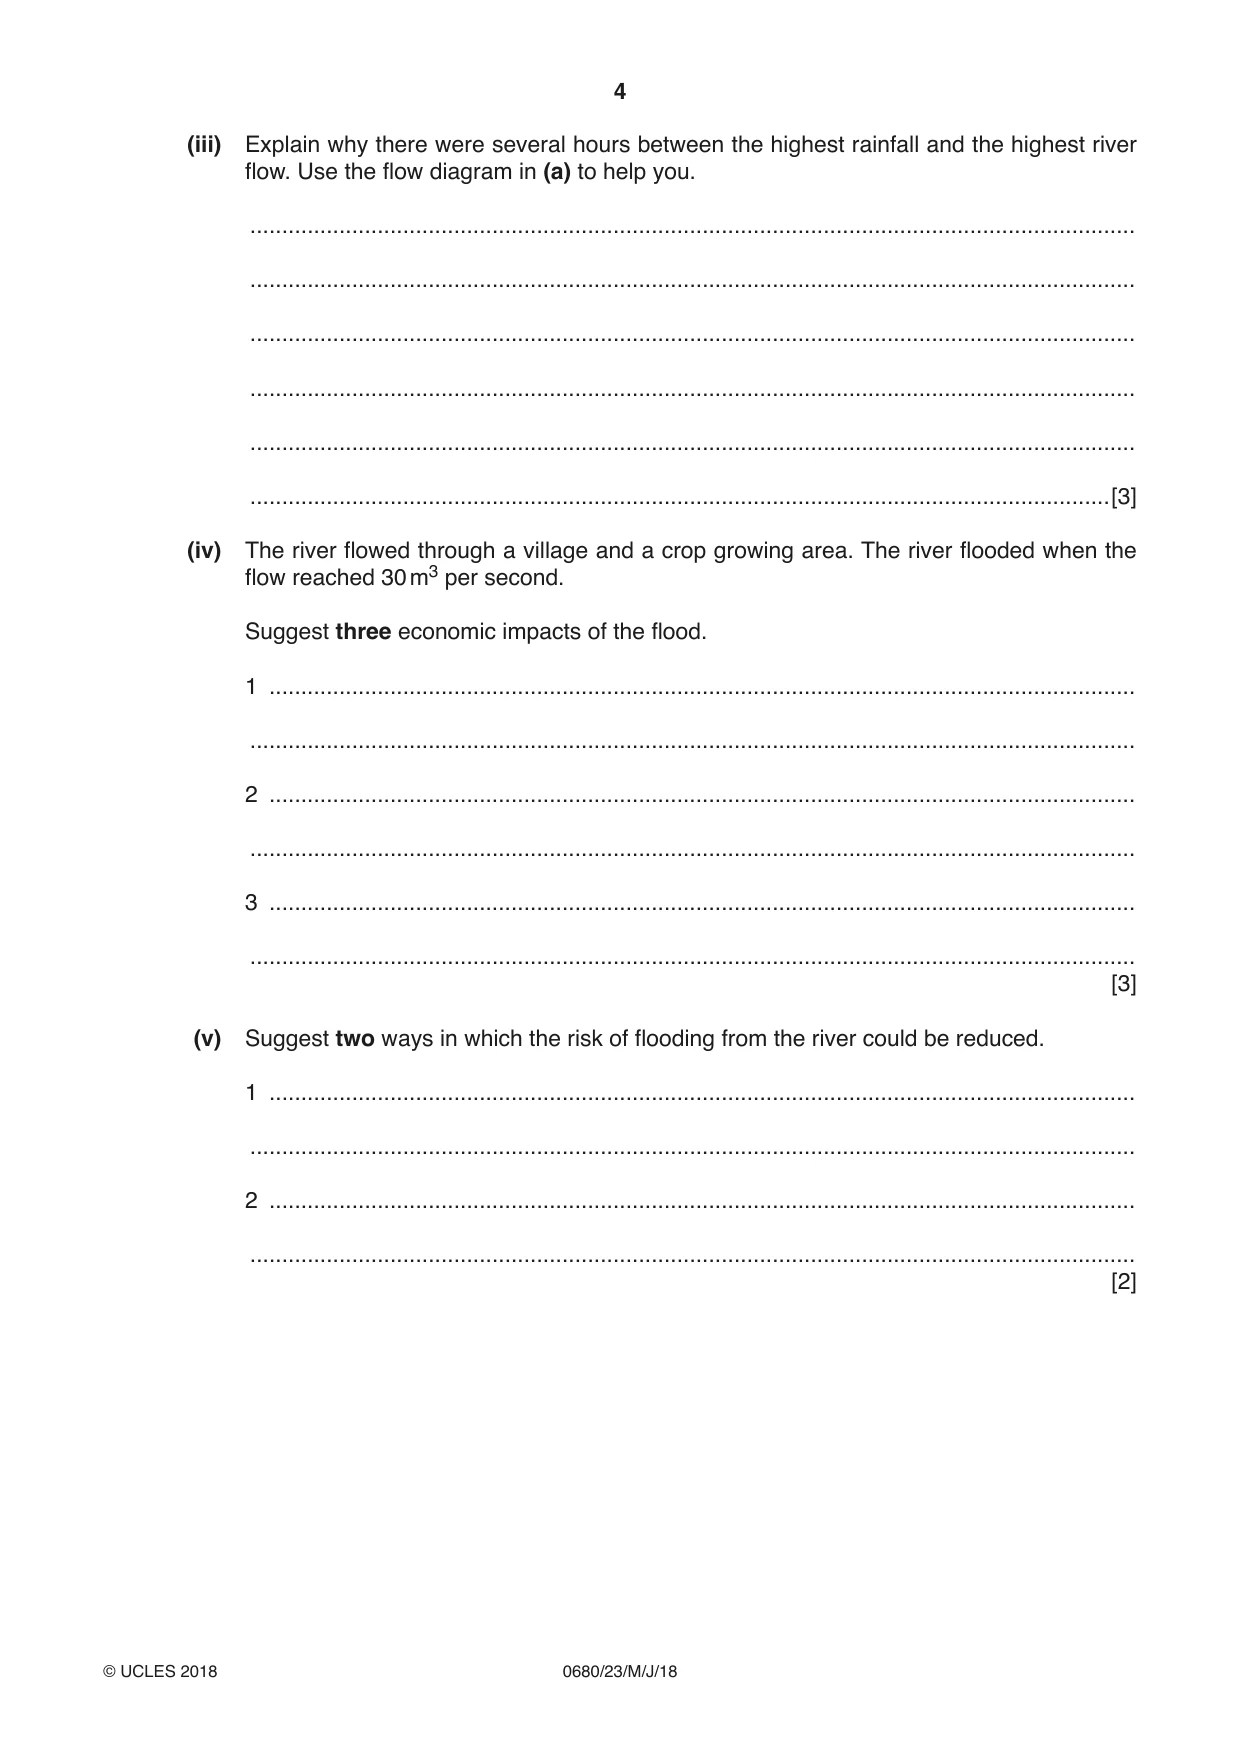
4 0680/23/M/J/18 © UCLES 2018 (iii) Explain why there were several hours between the highest rainfall and the highest river flow. Use the flow diagram in (a) to help you. … … … … … …[3] (iv) The river flowed through a village and a crop growing area. The river flooded when the flow reached 30 m3 per second. Suggest three economic impacts of the flood. 1 … … 2 … … 3 … … [3] (v) Suggest two ways in which the risk of flooding from the river could be reduced. 1 … … 2 … … [2]
Question paper, page 5
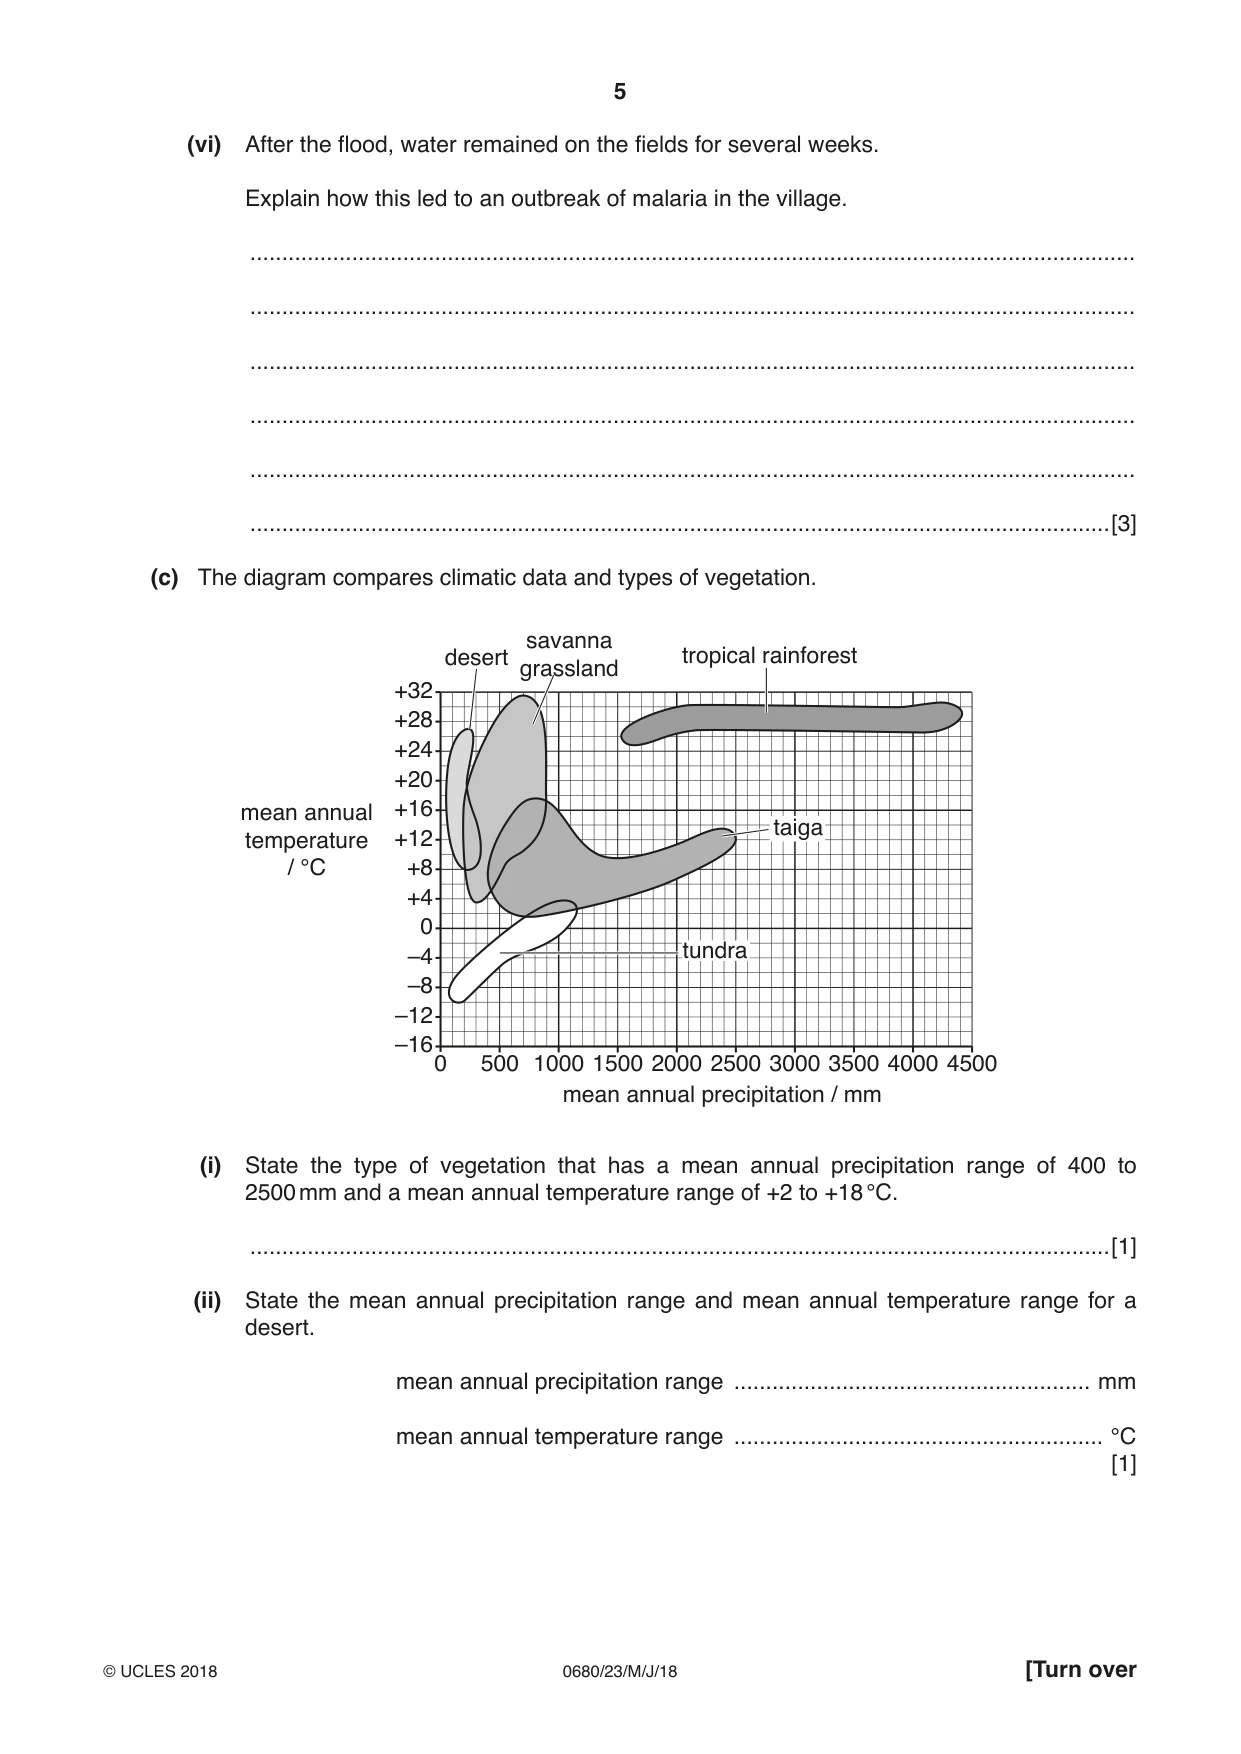
5 0680/23/M/J/18 © UCLES 2018 [Turn over (vi) After the flood, water remained on the fields for several weeks. Explain how this led to an outbreak of malaria in the village. … … … … … …[3] (c) The diagram compares climatic data and types of vegetation. +32 +28 +24 +20 +16 +12 +8 +4 0 –4 –8 –12 –160 500 1000 1500 2000 2500 3000 3500 4000 4500 mean annual temperature / °C mean annual precipitation / mm desert savanna grassland tropical rainforest taiga tundra (i) State the type of vegetation that has a mean annual precipitation range of 400 to 2500 mm and a mean annual temperature range of +2 to +18 °C. …[1] (ii) State the mean annual precipitation range and mean annual temperature range for a desert. mean annual precipitation range … mm mean annual temperature range … °C [1]
Question paper, page 6
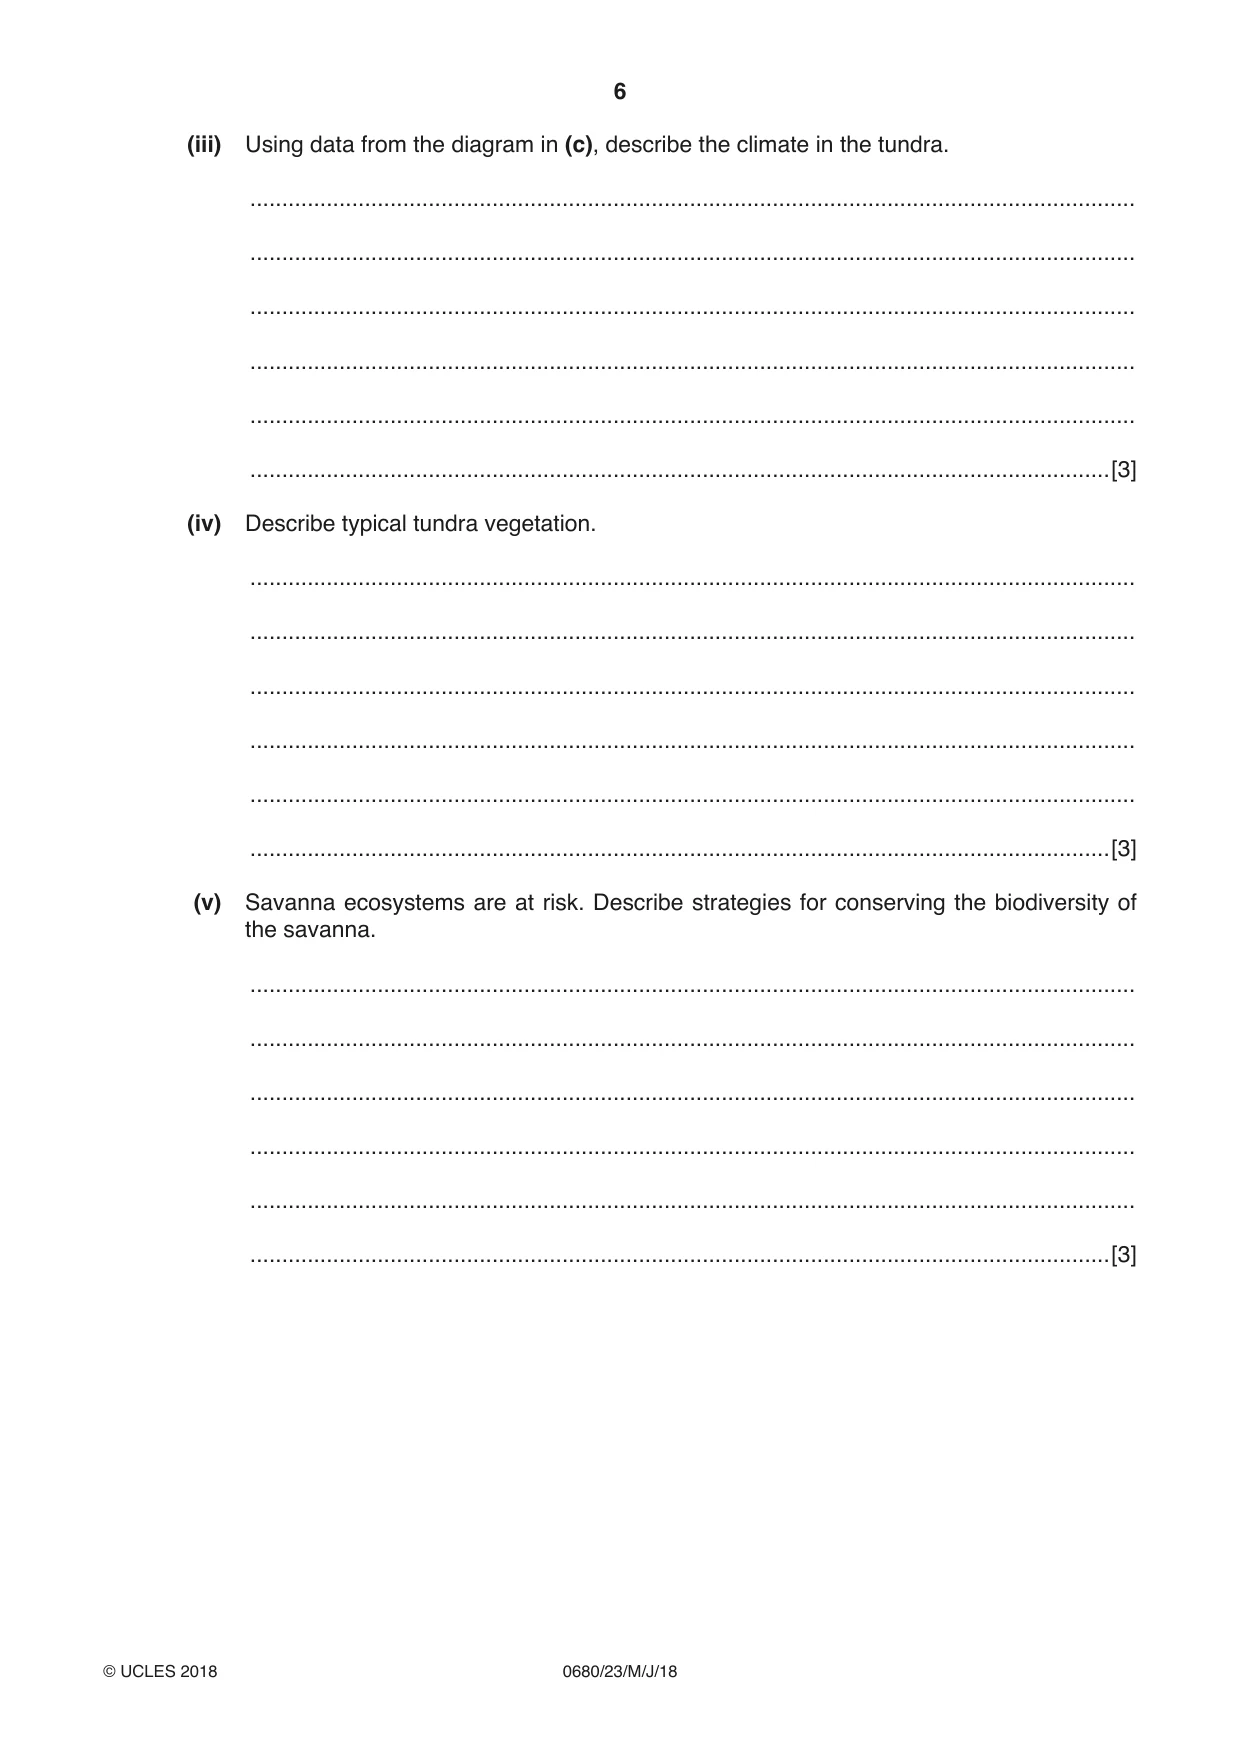
6 0680/23/M/J/18 © UCLES 2018 (iii) Using data from the diagram in (c), describe the climate in the tundra. … … … … … …[3] (iv) Describe typical tundra vegetation. … … … … … …[3] (v) Savanna ecosystems are at risk. Describe strategies for conserving the biodiversity of the savanna. … … … … … …[3]
Question paper, page 7
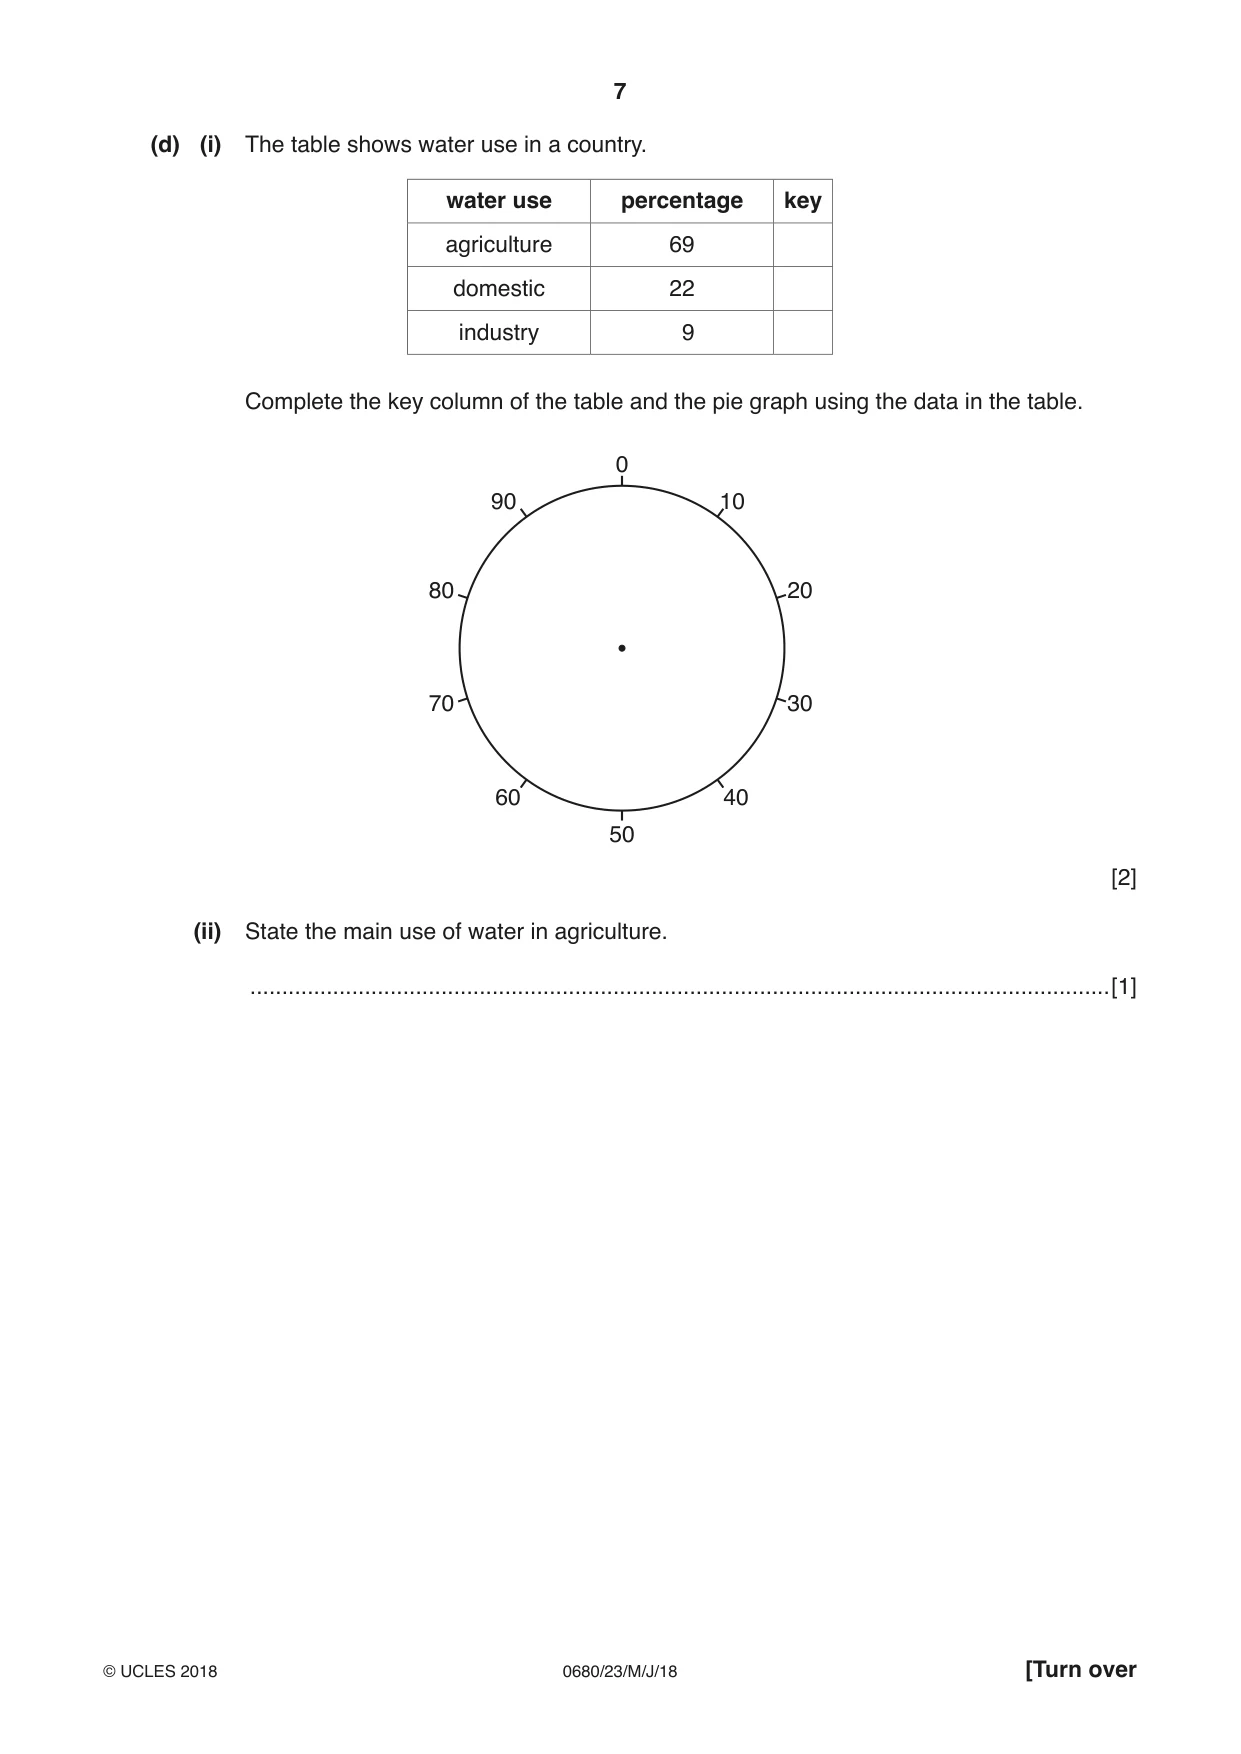
7 0680/23/M/J/18 © UCLES 2018 [Turn over (d) (i) The table shows water use in a country. water use percentage key agriculture 69 domestic 22 industry 9 Complete the key column of the table and the pie graph using the data in the table. 0 10 20 30 40 50 60 70 80 90 [2] (ii) State the main use of water in agriculture. …[1]
Question paper, page 8
8 0680/23/M/J/18 © UCLES 2018 (iii) There are many competing demands for water. Suggest how competing demands for water can be managed. … … … … … … … … … … … …[6]
Question paper, page 9
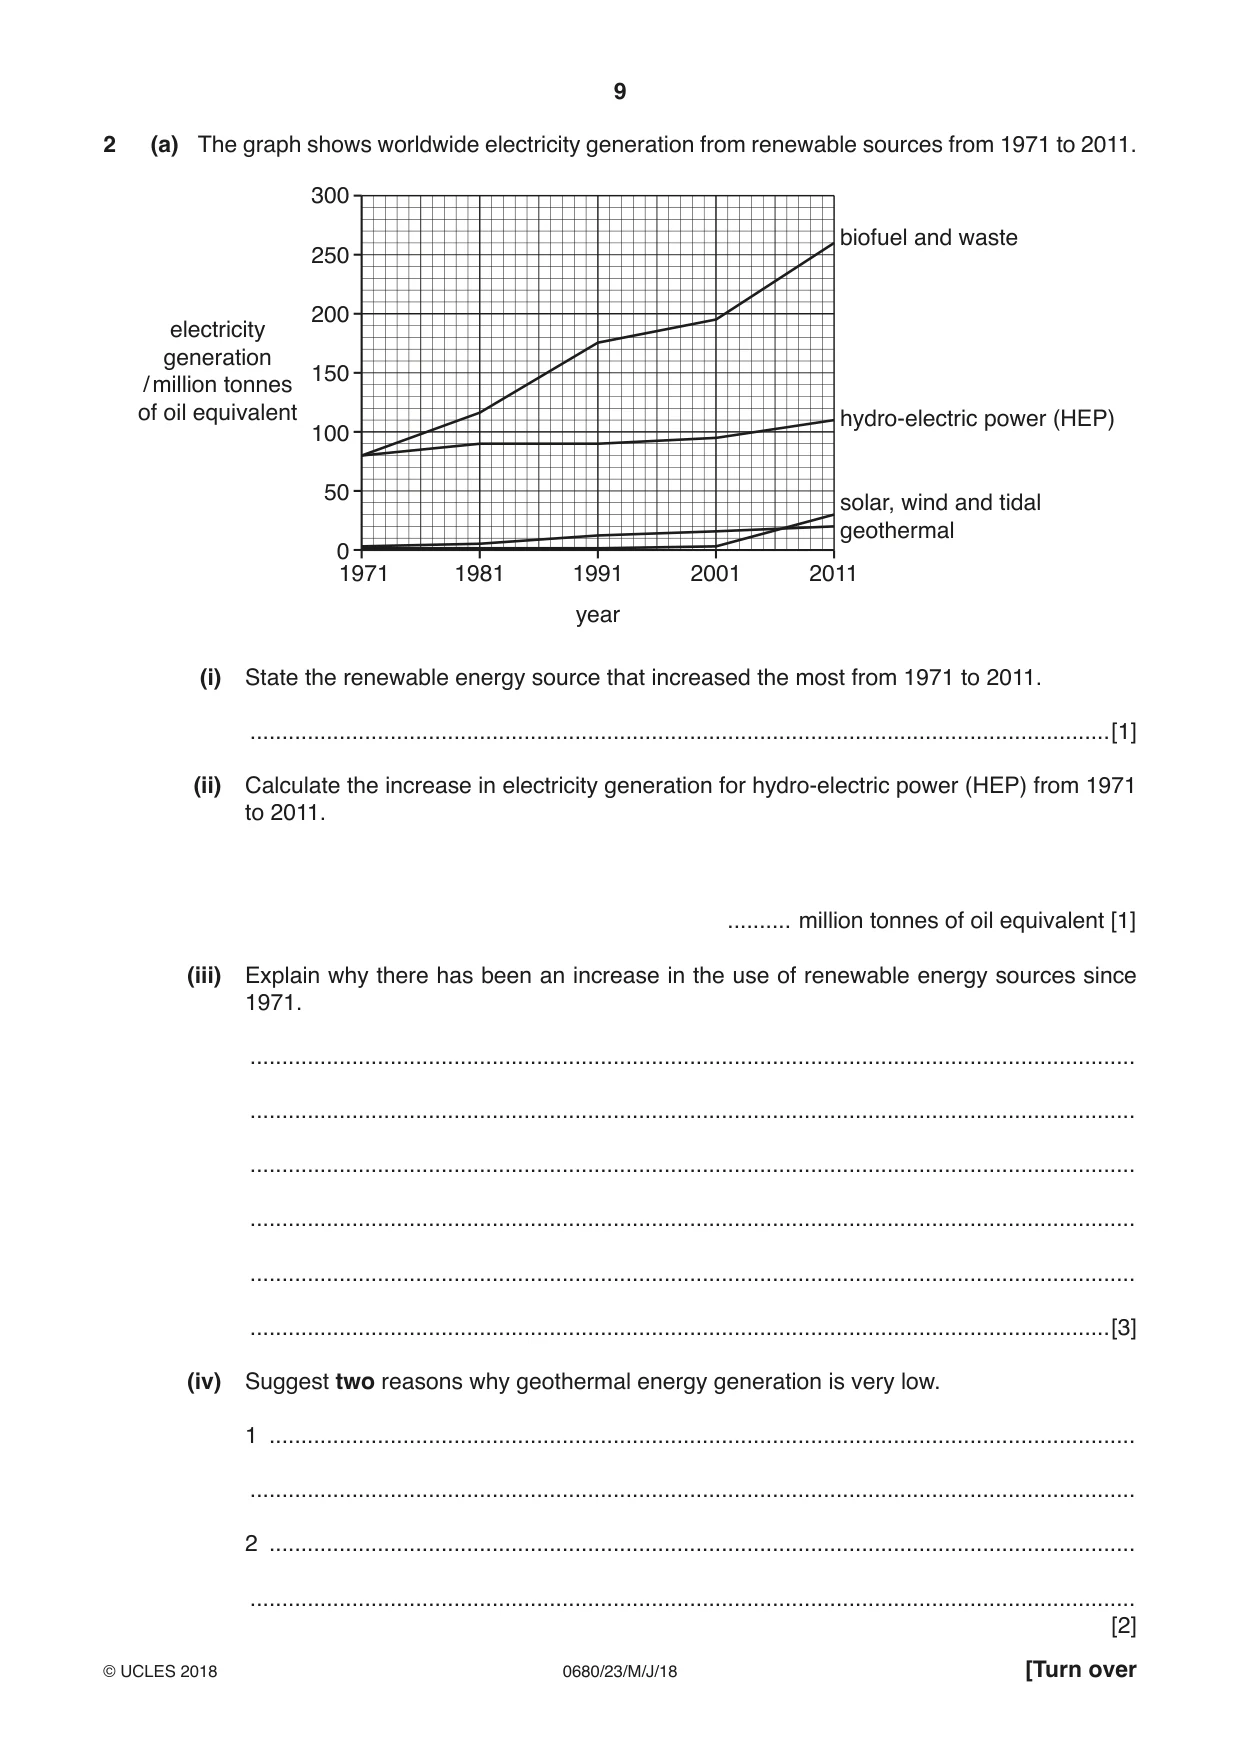
9 0680/23/M/J/18 © UCLES 2018 [Turn over 2 (a) The graph shows worldwide electricity generation from renewable sources from 1971 to 2011. 300 250 200 150 100 50 0 1971 1981 1991 year 2001 2011 biofuel and waste hydro-electric power (HEP) geothermal solar, wind and tidal electricity generation / million tonnes of oil equivalent (i) State the renewable energy source that increased the most from 1971 to 2011. …[1] (ii) Calculate the increase in electricity generation for hydro-electric power (HEP) from 1971 to 2011. … million tonnes of oil equivalent [1] (iii) Explain why there has been an increase in the use of renewable energy sources since 1971. … … … … … …[3] (iv) Suggest two reasons why geothermal energy generation is very low. 1 … … 2 … … [2]
Question paper, page 10
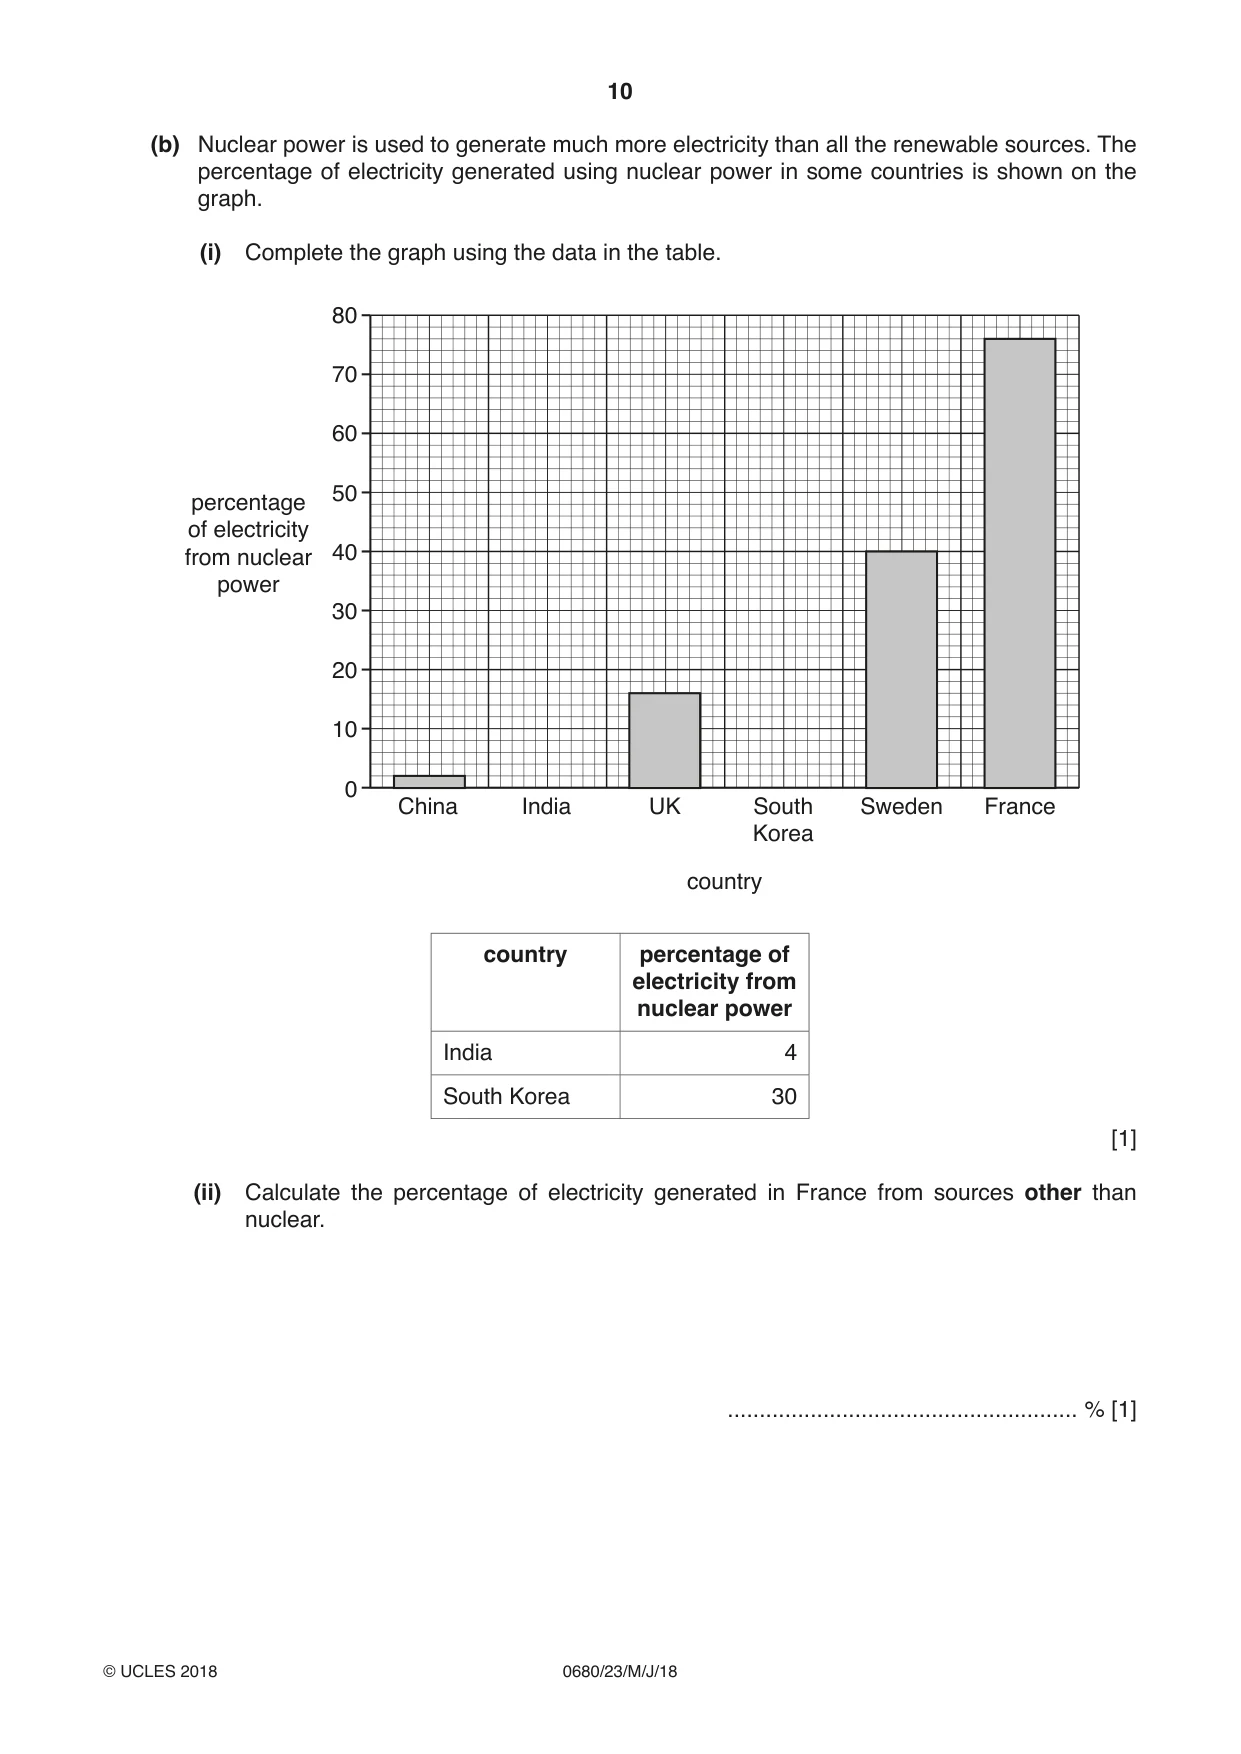
10 0680/23/M/J/18 © UCLES 2018 (b) Nuclear power is used to generate much more electricity than all the renewable sources. The percentage of electricity generated using nuclear power in some countries is shown on the graph. (i) Complete the graph using the data in the table. China India UK South Korea country Sweden France 0 10 20 30 40 50 60 70 80 percentage of electricity from nuclear power country percentage of electricity from nuclear power India 4 South Korea 30 [1] (ii) Calculate the percentage of electricity generated in France from sources other than nuclear. … % [1]
Question paper, page 11
11 0680/23/M/J/18 © UCLES 2018 [Turn over (iii) Suggest reasons why some countries generate a much larger percentage of their electricity from nuclear power than other countries. … … … …[2] (iv) State one environmental reason for, and one environmental reason against, nuclear power. for … … against … … [2]
Question paper, page 12
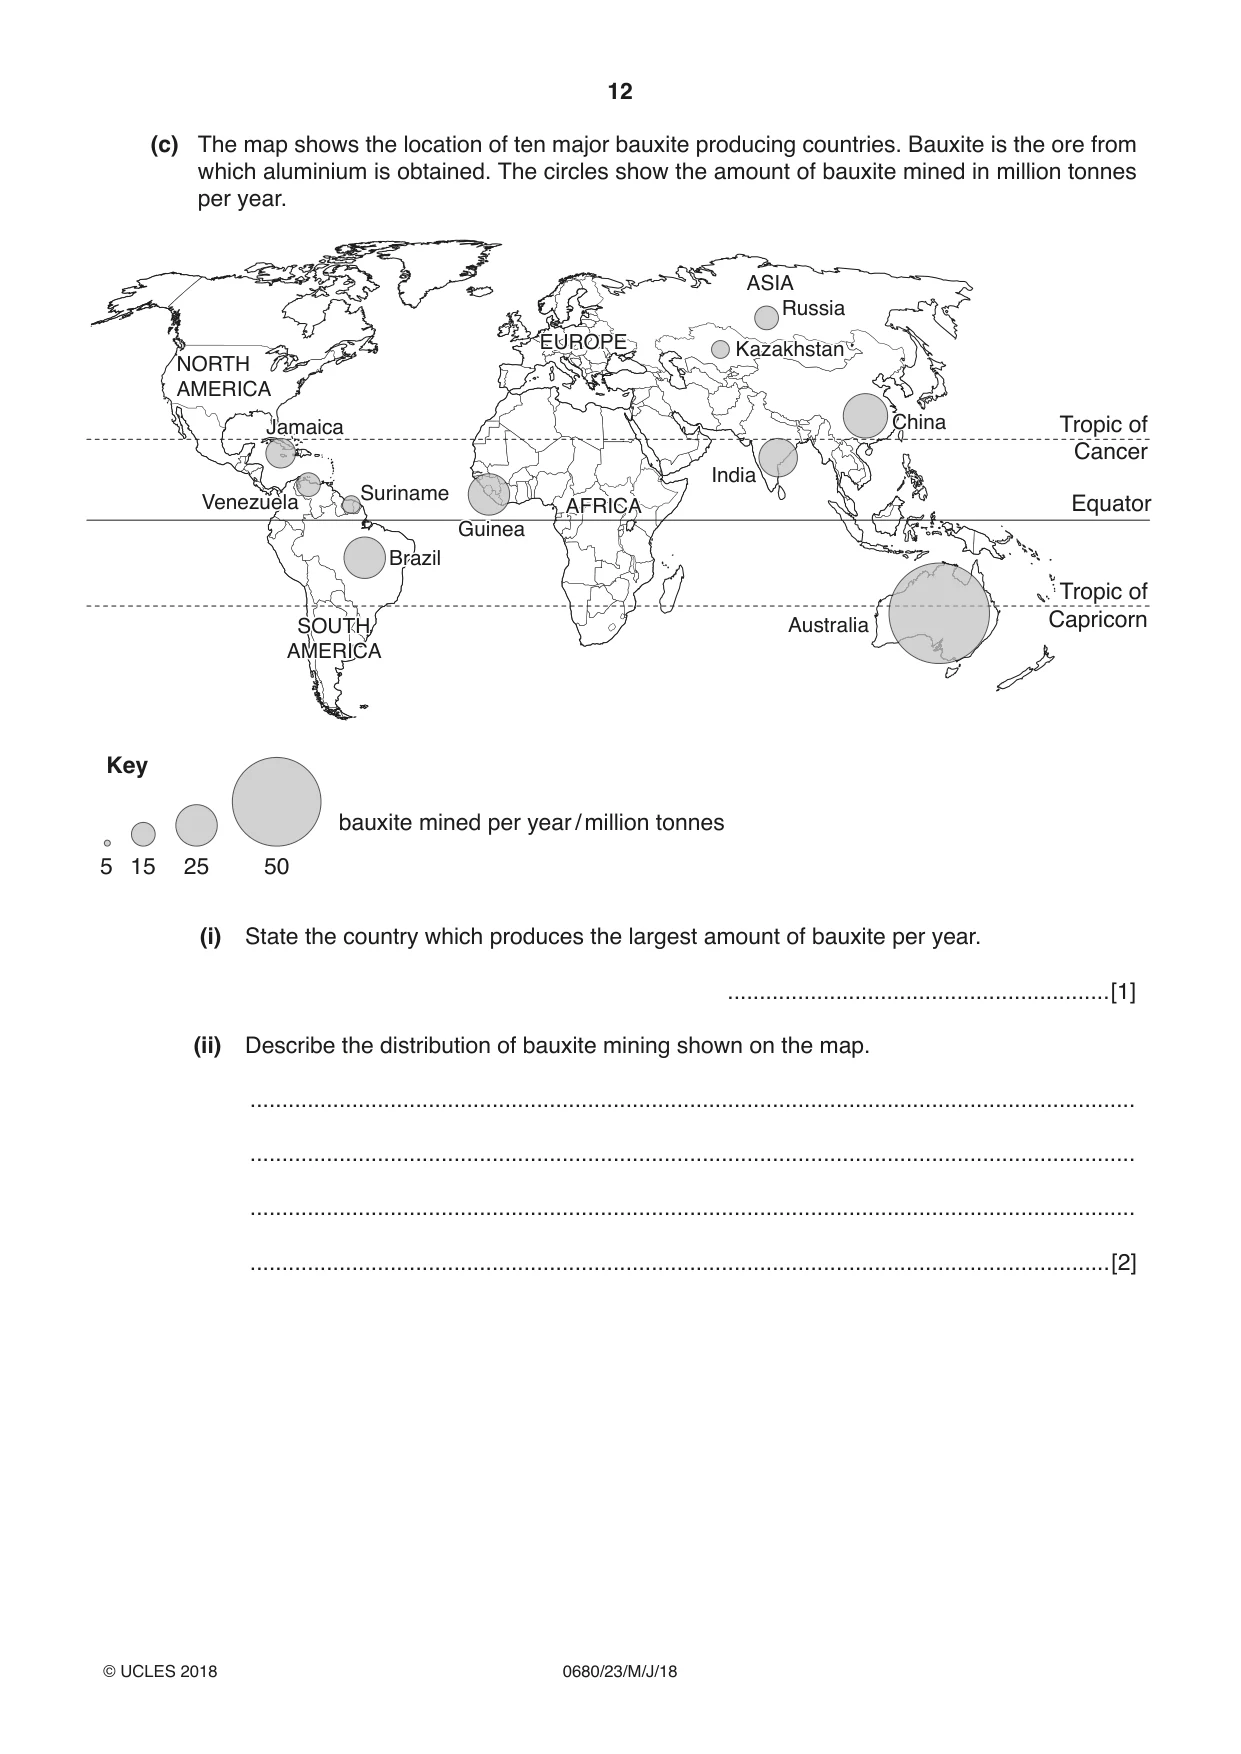
12 0680/23/M/J/18 © UCLES 2018 (c) The map shows the location of ten major bauxite producing countries. Bauxite is the ore from which aluminium is obtained. The circles show the amount of bauxite mined in million tonnes per year. Equator Tropic of Capricorn Tropic of Cancer Key 5 15 25 50 bauxite mined per year / million tonnes NORTH AMERICA SOUTH AMERICA SOUTH AMERICA EUROPE EUROPE AFRICA AFRICA ASIA China China India Australia Venezuela Venezuela Surinam Suriname Brazil Brazil Guinea Guinea Kazakhstan Kazakhstan Russia Jamaica Jamaica (i) State the country which produces the largest amount of bauxite per year. …[1] (ii) Describe the distribution of bauxite mining shown on the map. … … … …[2]
Question paper, page 13
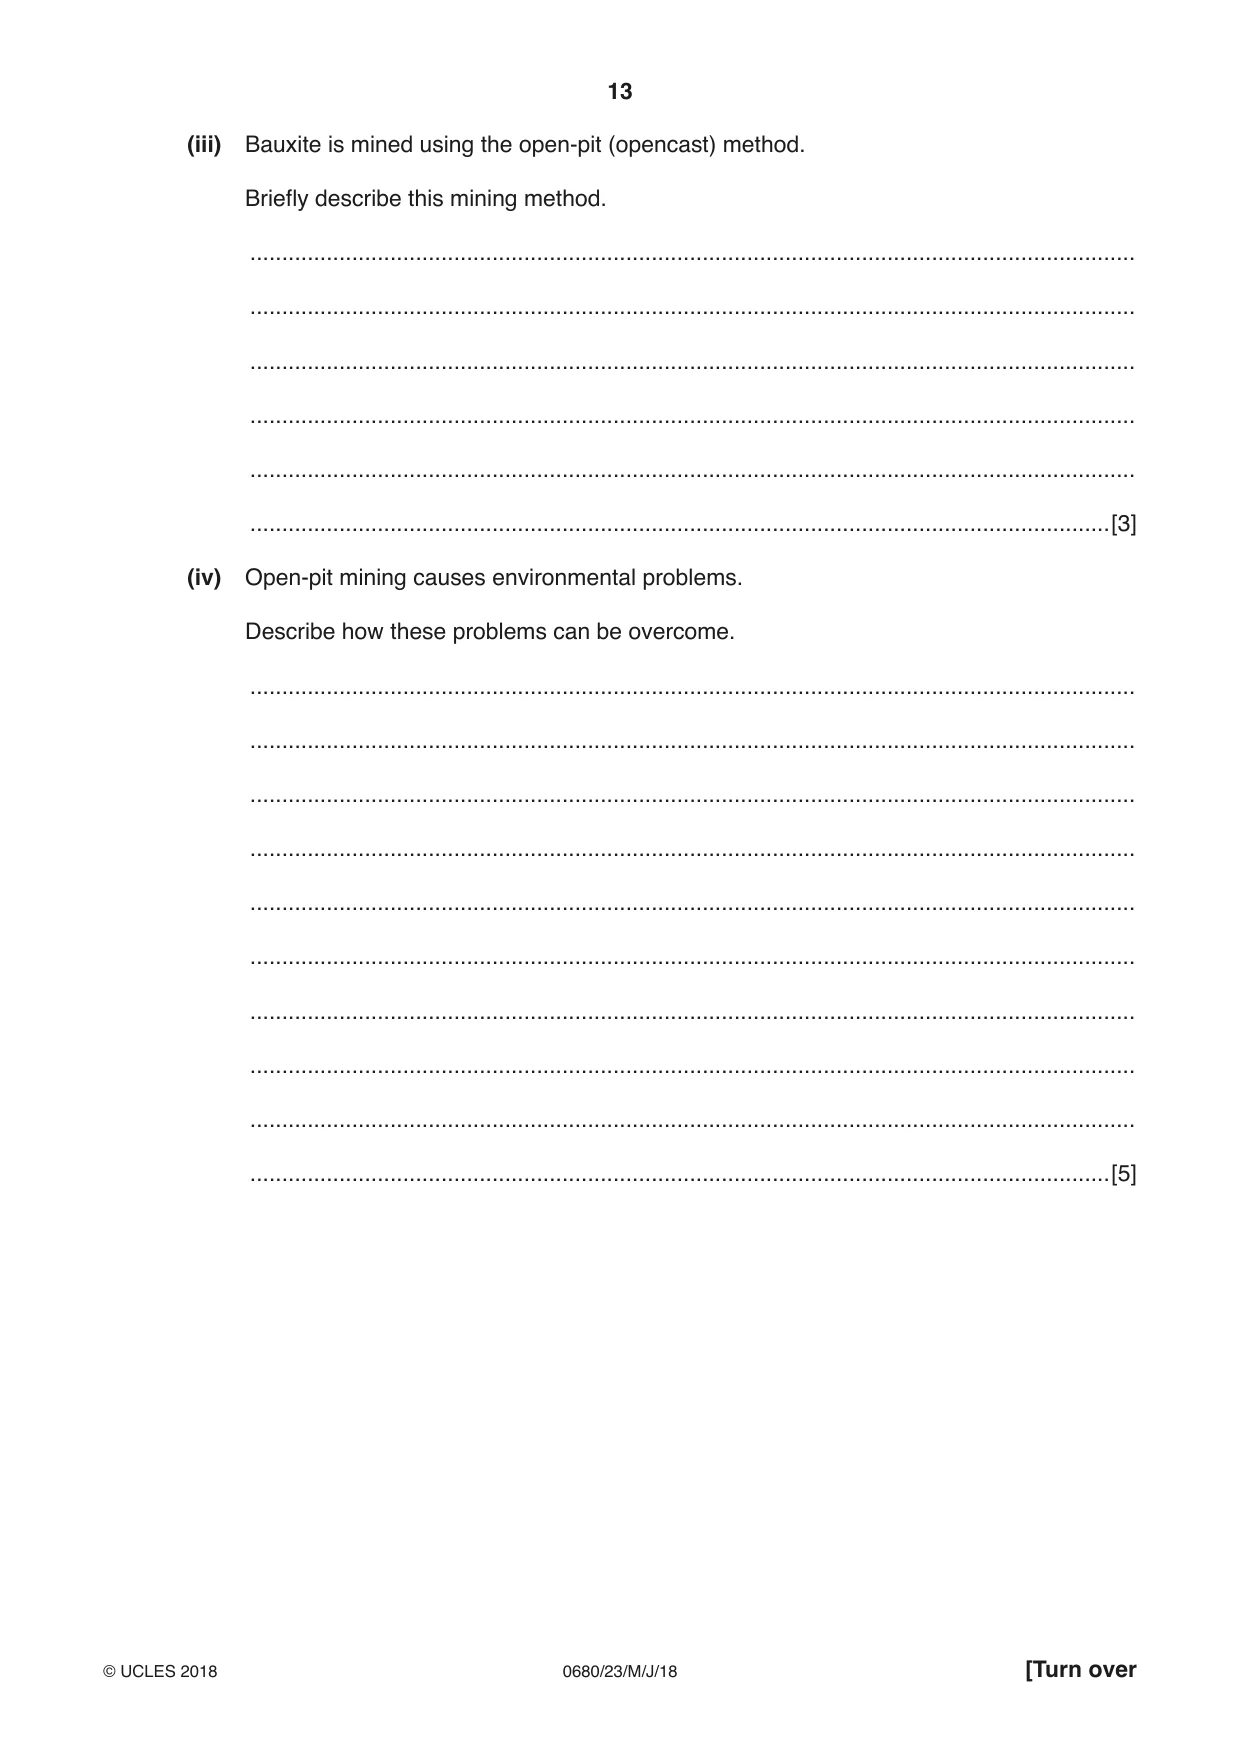
13 0680/23/M/J/18 © UCLES 2018 [Turn over (iii) Bauxite is mined using the open-pit (opencast) method. Briefly describe this mining method. … … … … … …[3] (iv) Open-pit mining causes environmental problems. Describe how these problems can be overcome. … … … … … … … … … …[5]
Question paper, page 14
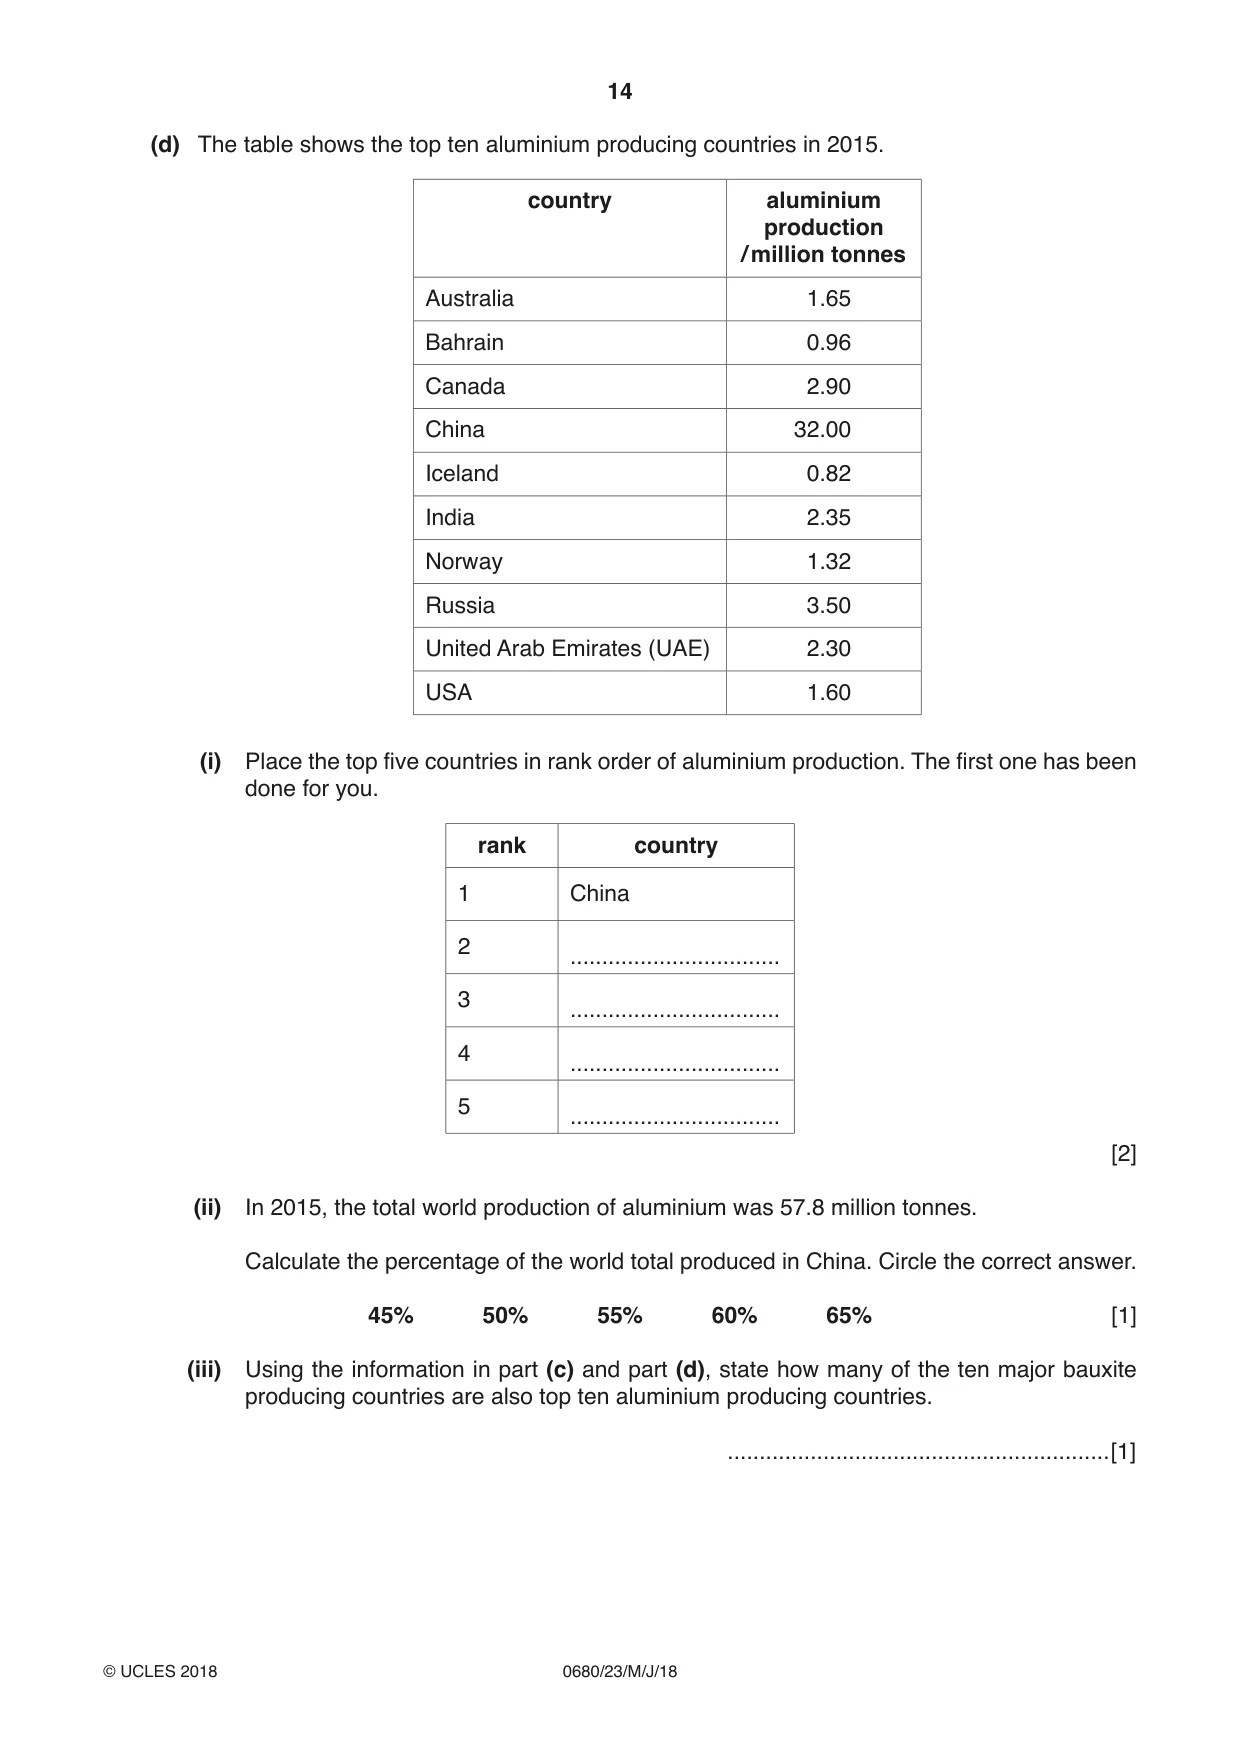
14 0680/23/M/J/18 © UCLES 2018 (d) The table shows the top ten aluminium producing countries in 2015. country aluminium production / million tonnes Australia 1.65 Bahrain 0.96 Canada 2.90 China 32.00 Iceland 0.82 India 2.35 Norway 1.32 Russia 3.50 United Arab Emirates (UAE) 2.30 USA 1.60 (i) Place the top five countries in rank order of aluminium production. The first one has been done for you. rank country 1 China 2 … 3 … 4 … 5 … [2] (ii) In 2015, the total world production of aluminium was 57.8 million tonnes. Calculate the percentage of the world total produced in China. Circle the correct answer. 45% 50% 55% 60% 65% [1] (iii) Using the information in part (c) and part (d), state how many of the ten major bauxite producing countries are also top ten aluminium producing countries. …[1]
Question paper, page 15
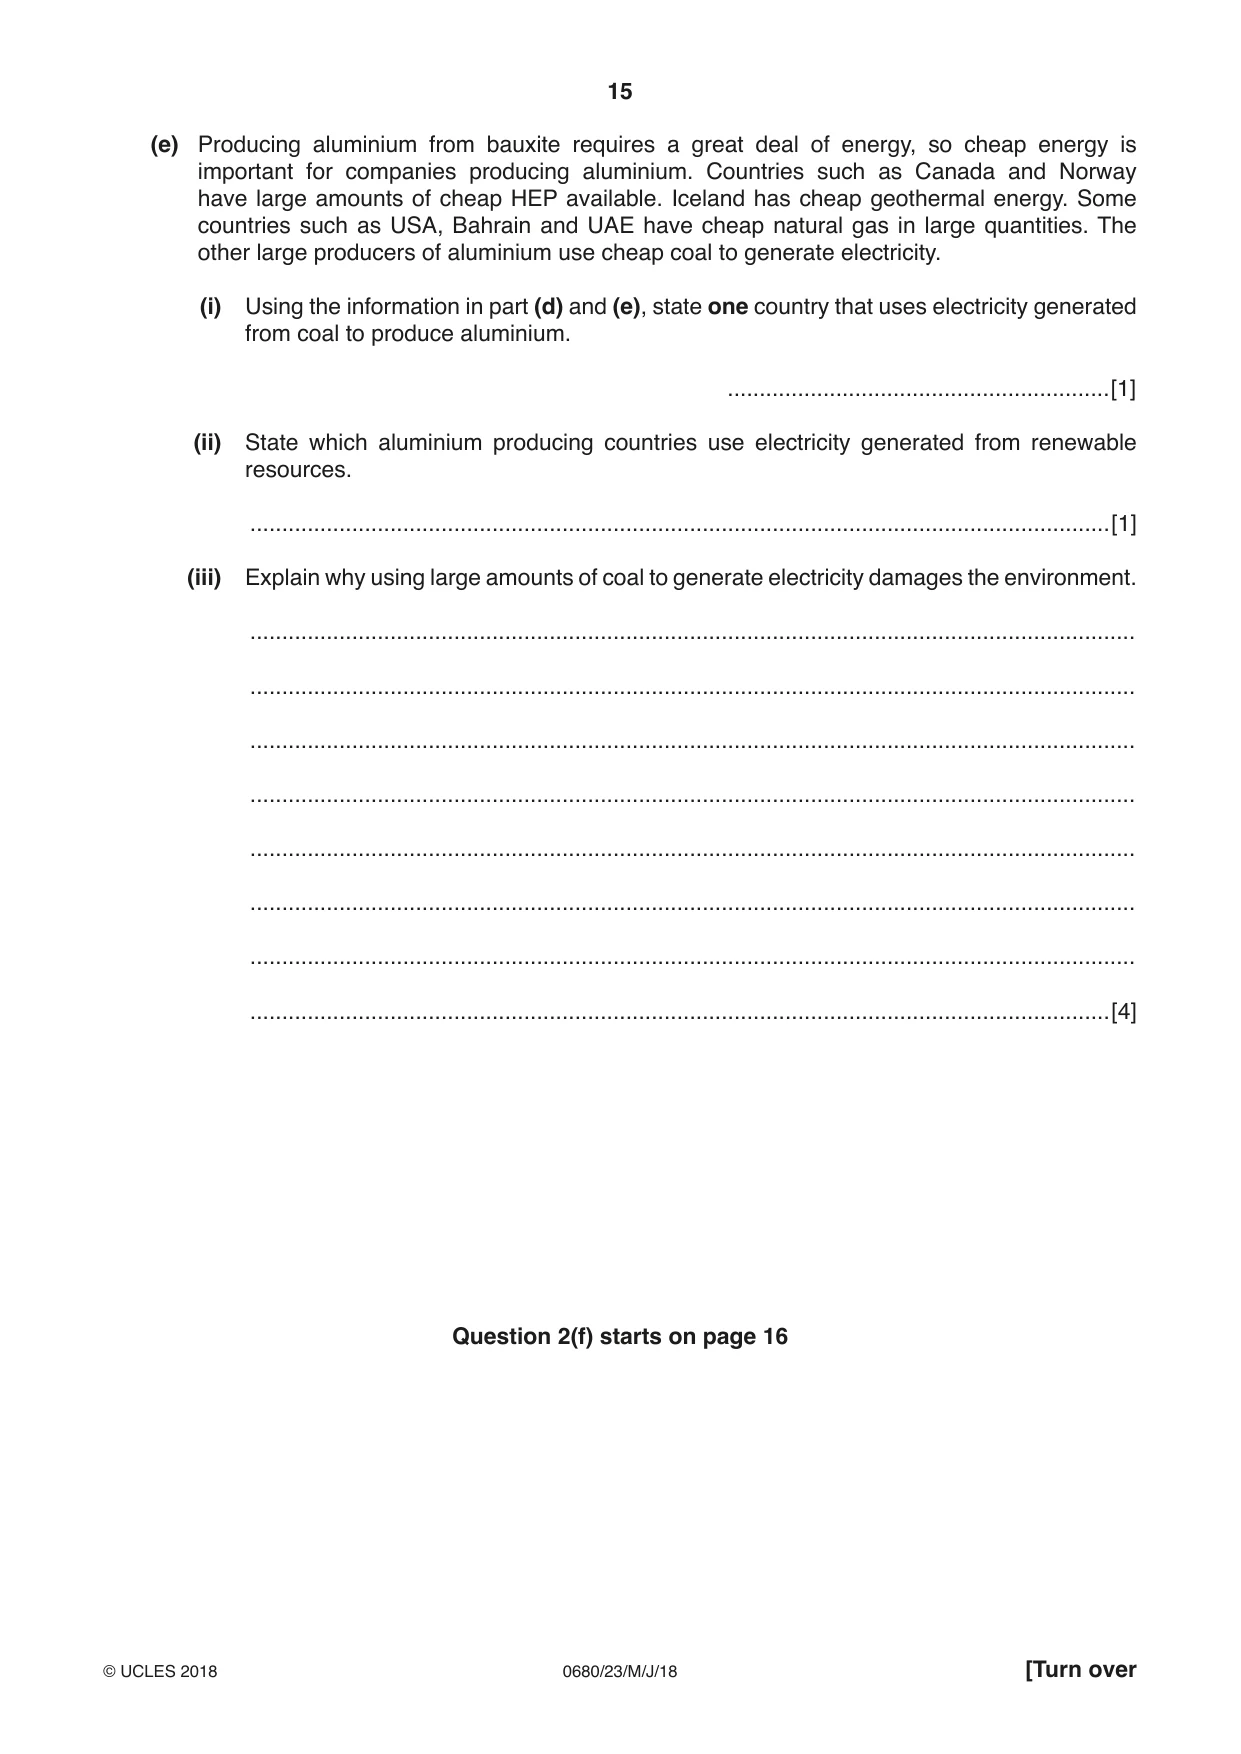
15 0680/23/M/J/18 © UCLES 2018 [Turn over (e) Producing aluminium from bauxite requires a great deal of energy, so cheap energy is important for companies producing aluminium. Countries such as Canada and Norway have large amounts of cheap HEP available. Iceland has cheap geothermal energy. Some countries such as USA, Bahrain and UAE have cheap natural gas in large quantities. The other large producers of aluminium use cheap coal to generate electricity. (i) Using the information in part (d) and (e), state one country that uses electricity generated from coal to produce aluminium. …[1] (ii) State which aluminium producing countries use electricity generated from renewable resources. …[1] (iii) Explain why using large amounts of coal to generate electricity damages the environment. … … … … … … … …[4] Question 2(f) starts on page 16
Question paper, page 16
16 0680/23/M/J/18 © UCLES 2018 Permission to reproduce items where third-party owned material protected by copyright is included has been sought and cleared where possible. Every reasonable effort has been made by the publisher (UCLES) to trace copyright holders, but if any items requiring clearance have unwittingly been included, the publisher will be pleased to make amends at the earliest possible opportunity. To avoid the issue of disclosure of answer-related information to candidates, all copyright acknowledgements are reproduced online in the Cambridge International Examinations Copyright Acknowledgements Booklet. This is produced for each series of examinations and is freely available to download at www.cie.org.uk after the live examination series. Cambridge International Examinations is part of the Cambridge Assessment Group. Cambridge Assessment is the brand name of University of Cambridge Local Examinations Syndicate (UCLES), which is itself a department of the University of Cambridge. (f) ‘Recycling will solve the problems of depletion of resources and atmospheric pollution.’ How far do you agree with this statement? Give reasons for your answer. … … … … … … … … … … … …[6]
Mark scheme, page 1
IGCSE™ is a registered trademark. This document consists of 10 printed pages. © UCLES 2018 [Turn over Cambridge Assessment International Education Cambridge International General Certificate of Secondary Education ENVIRONMENTAL MANAGEMENT 0680/23 Paper 2 May/June 2018 MARK SCHEME Maximum Mark: 80 Published This mark scheme is published as an aid to teachers and candidates, to indicate the requirements of the examination. It shows the basis on which Examiners were instructed to award marks. It does not indicate the details of the discussions that took place at an Examiners’ meeting before marking began, which would have considered the acceptability of alternative answers. Mark schemes should be read in conjunction with the question paper and the Principal Examiner Report for Teachers. Cambridge International will not enter into discussions about these mark schemes. Cambridge International is publishing the mark schemes for the May/June 2018 series for most Cambridge IGCSE™, Cambridge International A and AS Level and Cambridge Pre-U components, and some Cambridge O Level components.
Mark scheme, page 2
0680/23 Cambridge IGCSE – Mark Scheme PUBLISHED May/June 2018 © UCLES 2018 Page 2 of 10 Generic Marking Principles These general marking principles must be applied by all examiners when marking candidate answers. They should be applied alongside the specific content of the mark scheme or generic level descriptors for a question. Each question paper and mark scheme will also comply with these marking principles. GENERIC MARKING PRINCIPLE 1: Marks must be awarded in line with: • the specific content of the mark scheme or the generic level descriptors for the question • the specific skills defined in the mark scheme or in the generic level descriptors for the question • the standard of response required by a candidate as exemplified by the standardisation scripts. GENERIC MARKING PRINCIPLE 2: Marks awarded are always whole marks (not half marks, or other fractions). GENERIC MARKING PRINCIPLE 3: Marks must be awarded positively: • marks are awarded for correct/valid answers, as defined in the mark scheme. However, credit is given for valid answers which go beyond the scope of the syllabus and mark scheme, referring to your Team Leader as appropriate • marks are awarded when candidates clearly demonstrate what they know and can do • marks are not deducted for errors • marks are not deducted for omissions • answers should only be judged on the quality of spelling, punctuation and grammar when these features are specifically assessed by the question as indicated by the mark scheme. The meaning, however, should be unambiguous. GENERIC MARKING PRINCIPLE 4: Rules must be applied consistently e.g. in situations where candidates have not followed instructions or in the application of generic level descriptors.
Mark scheme, page 3
0680/23 Cambridge IGCSE – Mark Scheme PUBLISHED May/June 2018 © UCLES 2018 Page 3 of 10 GENERIC MARKING PRINCIPLE 5: Marks should be awarded using the full range of marks defined in the mark scheme for the question (however; the use of the full mark range may be limited according to the quality of the candidate responses seen). GENERIC MARKING PRINCIPLE 6: Marks awarded are based solely on the requirements as defined in the mark scheme. Marks should not be awarded with grade thresholds or grade descriptors in mind.
Mark scheme, page 4
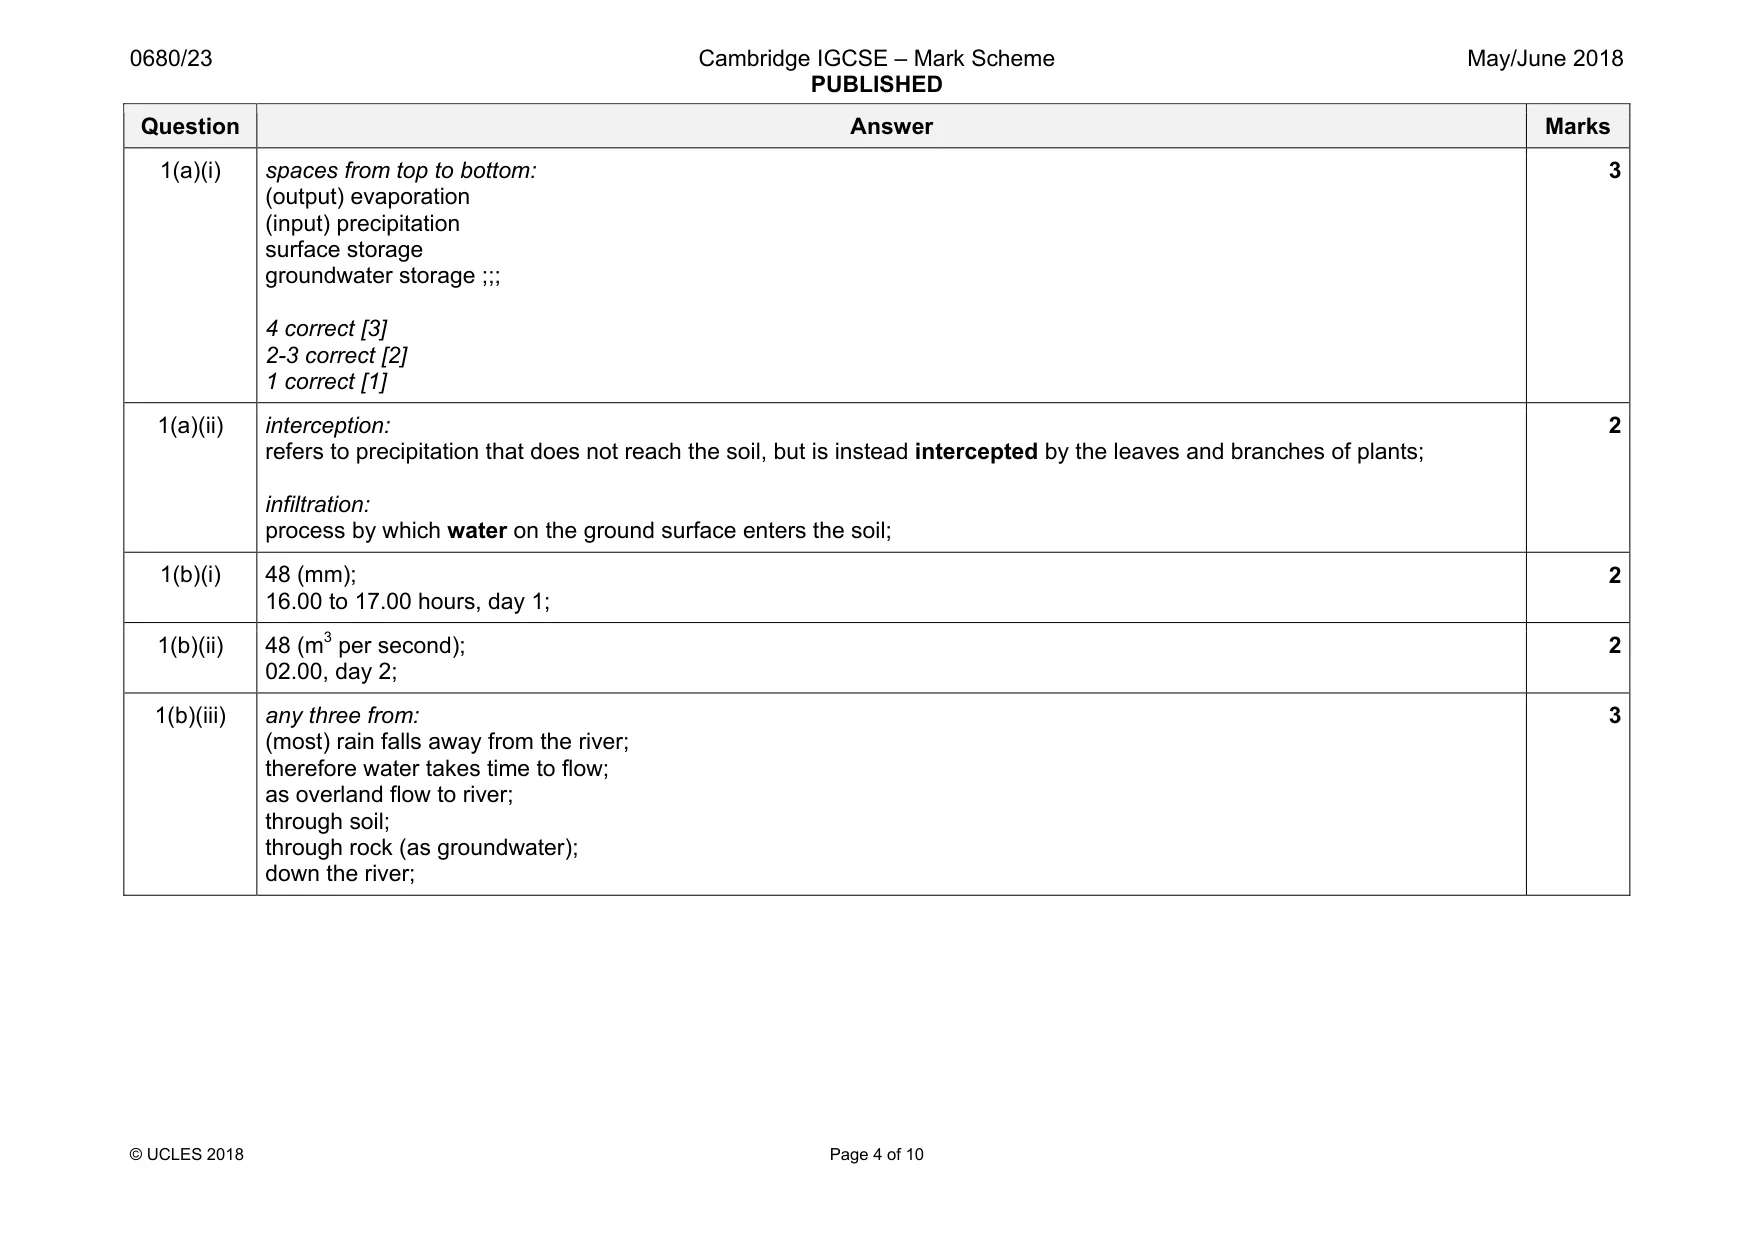
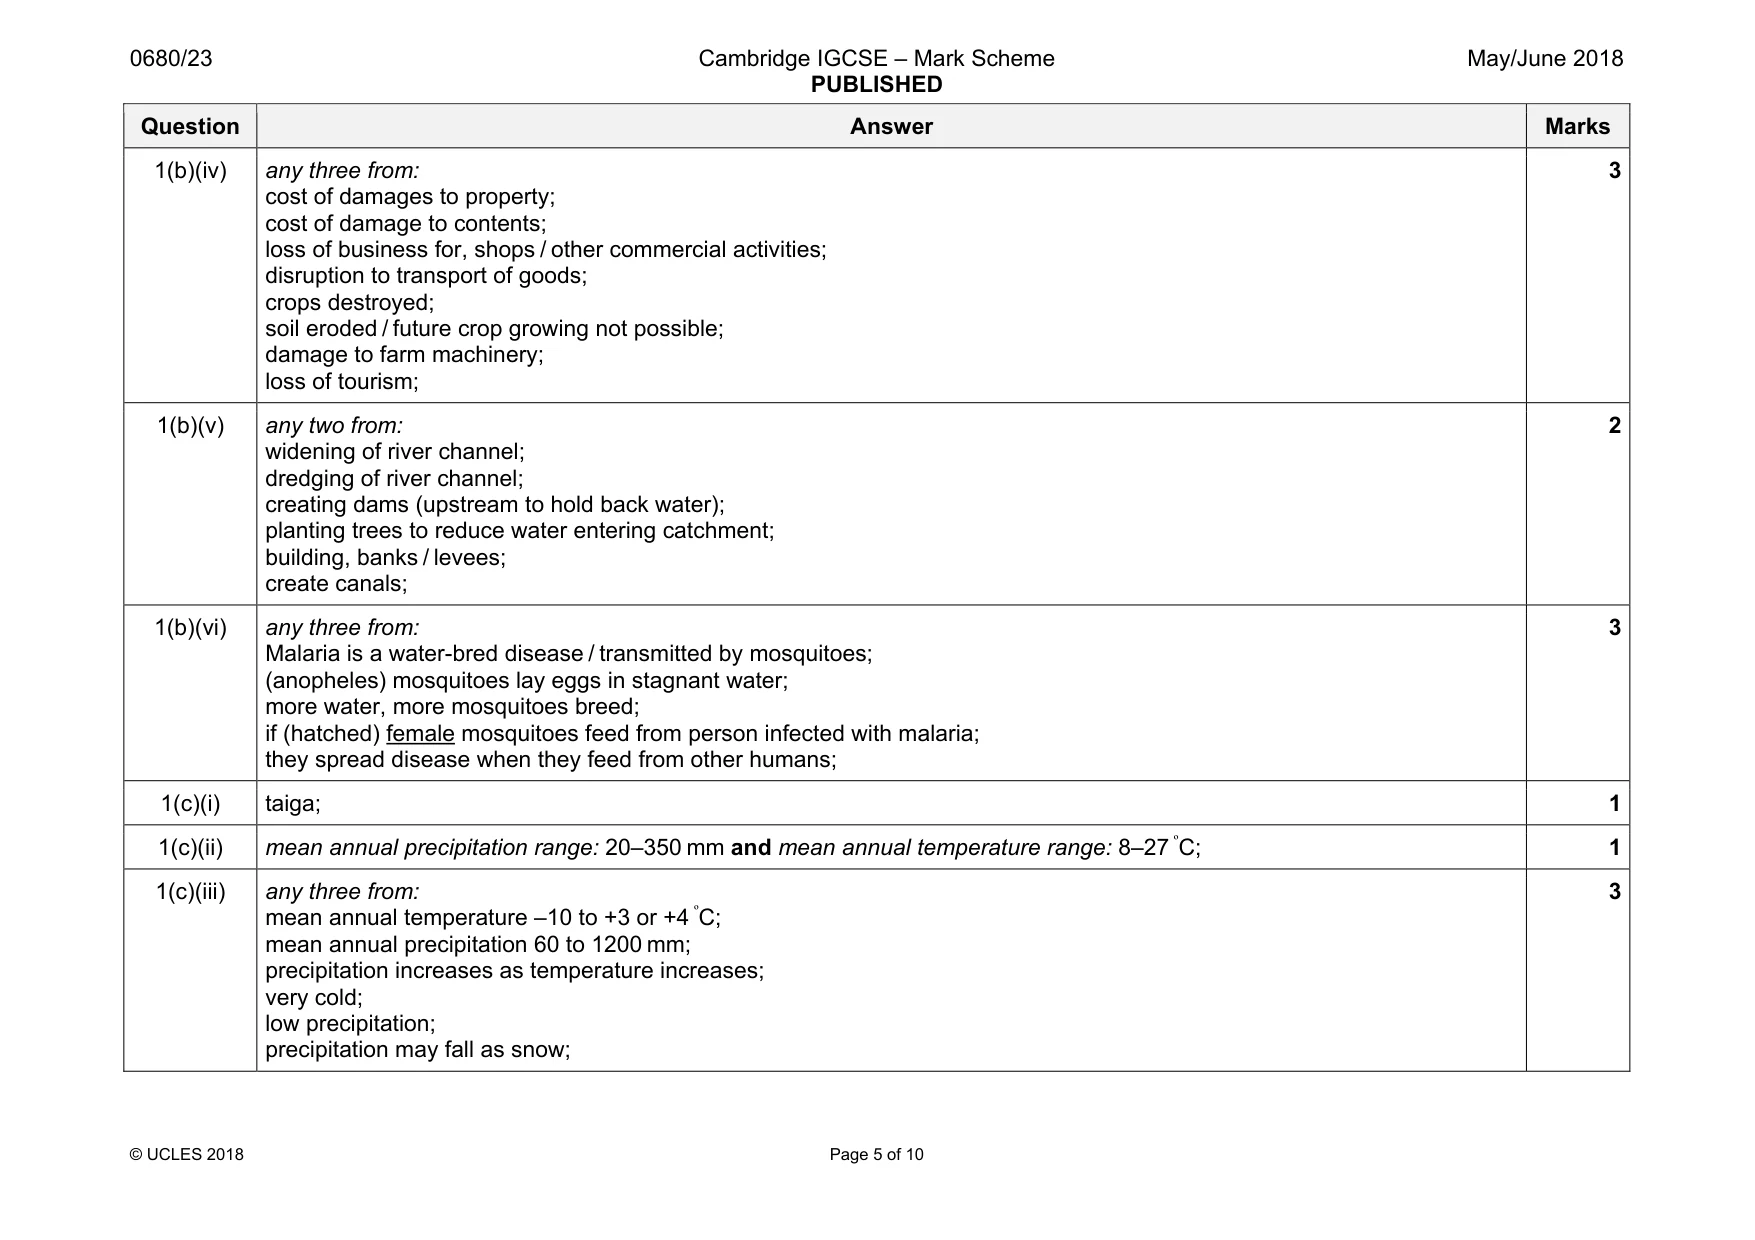
0680/23 Cambridge IGCSE – Mark Scheme PUBLISHED May/June 2018 © UCLES 2018 Page 4 of 10 Question Answer Marks 1(a)(i) spaces from top to bottom: (output) evaporation (input) precipitation surface storage groundwater storage ;;; 4 correct [3] 2-3 correct [2] 1 correct [1] 3 1(a)(ii) interception: refers to precipitation that does not reach the soil, but is instead intercepted by the leaves and branches of plants; infiltration: process by which water on the ground surface enters the soil; 2 1(b)(i) 48 (mm); 16.00 to 17.00 hours, day 1; 2 1(b)(ii) 48 (m3 per second); 02.00, day 2; 2 1(b)(iii) any three from: (most) rain falls away from the river; therefore water takes time to flow; as overland flow to river; through soil; through rock (as groundwater); down the river; 3
Mark scheme, page 5
0680/23 Cambridge IGCSE – Mark Scheme PUBLISHED May/June 2018 © UCLES 2018 Page 5 of 10 Question Answer Marks 1(b)(iv) any three from: cost of damages to property; cost of damage to contents; loss of business for, shops / other commercial activities; disruption to transport of goods; crops destroyed; soil eroded / future crop growing not possible; damage to farm machinery; loss of tourism; 3 1(b)(v) any two from: widening of river channel; dredging of river channel; creating dams (upstream to hold back water); planting trees to reduce water entering catchment; building, banks / levees; create canals; 2 1(b)(vi) any three from: Malaria is a water-bred disease / transmitted by mosquitoes; (anopheles) mosquitoes lay eggs in stagnant water; more water, more mosquitoes breed; if (hatched) female mosquitoes feed from person infected with malaria; they spread disease when they feed from other humans; 3 1(c)(i) taiga; 1 1(c)(ii) mean annual precipitation range: 20–350 mm and mean annual temperature range: 8–27 ºC; 1 1(c)(iii) any three from: mean annual temperature –10 to +3 or +4 ºC; mean annual precipitation 60 to 1200 mm; precipitation increases as temperature increases; very cold; low precipitation; precipitation may fall as snow; 3
Mark scheme, page 6
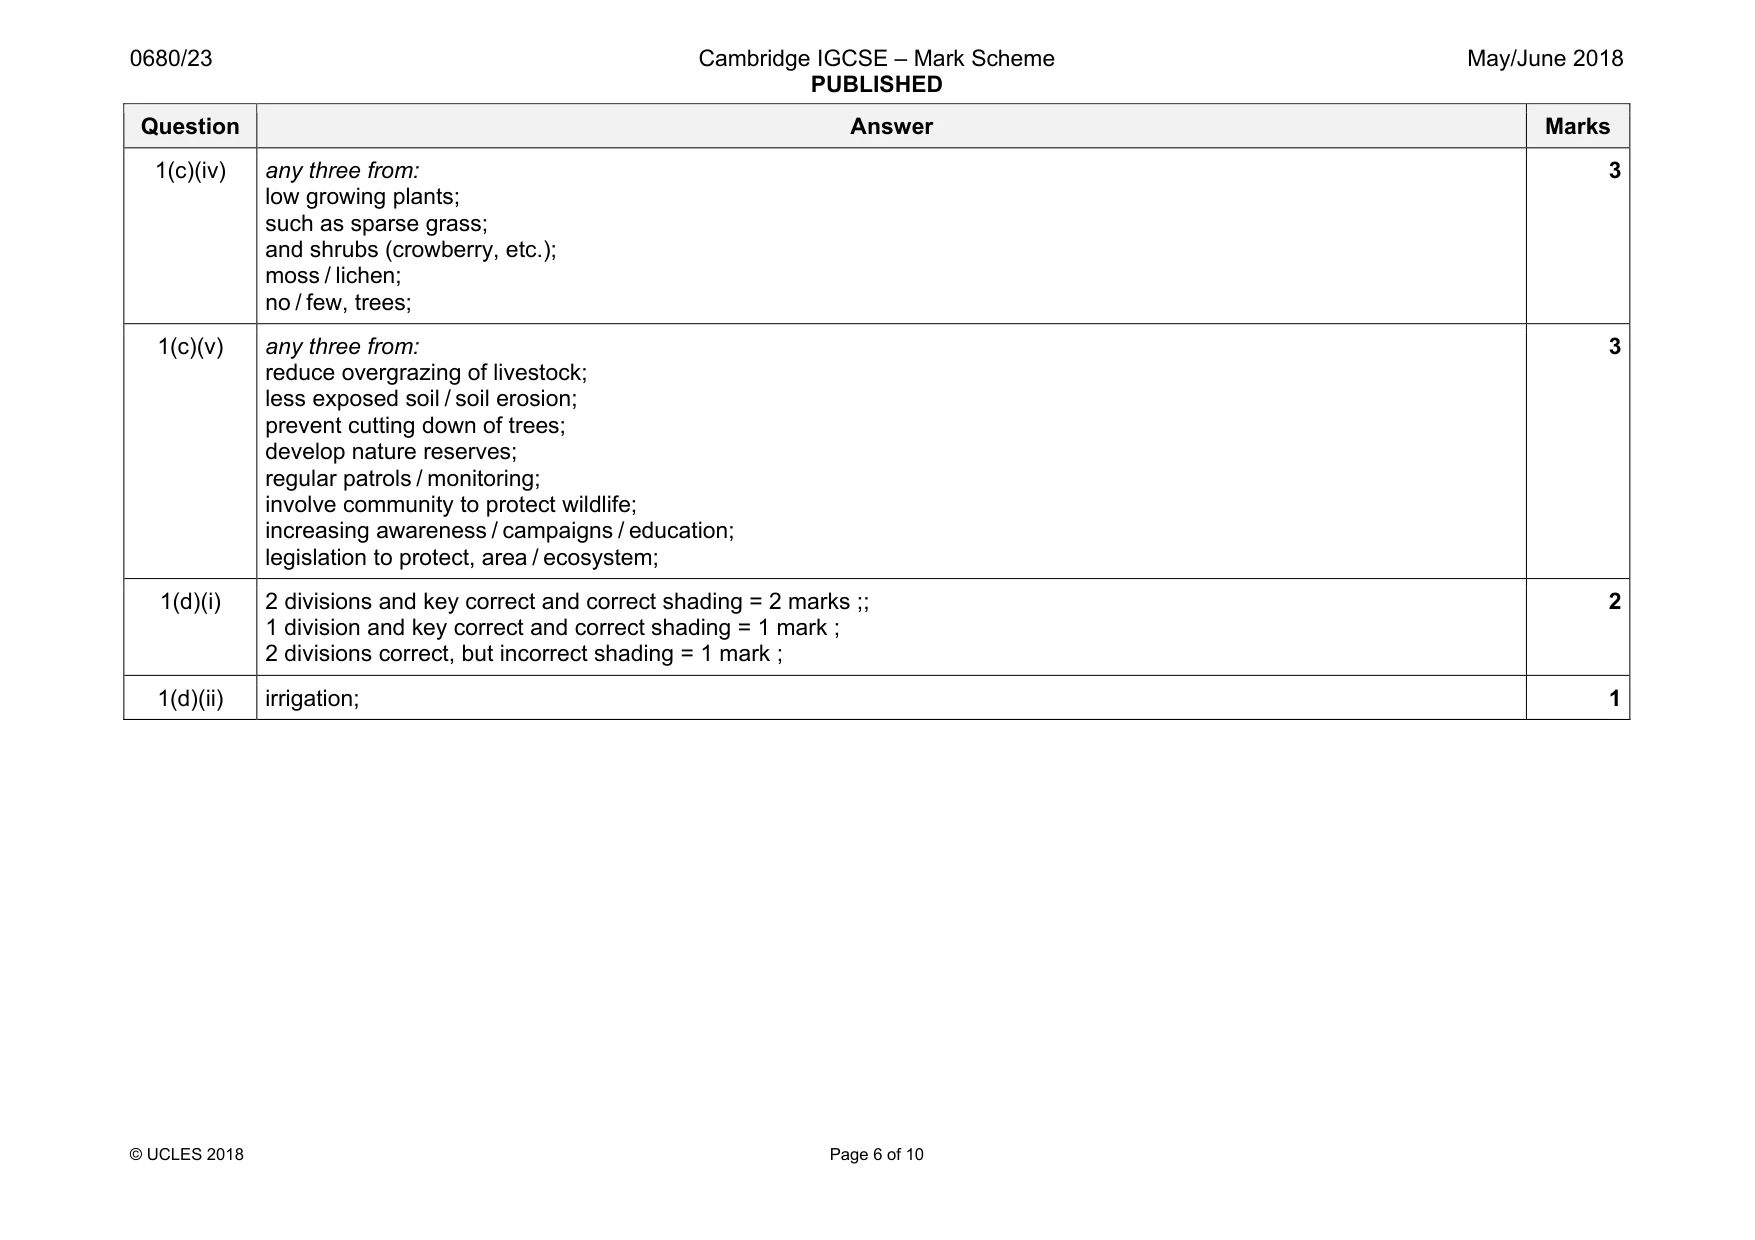
0680/23 Cambridge IGCSE – Mark Scheme PUBLISHED May/June 2018 © UCLES 2018 Page 6 of 10 Question Answer Marks 1(c)(iv) any three from: low growing plants; such as sparse grass; and shrubs (crowberry, etc.); moss / lichen; no / few, trees; 3 1(c)(v) any three from: reduce overgrazing of livestock; less exposed soil / soil erosion; prevent cutting down of trees; develop nature reserves; regular patrols / monitoring; involve community to protect wildlife; increasing awareness / campaigns / education; legislation to protect, area / ecosystem; 3 1(d)(i) 2 divisions and key correct and correct shading = 2 marks ;; 1 division and key correct and correct shading = 1 mark ; 2 divisions correct, but incorrect shading = 1 mark ; 2 1(d)(ii) irrigation; 1
Mark scheme, page 7
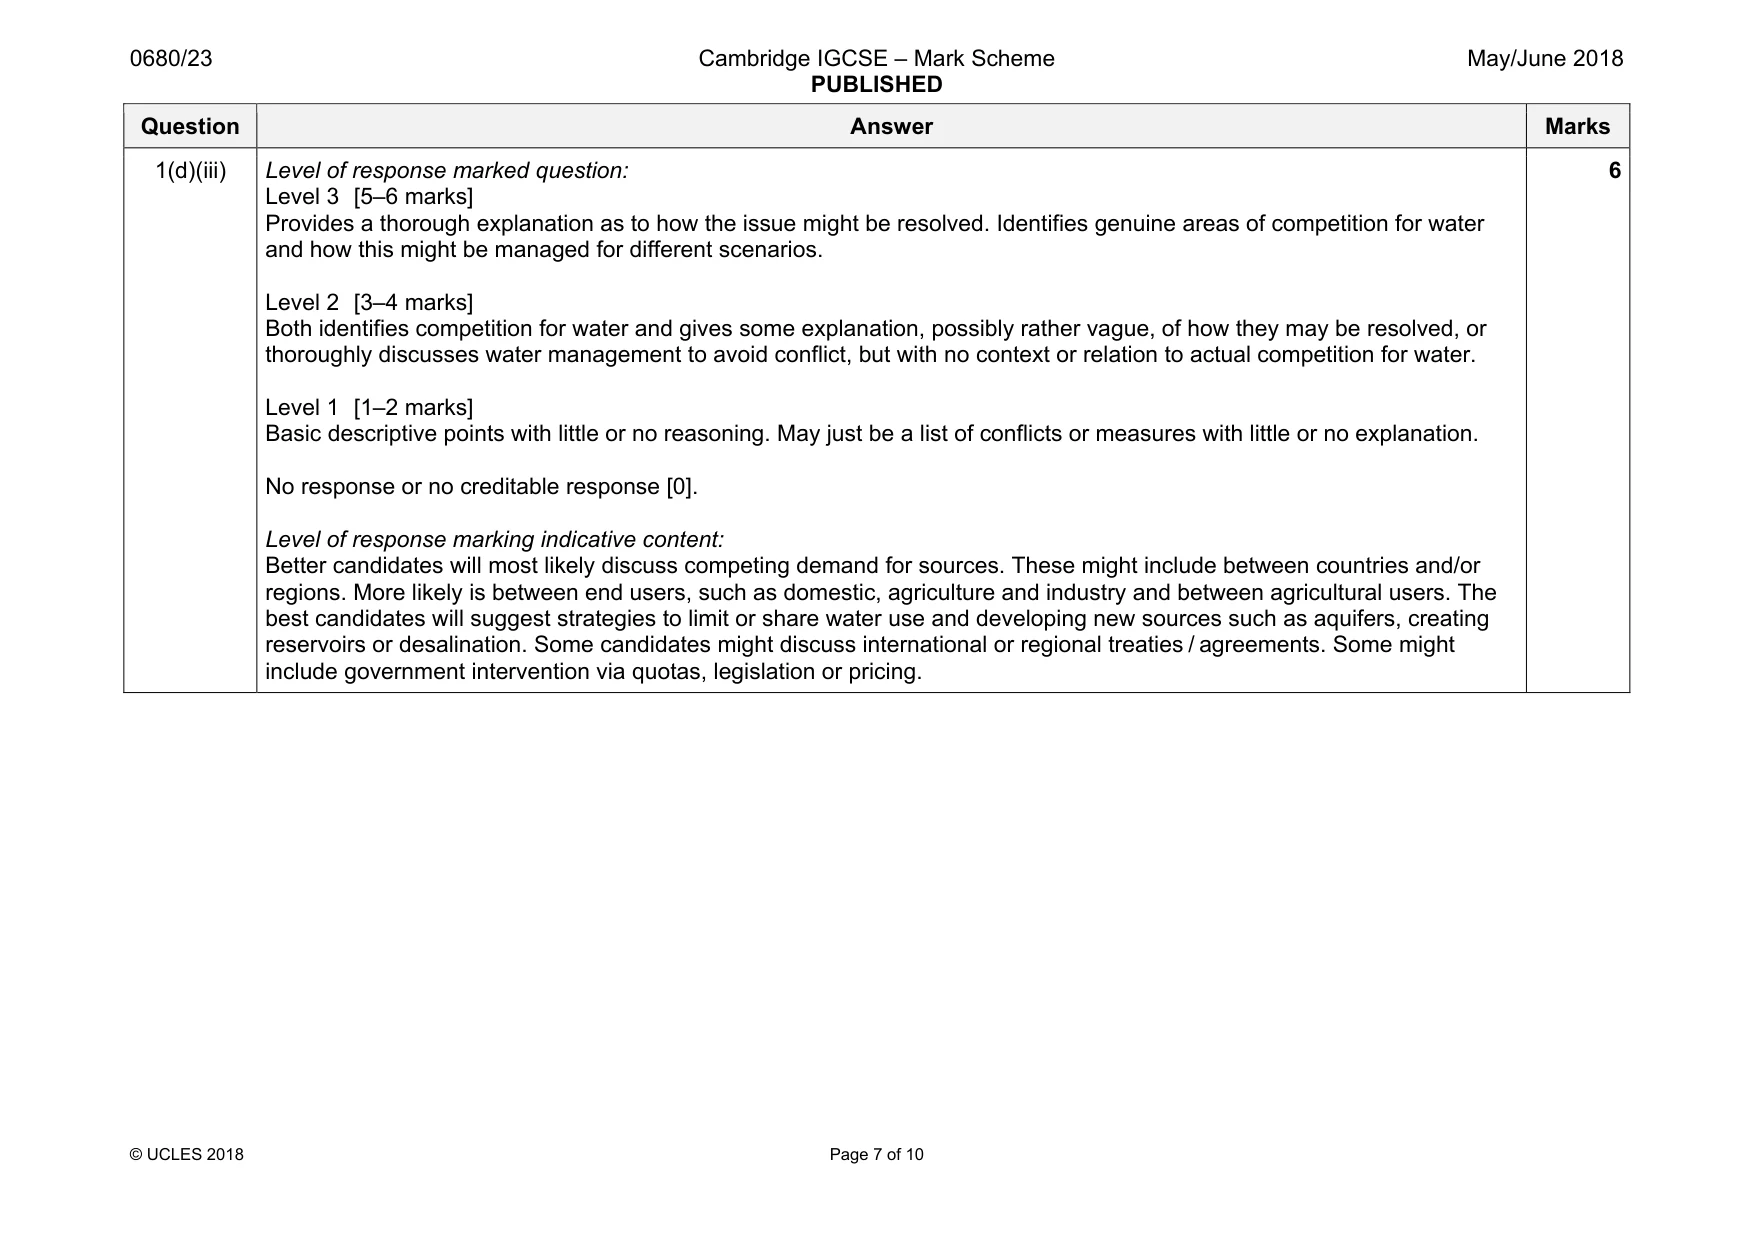
0680/23 Cambridge IGCSE – Mark Scheme PUBLISHED May/June 2018 © UCLES 2018 Page 7 of 10 Question Answer Marks 1(d)(iii) Level of response marked question: Level 3 [5–6 marks] Provides a thorough explanation as to how the issue might be resolved. Identifies genuine areas of competition for water and how this might be managed for different scenarios. Level 2 [3–4 marks] Both identifies competition for water and gives some explanation, possibly rather vague, of how they may be resolved, or thoroughly discusses water management to avoid conflict, but with no context or relation to actual competition for water. Level 1 [1–2 marks] Basic descriptive points with little or no reasoning. May just be a list of conflicts or measures with little or no explanation. No response or no creditable response [0]. Level of response marking indicative content: Better candidates will most likely discuss competing demand for sources. These might include between countries and/or regions. More likely is between end users, such as domestic, agriculture and industry and between agricultural users. The best candidates will suggest strategies to limit or share water use and developing new sources such as aquifers, creating reservoirs or desalination. Some candidates might discuss international or regional treaties / agreements. Some might include government intervention via quotas, legislation or pricing. 6
Mark scheme, page 8
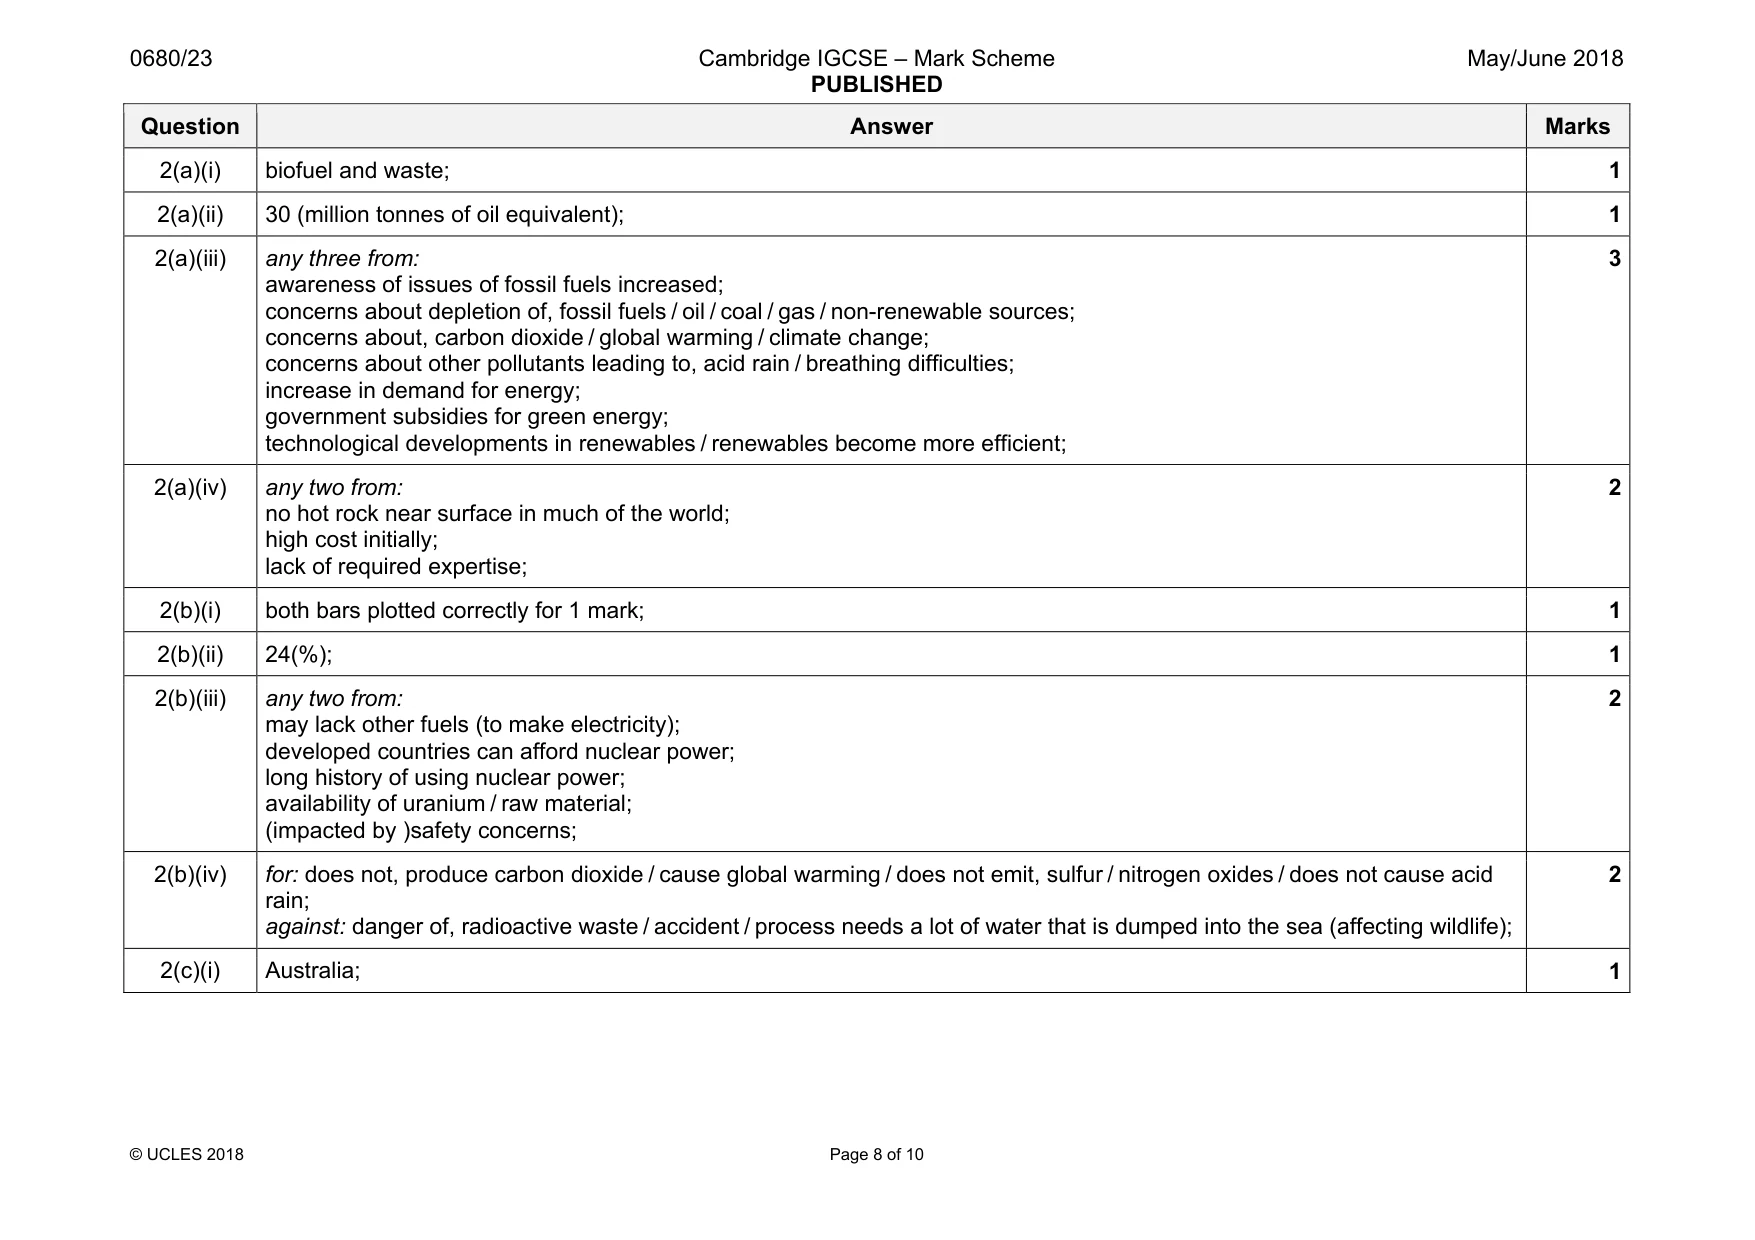
0680/23 Cambridge IGCSE – Mark Scheme PUBLISHED May/June 2018 © UCLES 2018 Page 8 of 10 Question Answer Marks 2(a)(i) biofuel and waste; 1 2(a)(ii) 30 (million tonnes of oil equivalent); 1 2(a)(iii) any three from: awareness of issues of fossil fuels increased; concerns about depletion of, fossil fuels / oil / coal / gas / non-renewable sources; concerns about, carbon dioxide / global warming / climate change; concerns about other pollutants leading to, acid rain / breathing difficulties; increase in demand for energy; government subsidies for green energy; technological developments in renewables / renewables become more efficient; 3 2(a)(iv) any two from: no hot rock near surface in much of the world; high cost initially; lack of required expertise; 2 2(b)(i) both bars plotted correctly for 1 mark; 1 2(b)(ii) 24(%); 1 2(b)(iii) any two from: may lack other fuels (to make electricity); developed countries can afford nuclear power; long history of using nuclear power; availability of uranium / raw material; (impacted by )safety concerns; 2 2(b)(iv) for: does not, produce carbon dioxide / cause global warming / does not emit, sulfur / nitrogen oxides / does not cause acid rain; against: danger of, radioactive waste / accident / process needs a lot of water that is dumped into the sea (affecting wildlife); 2 2(c)(i) Australia; 1
Mark scheme, page 9
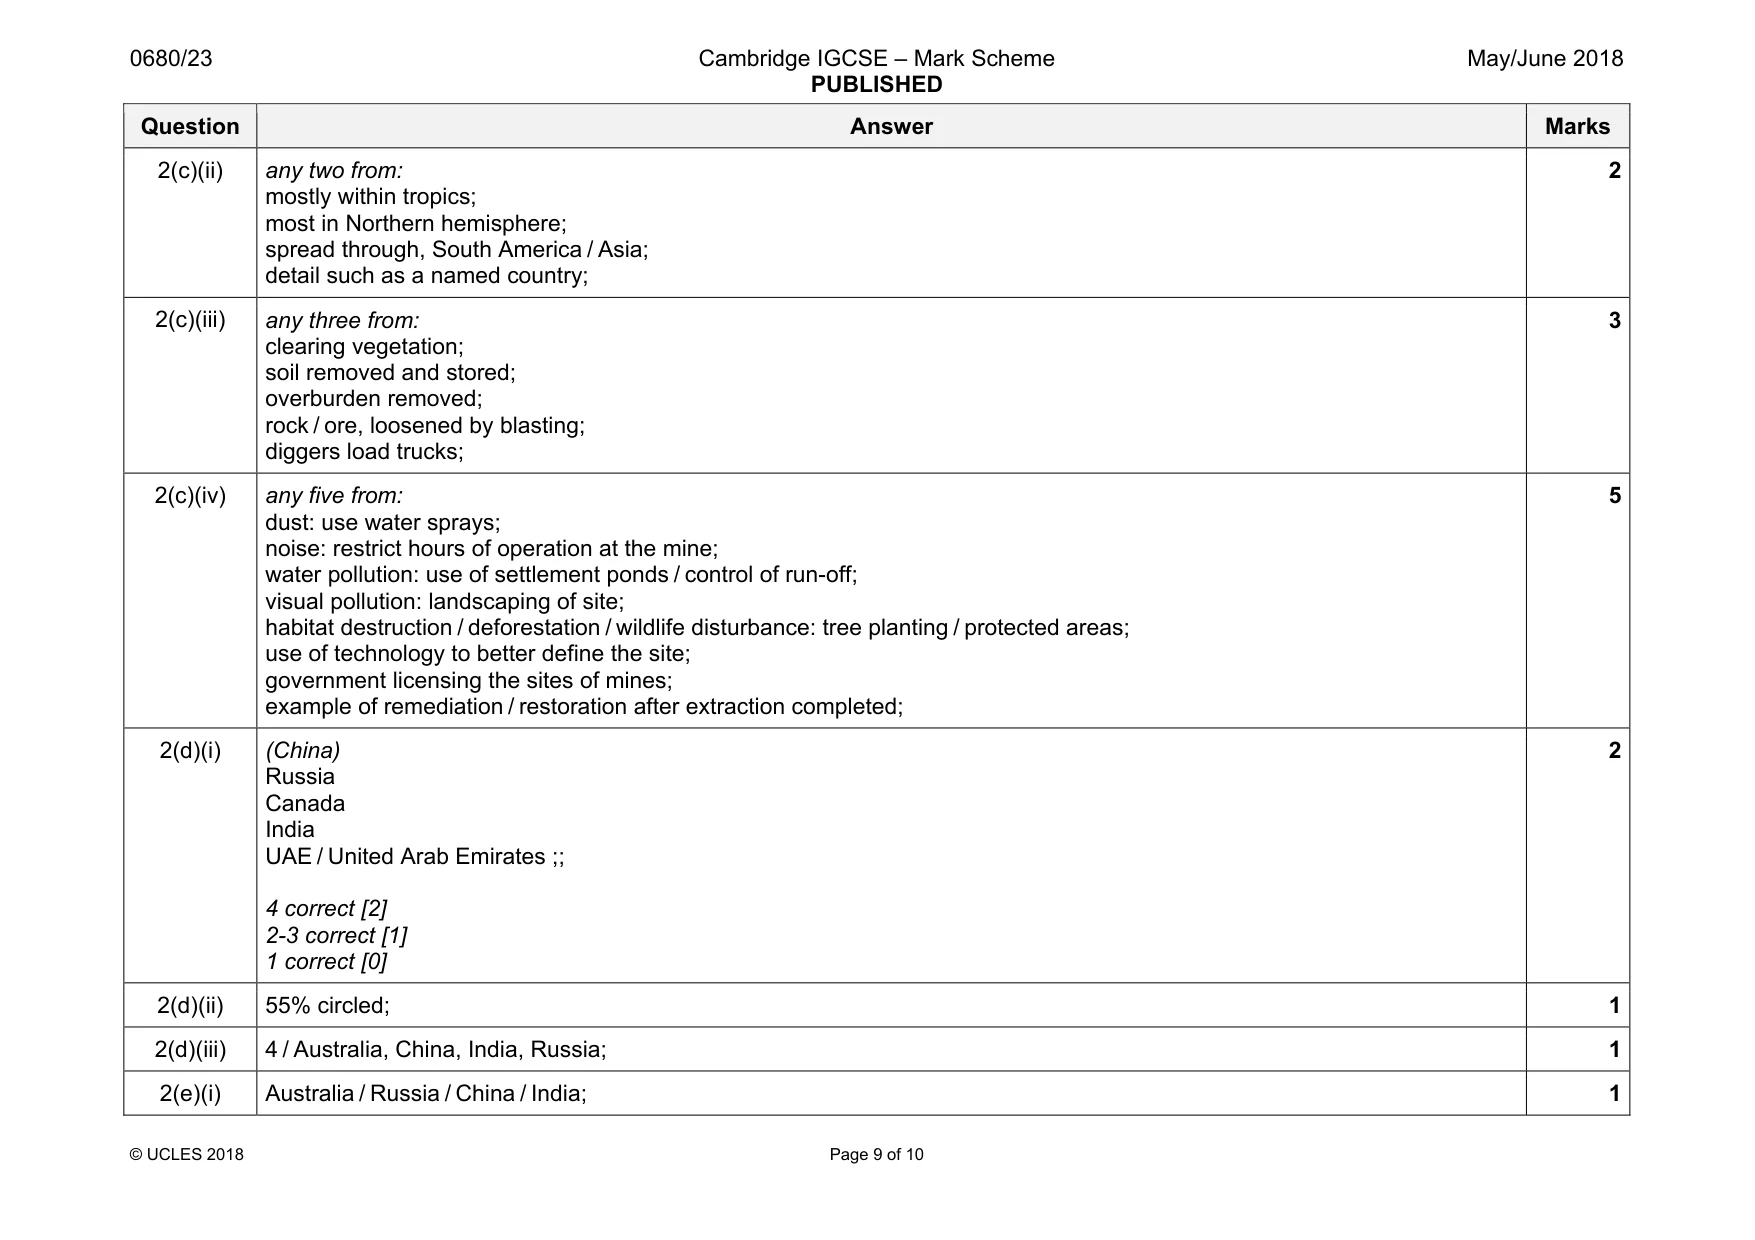
0680/23 Cambridge IGCSE – Mark Scheme PUBLISHED May/June 2018 © UCLES 2018 Page 9 of 10 Question Answer Marks 2(c)(ii) any two from: mostly within tropics; most in Northern hemisphere; spread through, South America / Asia; detail such as a named country; 2 2(c)(iii) any three from: clearing vegetation; soil removed and stored; overburden removed; rock / ore, loosened by blasting; diggers load trucks; 3 2(c)(iv) any five from: dust: use water sprays; noise: restrict hours of operation at the mine; water pollution: use of settlement ponds / control of run-off; visual pollution: landscaping of site; habitat destruction / deforestation / wildlife disturbance: tree planting / protected areas; use of technology to better define the site; government licensing the sites of mines; example of remediation / restoration after extraction completed; 5 2(d)(i) (China) Russia Canada India UAE / United Arab Emirates ;; 4 correct [2] 2-3 correct [1] 1 correct [0] 2 2(d)(ii) 55% circled; 1 2(d)(iii) 4 / Australia, China, India, Russia; 1 2(e)(i) Australia / Russia / China / India; 1
Mark scheme, page 10
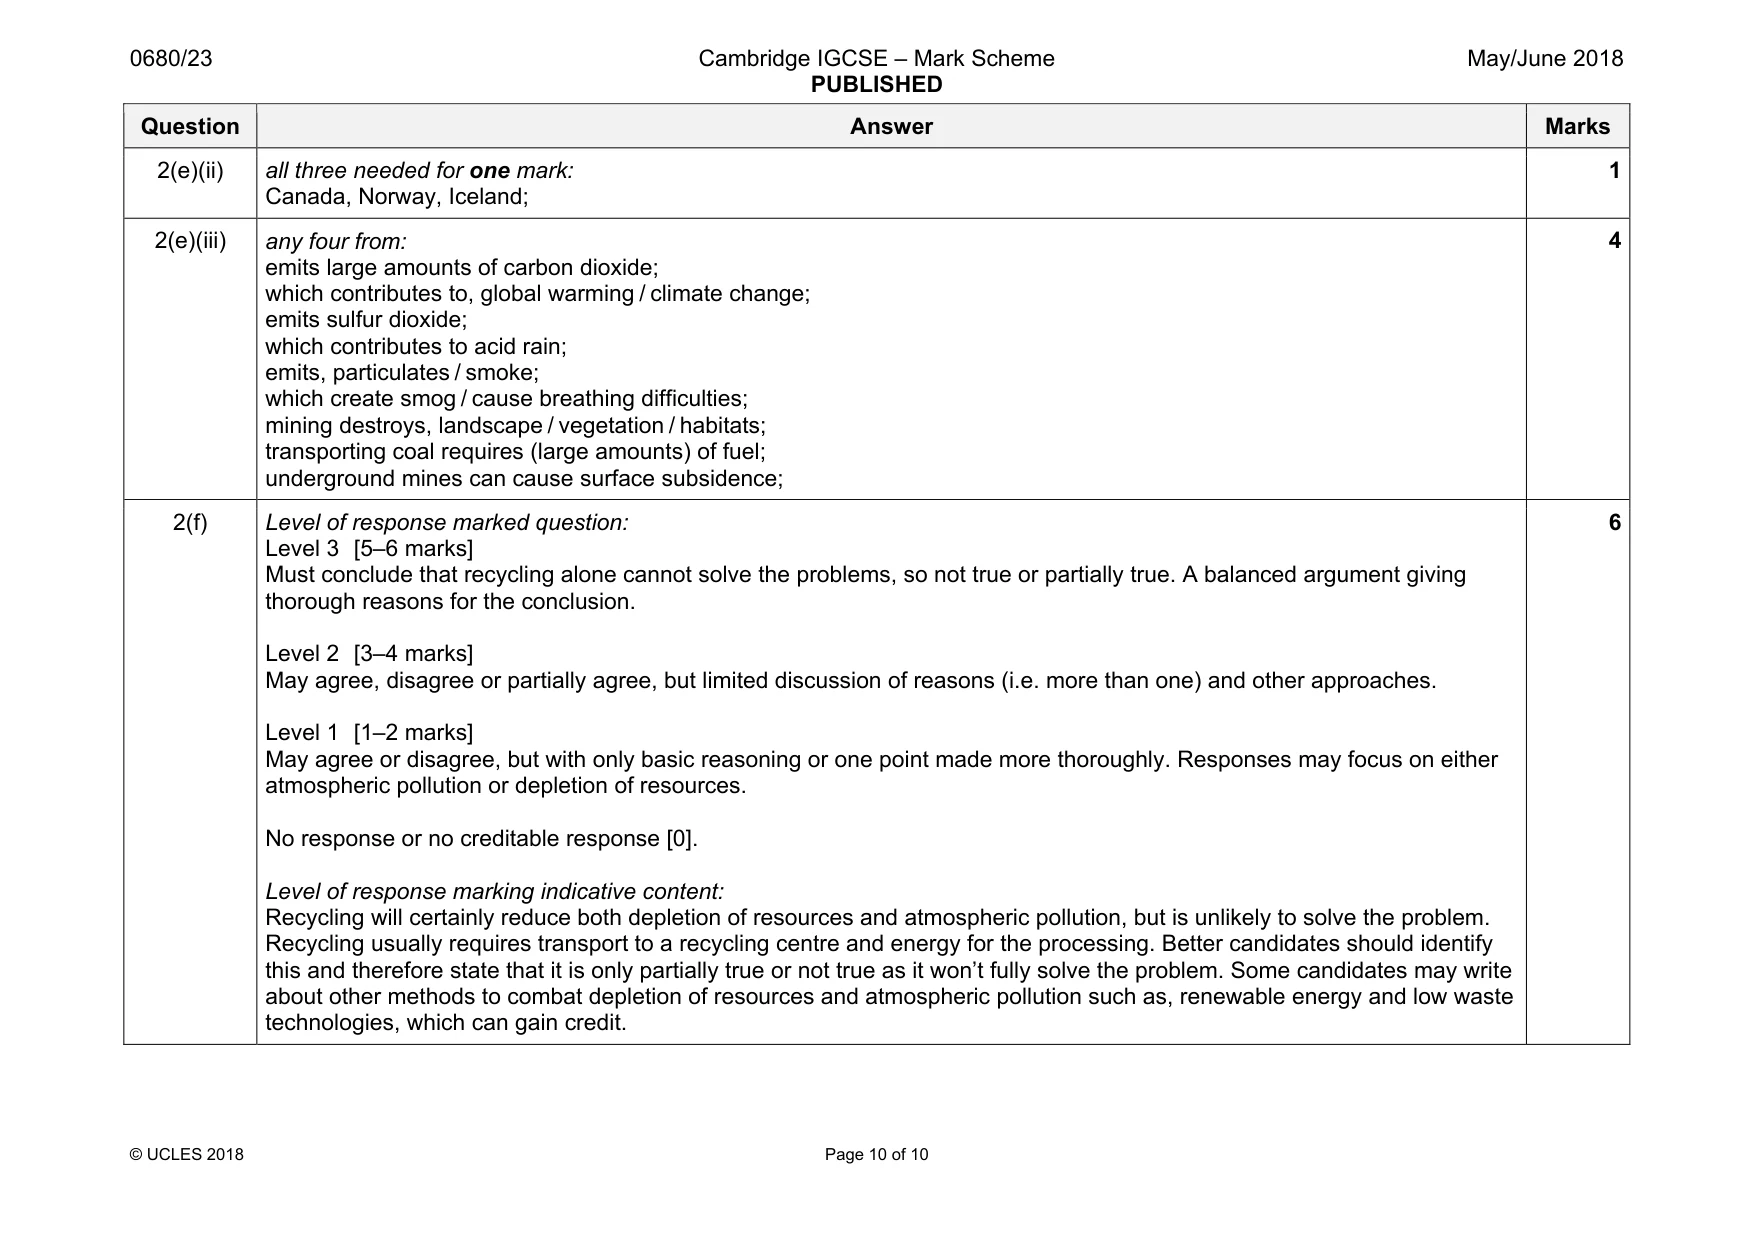
0680/23 Cambridge IGCSE – Mark Scheme PUBLISHED May/June 2018 © UCLES 2018 Page 10 of 10 Question Answer Marks 2(e)(ii) all three needed for one mark: Canada, Norway, Iceland; 1 2(e)(iii) any four from: emits large amounts of carbon dioxide; which contributes to, global warming / climate change; emits sulfur dioxide; which contributes to acid rain; emits, particulates / smoke; which create smog / cause breathing difficulties; mining destroys, landscape / vegetation / habitats; transporting coal requires (large amounts) of fuel; underground mines can cause surface subsidence; 4 2(f) Level of response marked question: Level 3 [5–6 marks] Must conclude that recycling alone cannot solve the problems, so not true or partially true. A balanced argument giving thorough reasons for the conclusion. Level 2 [3–4 marks] May agree, disagree or partially agree, but limited discussion of reasons (i.e. more than one) and other approaches. Level 1 [1–2 marks] May agree or disagree, but with only basic reasoning or one point made more thoroughly. Responses may focus on either atmospheric pollution or depletion of resources. No response or no creditable response [0]. Level of response marking indicative content: Recycling will certainly reduce both depletion of resources and atmospheric pollution, but is unlikely to solve the problem. Recycling usually requires transport to a recycling centre and energy for the processing. Better candidates should identify this and therefore state that it is only partially true or not true as it won’t fully solve the problem. Some candidates may write about other methods to combat depletion of resources and atmospheric pollution such as, renewable energy and low waste technologies, which can gain credit. 6
What you needed in this session
Cambridge’s own grade thresholds for 2018 May/June, Paper 2 · Variant 3. A higher threshold means an easier paper — the bar moves with how the cohort did.