Cambridge IGCSE Environmental Management 0680 — 2018 May/June Paper 2 · Variant 1
0680/21/M/J/18 · 2 questions · 80 marks · ≈90 min
The question paper and its mark scheme, free to read here and free to download. This is Cambridge’s own paper, exactly as it was sat.
Question paper16 pages

Mark scheme10 pages
Answers below. Sit the paper first if you are practising.
Questions as text
Q1 · The table shows climate data for the city of Ndola in Zambia
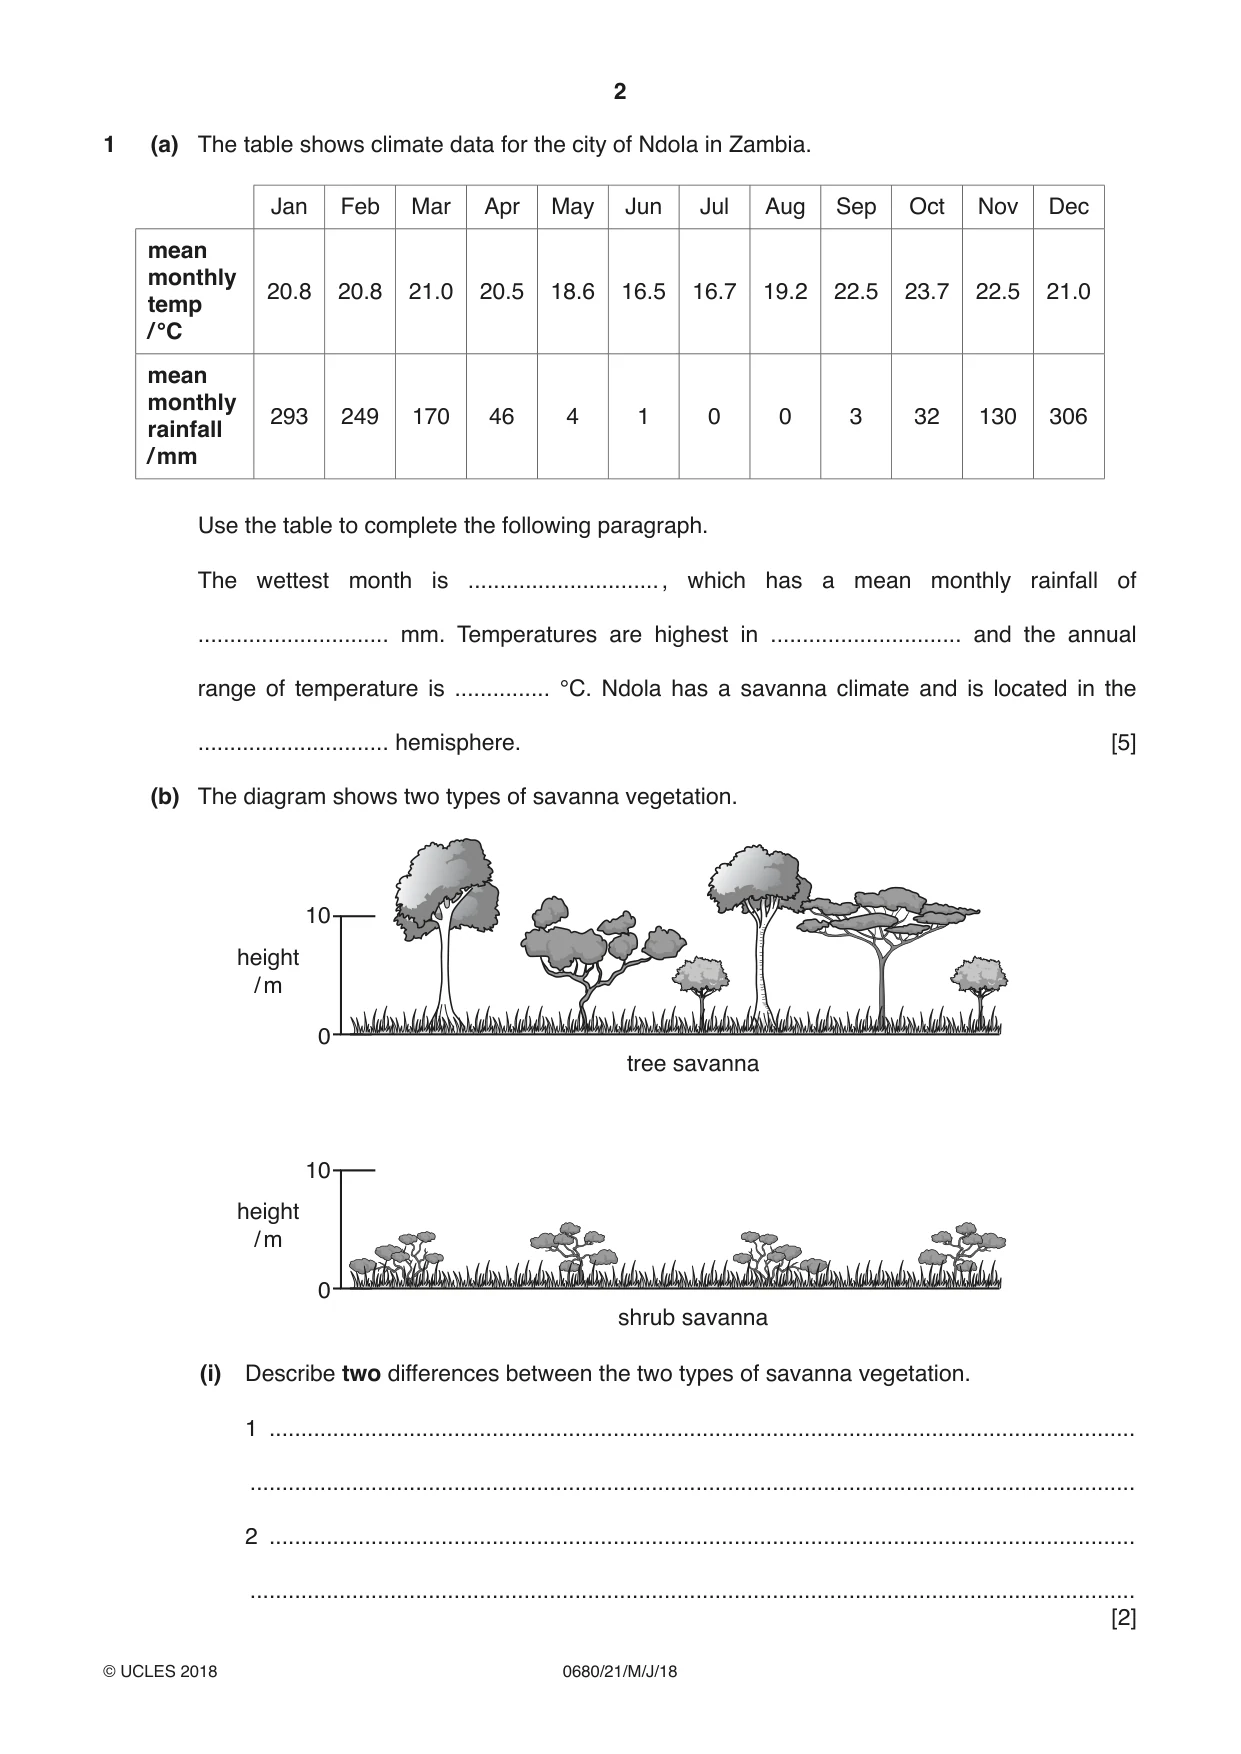
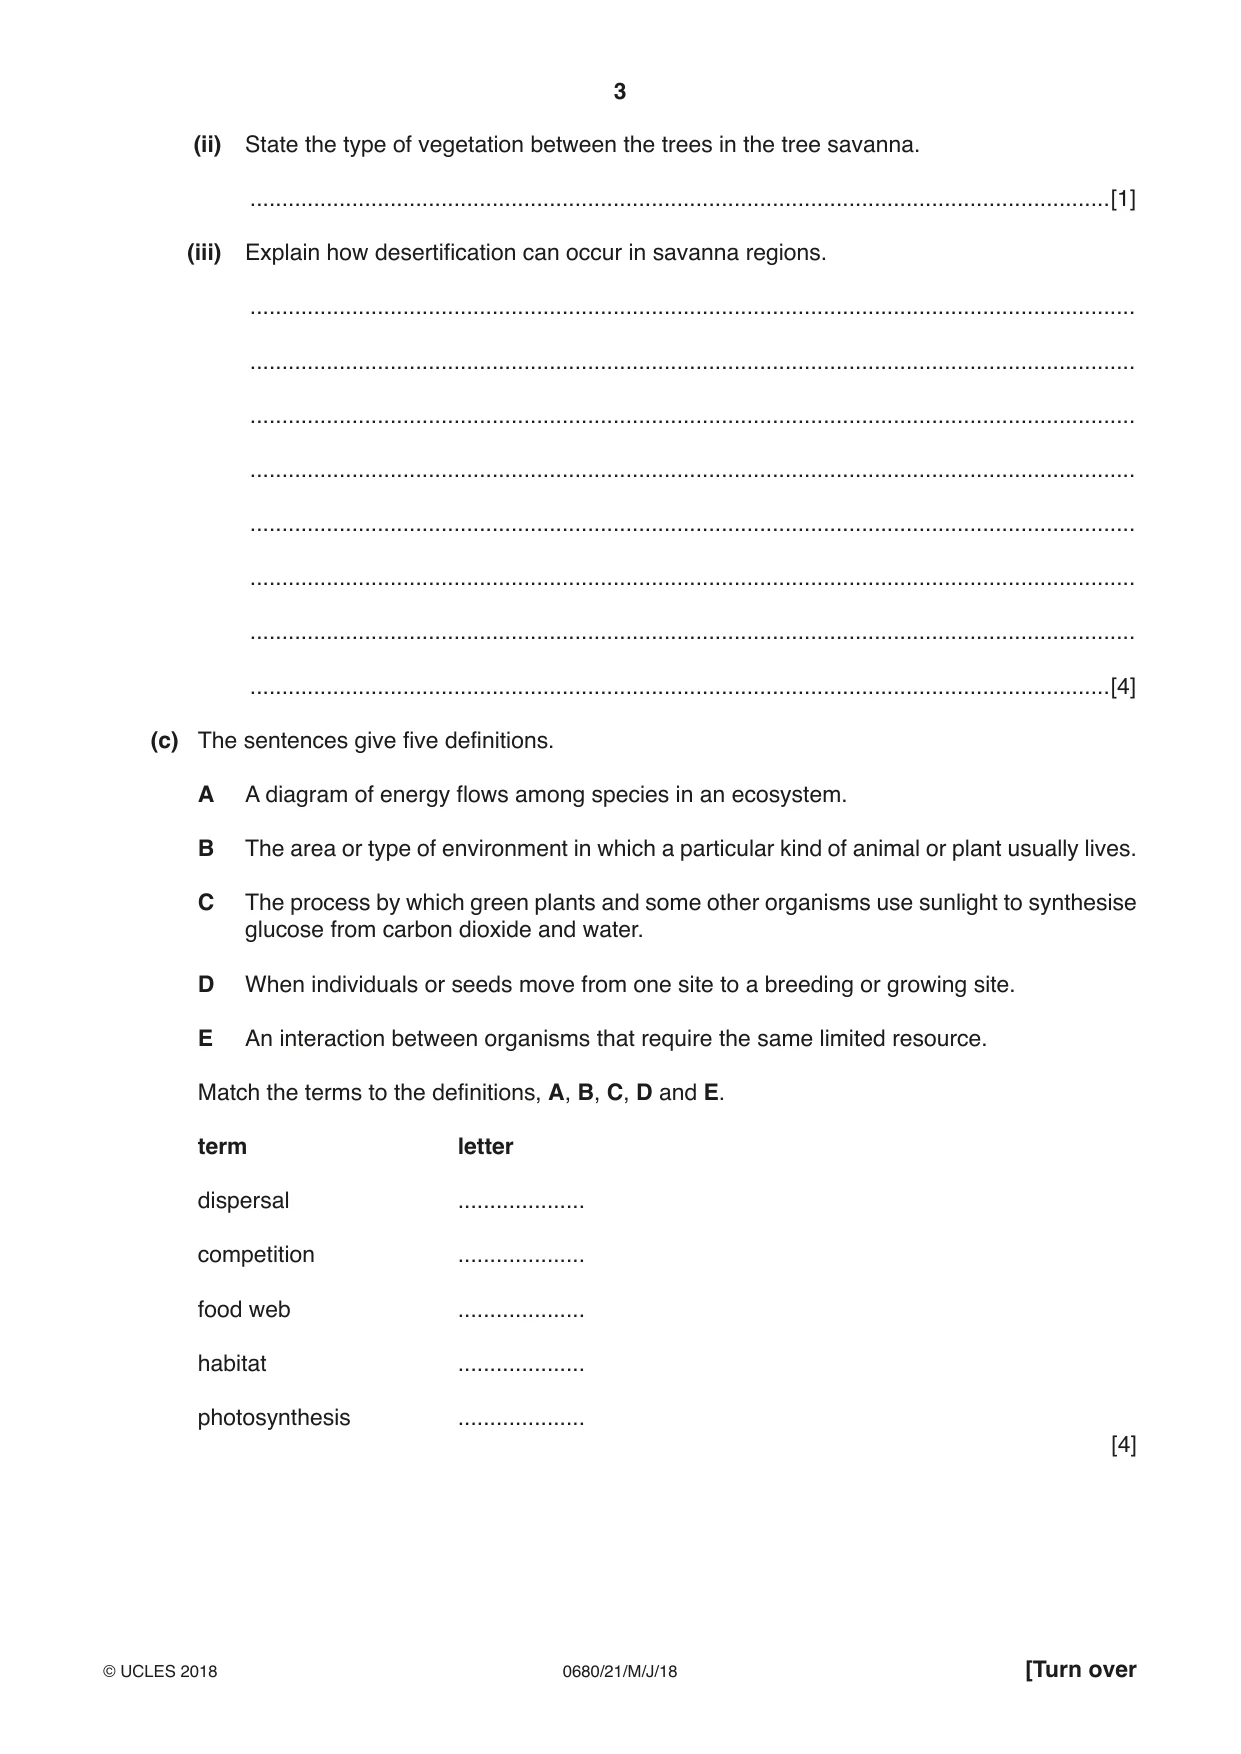
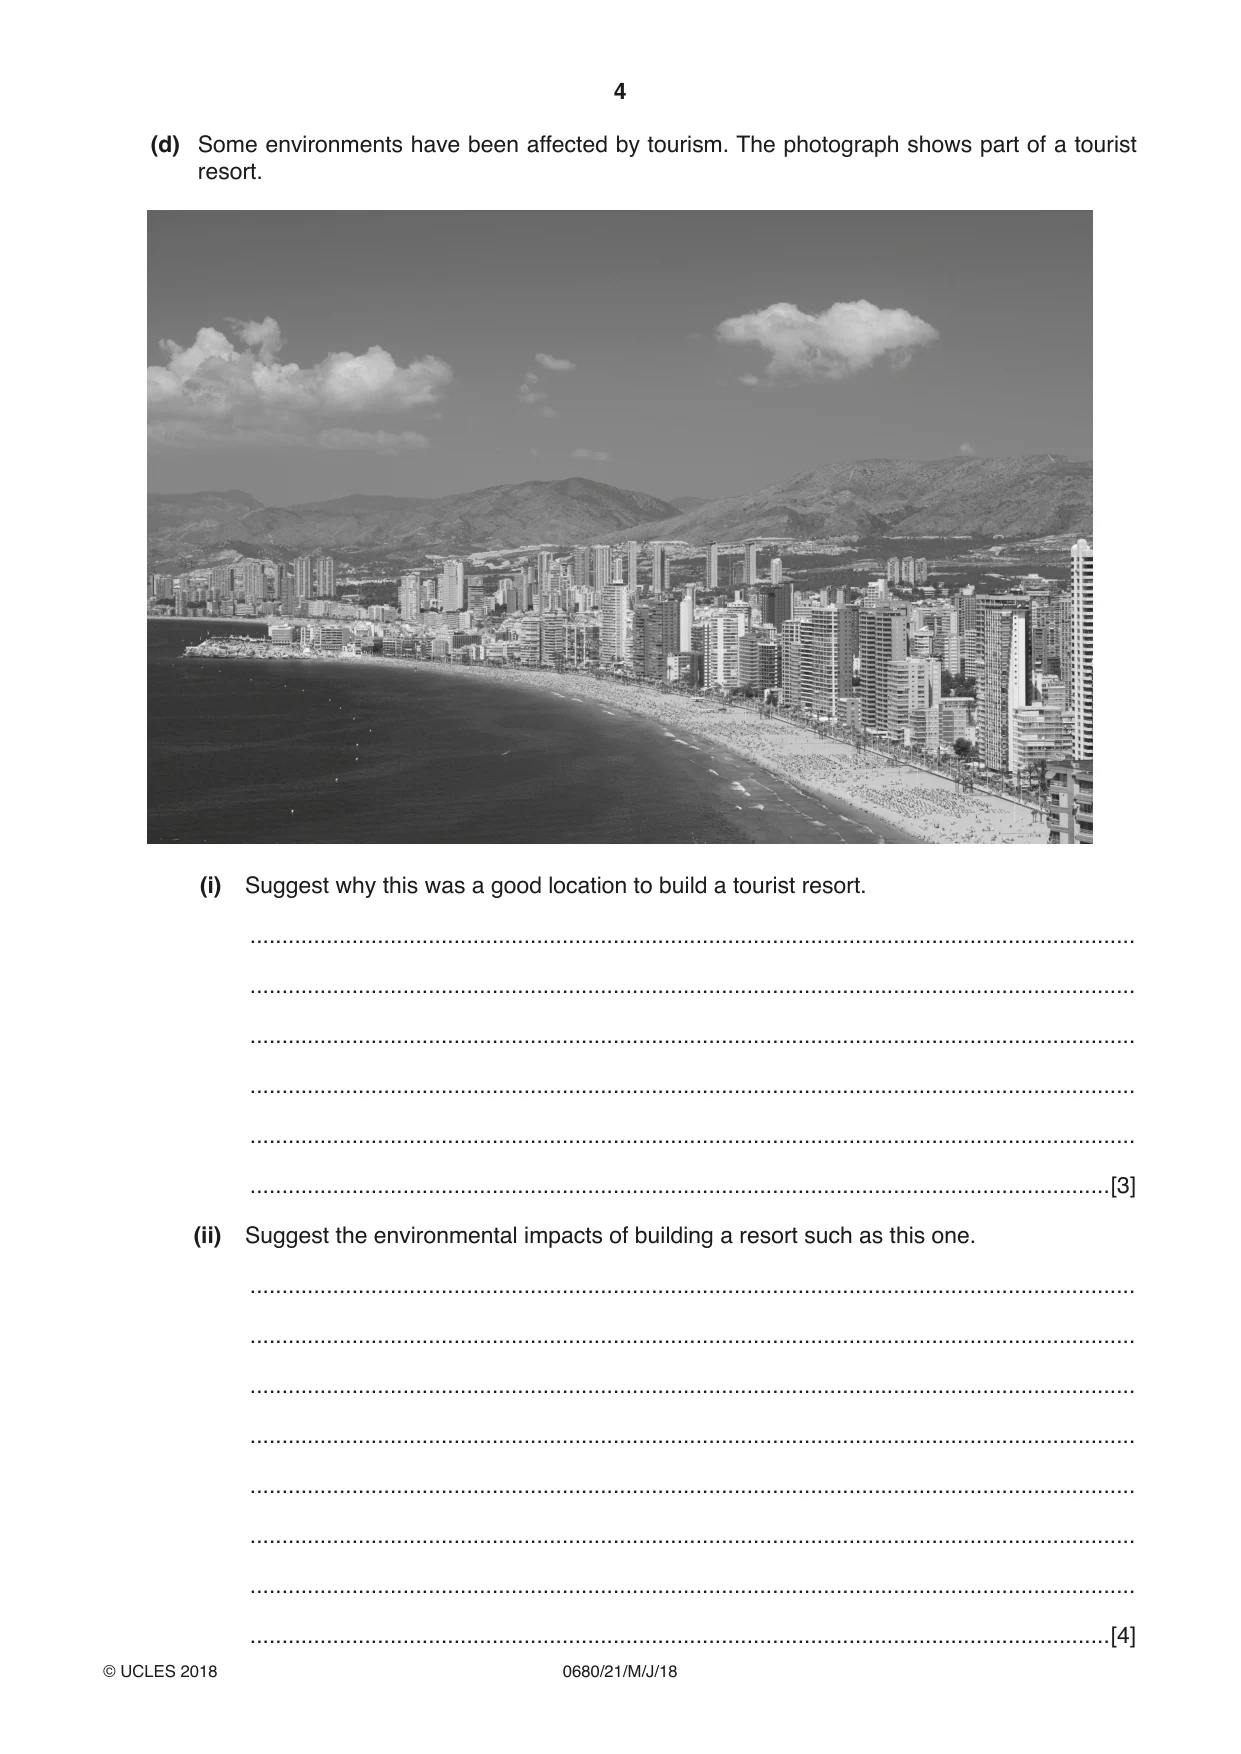
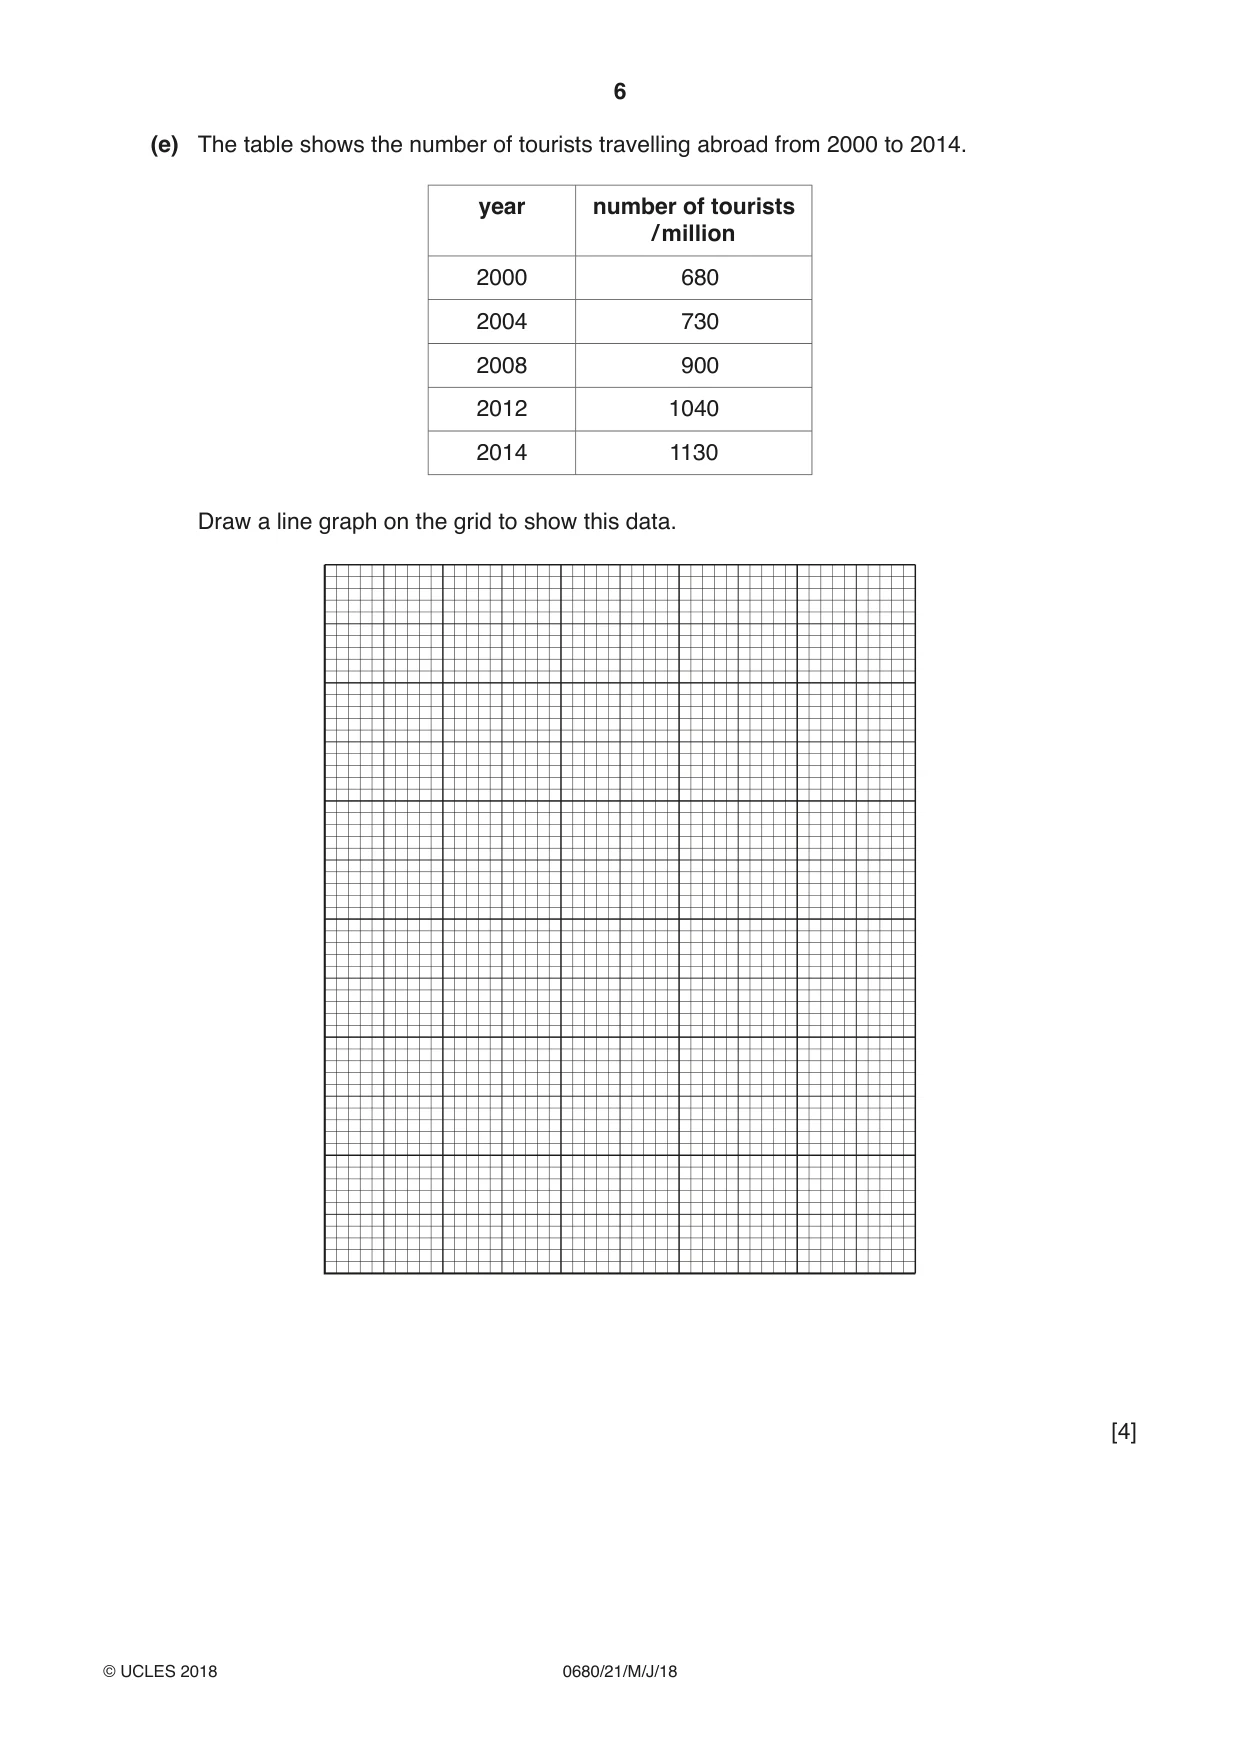
1 (a) The table shows climate data for the city of Ndola in Zambia. Jan Feb Mar Apr May Jun Jul Aug Sep Oct Nov Dec mean monthly 20.8 20.8 21.0 20.5 18.6 16.5 16.7 19.2 22.5 23.7 22.5 21.0 temp / °C mean monthly 293 249 170 46 4 1 0 0 3 32 130 306 rainfall / mm Use the table to complete the following paragraph. The wettest month is .............................. , which has a mean monthly rainfall of .............................. mm. Temperatures are highest in .............................. and the annual range of temperature is ............... °C. Ndola has a savanna climate and is located in the .............................. hemisphere. [5] (b) The diagram shows two types of savanna vegetation. 10 height / m 0 tree savanna 10 height / m 0 shrub savanna (i) Describe two differences between the two types of savanna vegetation. 1 ........................................................................................................................................ ........................................................................................................................................... 2 ........................................................................................................................................ ........................................................................................................................................... [2] (ii) State the type of vegetation between the trees in the tree savanna. .......................................................................................................................................[1] (iii) Explain how desertification can occur in savanna regions. ........................................................................................................................................... ........................................................................................................................................... ........................................................................................................................................... ........................................................................................................................................... ........................................................................................................................................... ........................................................................................................................................... ........................................................................................................................................... .......................................................................................................................................[4] (c) The sentences give five definitions. A A diagram of energy flows among species in an ecosystem. B The area or type of environment in which a particular kind of animal or plant usually lives. C The process by which green plants and some other organisms use sunlight to synthesise glucose from carbon dioxide and water. D When individuals or seeds move from one site to a breeding or growing site. E An interaction between organisms that require the same limited resource. Match the terms to the definitions, A, B, C, D and E. term letter dispersal .................... competition .................... food web .................... habitat .................... photosynthesis .................... [4] (d) Some environments have been affected by tourism. The photograph shows part of a tourist resort. (i) Suggest why this was a good location to build a tourist resort. ........................................................................................................................................... ........................................................................................................................................... ........................................................................................................................................... ........................................................................................................................................... ........................................................................................................................................... .......................................................................................................................................[3] (ii) Suggest the environmental impacts of building a resort such as this one. ........................................................................................................................................... ........................................................................................................................................... ........................................................................................................................................... ........................................................................................................................................... ........................................................................................................................................... ........................................................................................................................................... ........................................................................................................................................... .......................................................................................................................................[4] (iii) The resort faces environmental challenges: • a shortage of water – the average daily use is 880 litres per tourist and there are 30 000 swimming pools in the area • a massive amount of waste and sewage to process. Describe how these environmental challenges can be managed. ........................................................................................................................................... ........................................................................................................................................... ........................................................................................................................................... ........................................................................................................................................... ........................................................................................................................................... .......................................................................................................................................[3] (iv) The resort receives 1.75 million tourists per year, at least half from other countries. Explain how this tourism will cause air pollution. ........................................................................................................................................... ........................................................................................................................................... ........................................................................................................................................... ........................................................................................................................................... ........................................................................................................................................... ........................................................................................................................................... ........................................................................................................................................... .......................................................................................................................................[4] (e) The table shows the number of tourists travelling abroad from 2000 to 2014. year number of tourists / million 2000 680 2004 730 2008 900 2012 1040 2014 1130 Draw a line graph on the grid to show this data. [4] (f) ‘Tourism is good for the economy, but bad for the planet.’ How far do you agree with this statement? Give reasons for your answer. ................................................................................................................................................... ................................................................................................................................................... ................................................................................................................................................... ................................................................................................................................................... ................................................................................................................................................... ................................................................................................................................................... ................................................................................................................................................... ................................................................................................................................................... ................................................................................................................................................... ................................................................................................................................................... ................................................................................................................................................... ...............................................................................................................................................[6]
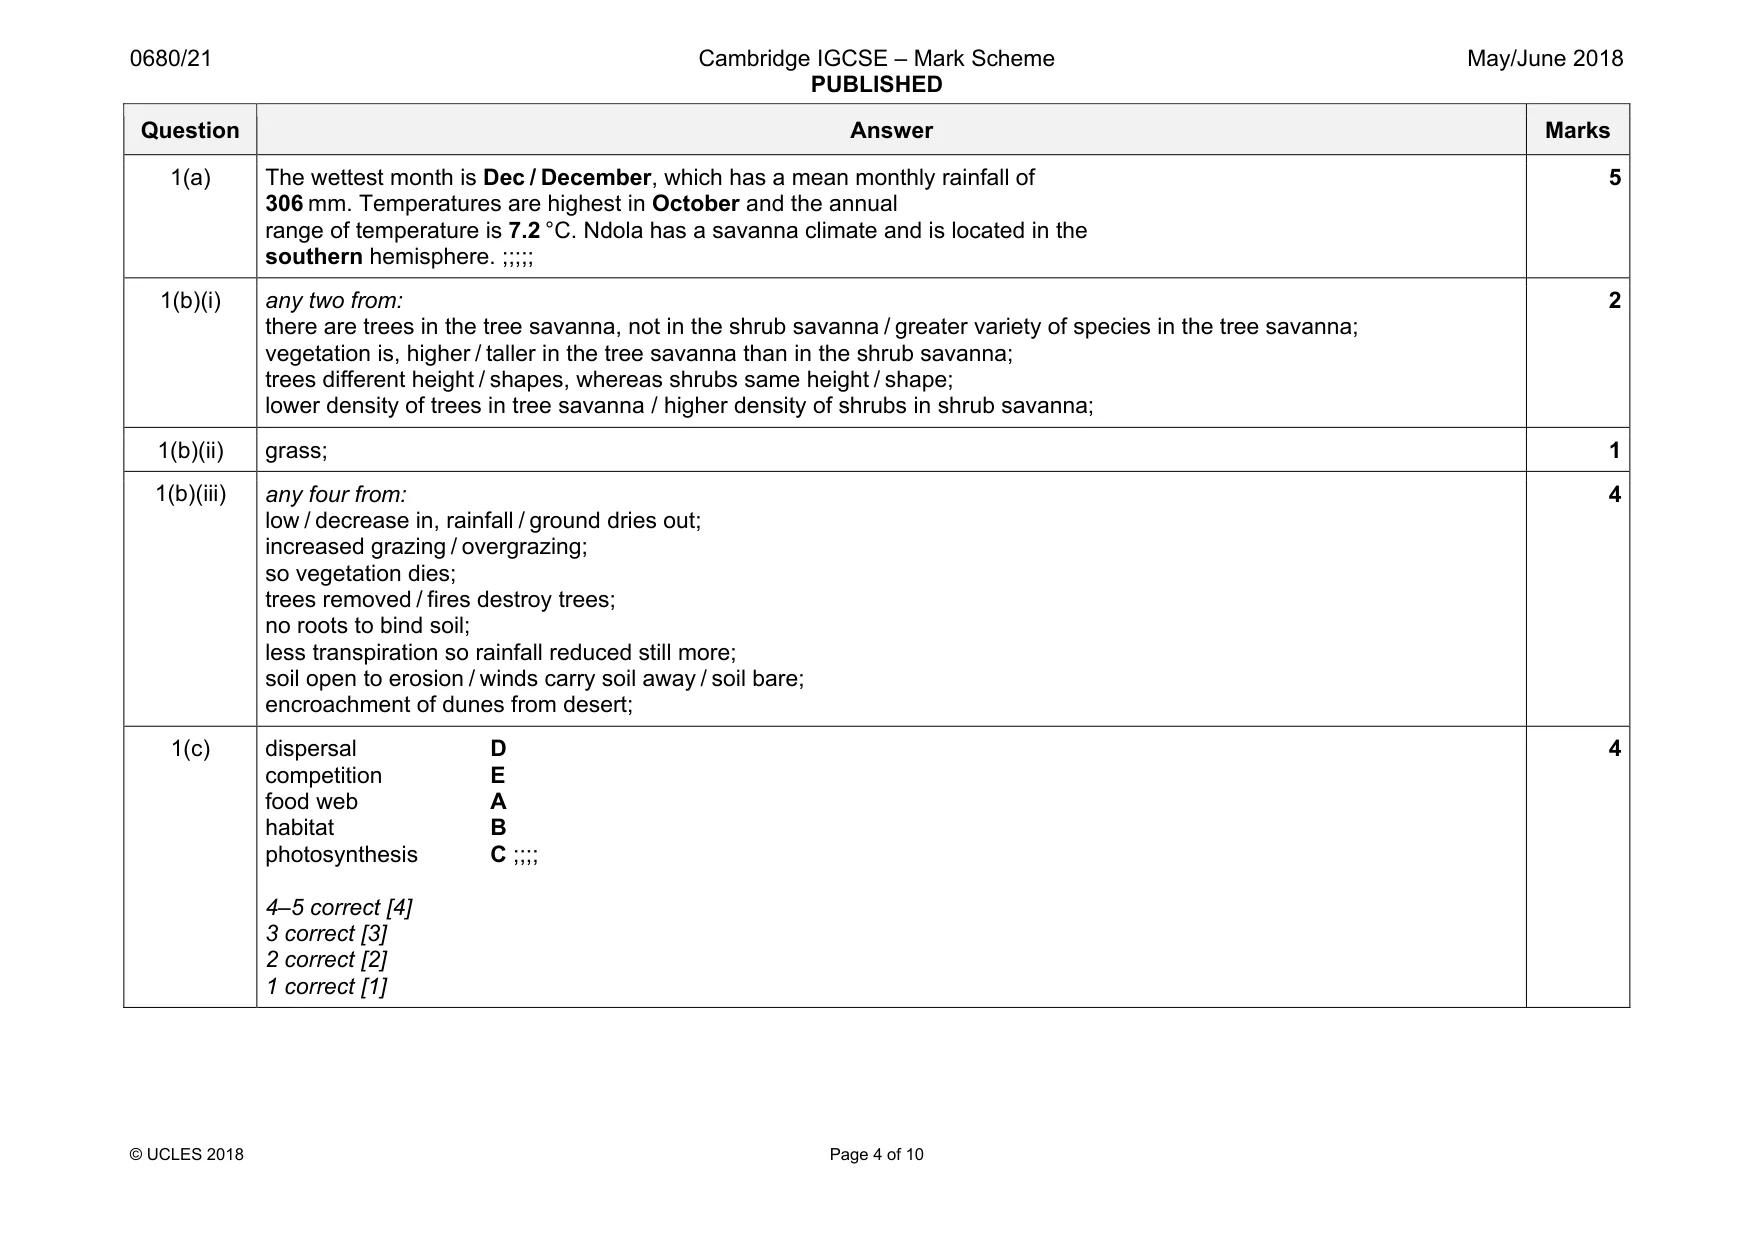
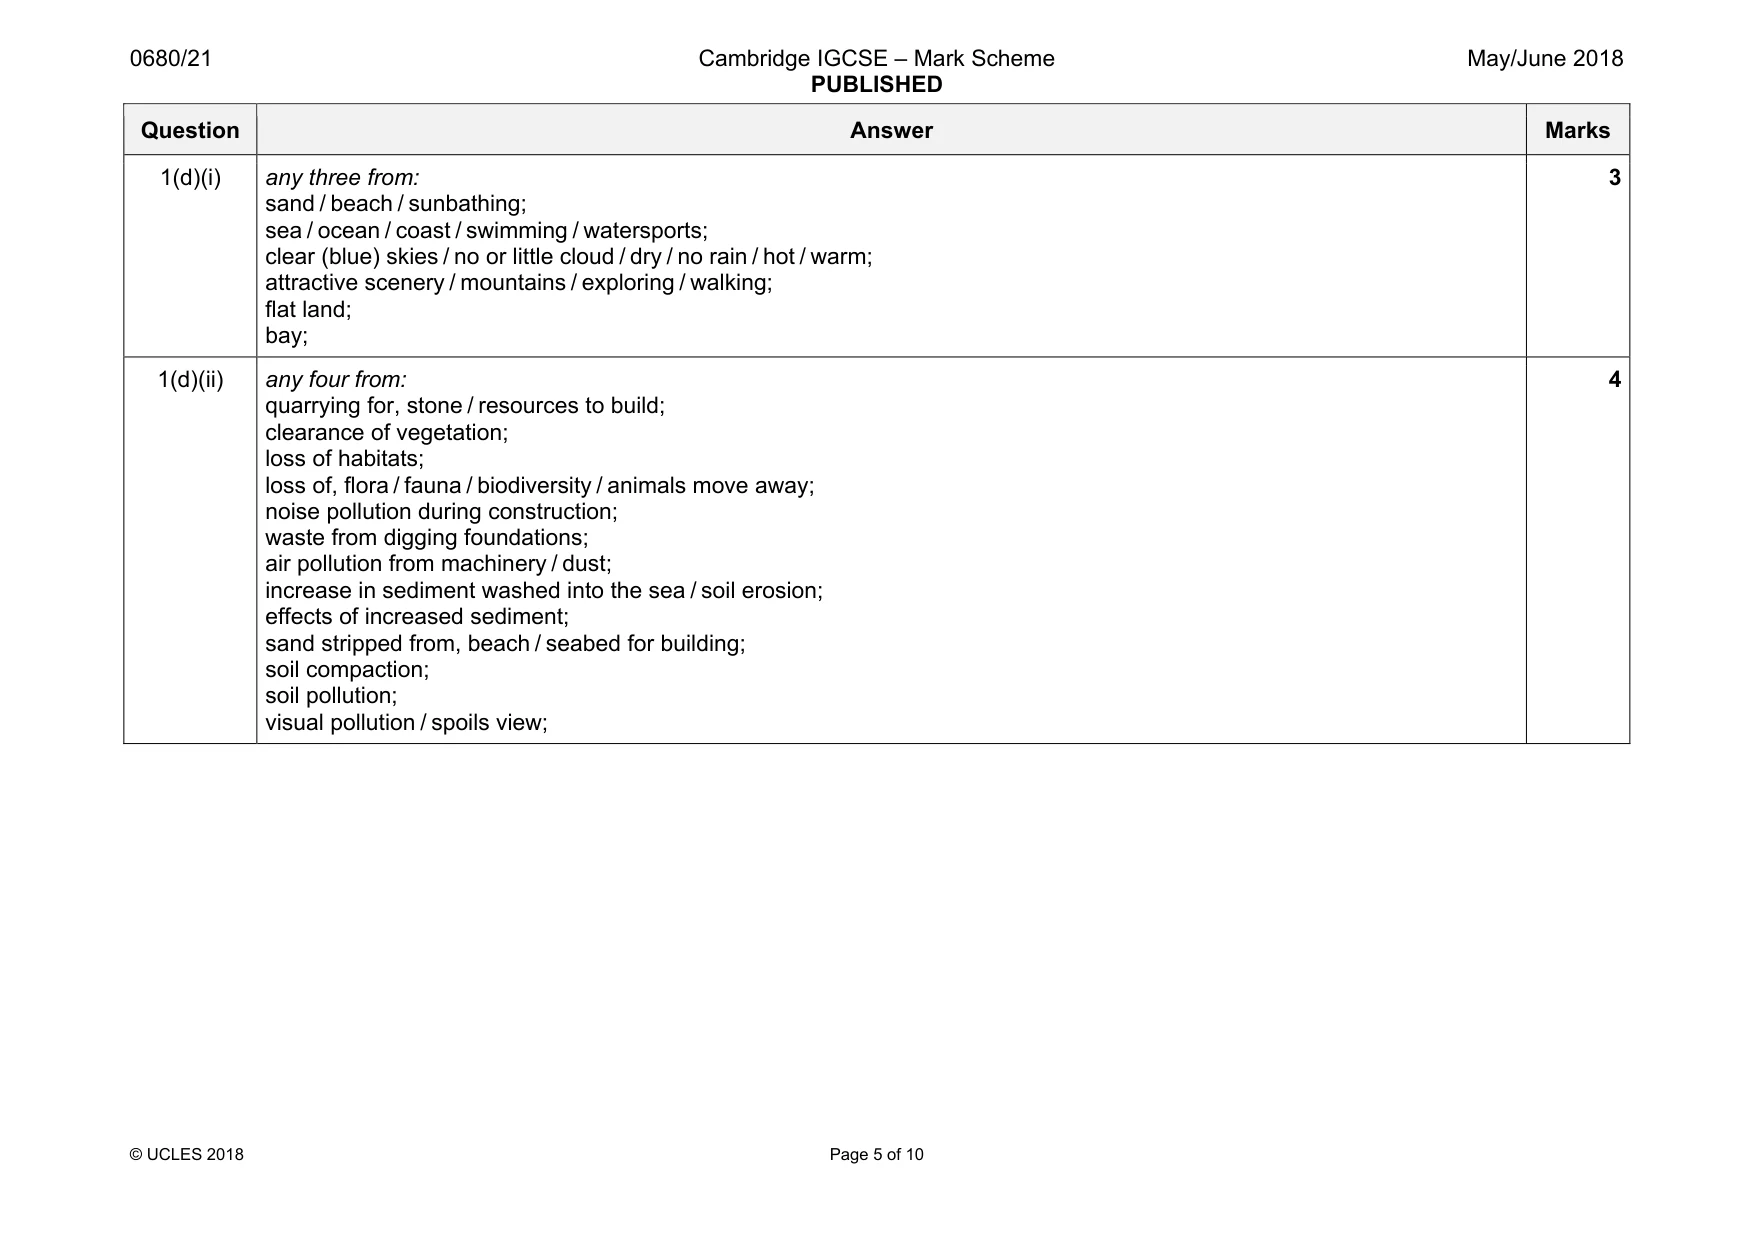
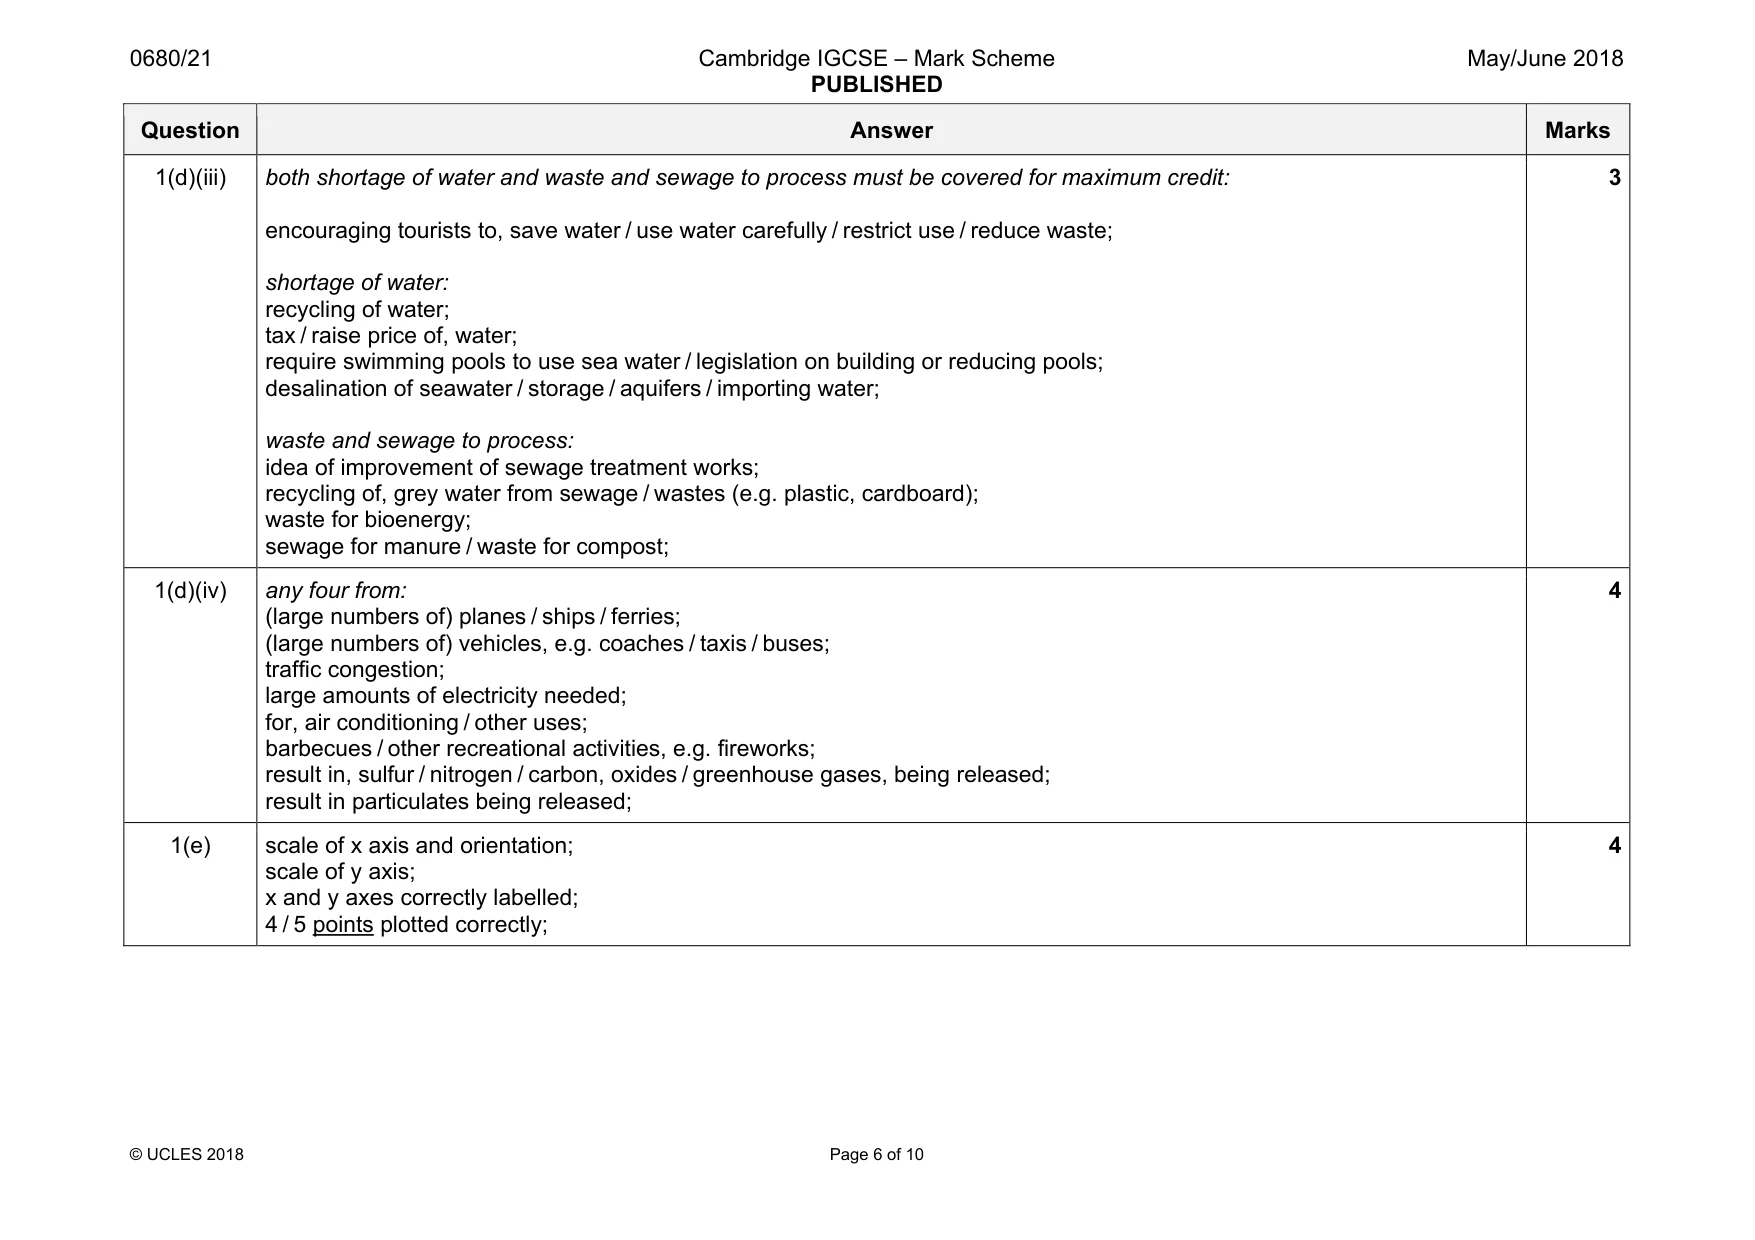
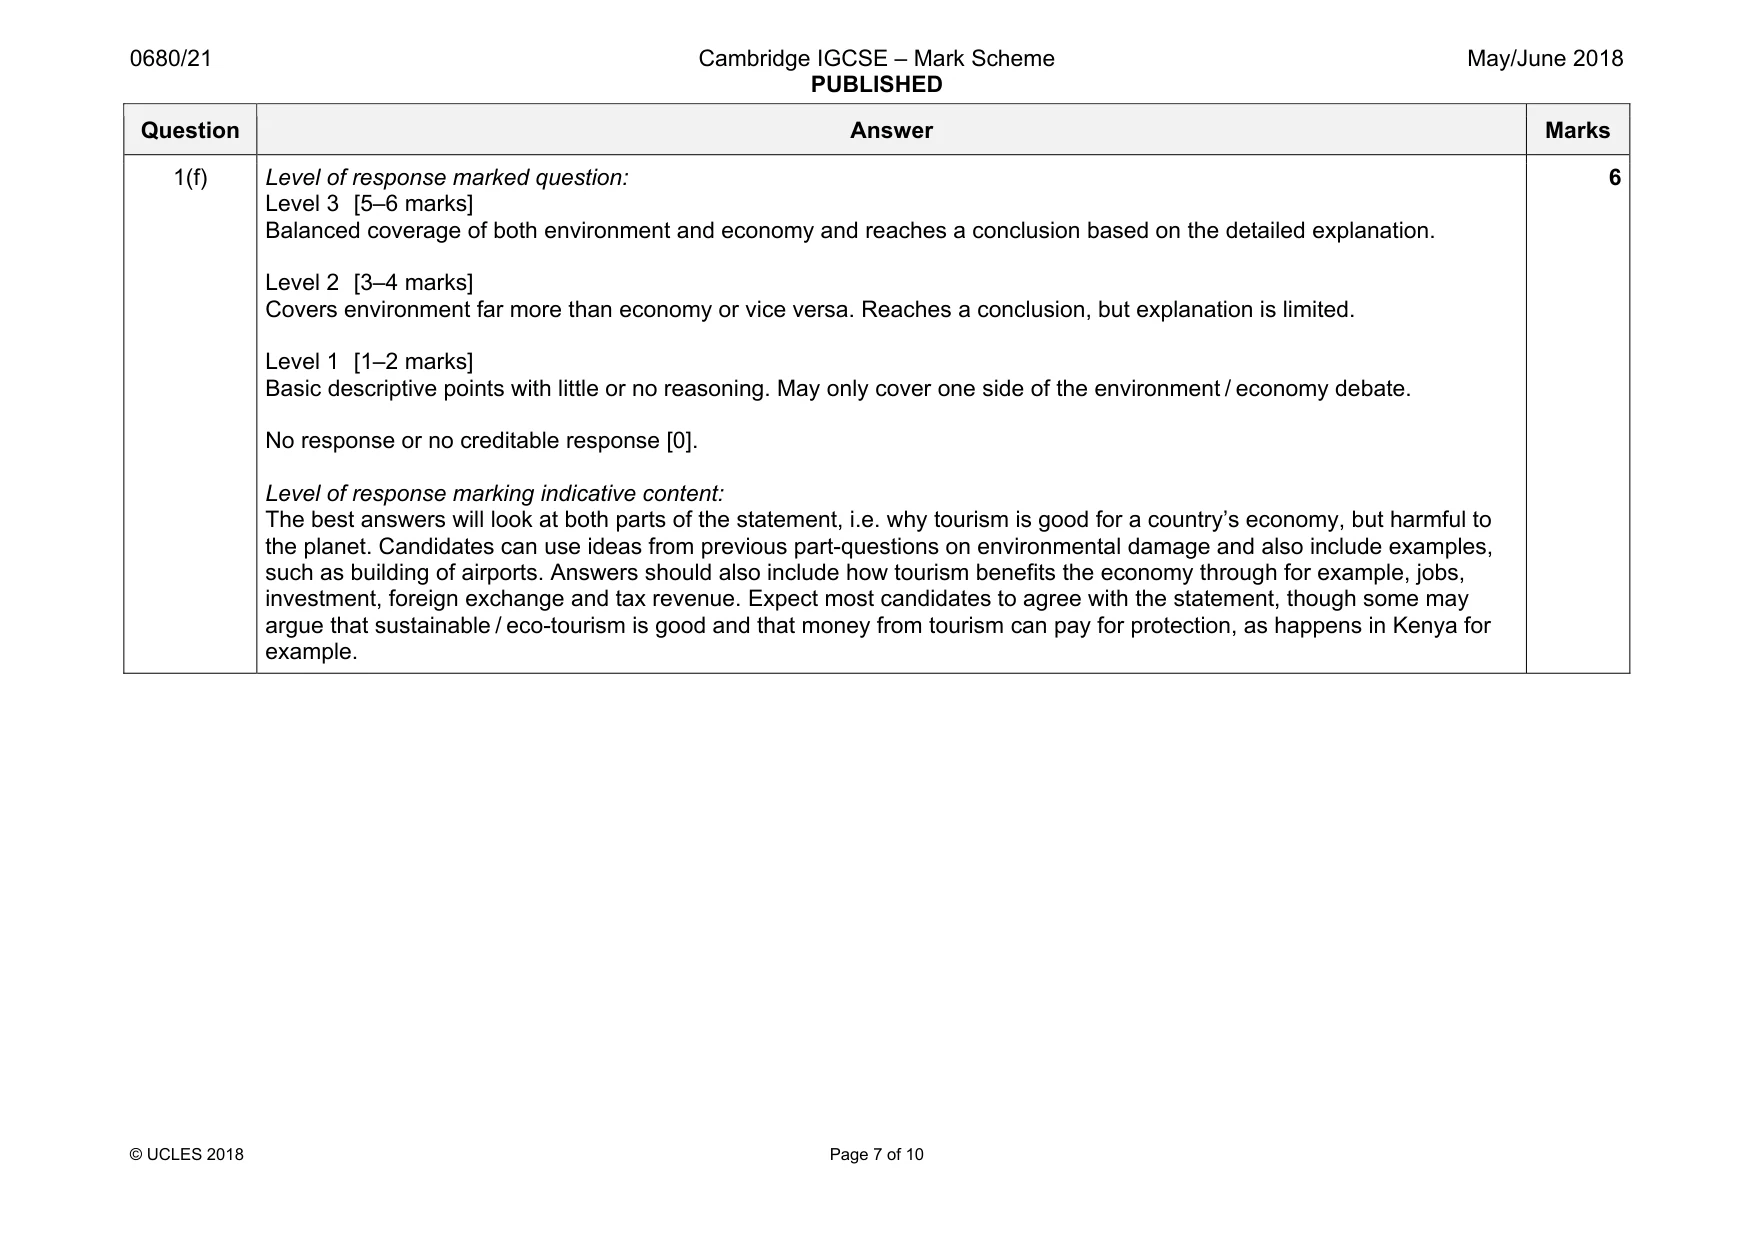
Mark scheme: 1(a) The wettest month is Dec / December, which has a mean monthly rainfall of 306 mm. Temperatures are highest in October and the annual range of temperature is 7.2 °C. Ndola has a savanna climate and is located in the southern hemisphere. ;;;;; 5 1(b)(i) any two from: there are trees in the tree savanna, not in the shrub savanna / greater variety of species in the tree savanna; vegetation is, higher / taller in the tree savanna than in the shrub savanna; trees different height / shapes, whereas shrubs same height / shape; lower density of trees in tree savanna / higher density of shrubs in shrub savanna; 2 1(b)(ii) grass; 1 1(b)(iii) any four from: low / decrease in, rainfall / ground dries out; increased grazing / overgrazing; so vegetation dies; trees removed / fires destroy trees; no roots to bind soil; less transpiration so rainfall reduced still more; soil open to erosion / winds carry soil away / soil bare; encroachment of dunes from desert; 4 1(c) dispersal D competition E food web A habitat B photosynthesis C ;;;; 4–5 correct [4] 3 correct [3] 2 correct [2] 1 correct [1] 4 Question Answer Marks 1(d)(i) any three from: sand / beach / sunbathing; sea / ocean / coast / swimming / watersports; clear (blue) skies / no or little cloud / dry / no rain / hot / warm; attractive scenery / mountains / exploring / walking; flat land; bay; 3 1(d)(ii) any four from: quarrying for, stone / resources to build; clearance of vegetation; loss of habitats; loss of, flora / fauna / biodiversity / animals move away; noise pollution during construction; waste from digging foundations; air pollution from machinery / dust; increase in sediment washed into the sea / soil erosion; effects of increased sediment; sand stripped from, beach / seabed for building; soil compaction; soil pollution; visual pollution / spoils view; 4 Question Answer Marks 1(d)(iii) both shortage of water and waste and sewage to process must be covered for maximum credit: encouraging tourists to, save water / use water carefully / restrict use / reduce waste; shortage of water: recycling of water; tax / raise price of, water; require swimming pools to use sea water / legislation on building or reducing pools; desalination of seawater / storage / aquifers / importing water; waste and sewage to process: idea of improvement of sewage treatment works; recycling of, grey water from sewage / wastes (e.g. plastic, cardboard); waste for bioenergy; sewage for manure / waste for compost; 3 1(d)(iv) any four from: (large numbers of) planes / ships / ferries; (large numbers of) vehicles, e.g. coaches / taxis / buses; traffic congestion; large amounts of electricity needed; for, air conditioning / other uses; barbecues / other recreational activities, e.g. fireworks; result in, sulfur / nitrogen / carbon, oxides / greenhouse gases, being released; result in particulates being released; 4 1(e) scale of x axis and orientation; scale of y axis; x and y axes correctly labelled; 4 / 5 points plotted correctly; 4 Question Answer Marks 1(f) Level of response marked question: Level 3 [5–6 marks] Balanced coverage of both environment and economy and reaches a conclusion based on the detailed explanation. Level 2 [3–4 marks] Covers environment far more than economy or vice versa. Reaches a conclusion, but explanation is limited. Level 1 [1–2 marks] Basic descriptive points with little or no reasoning. May only cover one side of the environment / economy debate. No response or no creditable response [0]. Level of response marking indicative content: The best answers will look at both parts of the statement, i.e. why tourism is good for a country’s economy, but harmful to the planet. Candidates can use ideas from previous part-questions on environmental damage and also include examples, such as building of airports. Answers should also include how tourism benefits the economy through for example, jobs, investment, foreign exchange and tax revenue. Expect most candidates to agree with the statement, though some may argue that sustainable / eco-tourism is good and that money from tourism can pay for protection, as happens in Kenya for example. 6
Q2 · The diagram shows a trawler and its net (trawl)
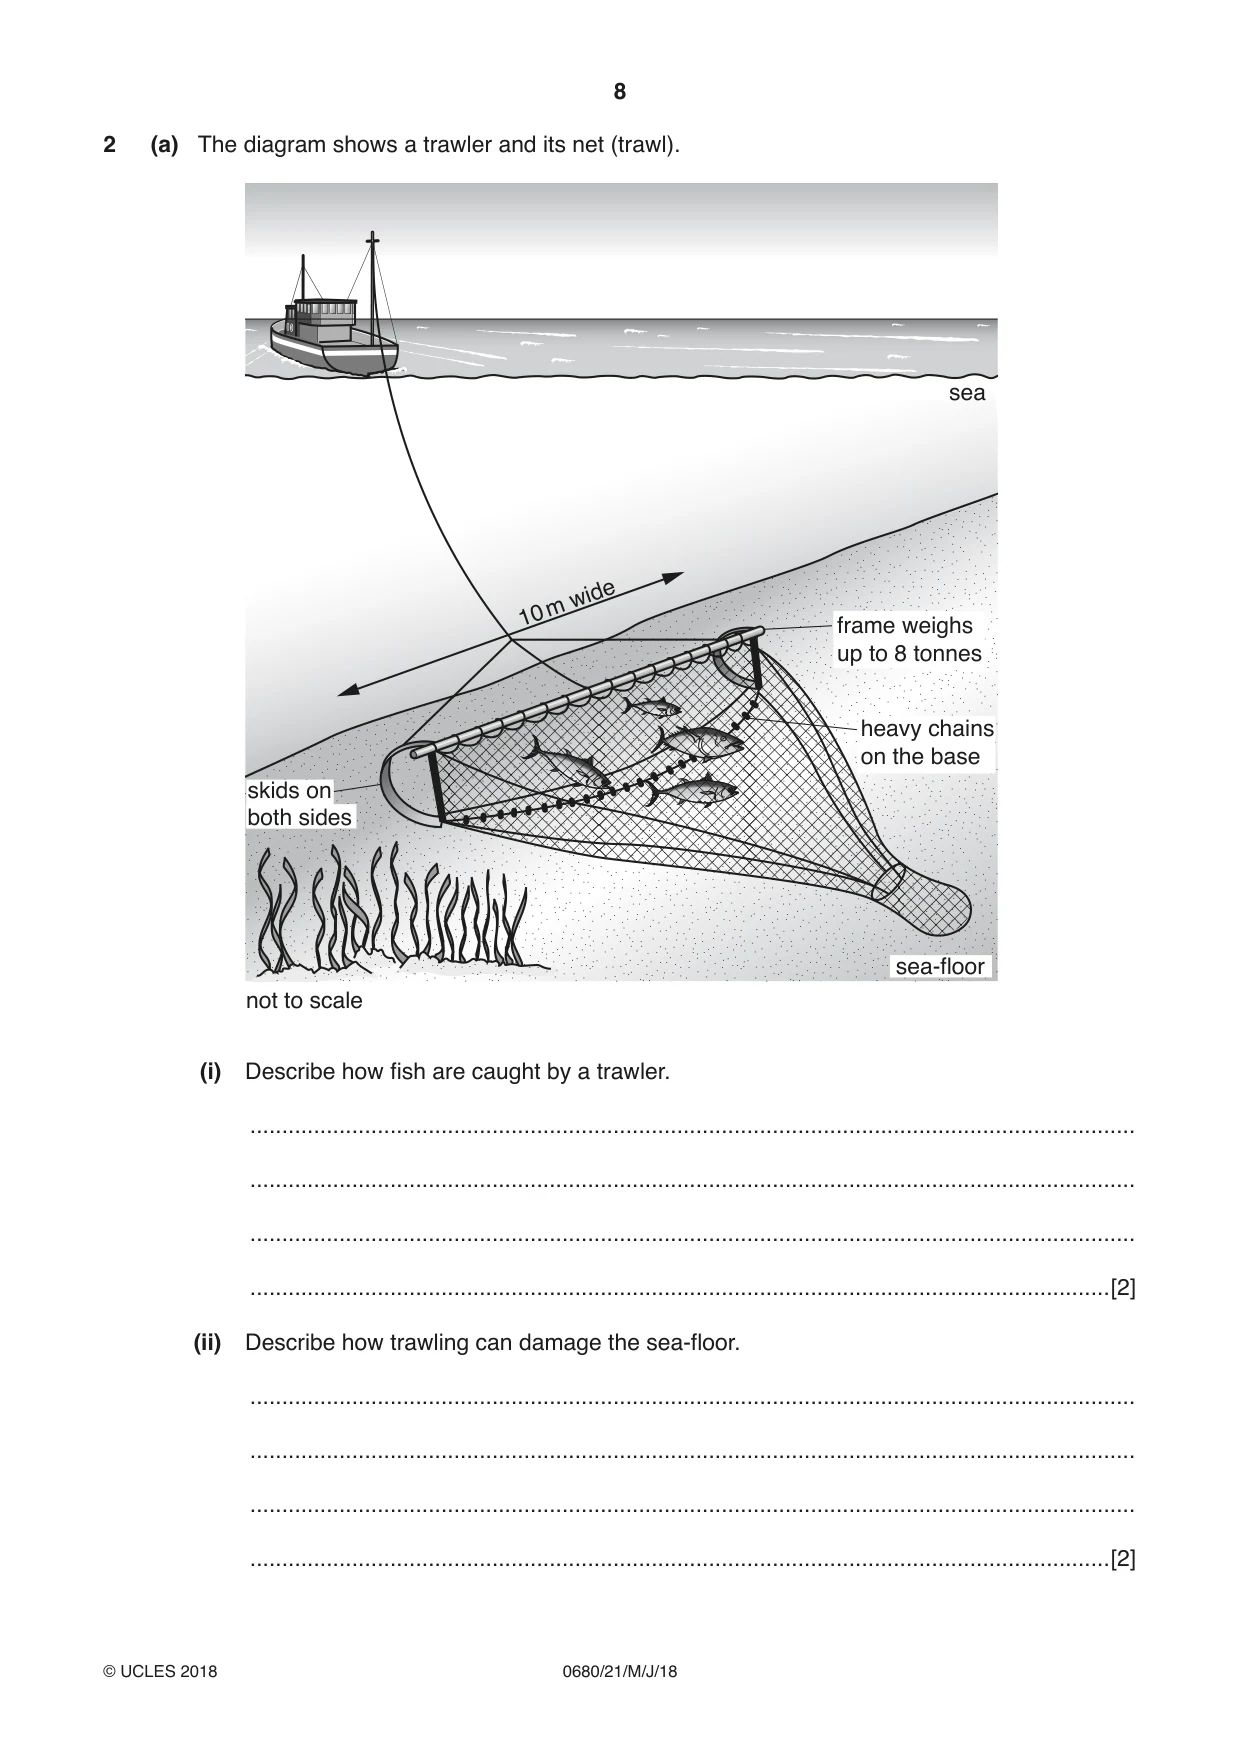
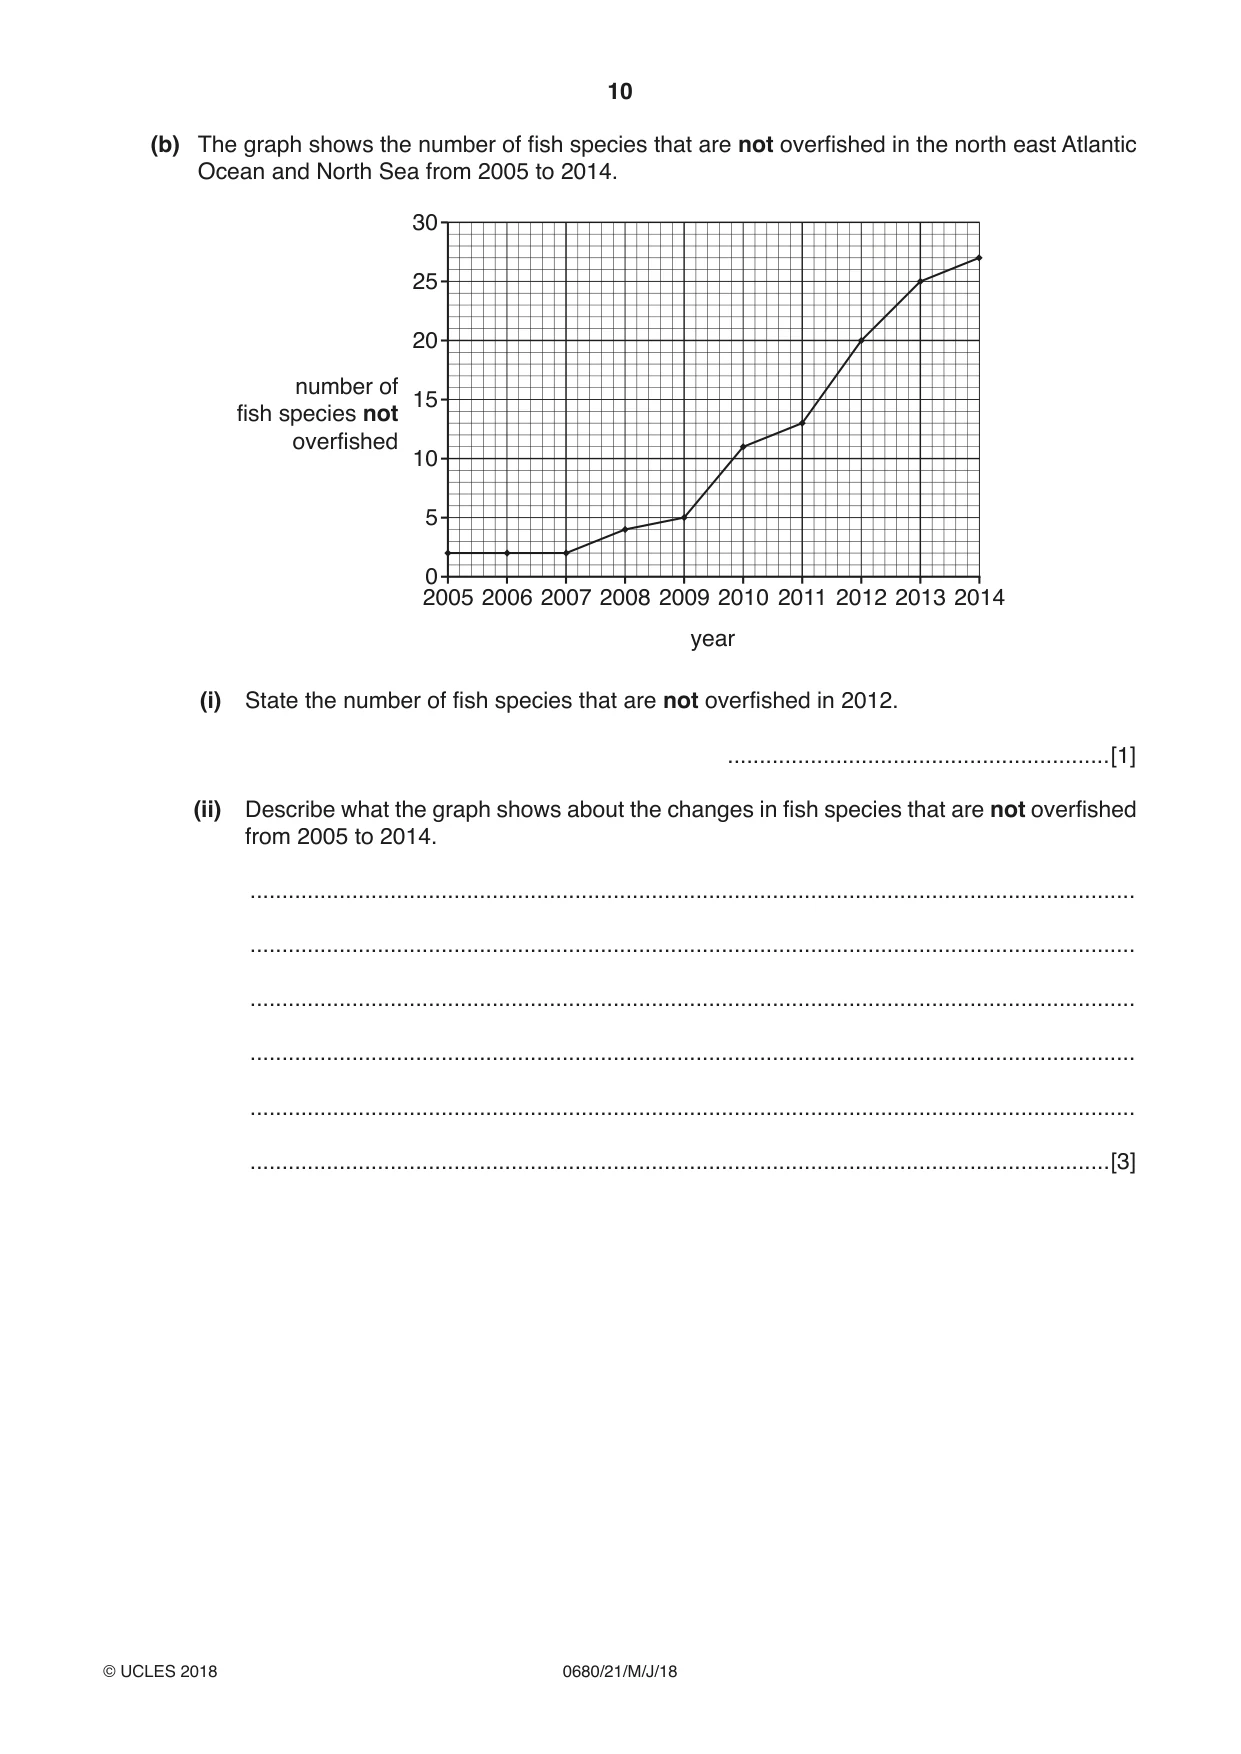
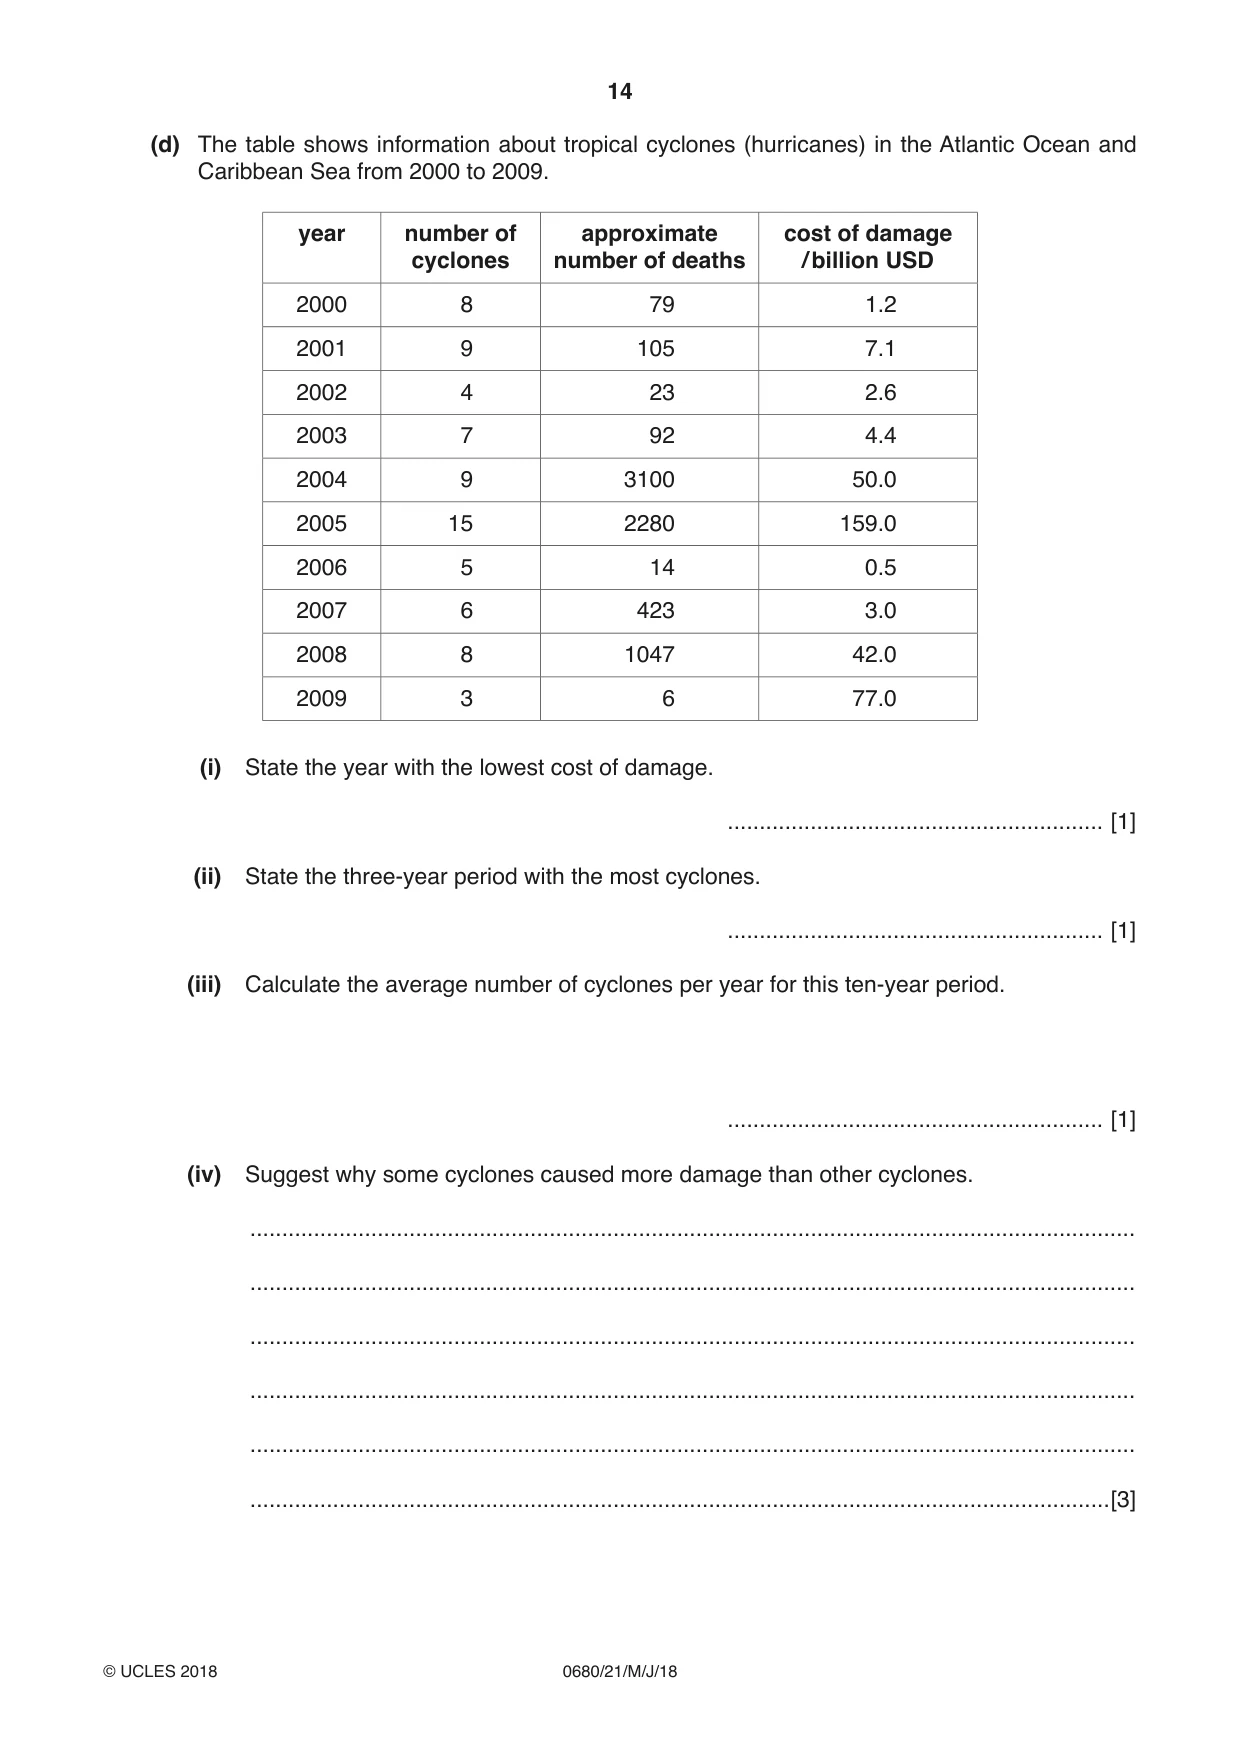
2 (a) The diagram shows a trawler and its net (trawl). sea wide m 10 frame weighs up to 8 tonnes heavy chains on the base skids on both sides sea-floor not to scale (i) Describe how fish are caught by a trawler. ........................................................................................................................................... ........................................................................................................................................... ........................................................................................................................................... .......................................................................................................................................[2] (ii) Describe how trawling can damage the sea-floor. ........................................................................................................................................... ........................................................................................................................................... ........................................................................................................................................... .......................................................................................................................................[2] (iii) What is meant by the term overfishing? ........................................................................................................................................... .......................................................................................................................................[1] (iv) Explain why overfishing has occurred in many of the world’s oceans. ........................................................................................................................................... ........................................................................................................................................... ........................................................................................................................................... ........................................................................................................................................... ........................................................................................................................................... .......................................................................................................................................[3] (v) Suggest how overfishing can impact a marine food web. ........................................................................................................................................... ........................................................................................................................................... ........................................................................................................................................... ........................................................................................................................................... ........................................................................................................................................... .......................................................................................................................................[3] (b) The graph shows the number of fish species that are not overfished in the north east Atlantic Ocean and North Sea from 2005 to 2014. 30 25 20 number of 15 fish species not overfished 10 5 0 2005 2006 2007 2008 2009 2010 2011 2012 2013 2014 year (i) State the number of fish species that are not overfished in 2012. ............................................................[1] (ii) Describe what the graph shows about the changes in fish species that are not overfished from 2005 to 2014. ........................................................................................................................................... ........................................................................................................................................... ........................................................................................................................................... ........................................................................................................................................... ........................................................................................................................................... .......................................................................................................................................[3]
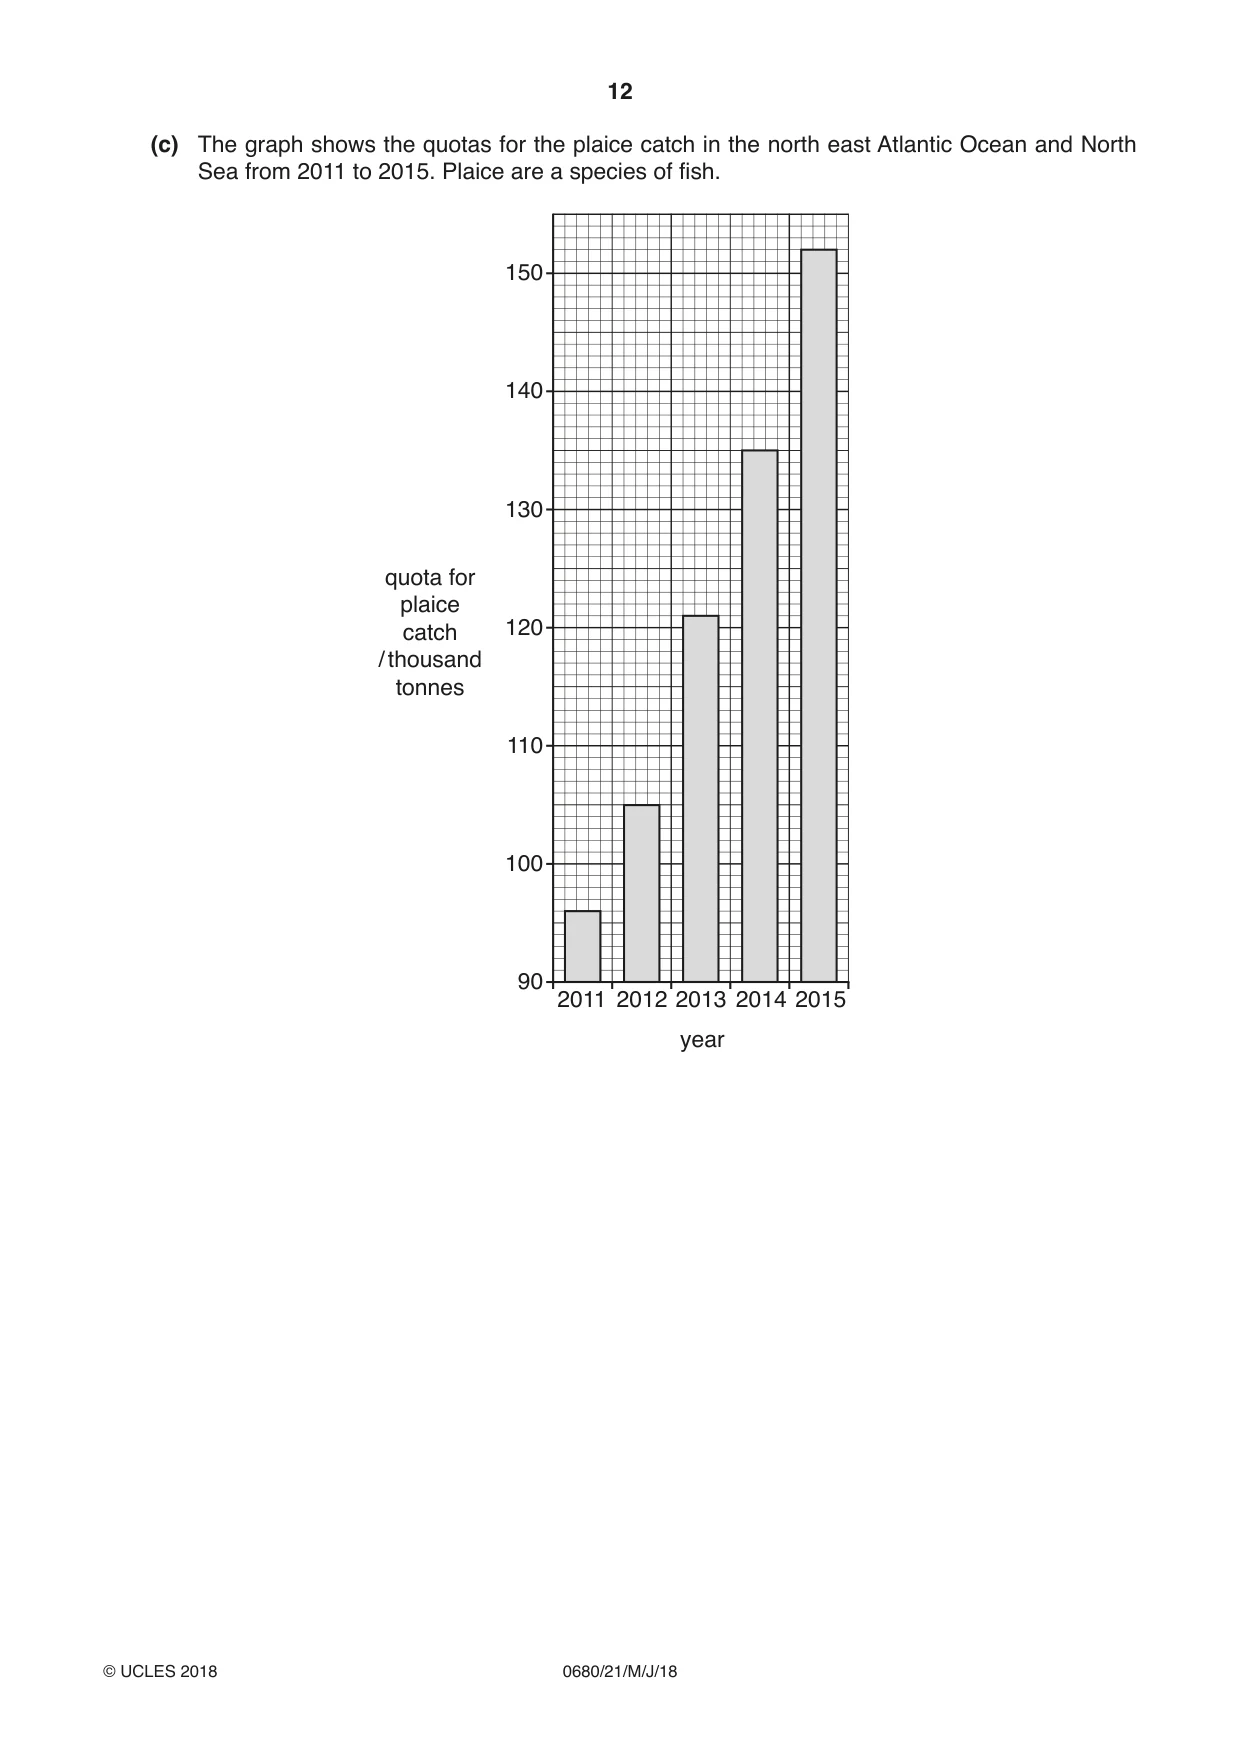
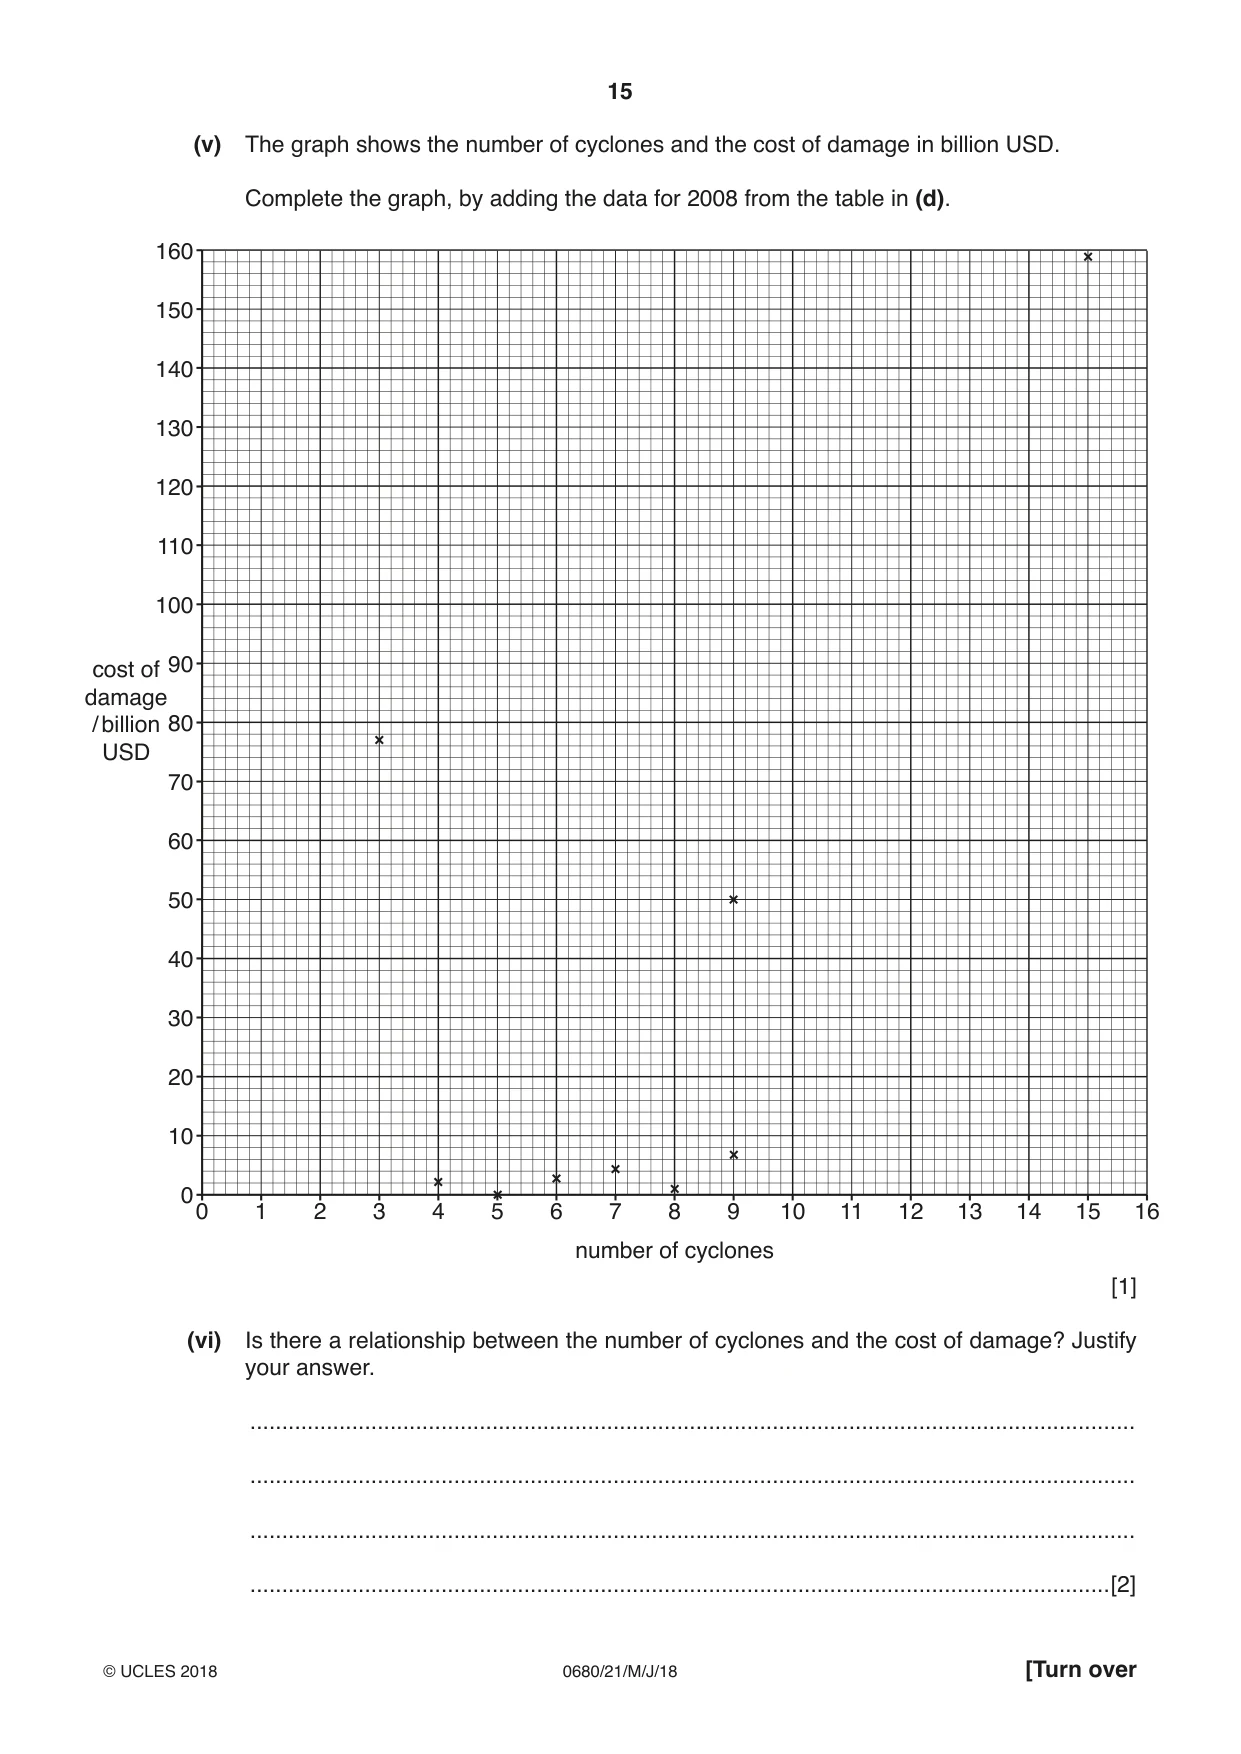
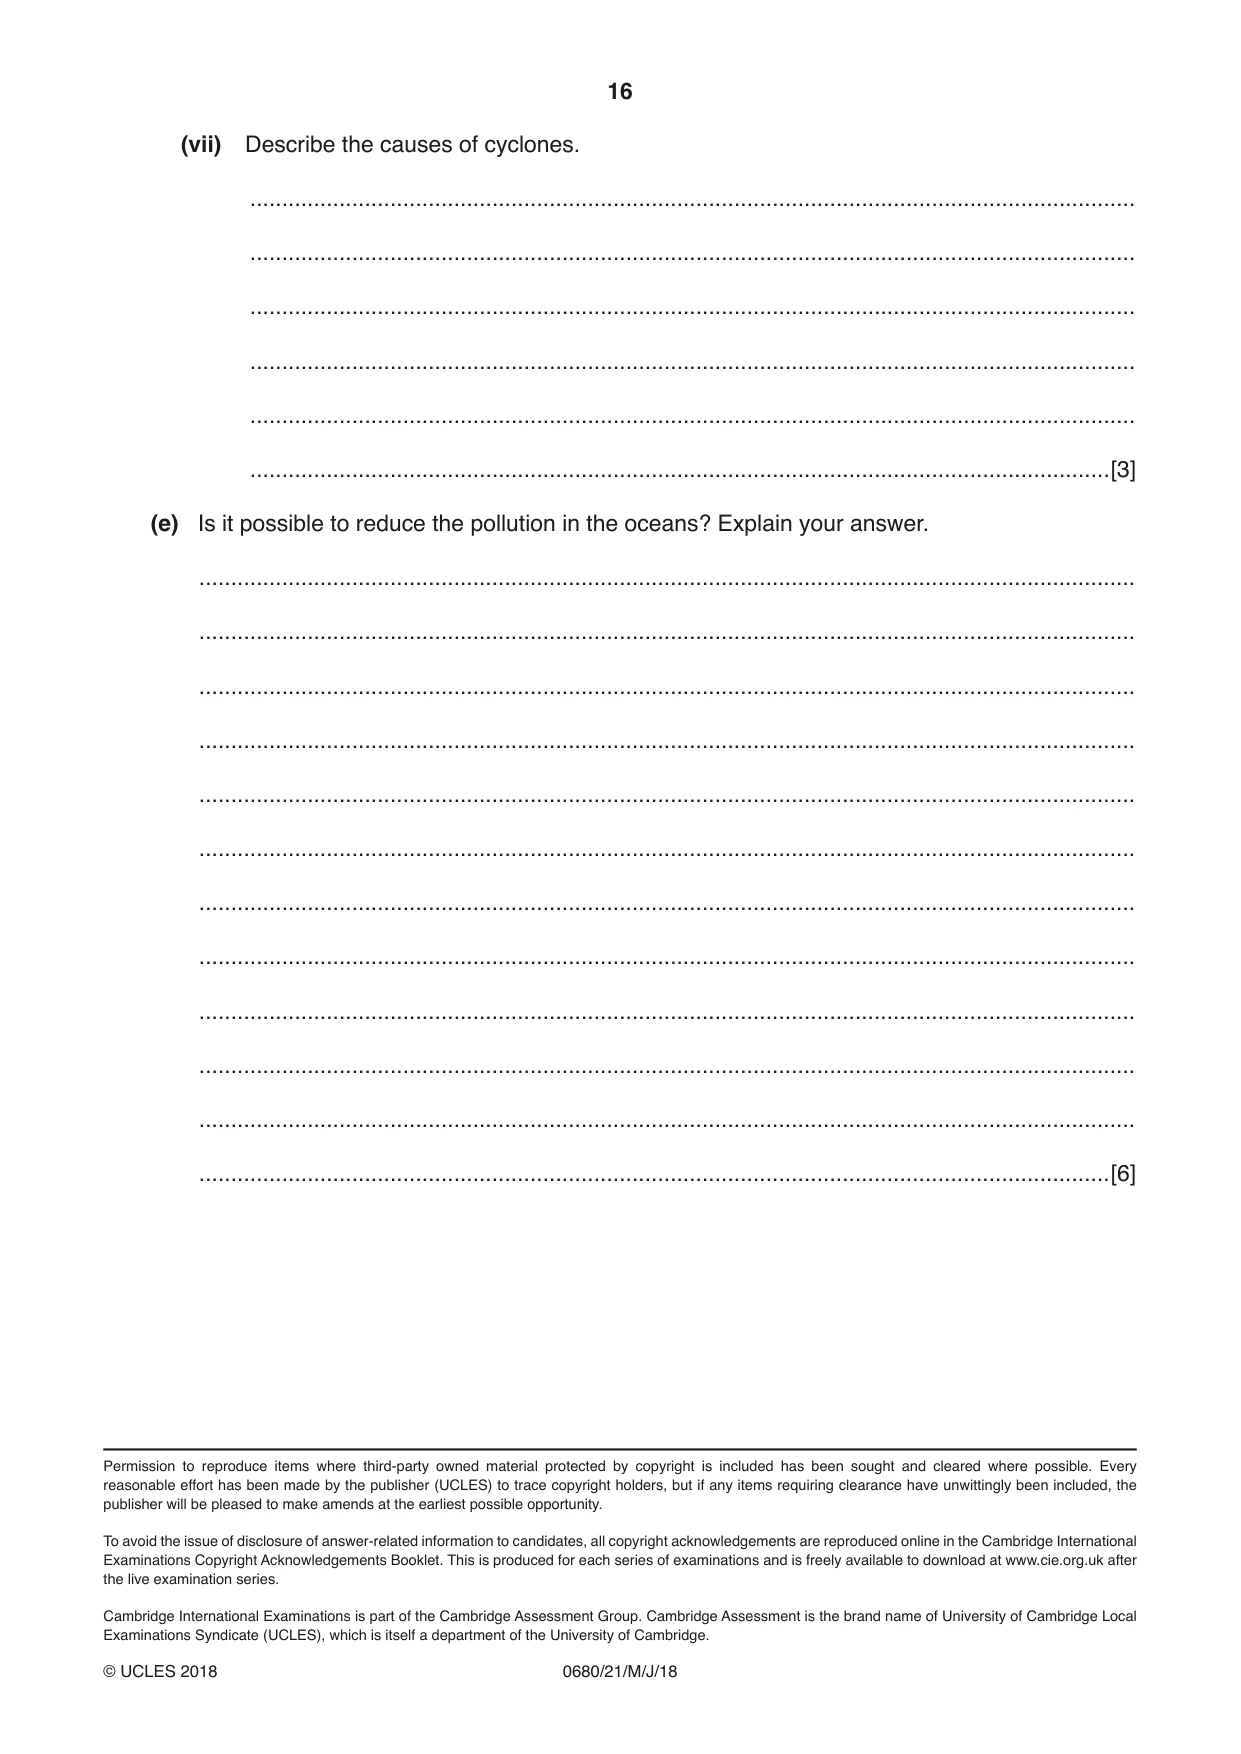
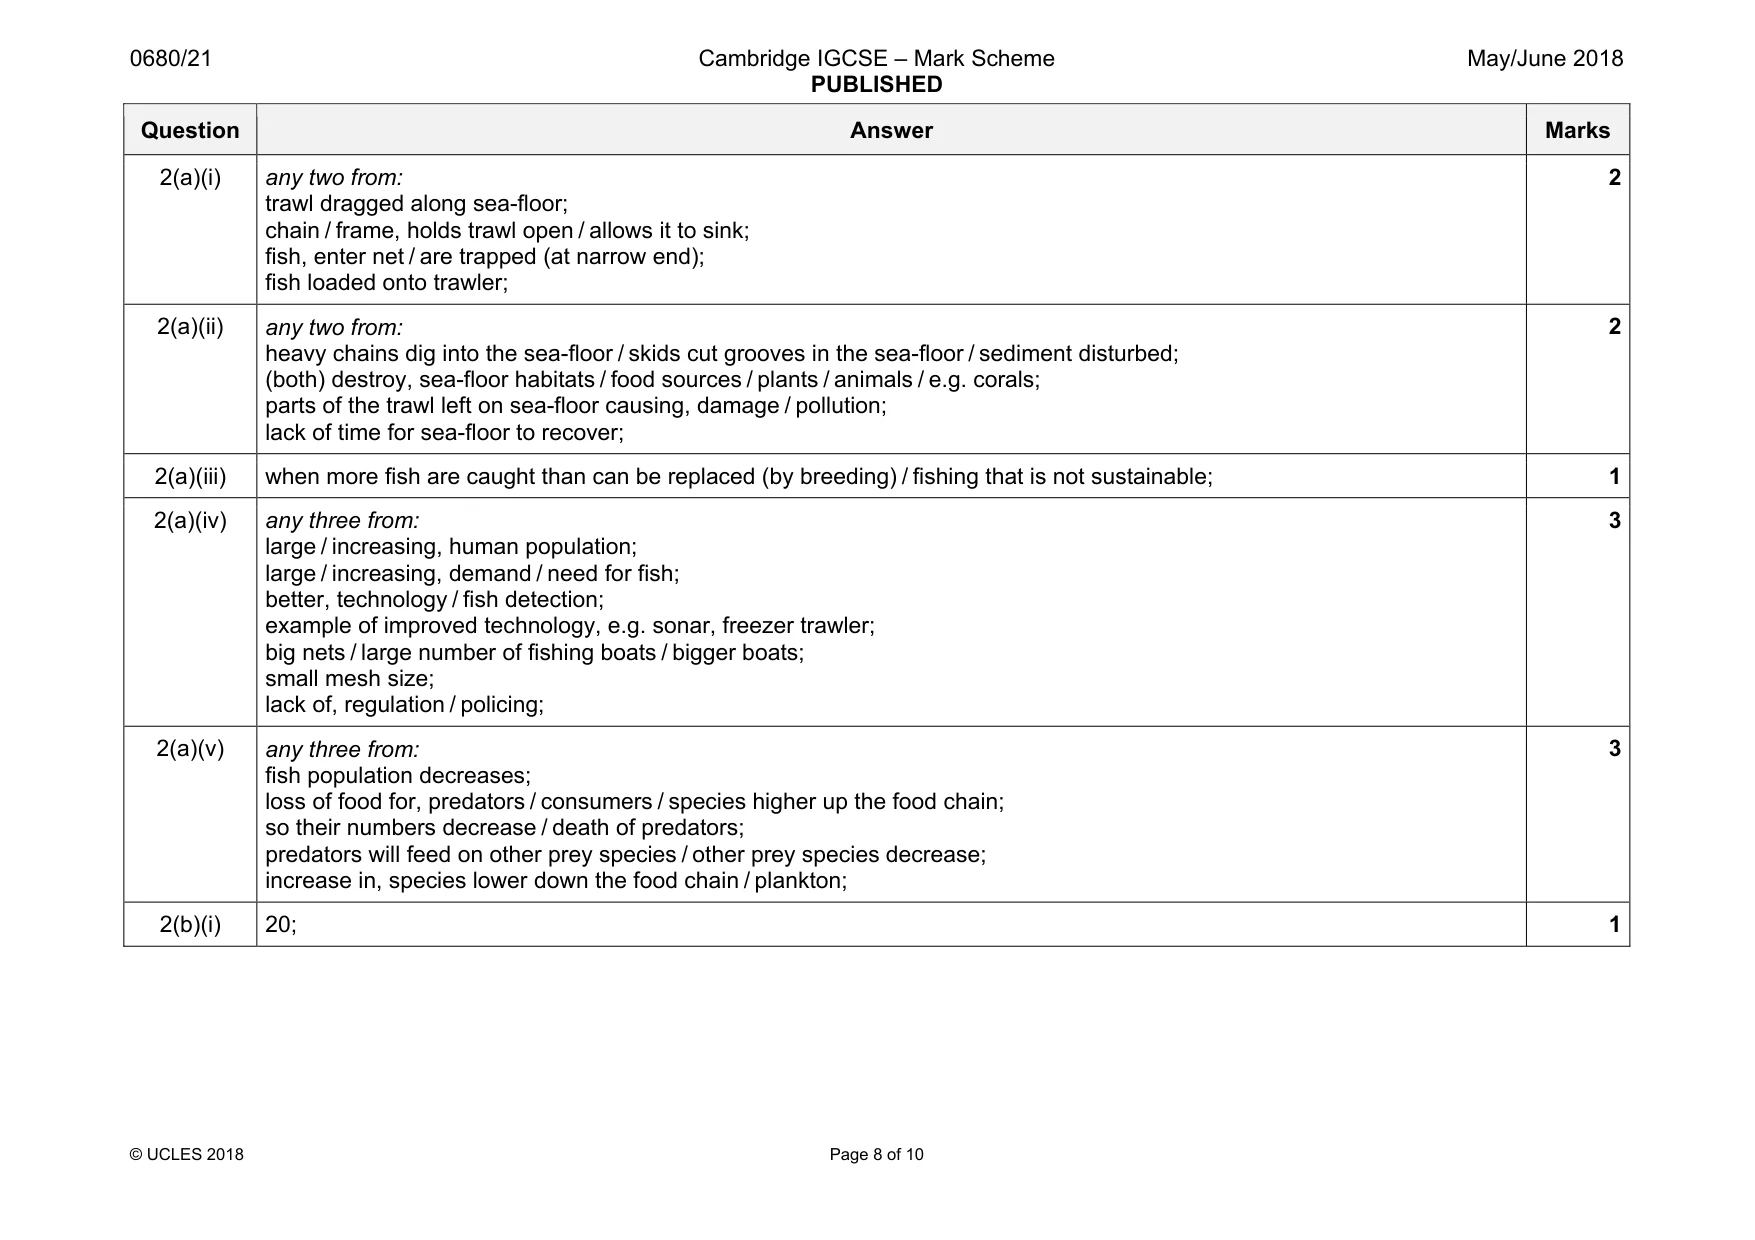
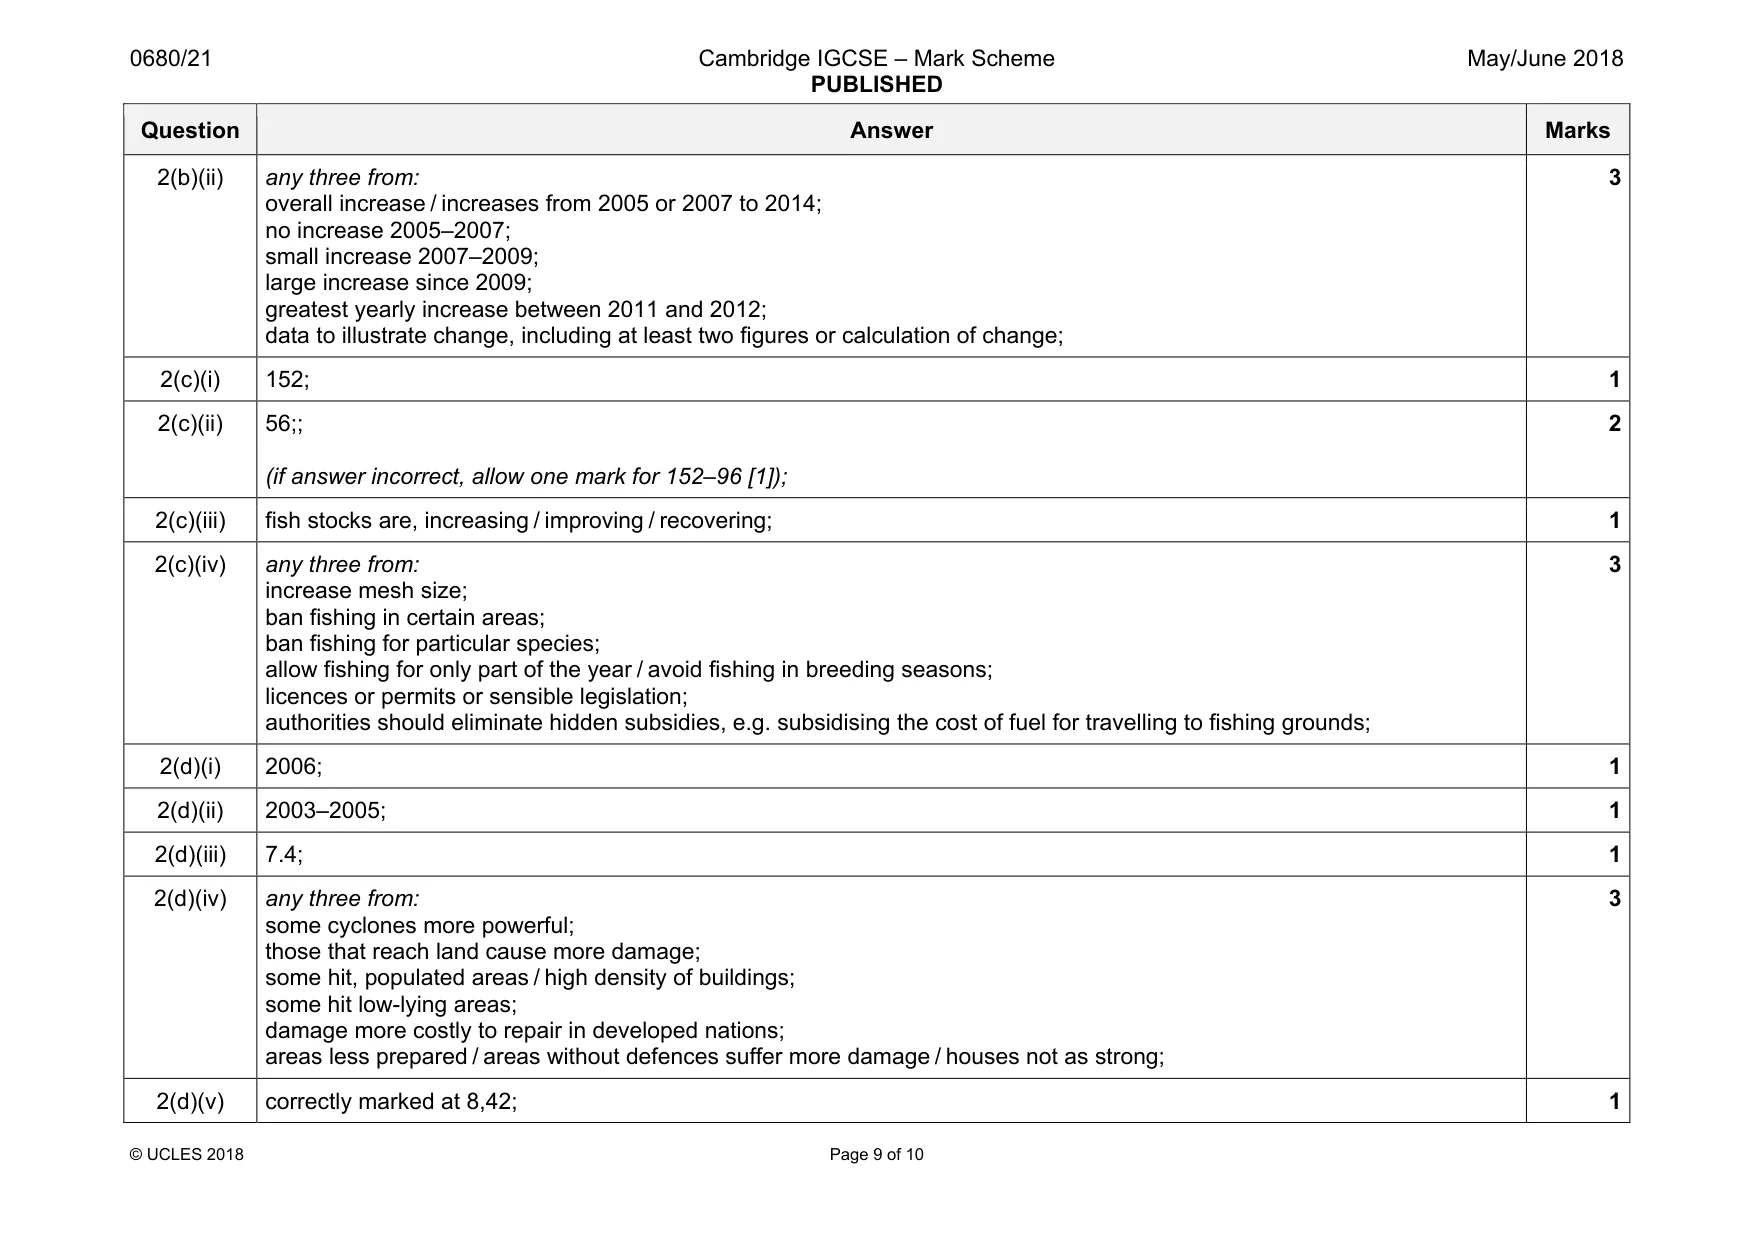
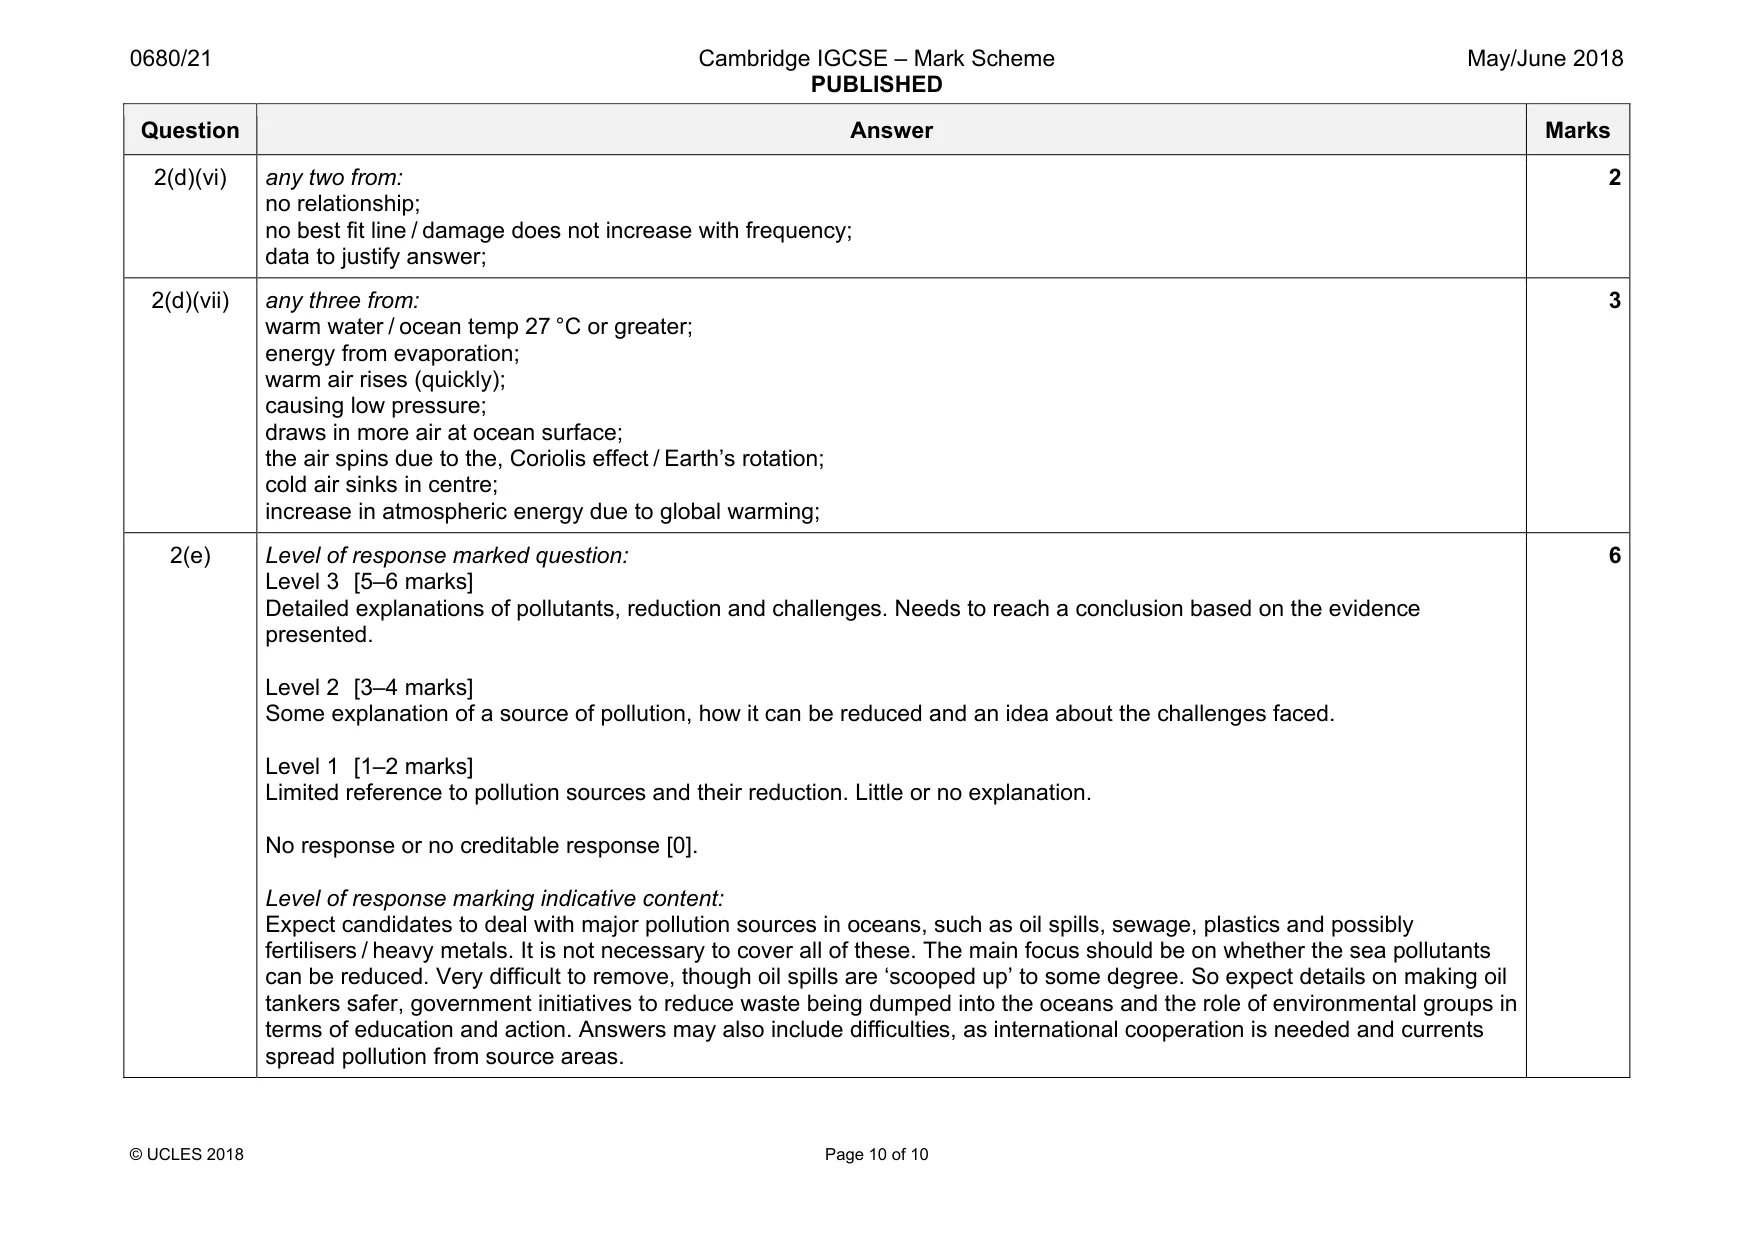
Mark scheme: 2(a)(i) any two from: trawl dragged along sea-floor; chain / frame, holds trawl open / allows it to sink; fish, enter net / are trapped (at narrow end); fish loaded onto trawler; 2 2(a)(ii) any two from: heavy chains dig into the sea-floor / skids cut grooves in the sea-floor / sediment disturbed; (both) destroy, sea-floor habitats / food sources / plants / animals / e.g. corals; parts of the trawl left on sea-floor causing, damage / pollution; lack of time for sea-floor to recover; 2 2(a)(iii) when more fish are caught than can be replaced (by breeding) / fishing that is not sustainable; 1 2(a)(iv) any three from: large / increasing, human population; large / increasing, demand / need for fish; better, technology / fish detection; example of improved technology, e.g. sonar, freezer trawler; big nets / large number of fishing boats / bigger boats; small mesh size; lack of, regulation / policing; 3 2(a)(v) any three from: fish population decreases; loss of food for, predators / consumers / species higher up the food chain; so their numbers decrease / death of predators; predators will feed on other prey species / other prey species decrease; increase in, species lower down the food chain / plankton; 3 2(b)(i) 20; 1 Question Answer Marks 2(b)(ii) any three from: overall increase / increases from 2005 or 2007 to 2014; no increase 2005–2007; small increase 2007–2009; large increase since 2009; greatest yearly increase between 2011 and 2012; data to illustrate change, including at least two figures or calculation of change; 3 2(c)(i) 152; 1 2(c)(ii) 56;; (if answer incorrect, allow one mark for 152–96 [1]); 2 2(c)(iii) fish stocks are, increasing / improving / recovering; 1 2(c)(iv) any three from: increase mesh size; ban fishing in certain areas; ban fishing for particular species; allow fishing for only part of the year / avoid fishing in breeding seasons; licences or permits or sensible legislation; authorities should eliminate hidden subsidies, e.g. subsidising the cost of fuel for travelling to fishing grounds; 3 2(d)(i) 2006; 1 2(d)(ii) 2003–2005; 1 2(d)(iii) 7.4; 1 2(d)(iv) any three from: some cyclones more powerful; those that reach land cause more damage; some hit, populated areas / high density of buildings; some hit low-lying areas; damage more costly to repair in developed nations; areas less prepared / areas without defences suffer more damage / houses not as strong; 3 2(d)(v) correctly marked at 8,42; 1 Question Answer Marks 2(d)(vi) any two from: no relationship; no best fit line / damage does not increase with frequency; data to justify answer; 2 2(d)(vii) any three from: warm water / ocean temp 27 °C or greater; energy from evaporation; warm air rises (quickly); causing low pressure; draws in more air at ocean surface; the air spins due to the, Coriolis effect / Earth’s rotation; cold air sinks in centre; increase in atmospheric energy due to global warming; 3 2(e) Level of response marked question: Level 3 [5–6 marks] Detailed explanations of pollutants, reduction and challenges. Needs to reach a conclusion based on the evidence presented. Level 2 [3–4 marks] Some explanation of a source of pollution, how it can be reduced and an idea about the challenges faced. Level 1 [1–2 marks] Limited reference to pollution sources and their reduction. Little or no explanation. No response or no creditable response [0]. Level of response marking indicative content: Expect candidates to deal with major pollution sources in oceans, such as oil spills, sewage, plastics and possibly fertilisers / heavy metals. It is not necessary to cover all of these. The main focus should be on whether the sea pollutants can be reduced. Very difficult to remove, though oil spills are ‘scooped up’ to some degree. So expect details on making oil tankers safer, government initiatives to reduce waste being dumped into the oceans and the role of environmental groups in terms of education and action. Answers may also include difficulties, as international cooperation is needed and currents spread pollution from source areas. 6
What was in this paper
The subtopics covered by these 2 questions, and how many questions each got. Open one in a new tab to see every Cambridge question on it.
What you needed in this session
Cambridge’s own grade thresholds for 2018 May/June, Paper 2 · Variant 1. A higher threshold means an easier paper — the bar moves with how the cohort did.