Cambridge IGCSE Environmental Management 0680 — 2017 Oct/Nov Paper 2 · Variant 2
0680/22/O/N/17 · 2 questions · 80 marks · ≈90 min
The question paper and its mark scheme, free to read here and free to download. This is Cambridge’s own paper, exactly as it was sat.
Question paper16 pages

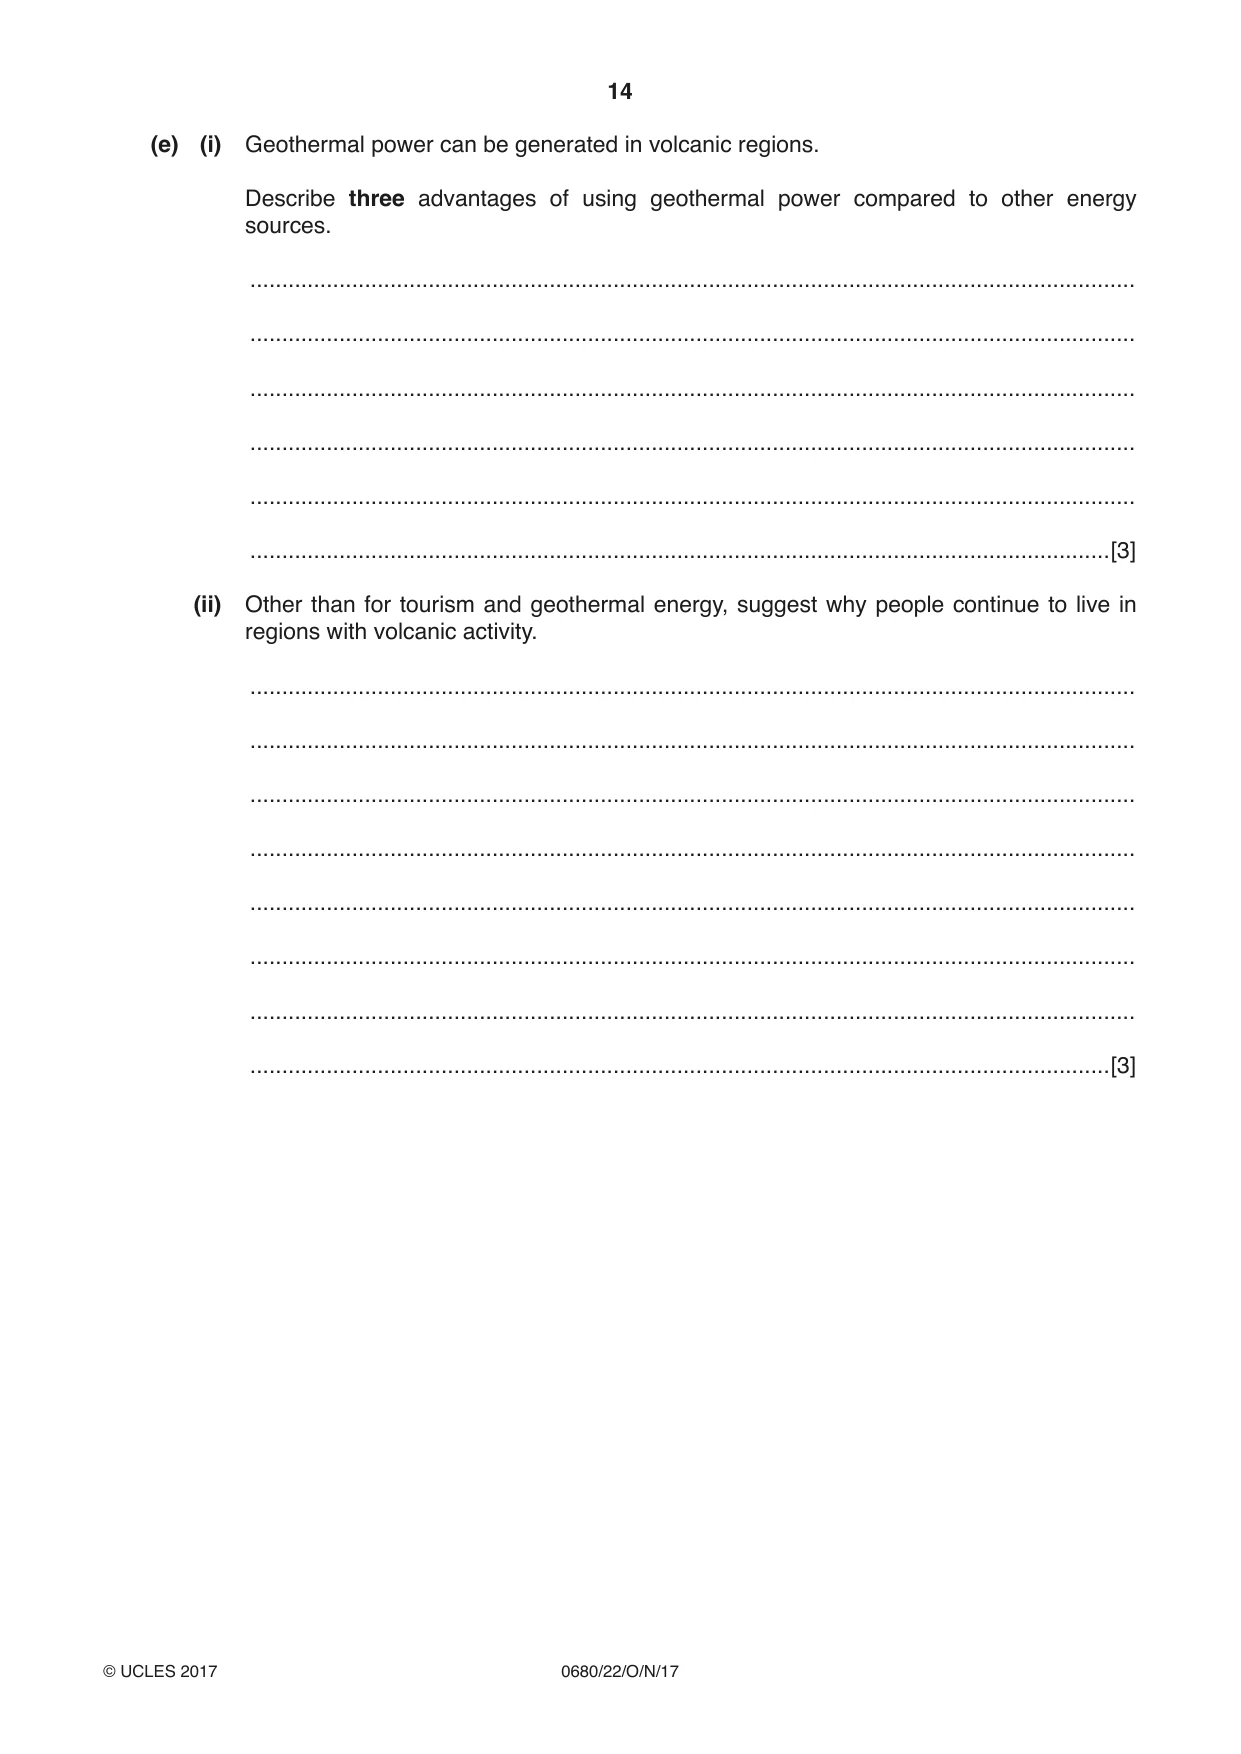
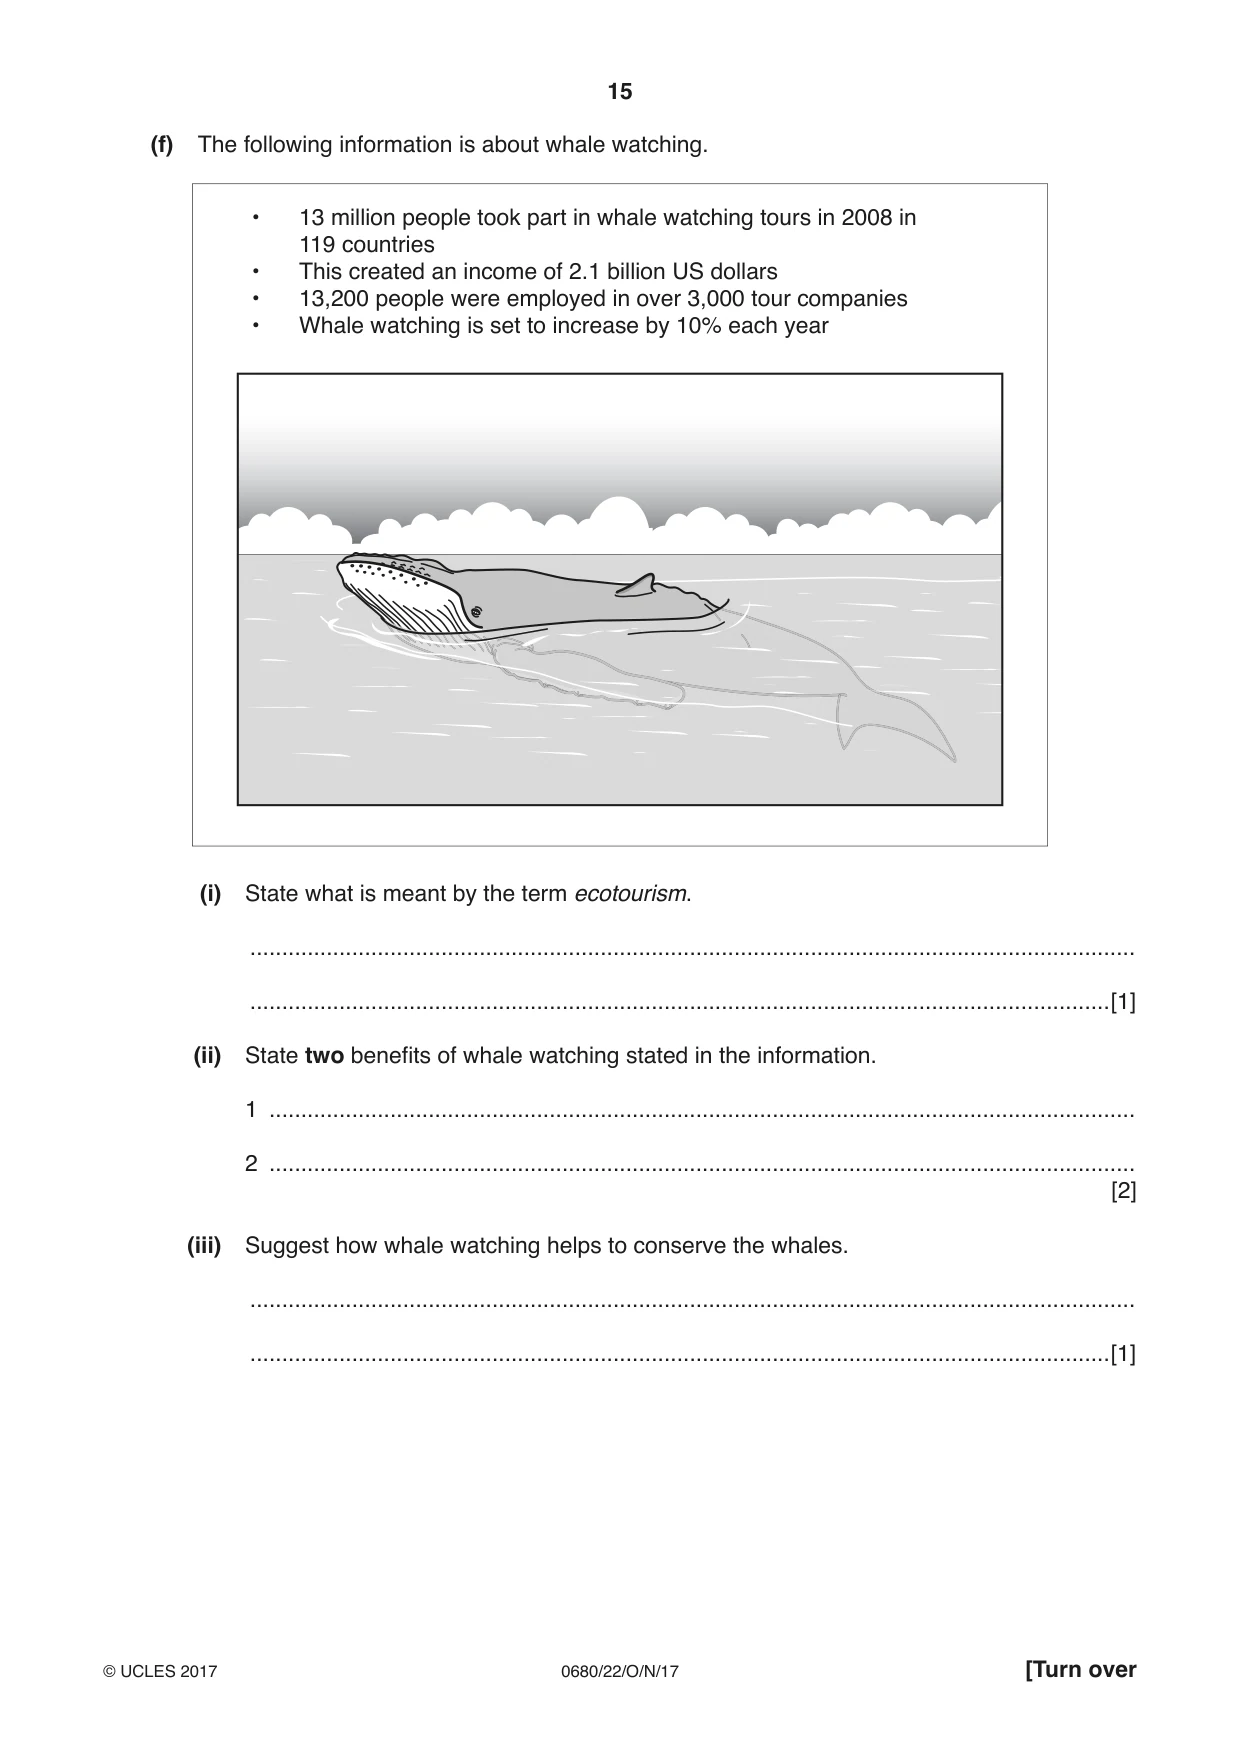
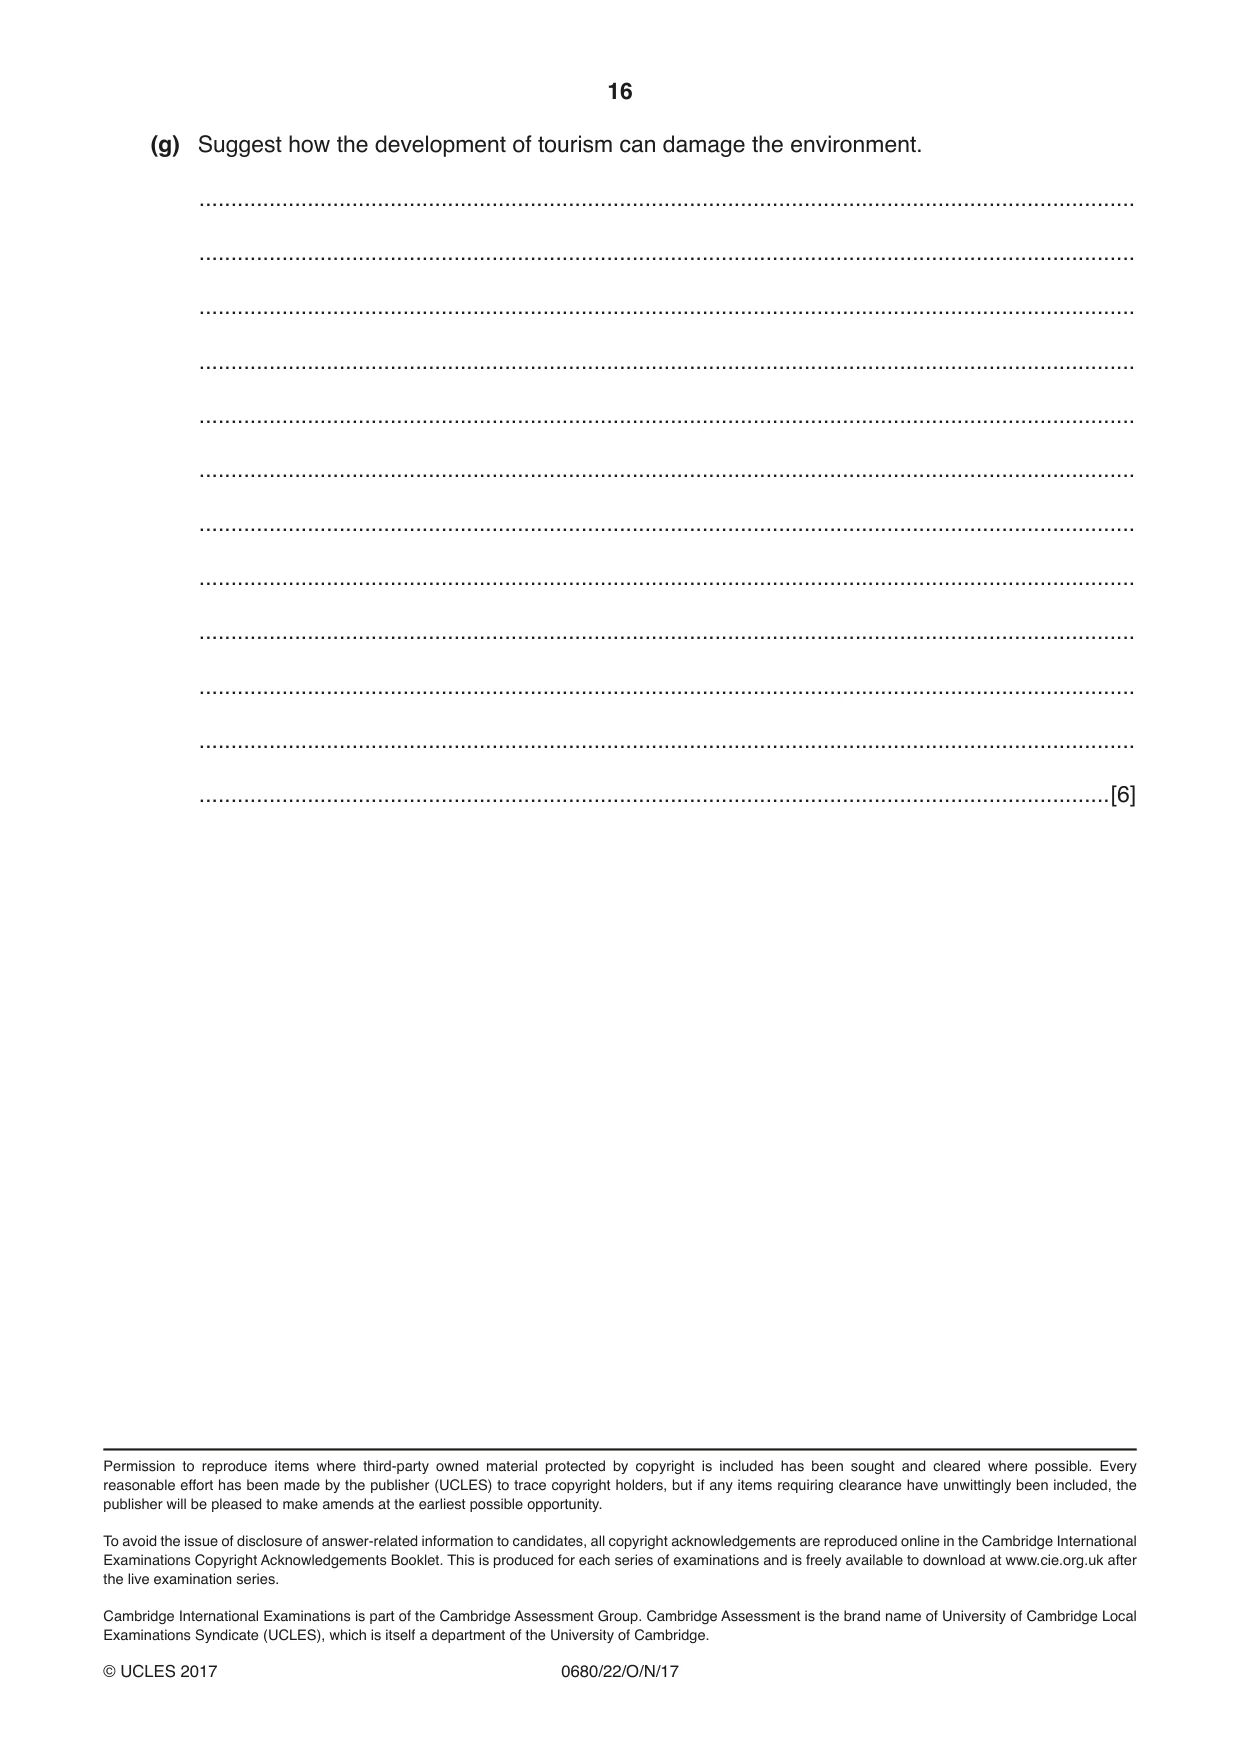
Mark scheme8 pages
Answers below. Sit the paper first if you are practising.
Questions as text
Q1 · The table shows the percentage of the Earth’s land surface covered by some biomes
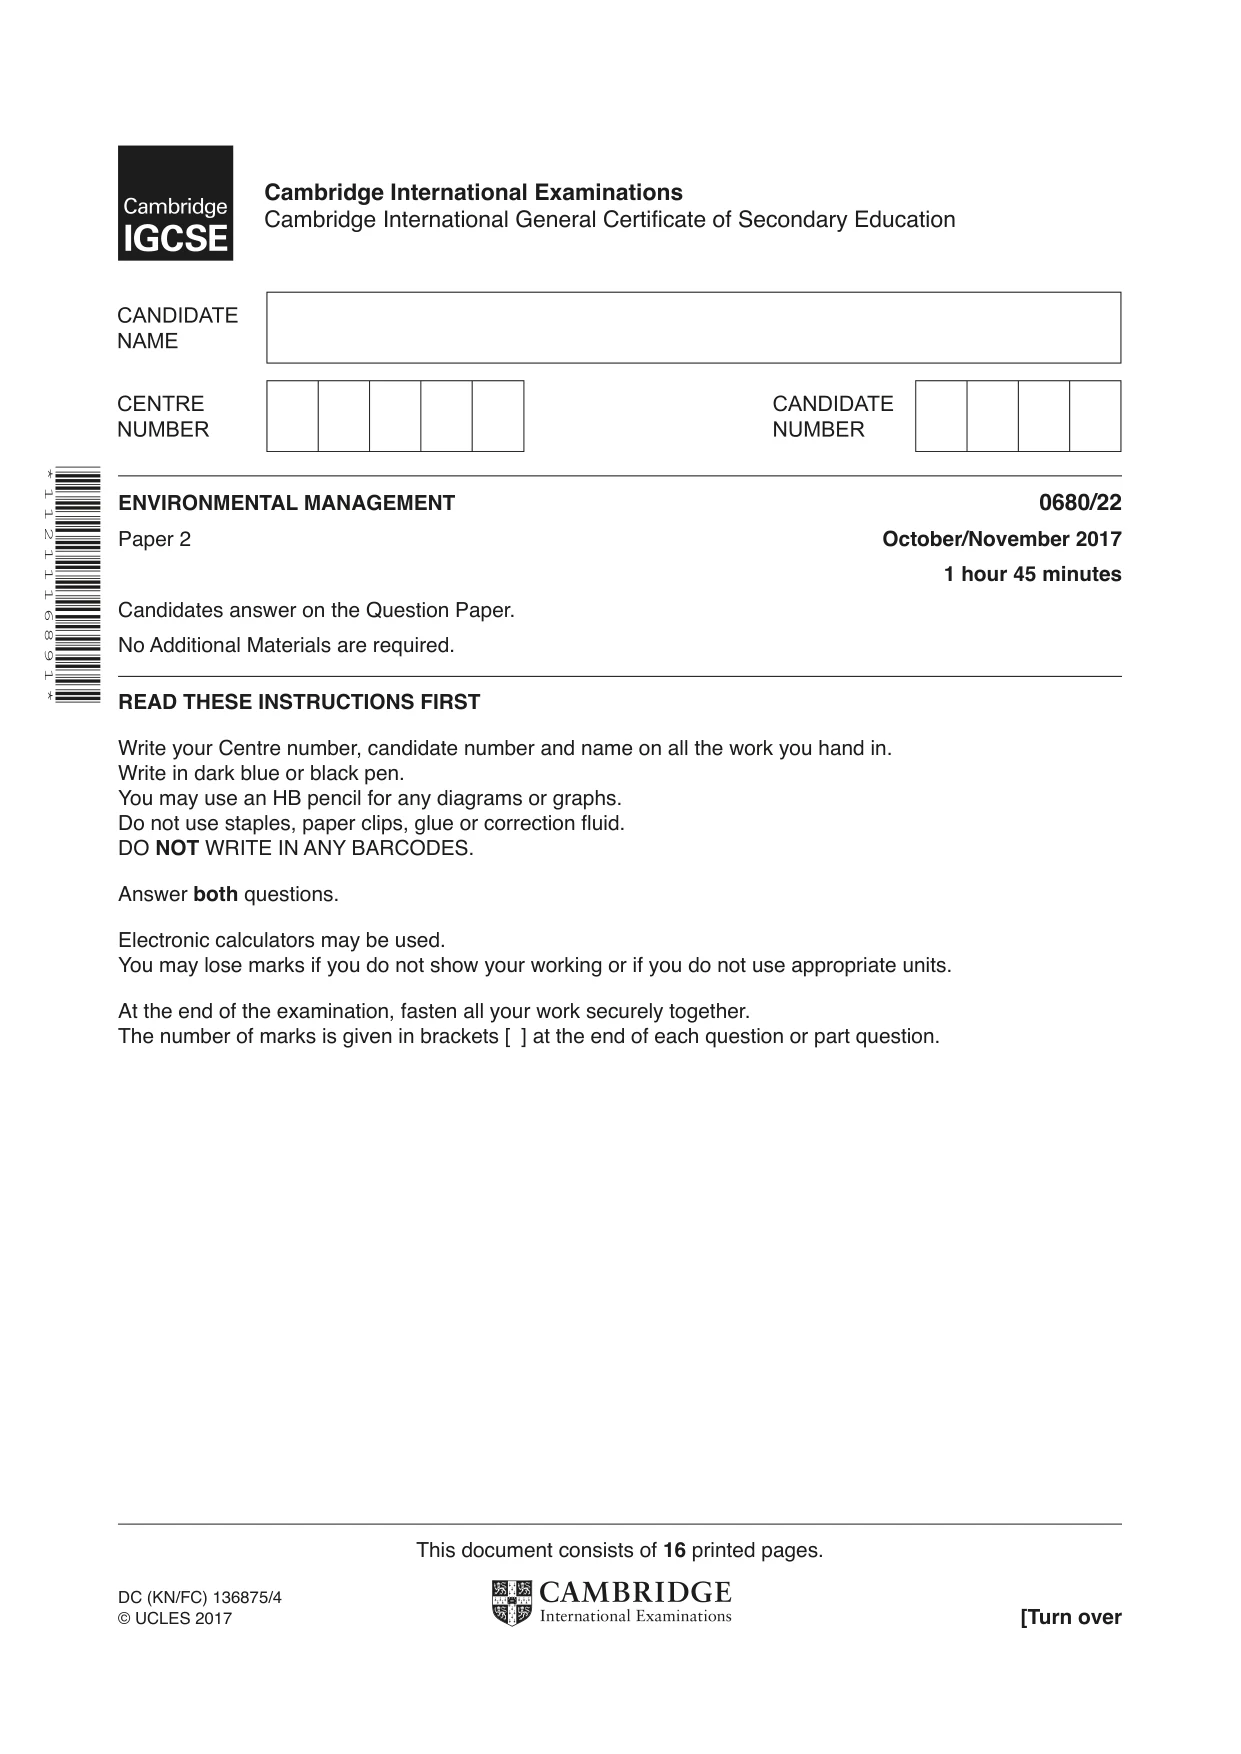
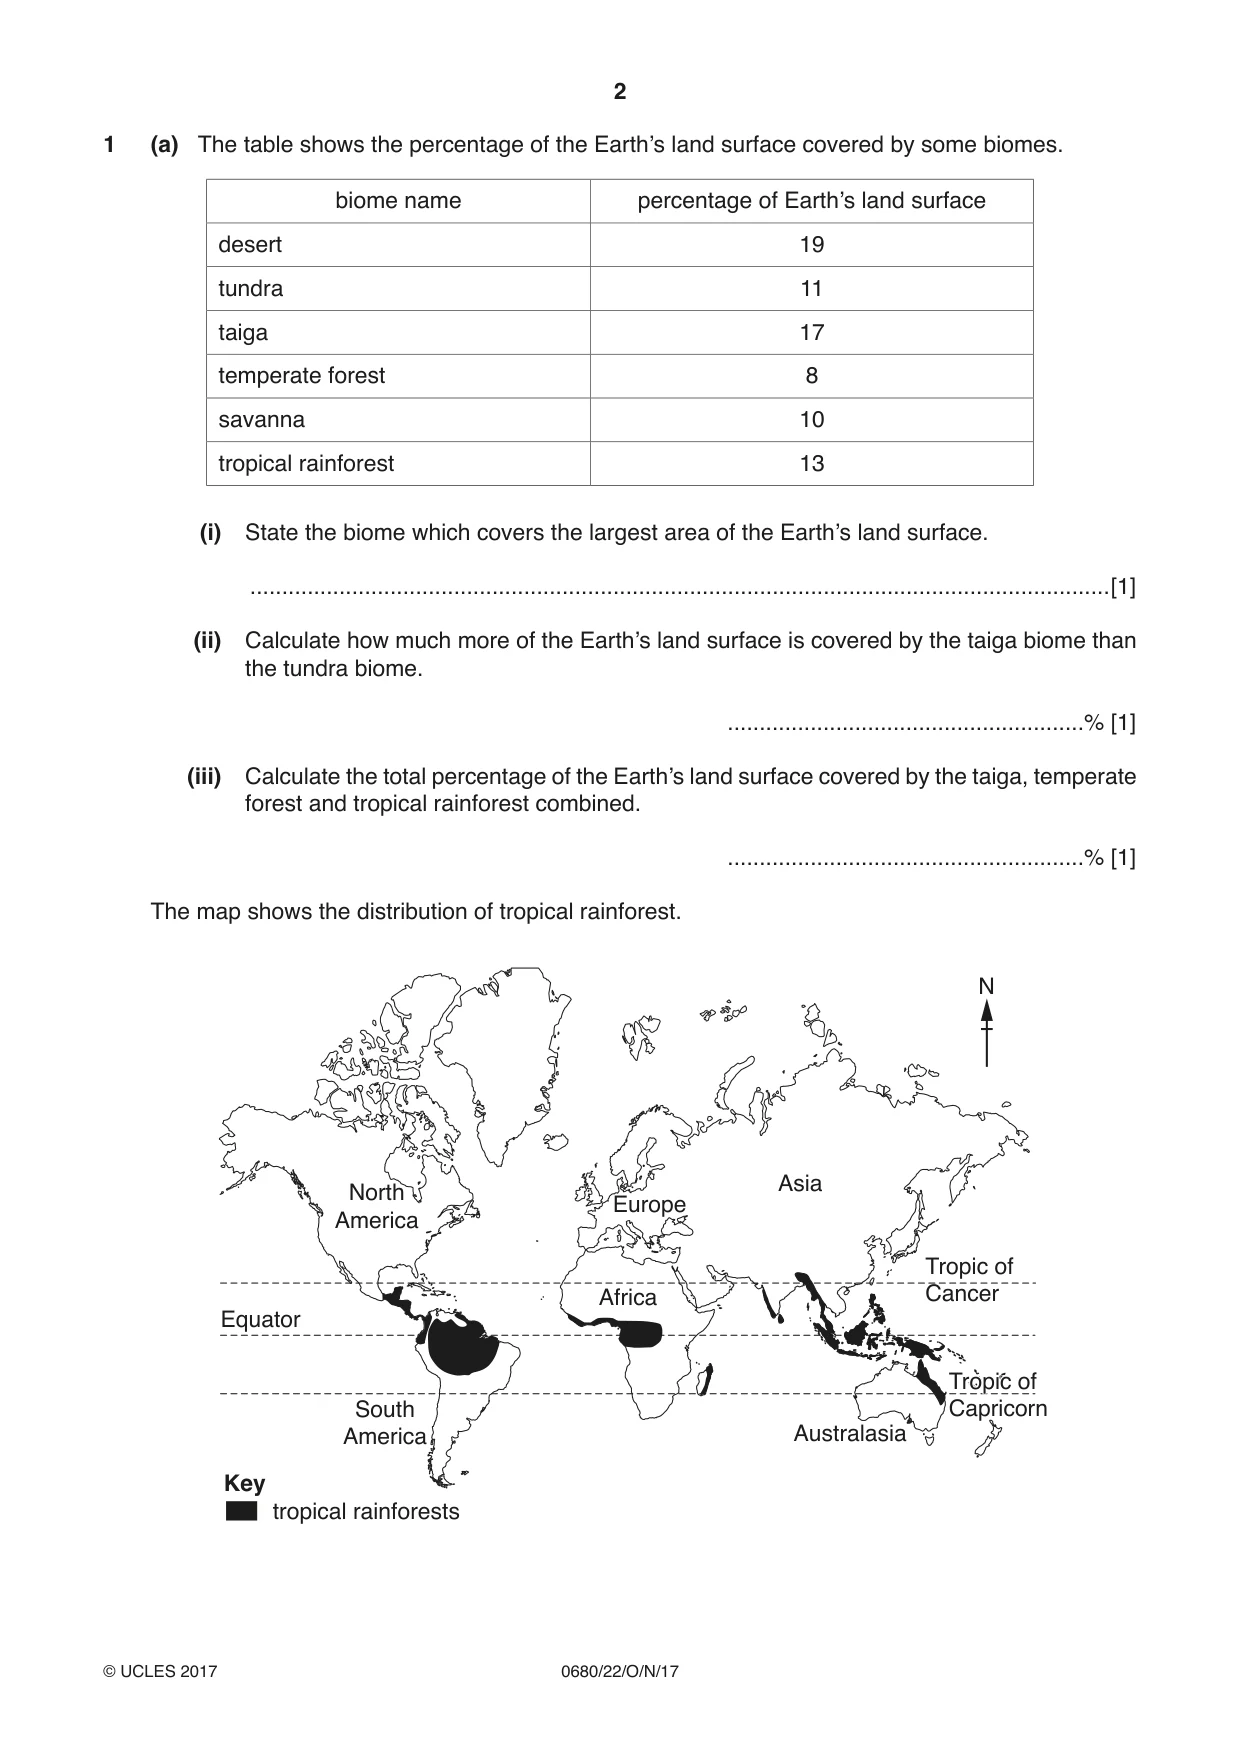
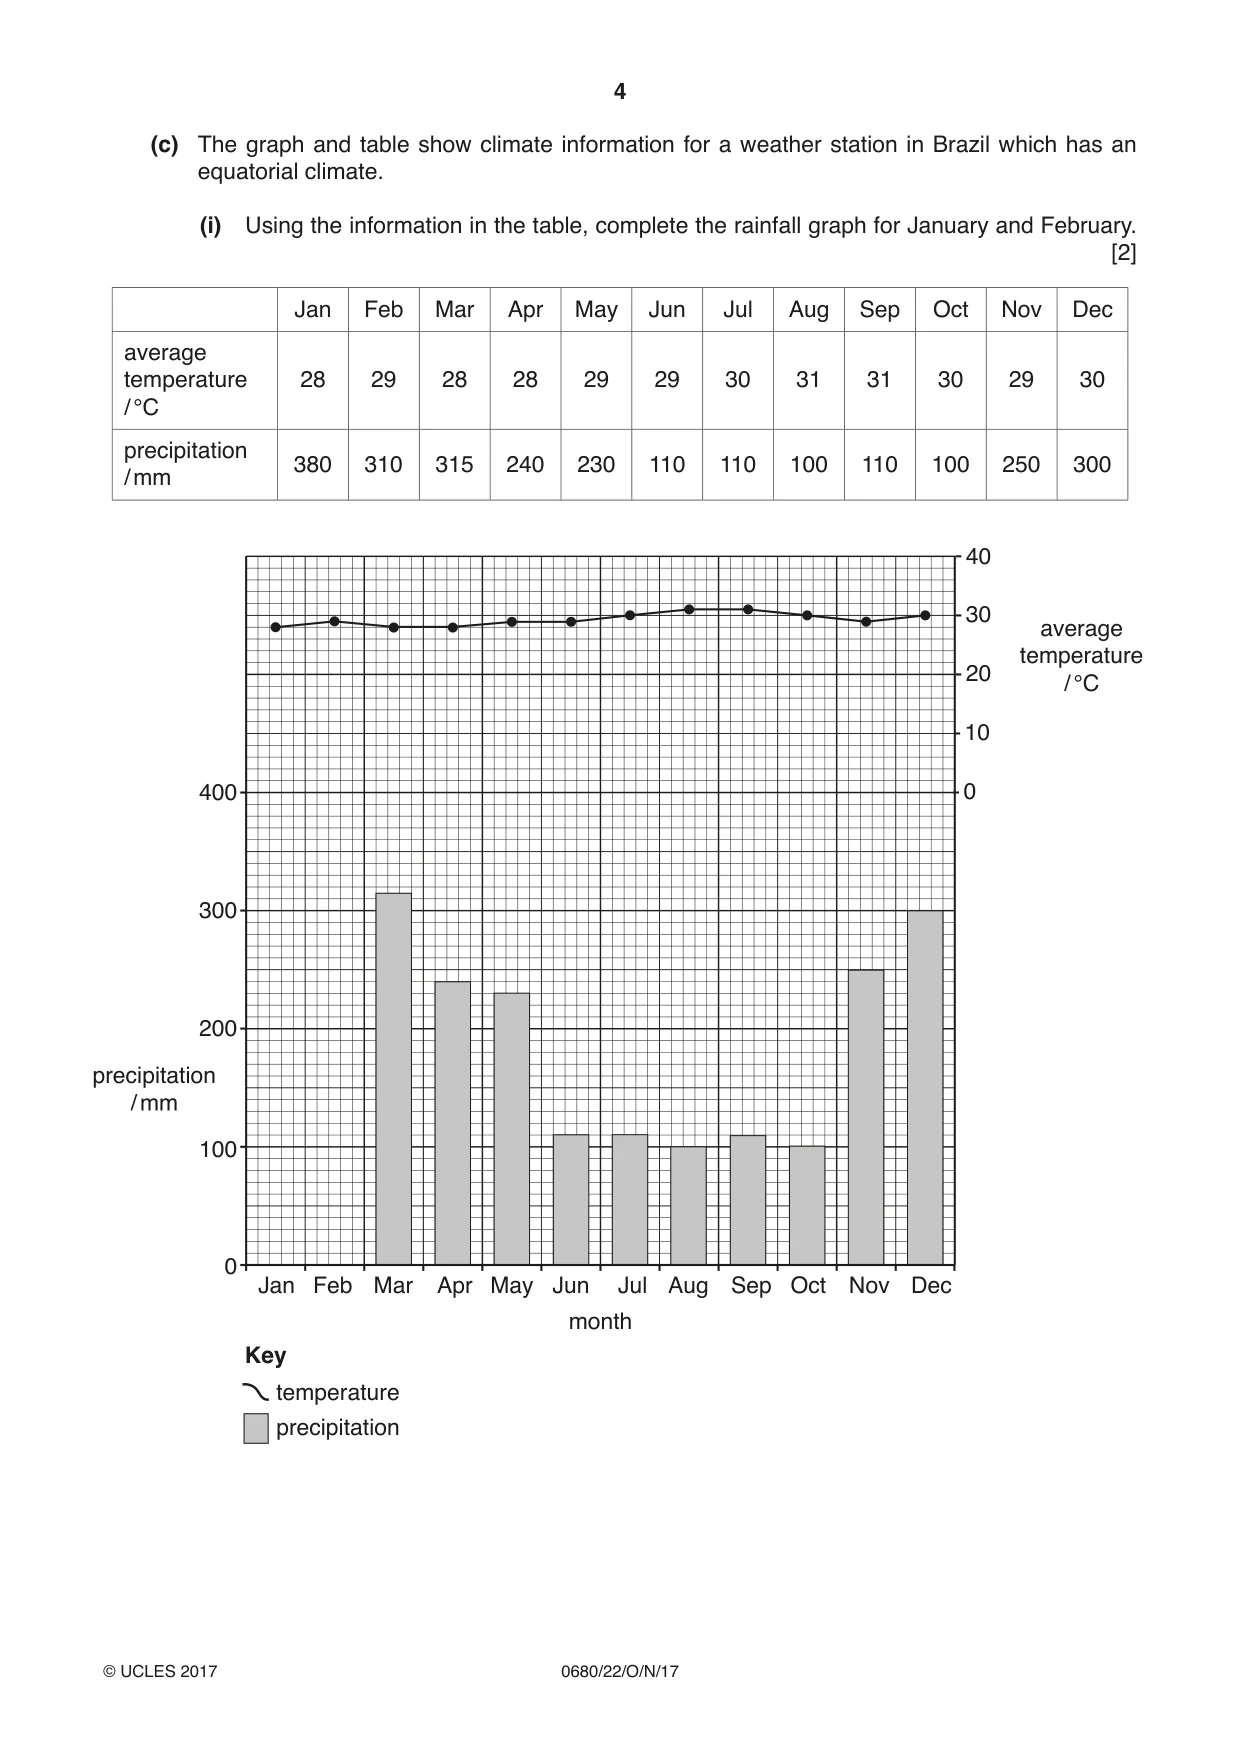
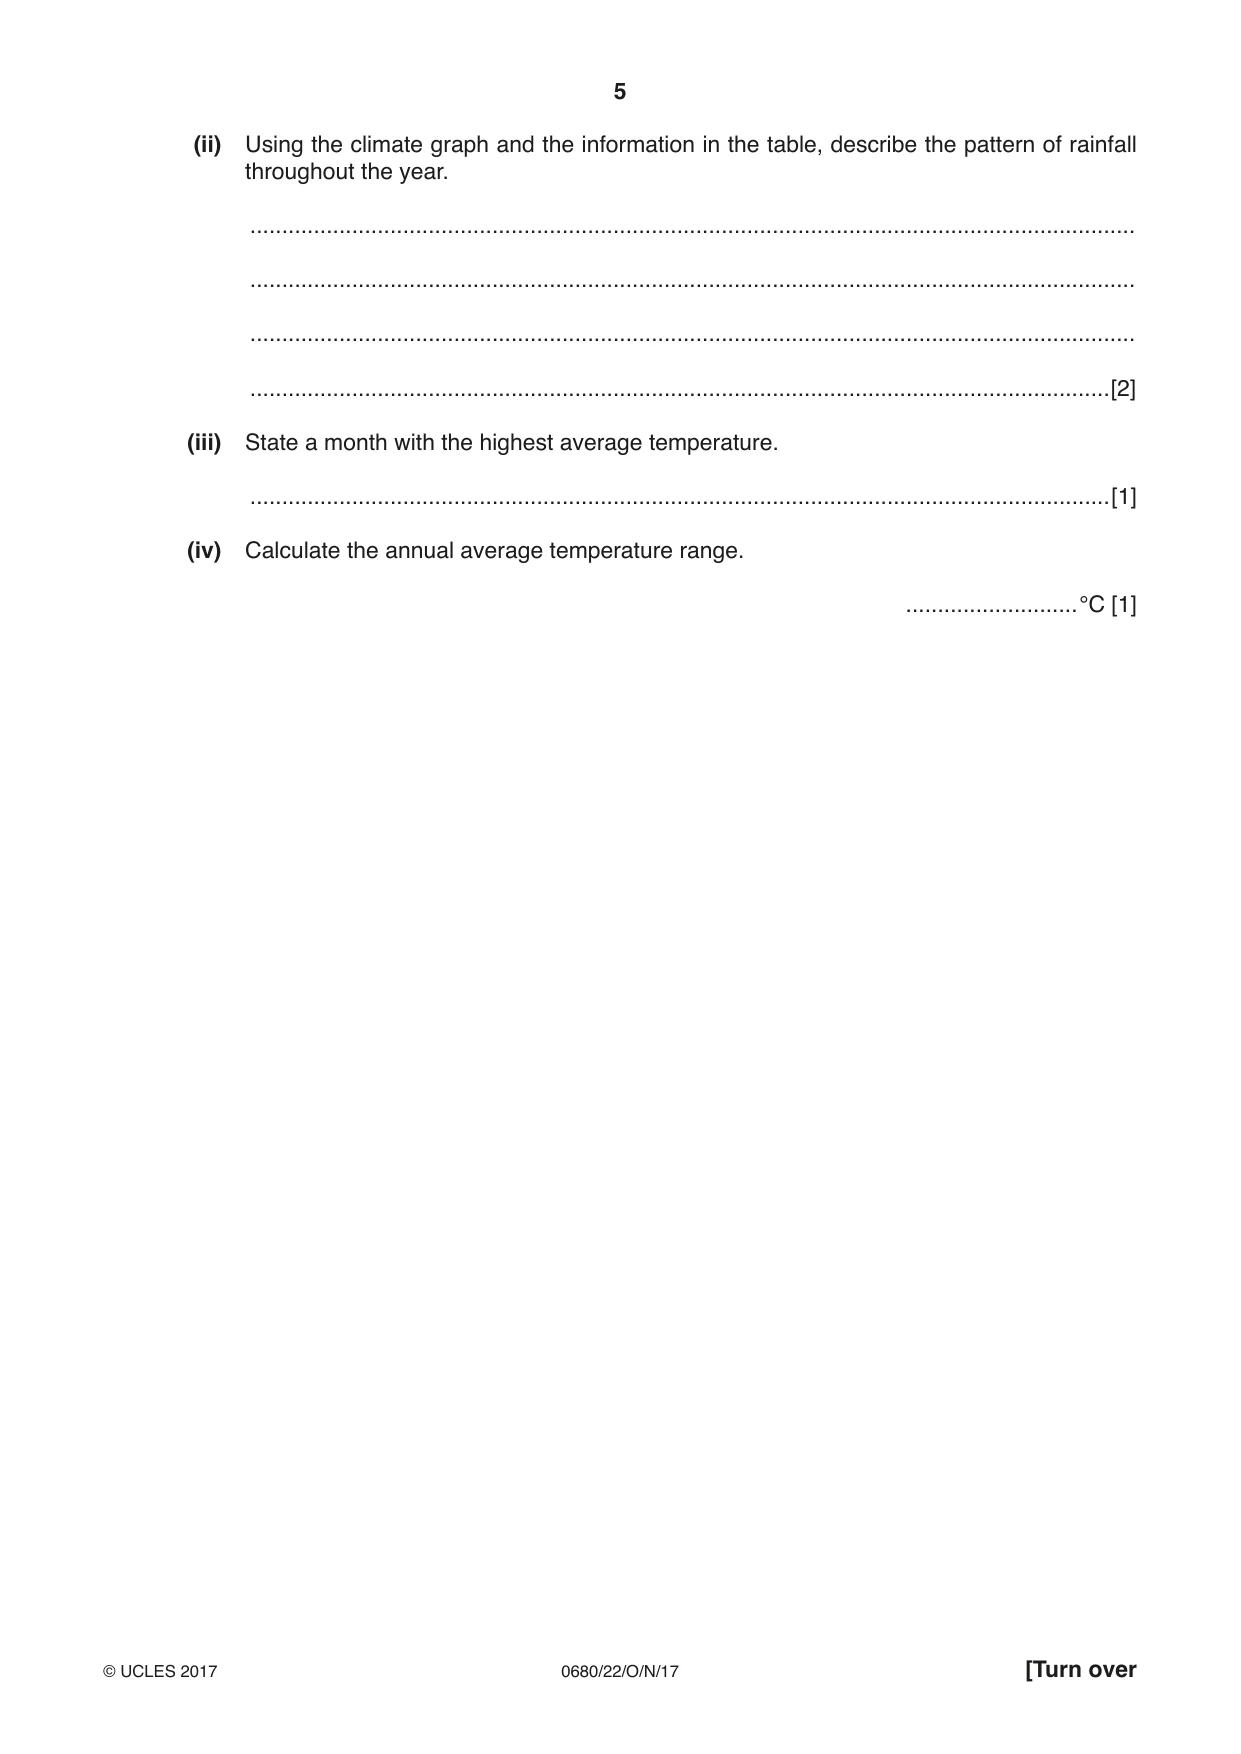
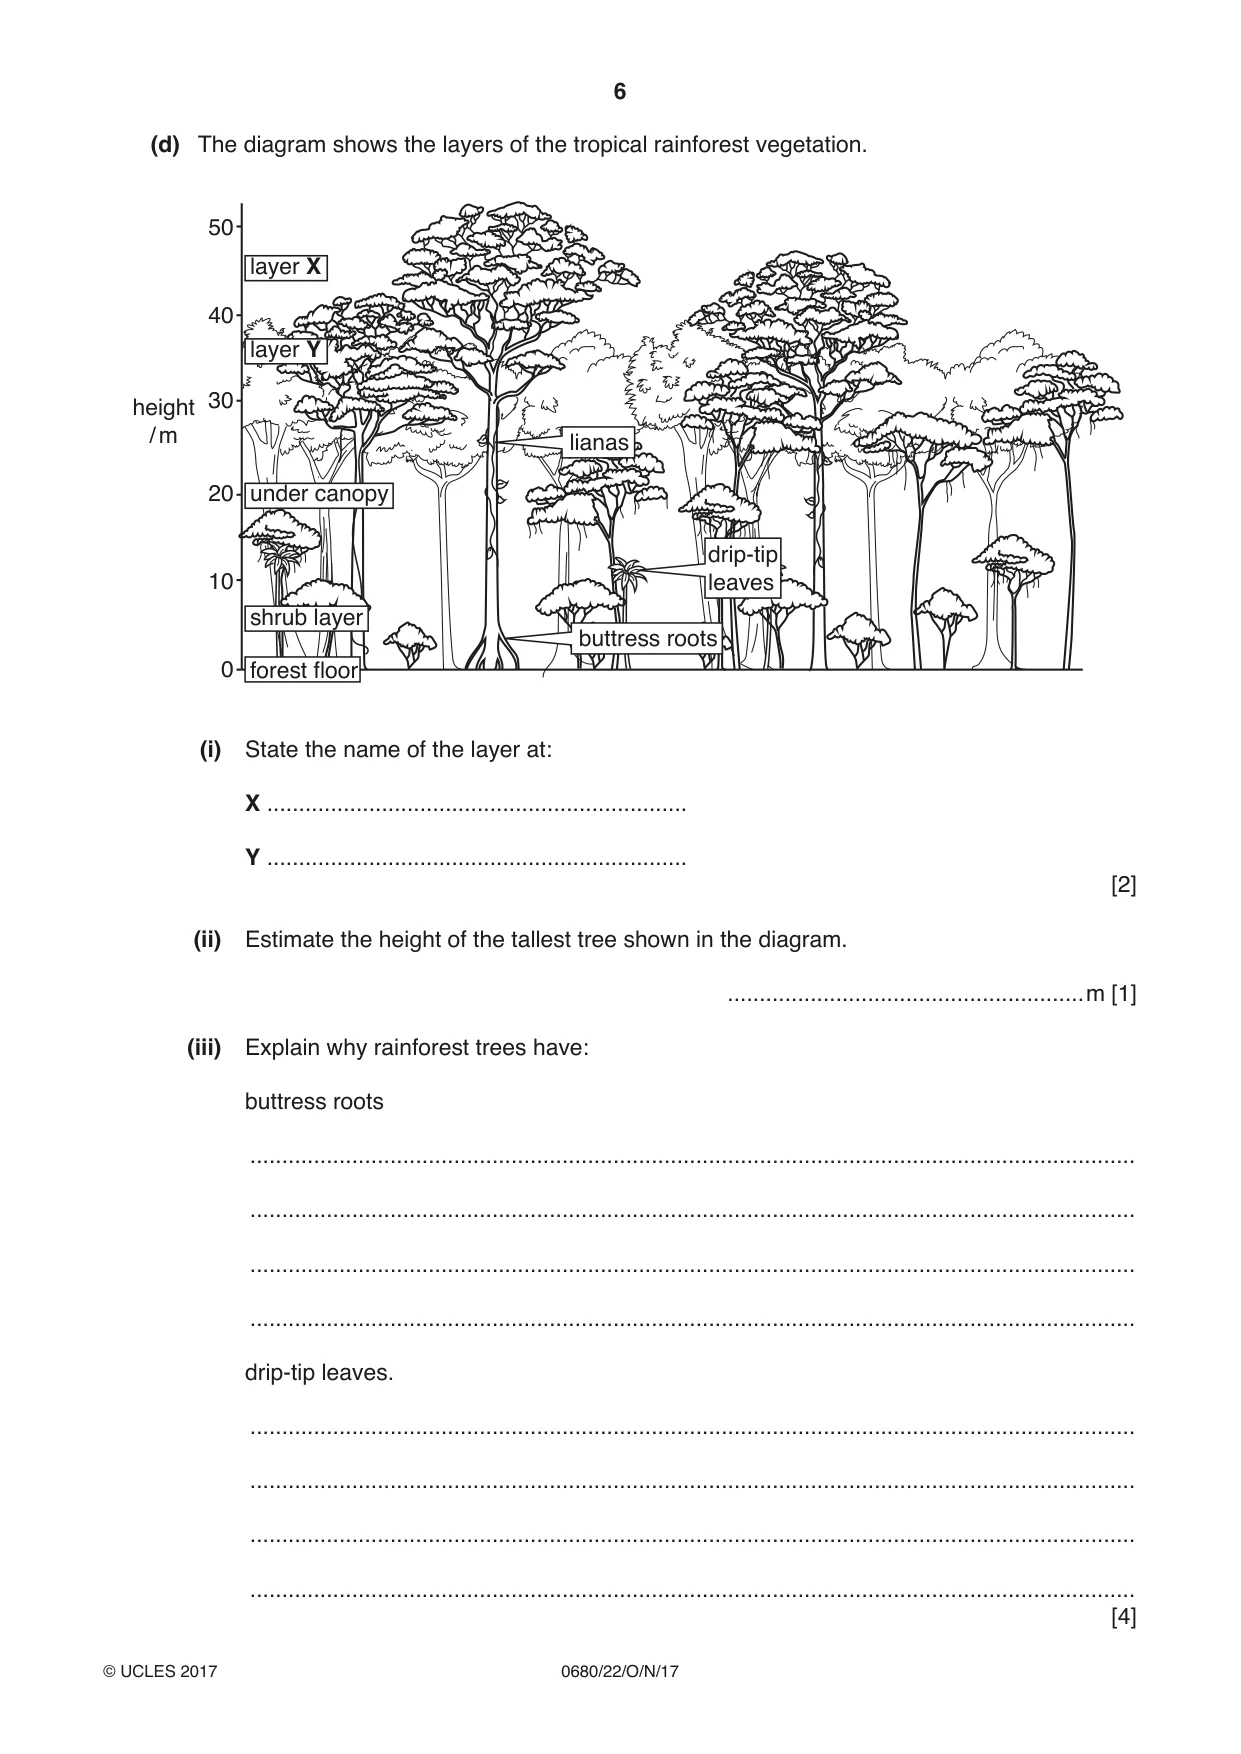
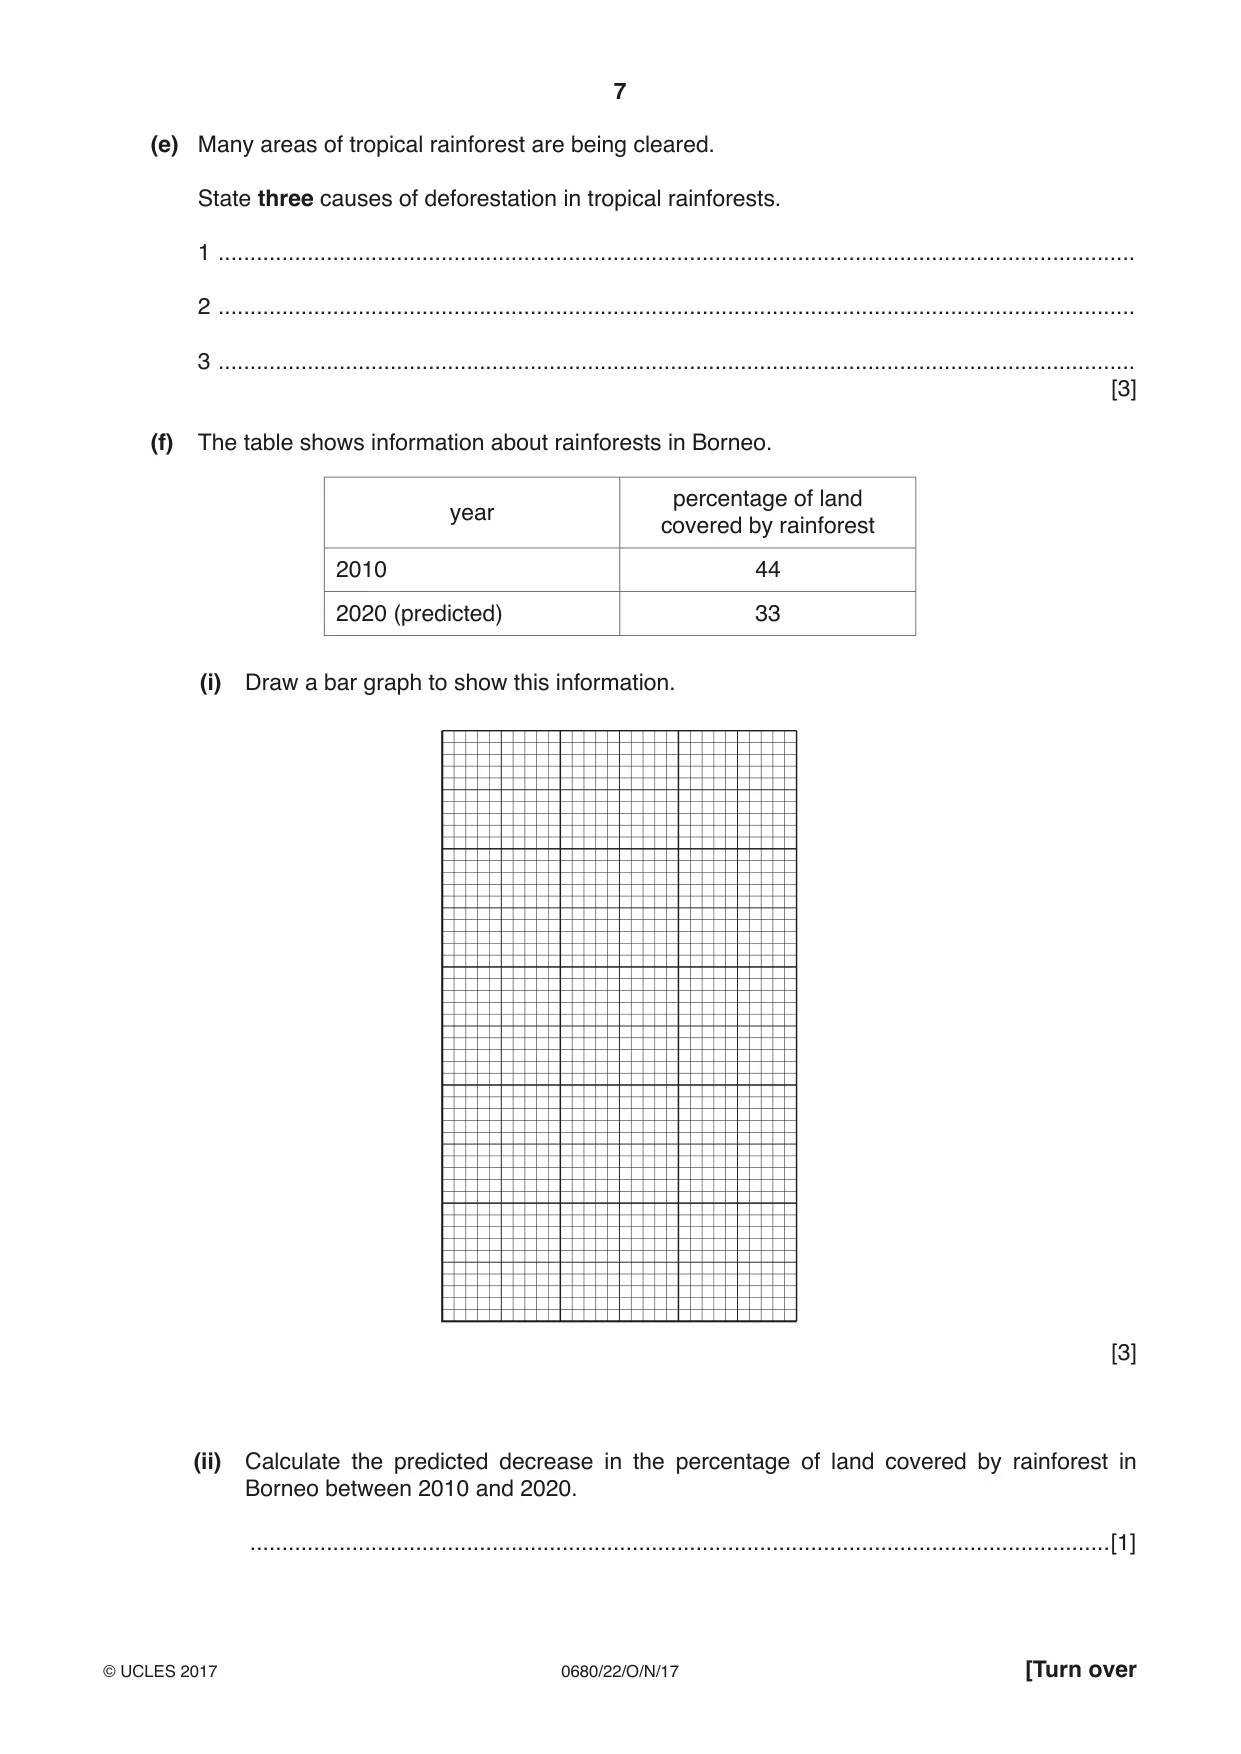
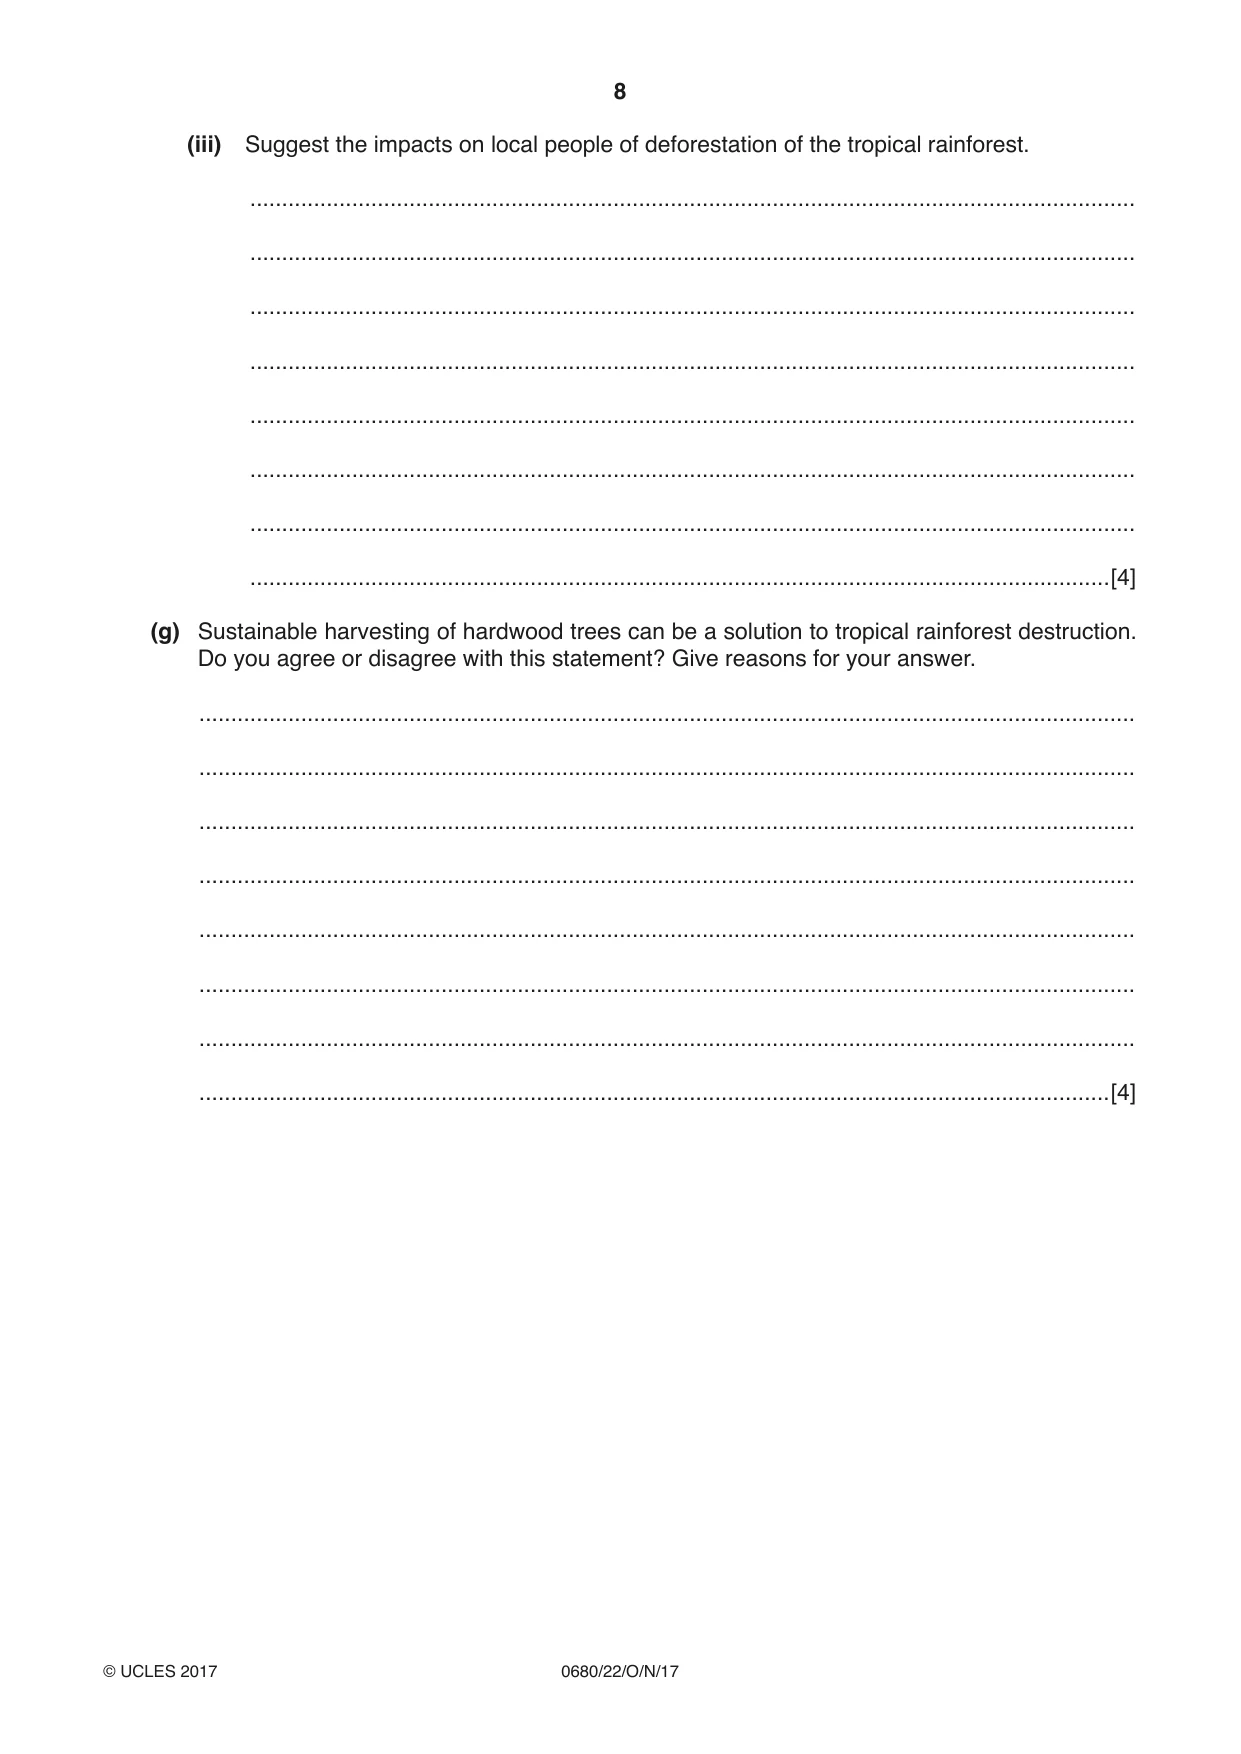
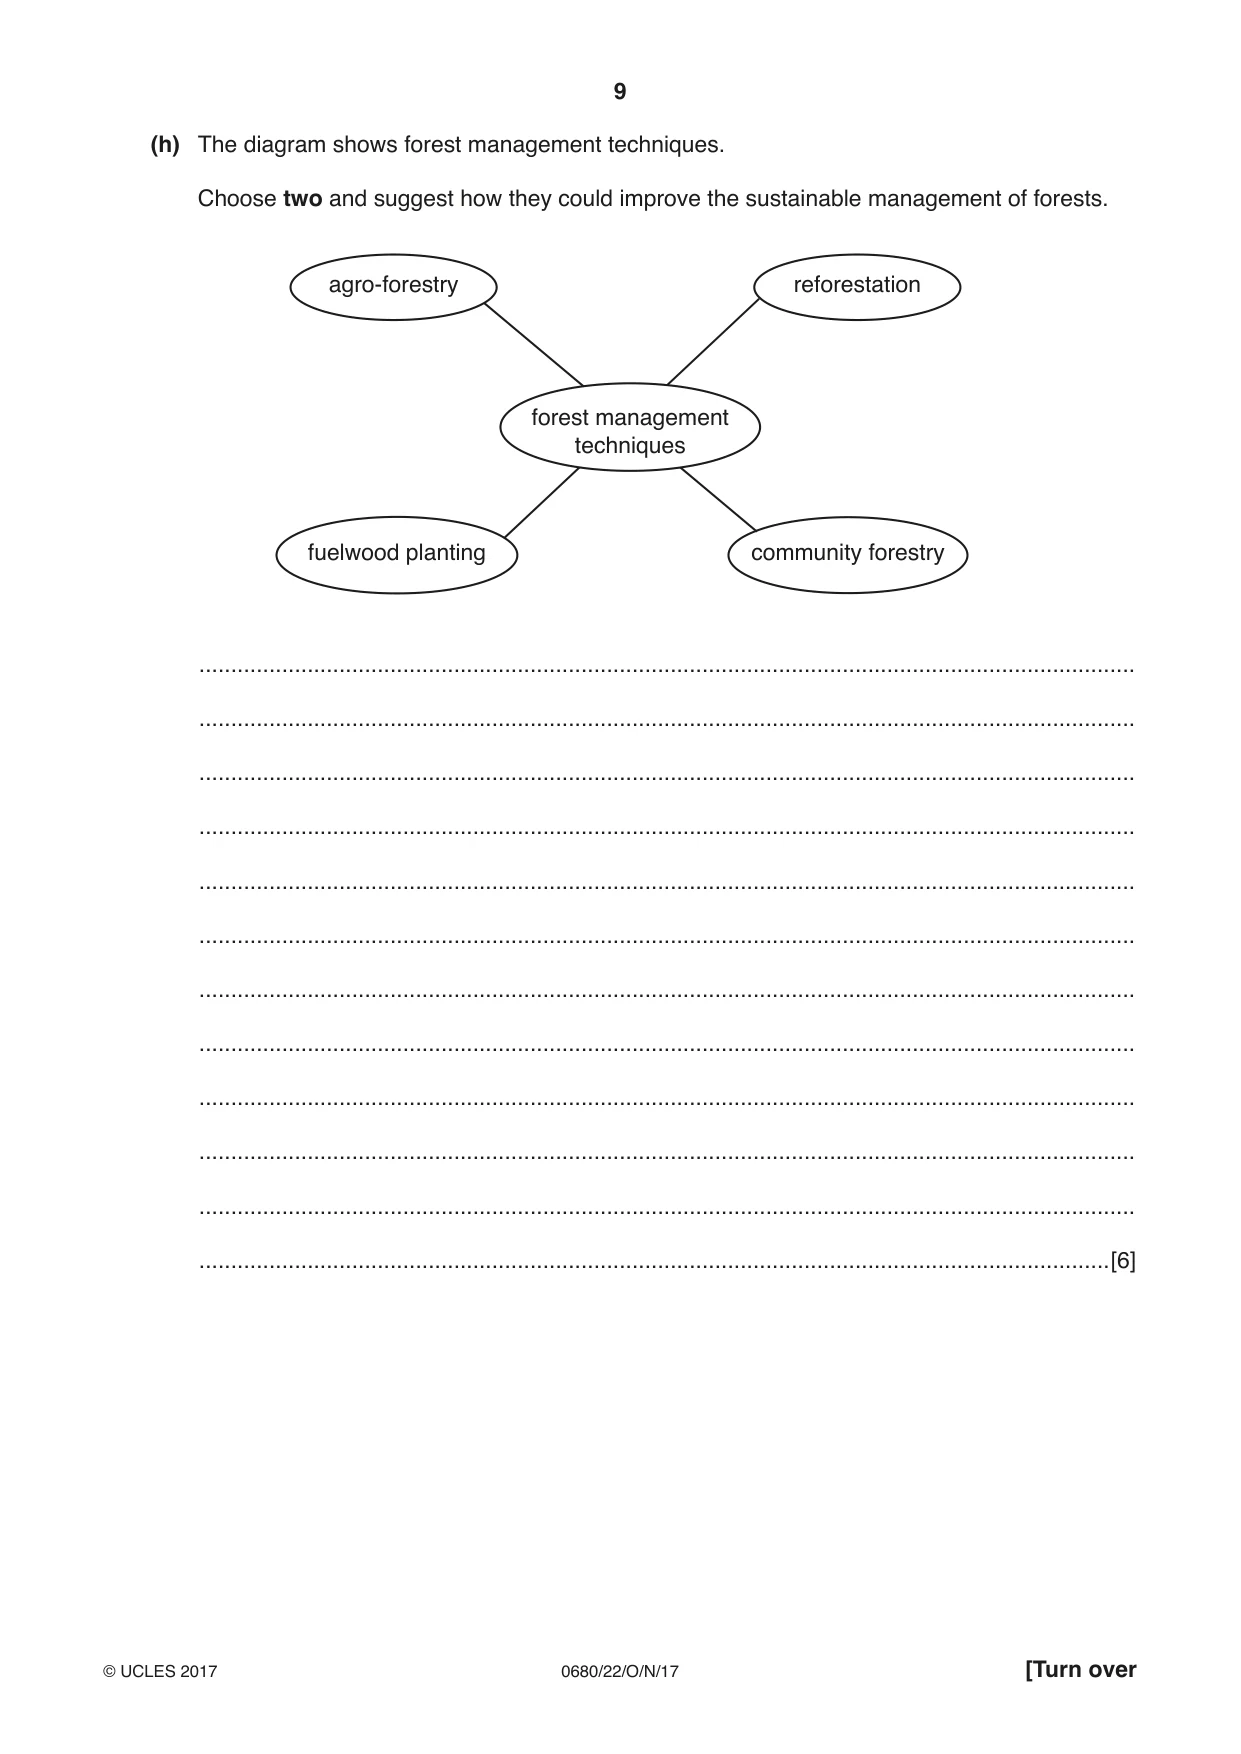
1 (a) The table shows the percentage of the Earth’s land surface covered by some biomes. biome name percentage of Earth’s land surface desert 19 tundra 11 taiga 17 temperate forest 8 savanna 10 tropical rainforest 13 (i) State the biome which covers the largest area of the Earth’s land surface. .......................................................................................................................................[1] (ii) Calculate how much more of the Earth’s land surface is covered by the taiga biome than the tundra biome. ........................................................% [1] (iii) Calculate the total percentage of the Earth’s land surface covered by the taiga, temperate forest and tropical rainforest combined. ........................................................% [1] The map shows the distribution of tropical rainforest. N Asia North Europe America Tropic of Africa Cancer Equator TropicTropic ofof South CancerCapricorn America Australasia Key tropical rainforests (b) Describe the distribution of tropical rainforest as shown on the map. ................................................................................................................................................... ................................................................................................................................................... ................................................................................................................................................... ................................................................................................................................................... ................................................................................................................................................... ...............................................................................................................................................[3] (c) The graph and table show climate information for a weather station in Brazil which has an equatorial climate. (i) Using the information in the table, complete the rainfall graph for January and February. [2] Jan Feb Mar Apr May Jun Jul Aug Sep Oct Nov Dec average temperature 28 29 28 28 29 29 30 31 31 30 29 30 / °C precipitation 380 310 315 240 230 110 110 100 110 100 250 300 / mm 40 30 average temperature 20 / °C 10 400 0 300 200 precipitation / mm 100 0 Jan Feb Mar Apr May Jun Jul Aug Sep Oct Nov Dec month Key temperature precipitation (ii) Using the climate graph and the information in the table, describe the pattern of rainfall throughout the year. ........................................................................................................................................... ........................................................................................................................................... ........................................................................................................................................... .......................................................................................................................................[2] (iii) State a month with the highest average temperature. .......................................................................................................................................[1] (iv) Calculate the annual average temperature range. ...........................°C [1] (d) The diagram shows the layers of the tropical rainforest vegetation. 50 layer X 40 layer Y 30height / m lianas 20 under canopy drip-tip 10 leaves shrub layer buttress roots 0 forest floor (i) State the name of the layer at: X .................................................................. Y .................................................................. [2] (ii) Estimate the height of the tallest tree shown in the diagram. ........................................................m [1] (iii) Explain why rainforest trees have: buttress roots ........................................................................................................................................... ........................................................................................................................................... ........................................................................................................................................... ........................................................................................................................................... drip-tip leaves. ........................................................................................................................................... ........................................................................................................................................... ........................................................................................................................................... ........................................................................................................................................... [4] (e) Many areas of tropical rainforest are being cleared. State three causes of deforestation in tropical rainforests. 1 ................................................................................................................................................ 2 ................................................................................................................................................ 3 ................................................................................................................................................ [3] (f) The table shows information about rainforests in Borneo. percentage of land year covered by rainforest 2010 44 2020 (predicted) 33 (i) Draw a bar graph to show this information. [3] (ii) Calculate the predicted decrease in the percentage of land covered by rainforest in Borneo between 2010 and 2020. .......................................................................................................................................[1] (iii) Suggest the impacts on local people of deforestation of the tropical rainforest. ........................................................................................................................................... ........................................................................................................................................... ........................................................................................................................................... ........................................................................................................................................... ........................................................................................................................................... ........................................................................................................................................... ........................................................................................................................................... .......................................................................................................................................[4] (g) Sustainable harvesting of hardwood trees can be a solution to tropical rainforest destruction. Do you agree or disagree with this statement? Give reasons for your answer. ................................................................................................................................................... ................................................................................................................................................... ................................................................................................................................................... ................................................................................................................................................... ................................................................................................................................................... ................................................................................................................................................... ................................................................................................................................................... ...............................................................................................................................................[4] (h) The diagram shows forest management techniques. Choose two and suggest how they could improve the sustainable management of forests. agro-forestry reforestation forest management techniques fuelwood planting community forestry ................................................................................................................................................... ................................................................................................................................................... ................................................................................................................................................... ................................................................................................................................................... ................................................................................................................................................... ................................................................................................................................................... ................................................................................................................................................... ................................................................................................................................................... ................................................................................................................................................... ................................................................................................................................................... ................................................................................................................................................... ...............................................................................................................................................[6]
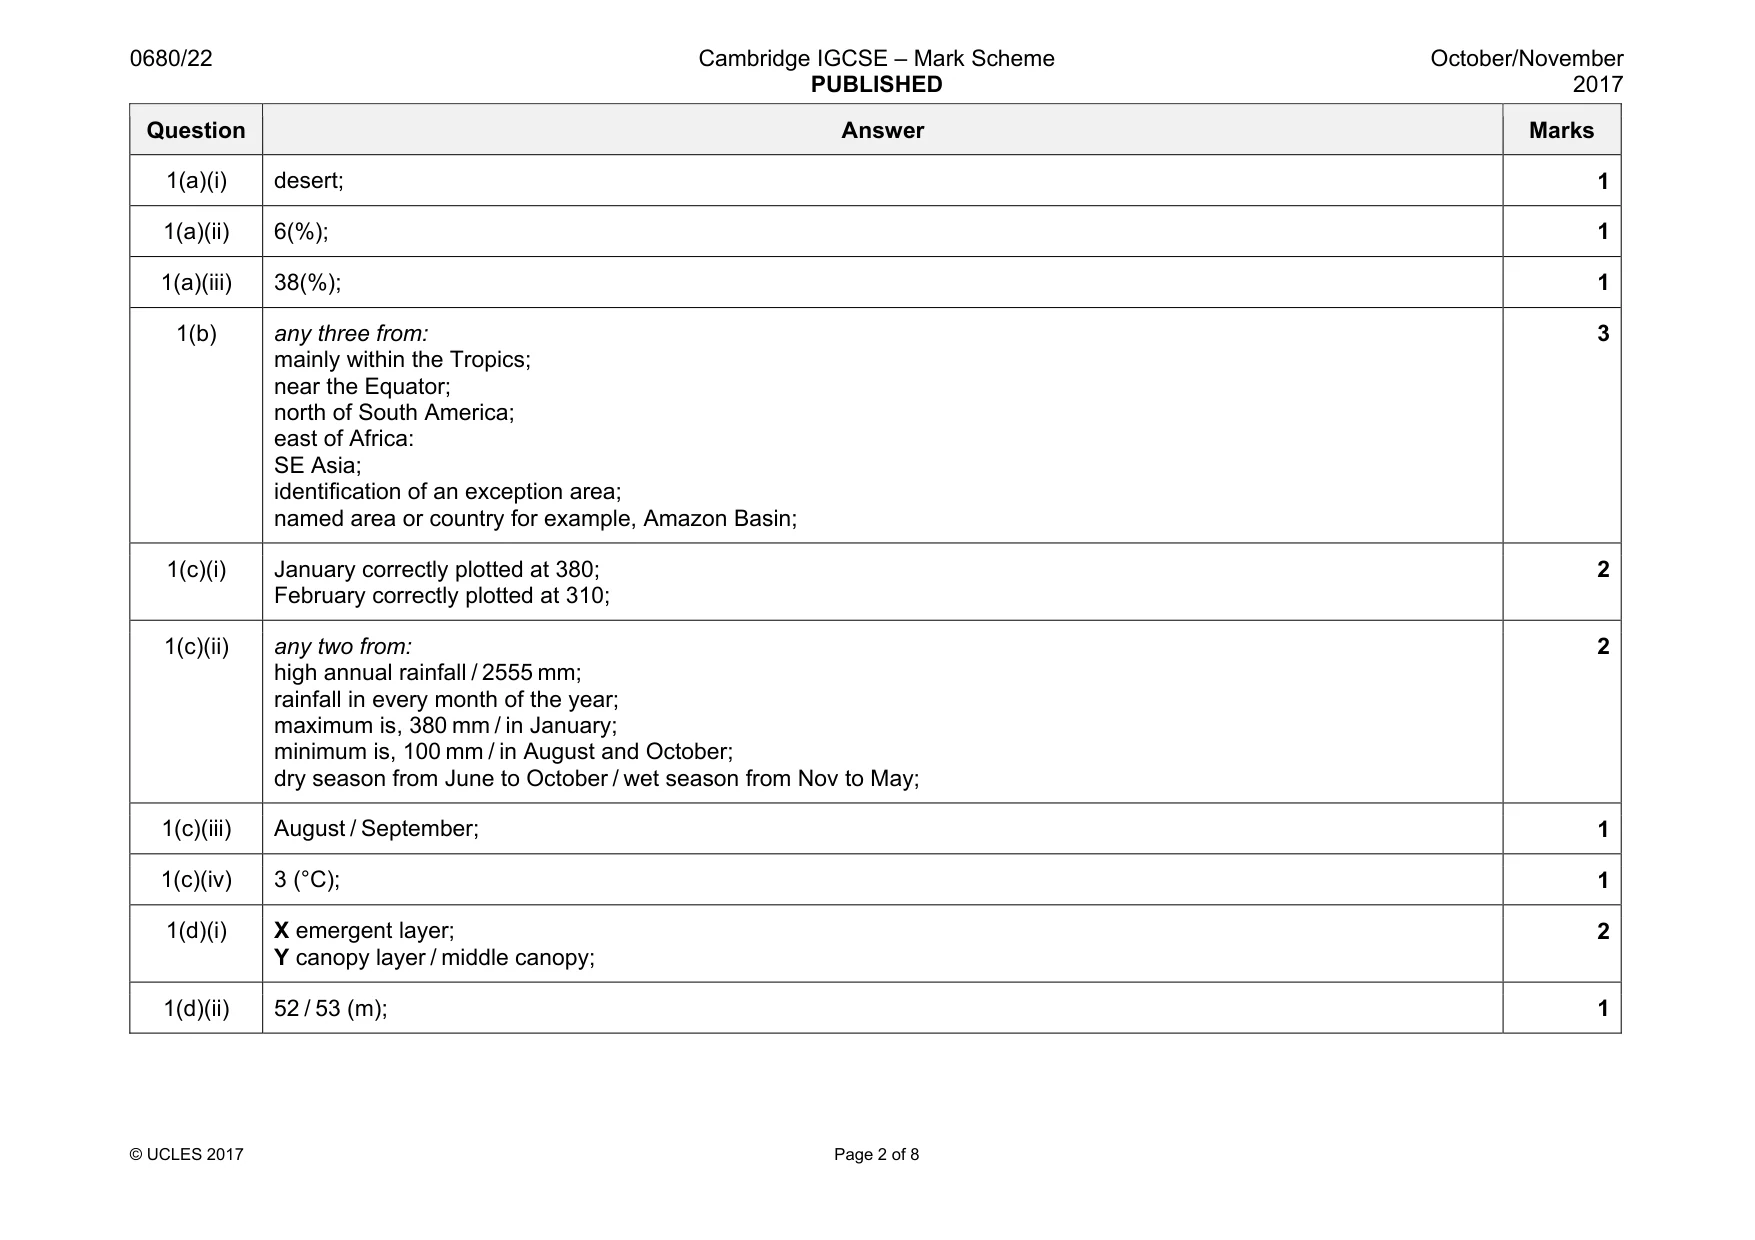
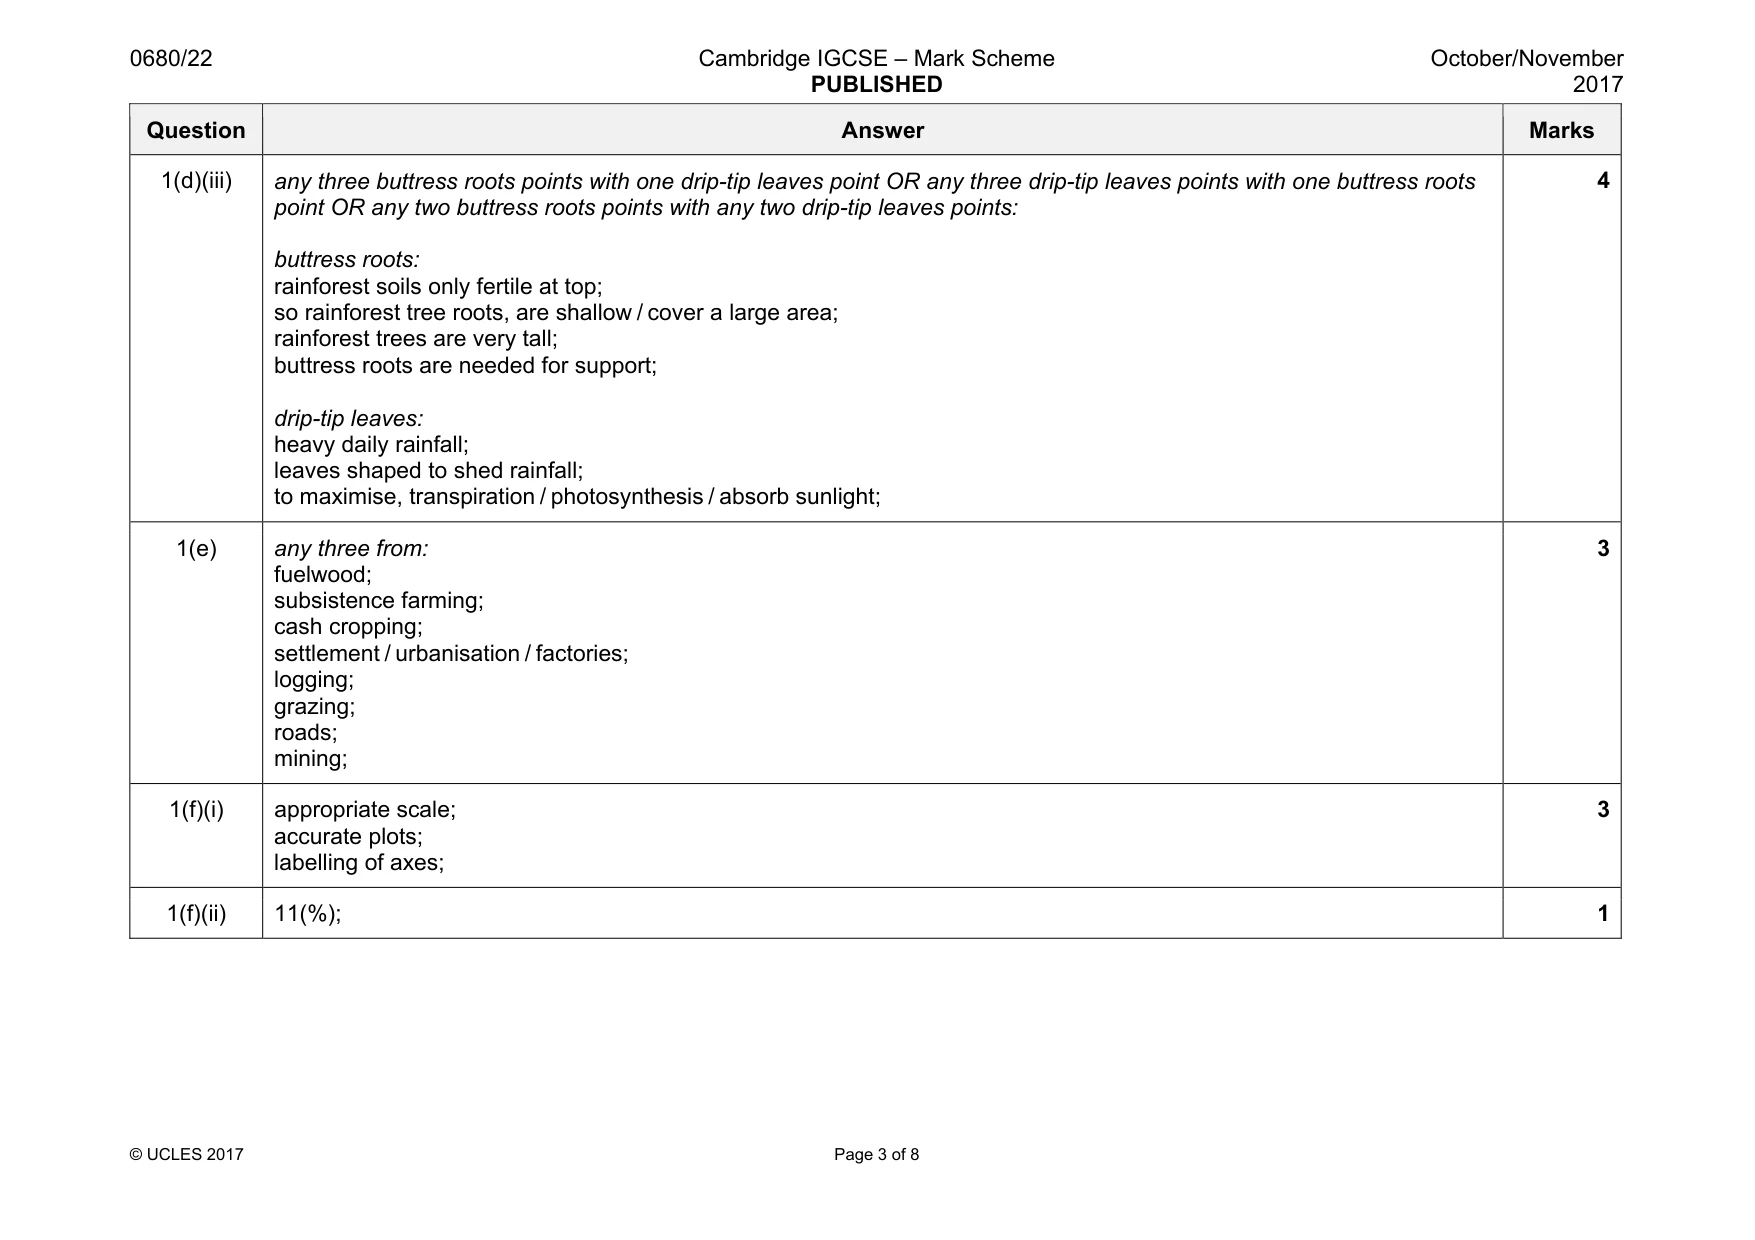
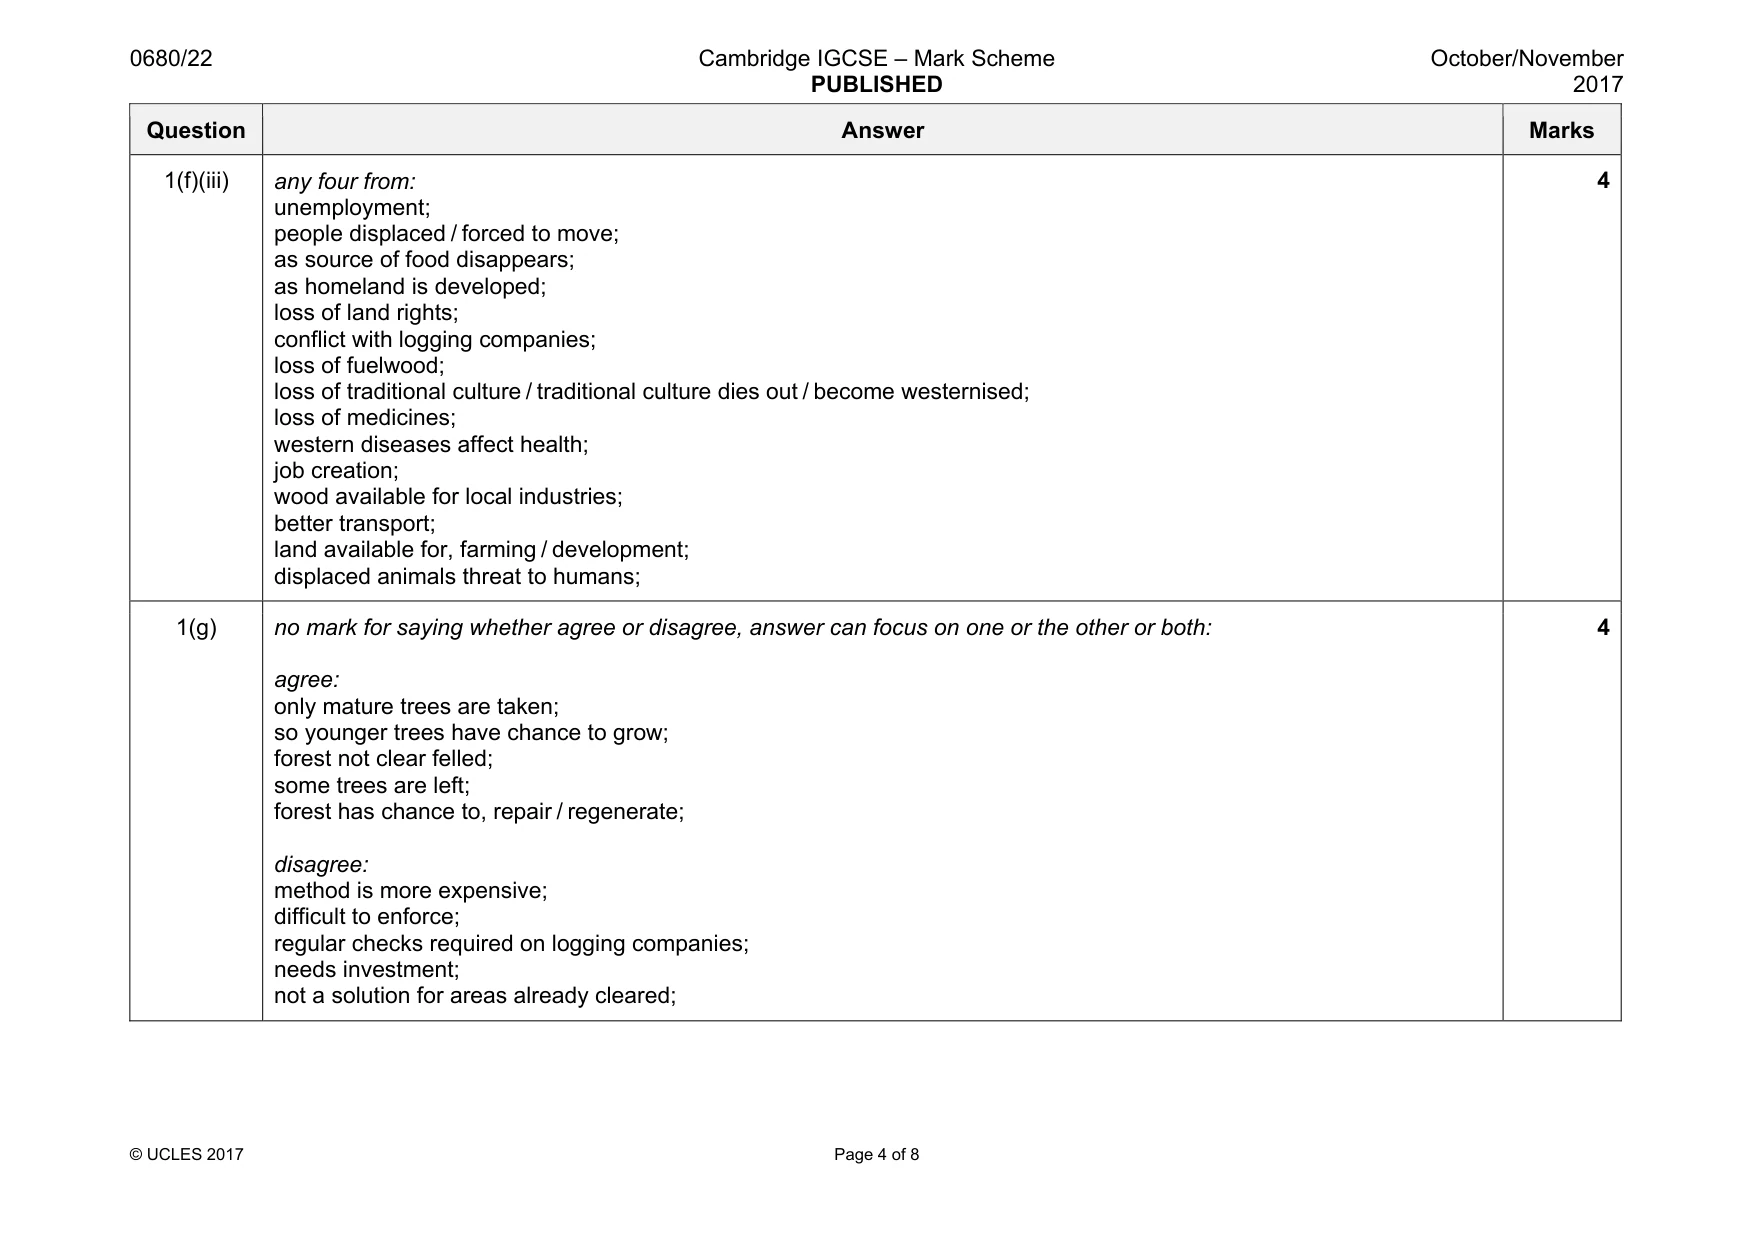
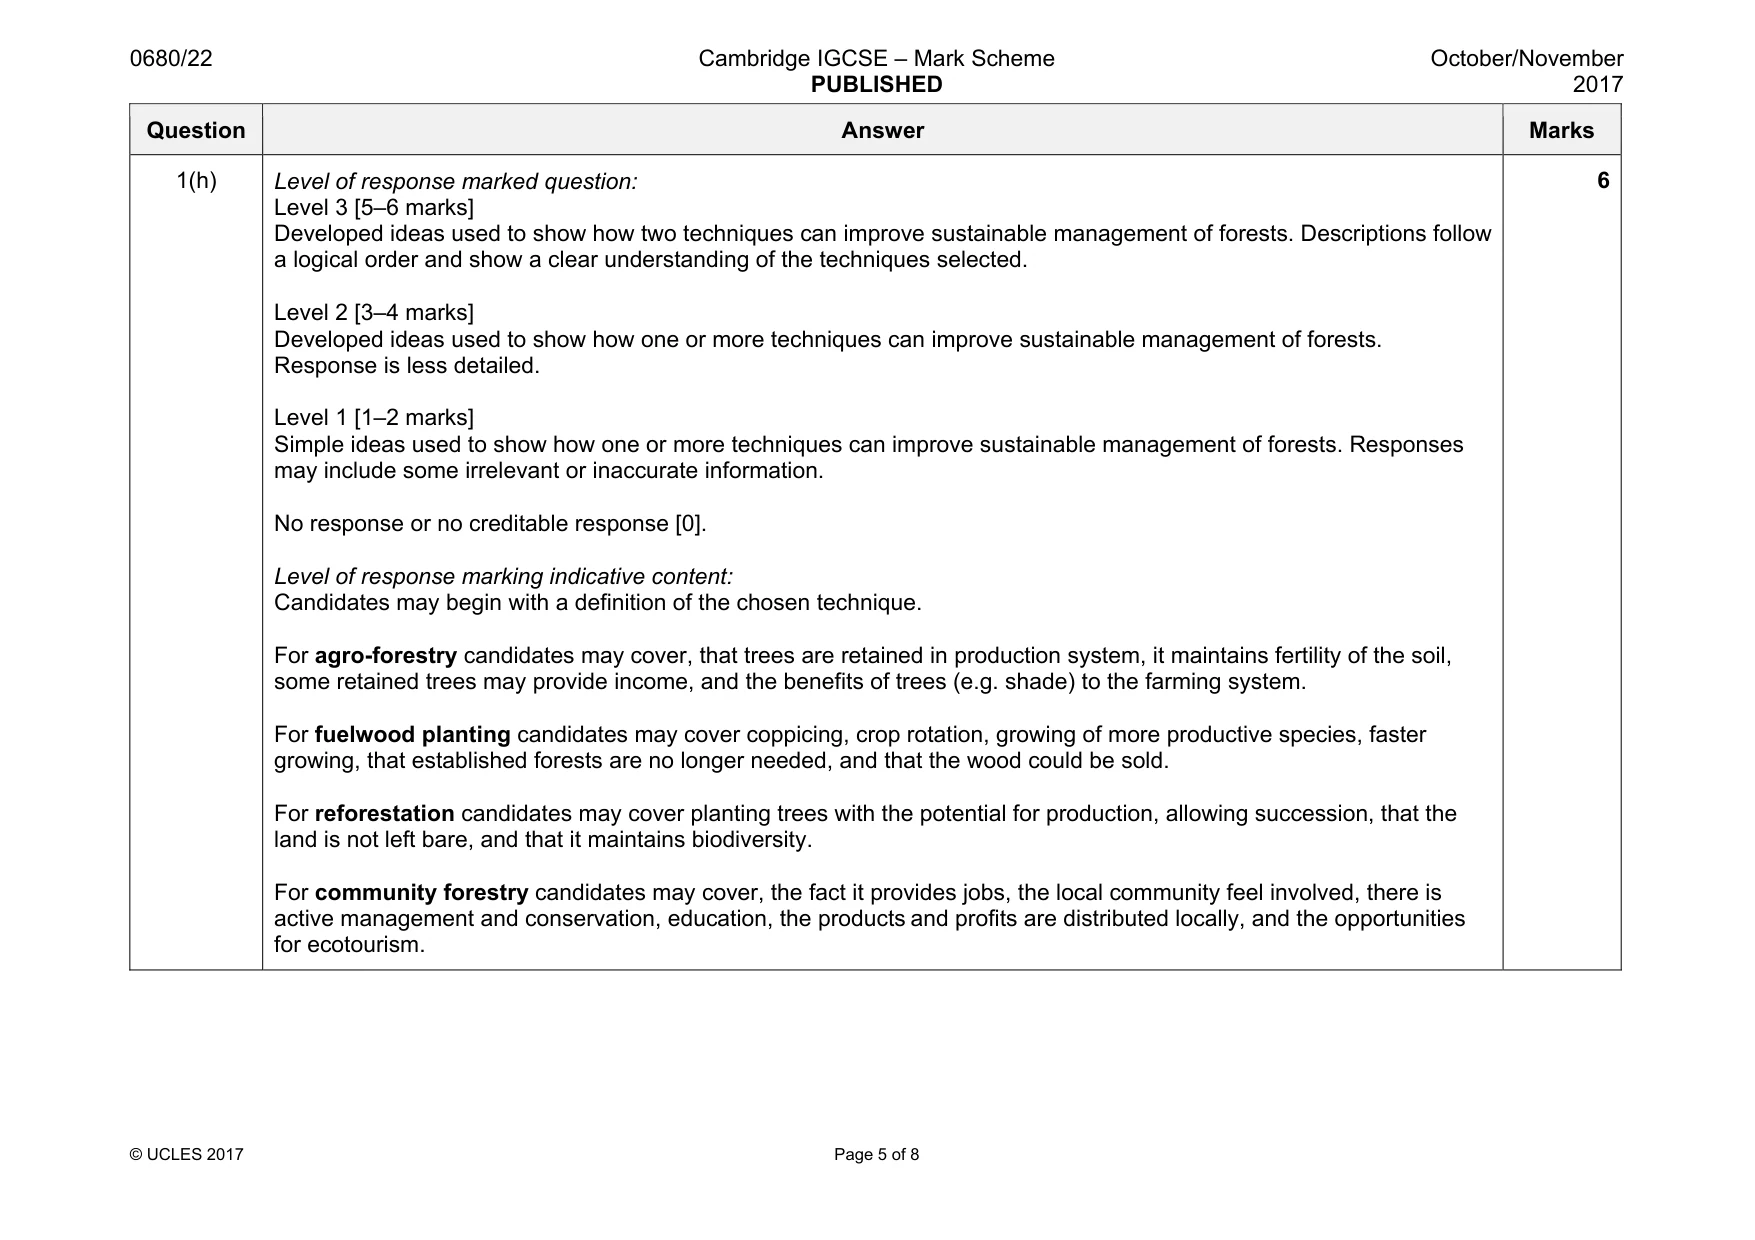
Mark scheme: 1(a)(i) desert; 1 1(a)(ii) 6(%); 1 1(a)(iii) 38(%); 1 1(b) any three from: mainly within the Tropics; near the Equator; north of South America; east of Africa: SE Asia; identification of an exception area; named area or country for example, Amazon Basin; 3 1(c)(i) January correctly plotted at 380; February correctly plotted at 310; 2 1(c)(ii) any two from: high annual rainfall / 2555 mm; rainfall in every month of the year; maximum is, 380 mm / in January; minimum is, 100 mm / in August and October; dry season from June to October / wet season from Nov to May; 2 1(c)(iii) August / September; 1 1(c)(iv) 3 (°C); 1 1(d)(i) X emergent layer; Y canopy layer / middle canopy; 2 1(d)(ii) 52 / 53 (m); 1 Question Answer Marks 1(d)(iii) any three buttress roots points with one drip-tip leaves point OR any three drip-tip leaves points with one buttress roots point OR any two buttress roots points with any two drip-tip leaves points: buttress roots: rainforest soils only fertile at top; so rainforest tree roots, are shallow / cover a large area; rainforest trees are very tall; buttress roots are needed for support; drip-tip leaves: heavy daily rainfall; leaves shaped to shed rainfall; to maximise, transpiration / photosynthesis / absorb sunlight; 4 1(e) any three from: fuelwood; subsistence farming; cash cropping; settlement / urbanisation / factories; logging; grazing; roads; mining; 3 1(f)(i) appropriate scale; accurate plots; labelling of axes; 3 1(f)(ii) 11(%); 1 Question Answer Marks 1(f)(iii) any four from: unemployment; people displaced / forced to move; as source of food disappears; as homeland is developed; loss of land rights; conflict with logging companies; loss of fuelwood; loss of traditional culture / traditional culture dies out / become westernised; loss of medicines; western diseases affect health; job creation; wood available for local industries; better transport; land available for, farming / development; displaced animals threat to humans; 4 1(g) no mark for saying whether agree or disagree, answer can focus on one or the other or both: agree: only mature trees are taken; so younger trees have chance to grow; forest not clear felled; some trees are left; forest has chance to, repair / regenerate; disagree: method is more expensive; difficult to enforce; regular checks required on logging companies; needs investment; not a solution for areas already cleared; 4 Question Answer Marks 1(h) Level of response marked question: Level 3 [5–6 marks] Developed ideas used to show how two techniques can improve sustainable management of forests. Descriptions follow a logical order and show a clear understanding of the techniques selected. Level 2 [3–4 marks] Developed ideas used to show how one or more techniques can improve sustainable management of forests. Response is less detailed. Level 1 [1–2 marks] Simple ideas used to show how one or more techniques can improve sustainable management of forests. Responses may include some irrelevant or inaccurate information. No response or no creditable response [0]. Level of response marking indicative content: Candidates may begin with a definition of the chosen technique. For agro-forestry candidates may cover, that trees are retained in production system, it maintains fertility of the soil, some retained trees may provide income, and the benefits of trees (e.g. shade) to the farming system. For fuelwood planting candidates may cover coppicing, crop rotation, growing of more productive species, faster growing, that established forests are no longer needed, and that the wood could be sold. For reforestation candidates may cover planting trees with the potential for production, allowing succession, that the land is not left bare, and that it maintains biodiversity. For community forestry candidates may cover, the fact it provides jobs, the local community feel involved, there is active management and conservation, education, the products and profits are distributed locally, and the opportunities for ecotourism. 6
Question 2
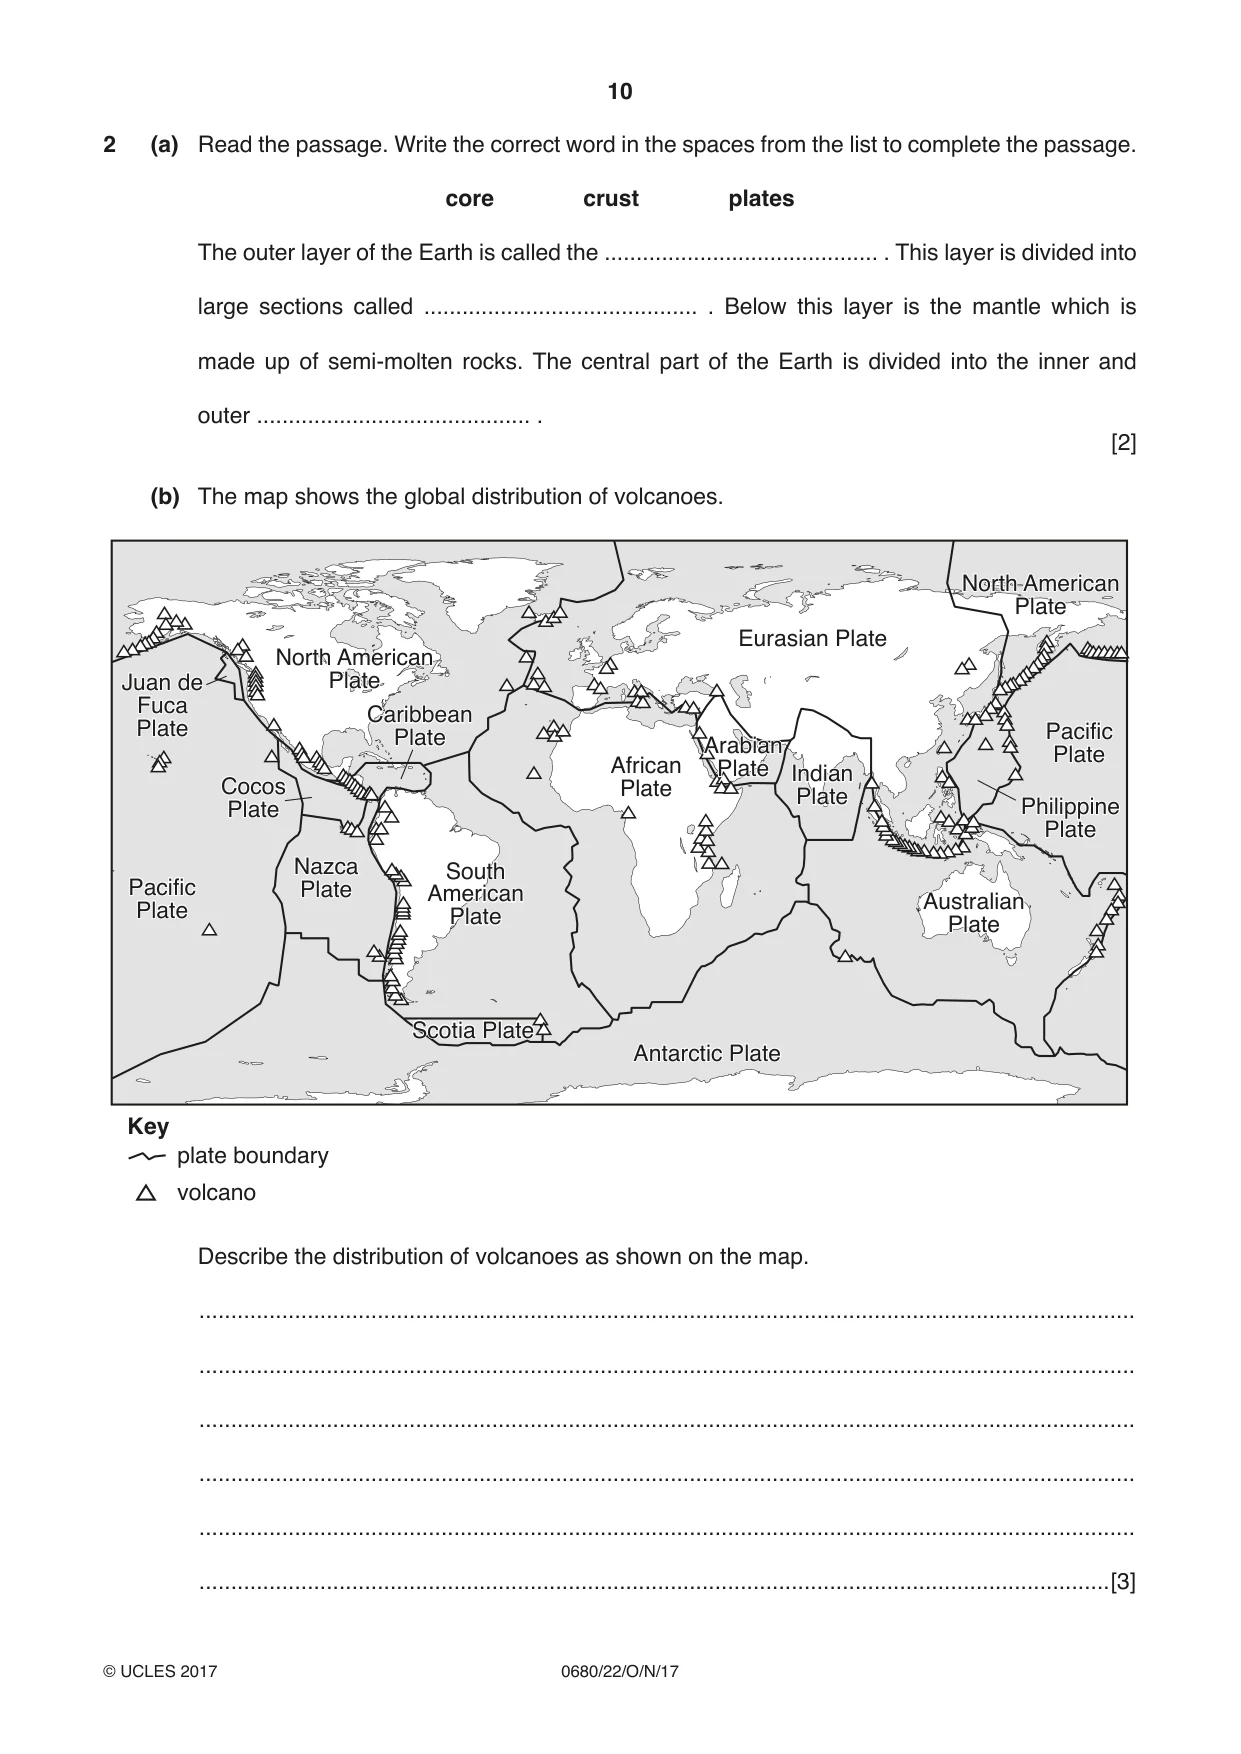
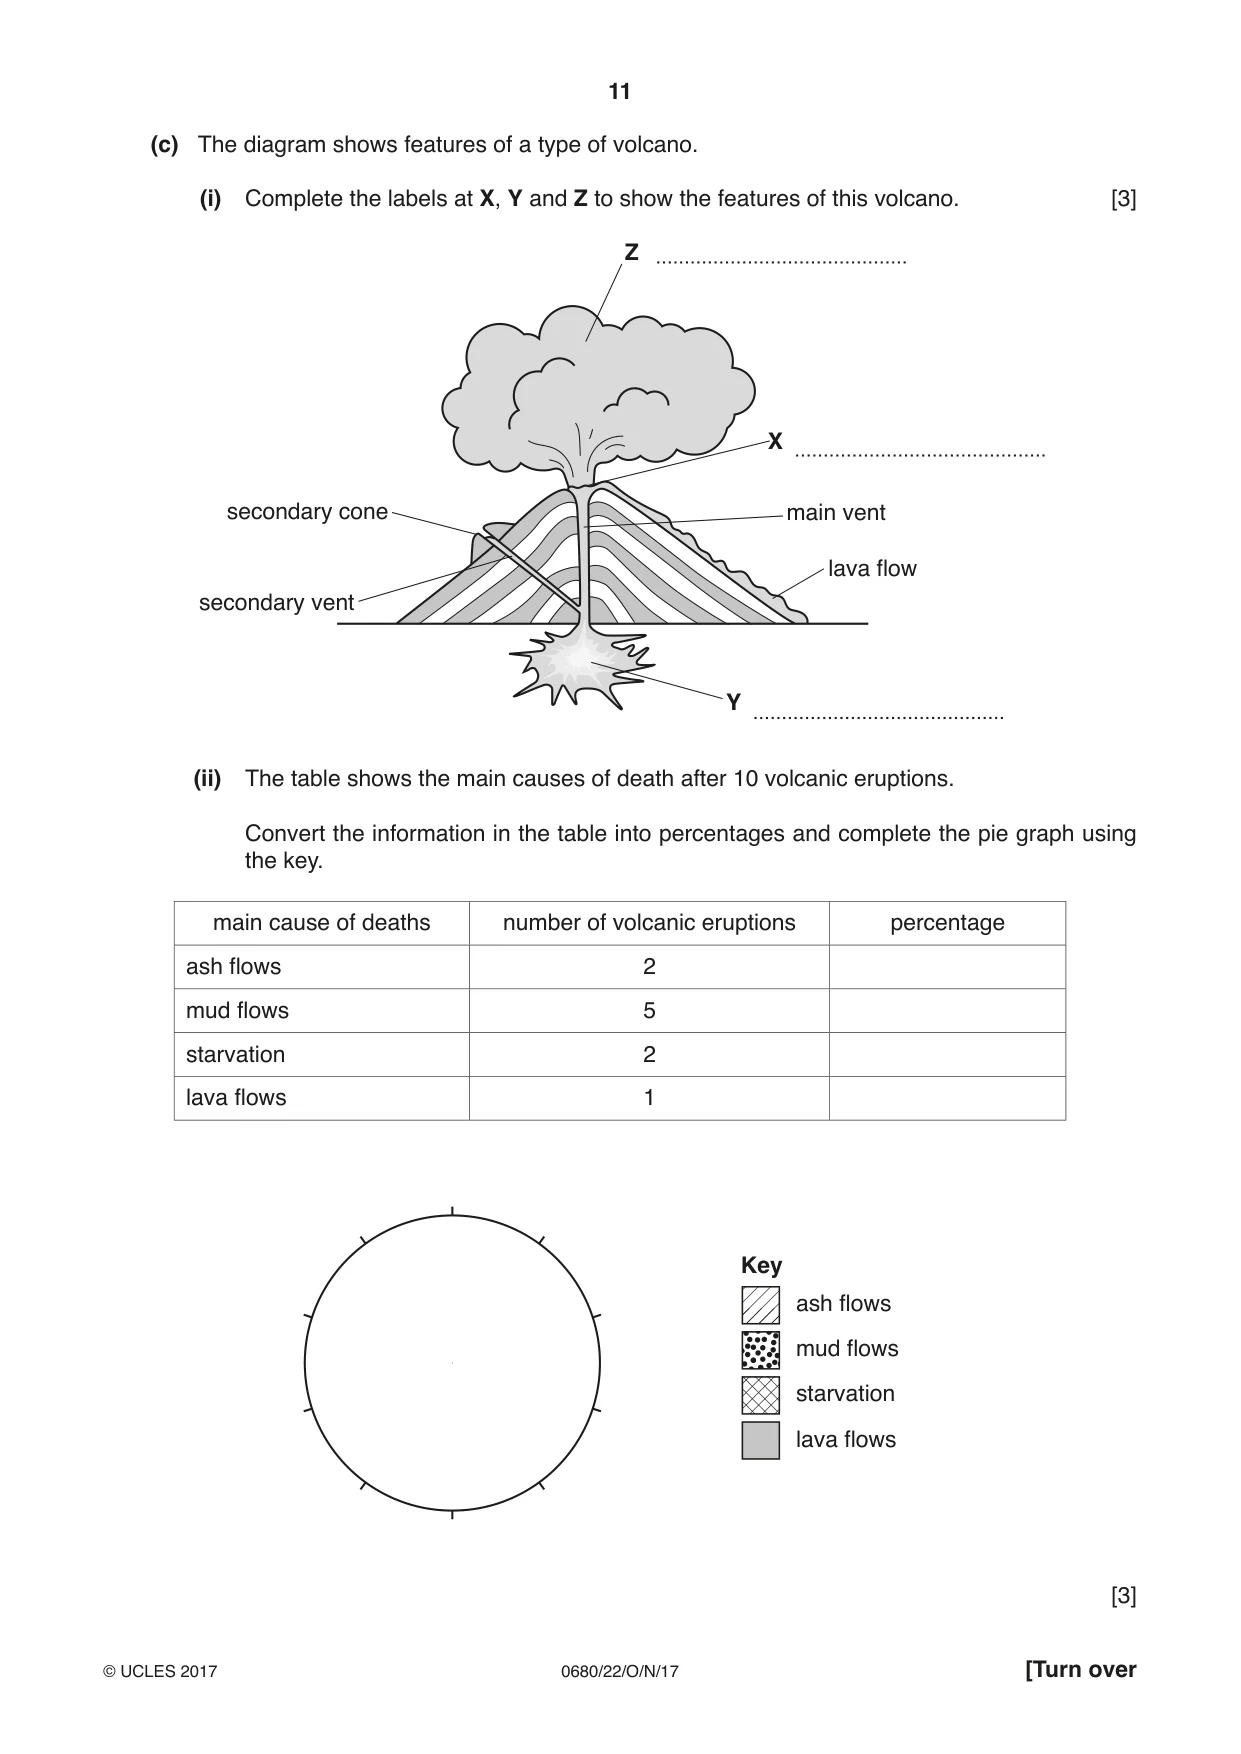
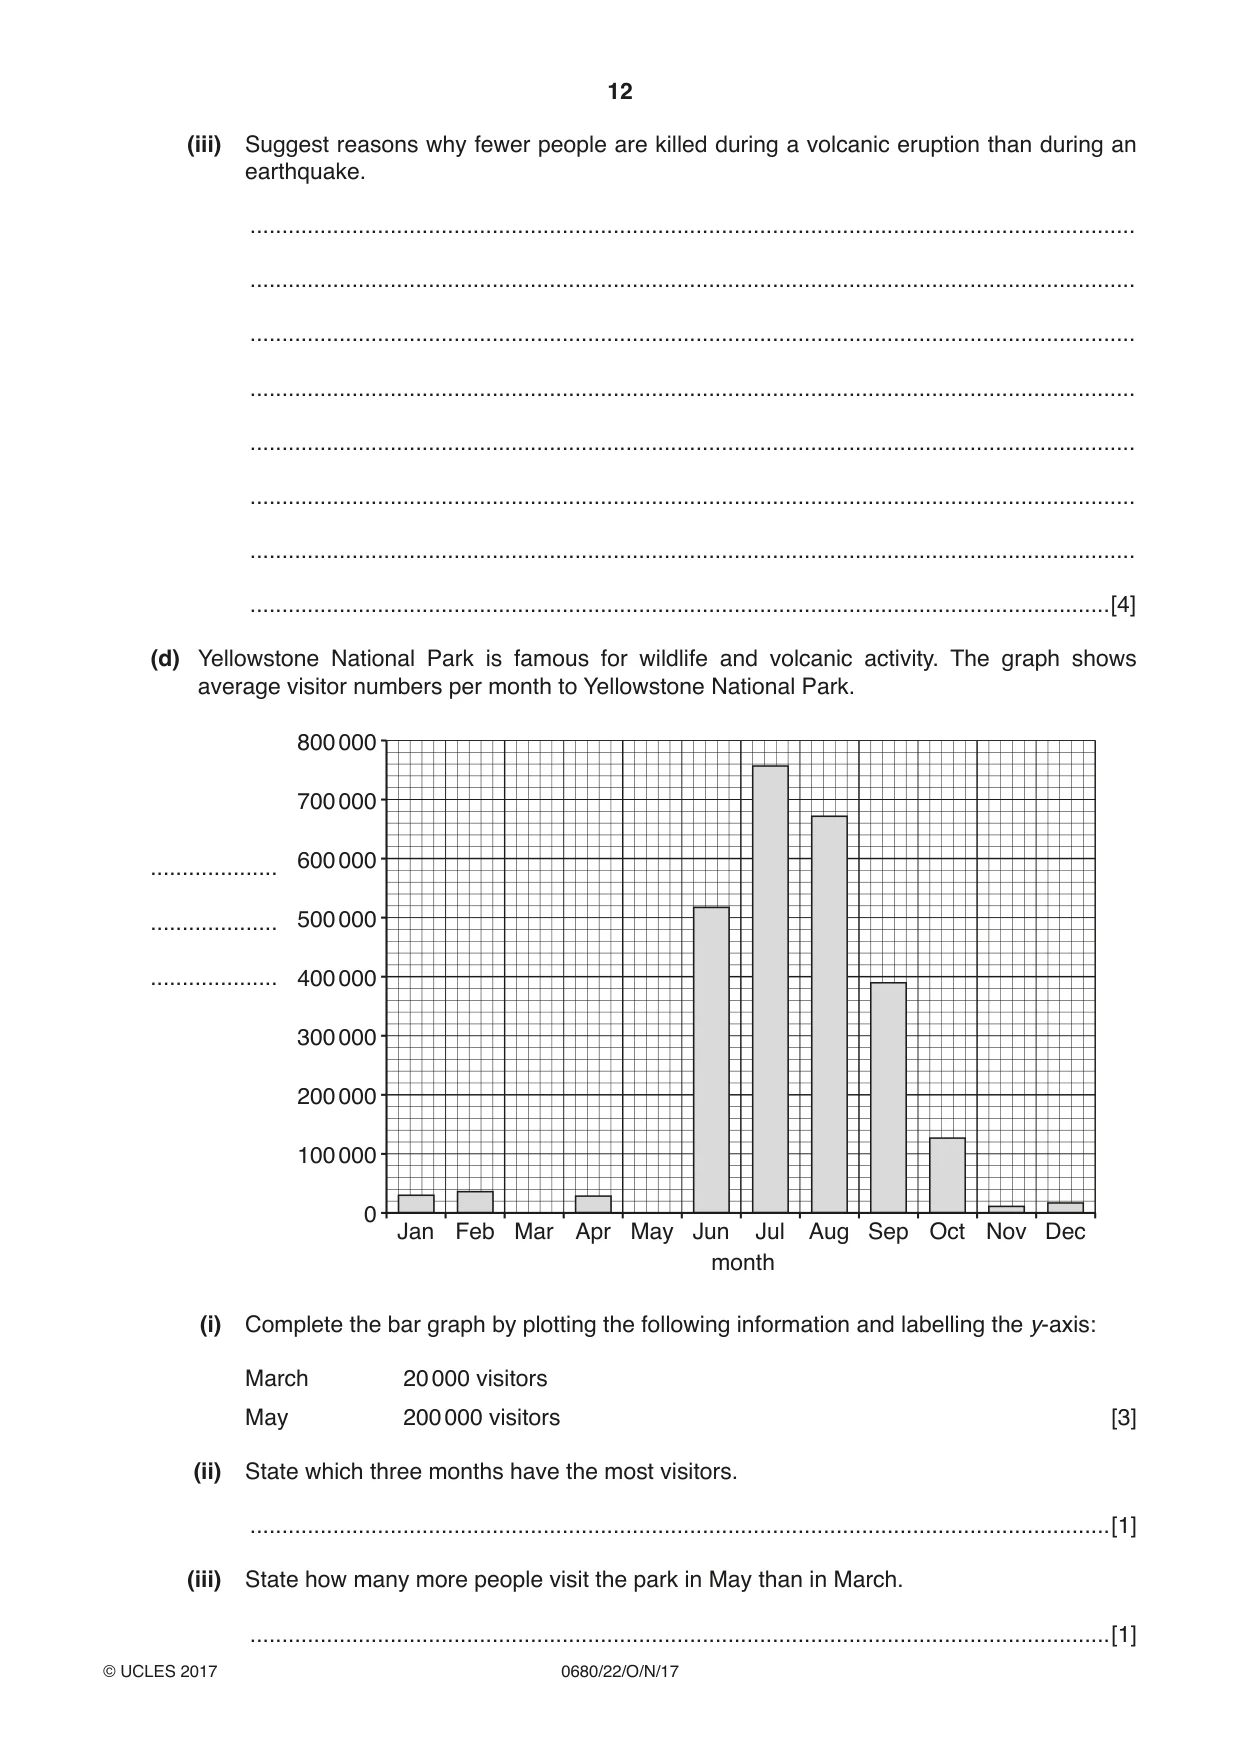
2 (a) Read the passage. Write the correct word in the spaces from the list to complete the passage. core crust plates The outer layer of the Earth is called the ........................................... . This layer is divided into large sections called ........................................... . Below this layer is the mantle which is made up of semi-molten rocks. The central part of the Earth is divided into the inner and outer ........................................... . [2] (b) The map shows the global distribution of volcanoes. North American Plate Eurasian Plate North American Juan de Plate Fuca Caribbean Plate Pacific Plate Arabian Plate African Plate Indian Cocos Plate Plate Plate Philippine Plate Nazca South Pacific Plate American Australian Plate Plate Plate Scotia Plate Antarctic Plate Key plate boundary volcano Describe the distribution of volcanoes as shown on the map. ................................................................................................................................................... ................................................................................................................................................... ................................................................................................................................................... ................................................................................................................................................... ................................................................................................................................................... ...............................................................................................................................................[3] (c) The diagram shows features of a type of volcano. (i) Complete the labels at X, Y and Z to show the features of this volcano. [3] Z X secondary cone main vent lava flow secondary vent Y (ii) The table shows the main causes of death after 10 volcanic eruptions. Convert the information in the table into percentages and complete the pie graph using the key. main cause of deaths number of volcanic eruptions percentage ash flows 2 mud flows 5 starvation 2 lava flows 1 Key ash flows mud flows starvation lava flows [3] (iii) Suggest reasons why fewer people are killed during a volcanic eruption than during an earthquake. ........................................................................................................................................... ........................................................................................................................................... ........................................................................................................................................... ........................................................................................................................................... ........................................................................................................................................... ........................................................................................................................................... ........................................................................................................................................... .......................................................................................................................................[4] (d) Yellowstone National Park is famous for wildlife and volcanic activity. The graph shows average visitor numbers per month to Yellowstone National Park. 800 000 700 000 600 000.................... .................... 500 000 .................... 400 000 300 000 200 000 100 000 0 Jan Feb Mar Apr May Jun Jul Aug Sep Oct Nov Dec month (i) Complete the bar graph by plotting the following information and labelling the y-axis: March 20 000 visitors May 200 000 visitors [3] (ii) State which three months have the most visitors. .......................................................................................................................................[1] (iii) State how many more people visit the park in May than in March.
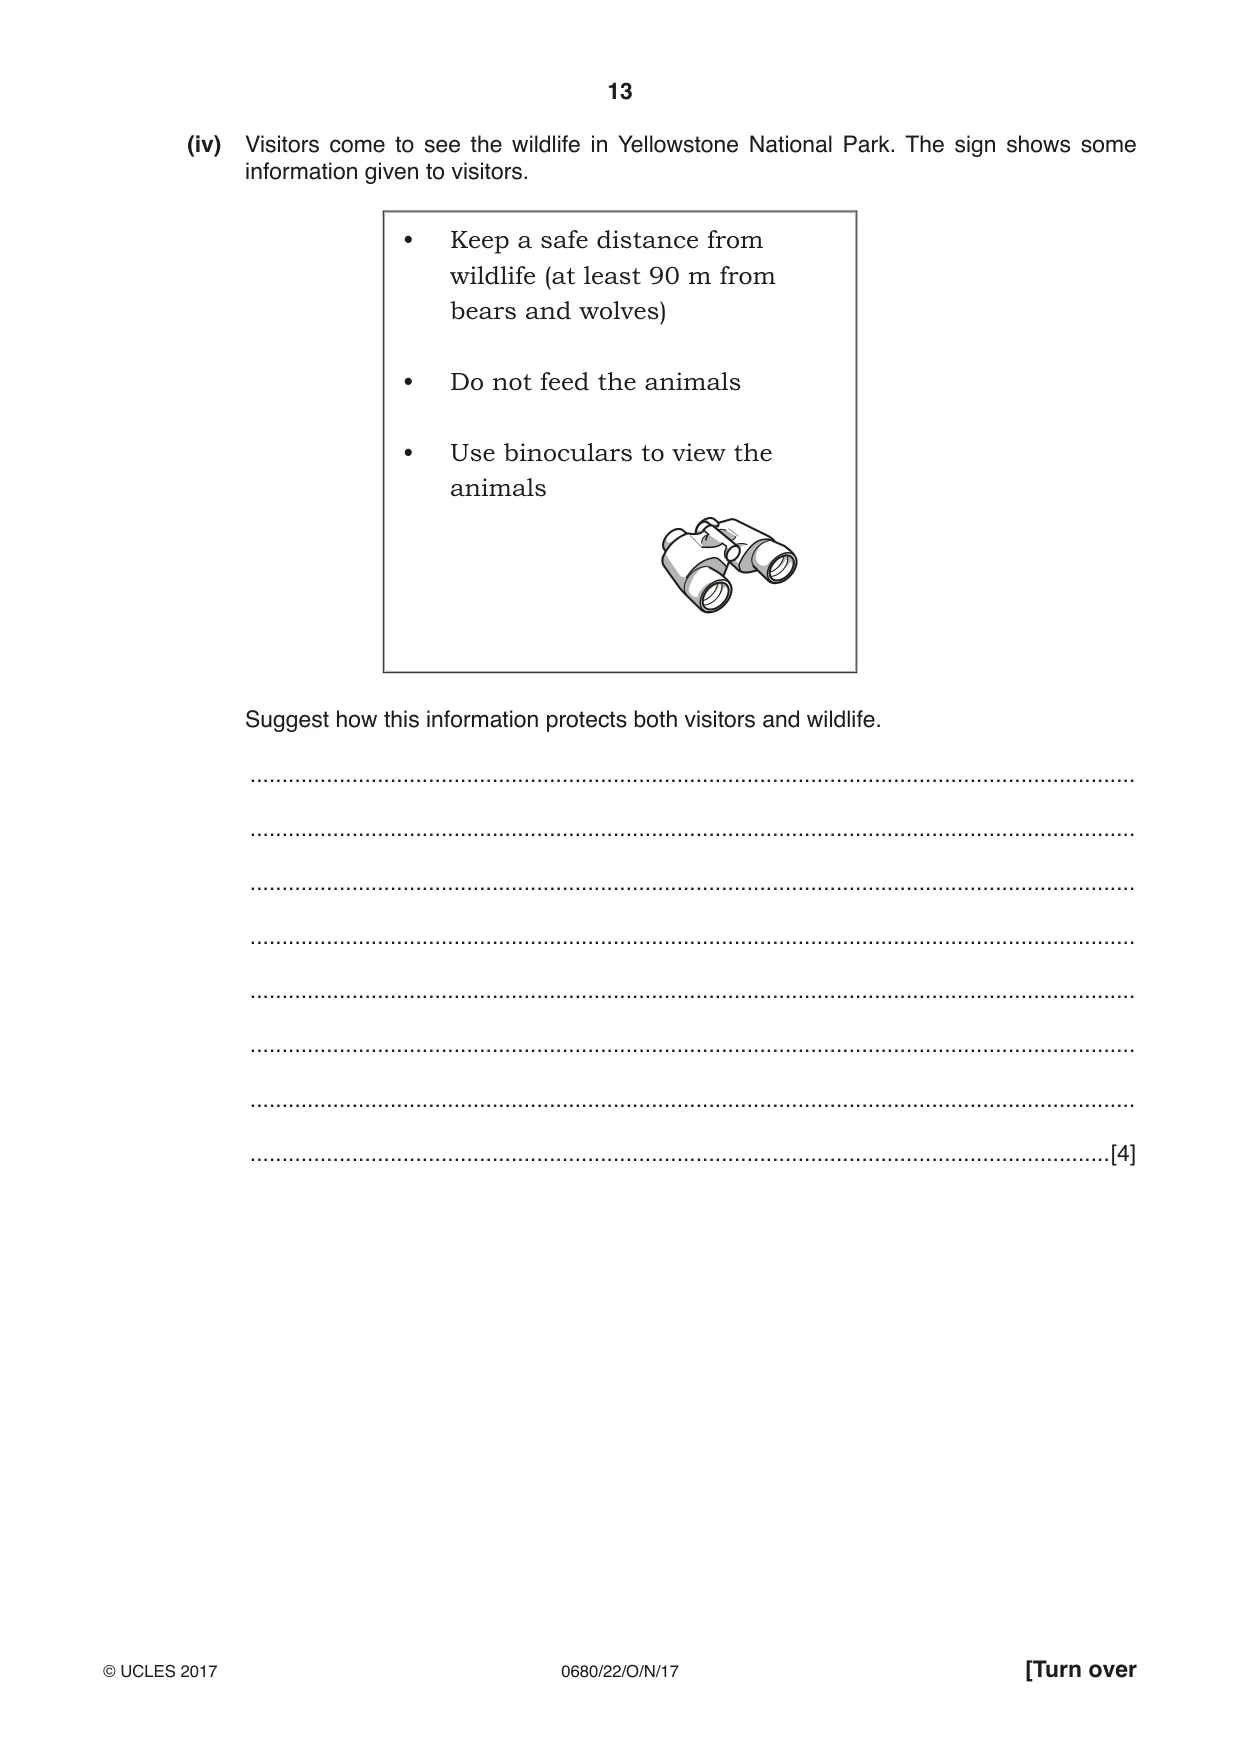
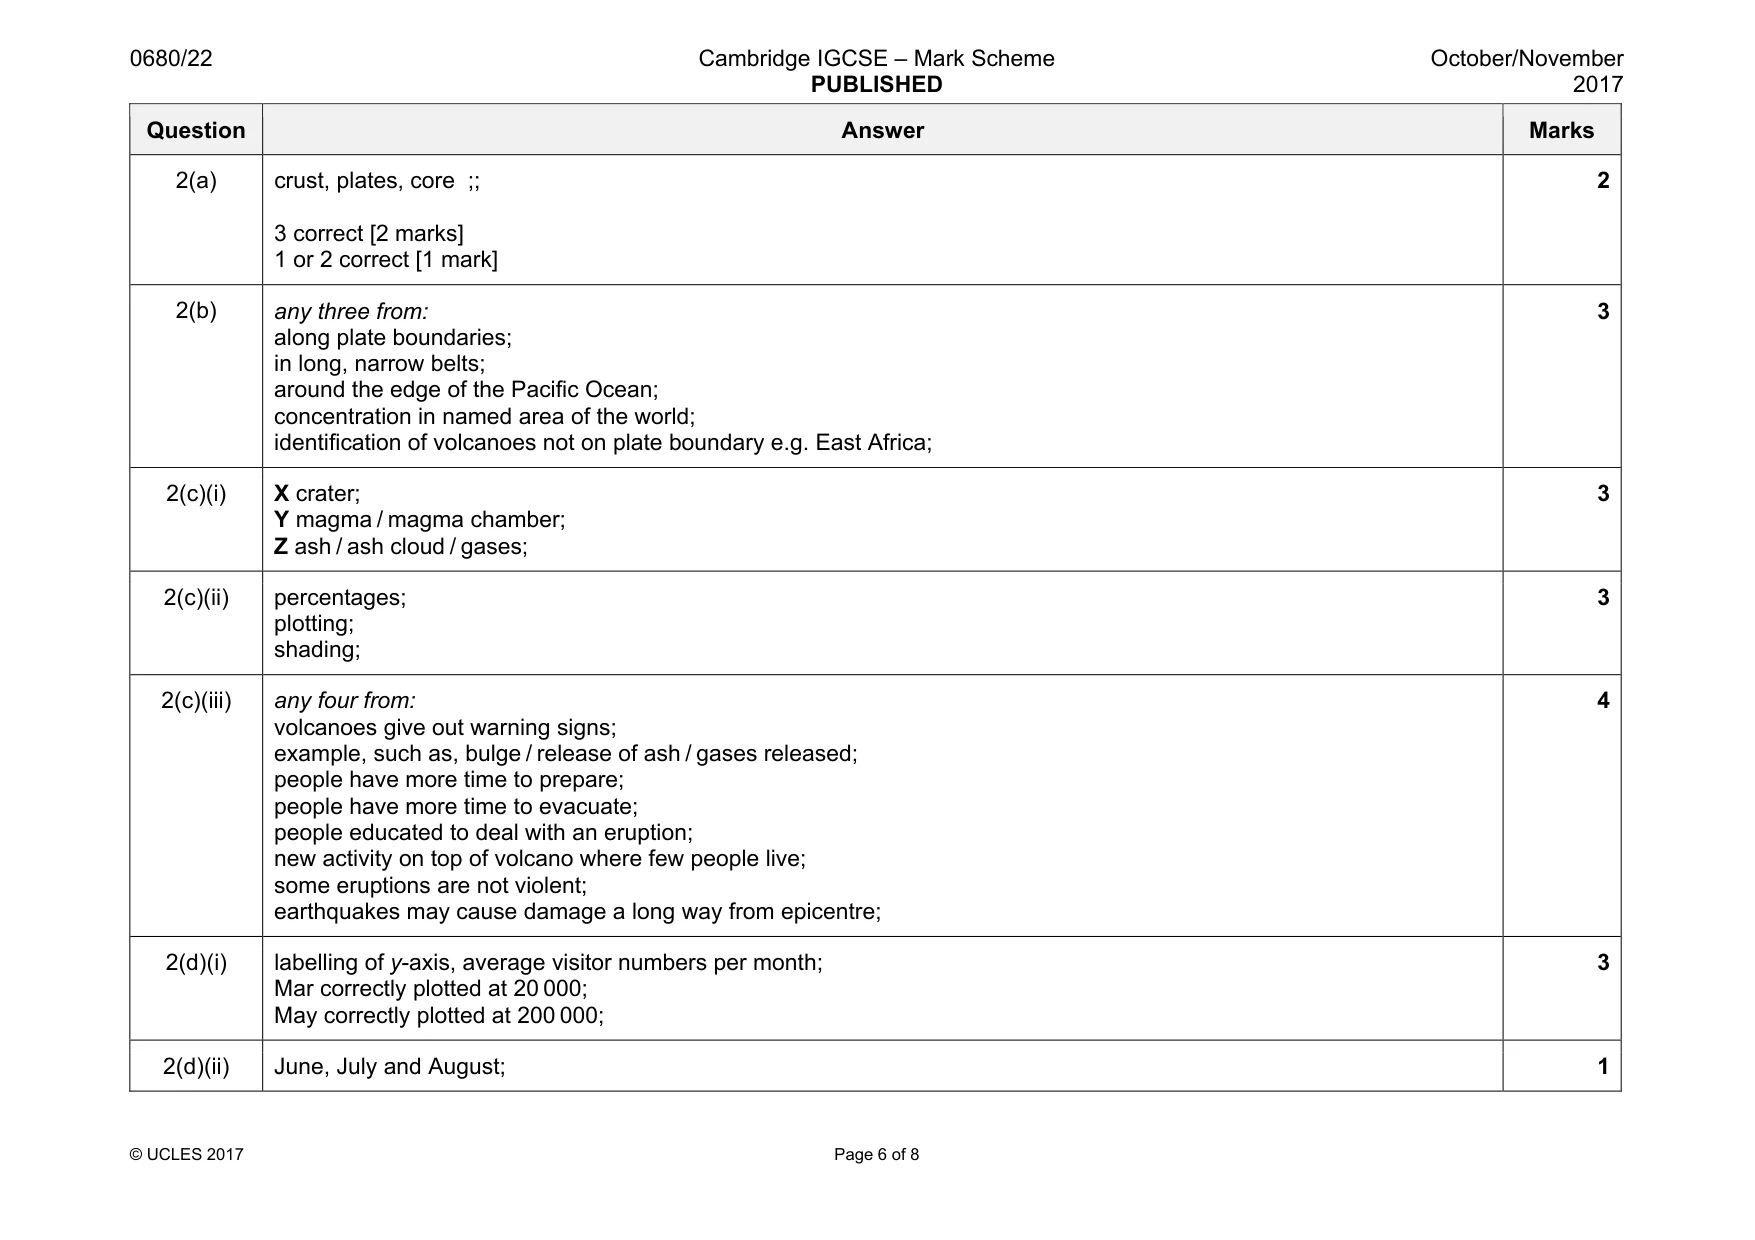
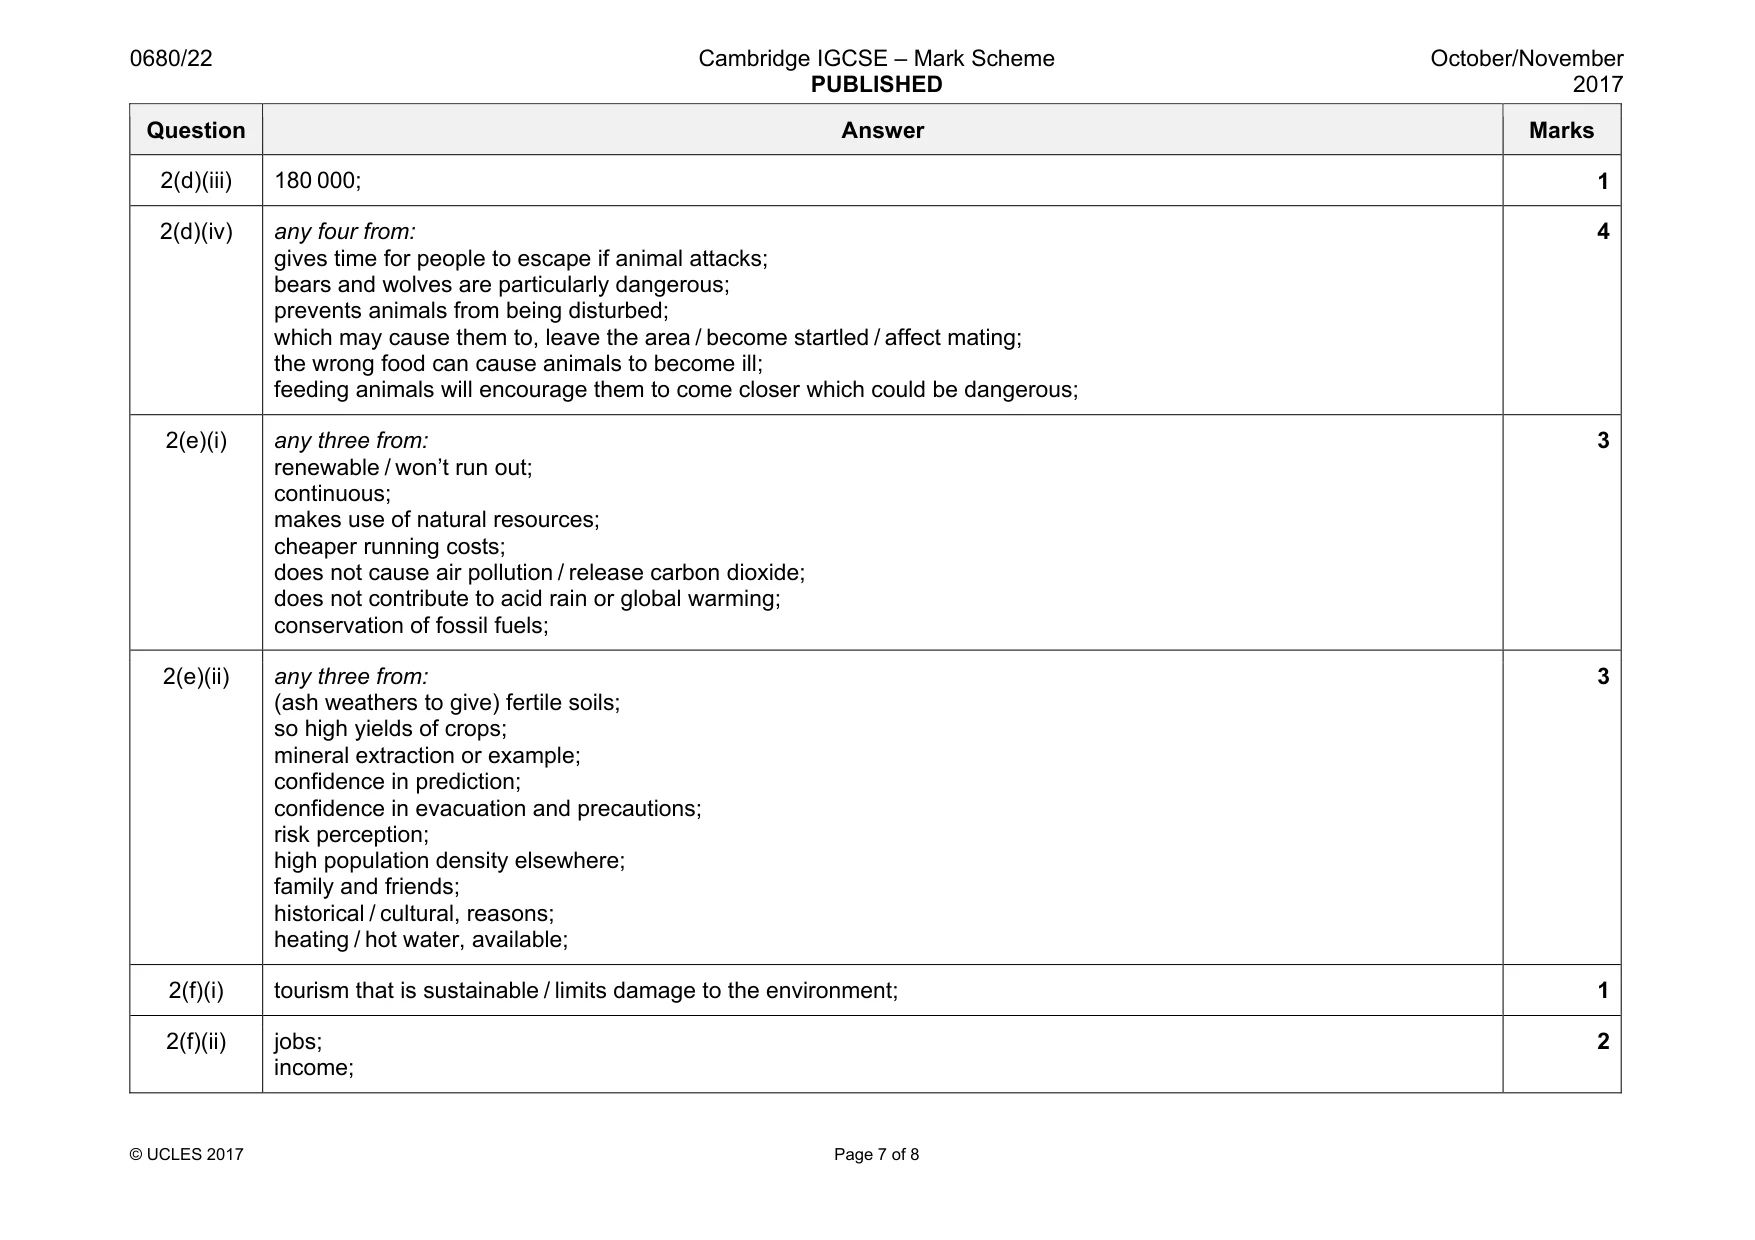
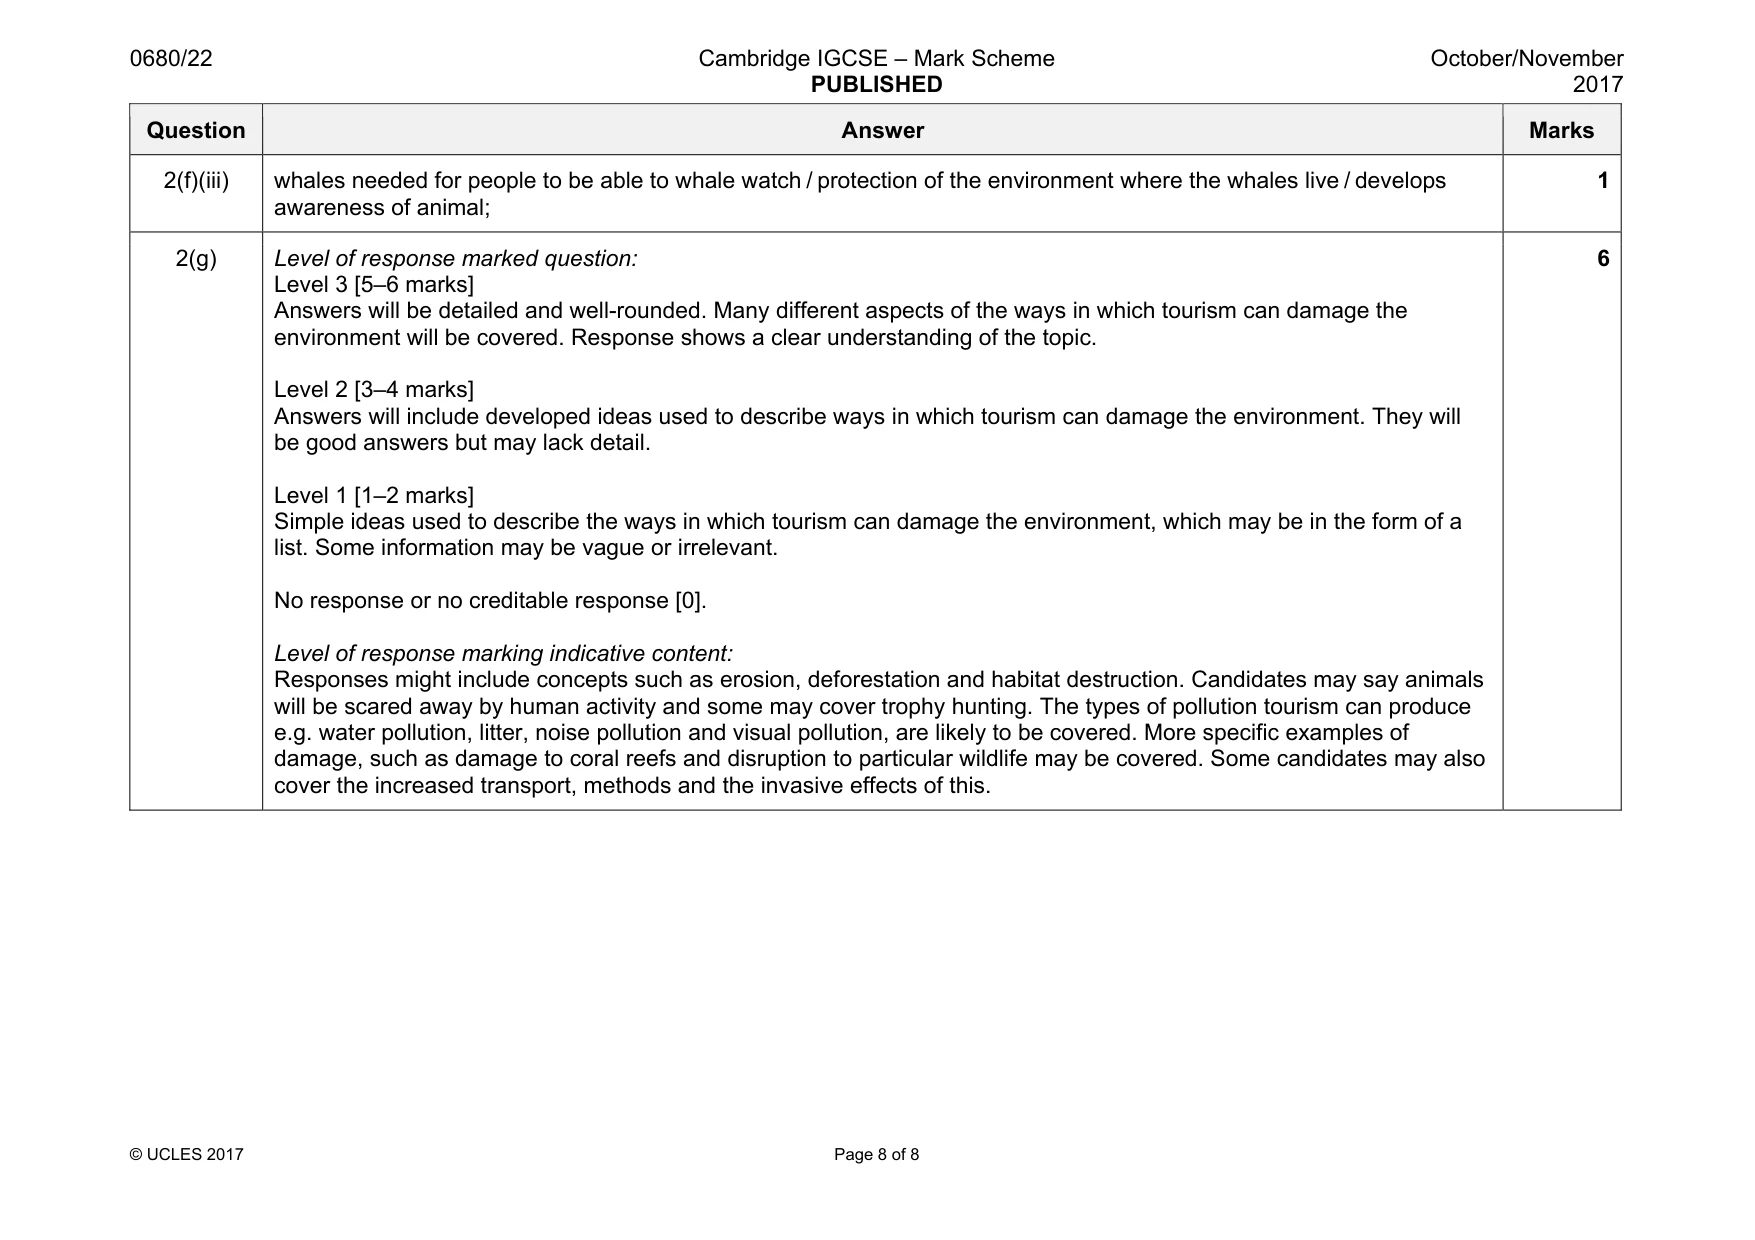
Mark scheme: 2(a) crust, plates, core ;; 3 correct [2 marks] 1 or 2 correct [1 mark] 2 2(b) any three from: along plate boundaries; in long, narrow belts; around the edge of the Pacific Ocean; concentration in named area of the world; identification of volcanoes not on plate boundary e.g. East Africa; 3 2(c)(i) X crater; Y magma / magma chamber; Z ash / ash cloud / gases; 3 2(c)(ii) percentages; plotting; shading; 3 2(c)(iii) any four from: volcanoes give out warning signs; example, such as, bulge / release of ash / gases released; people have more time to prepare; people have more time to evacuate; people educated to deal with an eruption; new activity on top of volcano where few people live; some eruptions are not violent; earthquakes may cause damage a long way from epicentre; 4 2(d)(i) labelling of y-axis, average visitor numbers per month; Mar correctly plotted at 20 000; May correctly plotted at 200 000; 3 2(d)(ii) June, July and August; 1 Question Answer Marks 2(d)(iii) 180 000; 1 2(d)(iv) any four from: gives time for people to escape if animal attacks; bears and wolves are particularly dangerous; prevents animals from being disturbed; which may cause them to, leave the area / become startled / affect mating; the wrong food can cause animals to become ill; feeding animals will encourage them to come closer which could be dangerous; 4 2(e)(i) any three from: renewable / won’t run out; continuous; makes use of natural resources; cheaper running costs; does not cause air pollution / release carbon dioxide; does not contribute to acid rain or global warming; conservation of fossil fuels; 3 2(e)(ii) any three from: (ash weathers to give) fertile soils; so high yields of crops; mineral extraction or example; confidence in prediction; confidence in evacuation and precautions; risk perception; high population density elsewhere; family and friends; historical / cultural, reasons; heating / hot water, available; 3 2(f)(i) tourism that is sustainable / limits damage to the environment; 1 2(f)(ii) jobs; income; 2 Question Answer Marks 2(f)(iii) whales needed for people to be able to whale watch / protection of the environment where the whales live / develops awareness of animal; 1 2(g) Level of response marked question: Level 3 [5–6 marks] Answers will be detailed and well-rounded. Many different aspects of the ways in which tourism can damage the environment will be covered. Response shows a clear understanding of the topic. Level 2 [3–4 marks] Answers will include developed ideas used to describe ways in which tourism can damage the environment. They will be good answers but may lack detail. Level 1 [1–2 marks] Simple ideas used to describe the ways in which tourism can damage the environment, which may be in the form of a list. Some information may be vague or irrelevant. No response or no creditable response [0]. Level of response marking indicative content: Responses might include concepts such as erosion, deforestation and habitat destruction. Candidates may say animals will be scared away by human activity and some may cover trophy hunting. The types of pollution tourism can produce e.g. water pollution, litter, noise pollution and visual pollution, are likely to be covered. More specific examples of damage, such as damage to coral reefs and disruption to particular wildlife may be covered. Some candidates may also cover the increased transport, methods and the invasive effects of this. 6
What was in this paper
The subtopics covered by these 2 questions, and how many questions each got. Open one in a new tab to see every Cambridge question on it.
What you needed in this session
Cambridge’s own grade thresholds for 2017 Oct/Nov, Paper 2 · Variant 2. A higher threshold means an easier paper — the bar moves with how the cohort did.