Cambridge IGCSE Environmental Management 0680 — 2017 Oct/Nov Paper 2 · Variant 3
0680/23/O/N/17 · 2 questions · 80 marks · ≈90 min
The question paper and its mark scheme, free to read here and free to download. This is Cambridge’s own paper, exactly as it was sat.
Question paper16 pages


Mark scheme9 pages
Answers below. Sit the paper first if you are practising.
Questions as text
Q1 · State what is meant by rural to urban migration
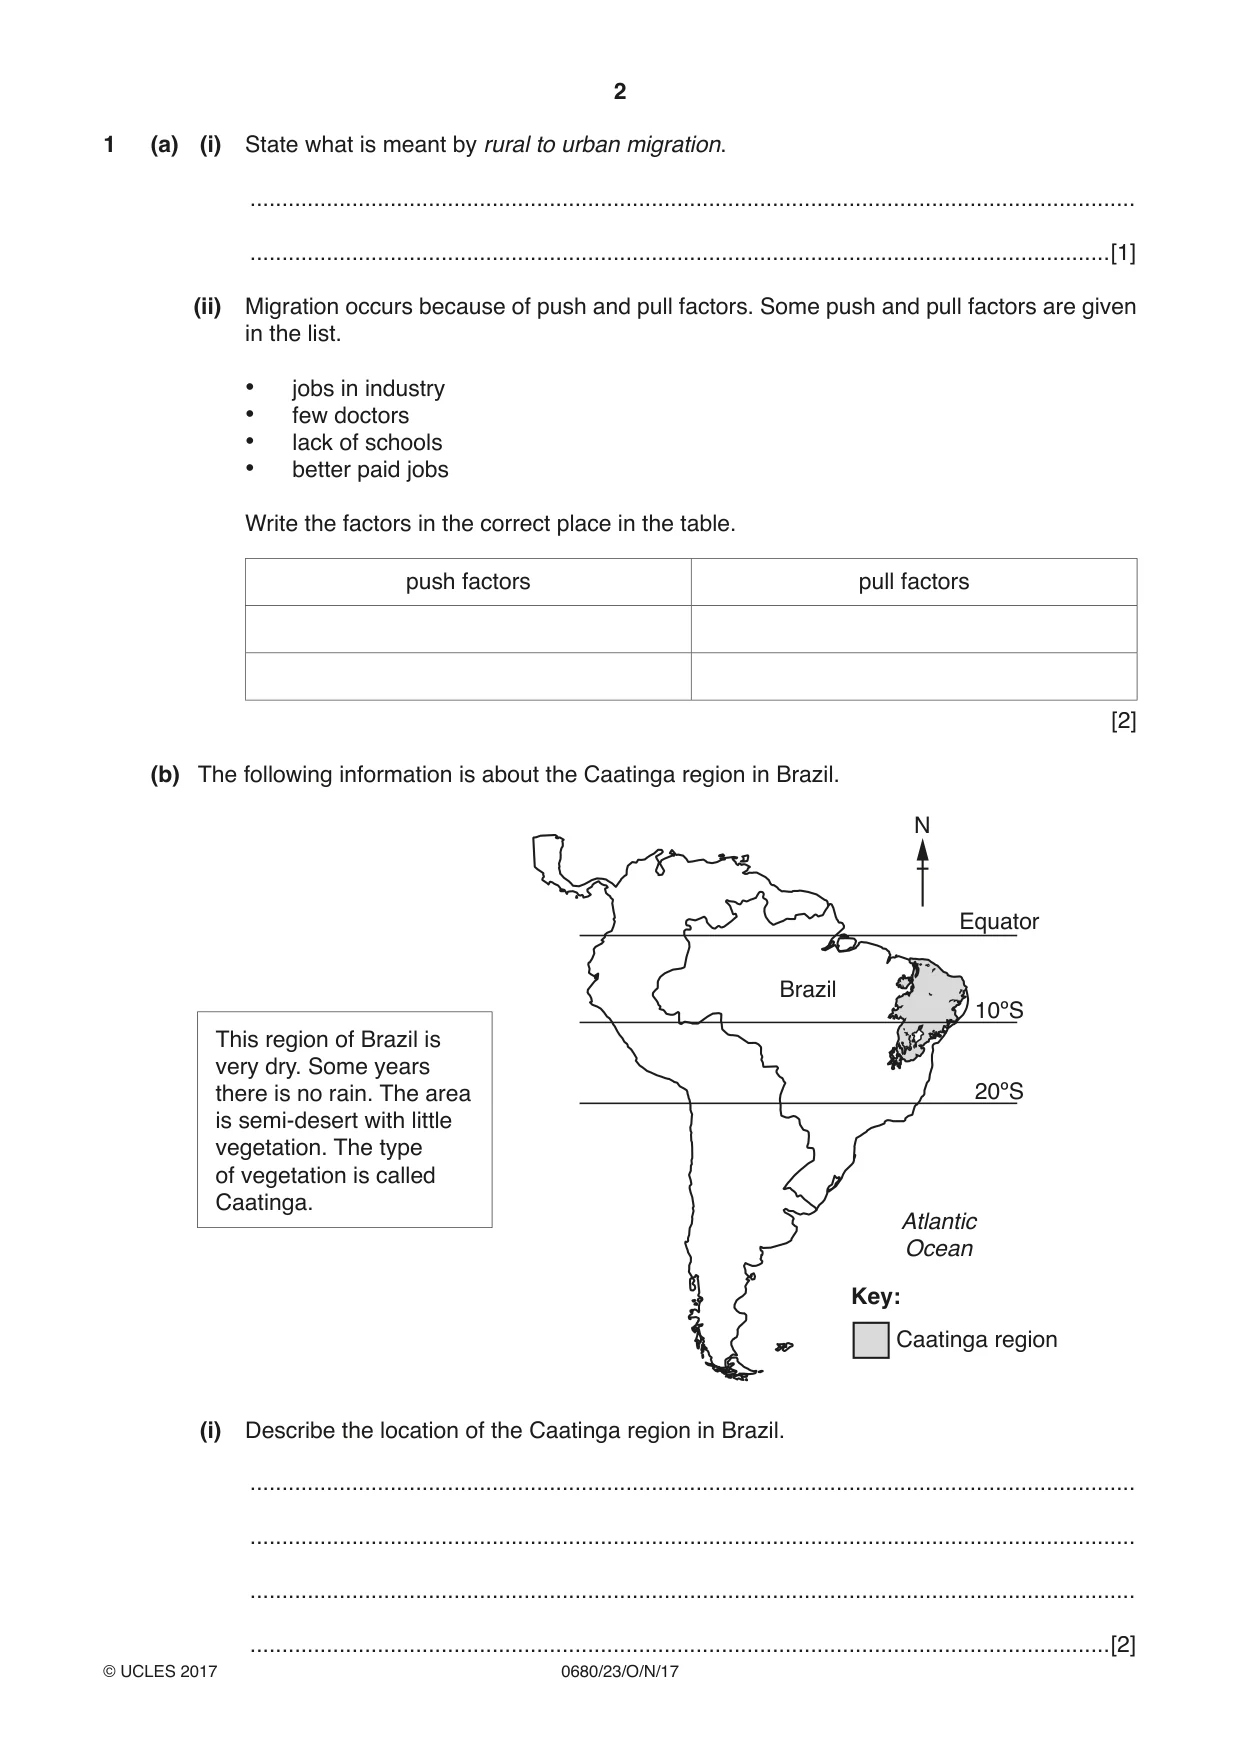
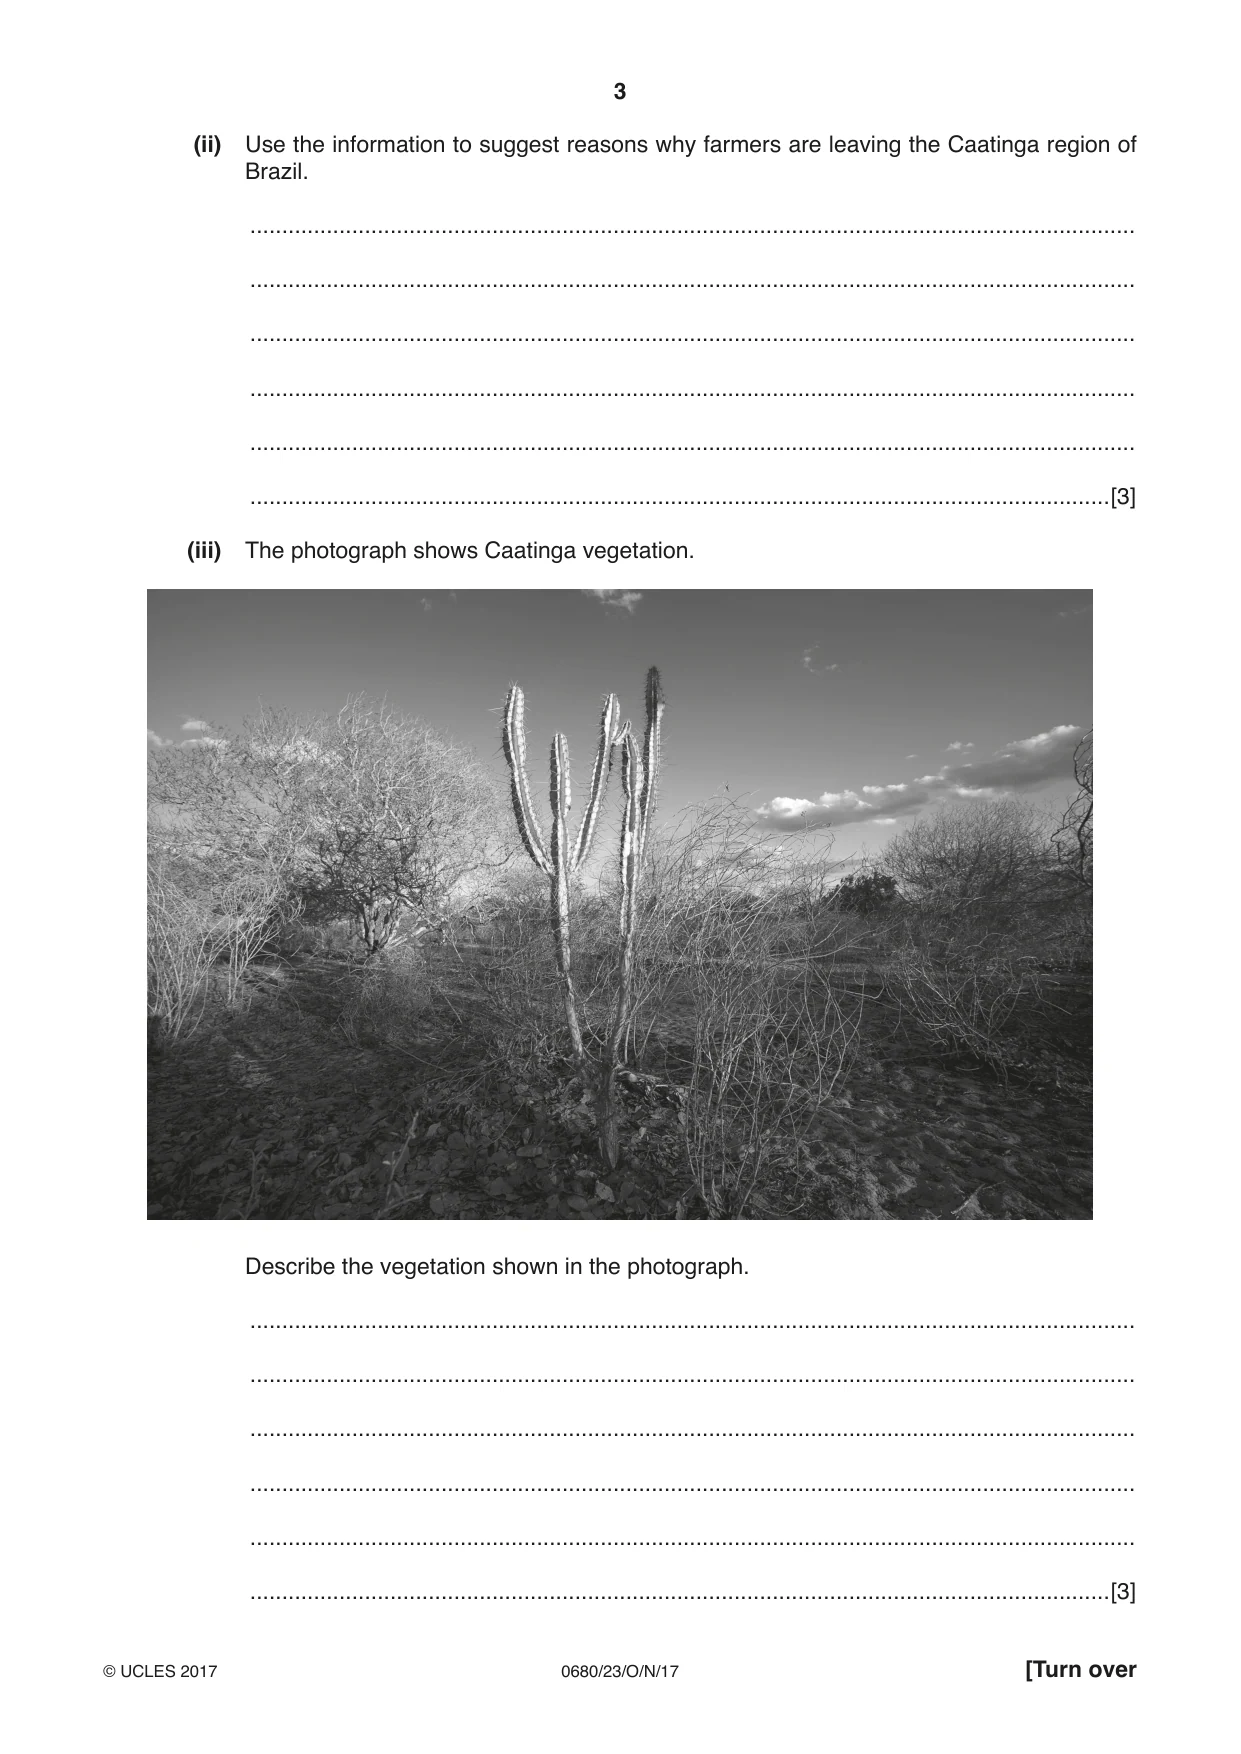
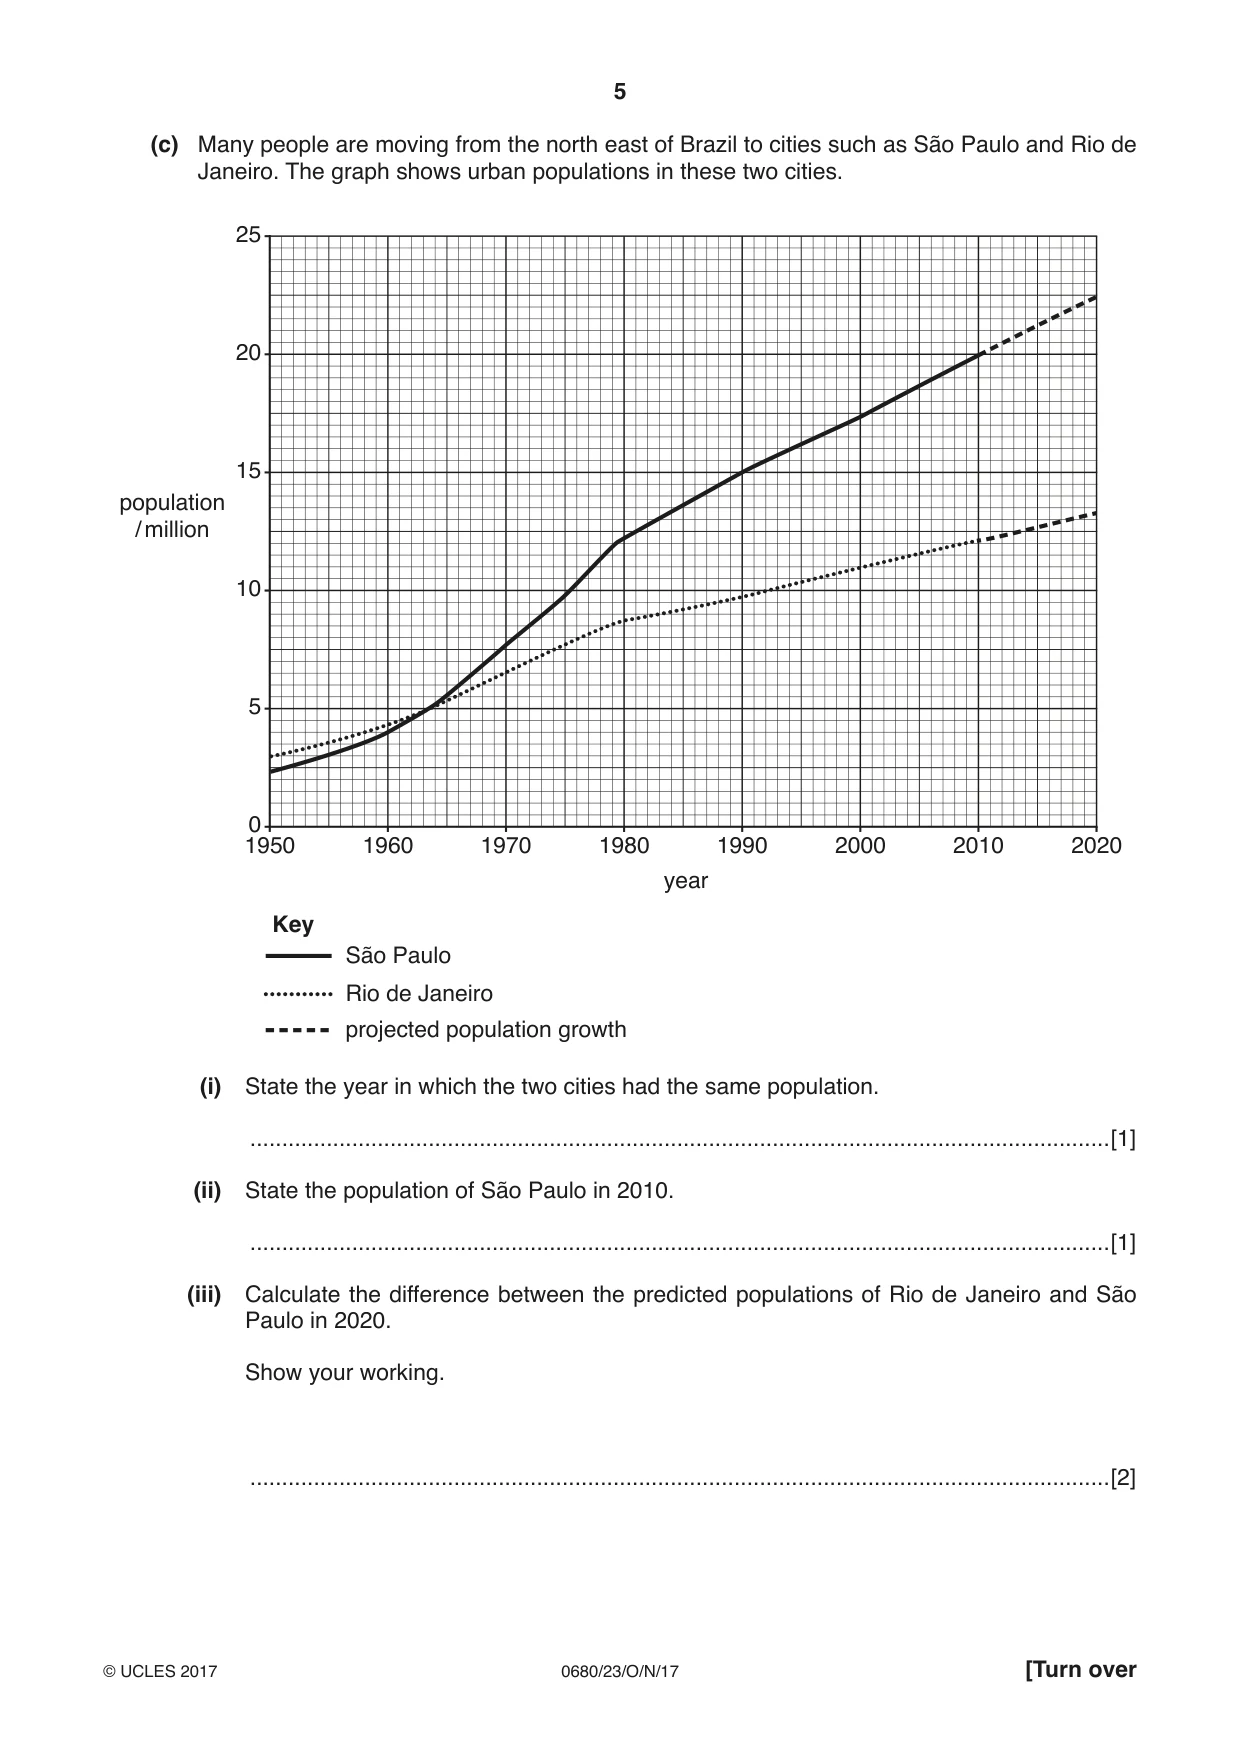
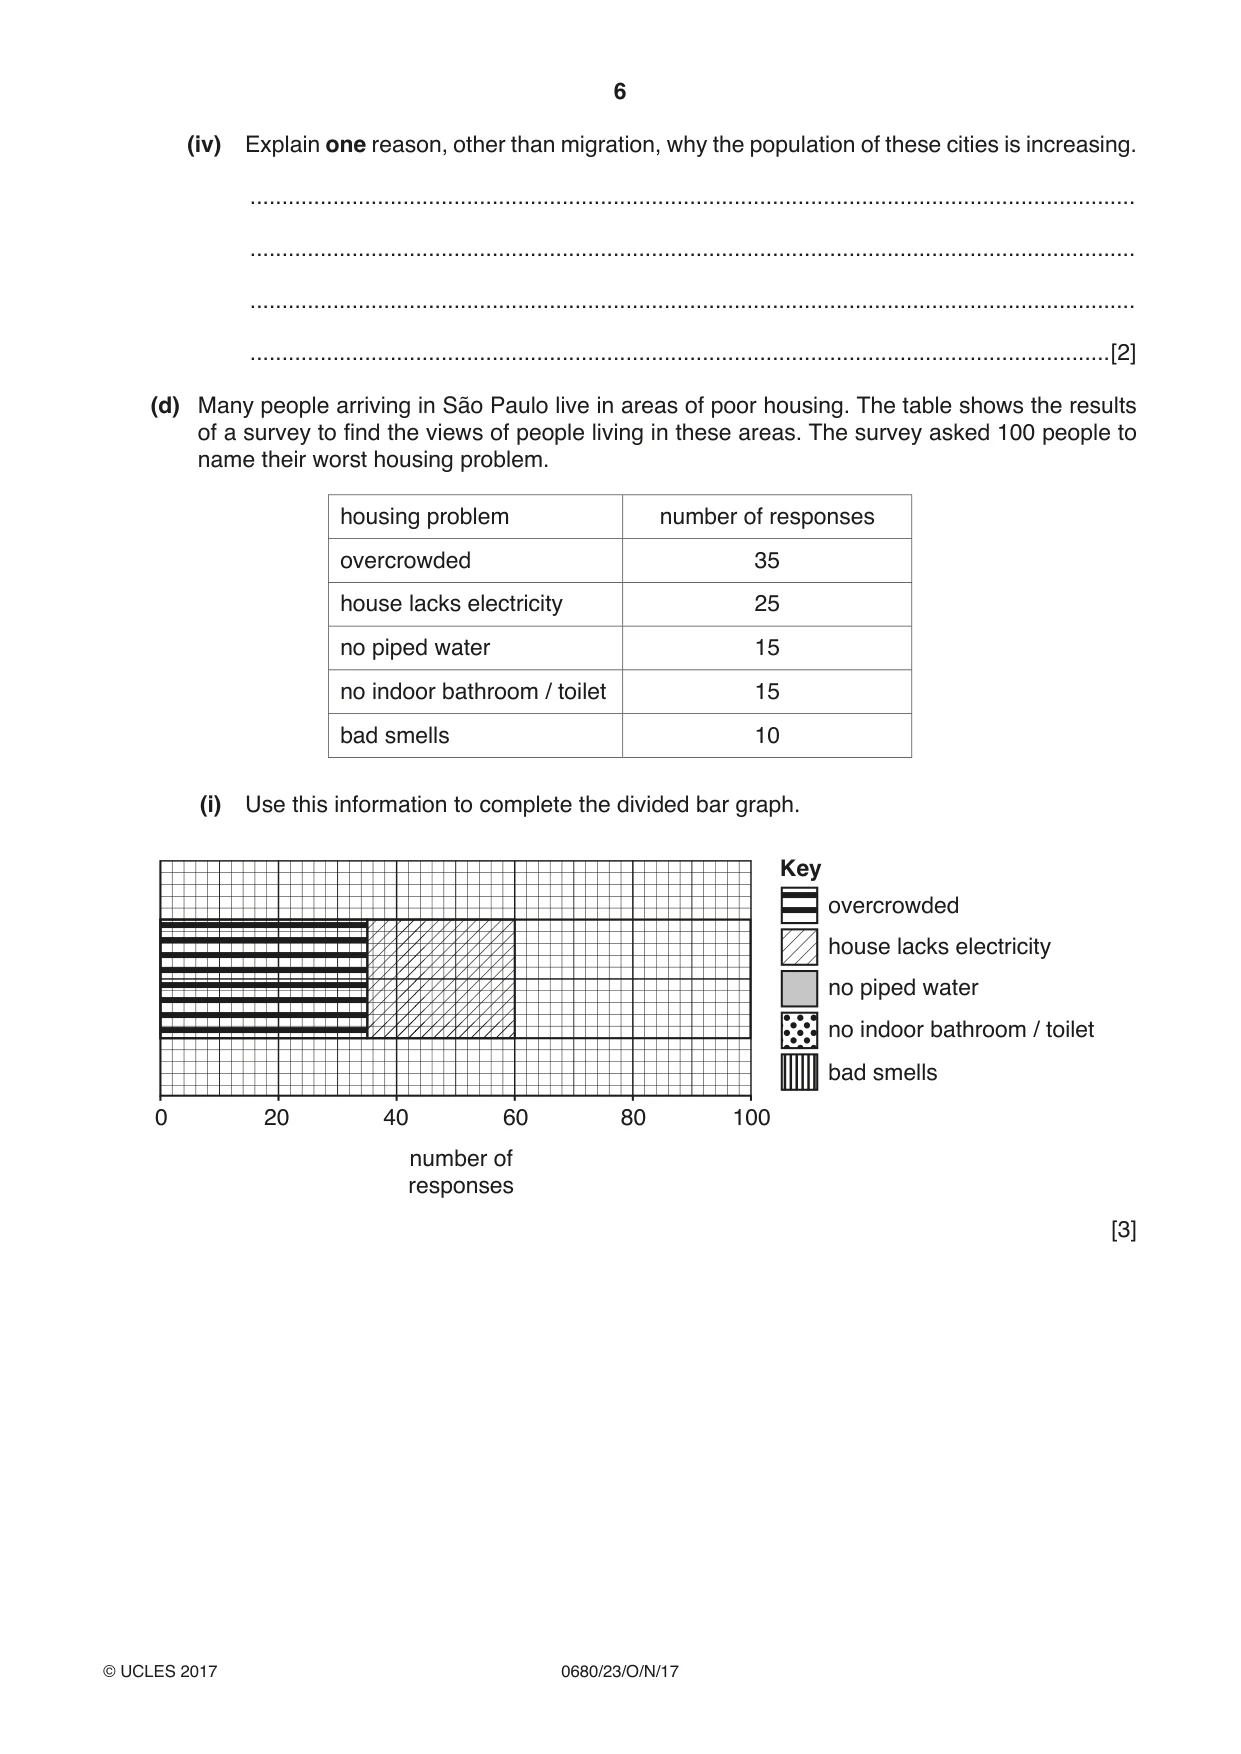
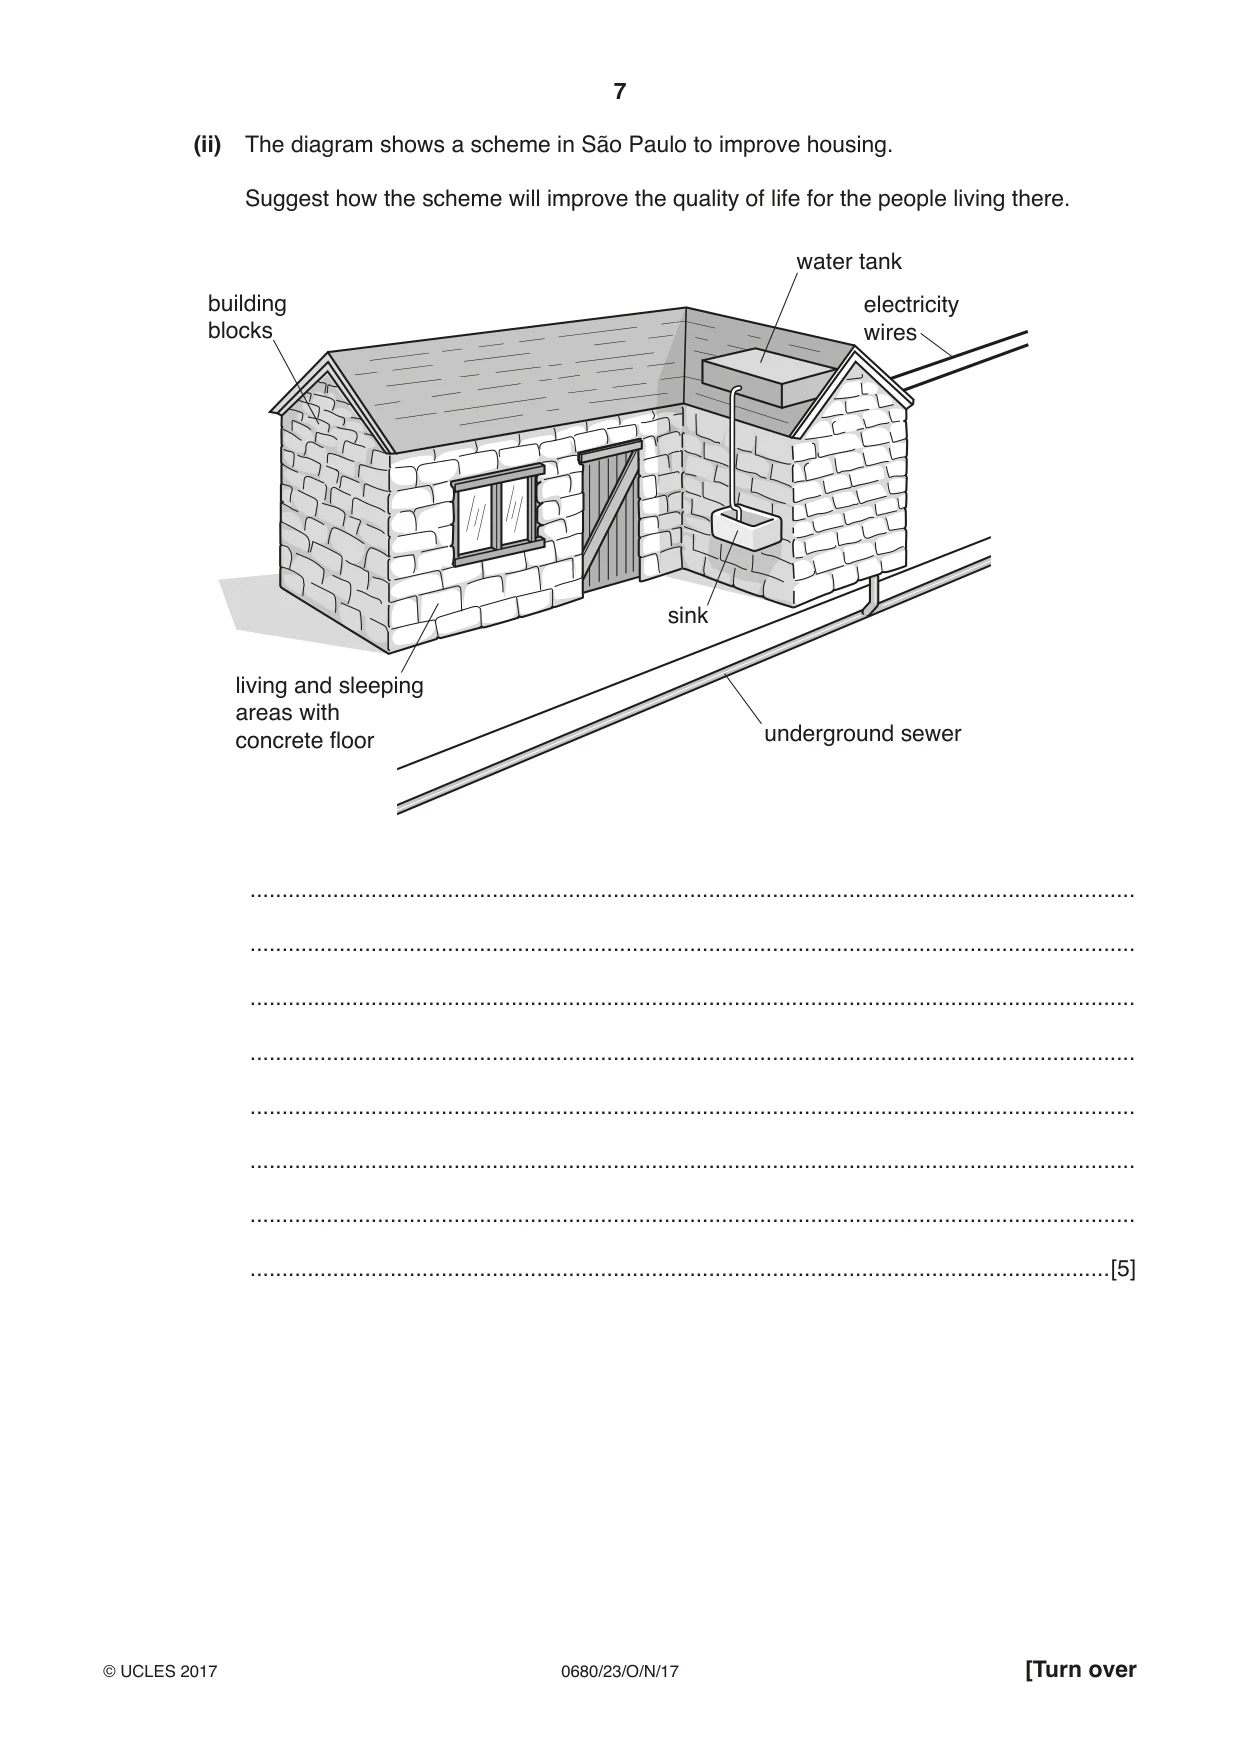
1 (a) (i) State what is meant by rural to urban migration. ........................................................................................................................................... .......................................................................................................................................[1] (ii) Migration occurs because of push and pull factors. Some push and pull factors are given in the list. • jobs in industry • few doctors • lack of schools • better paid jobs Write the factors in the correct place in the table. push factors pull factors [2] (b) The following information is about the Caatinga region in Brazil. N EquatorEquator Brazil 10ºS10ºS This region of Brazil is very dry. Some years there is no rain. The area 20ºS is semi-desert with little vegetation. The type of vegetation is called Caatinga. Atlantic Ocean Key: Caatinga region (i) Describe the location of the Caatinga region in Brazil. ........................................................................................................................................... ........................................................................................................................................... ........................................................................................................................................... (ii) Use the information to suggest reasons why farmers are leaving the Caatinga region of Brazil. ........................................................................................................................................... ........................................................................................................................................... ........................................................................................................................................... ........................................................................................................................................... ........................................................................................................................................... .......................................................................................................................................[3] (iii) The photograph shows Caatinga vegetation. Describe the vegetation shown in the photograph. ........................................................................................................................................... ........................................................................................................................................... ........................................................................................................................................... ........................................................................................................................................... ........................................................................................................................................... .......................................................................................................................................[3] (iv) Explain why plants such as those shown in (iii), have shallow, wide spreading roots. ........................................................................................................................................... .......................................................................................................................................[1] (v) The land in the Caatinga region has been overused for grazing and growing crops. Explain how this overuse can cause desertification. ........................................................................................................................................... ........................................................................................................................................... ........................................................................................................................................... ........................................................................................................................................... ........................................................................................................................................... ........................................................................................................................................... ........................................................................................................................................... ........................................................................................................................................... ........................................................................................................................................... .......................................................................................................................................[5] (vi) Over 50% of the habitats in the Caatinga region have been destroyed. One strategy that could be used to protect this area of Brazil is to create a national park. Suggest ways in which the region could be managed as a national park. ........................................................................................................................................... ........................................................................................................................................... ........................................................................................................................................... ........................................................................................................................................... ........................................................................................................................................... .......................................................................................................................................[3] (c) Many people are moving from the north east of Brazil to cities such as São Paulo and Rio de Janeiro. The graph shows urban populations in these two cities. 25 20 15 population / million 10 5 0 1950 1960 1970 1980 1990 2000 2010 2020 year Key São Paulo Rio de Janeiro projected population growth (i) State the year in which the two cities had the same population. .......................................................................................................................................[1] (ii) State the population of São Paulo in 2010. .......................................................................................................................................[1] (iii) Calculate the difference between the predicted populations of Rio de Janeiro and São Paulo in 2020. Show your working. .......................................................................................................................................[2] (iv) Explain one reason, other than migration, why the population of these cities is increasing. ........................................................................................................................................... ........................................................................................................................................... ........................................................................................................................................... .......................................................................................................................................[2] (d) Many people arriving in São Paulo live in areas of poor housing. The table shows the results of a survey to find the views of people living in these areas. The survey asked 100 people to name their worst housing problem. housing problem number of responses overcrowded 35 house lacks electricity 25 no piped water 15 no indoor bathroom / toilet 15 bad smells 10 (i) Use this information to complete the divided bar graph. Key overcrowded house lacks electricity no piped water no indoor bathroom / toilet bad smells 0 20 40 60 80 100 number of responses [3] (ii) The diagram shows a scheme in São Paulo to improve housing. Suggest how the scheme will improve the quality of life for the people living there. water tank building electricity blocks wires sink living and sleeping areas with underground sewer concrete floor ........................................................................................................................................... ........................................................................................................................................... ........................................................................................................................................... ........................................................................................................................................... ........................................................................................................................................... ........................................................................................................................................... ........................................................................................................................................... .......................................................................................................................................[5] (e) Population growth causes problems for rural and urban areas. Suggest strategies that can be used to manage population growth. ................................................................................................................................................... ................................................................................................................................................... ................................................................................................................................................... ................................................................................................................................................... ................................................................................................................................................... ................................................................................................................................................... ................................................................................................................................................... ................................................................................................................................................... ................................................................................................................................................... ................................................................................................................................................... ................................................................................................................................................... ...............................................................................................................................................[6]
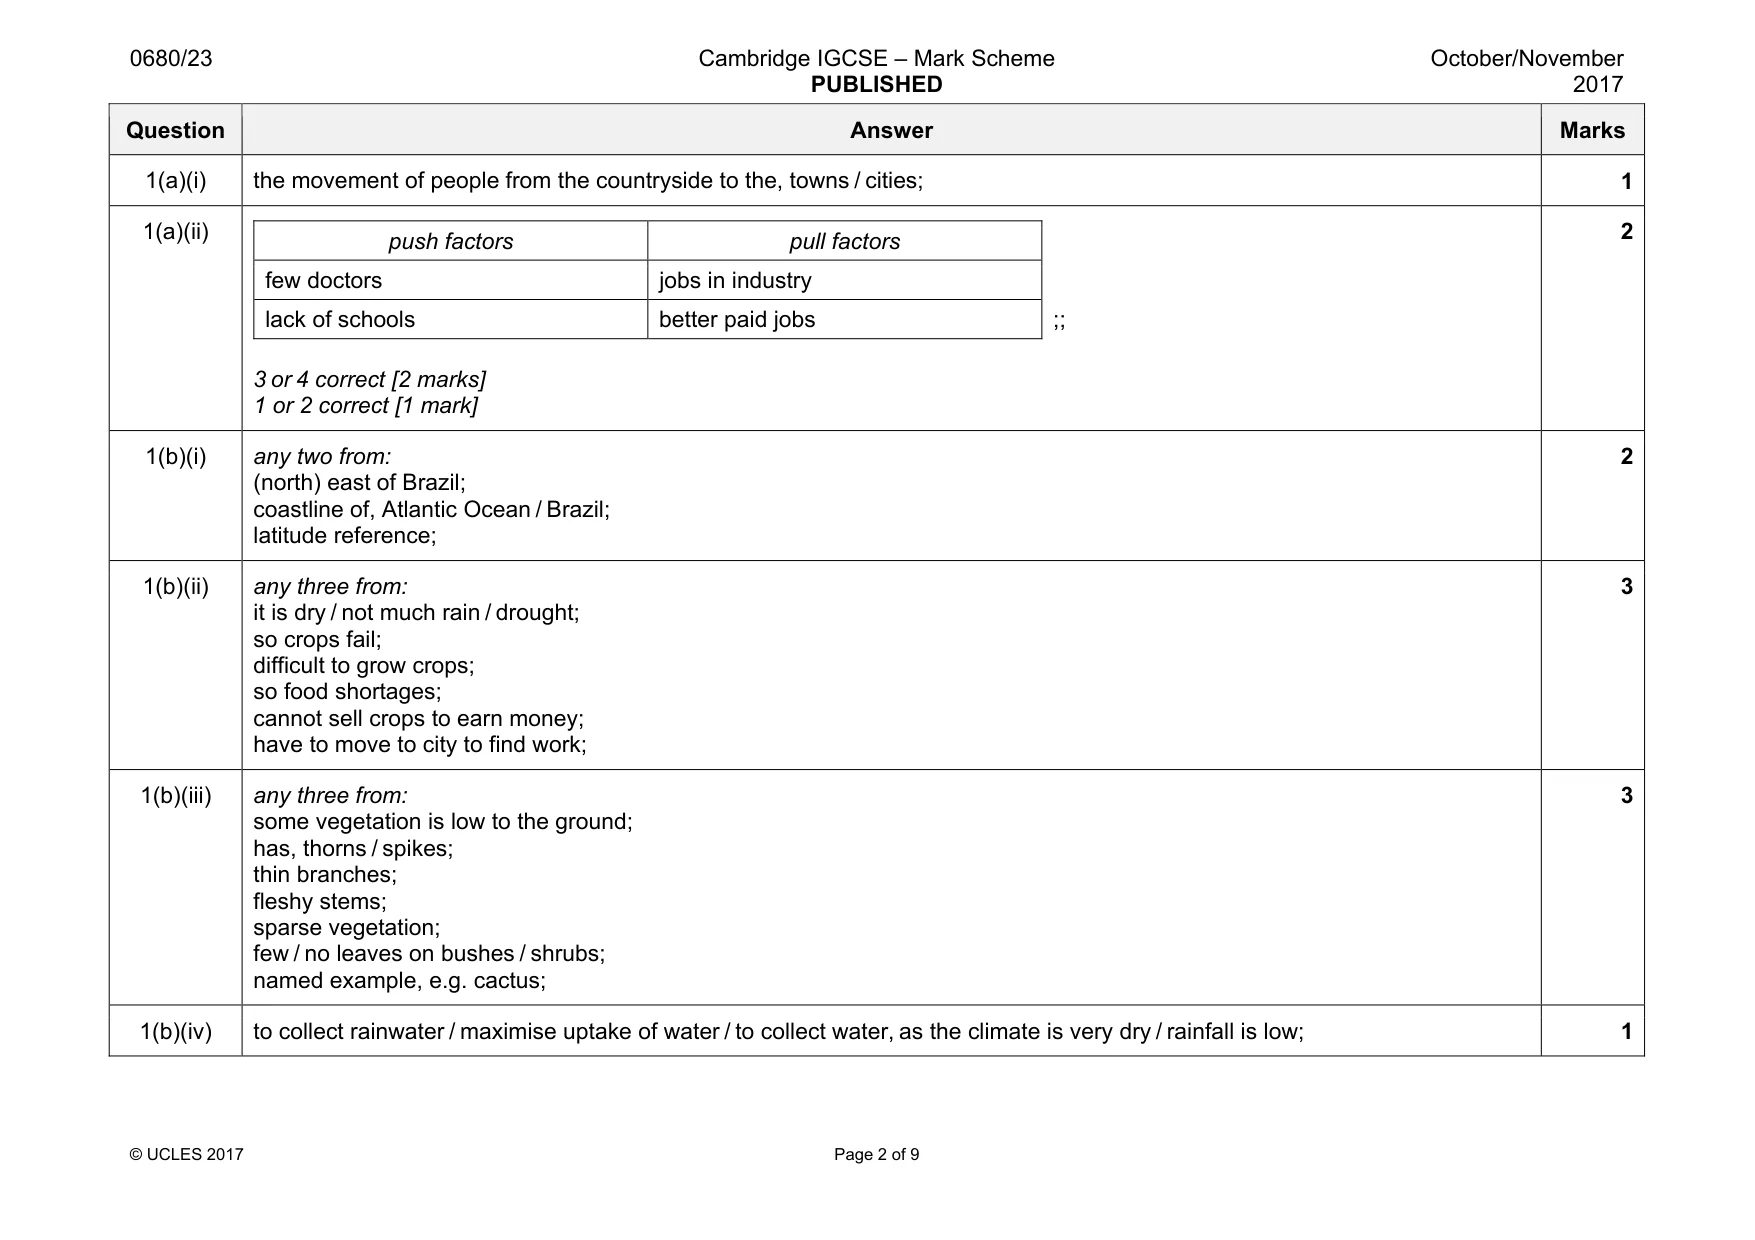
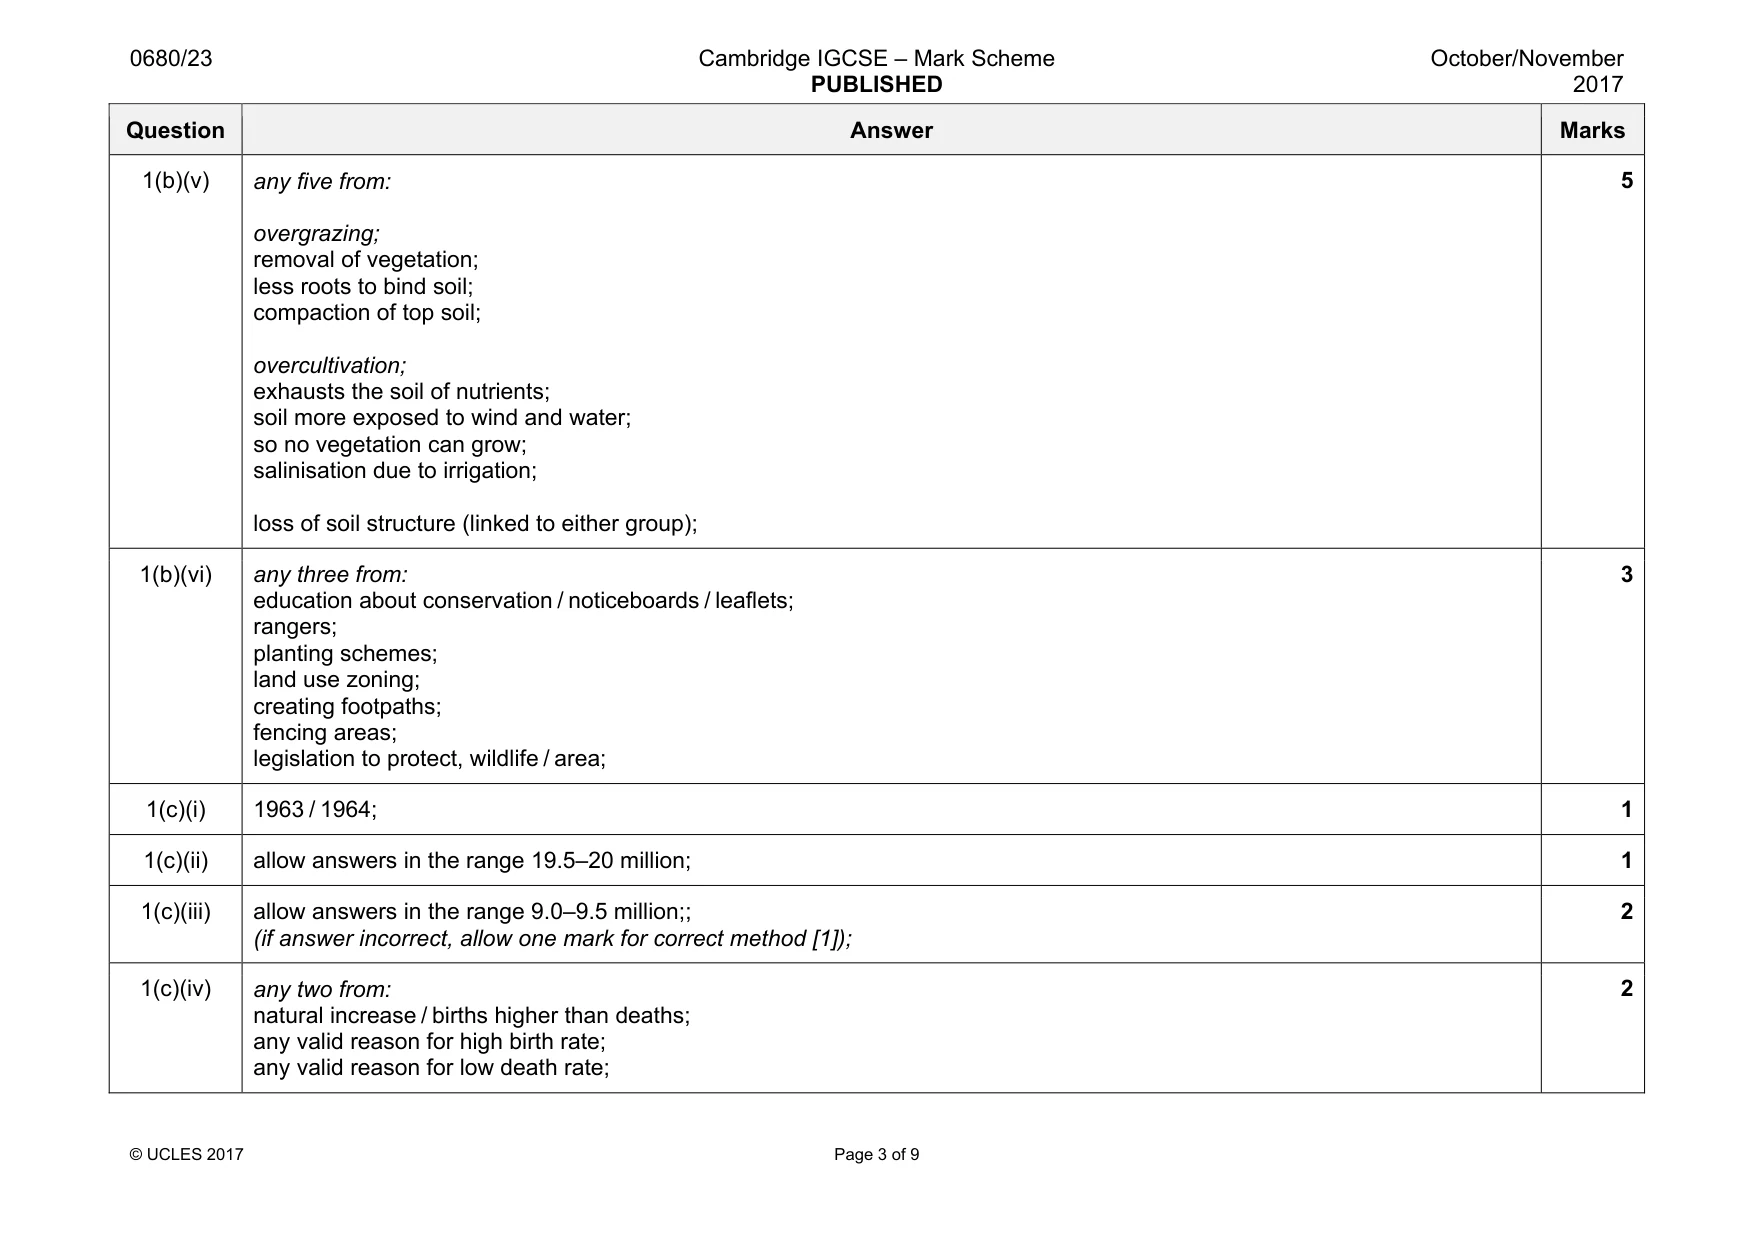
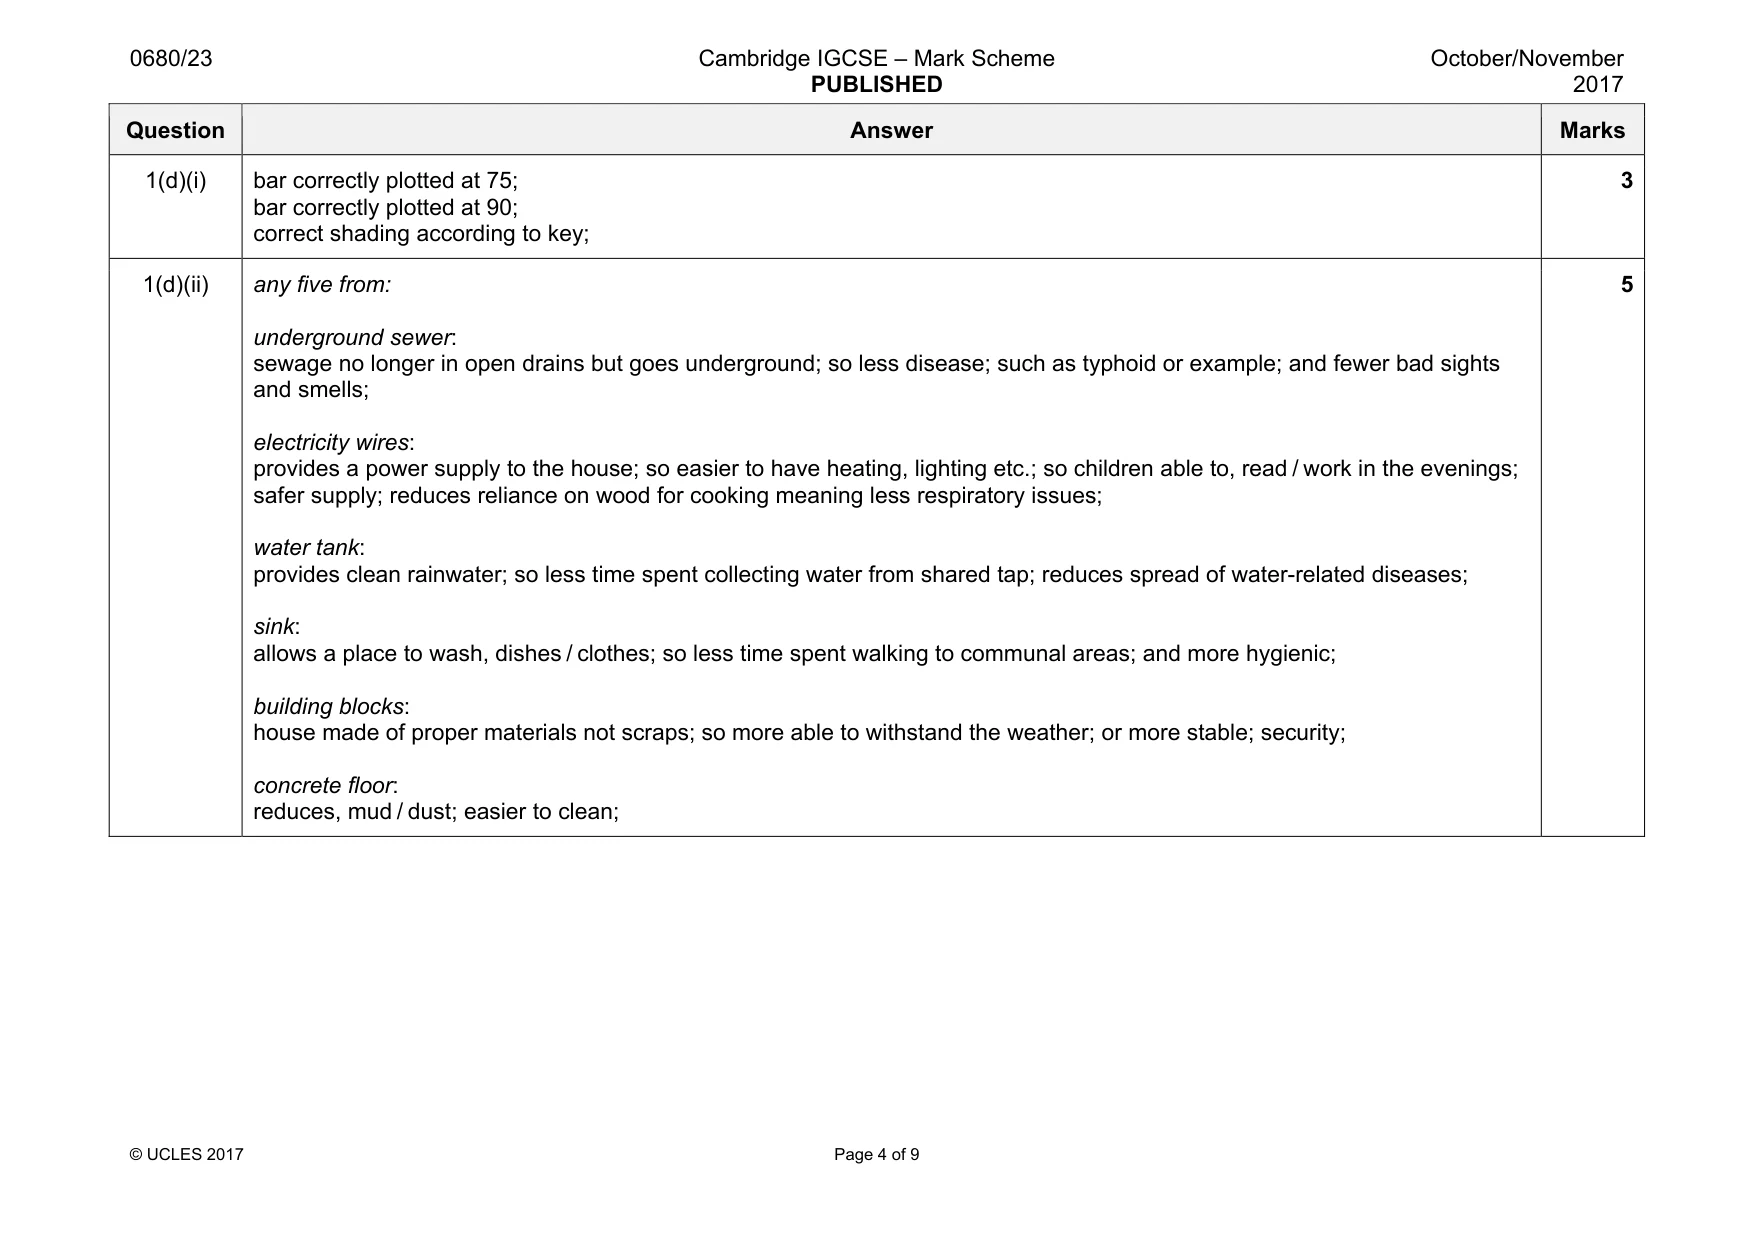
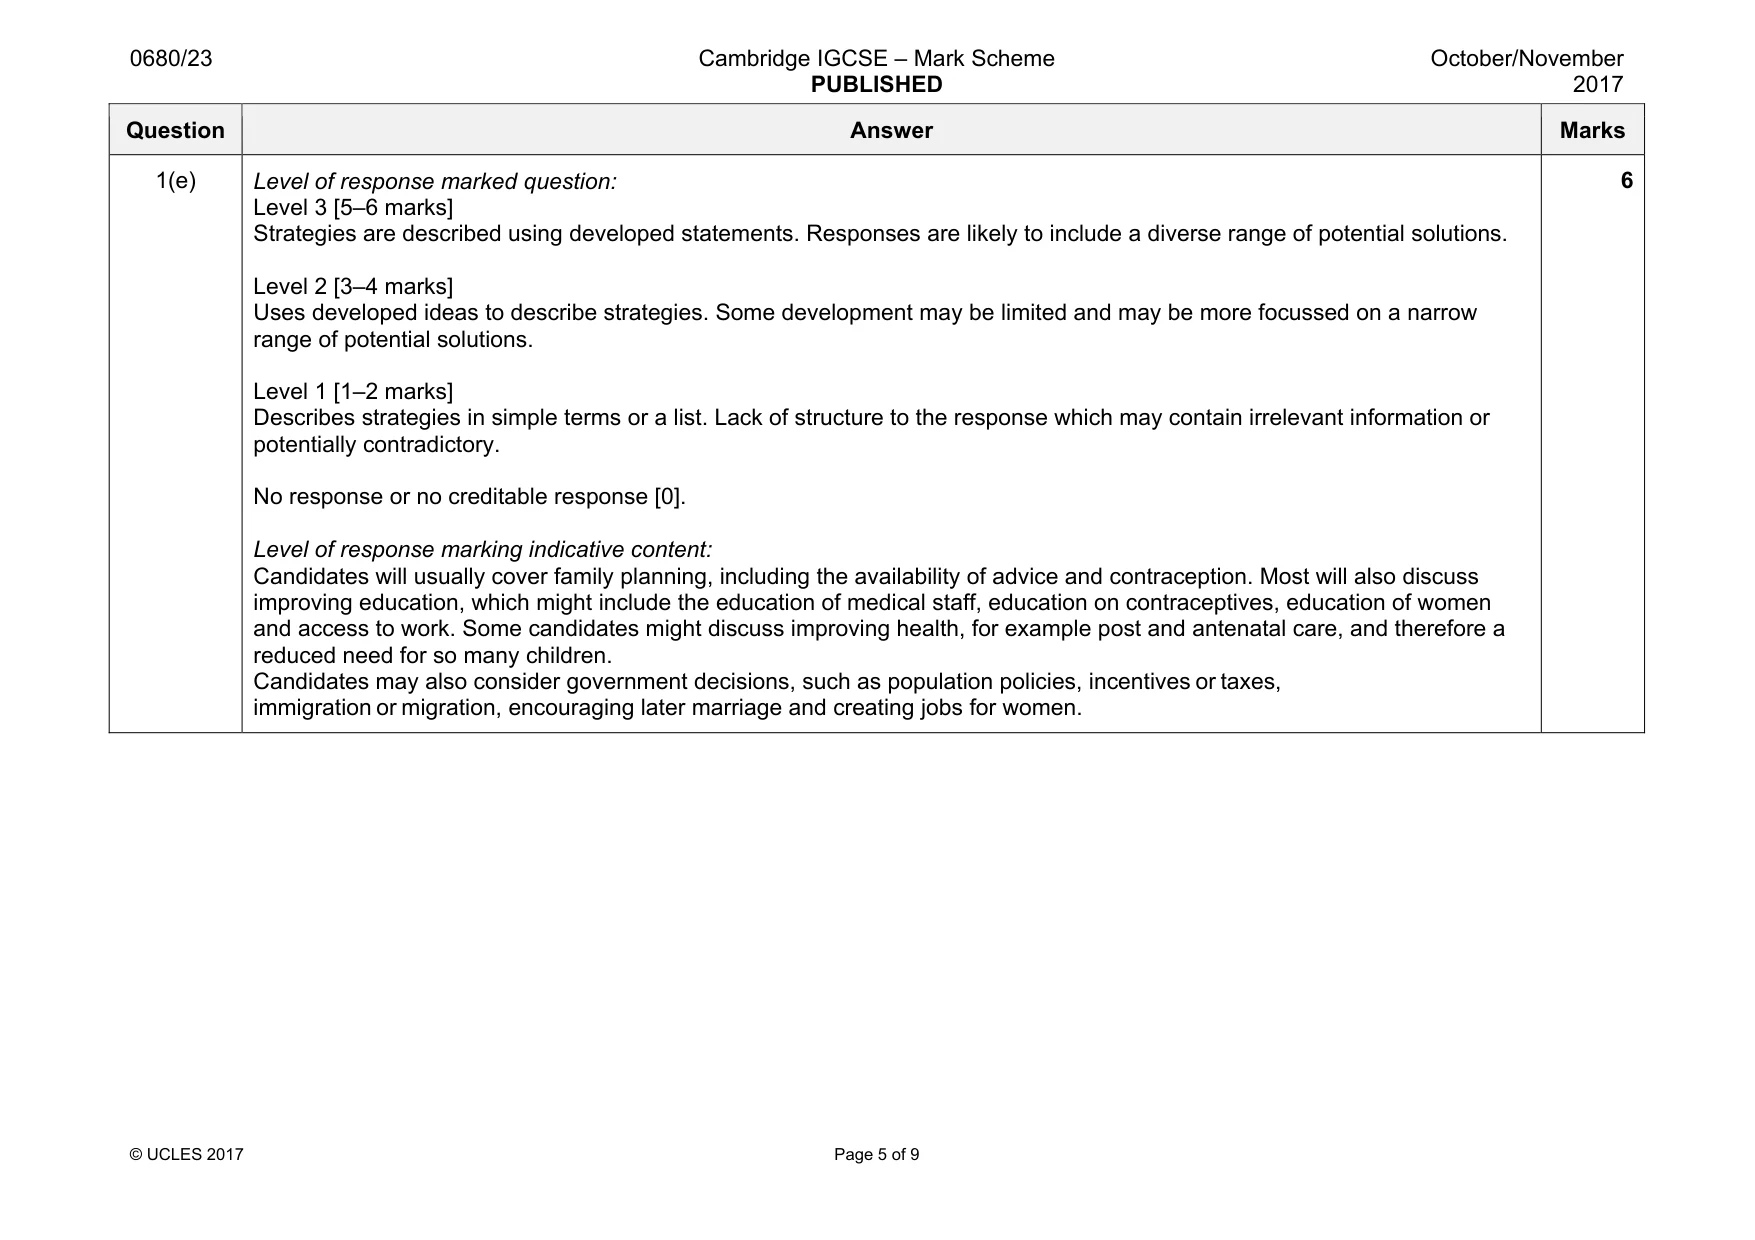
Mark scheme: 1(a)(i) the movement of people from the countryside to the, towns / cities; 1 1(a)(ii) push factors pull factors few doctors jobs in industry lack of schools better paid jobs ;; 3 or 4 correct [2 marks] 1 or 2 correct [1 mark] 2 1(b)(i) any two from: (north) east of Brazil; coastline of, Atlantic Ocean / Brazil; latitude reference; 2 1(b)(ii) any three from: it is dry / not much rain / drought; so crops fail; difficult to grow crops; so food shortages; cannot sell crops to earn money; have to move to city to find work; 3 1(b)(iii) any three from: some vegetation is low to the ground; has, thorns / spikes; thin branches; fleshy stems; sparse vegetation; few / no leaves on bushes / shrubs; named example, e.g. cactus; 3 1(b)(iv) to collect rainwater / maximise uptake of water / to collect water, as the climate is very dry / rainfall is low; 1 Question Answer Marks 1(b)(v) any five from: overgrazing; removal of vegetation; less roots to bind soil; compaction of top soil; overcultivation; exhausts the soil of nutrients; soil more exposed to wind and water; so no vegetation can grow; salinisation due to irrigation; loss of soil structure (linked to either group); 5 1(b)(vi) any three from: education about conservation / noticeboards / leaflets; rangers; planting schemes; land use zoning; creating footpaths; fencing areas; legislation to protect, wildlife / area; 3 1(c)(i) 1963 / 1964; 1 1(c)(ii) allow answers in the range 19.5–20 million; 1 1(c)(iii) allow answers in the range 9.0–9.5 million;; (if answer incorrect, allow one mark for correct method [1]); 2 1(c)(iv) any two from: natural increase / births higher than deaths; any valid reason for high birth rate; any valid reason for low death rate; 2 Question Answer Marks 1(d)(i) bar correctly plotted at 75; bar correctly plotted at 90; correct shading according to key; 3 1(d)(ii) any five from: underground sewer: sewage no longer in open drains but goes underground; so less disease; such as typhoid or example; and fewer bad sights and smells; electricity wires: provides a power supply to the house; so easier to have heating, lighting etc.; so children able to, read / work in the evenings; safer supply; reduces reliance on wood for cooking meaning less respiratory issues; water tank: provides clean rainwater; so less time spent collecting water from shared tap; reduces spread of water-related diseases; sink: allows a place to wash, dishes / clothes; so less time spent walking to communal areas; and more hygienic; building blocks: house made of proper materials not scraps; so more able to withstand the weather; or more stable; security; concrete floor: reduces, mud / dust; easier to clean; 5 Question Answer Marks 1(e) Level of response marked question: Level 3 [5–6 marks] Strategies are described using developed statements. Responses are likely to include a diverse range of potential solutions. Level 2 [3–4 marks] Uses developed ideas to describe strategies. Some development may be limited and may be more focussed on a narrow range of potential solutions. Level 1 [1–2 marks] Describes strategies in simple terms or a list. Lack of structure to the response which may contain irrelevant information or potentially contradictory. No response or no creditable response [0]. Level of response marking indicative content: Candidates will usually cover family planning, including the availability of advice and contraception. Most will also discuss improving education, which might include the education of medical staff, education on contraceptives, education of women and access to work. Some candidates might discuss improving health, for example post and antenatal care, and therefore a reduced need for so many children. Candidates may also consider government decisions, such as population policies, incentives or taxes, immigration or migration, encouraging later marriage and creating jobs for women. 6
Q2 · The climate graph shows average temperature and precipitation for Fairbanks in Alaska…
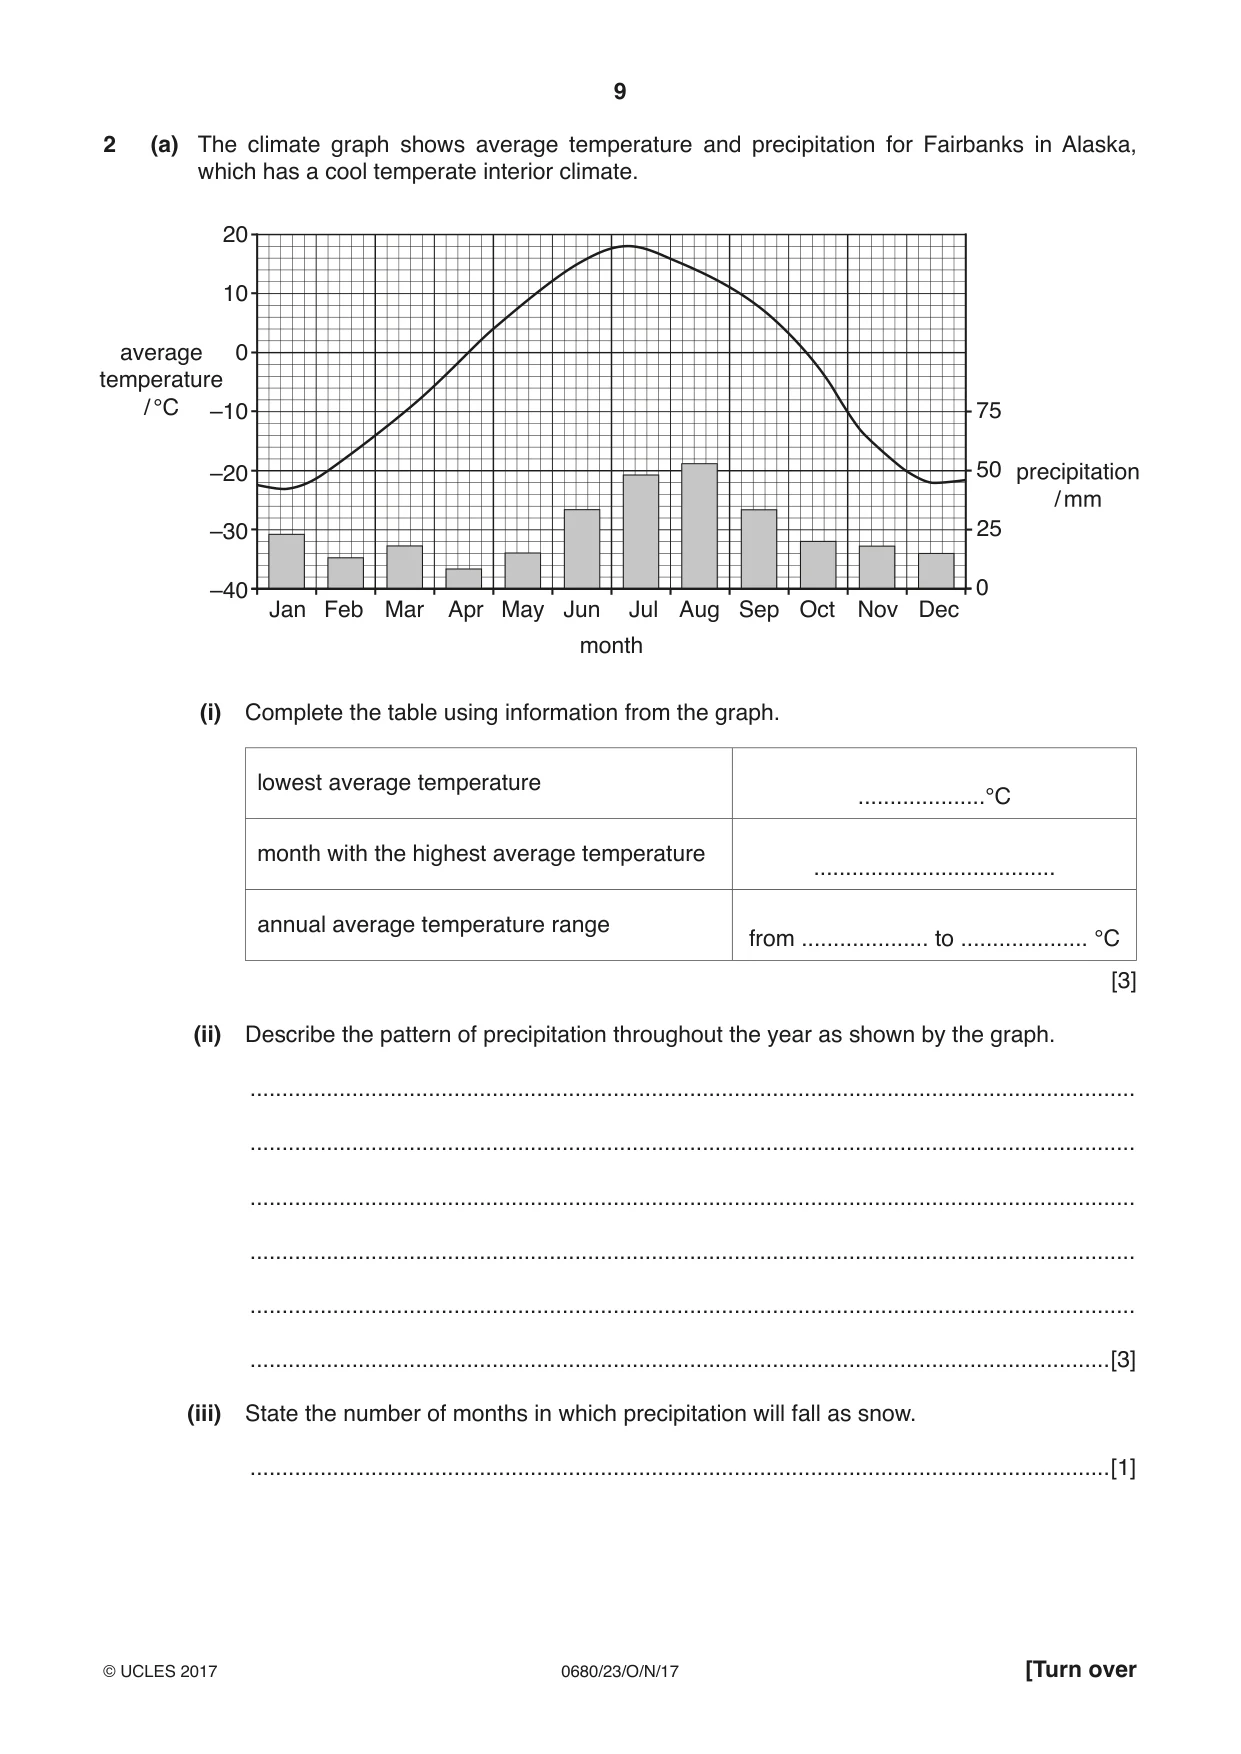
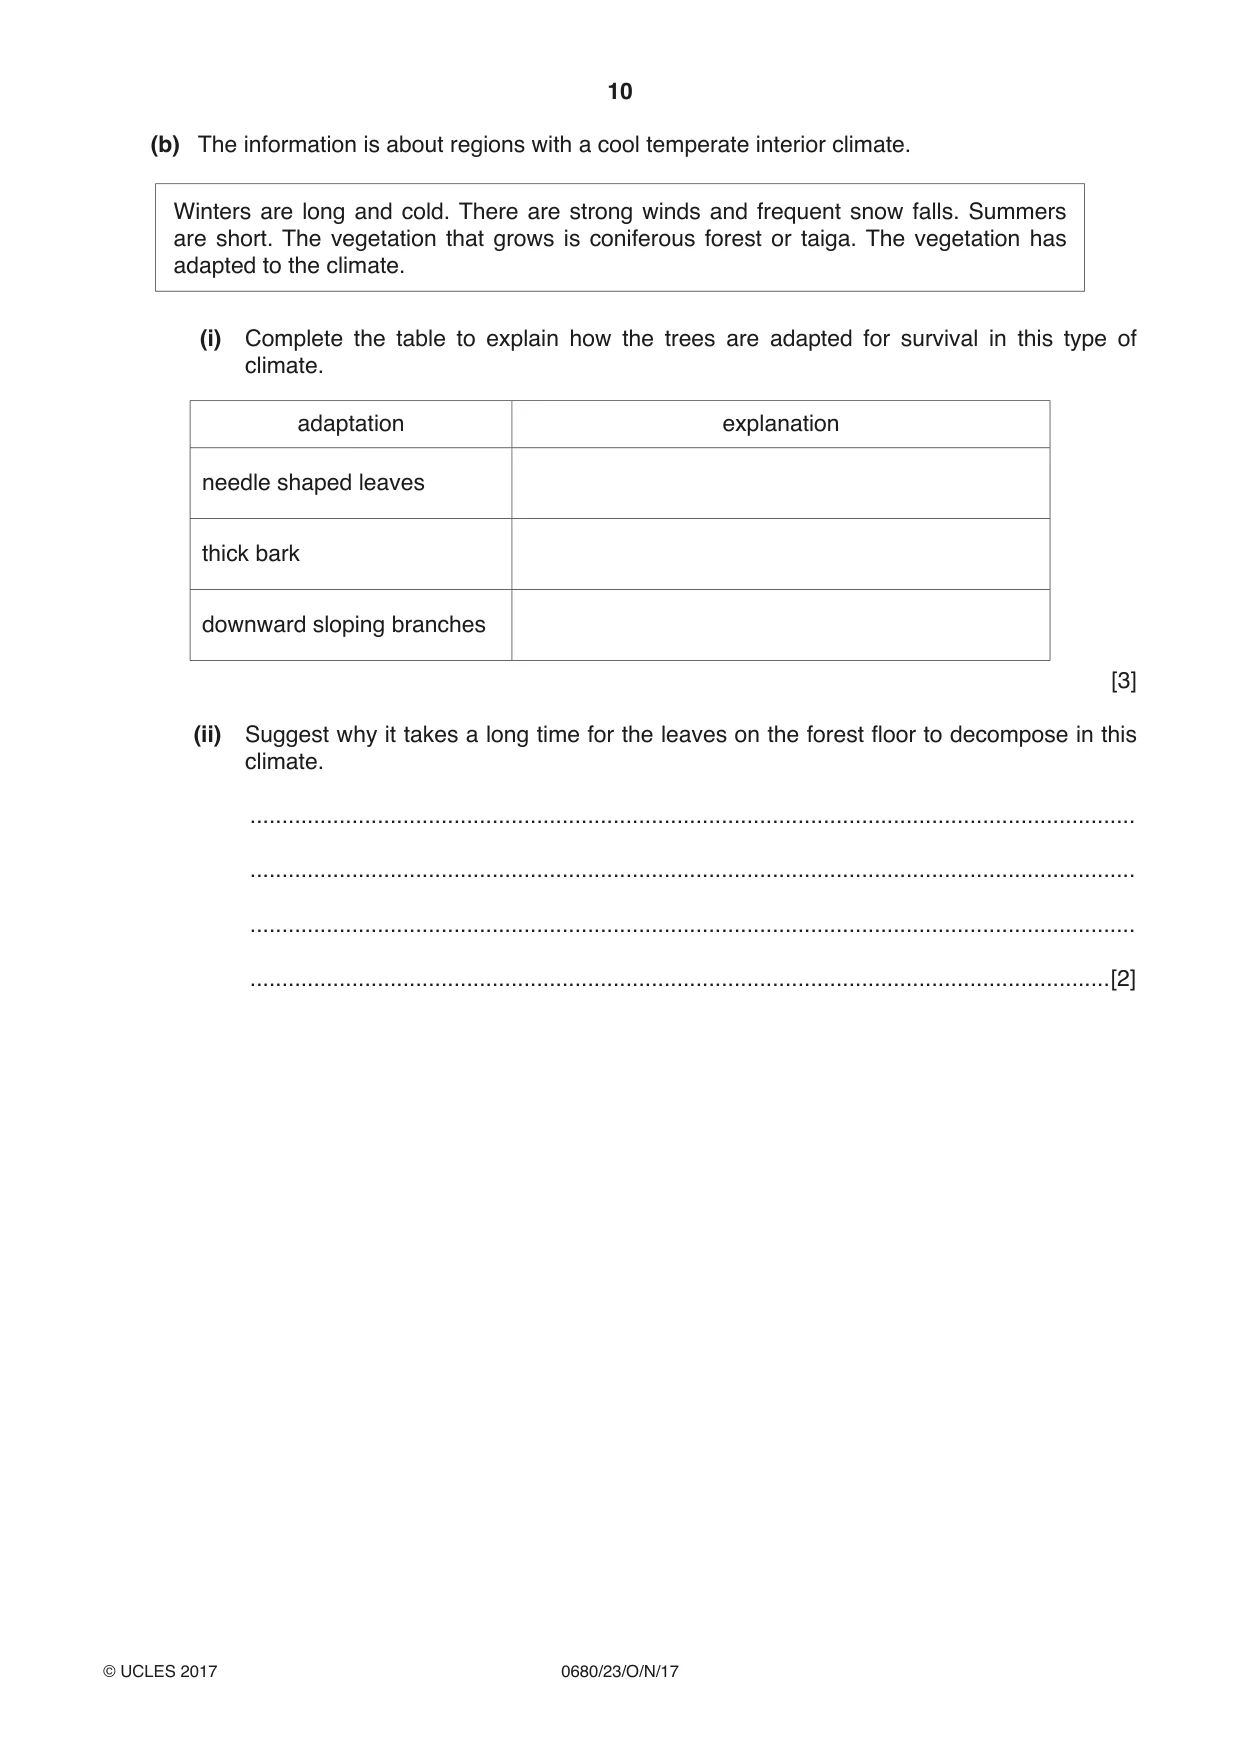
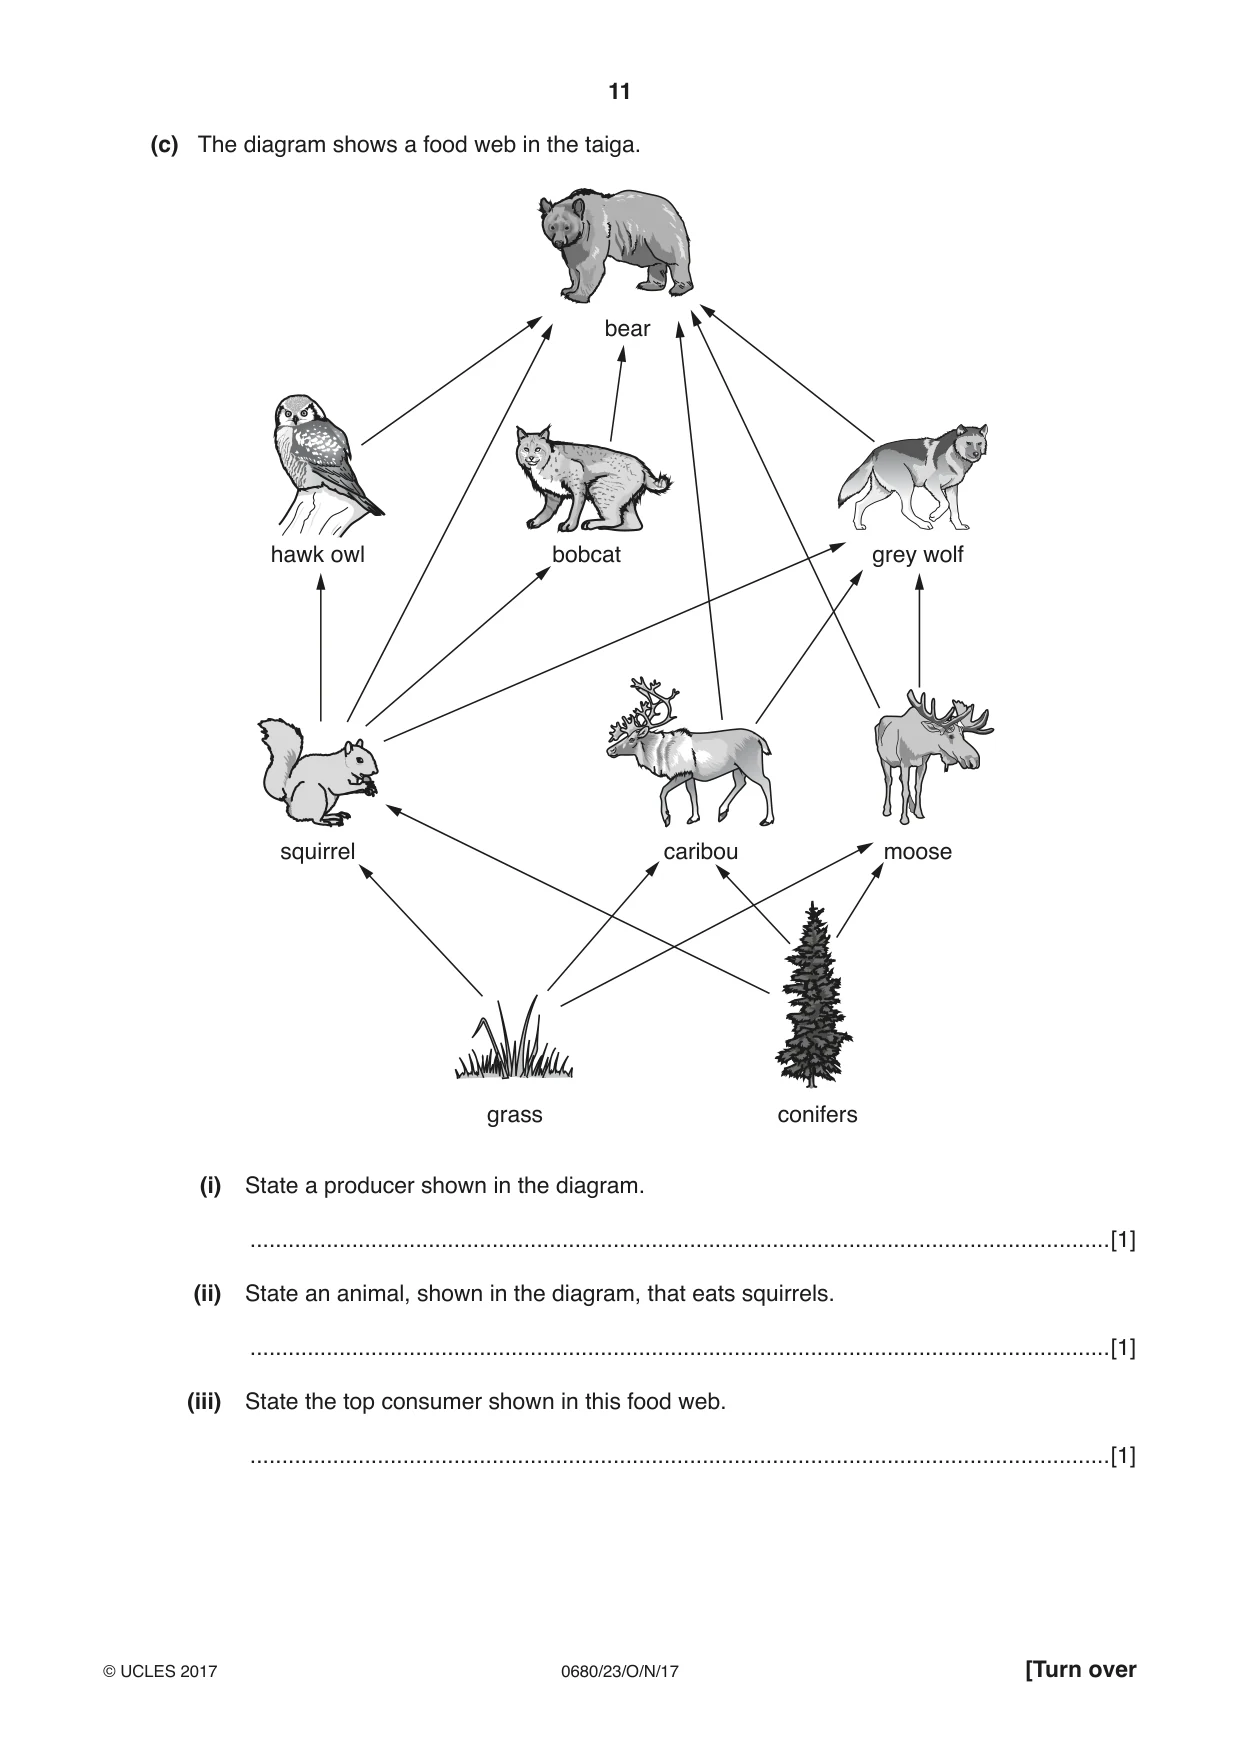
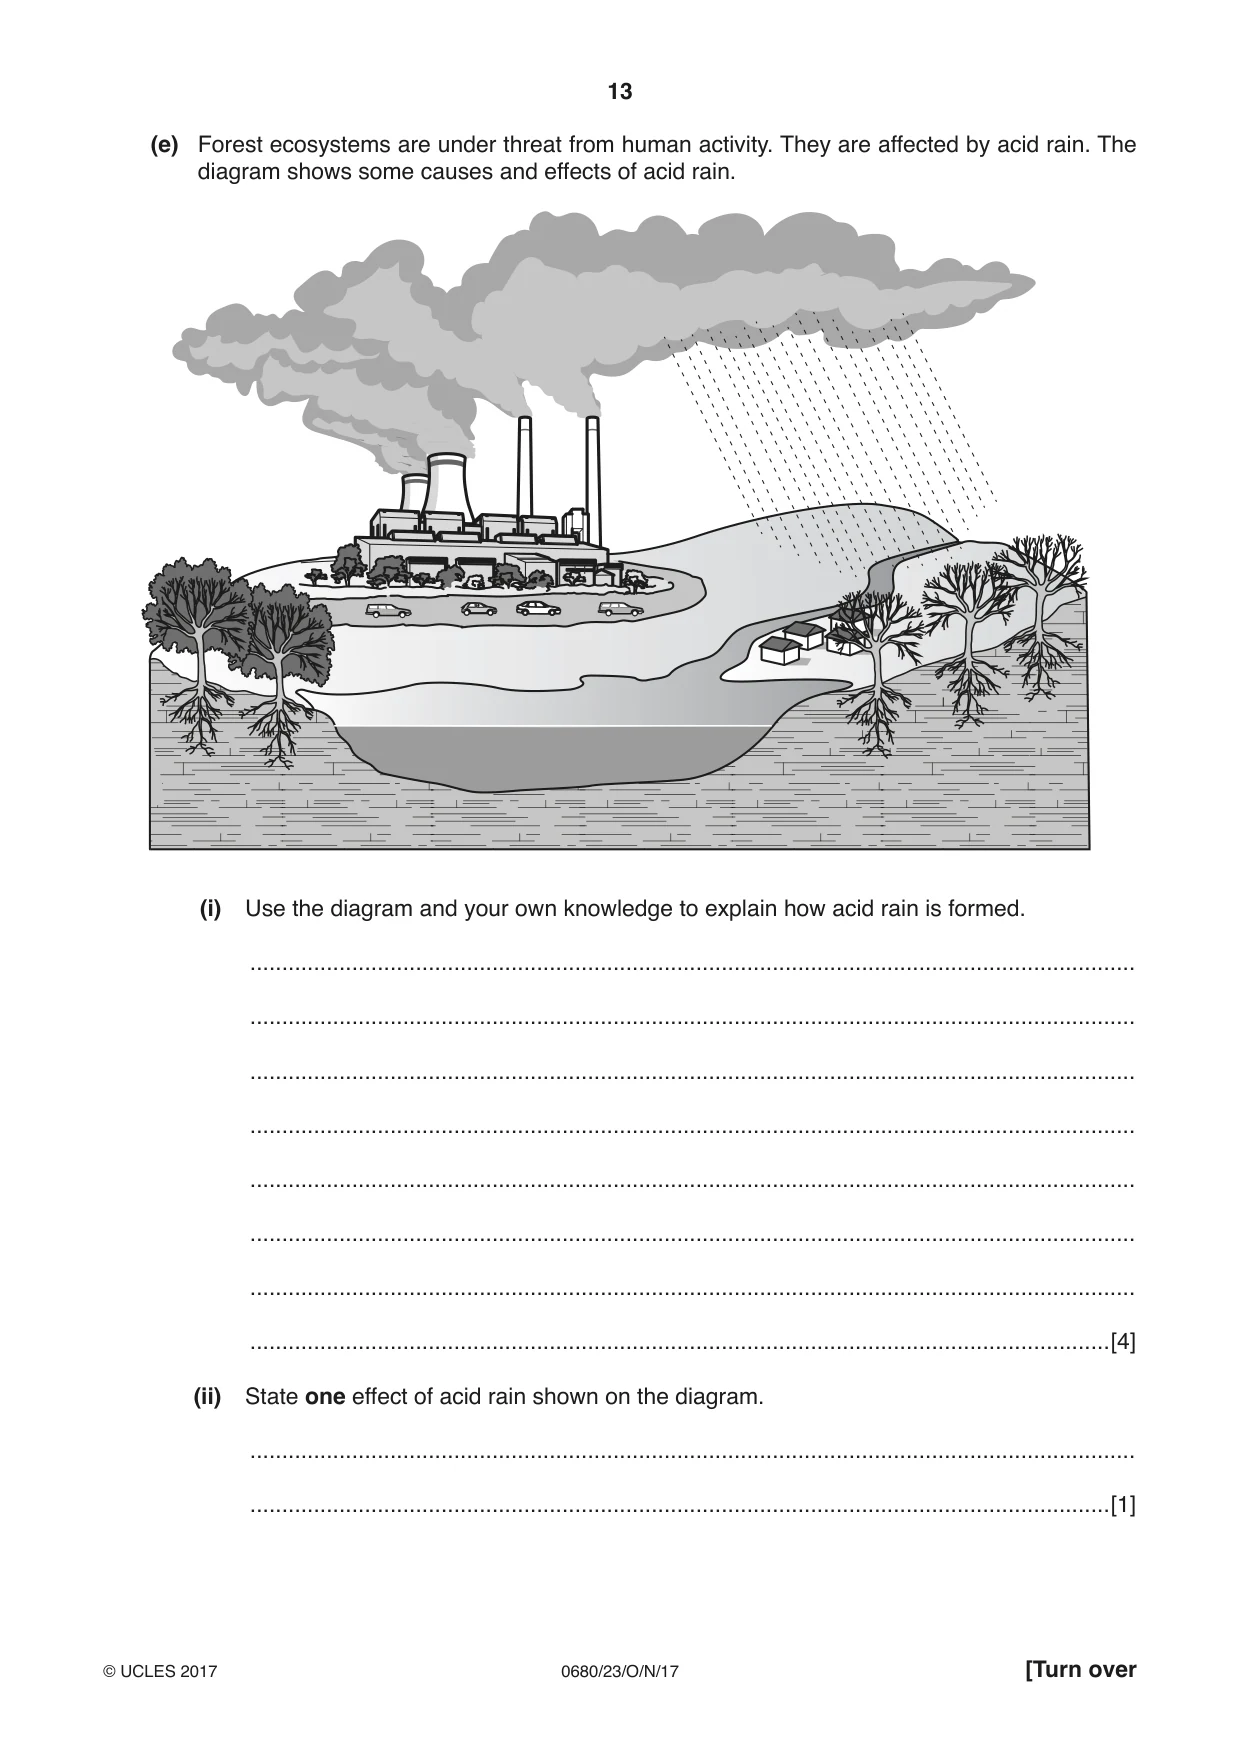
2 (a) The climate graph shows average temperature and precipitation for Fairbanks in Alaska, which has a cool temperate interior climate. 20 10 average 0 temperature / °C –10 75 –20 50 precipitation / mm –30 25 –40 0 Jan Feb Mar Apr May Jun Jul Aug Sep Oct Nov Dec month (i) Complete the table using information from the graph. lowest average temperature ....................°C month with the highest average temperature ...................................... annual average temperature range from .................... to .................... °C [3] (ii) Describe the pattern of precipitation throughout the year as shown by the graph. ........................................................................................................................................... ........................................................................................................................................... ........................................................................................................................................... ........................................................................................................................................... ........................................................................................................................................... .......................................................................................................................................[3] (iii) State the number of months in which precipitation will fall as snow. .......................................................................................................................................[1] (b) The information is about regions with a cool temperate interior climate. Winters are long and cold. There are strong winds and frequent snow falls. Summers are short. The vegetation that grows is coniferous forest or taiga. The vegetation has adapted to the climate. (i) Complete the table to explain how the trees are adapted for survival in this type of climate. adaptation explanation needle shaped leaves thick bark downward sloping branches [3] (ii) Suggest why it takes a long time for the leaves on the forest floor to decompose in this climate. ........................................................................................................................................... ........................................................................................................................................... ........................................................................................................................................... .......................................................................................................................................[2] (c) The diagram shows a food web in the taiga. bear hawk owl bobcat grey wolf squirrel caribou moose grass conifers (i) State a producer shown in the diagram. .......................................................................................................................................[1] (ii) State an animal, shown in the diagram, that eats squirrels. .......................................................................................................................................[1] (iii) State the top consumer shown in this food web. .......................................................................................................................................[1]
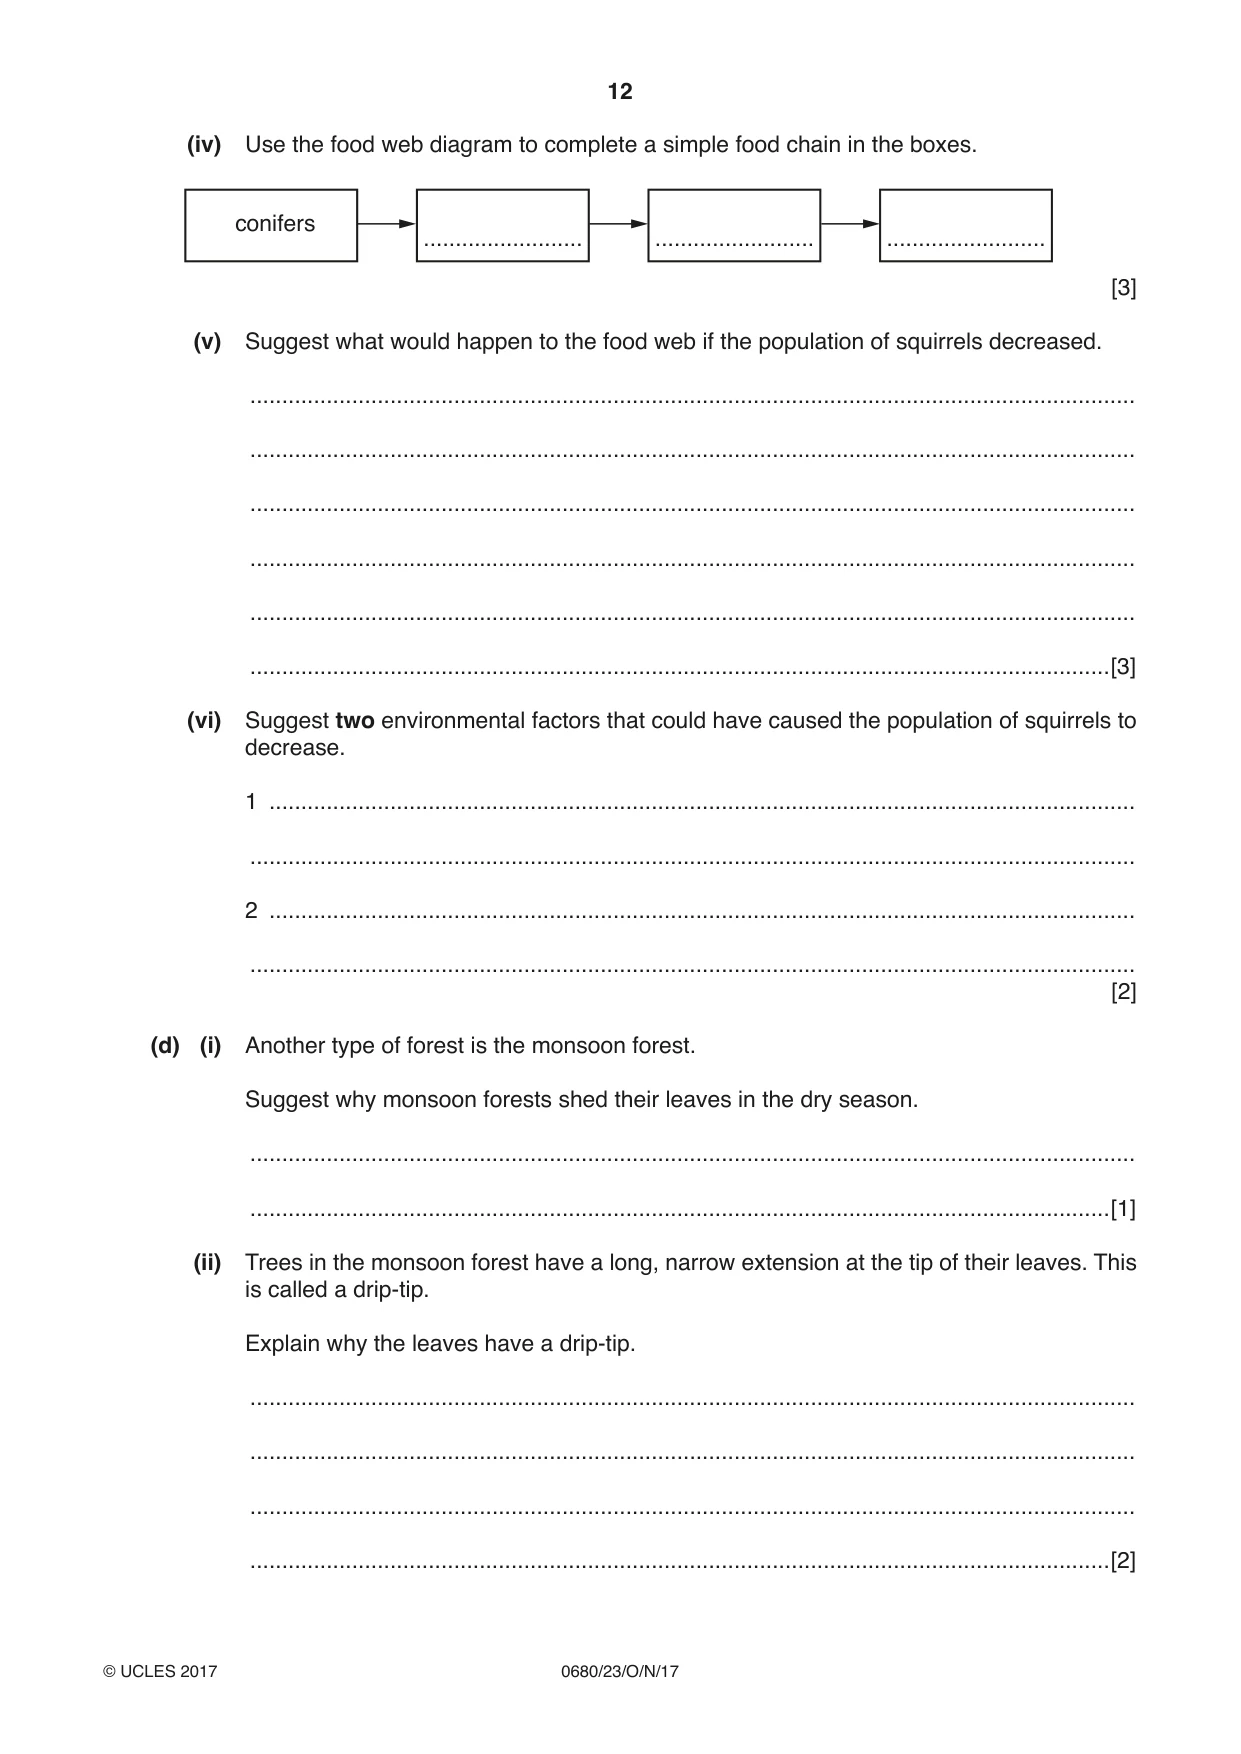
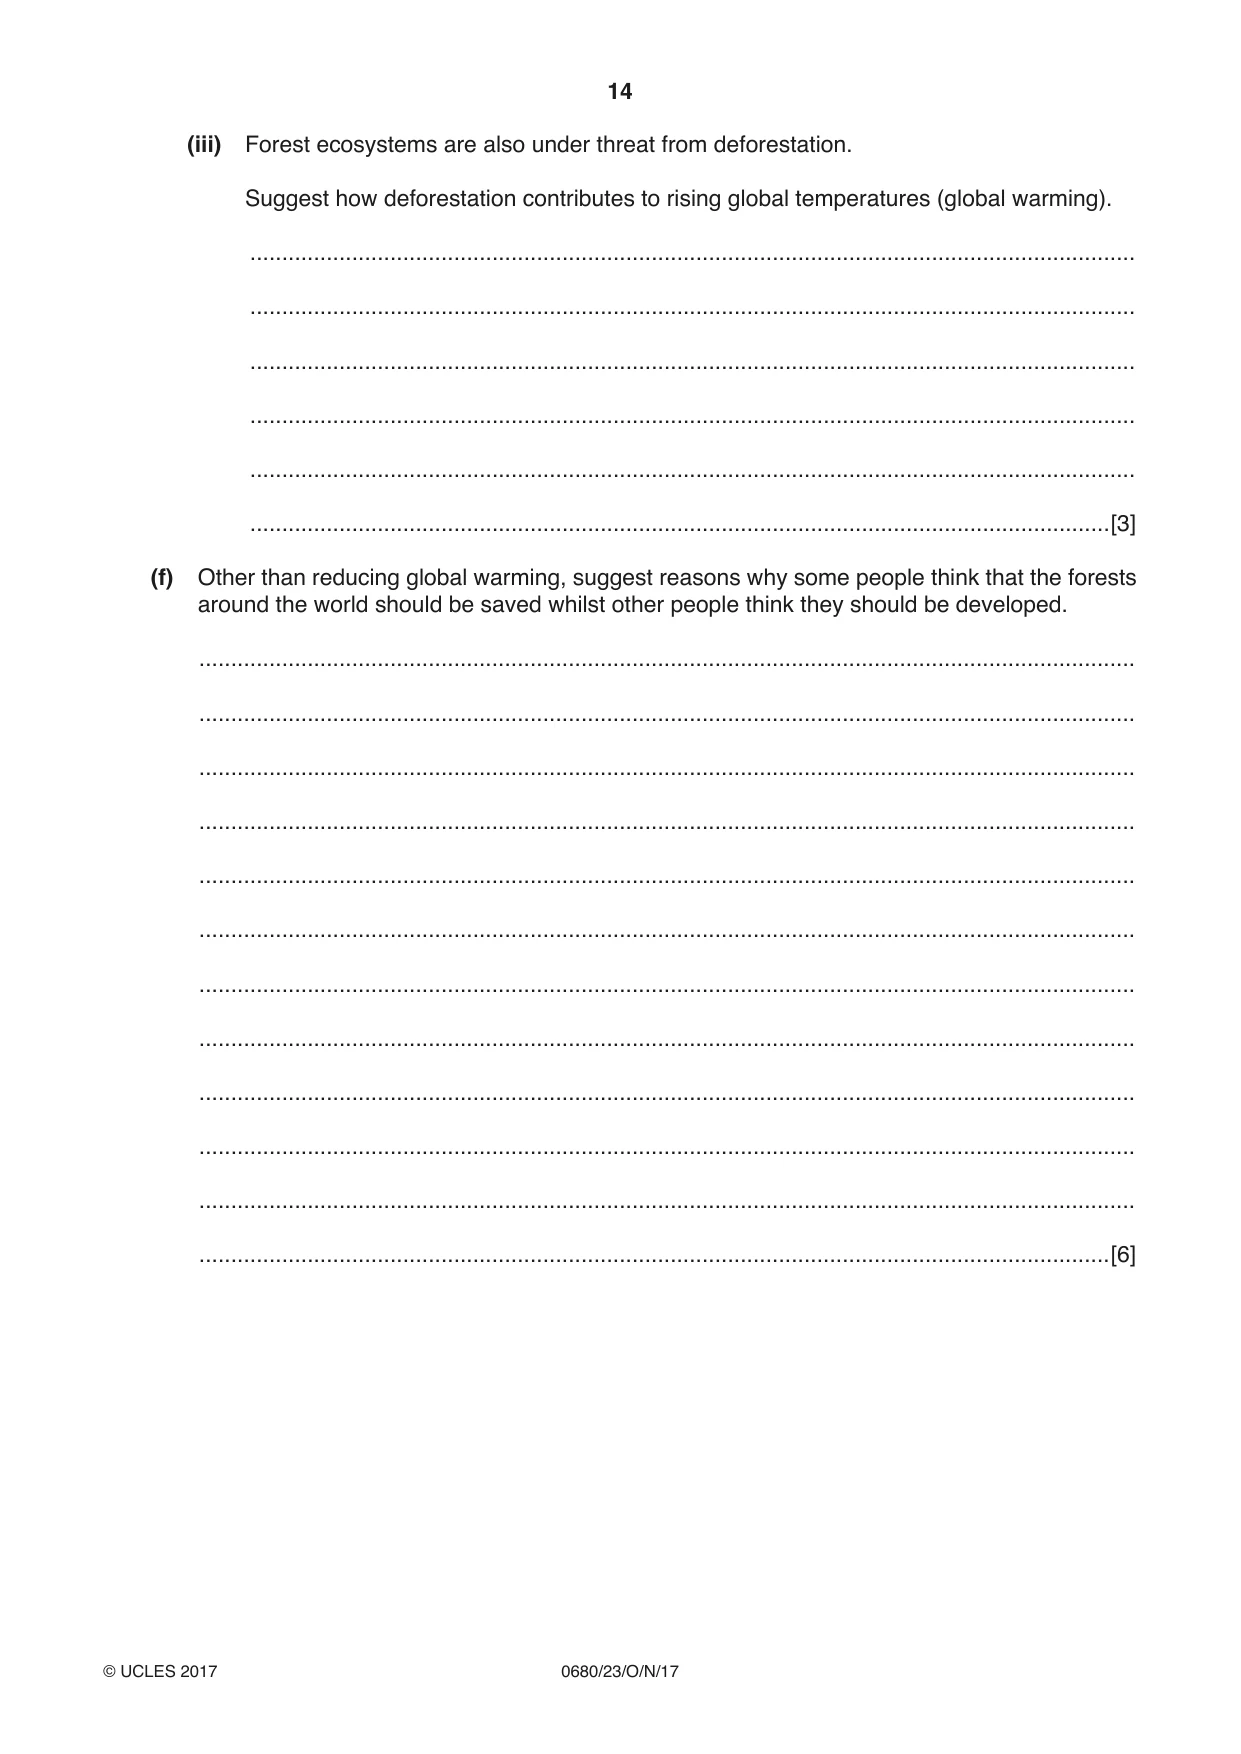
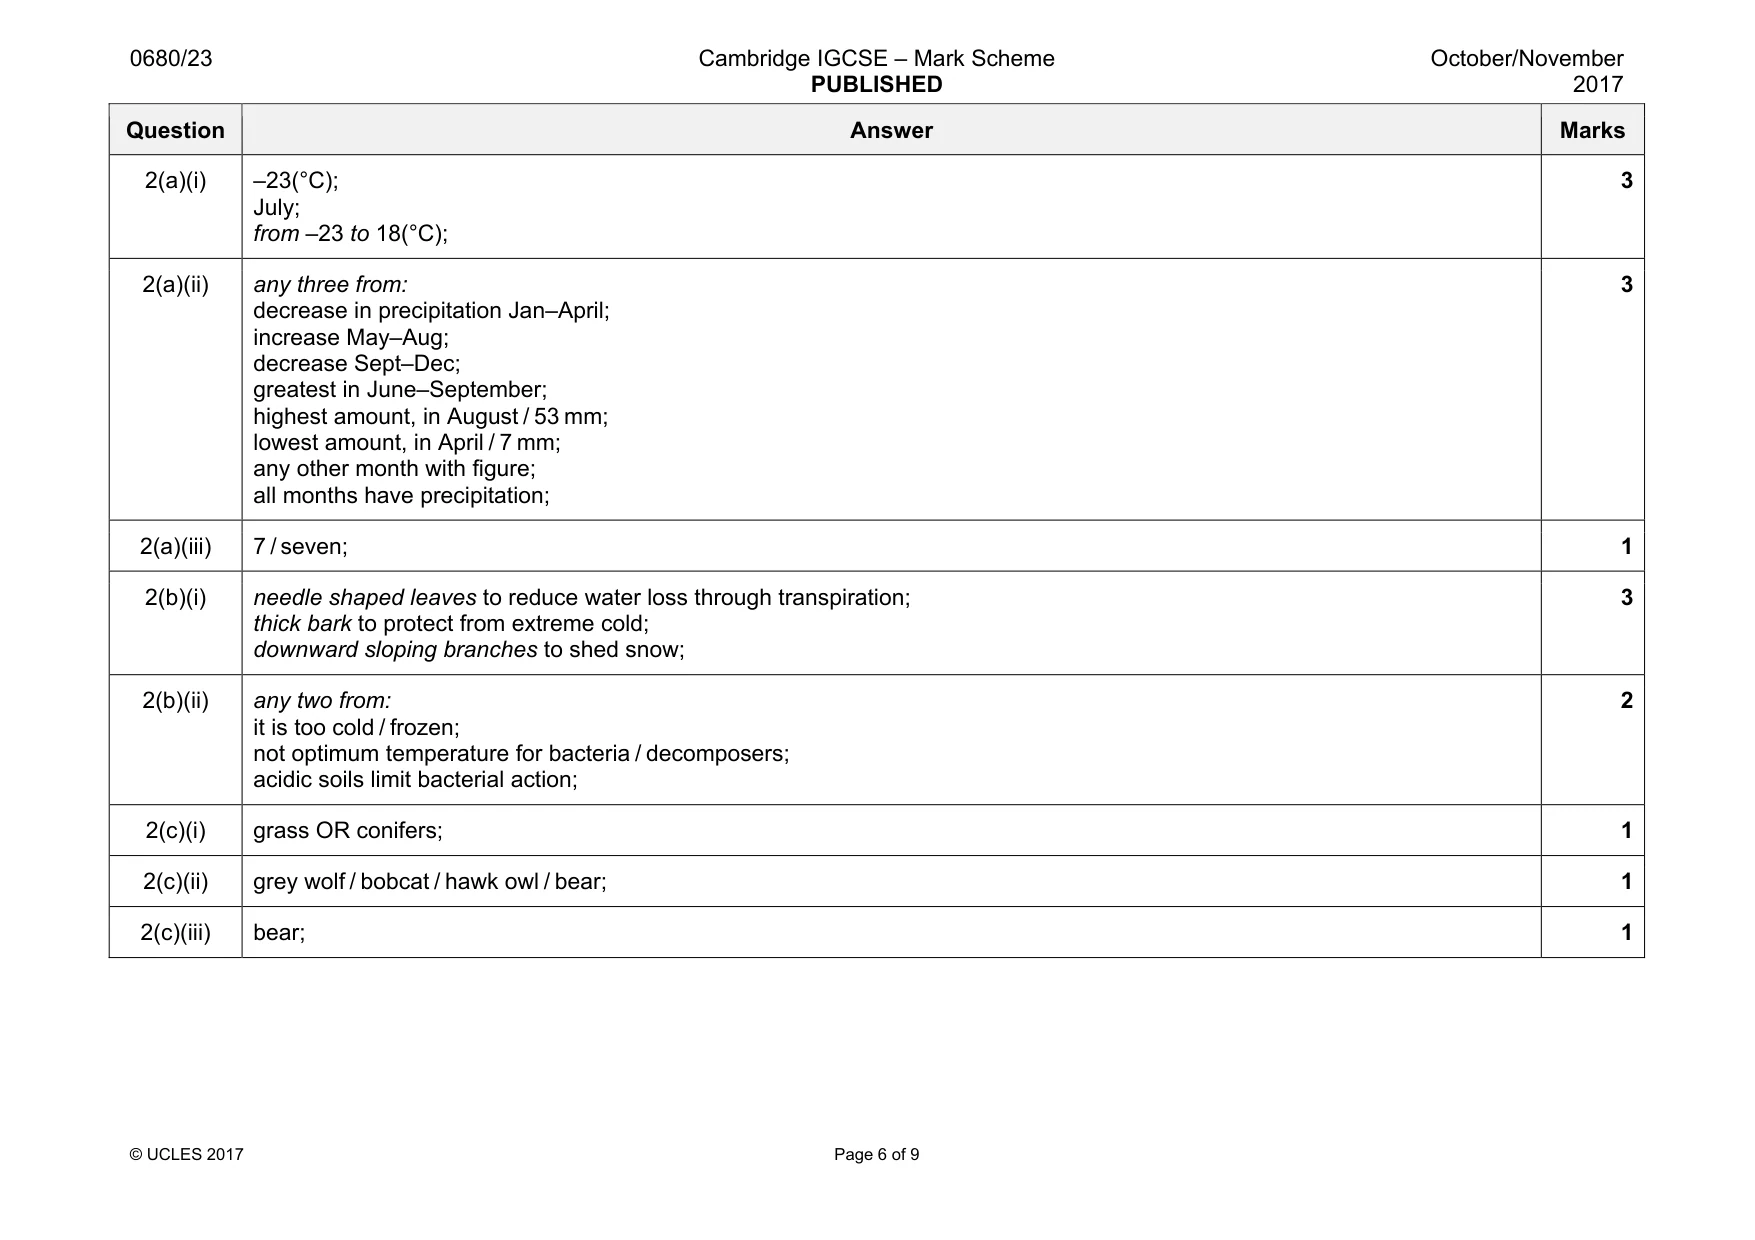
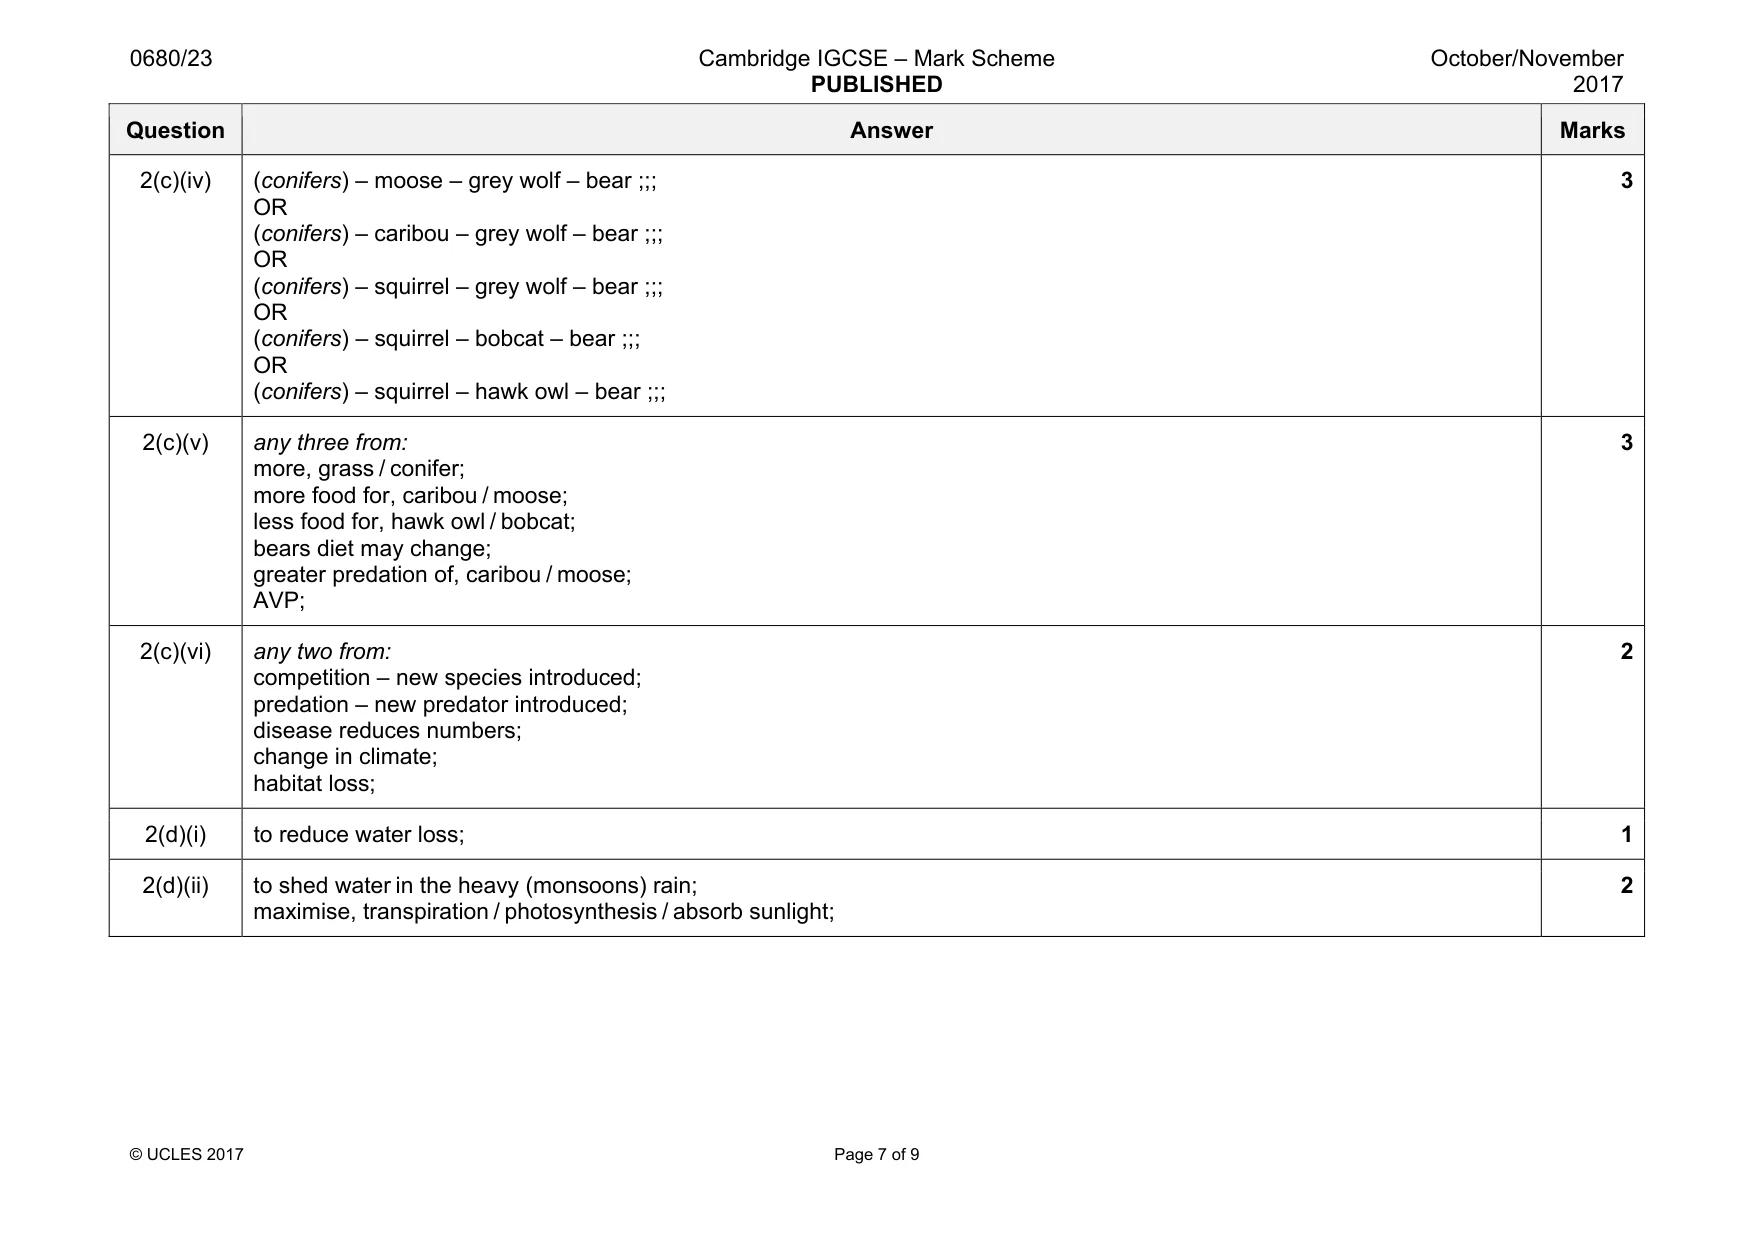
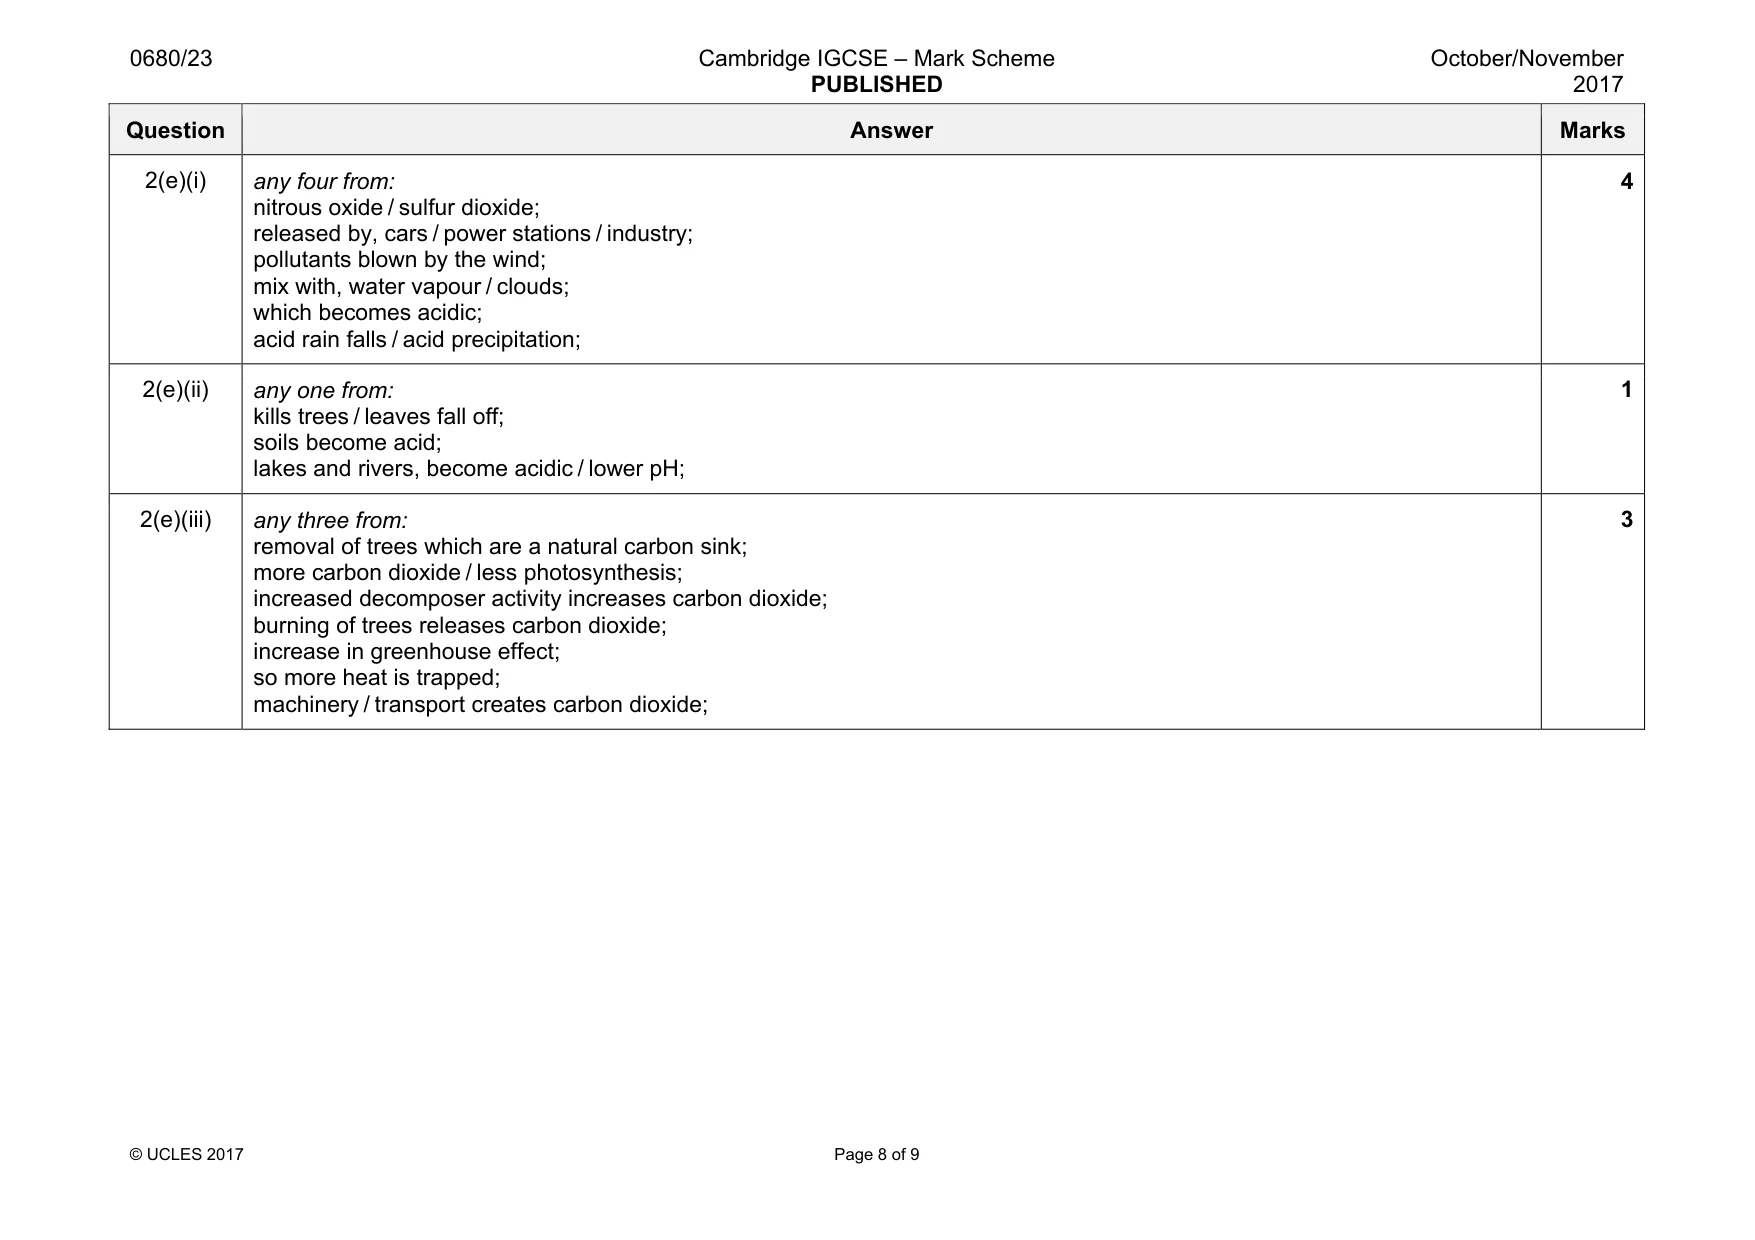
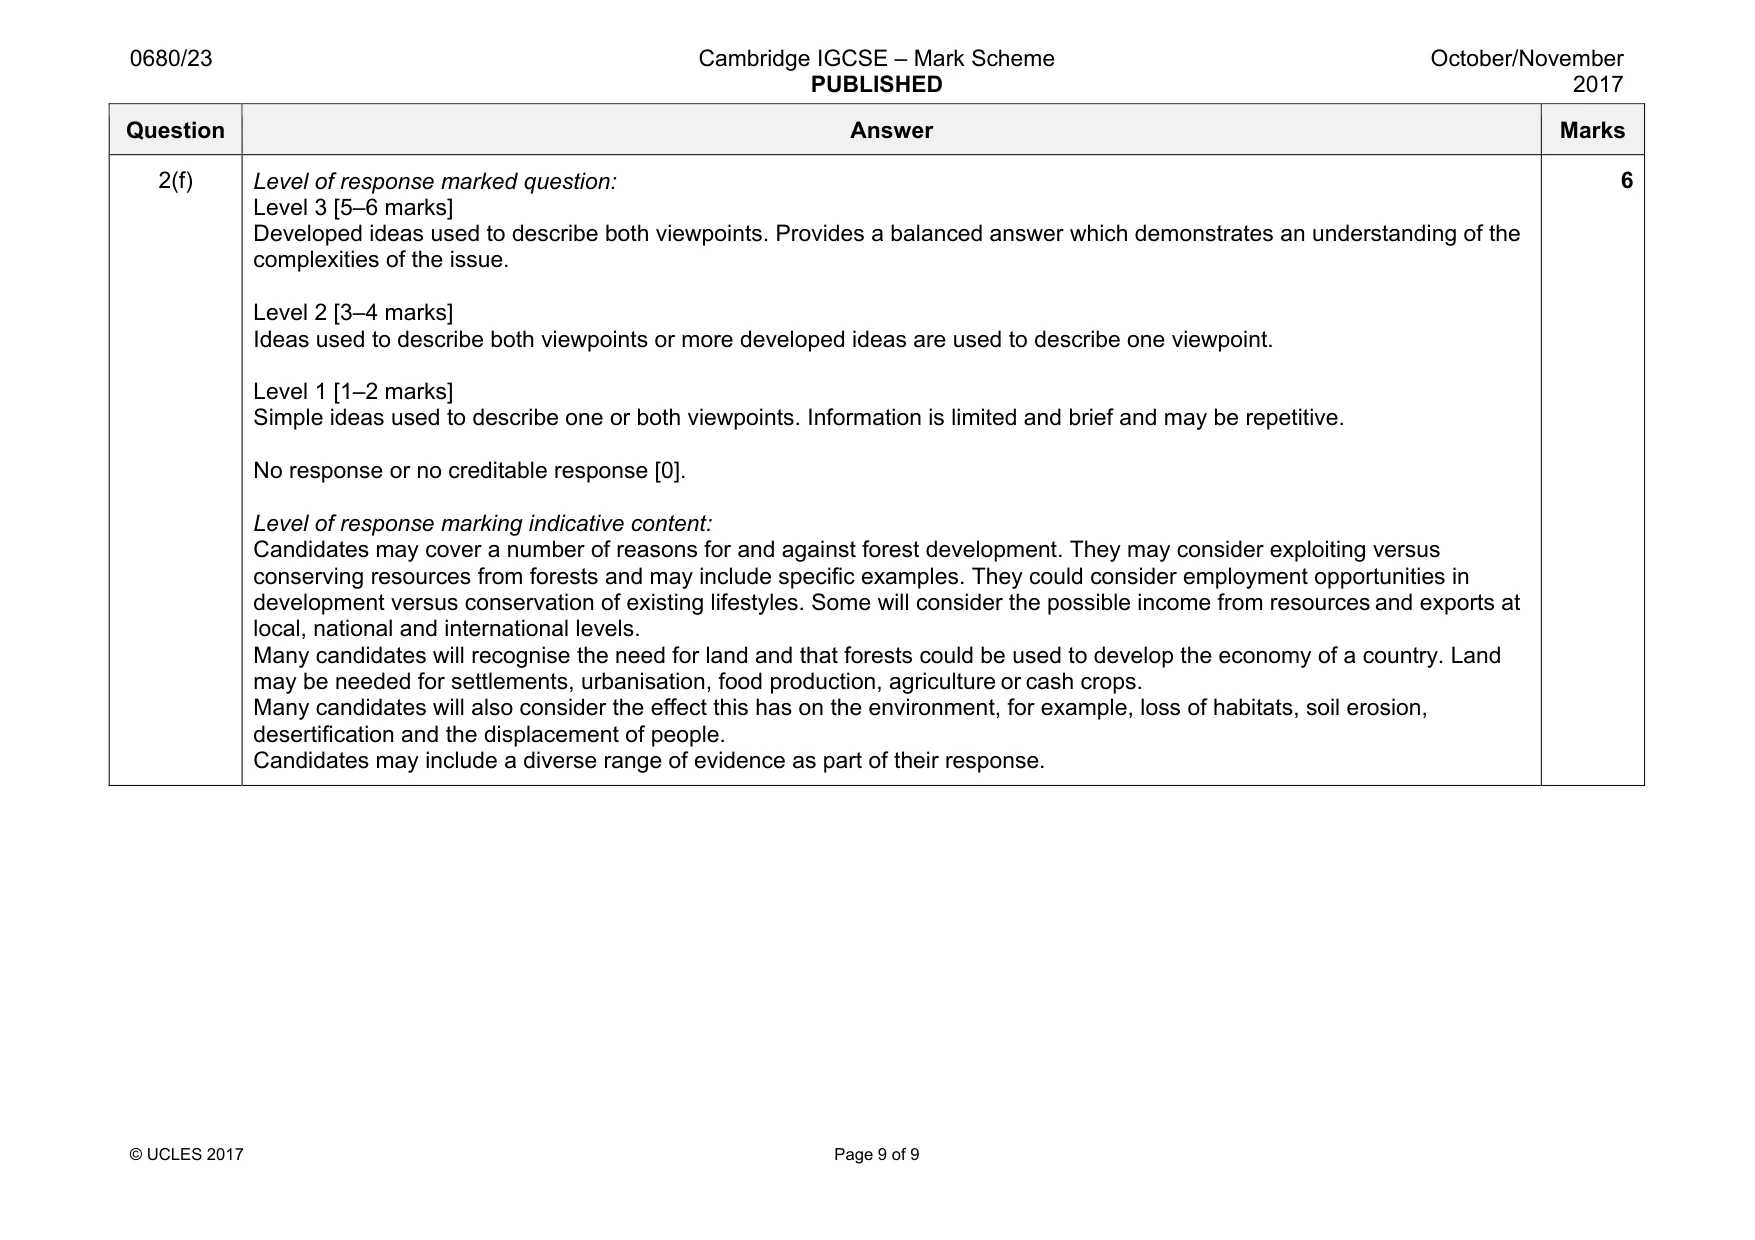
Mark scheme: 2(a)(i) –23(°C); July; from –23 to 18(°C); 3 2(a)(ii) any three from: decrease in precipitation Jan–April; increase May–Aug; decrease Sept–Dec; greatest in June–September; highest amount, in August / 53 mm; lowest amount, in April / 7 mm; any other month with figure; all months have precipitation; 3 2(a)(iii) 7 / seven; 1 2(b)(i) needle shaped leaves to reduce water loss through transpiration; thick bark to protect from extreme cold; downward sloping branches to shed snow; 3 2(b)(ii) any two from: it is too cold / frozen; not optimum temperature for bacteria / decomposers; acidic soils limit bacterial action; 2 2(c)(i) grass OR conifers; 1 2(c)(ii) grey wolf / bobcat / hawk owl / bear; 1 2(c)(iii) bear; 1 Question Answer Marks 2(c)(iv) (conifers) – moose – grey wolf – bear ;;; OR (conifers) – caribou – grey wolf – bear ;;; OR (conifers) – squirrel – grey wolf – bear ;;; OR (conifers) – squirrel – bobcat – bear ;;; OR (conifers) – squirrel – hawk owl – bear ;;; 3 2(c)(v) any three from: more, grass / conifer; more food for, caribou / moose; less food for, hawk owl / bobcat; bears diet may change; greater predation of, caribou / moose; AVP; 3 2(c)(vi) any two from: competition – new species introduced; predation – new predator introduced; disease reduces numbers; change in climate; habitat loss; 2 2(d)(i) to reduce water loss; 1 2(d)(ii) to shed water in the heavy (monsoons) rain; maximise, transpiration / photosynthesis / absorb sunlight; 2 Question Answer Marks 2(e)(i) any four from: nitrous oxide / sulfur dioxide; released by, cars / power stations / industry; pollutants blown by the wind; mix with, water vapour / clouds; which becomes acidic; acid rain falls / acid precipitation; 4 2(e)(ii) any one from: kills trees / leaves fall off; soils become acid; lakes and rivers, become acidic / lower pH; 1 2(e)(iii) any three from: removal of trees which are a natural carbon sink; more carbon dioxide / less photosynthesis; increased decomposer activity increases carbon dioxide; burning of trees releases carbon dioxide; increase in greenhouse effect; so more heat is trapped; machinery / transport creates carbon dioxide; 3 Question Answer Marks 2(f) Level of response marked question: Level 3 [5–6 marks] Developed ideas used to describe both viewpoints. Provides a balanced answer which demonstrates an understanding of the complexities of the issue. Level 2 [3–4 marks] Ideas used to describe both viewpoints or more developed ideas are used to describe one viewpoint. Level 1 [1–2 marks] Simple ideas used to describe one or both viewpoints. Information is limited and brief and may be repetitive. No response or no creditable response [0]. Level of response marking indicative content: Candidates may cover a number of reasons for and against forest development. They may consider exploiting versus conserving resources from forests and may include specific examples. They could consider employment opportunities in development versus conservation of existing lifestyles. Some will consider the possible income from resources and exports at local, national and international levels. Many candidates will recognise the need for land and that forests could be used to develop the economy of a country. Land may be needed for settlements, urbanisation, food production, agriculture or cash crops. Many candidates will also consider the effect this has on the environment, for example, loss of habitats, soil erosion, desertification and the displacement of people. Candidates may include a diverse range of evidence as part of their response. 6
What was in this paper
The subtopics covered by these 2 questions, and how many questions each got. Open one in a new tab to see every Cambridge question on it.
What you needed in this session
Cambridge’s own grade thresholds for 2017 Oct/Nov, Paper 2 · Variant 3. A higher threshold means an easier paper — the bar moves with how the cohort did.