Cambridge IGCSE Environmental Management 0680 — 2017 Oct/Nov Paper 2 · Variant 1
0680/21/O/N/17 · 2 questions · 80 marks · ≈90 min
The question paper and its mark scheme, free to read here and free to download. This is Cambridge’s own paper, exactly as it was sat.
Question paper16 pages
Mark scheme8 pages
Answers below. Sit the paper first if you are practising.

Questions as text
Q1 · The diagram shows the distribution of water on Earth
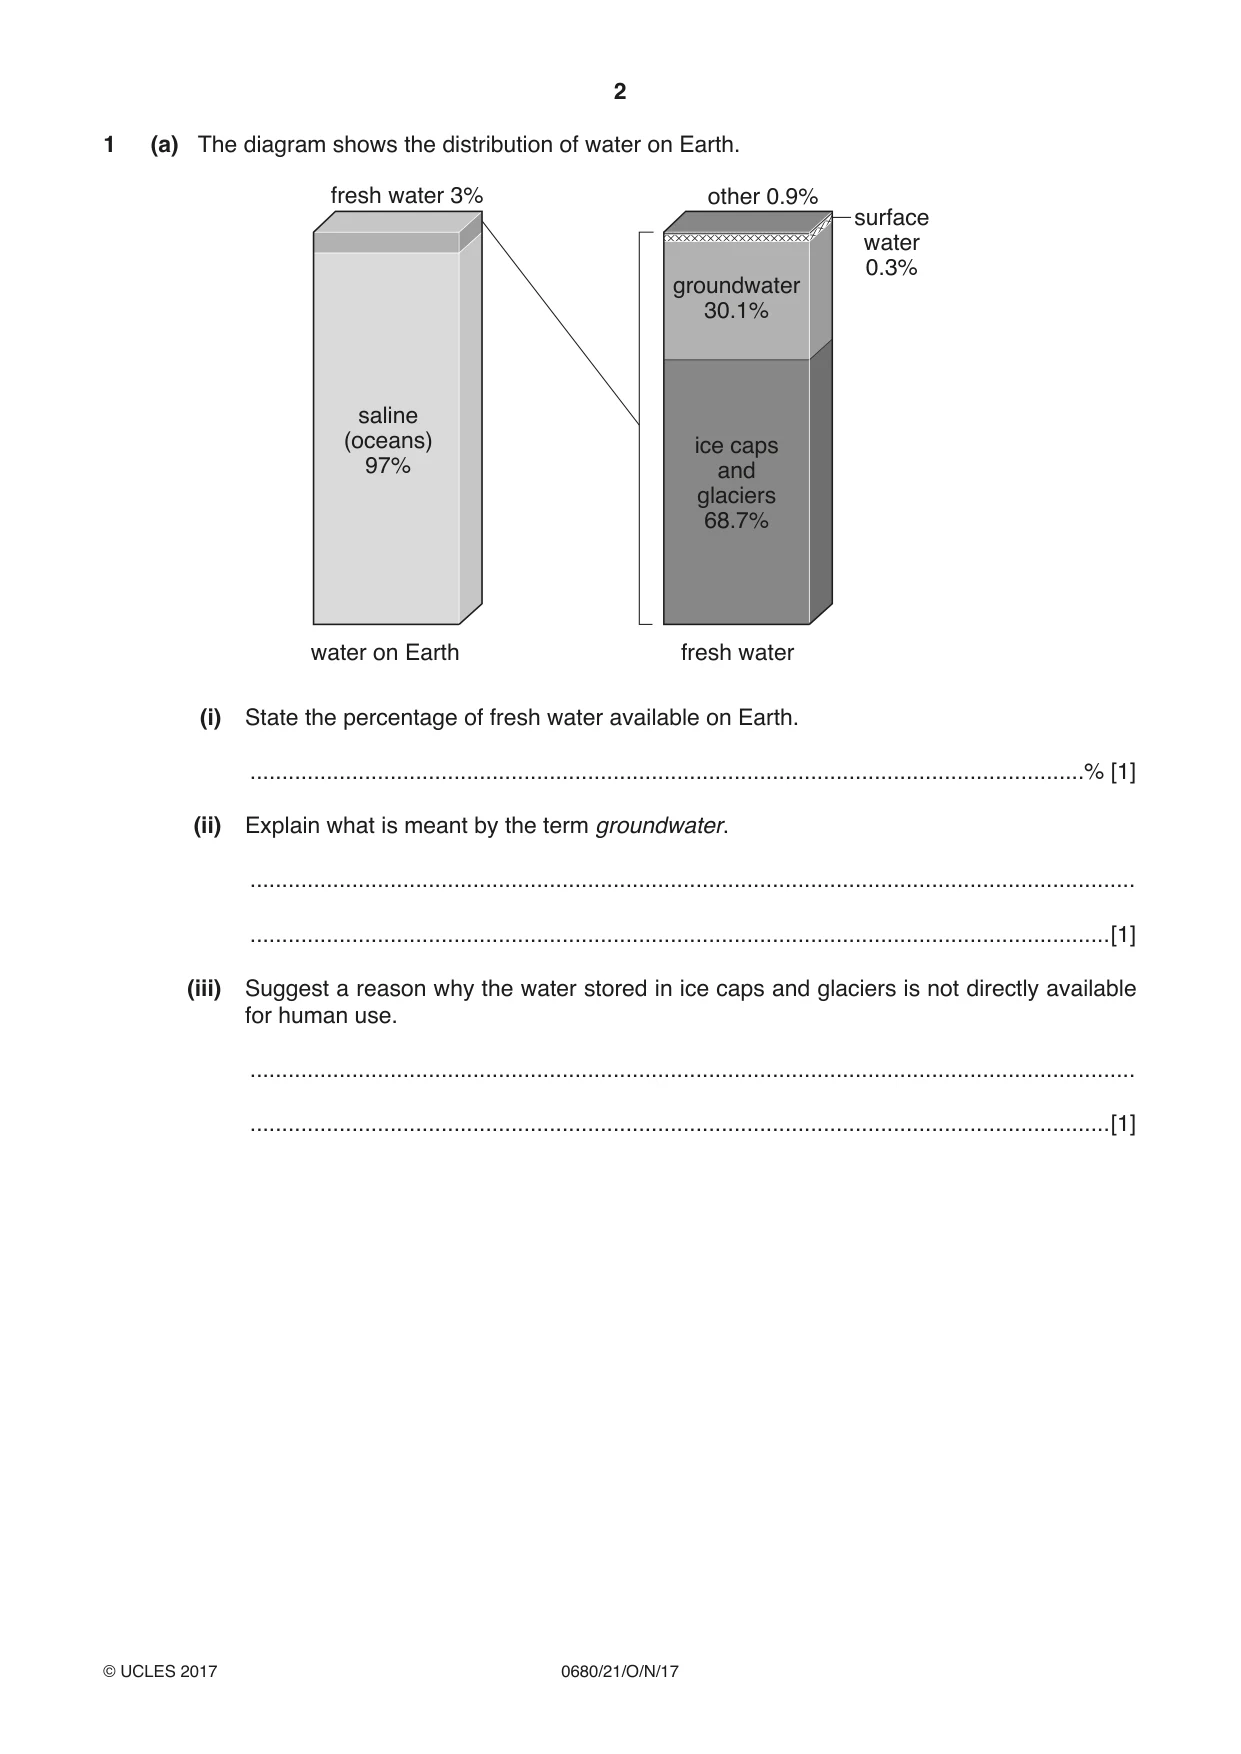
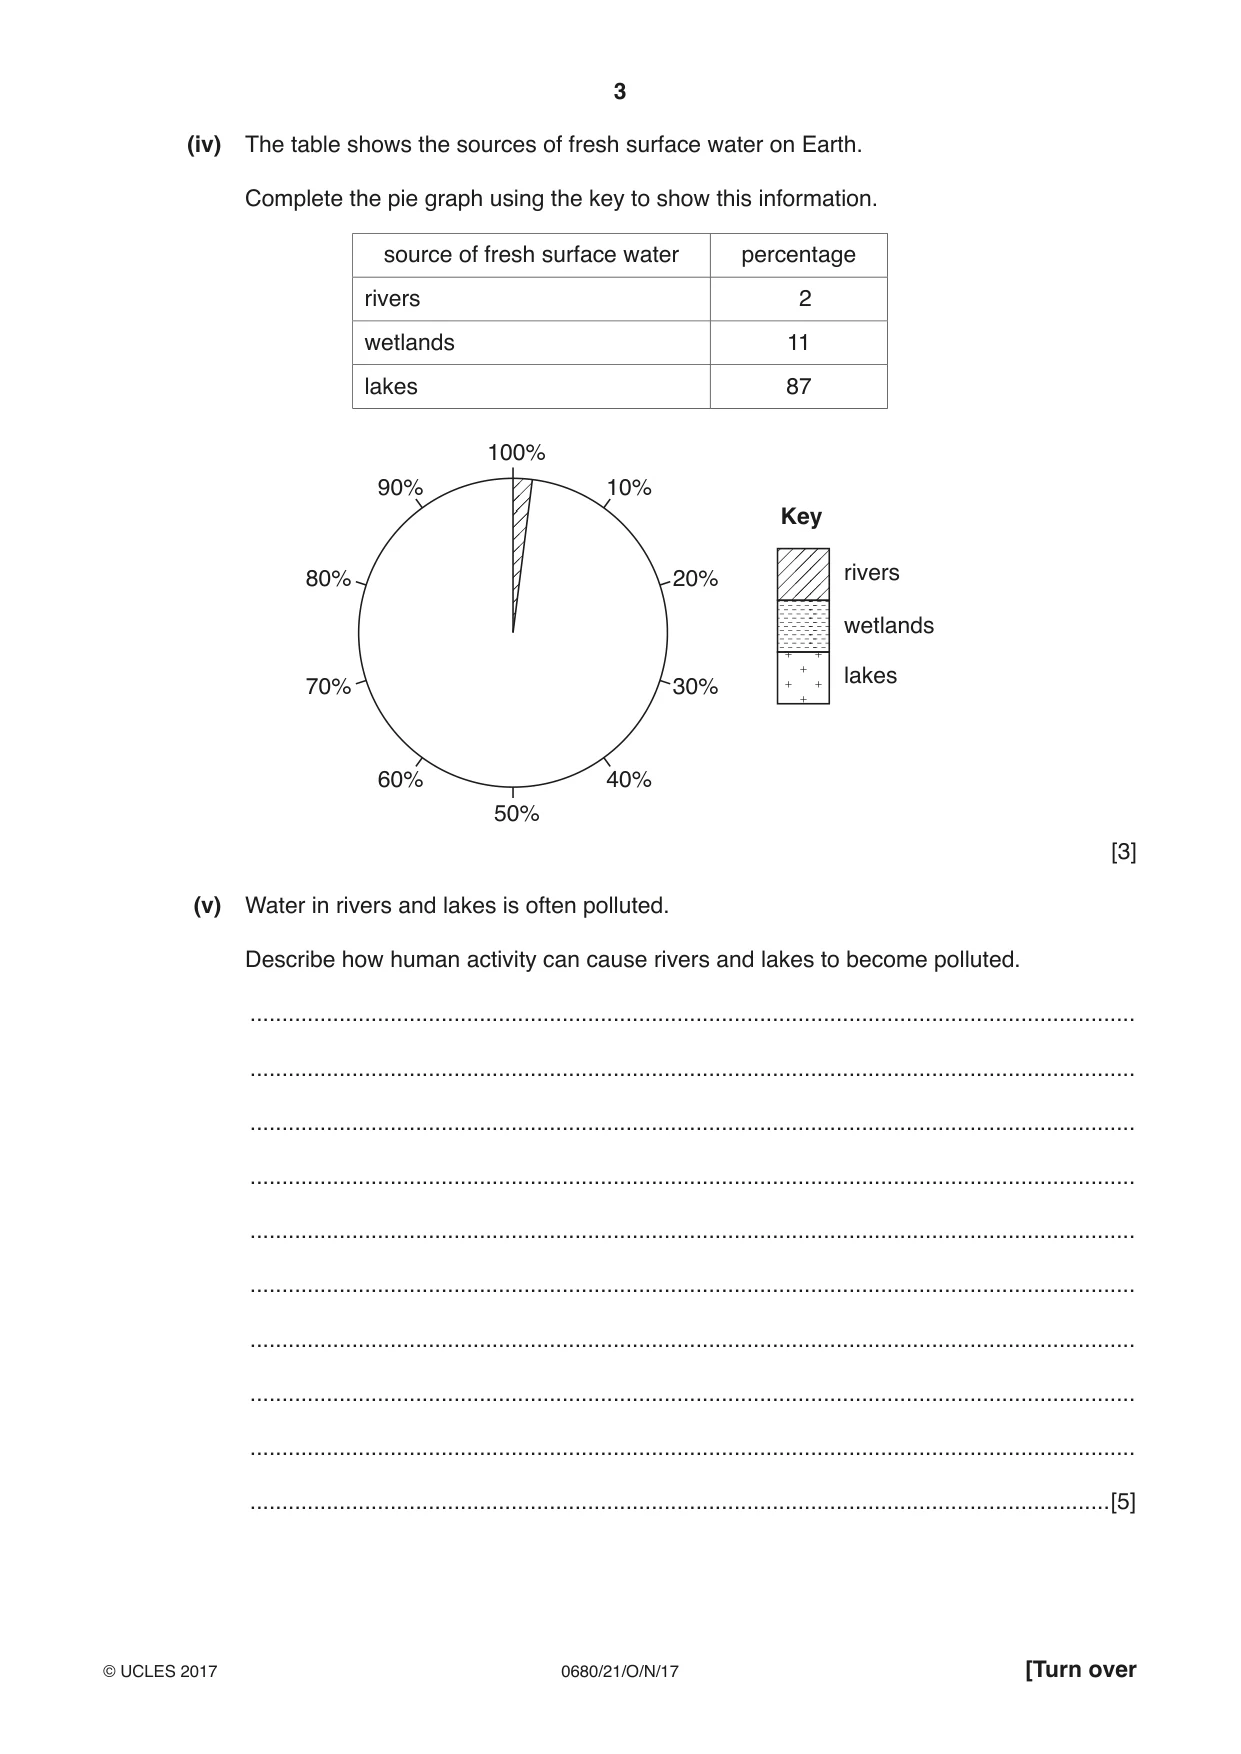
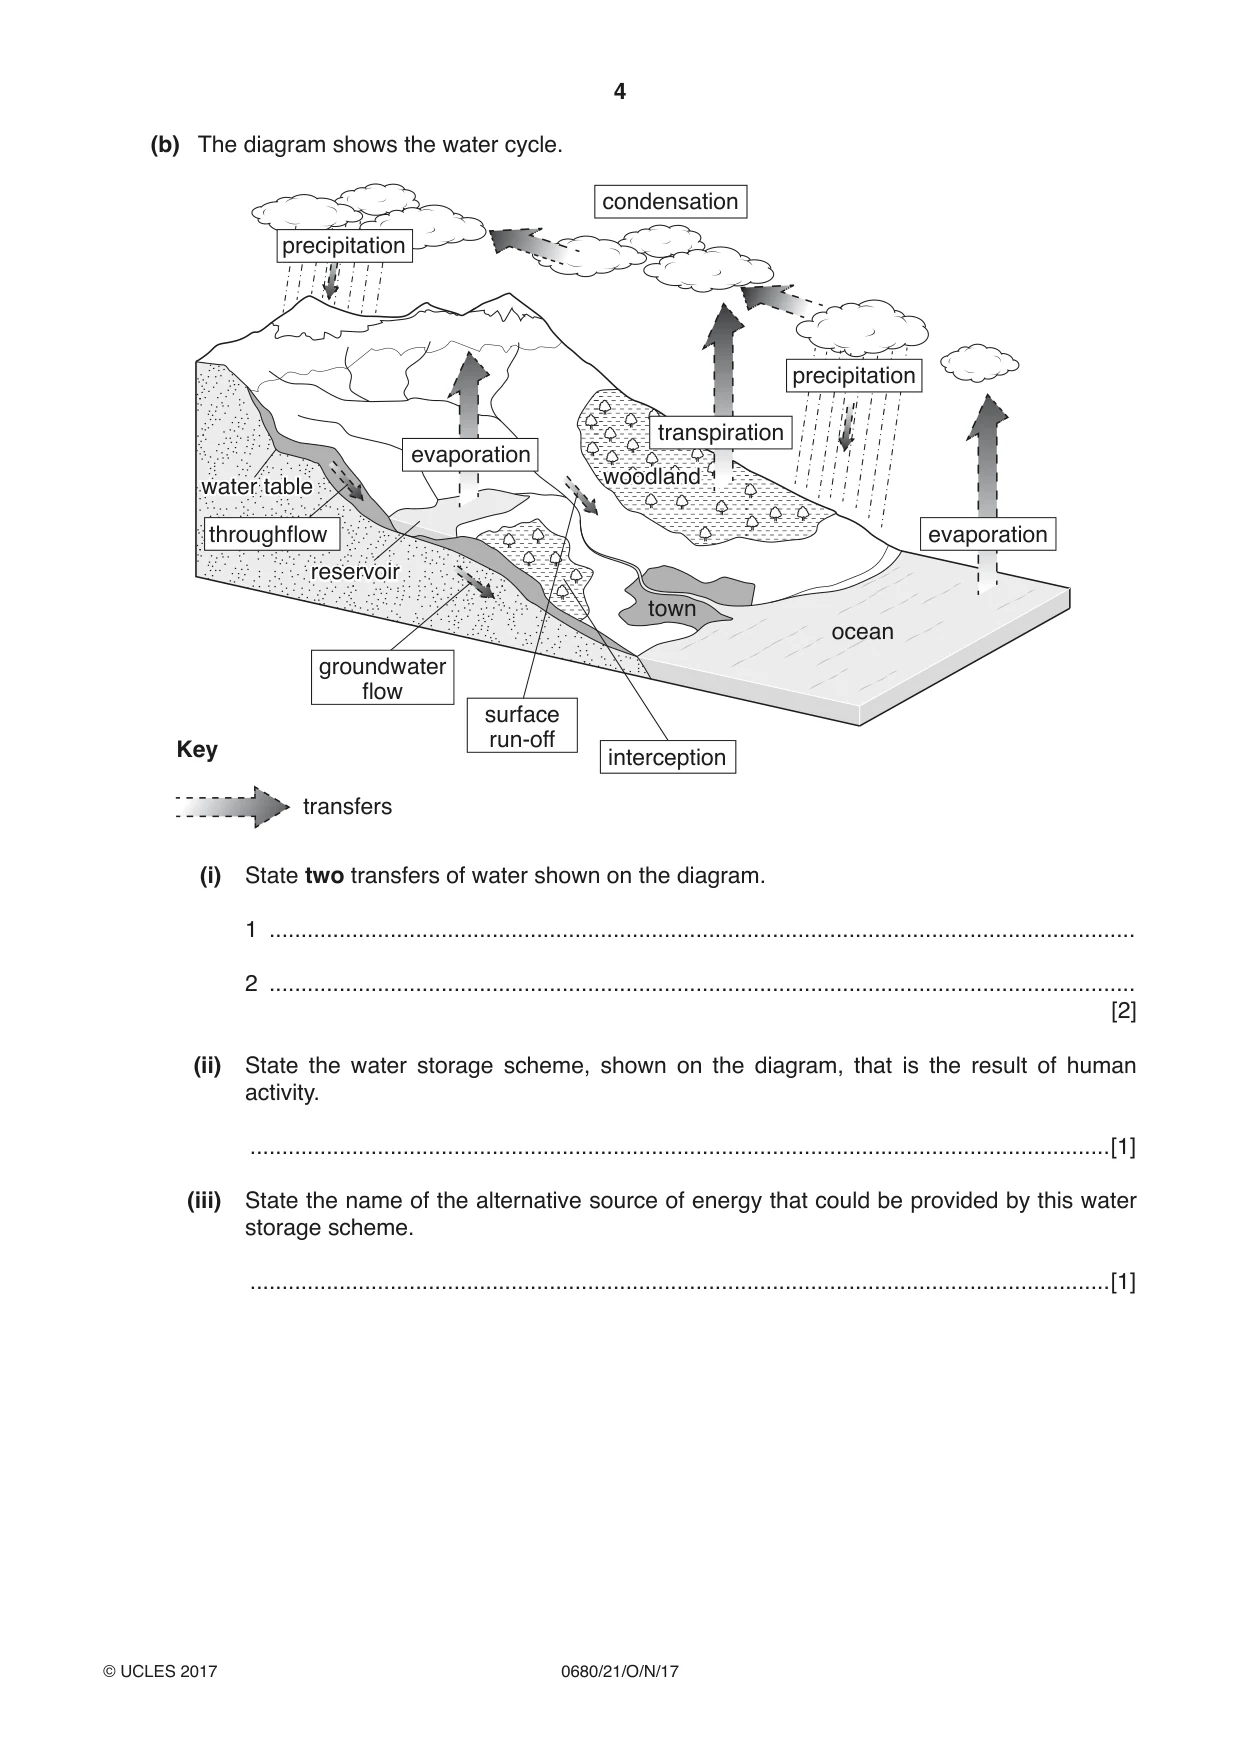
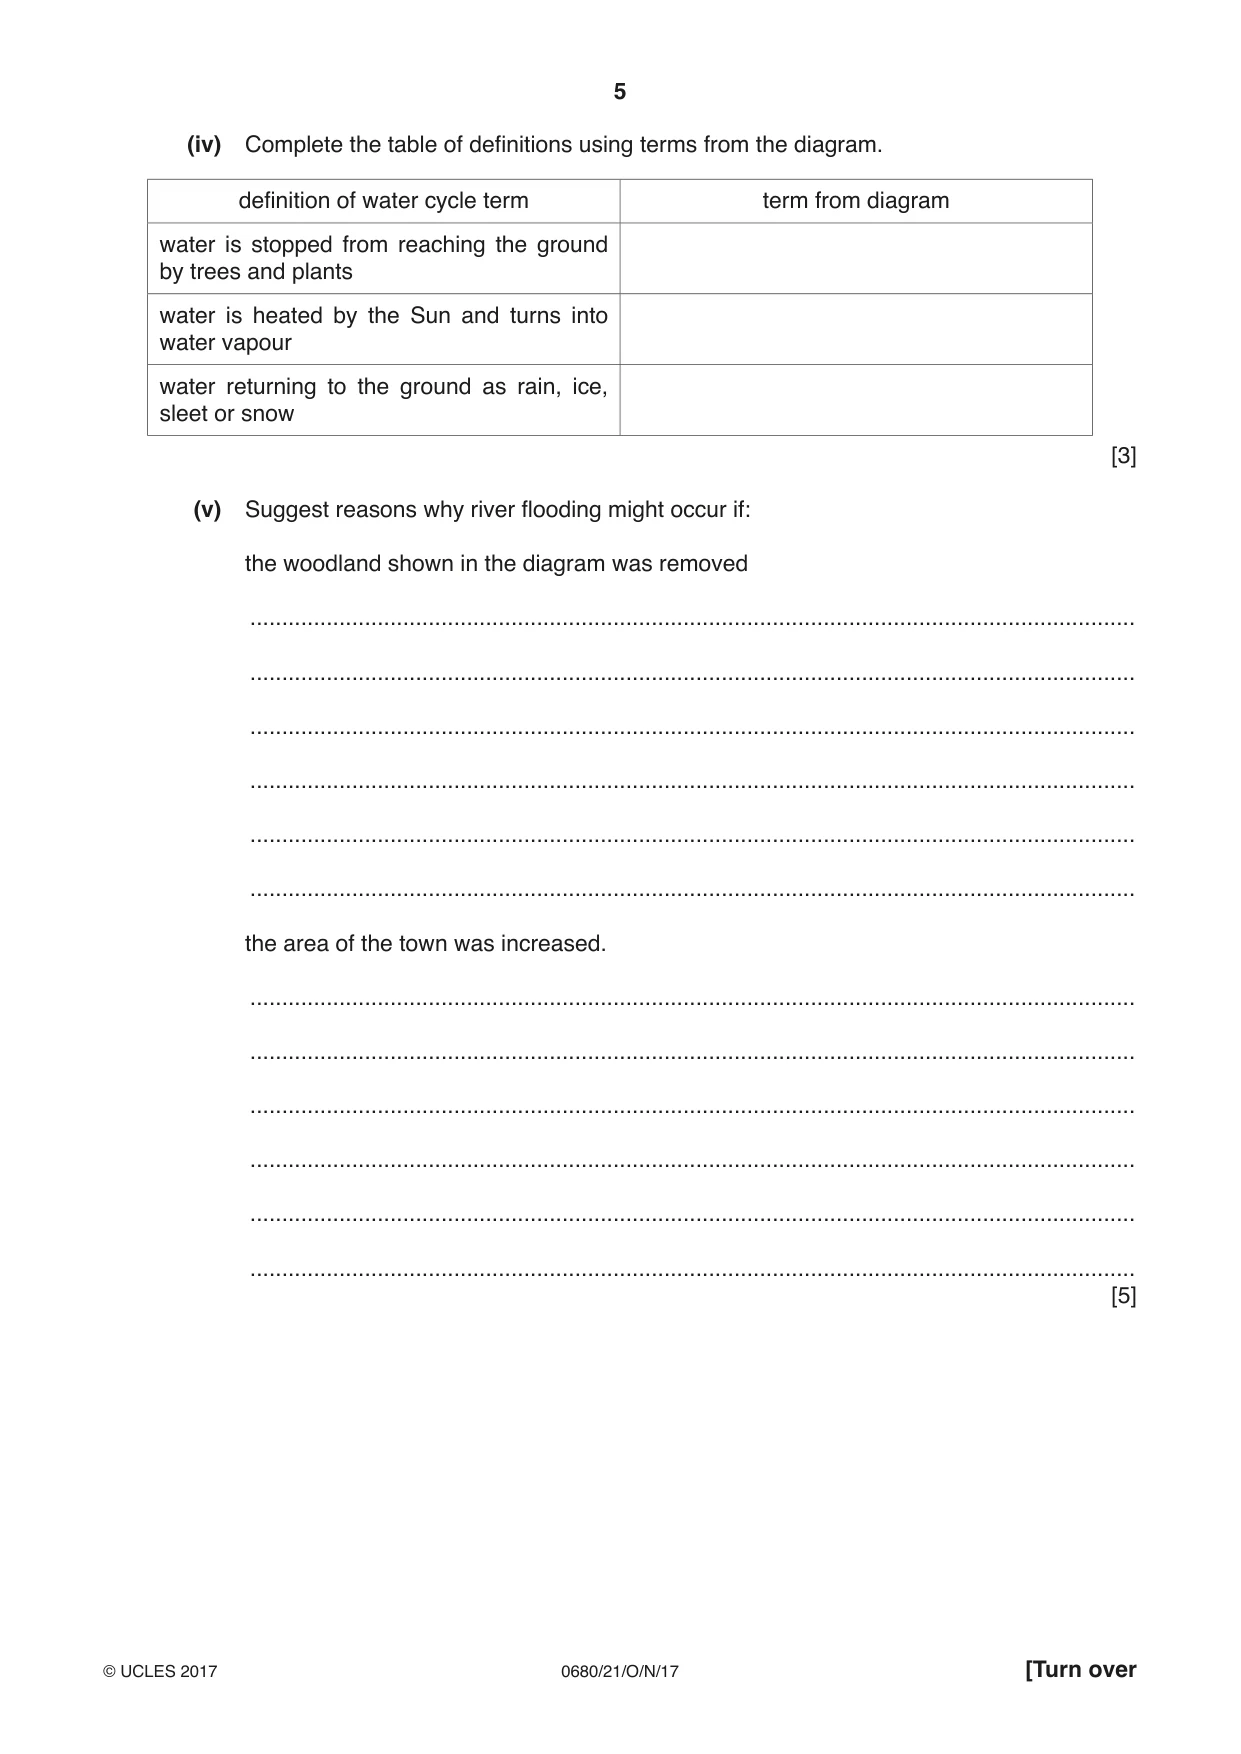
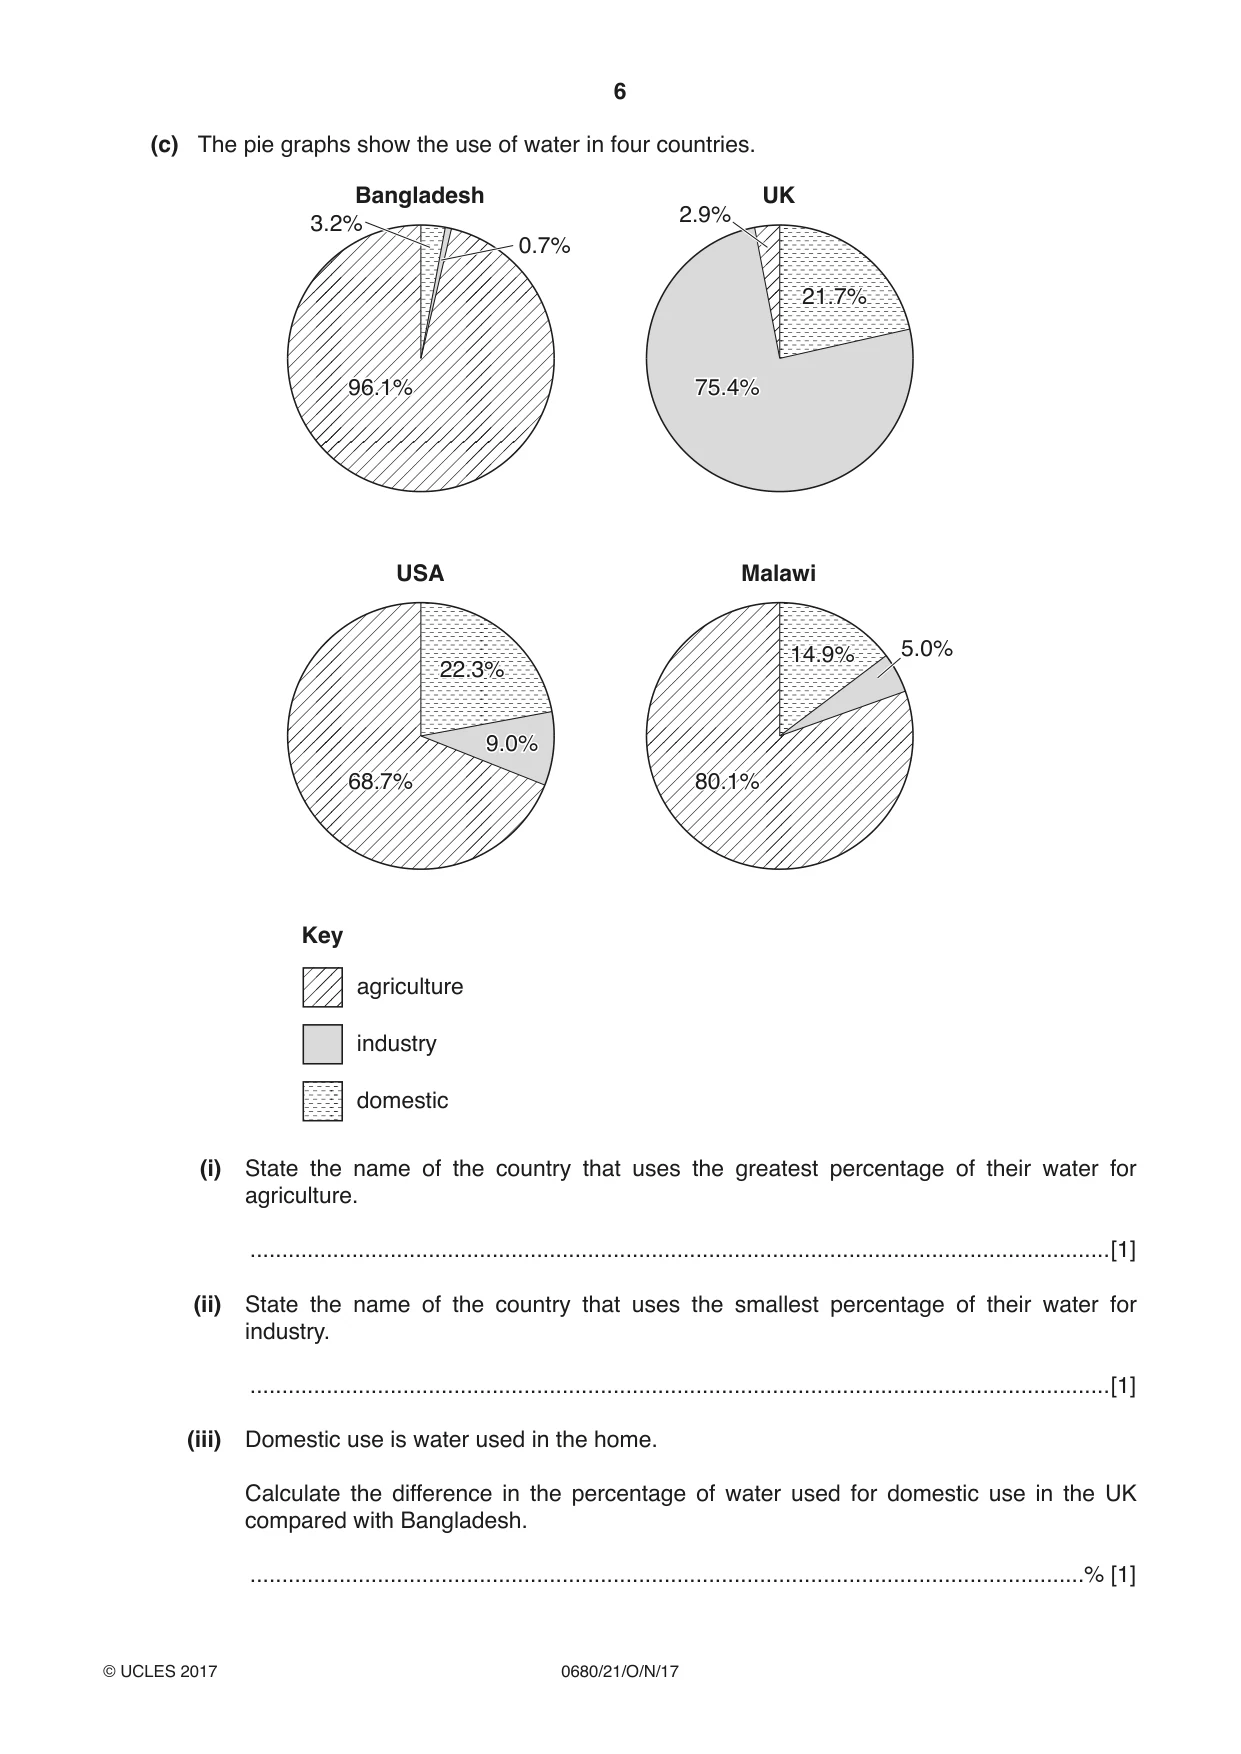
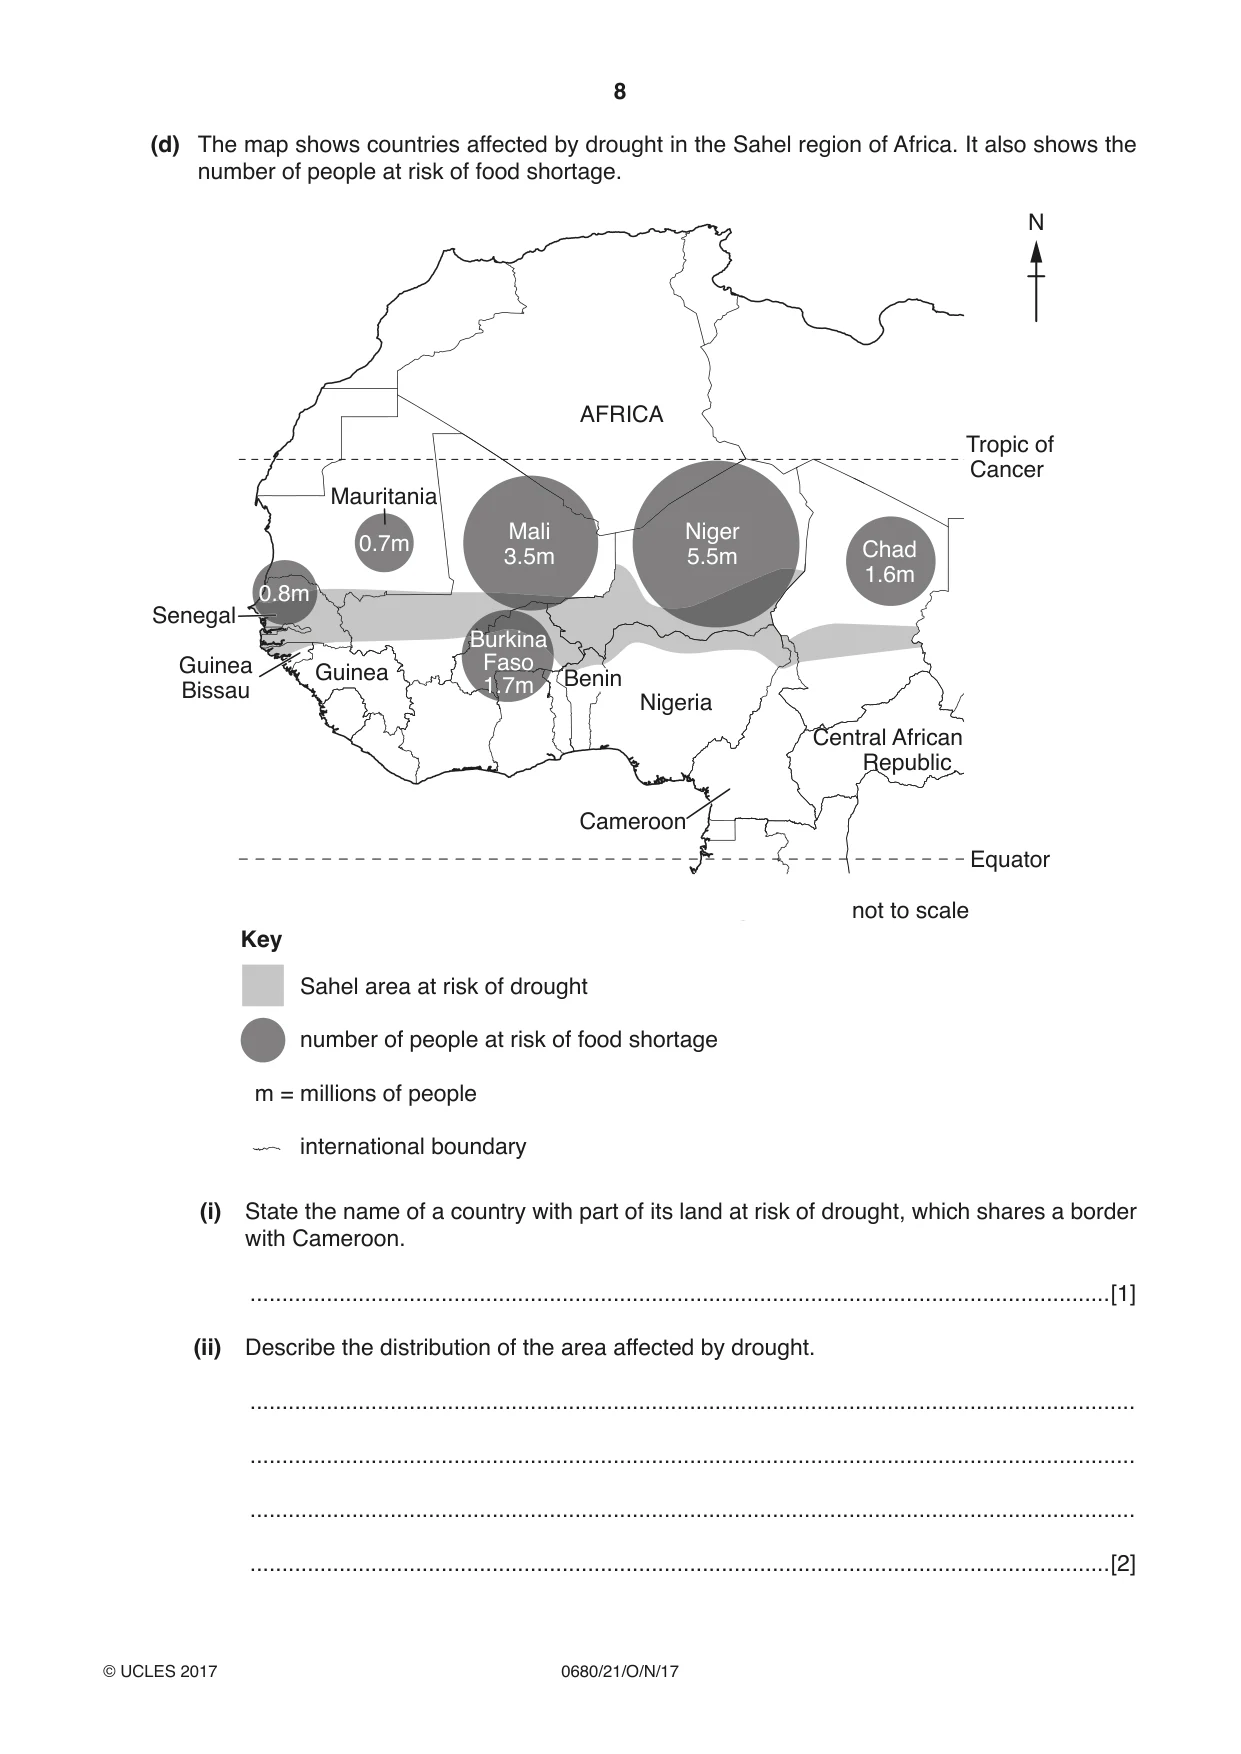
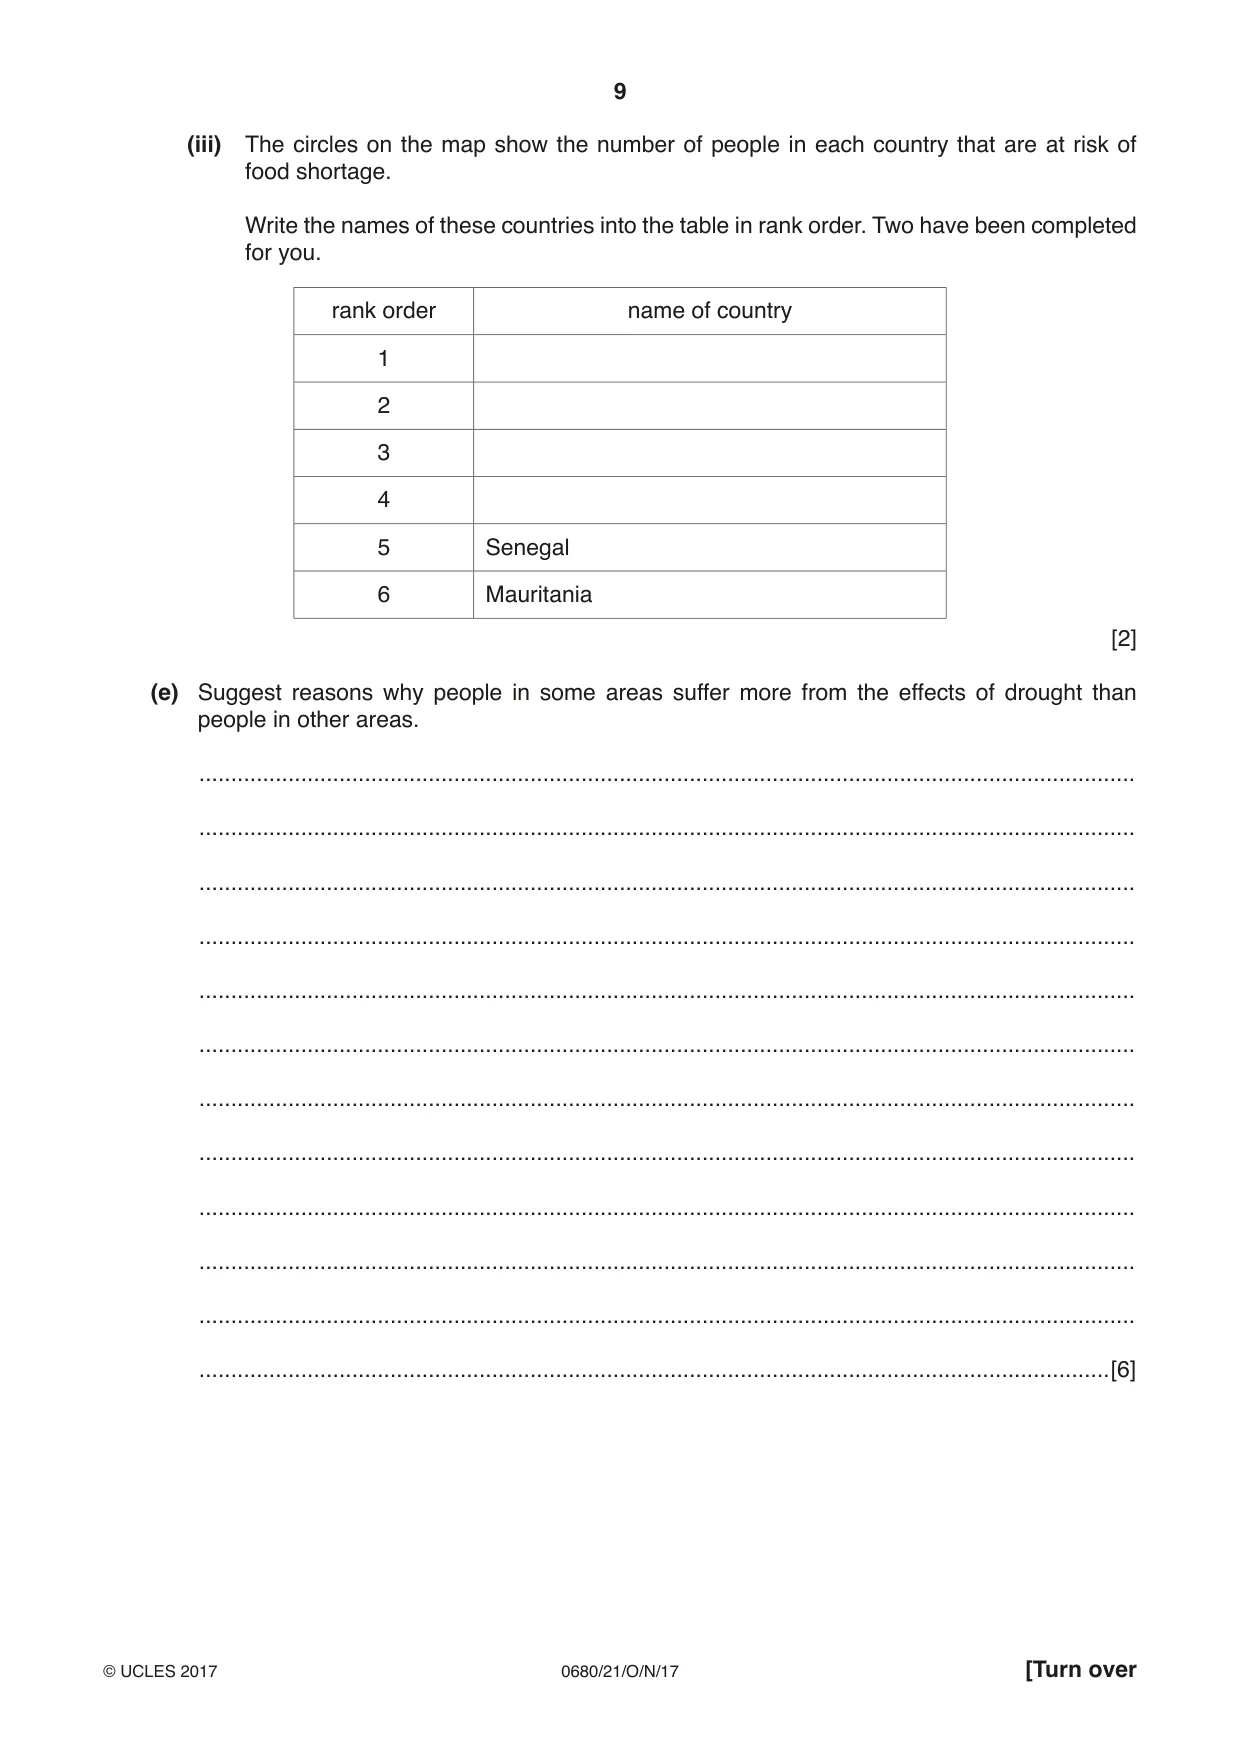
1 (a) The diagram shows the distribution of water on Earth. fresh water 3% other 0.9% surface water 0.3% groundwater 30.1% saline (oceans) ice caps 97% and glaciers 68.7% water on Earth fresh water (i) State the percentage of fresh water available on Earth. ...................................................................................................................................% [1] (ii) Explain what is meant by the term groundwater. ........................................................................................................................................... .......................................................................................................................................[1] (iii) Suggest a reason why the water stored in ice caps and glaciers is not directly available for human use. ........................................................................................................................................... .......................................................................................................................................[1] (iv) The table shows the sources of fresh surface water on Earth. Complete the pie graph using the key to show this information. source of fresh surface water percentage rivers 2 wetlands 11 lakes 87 100% 90% 10% Key 80% 20% rivers wetlands lakes 70% 30% 60% 40% 50% [3] (v) Water in rivers and lakes is often polluted. Describe how human activity can cause rivers and lakes to become polluted. ........................................................................................................................................... ........................................................................................................................................... ........................................................................................................................................... ........................................................................................................................................... ........................................................................................................................................... ........................................................................................................................................... ........................................................................................................................................... ........................................................................................................................................... ........................................................................................................................................... .......................................................................................................................................[5] (b) The diagram shows the water cycle. condensation precipitation precipitation transpiration evaporation woodlandwoodland waterwater tabletable throughflow evaporation reservoirreservoir town ocean groundwater flow surface run-off Key interception transfers (i) State two transfers of water shown on the diagram. 1 ........................................................................................................................................ 2 ........................................................................................................................................ [2] (ii) State the water storage scheme, shown on the diagram, that is the result of human activity. .......................................................................................................................................[1] (iii) State the name of the alternative source of energy that could be provided by this water storage scheme. .......................................................................................................................................[1] (iv) Complete the table of definitions using terms from the diagram. definition of water cycle term term from diagram water is stopped from reaching the ground by trees and plants water is heated by the Sun and turns into water vapour water returning to the ground as rain, ice, sleet or snow [3] (v) Suggest reasons why river flooding might occur if: the woodland shown in the diagram was removed ........................................................................................................................................... ........................................................................................................................................... ........................................................................................................................................... ........................................................................................................................................... ........................................................................................................................................... ........................................................................................................................................... the area of the town was increased. ........................................................................................................................................... ........................................................................................................................................... ........................................................................................................................................... ........................................................................................................................................... ........................................................................................................................................... ........................................................................................................................................... [5] (c) The pie graphs show the use of water in four countries. Bangladesh UK 2.9% 3.2% 0.7% 21.7%21.7% 96.1%96.1% 75.4%75.4% USA Malawi 5.0% 14.9%14.9% 22.3%22.3% 9.0%9.0% 68.7%68.7% 80.1%80.1% Key agriculture industry domestic (i) State the name of the country that uses the greatest percentage of their water for agriculture. .......................................................................................................................................[1] (ii) State the name of the country that uses the smallest percentage of their water for industry. .......................................................................................................................................[1] (iii) Domestic use is water used in the home. Calculate the difference in the percentage of water used for domestic use in the UK compared with Bangladesh. ...................................................................................................................................% [1] (iv) Suggest reasons why the UK, which is a developed country, uses a greater percentage of their water in the home than Bangladesh which is a developing country. ........................................................................................................................................... ........................................................................................................................................... ........................................................................................................................................... ........................................................................................................................................... ........................................................................................................................................... .......................................................................................................................................[3] (d) The map shows countries affected by drought in the Sahel region of Africa. It also shows the number of people at risk of food shortage. N AFRICA Tropic of Cancer Mauritania Mali Niger 0.7m Chad 3.5m 5.5m 1.6m 0.8m Sudan Senegal Burkina Guinea Faso Guinea Benin Bissau 1.7m Nigeria Central African Republic Cameroon Equator not to scale Key Sahel area at risk of drought number of people at risk of food shortage m = millions of people international boundary (i) State the name of a country with part of its land at risk of drought, which shares a border with Cameroon. .......................................................................................................................................[1] (ii) Describe the distribution of the area affected by drought. ........................................................................................................................................... ........................................................................................................................................... ........................................................................................................................................... .......................................................................................................................................[2] (iii) The circles on the map show the number of people in each country that are at risk of food shortage. Write the names of these countries into the table in rank order. Two have been completed for you. rank order name of country 1 2 3 4 5 Senegal 6 Mauritania [2] (e) Suggest reasons why people in some areas suffer more from the effects of drought than people in other areas. ................................................................................................................................................... ................................................................................................................................................... ................................................................................................................................................... ................................................................................................................................................... ................................................................................................................................................... ................................................................................................................................................... ................................................................................................................................................... ................................................................................................................................................... ................................................................................................................................................... ................................................................................................................................................... ................................................................................................................................................... ...............................................................................................................................................[6]
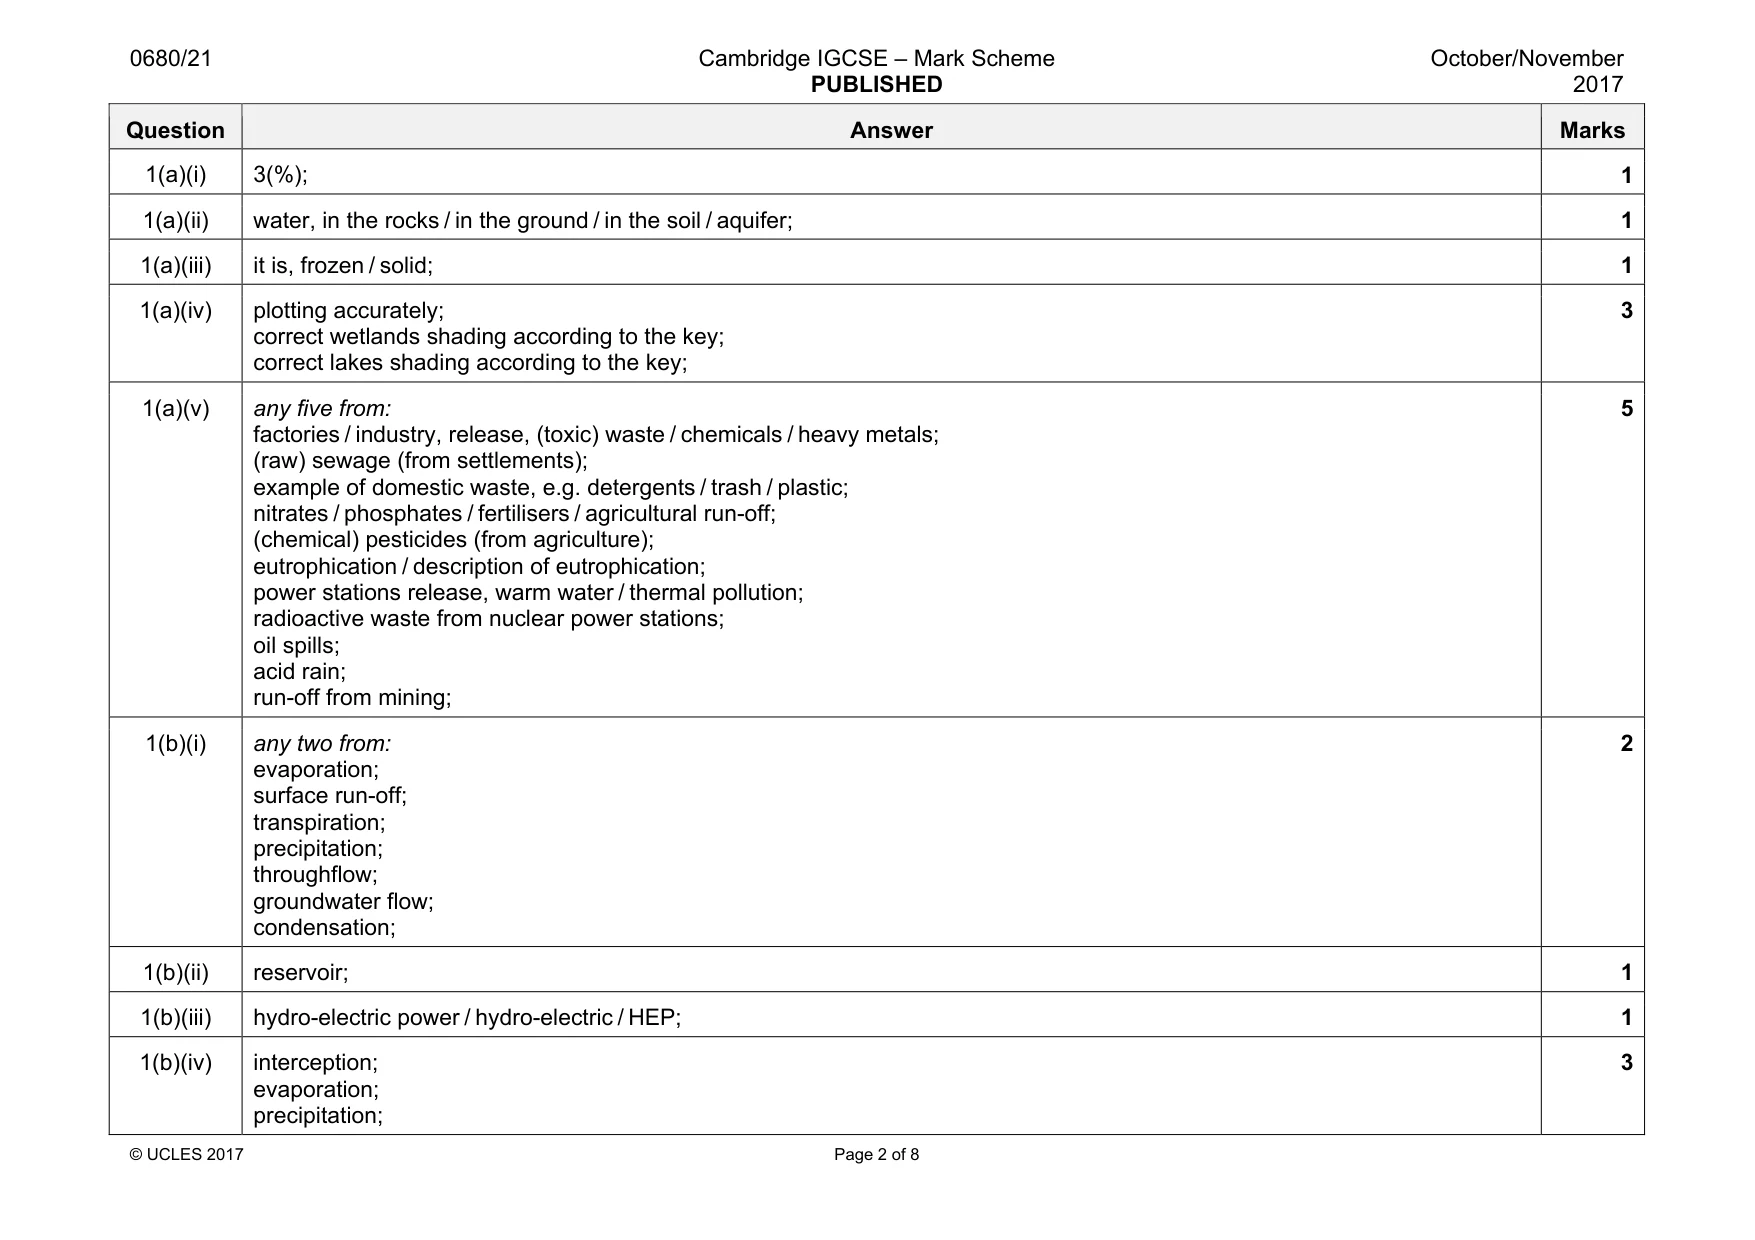
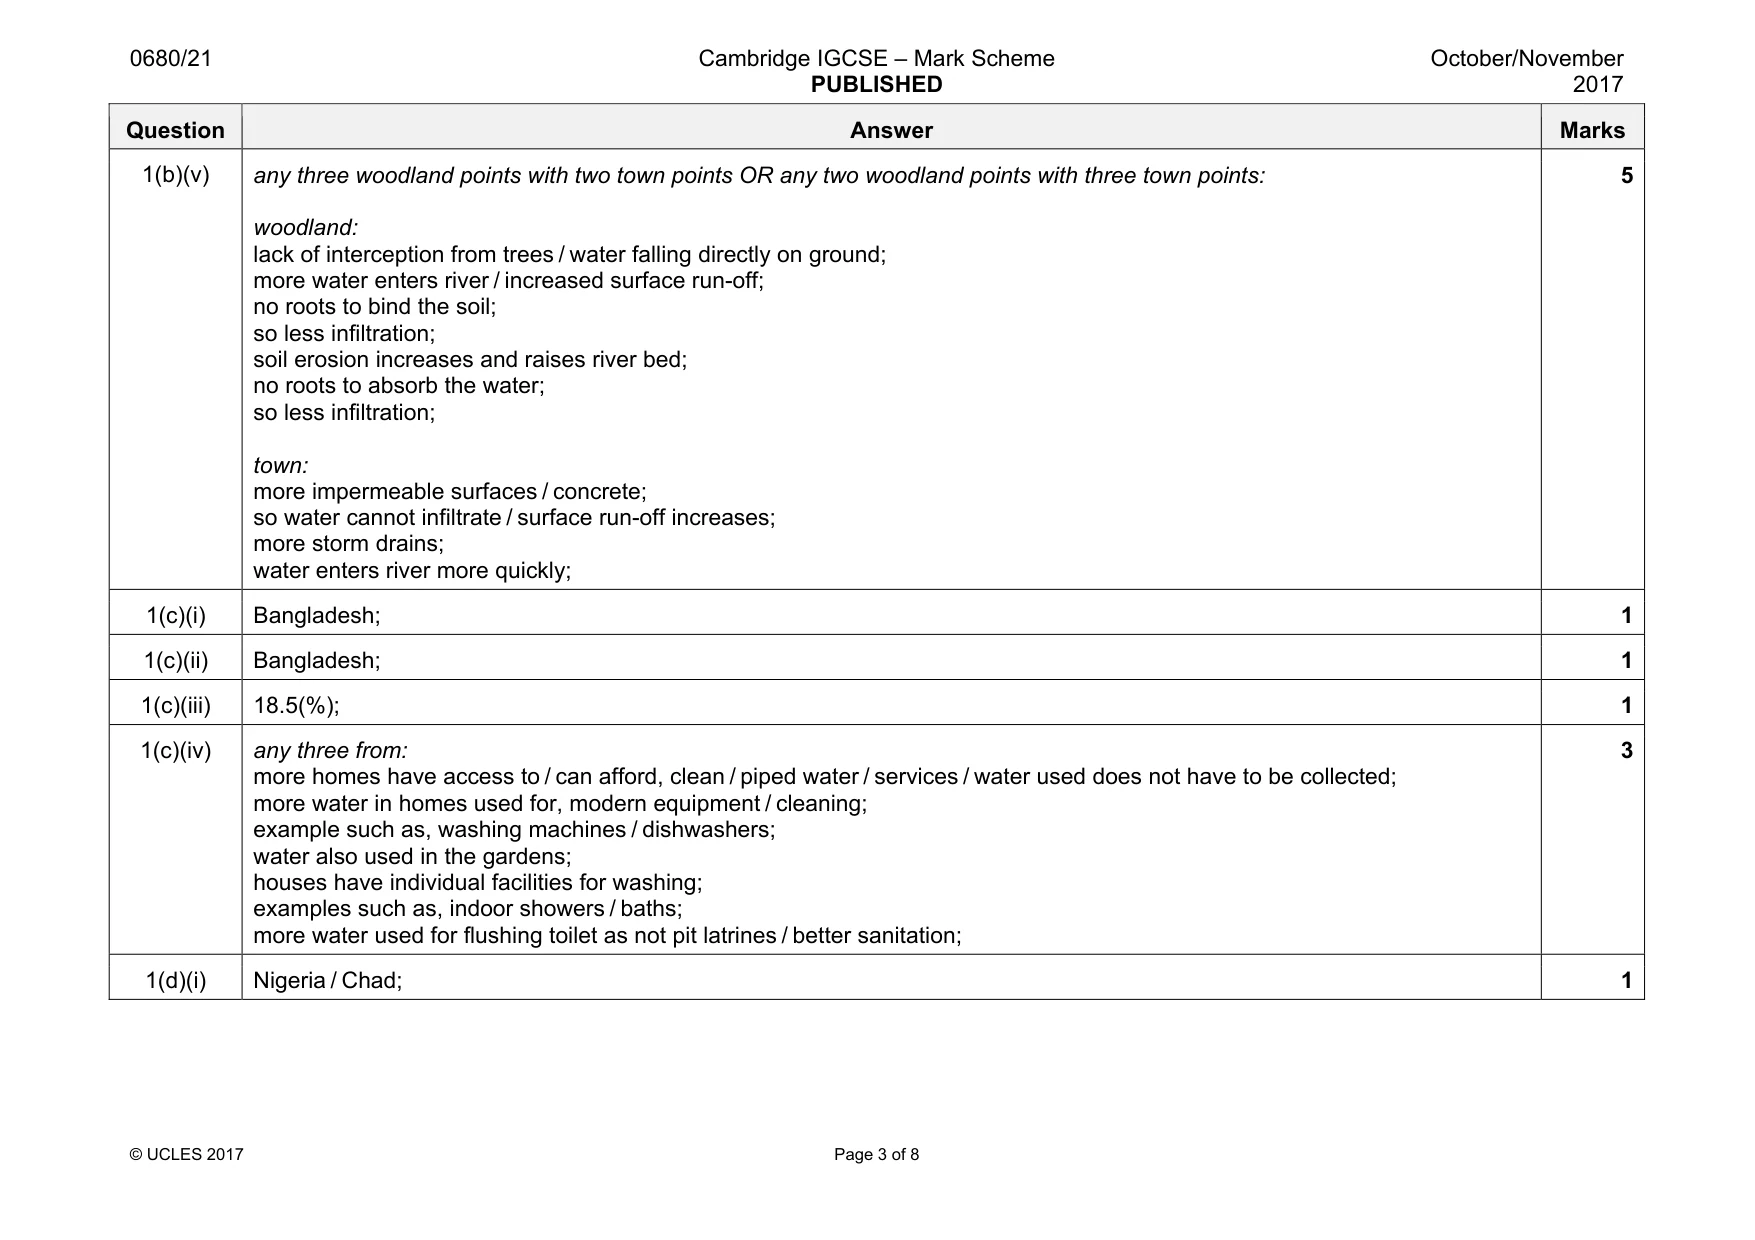
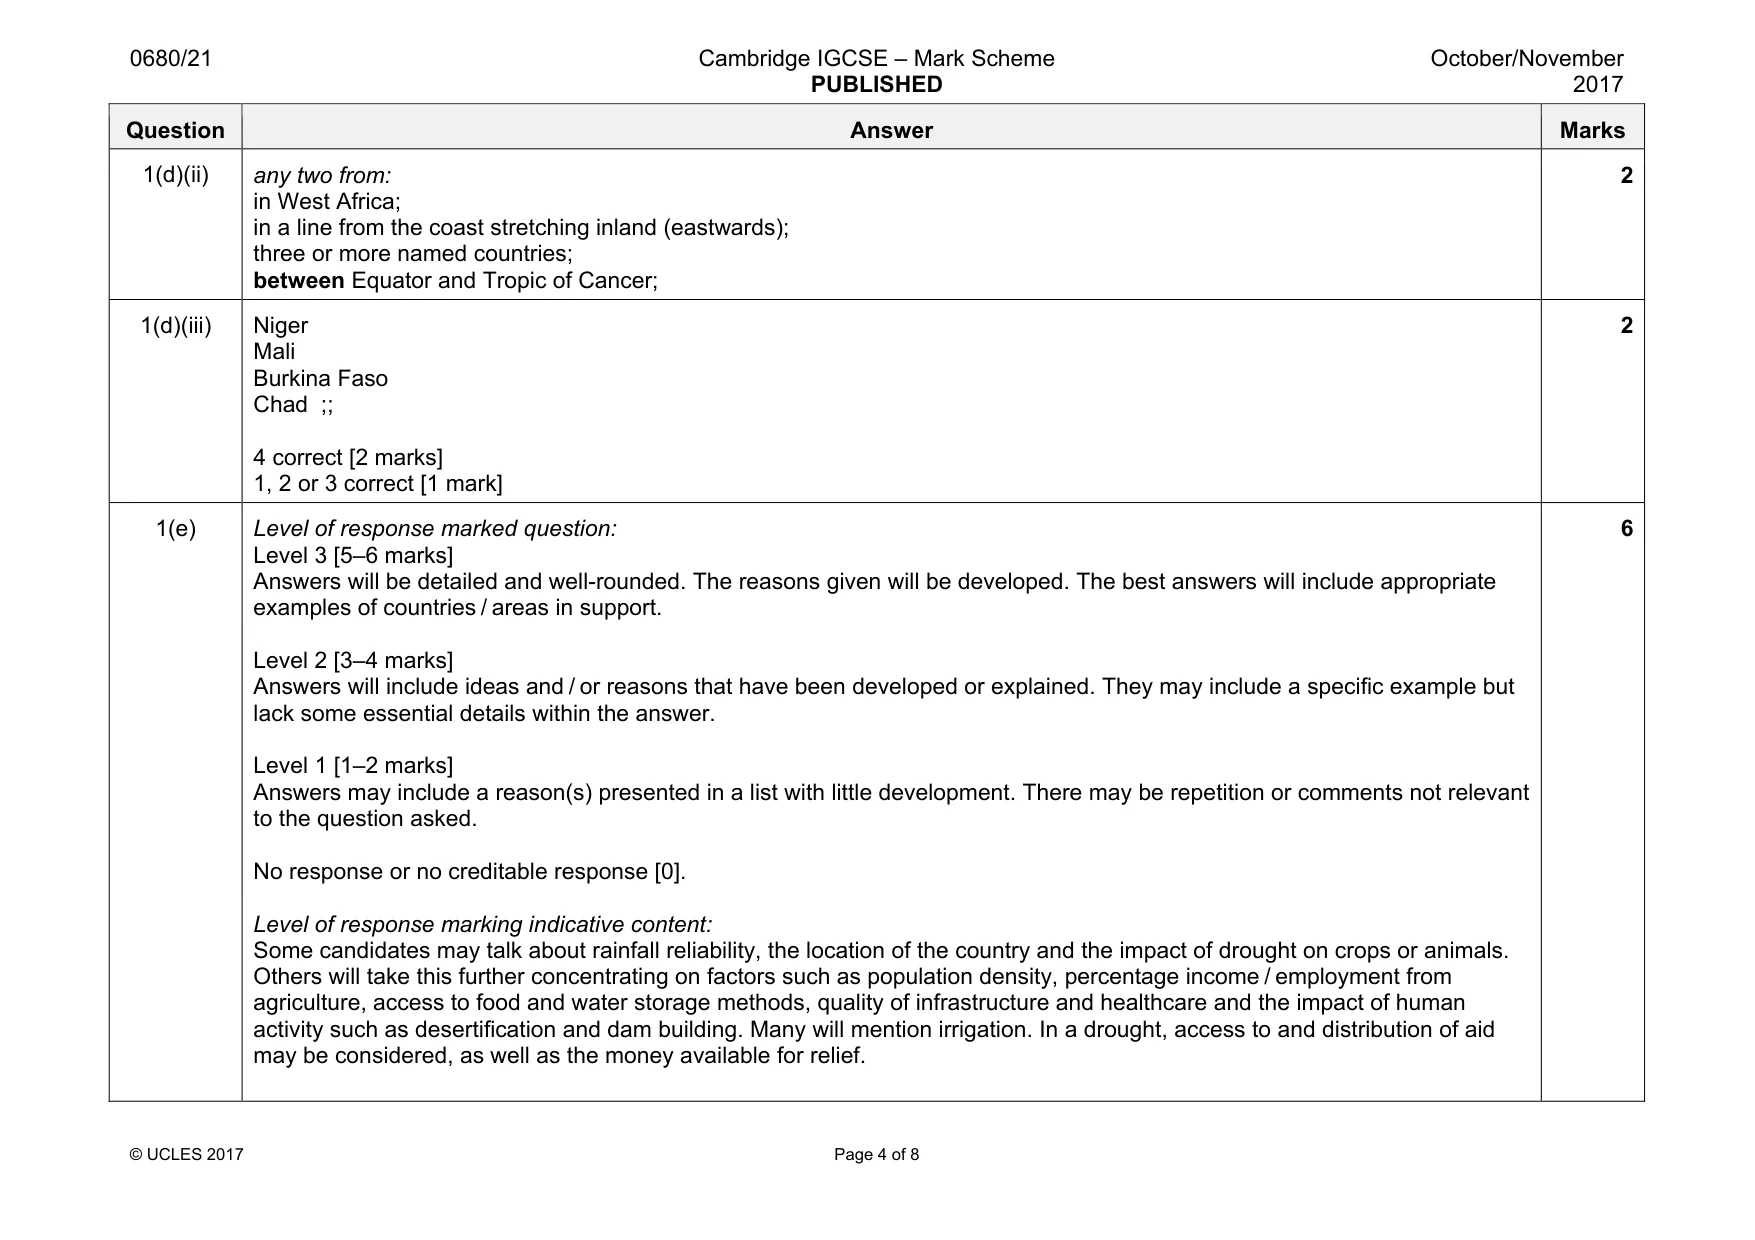
Mark scheme: 1(a)(i) 3(%); 1 1(a)(ii) water, in the rocks / in the ground / in the soil / aquifer; 1 1(a)(iii) it is, frozen / solid; 1 1(a)(iv) plotting accurately; correct wetlands shading according to the key; correct lakes shading according to the key; 3 1(a)(v) any five from: factories / industry, release, (toxic) waste / chemicals / heavy metals; (raw) sewage (from settlements); example of domestic waste, e.g. detergents / trash / plastic; nitrates / phosphates / fertilisers / agricultural run-off; (chemical) pesticides (from agriculture); eutrophication / description of eutrophication; power stations release, warm water / thermal pollution; radioactive waste from nuclear power stations; oil spills; acid rain; run-off from mining; 5 1(b)(i) any two from: evaporation; surface run-off; transpiration; precipitation; throughflow; groundwater flow; condensation; 2 1(b)(ii) reservoir; 1 1(b)(iii) hydro-electric power / hydro-electric / HEP; 1 1(b)(iv) interception; evaporation; precipitation; 3 Question Answer Marks 1(b)(v) any three woodland points with two town points OR any two woodland points with three town points: woodland: lack of interception from trees / water falling directly on ground; more water enters river / increased surface run-off; no roots to bind the soil; so less infiltration; soil erosion increases and raises river bed; no roots to absorb the water; so less infiltration; town: more impermeable surfaces / concrete; so water cannot infiltrate / surface run-off increases; more storm drains; water enters river more quickly; 5 1(c)(i) Bangladesh; 1 1(c)(ii) Bangladesh; 1 1(c)(iii) 18.5(%); 1 1(c)(iv) any three from: more homes have access to / can afford, clean / piped water / services / water used does not have to be collected; more water in homes used for, modern equipment / cleaning; example such as, washing machines / dishwashers; water also used in the gardens; houses have individual facilities for washing; examples such as, indoor showers / baths; more water used for flushing toilet as not pit latrines / better sanitation; 3 1(d)(i) Nigeria / Chad; 1 Question Answer Marks 1(d)(ii) any two from: in West Africa; in a line from the coast stretching inland (eastwards); three or more named countries; between Equator and Tropic of Cancer; 2 1(d)(iii) Niger Mali Burkina Faso Chad ;; 4 correct [2 marks] 1, 2 or 3 correct [1 mark] 2 1(e) Level of response marked question: Level 3 [5–6 marks] Answers will be detailed and well-rounded. The reasons given will be developed. The best answers will include appropriate examples of countries / areas in support. Level 2 [3–4 marks] Answers will include ideas and / or reasons that have been developed or explained. They may include a specific example but lack some essential details within the answer. Level 1 [1–2 marks] Answers may include a reason(s) presented in a list with little development. There may be repetition or comments not relevant to the question asked. No response or no creditable response [0]. Level of response marking indicative content: Some candidates may talk about rainfall reliability, the location of the country and the impact of drought on crops or animals. Others will take this further concentrating on factors such as population density, percentage income / employment from agriculture, access to food and water storage methods, quality of infrastructure and healthcare and the impact of human activity such as desertification and dam building. Many will mention irrigation. In a drought, access to and distribution of aid may be considered, as well as the money available for relief. 6
Q2 · The table shows a classification of some farming types
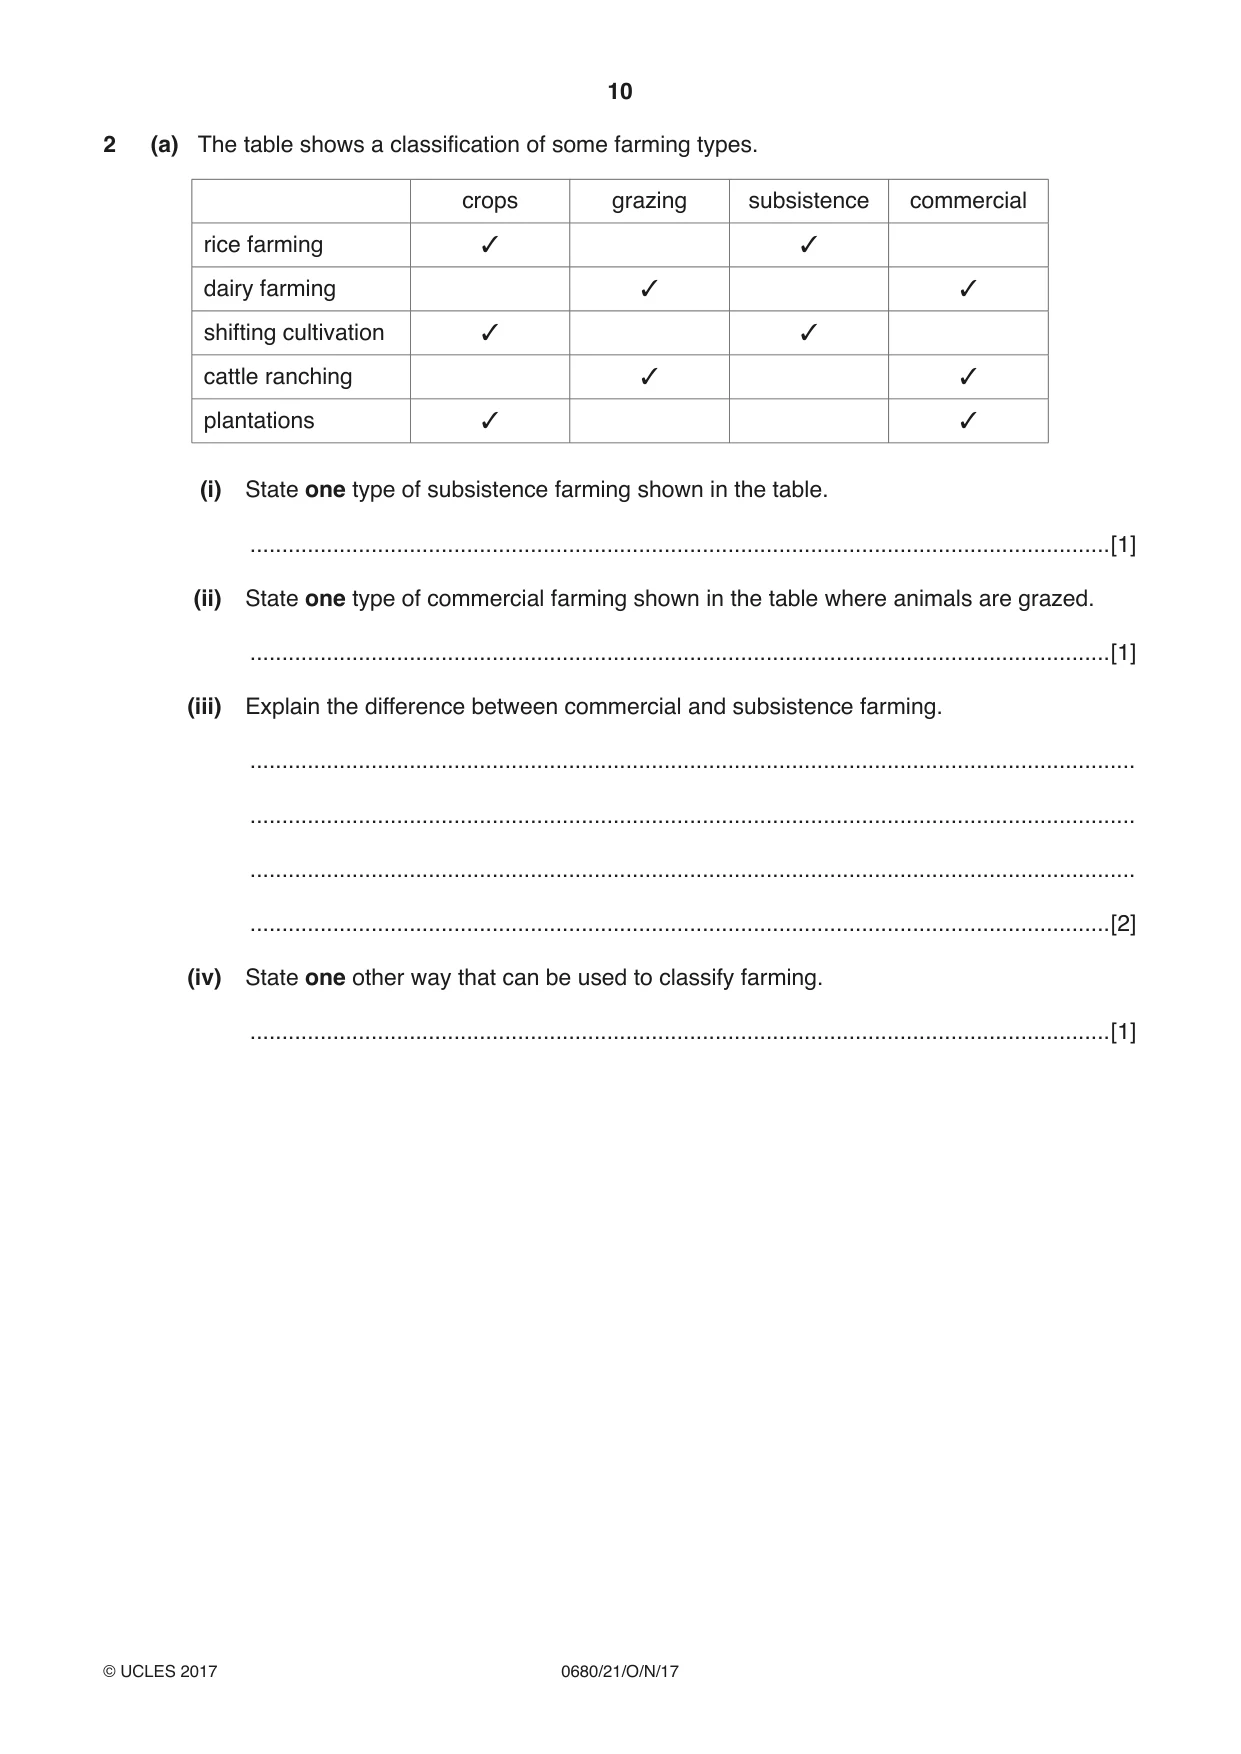
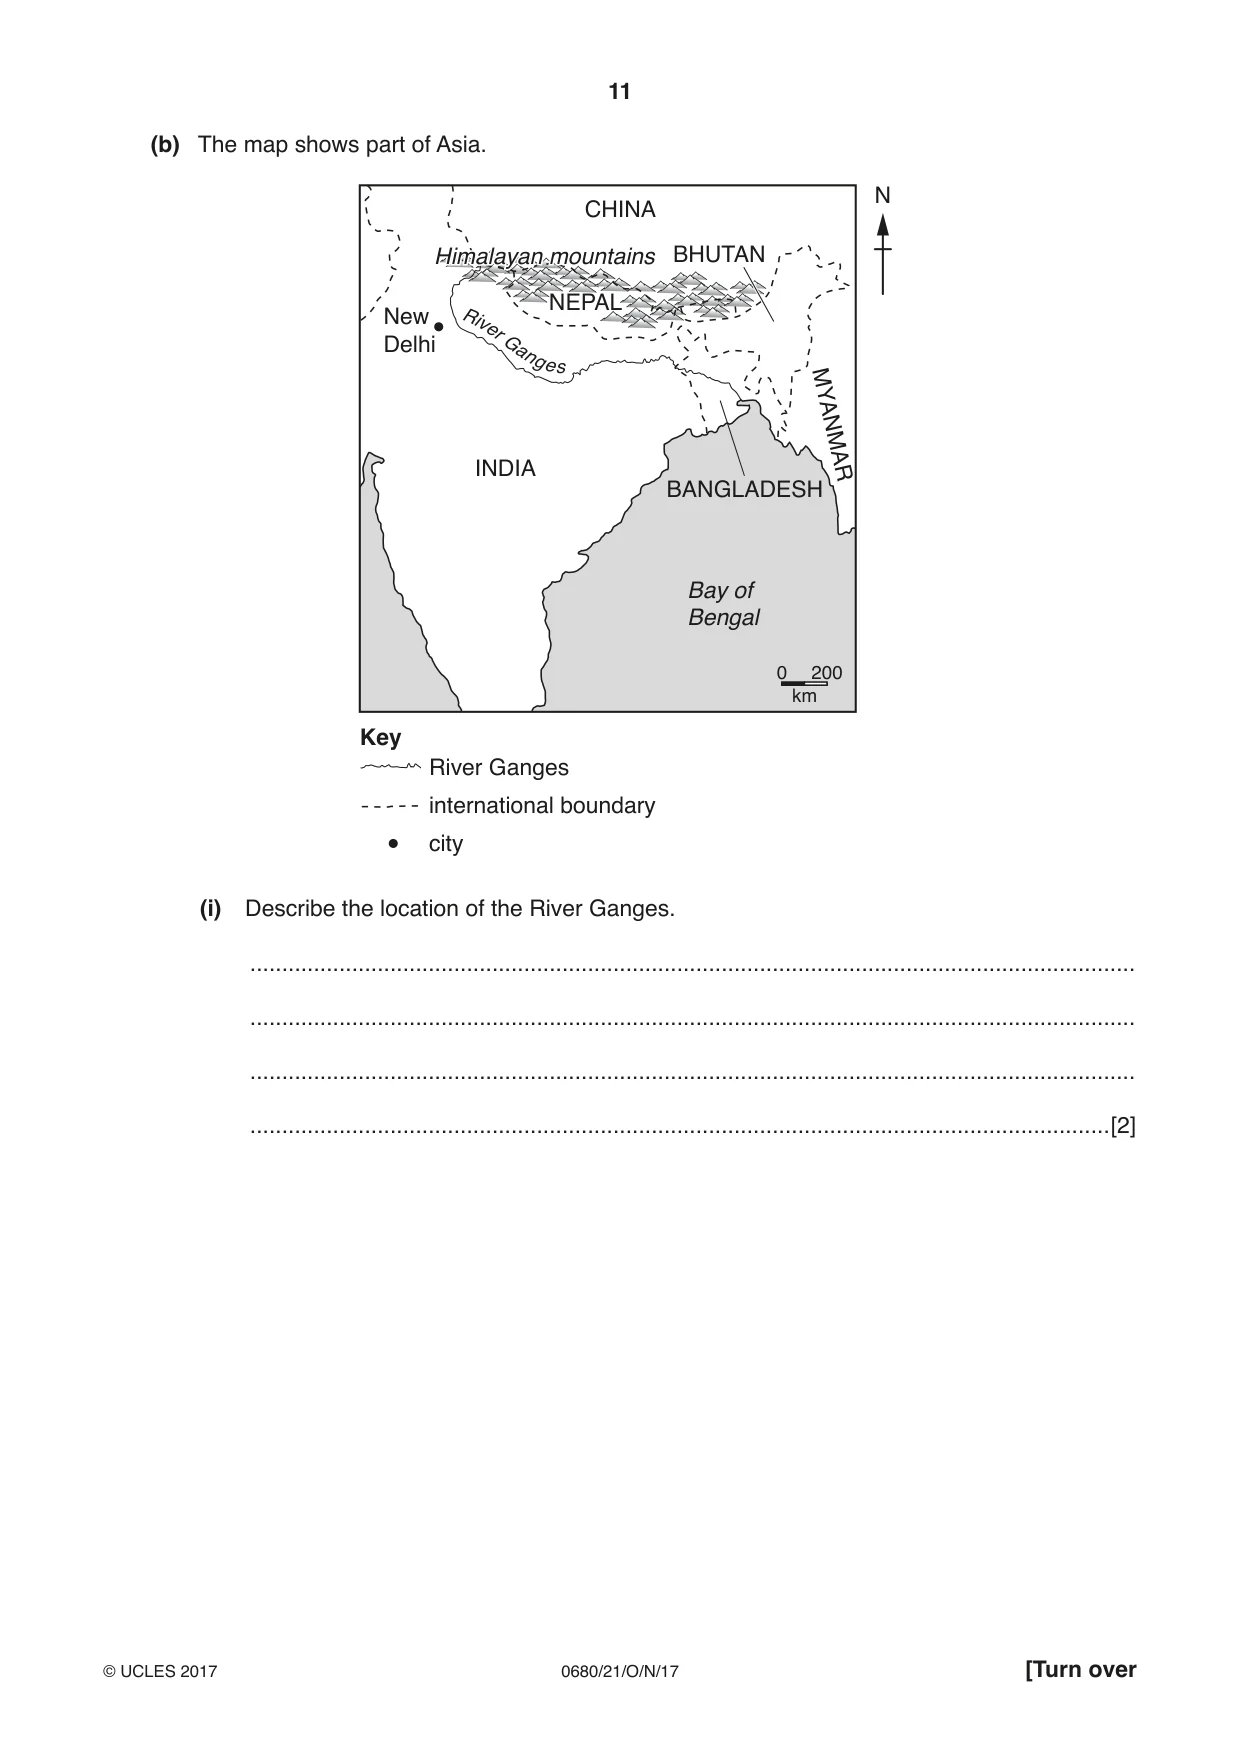
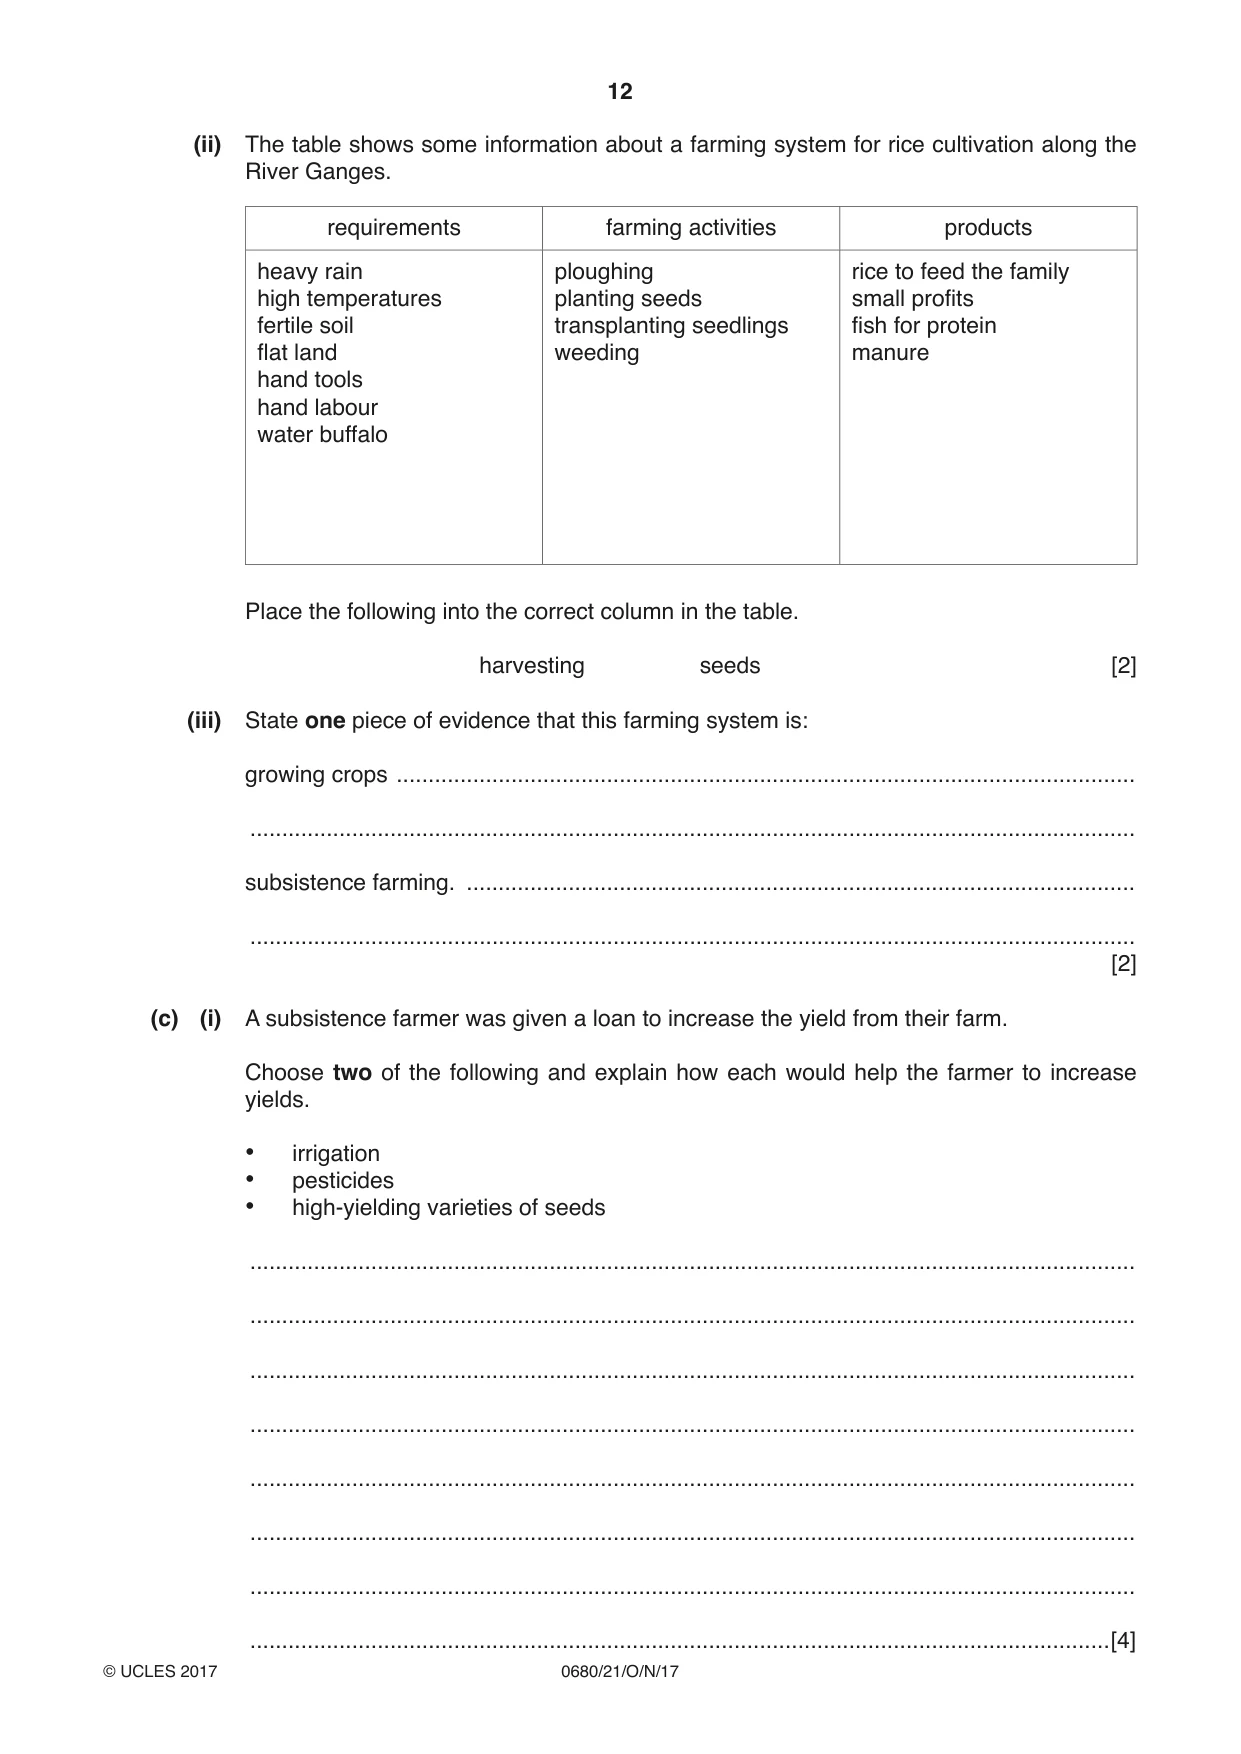
2 (a) The table shows a classification of some farming types. crops grazing subsistence commercial 3 3 rice farming 3 3 dairy farming 3 3 shifting cultivation 3 3 cattle ranching 3 3 plantations (i) State one type of subsistence farming shown in the table. .......................................................................................................................................[1] (ii) State one type of commercial farming shown in the table where animals are grazed. .......................................................................................................................................[1] (iii) Explain the difference between commercial and subsistence farming. ........................................................................................................................................... ........................................................................................................................................... ........................................................................................................................................... .......................................................................................................................................[2] (iv) State one other way that can be used to classify farming. .......................................................................................................................................[1] (b) The map shows part of Asia. N CHINA HimalayanHimalayan mountainsmountains BHUTAN NEPAL New Riv er Delhi Ganges INDIA MYANMAR BANGLADESH Bay of Bengal 0 200 km Key River Ganges international boundary city (i) Describe the location of the River Ganges. ........................................................................................................................................... ........................................................................................................................................... ........................................................................................................................................... .......................................................................................................................................[2] (ii) The table shows some information about a farming system for rice cultivation along the River Ganges. requirements farming activities products heavy rain ploughing rice to feed the family high temperatures planting seeds small profits fertile soil transplanting seedlings fish for protein flat land weeding manure hand tools hand labour water buffalo Place the following into the correct column in the table. harvesting seeds [2] (iii) State one piece of evidence that this farming system is: growing crops .................................................................................................................... ........................................................................................................................................... subsistence farming. ......................................................................................................... ........................................................................................................................................... [2] (c) (i) A subsistence farmer was given a loan to increase the yield from their farm. Choose two of the following and explain how each would help the farmer to increase yields. • irrigation • pesticides • high-yielding varieties of seeds ........................................................................................................................................... ........................................................................................................................................... ........................................................................................................................................... ........................................................................................................................................... ........................................................................................................................................... ........................................................................................................................................... ...........................................................................................................................................
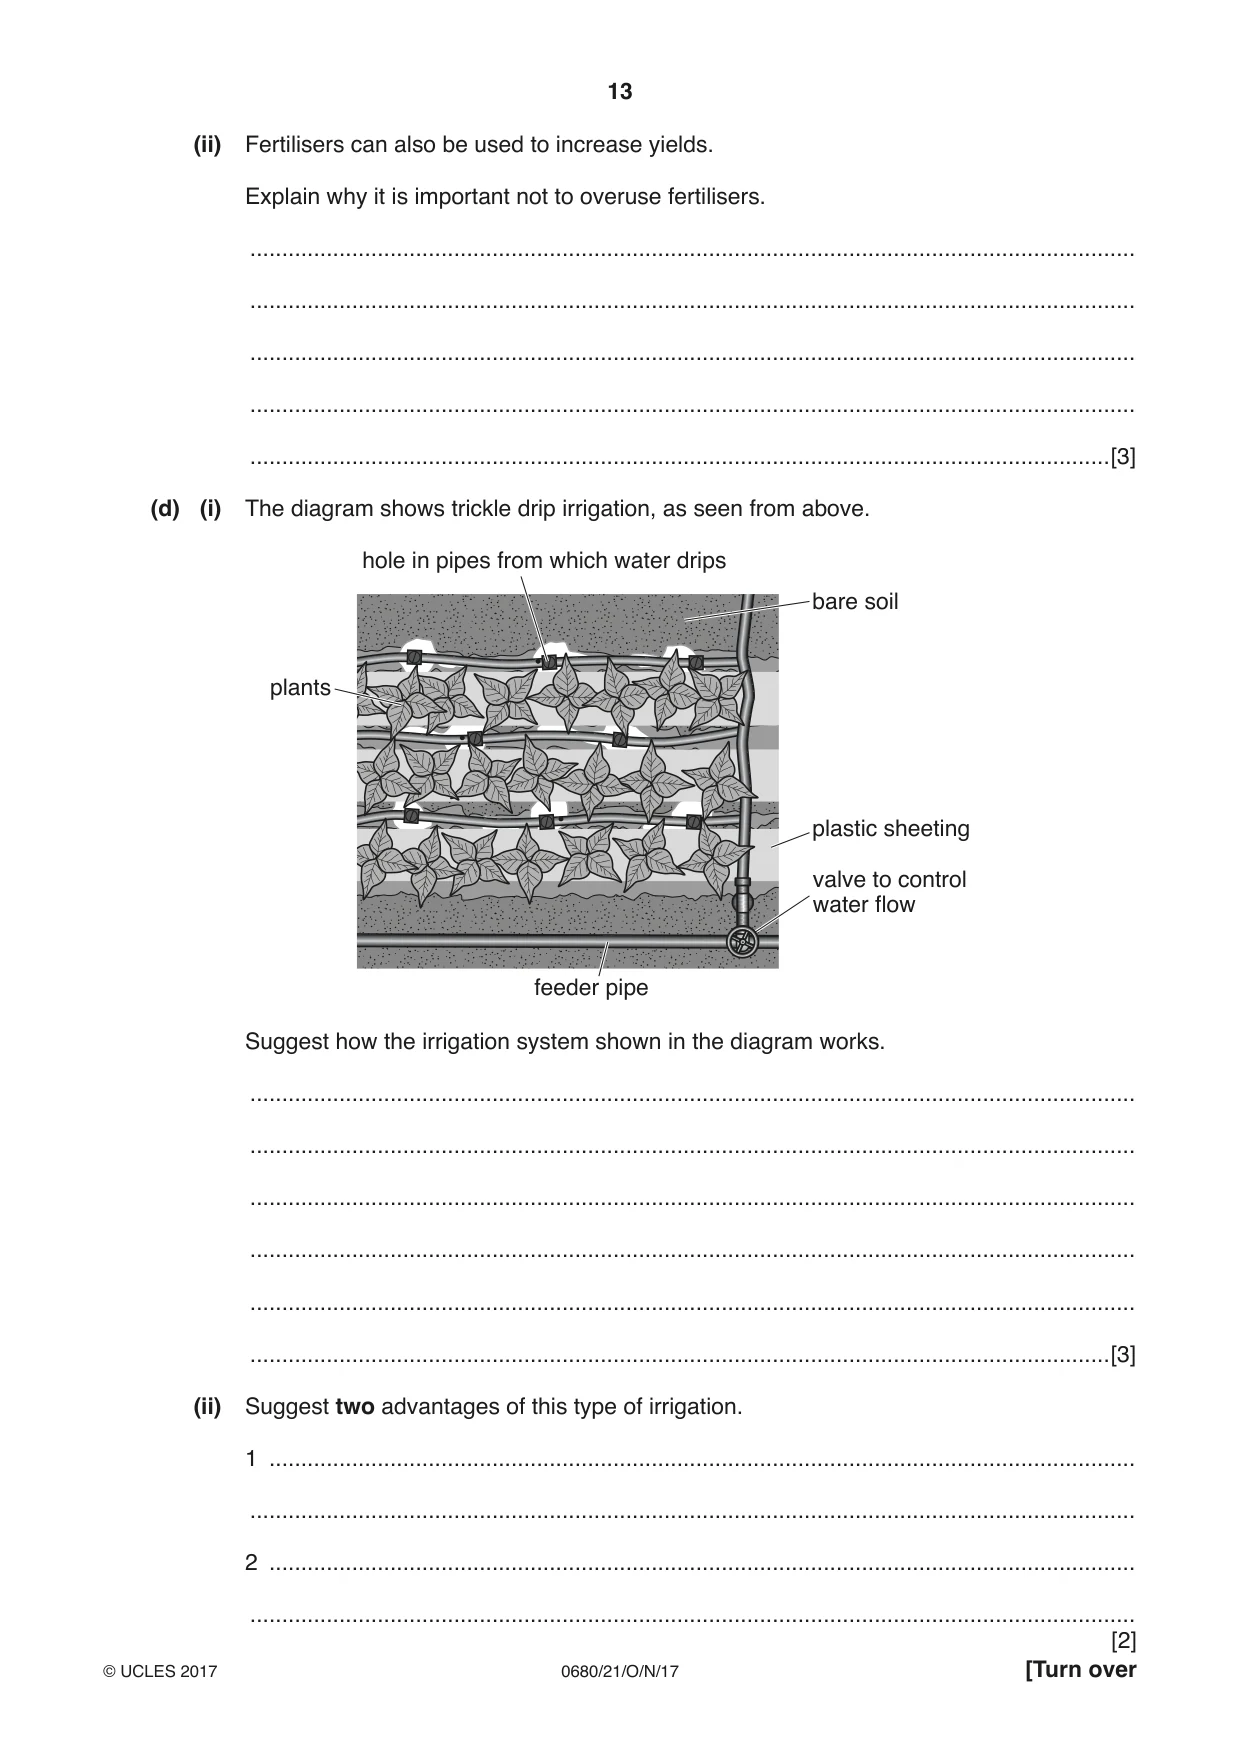
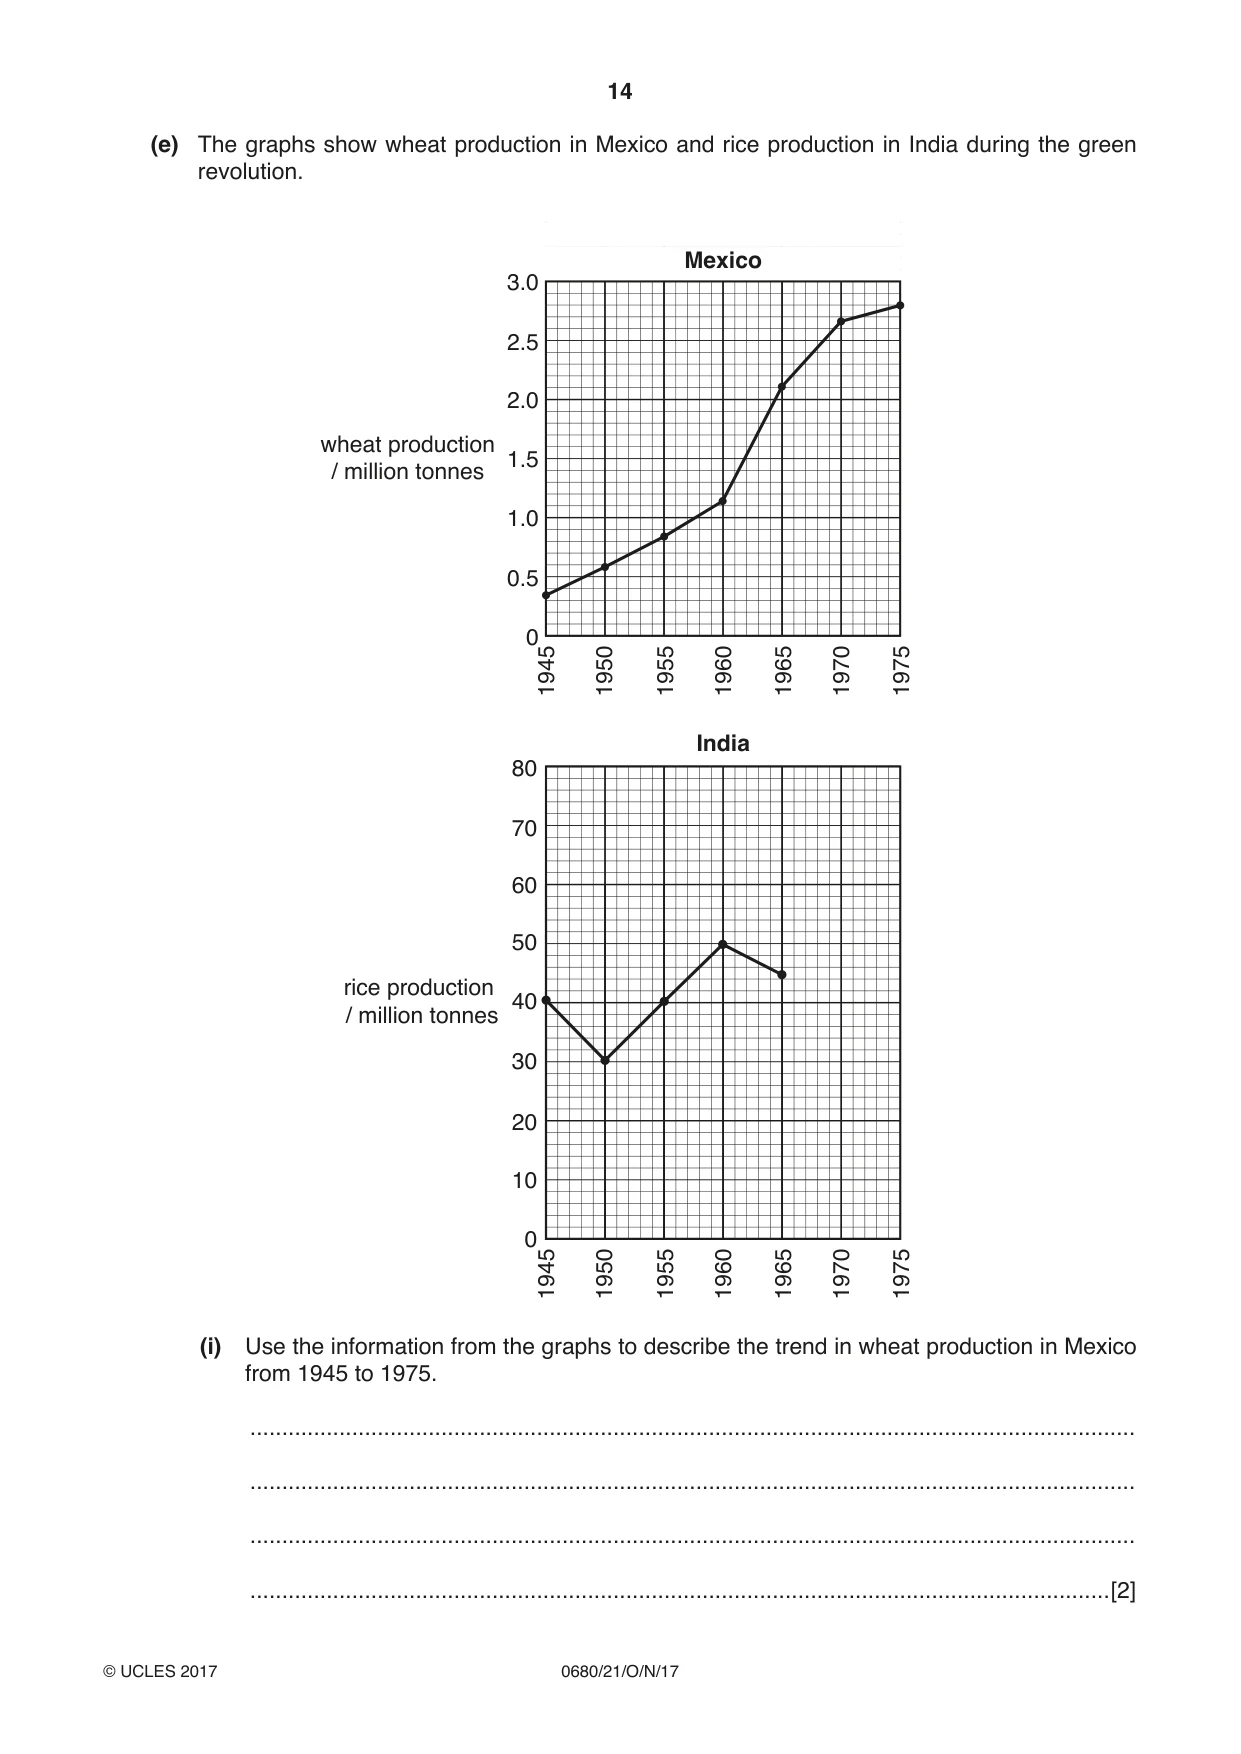
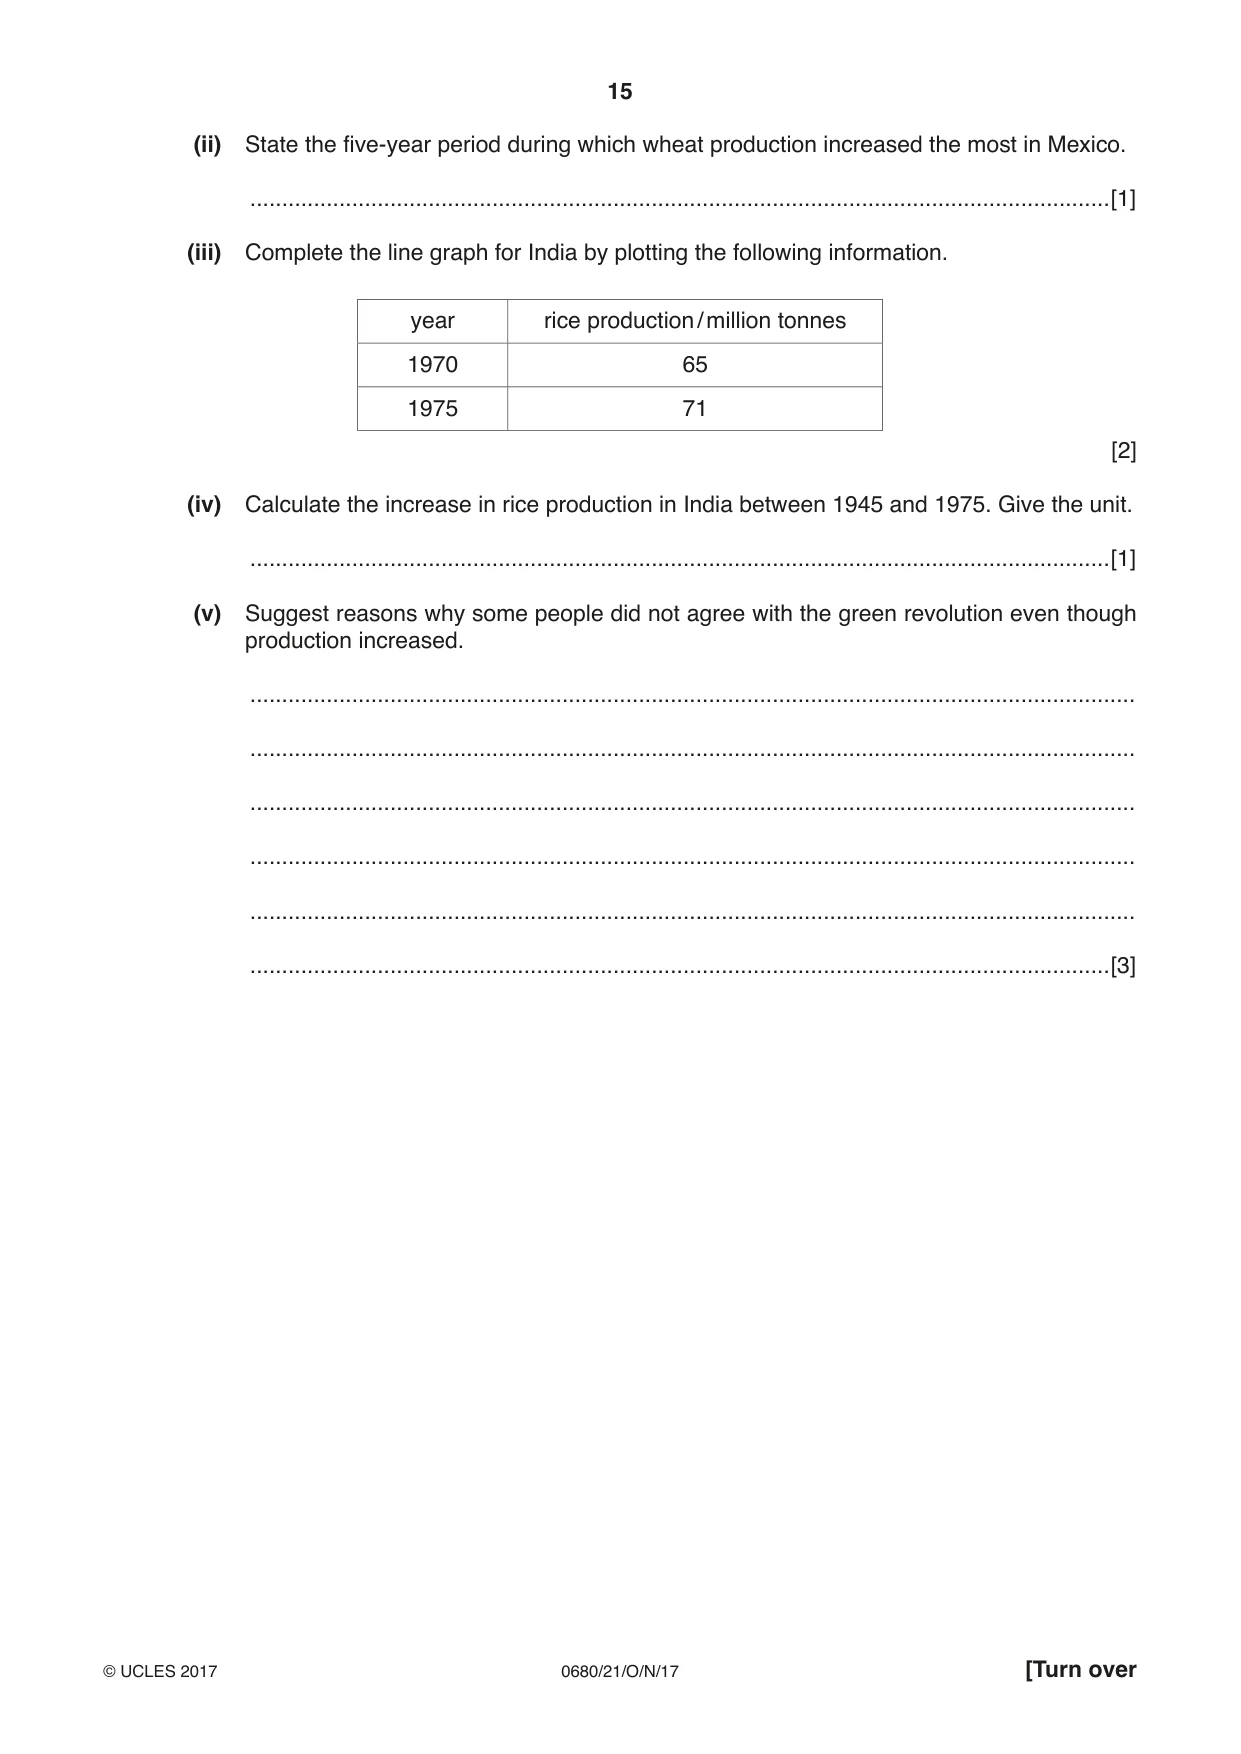
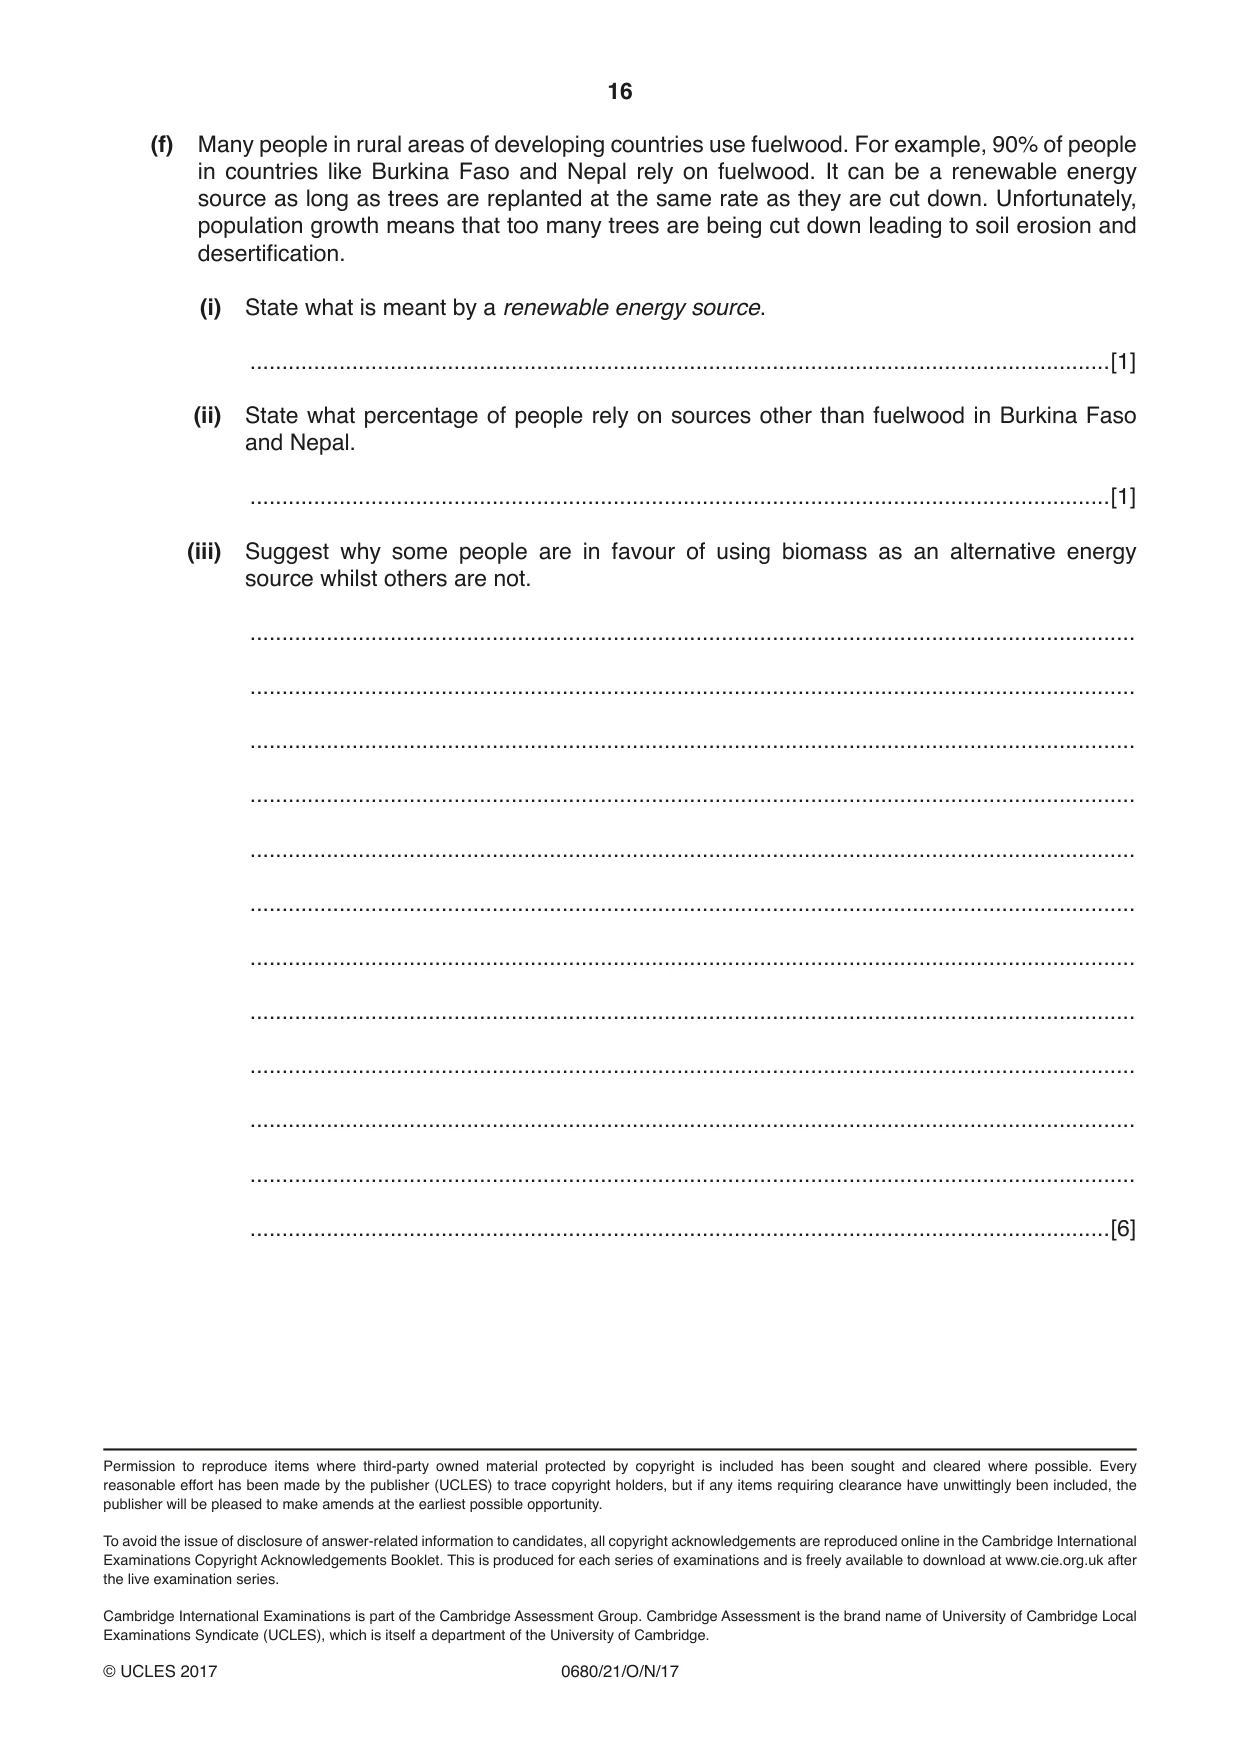
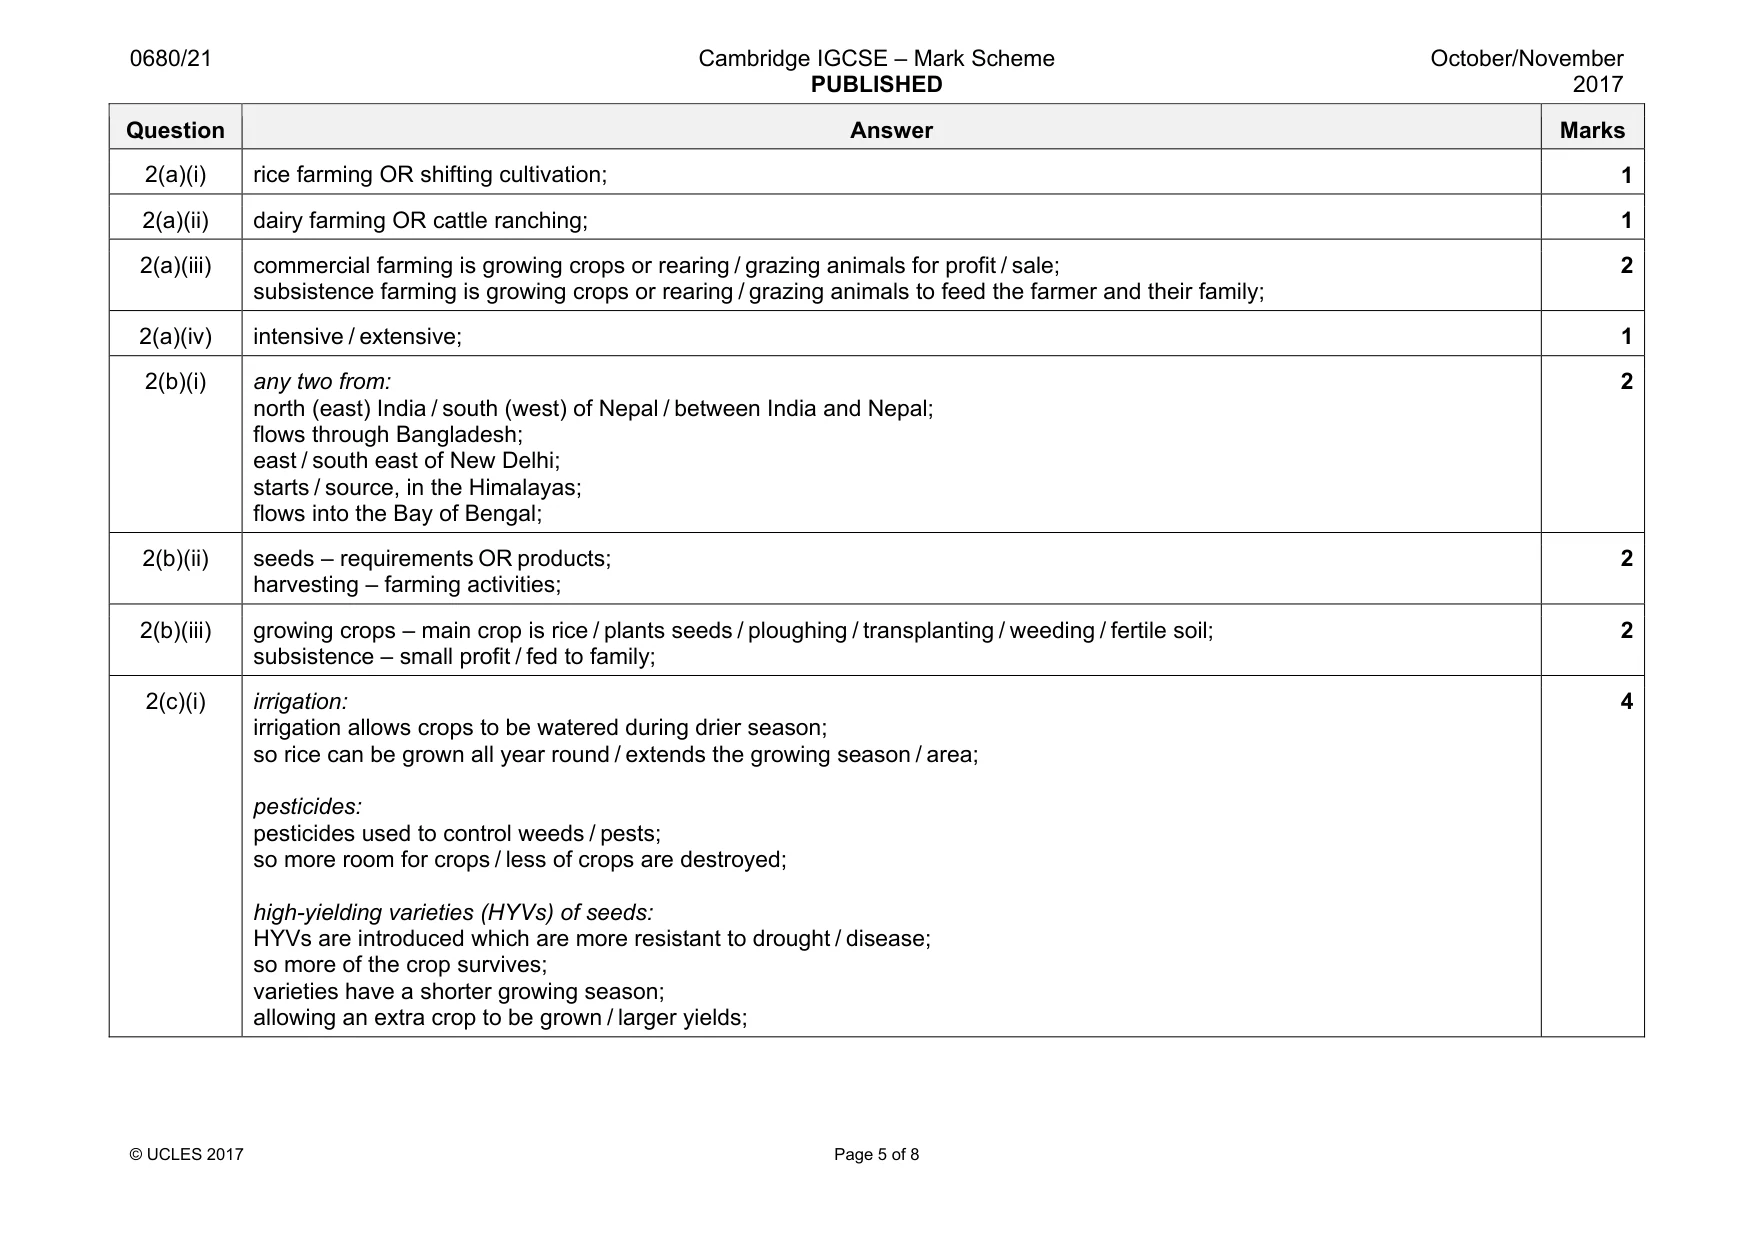
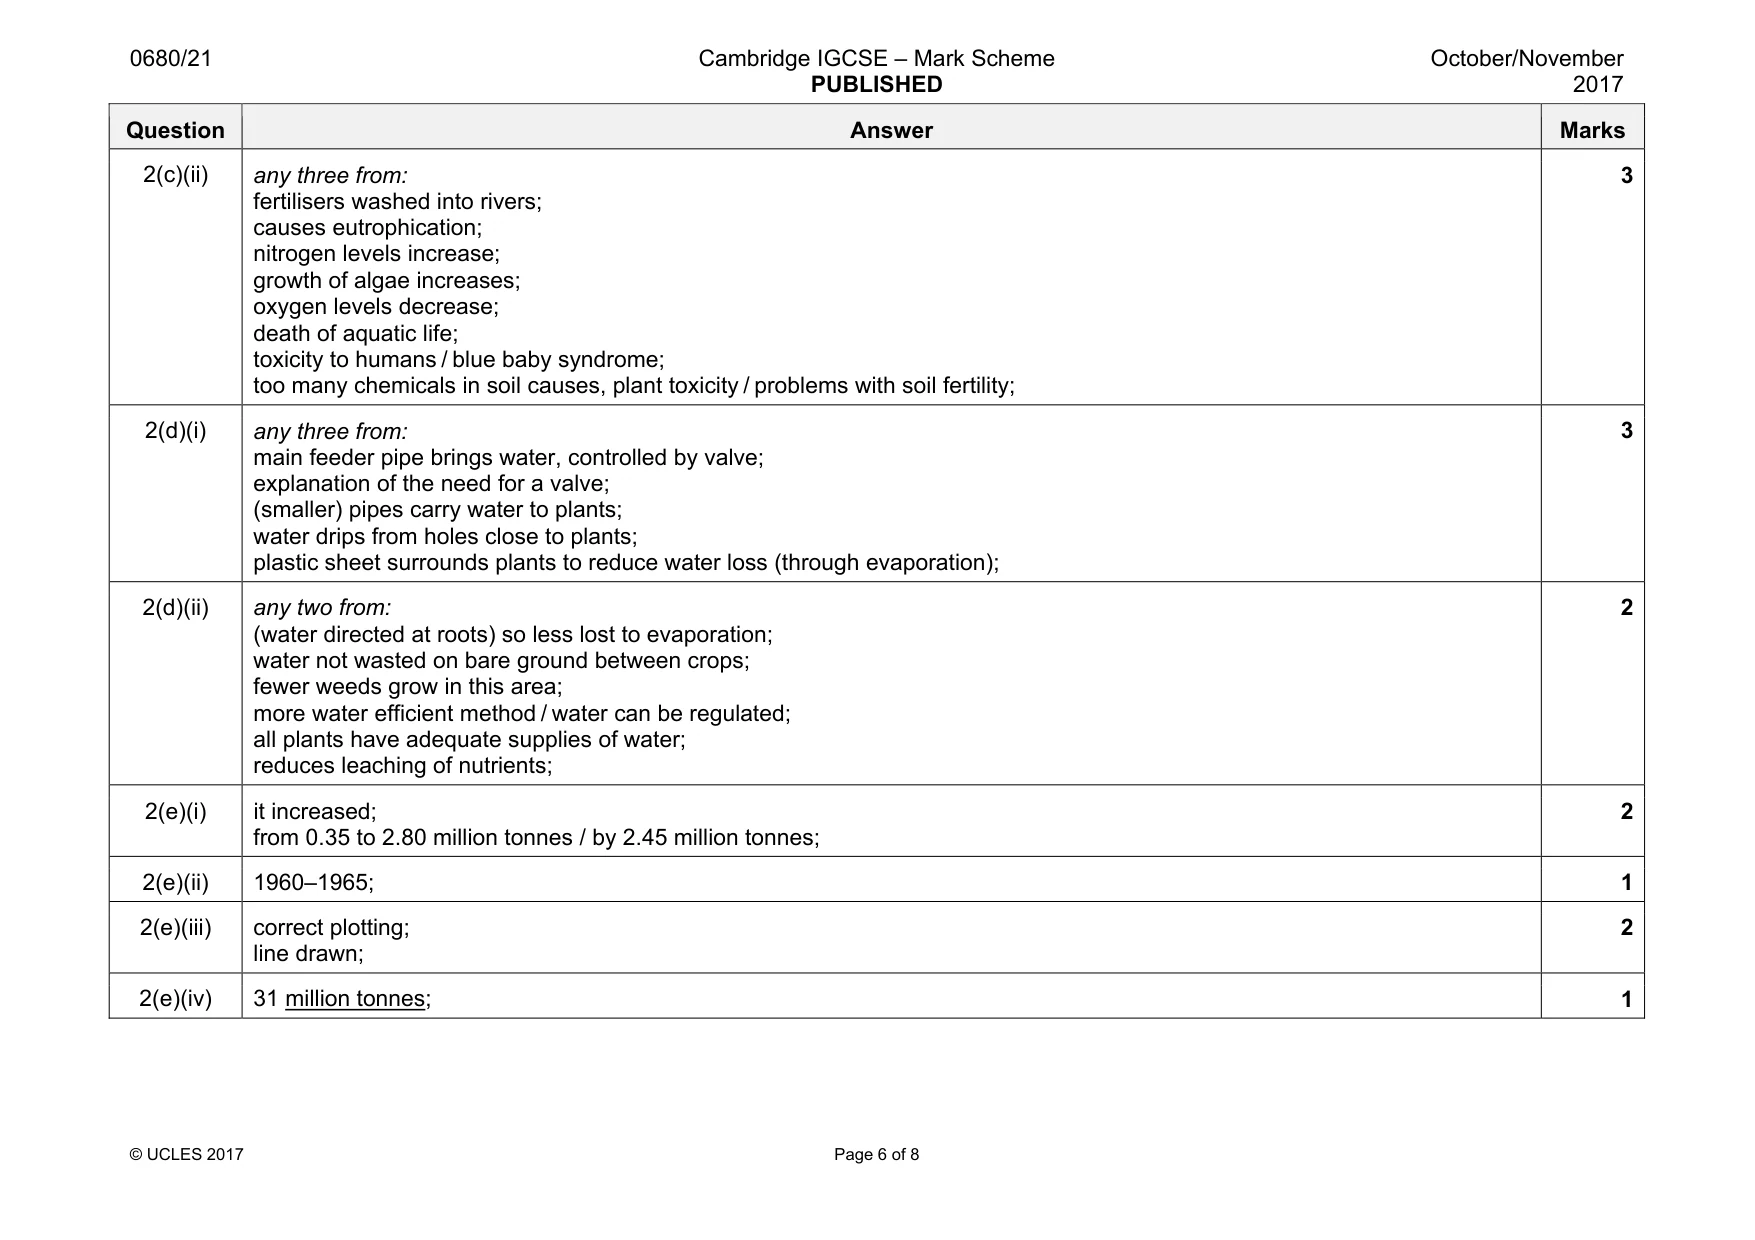
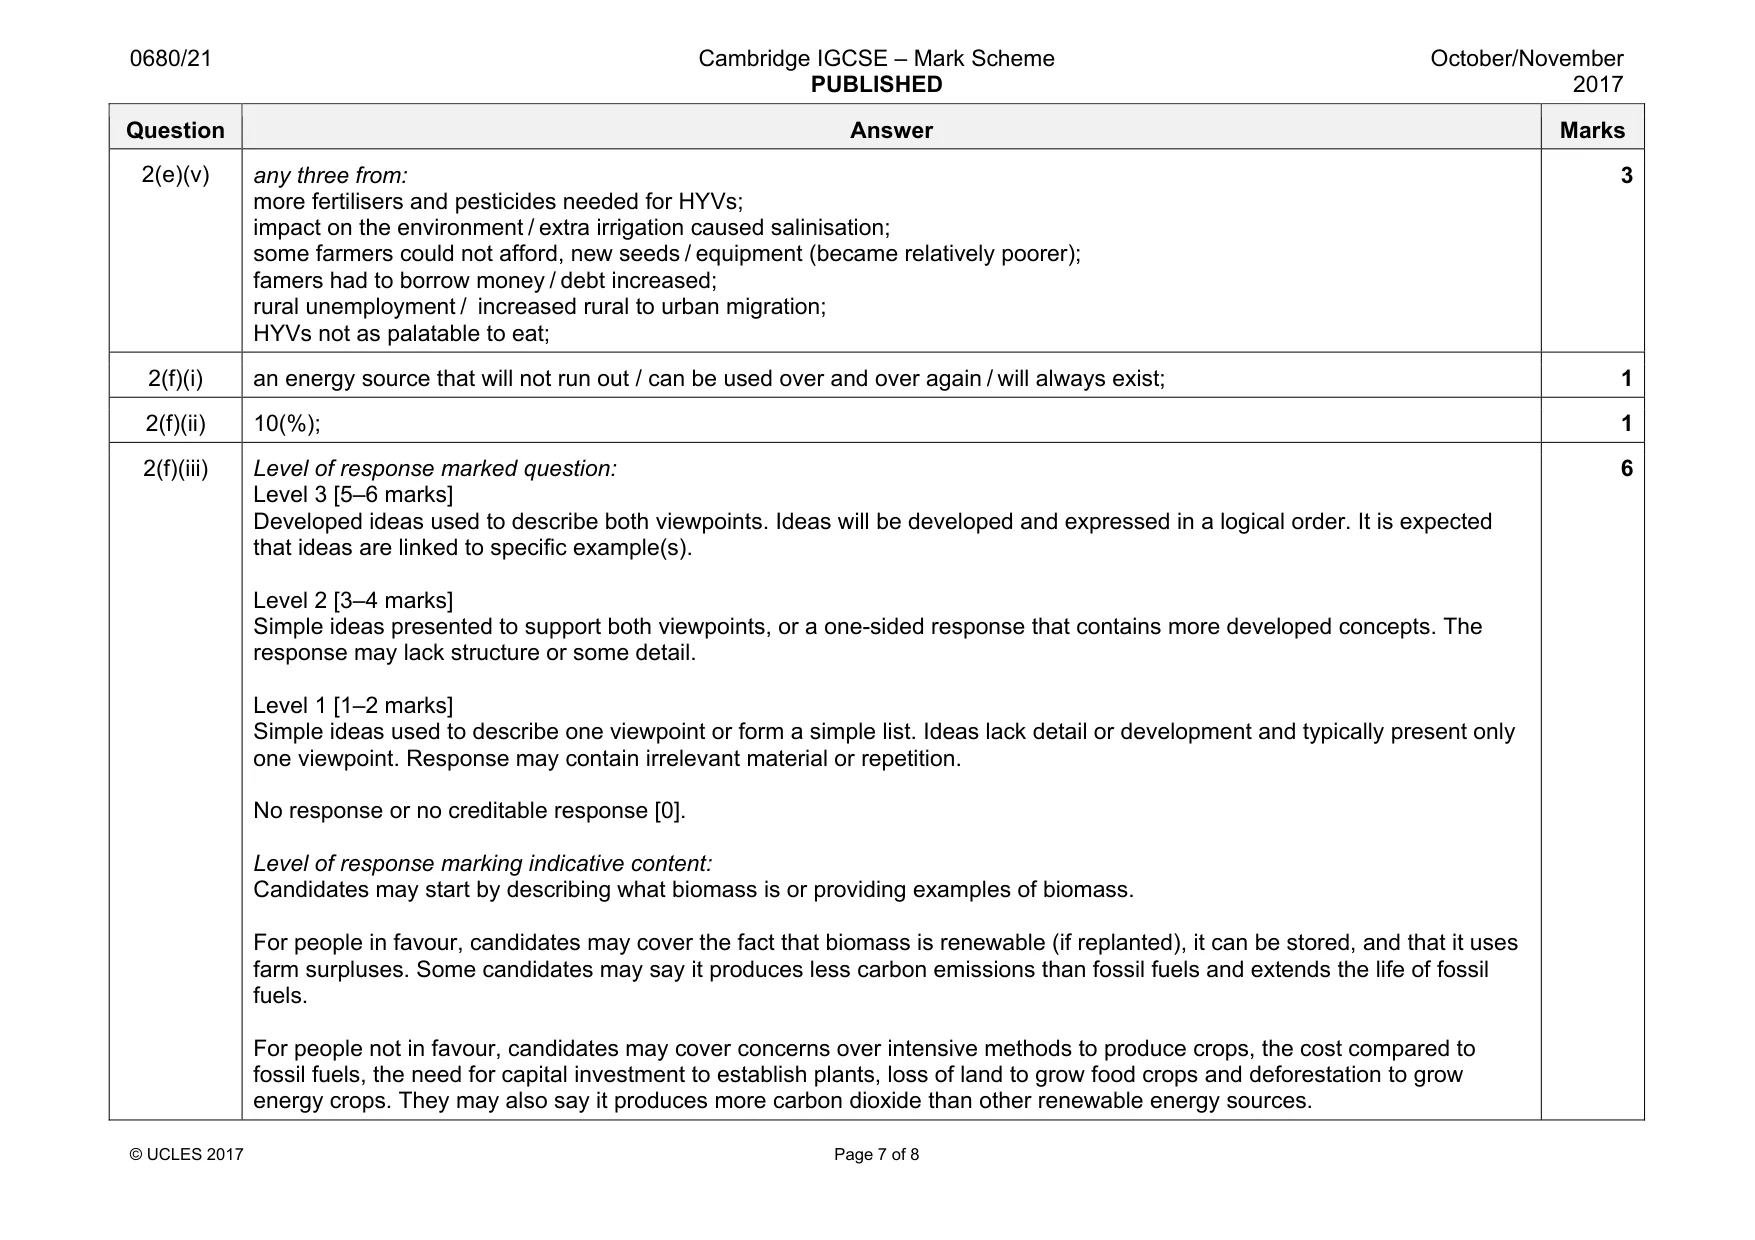
Mark scheme: 2(a)(i) rice farming OR shifting cultivation; 1 2(a)(ii) dairy farming OR cattle ranching; 1 2(a)(iii) commercial farming is growing crops or rearing / grazing animals for profit / sale; subsistence farming is growing crops or rearing / grazing animals to feed the farmer and their family; 2 2(a)(iv) intensive / extensive; 1 2(b)(i) any two from: north (east) India / south (west) of Nepal / between India and Nepal; flows through Bangladesh; east / south east of New Delhi; starts / source, in the Himalayas; flows into the Bay of Bengal; 2 2(b)(ii) seeds – requirements OR products; harvesting – farming activities; 2 2(b)(iii) growing crops – main crop is rice / plants seeds / ploughing / transplanting / weeding / fertile soil; subsistence – small profit / fed to family; 2 2(c)(i) irrigation: irrigation allows crops to be watered during drier season; so rice can be grown all year round / extends the growing season / area; pesticides: pesticides used to control weeds / pests; so more room for crops / less of crops are destroyed; high-yielding varieties (HYVs) of seeds: HYVs are introduced which are more resistant to drought / disease; so more of the crop survives; varieties have a shorter growing season; allowing an extra crop to be grown / larger yields; 4 Question Answer Marks 2(c)(ii) any three from: fertilisers washed into rivers; causes eutrophication; nitrogen levels increase; growth of algae increases; oxygen levels decrease; death of aquatic life; toxicity to humans / blue baby syndrome; too many chemicals in soil causes, plant toxicity / problems with soil fertility; 3 2(d)(i) any three from: main feeder pipe brings water, controlled by valve; explanation of the need for a valve; (smaller) pipes carry water to plants; water drips from holes close to plants; plastic sheet surrounds plants to reduce water loss (through evaporation); 3 2(d)(ii) any two from: (water directed at roots) so less lost to evaporation; water not wasted on bare ground between crops; fewer weeds grow in this area; more water efficient method / water can be regulated; all plants have adequate supplies of water; reduces leaching of nutrients; 2 2(e)(i) it increased; from 0.35 to 2.80 million tonnes / by 2.45 million tonnes; 2 2(e)(ii) 1960–1965; 1 2(e)(iii) correct plotting; line drawn; 2 2(e)(iv) 31 million tonnes; 1 Question Answer Marks 2(e)(v) any three from: more fertilisers and pesticides needed for HYVs; impact on the environment / extra irrigation caused salinisation; some farmers could not afford, new seeds / equipment (became relatively poorer); famers had to borrow money / debt increased; rural unemployment / increased rural to urban migration; HYVs not as palatable to eat; 3 2(f)(i) an energy source that will not run out / can be used over and over again / will always exist; 1 2(f)(ii) 10(%); 1 2(f)(iii) Level of response marked question: Level 3 [5–6 marks] Developed ideas used to describe both viewpoints. Ideas will be developed and expressed in a logical order. It is expected that ideas are linked to specific example(s). Level 2 [3–4 marks] Simple ideas presented to support both viewpoints, or a one-sided response that contains more developed concepts. The response may lack structure or some detail. Level 1 [1–2 marks] Simple ideas used to describe one viewpoint or form a simple list. Ideas lack detail or development and typically present only one viewpoint. Response may contain irrelevant material or repetition. No response or no creditable response [0]. Level of response marking indicative content: Candidates may start by describing what biomass is or providing examples of biomass. For people in favour, candidates may cover the fact that biomass is renewable (if replanted), it can be stored, and that it uses farm surpluses. Some candidates may say it produces less carbon emissions than fossil fuels and extends the life of fossil fuels. For people not in favour, candidates may cover concerns over intensive methods to produce crops, the cost compared to fossil fuels, the need for capital investment to establish plants, loss of land to grow food crops and deforestation to grow energy crops. They may also say it produces more carbon dioxide than other renewable energy sources. 6
What was in this paper
The subtopics covered by these 2 questions, and how many questions each got. Open one in a new tab to see every Cambridge question on it.
What you needed in this session
Cambridge’s own grade thresholds for 2017 Oct/Nov, Paper 2 · Variant 1. A higher threshold means an easier paper — the bar moves with how the cohort did.